The Effect of Innovation on Corporate Tax Avoidance
57
Louisiana State University LSU Digital Commons LSU Doctoral Dissertations Graduate School 2014 e Effect of Innovation on Corporate Tax Avoidance Peng Guo Louisiana State University and Agricultural and Mechanical College, [email protected] Follow this and additional works at: hps://digitalcommons.lsu.edu/gradschool_dissertations Part of the Accounting Commons is Dissertation is brought to you for free and open access by the Graduate School at LSU Digital Commons. It has been accepted for inclusion in LSU Doctoral Dissertations by an authorized graduate school editor of LSU Digital Commons. For more information, please contact[email protected]. Recommended Citation Guo, Peng, "e Effect of Innovation on Corporate Tax Avoidance" (2014). LSU Doctoral Dissertations. 776. hps://digitalcommons.lsu.edu/gradschool_dissertations/776
Transcript of The Effect of Innovation on Corporate Tax Avoidance

Louisiana State UniversityLSU Digital Commons
LSU Doctoral Dissertations Graduate School
2014
The Effect of Innovation on Corporate TaxAvoidancePeng GuoLouisiana State University and Agricultural and Mechanical College, [email protected]
Follow this and additional works at: https://digitalcommons.lsu.edu/gradschool_dissertations
Part of the Accounting Commons
This Dissertation is brought to you for free and open access by the Graduate School at LSU Digital Commons. It has been accepted for inclusion inLSU Doctoral Dissertations by an authorized graduate school editor of LSU Digital Commons. For more information, please [email protected].
Recommended CitationGuo, Peng, "The Effect of Innovation on Corporate Tax Avoidance" (2014). LSU Doctoral Dissertations. 776.https://digitalcommons.lsu.edu/gradschool_dissertations/776

THE EFFECT OF INNOVATION ON CORPORATE TAX AVOIDANCE
A Dissertation
Submitted to the Graduate Faculty of the
Louisiana State University and
Agricultural and Mechanical College
in partial fulfillment of the
requirements for the degree of
Doctor of Philosophy
in
The Department of Accounting
by
Peng Guo
M.S., North Carolina State University, 2009
December 2014

ii
I dedicate this dissertation to my husband. This is for you.

iii
ACKNOWLEDGMENTS
I would like to acknowledge Dr. C.S. Agnes Cheng, Dr. Andrew Christie, Dr. Larry
Crumbley, Dr. Ken Reichelt, and Dr. Jared Soileau. I would also like to thank the other PhD
students for their support.

iv
TABLE OF CONTENTS
ACKNOWLEDGMENTS……………………………………………………………………..…iii
LIST OF TABLES………………………………………………………………………………...v
ABSTRACT……………………………………………………………………………………...vi
1. INTRODUCTION………………………………………………………………..…………….1
2. BACKGROUND, LITERATURE REVIEW, AND HYPOTHESIS……………………..……5
2.1 Definition of Tax Avoidance……………………………………………………………....5
2.2 Literature on Determinants of Tax Avoidance…………………………………….………6
2.3 Literature on Income Shifting and Transfer Pricing…………………………………….…9
2.4 Literature on Innovation……………………………………………………………...…..11
2.5 Hypothesis Development……………………………………………………………...….12
3. RESEARCH DESIGN………………………………………………………...………………14
4. DATA, SAMPLE SELECTION, AND DESCRIPTIVE STATISTICS……………………...19
4.1 Data and Sample Selection……………………………………………………………….19
4.2 Descriptive Statistics……………………………………………………………………...21
5. EMPIRICAL RESULTS………………………………………………………………………26
6. ADDITIONAL ANALYSIS…………………………………………………………………..29
6.1 Propensity-score Matching Test………………………………………………………….29
6.2 Change Model……………………………………………………….……………………31
6.3 Alternative Measures of Innovation………………………………………………………33
6.4 Does the Effect of Innovation on Tax Avoidance Depend on Firm Size?………………..36
6.5 Is the Effect of Innovation on Tax Avoidance Affected by Foreign Income?....................38
7. CONCLUSION……………………………………………………………………………......41
REFERENCES………………………………………………………………………………......43
THE VITA……………………………………………………………………………………….49

v
LIST OF TABLES
Table 1 Variable Definitions…………………………………………………………….….……14
Table 2 Sample Selection and Sample Composition…………………………………….………19
Table 3 Descriptive Statistics………………………………………………………………...…..21
Table 4 Spearman Correlations…………………………………………………………………..24
Table 5 Do firms with more innovation avoid more taxes?...........................................................26
Table 6 Sensitivity Analysis using Propensity-score Matched Sample………………………….30
Table 7 Sensitivity Analysis Using a Change Model………………………………..…………..32
Table 8 Sensitivity Analysis Using Alternative Measures of Innovation…………………….….34
Table 9 Does the Effect of Innovation on Tax Avoidance Depend on Firm Size?.......................37
Table 10 Does the Effect of Innovation on Tax Avoidance Depend on Foreign Income?............39

vi
ABSTRACT
A large body of literature examines the determinants of corporate tax avoidance. In this
paper I examine a new determinant of tax avoidance: innovation. Firms with more innovation
generate more patents. Due to information asymmetry between the managers of the firm and tax
authorities, firms have considerable discretion in choosing which country the patent revenue is
generated in. In this study, I predict that firms with more patents will choose to attribute the
revenue from those patents to countries with low tax rates. Using a relatively new data source
which contains data on patents, I find evidence consistent with my predictions. Specifically, I
find that patent activity is negatively associated with firms’ tax rates. The results are robust to
different measures of effective tax rates and to propensity-score matching.

1
1. INTRODUCTION
Tax avoidance includes activities that reduce explicit taxes per dollar of pre-tax
accounting earnings (Hanlon and Heitzman 2010).1 Tax avoidance increases firm value because
it reduces the firms’ tax burden and creates a wealth transfer from the government to
shareholders. On the other hand, tax avoidance is costly. For example, costs of tax avoidance
include hiring tax accountants and lawyers, reputational costs, penalties and interests for taking
risky tax positions that are subsequently challenged by the tax authorities. Recent research also
suggests that tax avoidance is associated with agency cost between the firm and its shareholders.2
A large body of research seeks to understand the determinants of corporate tax avoidance
(see Shackelford and Shevlin (2001) and Hanlon and Heitzman (2010) for a review). For
example, Rego (2003) finds that firms with greater international operations are able to avoid
more taxes. Phillips (2003) finds that compensating managers based on after-tax income results
in lower effective tax rates. Desai and Dharmapala (2006) find that managers with greater equity
incentives are less likely to engage in tax avoidance.3 To summarize, the tax avoidance literature
has identified a slew of manager and firm characteristics associated with tax avoidance.
However, this literature has not considered how the level of innovation at the firm can influence
tax avoidance.
More innovative firms generate more intellectual property, such as patents and
copyrights. If a firm owns a foreign subsidiary, the foreign subsidiary should be charged a fee to
use the intellectual property. The fee the firm charges must be an “arm’s length price”, i.e., a
1 Consistent with Hanlon and Heitzman (2010), I do not distinguish between legal and illegal tax avoidance
activities (illegal tax avoidance is also called tax evasion). Rather, I view tax avoidance as a continuum of tax
saving strategies that range from the least aggressive type (e.g., purchasing municipal bonds) to the most aggressive
type (e.g., tax evasion). 2 Tax avoidance creates agency cost by increasing the complexity of transactions. Managers can use tax avoidance
to mask for opportunistic behaviors, such as earnings management and rent extraction. 3 I review the tax avoidance literature in more detail in section 2.

2
price that two unrelated parties would agree to for the use of a similar asset (IRS Code Section
482). However, in practice it is difficult to assess the value of intellectual property (Rotkowski
and Miller 2012). This difficulty means that managers have considerable discretion in choosing
the fee the parent company charges to its foreign subsidiary for the use of patents or copyrights.
For example, Apple Computer uses a strategy whereby it charges its Ireland subsidiary a very
low fee for the use of several of its key patents. The subsidiary then uses those patents to
generate large profits in Ireland, which are then subject to a lower tax rate than the U.S. statutory
tax rate (Gleckman 2013). Thus, Apple maximizes its income from intellectual property in the
low tax-rate subsidiary while minimizing income in the U.S.4
Thus, while charging abnormally low fees for the use of intellectual property is a
relatively simple form of tax avoidance, the extant literature has not produced evidence that this
practice is widespread. The goal of this paper is, therefore, to investigate whether more
innovative firms engage in more tax avoidance. I measure innovation using the number of
patents a firm produces in a given year (Atanassov 2013; Bernstein 2012; He and Tian 2013).5
Tax avoidance is measured using firms’ effective tax rates. Using a sample of 25,967 firm-year
observations over the sample period 1993 to 1999, I find a negative relationship between my
patent-based measure of innovation and firms’ effective tax rates, suggesting that more
innovative firms are able to avoid more taxes. A one standard deviation increase in my
innovation measure is associated with a decrease of 0.7 percent decrease in a firm’s effective tax
4 Of Apple’s $34 billion in 2011 pre-tax income, $22 billion was allocated to two entities in Ireland (Gleckman
2013). Given the size of the Irish market compared with that of the U.S., it seems implausible that the Irish market
accounted for such a high percentage of Apple’s income. 5 This variable is adjusted to reflect the fact that innovation is stronger in certain years. More details on the measure
are provided in section 3.

3
rate. Given that the mean effective tax rate (cash effective tax rate) for the sample is 30.7 percent
(25.0 percent), a decrease of 0.7 percent translates to a 2.3 percent (2.8 percent) decrease.6
The results are robust to controlling for other known determinants of tax avoidance,
including firm profitability (Gupta and Newberry 1997; Rego 2003; Frank et al. 2009), firm
leverage (Badertscher et al. 2010; Hanlon and Heitzman 2010), net operating loss carryforwards
(Chen et al. 2010), foreign income, depreciation, intangible assets, and equity income (Rego
2003; Cheng et al. 2012), firm size (Watts and Zimmerman 1986; Mills et al. 2013), and the
level of cash holdings (Dhaliwal et al. 2011). The results are also robust to using alternative
measures of tax avoidance, including firms’ GAAP effective tax rate, cash effective tax rate, and
long-run measures of tax avoidance (e.g., Dyreng et al. 2008). Finally, the results are robust to
using a propensity-score matched sample where firms without patents are matched with firms
with patents on the basis of R&D and intangible assets.
This paper contributes to two streams of literature. First, it contributes to the literature on
the determinants of tax avoidance. While this literature has found a considerable number of
executive characteristics (Dyreng et al. 2010; Chyz 2013), auditor characteristics (McGuire et al.
2012), firm ownership structure (Badertscher et al. 2010; Chen et al. 2010), and firm
characteristics (Gupta and Newberry 1997; Rego 2003; Cheng et al. 2012) are associated with
tax avoidance, it has not considered firm innovation as a determinant of tax avoidance. Second,
by demonstrating that the level of innovation at the firm affects corporate tax policy, the findings
in this paper contribute to the burgeoning literature on the determinants and consequences of
firm innovation (Atanassov 2013; Bernstein 2012; He and Tian 2013). A third contribution of
this study is to begin to open the “black box” of tax strategies used by firms. The existing
6 i.e., 0.7/30.7 = 2.3 percent.

4
research generally fails to explore the mechanism firms actually use to avoid taxes and firms
generally do not reveal these mechanisms. The evidence in this study is also of use to tax
authorities in deciding which firms to investigate for tax avoidance. The results suggest that if
the IRS is targeting firms suspected of abusing the discretion inherent in Section 482 of the
Internal Revenue Code, it would do best to investigate multinational firms with valuable patents.
The remainder of this paper is organized as follows. Section 2 contains background
information, a literature review, and the hypothesis development. Section 3 contains the research
design, while section 4 discusses the data used in the study and the sample. Section 5
summarizes the main empirical results, section 6 contains additional analyses, and section 7
concludes.

5
2. BACKGROUND, LITERATURE REVIEW, AND HYPOTHESIS
2.1 Definition of Tax Avoidance
In this paper, I consider tax avoidance as any activity that reduces tax paid given the level
of earnings. This definition is broad. Tax avoidance includes any transaction that has any effect
on the firm’s tax burden. This includes real activities which have tax benefits, lobbying activities
aimed at reducing a firm’s tax burden, and activities undertaken solely for the purpose of
avoiding taxes.7
One may ask why all firms do not choose to engage in tax avoidance. Why is there
significant variation in the level of tax avoidance (e.g., Dyreng et al. 2008)? The answer is
twofold. First, tax avoidance has both costs and benefits. The benefit of tax avoidance is to save
tax payments. Firms in higher tax brackets receive greater benefits from avoiding taxes. There
also are costs associated with tax avoidance. One direct cost is the salaries paid to tax
accountants and tax lawyers. Reputation cost is another cost of tax avoidance. For example, after
news broke that General Motors earned $14.2 billion in worldwide profits in 2010, yet paid no
taxes in the U.S. and claimed a tax benefit of $3.2 billion, its reputation took a hit. “The
company’s reputation took a steep drop and two months to recover to pre-crisis levels”- Marzilli
(2012).
A third cost of engaging in tax avoidance is the risk that the firm’s tax position will be
challenged by the tax authorities. If a company owes a tax deficiency, the firm must pay tax
owed, plus interest, and penalty. Finally, a less direct but potentially large cost of tax avoidance
is agency cost. Managers can use tax avoidance to construct complicated transactions, which
7 This definition follows Hanlon and Heitzman (2010) who note that “tax avoidance represents a continuum of tax
planning strategies where something like municipal bond investments are at one end (lower explicit tax, perfectly
legal), then terms such as ‘noncompliance’, ‘evasion’, ‘aggressiveness’, and ‘sheltering’ would be closer to the other
end of the continuum.” – Hanlon and Heitzman (2010, 137).

6
increase the information asymmetry between the managers and the shareholders. To the extent
that managers use this increased information asymmetry to engage in opportunistic behavior, this
agency cost is born by the shareholders (Desai and Dharmapala 2009). Shareholders may
respond to the increased agency cost by discounting the firm’s stock price. The second reason
there is variation in tax avoidance is that certain aspects of a firm’s operations may create
opportunities for tax avoidance which are unavailable to other firms. This paper focuses on
firms’ opportunity to manipulate intellectual properties.
2.2 Literature on Determinants of Tax Avoidance
Tax researchers have identified firm characteristics, executive characteristics, firm
ownership structures, and other characteristics which are associated with tax avoidance. I will
first discuss firm characteristics.
An early study by Gupta and Newberry (1997) finds that tax avoidance is associated with
firm profitability, leverage, and capital intensity. More profitable firms generally pay higher
taxes. On the other hand, one could argue that more profitable firms have greater incentives to
engage in tax avoidance due to the greater potential savings (Rego 2003; Frank et al. 2009;
McGuire et al. 2012). As well, Manzon and Plesko (2002) argue that more profitable firms can
make better use of tax deductions, exemptions, and credits. The literature also has shown that
multinational corporations have lower effective tax rates, since these firms’ foreign operations
allow them to avoid more taxes (Rego 2003). Dhaliwal et al. (2011) find that firms with low
levels of cash holdings are more likely to engage in tax avoidance. There is also considerable
evidence that firms with higher political costs are less likely to engage in tax avoidance
(Zimmerman 1983; Mills et al. 2013). Recent research also has examined whether firms which
engage in aggressive financial reporting are more or less likely to avoid taxes. Frank et al. (2009)

7
find a positive relationship between aggressive financial reporting and tax aggressiveness.
However, Lennox et al. (2013) find a negative relationship between the two constructs.
Therefore, the relationship is not clear.8
Because individual executives, and not firms, make decisions, there is considerable
research which examines the effect of individual executives on tax avoidance. A recent paper by
Dyreng et al. (2010) find that top executives (e.g., the CEO and CFO) have considerable
influence on their firm’s tax policies. The authors provide some evidence that more optimistic
executives are more likely to engage in tax avoidance.9 Phillips (2003) investigates the role of
incentives in determining tax avoidance. He finds evidence that basing business-unit managers’
compensation on after-tax earnings leads to lower effective tax rates.10
Recent research has begun to explore the backgrounds of top executives to better
understand their influence on corporate tax policies. For example, Chyz (2013) identifies
“suspect executives” as those who appear to have engaged in stock option backdating and finds
that these executives are significantly more tax aggressive. To the extent that executives who
engage in option backdating report more aggressively, Chyz’s (2013) findings are consistent
with Frank et al.’s (2009) finding of a positive relationship between financial reporting
aggressiveness and tax aggressiveness. The board of directors also can have a significant
influence on corporate tax policy. For example, recent research finds that firms which share a
8 Frank et al. (2009) use earnings quality measures to measure financial reporting aggressiveness while Lennox et al.
(2013) use the incidence of accounting fraud. A disadvantage of using earnings quality measures is that they are
noisy proxies for the construct being studied (Eshleman and Guo 2014). However, using a dichotomous measure
ignores variation in the construct. In the case of Lennox et al.’s (2013) study, using accounting fraud as a measure
of financial reporting aggressiveness forces the researcher to assume that financial reporting quality is similar across
all of the firms which did not engage in fraud. An alternative way to capture fraud firms is the use of Benford’s Law
(Suh et al. 2011). 9 See Table 7 of the study. 10 However, he also finds that basing CEO compensation on after-tax earnings does not lead to lower effective tax
rates.

8
common board member are significantly more likely to utilize similar tax avoidance strategies
(Brown 2011). Robinson et al. (2010) examine how certain aspects of a firm’s tax department
can influence the level of tax avoidance. The authors find that firms which designate the tax
department as a profit center have lower effective tax rates than firms which designate the tax
department as a cost center. Apparently, members of corporate tax departments respond to profit
incentives by finding ways to avoid more taxes.
The ownership structure of a firm also can affect the firm’s level of tax avoidance (Desai
and Dharmapala 2006). Firms with more concentrated ownership structures may avoid more
taxes because the controlling shareholders benefit more from the savings. Alternatively, these
firms may engage in lower levels of tax avoidance because the controlling shareholders’ wealth
is more sensitive to costs of tax avoidance, including reputational damage and suspicions from
minority shareholders that the firm is masking rent extraction (Desai et al. 2007). Empirical
evidence on this issue is found in Chen et al. (2010), who study family firms. Family firms often
have a different ownership structure in which the family members have a controlling interest and
the minority shareholders do not. Chen et al. (2010) find that firms which are owned and run by
founding family members avoid fewer taxes than do other firms. The authors suggest that family
firms do this to avoid a potential price discount arising from minority shareholders who are
concerned that the controlling shareholders are engaging in rent extraction and masking it via tax
avoidance.11 However, a competing explanation is found in Badertscher et al. (2013), who
predict and find that firms with more diffuse ownership structures are more likely to engage in
tax avoidance. The authors argue that concentrated owners are less likely to engage in risky
11 The authors also note that the results are consistent with the controlling shareholders being more concerned with
reputational damage which could arise if the tax avoidance were to be challenged by the IRS.

9
activities and tax avoidance is a risky activity. Finally, Cheng et al. (2012) find that firms with
significant hedge fund ownership avoid more taxes.
In addition to firm characteristics, executive characteristics, and ownership structure,
researchers have identified at least two other determinants of tax avoidance. McGuire et al.
(2012) find that firms who purchase tax services from an industry specialist are able to avoid
more taxes. This finding highlights the fact that certain tax strategies are industry-specific.12
Finally, the characteristics of the country a firm operates in can affect the extent of tax
avoidance firms headquartered in that country engage in. For example, Porcano et al. (2011) find
that firms’ tax avoidance behavior is influenced by the level of economic development of the
country the firm operates in.
2.3 Literature on Income Shifting and Transfer Pricing
If multinational corporations were applying the arms-length principle, we would not
observe any difference in the transfer prices of related parties as compared to the transfer prices
of unrelated parties. However, the research in this area consistently finds that U.S. multinational
corporations use their discretion in the tax code to shift income to subsidiaries in low-tax
jurisdictions. For example, Clausing (2003) finds that the exports of parent firms tend to have
lower intra-firm transfer prices when compared to transactions with unrelated parties. She also
finds that the intra-firm import prices to the parent company are higher when compared to
unrelated parties’ import prices. Similarly, Harris (1993) finds that multinational firms with
affiliates in countries with low tax rates tend to have lower tax liabilities in the U.S., compared to
other firms without affiliates. Additional evidence can be found in Clausing (2009) who uses
country-level data to show that foreign profitability is higher in jurisdictions with lower tax rates.
12 Bonner et al. (1992) find that tax expertise consists of client-specific, as well as industry-specific knowledge.

10
This behavior is also found in Europe. Huizinga and Laeven (2008) show that European
multinationals tend to shift income away from Germany, since they have a high tax rate, and
towards low tax rate countries. Finally, Klassen and Laplante (2012a) show that income shifting
into and out of the U.S. has become more rampant in recent years.13 To summarize, research
using country and industry-level data has provided evidence that firms are engaging in income
shifting. The next question is through what means do firms engage in such behavior.
One way U.S. multinational firms can shift income from high-tax jurisdictions to low-tax
jurisdictions is by choosing to hold debt in the affiliate located in a low-tax country. Using a
sample of bond offerings in Australia, Canada, France, Germany, Italy, Japan, and the U.K.,
Newberry and Dhaliwal (2001) provide evidence that firms do consider the tax rate of the
country in which they are raising debt financing.
A second way multinational firms can shift income from high-tax to low-tax jurisdictions
is by charging their subsidiaries an abnormally low fee for the use of intellectual property, such
as patents or copyrights. This type of behavior is referred to as “transfer pricing”. However, the
literature has produced little evidence that firms are indeed engaging in this type of behavior.
Bartelsman and Beetsma (2003) use industry-level data and find that there is some evidence of
income shifting for OECD countries. They particularly find strong evidence for industries with
high levels of intangible assets, such as the pharmaceutical industry. A limitation of Bartelsman
and Beetsma’s (2003) finding is the use of industry-level data, which prevents the authors from
capturing variation in income shifting within an industry. In addition, Grubert and Slemrod
(1998) find that firms with high levels of intangible assets, such as pharmaceutical companies,
are more likely to choose to manufacture their products in Puerto Rico in order to avoid taxes. A
13 See also Grubert (1998) and Klassen and Laplante (2012b).
11
limitation of Grubert and Slemrod’s findings is that they deal with real activities, i.e., the choice
of location of a firm’s manufacturing. Finally, Grubert (2003) finds that approximately 50
percent of the income shifted to low-tax jurisdictions is related to research and development
(R&D) investments made by the parent. A limitation of Grubert’s (2003) study is the use of
R&D as a proxy for intellectual property. R&D is a poor proxy for the amount of intellectual
property a firm owns because it is not clear that more R&D always leads to more valuable
intellectual property. Some firms’ R&D efforts are not successful. Finally, the amount of
reported R&D may not be equal to the amount of R&D the firm spent as firms can engage in
classification shifting of R&D (Skaife et al. 2014).
To summarize, the literature has shown that multinational firms shift income out of high-
tax jurisdictions into low-tax jurisdictions. However, we lack direct evidence on the methods
firm use to shift this income.
2.4 Literature on Innovation
Recently, accounting and finance researchers have explored the determinants of corporate
innovation. Atanassov (2013) finds that anti-takeover laws stifle corporate innovation,
suggesting that corporate governance fosters greater innovation. In addition, Brav et al. (2014)
find that firms targeted by hedge fund activists experience an increase in innovation. On the
other hand, enhanced scrutiny from outside investors may not encourage firms to be more
innovative, particularly if the outside investors have short investment horizons. For example, He
and Tian (2013) find that firms with greater analyst following produce fewer patents and those
patents have a lower impact. In addition, Bernstein (2012) finds that firms are less innovative
after initial public offerings (i.e., after going public). Bernstein attributes his findings to skilled
inventors leaving firms which go public and the remaining inventors becoming less productive
12
after the IPO.14 Finally, Mukherjee et al. (2014) find that increases in corporate tax rates lead to
less innovation. The argument is that higher taxes are a disincentive to work hard. In addition,
higher taxes make debt financing more attractive, but creditors are unlikely to extend debt
financing to firms engaging in research and development projects with no standalone liquidation
value (Mukherjee et al. 2014).
Top management can also affect the level of innovation at the firm. Hirshleifer et al.
(2012) find that firms with more overconfident Chief Executive Officers tend to generate more
patents, and those patents tend to have a greater impact. Given the same level of research and
development expenditures, firms with more overconfident CEOs generate more patents.
Hirshleifer et al. (2013) extend this analysis and find that the ratio of patents to research and
development expenditures (innovative efficiency) is a strong predictor of future stock returns. It
appears the market does not fully appreciate innovation. The authors attribute this mispricing to
the limited attention hypothesis of Hirshleifer and Teoh (2003).
The competition in the industry can also affect the level of corporate innovation. Aghion
et al. (2005) provide evidence of an inverted-U relationship between product market competition
and corporate innovation. If competition is very low or very high, innovation suffers. Innovation
is highest when competition is medium.
2.5 Hypothesis Development
The hypothesis for this study is based on the difficulty of enforcing certain parts of the
tax code. If a firm generates intellectual property such as patents or copyrights, the company may
charge its foreign subsidiaries a fee for the use of that intellectual property in generating
revenues. Section 482 of the Internal Revenue Code mandates that the parent company charge an
14 Bernstein (2012) does find that after going public, firms have the resources to attract new human capital, and find
innovation externally. However, the net result is a decline in innovation.

13
“arm’s length” fee to the subsidiary for the use of the intellectual property (Rotkowski and Miller
2012). Because the value of intellectual property is ambiguous, the enforcement for this part of
the tax code can be difficult (Gleckman 2013). Therefore, I posit that firms with strong
innovation will generate more patents, and they will tend to charge their subsidiaries abnormally
low fees for the use of these patents. If these subsidiaries are located in jurisdictions with tax
rates lower than that of the U.S.,15 I will observe that these firms have lower effective tax rates
than comparable firms without patents. This observation leads to the hypothesis, stated in
alternate form:
Hypothesis: There is a negative association between a firm’s level of innovation and its
effective tax rate.
Alternatively, innovation may have no association with tax avoidance if either (i.) the
IRS is able to enforce the arm’s length principle in transfer pricing for patents or (ii.) managers
choose to use fair transfer pricing in selling patents to their subsidiaries. As well, if innovative
companies do not have tax expertise, they may not use the discretion inherent in the tax code to
avoid taxes with their patents.
15 The U.S. corporate tax rate is currently 35 percent, which is much higher than that of many foreign countries, such
as Ireland (12.5 percent), Luxembourg (29.22 percent), Hong Kong (16.5 percent), Iceland (20 percent), Germany
(29.55 percent), Denmark (25 percent), Sweden (22 percent), Canada (26 percent), Chile (20 percent), and Australia
(30 percent) (KPMG 2013).

14
3. RESEARCH DESIGN
In order to test the hypothesis, I estimate the following linear regression model using
ordinary least squares:
𝐸𝑇𝑅𝑖𝑡 = 𝛽0 + 𝛽1𝐼𝑁𝑁𝑂𝑉𝑖𝑡 + 𝛽2𝑅𝑂𝐴𝑖𝑡 + 𝛽3𝐶𝐴𝑆𝐻𝑖𝑡 + 𝛽4𝐸𝑄𝑈𝐼𝐶𝑖𝑡 + 𝛽5𝑅𝑁𝐷𝑖𝑡 + 𝛽6𝑀𝑉𝐸𝑖𝑡−1
+ 𝛽7𝑁𝑂𝐿𝑖𝑡 + 𝛽8∆𝑁𝑂𝐿𝑖𝑡 + 𝛽9𝐿𝐸𝑉𝑖𝑡 + 𝛽10𝐹𝐼𝑖𝑡 + 𝛽11𝐼𝑁𝑇𝐴𝑁𝐺𝑖𝑡 + 𝛽12𝐷𝐸𝑃𝑖𝑡
+ 𝛽13𝑀𝑇𝐵𝑖𝑡−1 + 𝛽14𝐼𝑁𝑆𝑇𝑂𝑊𝑁𝑖𝑡 + 𝛽15𝐹𝐸𝐷𝐶𝑈𝑆𝑇𝑖𝑡 + 𝛽16𝐴𝐴𝐸𝑅𝑖𝑡
+ 𝐼𝑛𝑑𝑢𝑠𝑡𝑟𝑦 𝐹𝑖𝑥𝑒𝑑 𝐸𝑓𝑓𝑒𝑐𝑡𝑠 + 𝑌𝑒𝑎𝑟 𝐹𝑖𝑥𝑒𝑑 𝐸𝑓𝑓𝑒𝑐𝑡𝑠 + 휀𝑖𝑡 (1)
Table 1 contains variable definitions.
Table 1 Variable Definitions
(in the order they appear)
__Variable__ Definition
𝐼𝑁𝑁𝑂𝑉 = Innovation, measured as the number of patents a firm generates in a
given year divided by the mean number of patents generated by all firms
in that year. Patent data is obtained from the Hall et al. (2001) database.
𝐸𝑇𝑅 = The firm’s effective tax rate, calculated as tax expense (𝑡𝑥𝑡) divided by
pretax income (𝑝𝑖) less special items (𝑠𝑝𝑖). This variable is winsorized
to have a range from 0 to 1.
𝐶𝐴𝑆𝐻_𝐸𝑇𝑅 = The firm’s cash effective tax rate, calculated as cash taxes paid (𝑡𝑥𝑝𝑑)
divided by pretax income (𝑝𝑖) less special items (𝑠𝑝𝑖). This variable is
winsorized to have a range from 0 to 1.
𝐶𝑈𝑅𝑅6 = The firm’s long-run current effective tax rate, calculated as the sum of
tax expense (𝑡𝑥𝑡) over the current and prior five years divided by the
sum of pre-tax book income (𝑝𝑖 − 𝑠𝑝𝑖) over the current and prior five
years. If data is missing, I use the prior four years. If data is still missing,
I use the prior three years. Values greater than 1 or less than 0 are
deleted.
𝐶𝐴𝑆𝐻6 = The firm’s long-run cash effective tax rate, calculated as the sum of cash
taxes paid (𝑡𝑥𝑝𝑑) over the current and prior five years divided by the
sum of pre-tax book income (𝑝𝑖 − 𝑠𝑝𝑖) over the current and prior five
years. If data is missing, I use the prior four years. If data is still missing,
I use the prior three years. Values greater than 1 or less than 0 are
deleted.
𝑅𝑂𝐴 = Return on assets, calculated as income before extraordinary items (𝑖𝑏)
divided by lagged assets (𝑎𝑡).
𝐶𝐴𝑆𝐻 = The firm’s cash balance at end of year (𝑐ℎ𝑒) divided by total assets (𝑎𝑡).
𝐸𝑄𝑈𝐼𝐶 = The firm’s equity income calculated as earnings from subsidiaries
(𝑒𝑠𝑢𝑏) divided by lagged assets (𝑎𝑡).
𝑅𝑁𝐷 = Research & development expense (𝑥𝑟𝑑) divided by lagged assets (𝑎𝑡).

15
(Table 1 continued)
Variable Definition
𝑀𝑉𝐸 = The natural logarithm of the firm’s market value of equity (𝑝𝑟𝑐𝑐_𝑓 ×𝑐𝑠ℎ𝑜).
𝑁𝑂𝐿 = Net operating loss carryforward, which is equal to 1 if the firm has a
positive net operating loss carryfoward (𝑡𝑙𝑐𝑓), 0 otherwise.
∆𝑁𝑂𝐿 = Change in NOL, calculated as the change in net operating loss
carryforward (𝑡𝑙𝑐𝑓) divided by lagged assets (𝑎𝑡).
𝐿𝐸𝑉 = Leverage, calculated as long-term debt (𝑑𝑙𝑡𝑡) divided by total assets
(𝑎𝑡).
𝐹𝐼 = Foreign income, calculated as pre-tax income from foreign operations
(𝑝𝑖𝑓𝑜) divided by lagged assets (𝑎𝑡).
𝐼𝑁𝑇𝐴𝑁𝐺 = Intangible assets, calculated as intangibles (𝑖𝑛𝑡𝑎𝑛) divided by lagged
assets (𝑎𝑡).
𝐷𝐸𝑃 = Depreciation, calculated as depreciation expense (𝑑𝑝) divided by lagged
assets (𝑎𝑡).
𝑀𝑇𝐵 = The market-to-book ratio, calculated as market value (𝑝𝑟𝑐𝑐_𝑓 × 𝑐𝑠ℎ𝑜)
divided by book value (𝑐𝑒𝑞).
𝐼𝑁𝑆𝑇𝑂𝑊𝑁 = The percentage of the firm’s shares held by institutional investors.
𝐹𝐸𝐷𝐶𝑈𝑆𝑇 = An indicator variable equal to 1 if one of the firm’s major customers is
the federal government, zero otherwise.
𝐴𝐴𝐸𝑅 = An indicator variable equal to 1 if the firm is subject to an Accounting
and Auditing Enforcement Release in the current year, 0 otherwise.
This Table contains variable definitions for all variables used in the study. Compustat
mnemonics are in parentheses.
The dependent variable is the firm’s GAAP effective tax rate (𝐸𝑇𝑅). To ensure the
generalizability of the results, I also estimate Equation (1) with alternate effective tax rate
variables such as the firm’s cash effective tax rate (𝐶𝐴𝑆𝐻_𝐸𝑇𝑅), long-run GAAP effective tax
rate (𝐶𝑈𝑅𝑅6), and long-run cash effective tax rate (𝐶𝐴𝑆𝐻6).16 When calculating effective tax
rates, special items are excluded from the denominator because special items can be quite large
and can lead to very volatile effective tax rates (Dyreng et al. 2008). The variable of interest is
𝐼𝑁𝑁𝑂𝑉, which is equal to the number of patents the firm generated in the year scaled by the
mean number of patents generated by all firms in that year. Scaling by the mean number of
16 𝐶𝑈𝑅𝑅6 and 𝐶𝐴𝑆𝐻6 are calculated as in Donohoe and Knechel (2014).

16
patents generated by all firms in the year controls for intertemporal differences in the level of
innovation. Patent data is obtained from the Hall et al. (2001) database.
Using the patent-based measure to capture innovation has several advantages over using
R&D. First, not all R&D leads to intellectual property; much R&D is unsuccessful (Thoma 2005;
Pielke 2012). Second, the amount of R&D reported by the firm is not necessarily equal to the
amount spent on research and development (Skaife et al. 2014). There is a limitation to using a
patent-based measure – it ignores other forms of intellectual property, such as copyrights.
The model controls for numerous firm characteristics which have been shown by prior
literature to affect the level of taxes avoided. The model controls for the profitability of the firm
(𝑅𝑂𝐴) because Gupta and Newberry (1997) document a negative relation between the level of
tax avoidance and firm’s profitability. On the other hand, it could be argued that more profitable
firms have greater incentives to engage in tax avoidance due to the greater potential tax savings
(Rego 2003; Frank et al 2009; McGuire et al. 2012). As well, Manzon and Plesko (2002) argue
that more profitable firms can make better use of tax deductions, exemptions, and credits. I
include the level of cash holdings (CASH) because Dhaliwal et al (2011) find a negative
association between the level of tax avoidance and the firm’s cash holding. I control for leverage
(𝐿𝐸𝑉) because firms with different capital structures may have different incentives for tax
avoidance. For example, firms with high leverage may have a greater incentive to avoid taxes
because they need the cash to pay off their debt and interest.
I expect firms with net operating loss carryforwards (NOLs) to pay less tax. To control for
this effect, the model includes 𝑁𝑂𝐿 and ∆𝑁𝑂𝐿. I expect to observe a negative association of
∆𝑁𝑂𝐿, consistent with firms that are using NOLs exhibiting greater tax avoidance. The model
includes a control for foreign income (𝐹𝐼), because foreign income is not subject to US tax until
17
the time it’s repatriated.17 I include depreciation expense (𝐷𝐸𝑃) and intangible assets (𝐼𝑁𝑇𝐴𝑁𝐺)
because the depreciation and amortization rules are different for book purpose and tax purpose
(Cheng et al. 2012).18 The model controls for the firm’s equity income (𝐸𝑄𝑈𝐼𝐶) because income
from subsidiaries is recognized as book income under the equity method but it is not necessarily
included in taxable income. Firm size (𝑀𝑉𝐸) is included because large firms may have higher
political costs (Zimmerman 1983; Watts and Zimmerman 1986). In addition, larger firms may
have greater resources which allow them to avoid more taxes.
I follow McGuire et al. (2012) to include R&D (𝑅𝑁𝐷), depreciation (𝐷𝐸𝑃), and the firm’s
market-to-book ratio (𝑀𝑇𝐵). The model controls for firms which list the U.S. Federal
Government as one of their major customers because Mills et al. (2013) find that these firms
avoid fewer taxes, possibly due to higher political costs. Data on major customers comes from
the Compustat customer file. The model controls for firms which received Accounting and
Auditing Enforcement Releases (AAERs) because Lennox et al. (2013) document a positive
relationship between effective tax rates and AAERs.19 The model controls for institutional
ownership (𝐼𝑁𝑆𝑇𝑂𝑊𝑁) because prior research has shown that sophisticated shareholders can
have a significant effect on firms’ tax policies (e.g., Cheng et al. 2012). Institutional ownership
data are obtained from the Thomson Reuters database.
The model also includes year fixed effects to control for possible differences in tax laws
across years. As well, industry fixed effects are included to control for variation in tax-saving
17 Technically, firms are required to recognize a deferred tax expense on foreign income, unless the foreign income
is designated as permanently reinvested foreign income. However, many firms choose to designate some or all of
the foreign income as permanently reinvested (Rego 2003). 18 Specifically, while purchased goodwill is amortized over 15 years under U.S. tax rules, it is tested for impairment
under current U.S. GAAP. 19 AAER data are obtained from the Center for Financial Reporting and Management at University of California,
Berkeley. See Dechow et al. (2011) for details on the dataset. The dataset contains details on AAERs up to 2011.

18
opportunities across industries. Industries are defined using four-digit Global Industry
Classification Standard (GICS) codes following Bhojraj et al. (2003).20 Standard errors are
clustered by firm as recommended by Peterson (2009) and Gow et al. (2010). Results are similar
if I cluster standard errors by firm and year.
20 Bhojraj, Lee, and Oler (2003) provide evidence that the GICS classifications are superior to SIC codes in
explaining stock return co-movements, and key financial ratios.

19
4. DATA, SAMPLE SELECTION, AND DESCRIPTIVE STATISTICS
4.1 Data and Sample Selection
Financial statement data are obtained from the Compustat fundamentals annual file.
Institutional ownership data are obtained from the Thomson Reuters database. AAERs are
obtained from the Center for Financial Reporting and Management (see Dechow et al. 2011),
and data on patents come from the Hall et al. (2001) patent database. The sample spans 1993 to
1999. I choose a post-1993 sample because of the passage of FAS 109 Accounting for Income
Taxes in 1993. I start from 1993 to ensure the consistency of the tax avoidance measures. Panel
A of Table 2 outlines the sample selection procedure.
Table 2 Sample Selection and Sample Composition
Panel A: Sample Selection
All firm-years on Compustat post-1993 with non-missing innovation data: 78,605
Less observations with negative pre-tax income: (33,258)
Less financial services firms: (10,662)
Less firms without necessary data to estimate Eq. (1): (8,718)
Primary Sample 25,967
Panel B: Industry Composition
GICS Industry N Percentage of
Sample
Percentage of
Compustat
Sample
Energy (1010) 1,606 6.2% 5.6%
Materials (1510) 2,061 7.9% 6.6%
Capital Goods(2010) 2,917 11.2% 8.5%
Commercial & Professional Services (2020) 1,557 6.0% 6.0%
Transportation (2030) 748 2.9% 2.3%
Automobile and Components (2510) 571 2.2% 1.6%
Consumer Durables & Apparel (2520) 1,845 7.1% 5.8%
Consumer Services (2530) 1,155 4.5% 4.4%
Media (2540) 969 3.7% 4.3%
Retailing (2550) 1,572 6.1% 5.6%
Food & Staples Retailing (3010) 433 1.7% 1.4%
Food, Beverage, & Tobacco (3020) 899 3.5% 2.8%
Household & Personal Products (3030) 343 1.3% 1.1%
Health Care Equipment & Services (3510) 1,995 7.7% 8.4%
Pharmaceuticals, Biotechnology & Life
Sciences (3520)
692 2.7% 5.5%
Software & Services (4510) 1,656 6.4% 11.4%

20
(Table 2 continued)
GICS Industry N Percentage of
Sample
Percentage of
Compustat
Sample
Technology Hardware & Equipment (4520) 2,617 10.1% 9.8%
Semiconductors & Semiconductor Equipment
(4530)
514 2.0% 1.7%
Telecommunication Services (5010) 483 1.9% 3.3%
Utilities (5510) 1,302 5.0% 3.9%
Panel A contains details on the sample selection. Panel B displays the industry composition of
the sample, compared to Compustat during the same sample period. The sample spans 1993 to
1999.
I begin with all firm-year observations on Compustat during the period 1993 to 1999. The
sample ends in 1999 because that is the last year the patent data are available from the Hall et al.
(2001) database. Firm-year observations with negative pre-tax earnings are deleted as my focus
is on tax avoidance. Financial services firms (GICS codes beginning with 40) are deleted to be
consistent with prior literature (e.g., Cheng et al. 2012).21 After deleting 8,718 observations, due
to a lack of data necessary to estimate Eq. (1), I am left with 25,967 firm-year observations.
After trimming the sample in this way, each independent variable is winsorized at the 1st and 99th
percentile to reduce in the influence of outliers on the regression results.
Panel B of Table 2 contains an industry breakdown of my sample, compared to the
population of firms on Compustat during this time period. The composition of industries in my
sample is quite similar to that of Compustat. For example, 6.2 percent of the firms in my sample
are in the Energy industry as compared to 5.6 percent for the Compustat population. In addition,
the percentage of firms operating in the Commercial & Professional Services industry, Consumer
Durables industry, Household & Personal Products industry, and Health Care Equipment &
Services industry are quite similar to the Compustat population. A notable exception is Software
21 Results are robust to including financial services firms.
21
& Services (GICS code 4510) which accounts for only 6.4 percent of my sample and 11.4
percent of the Compustat firms during the same time period.
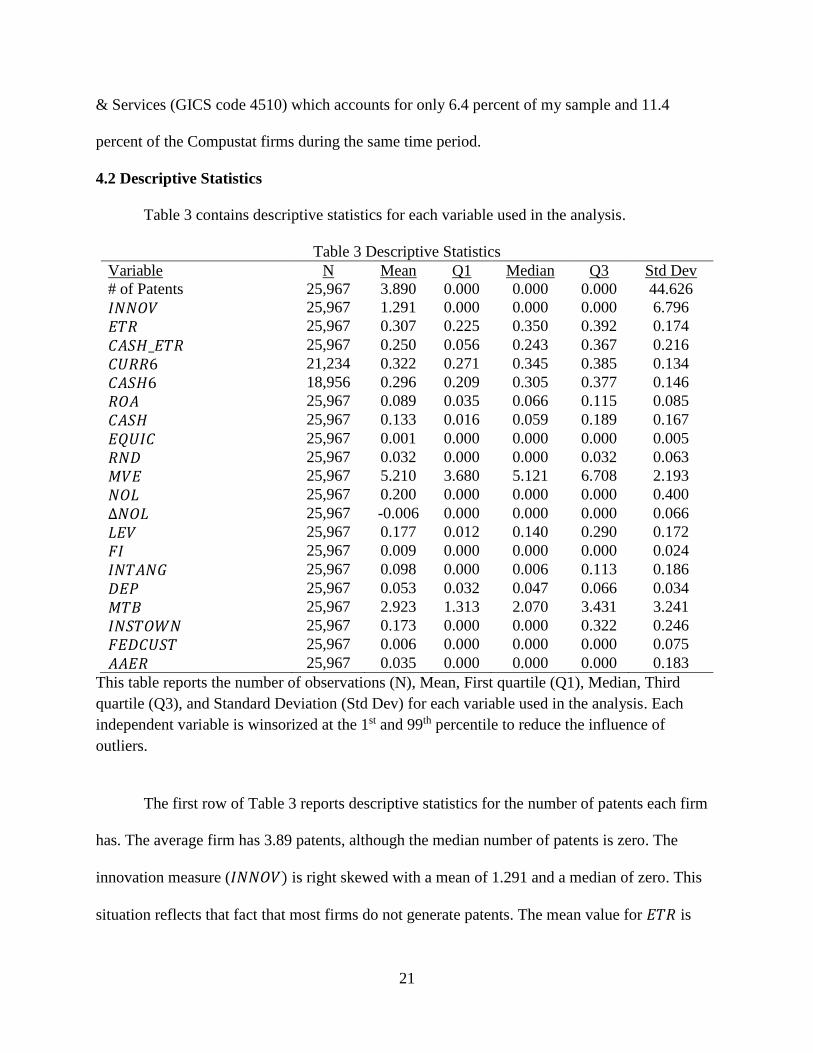
4.2 Descriptive Statistics
Table 3 contains descriptive statistics for each variable used in the analysis.
Table 3 Descriptive Statistics
Variable N Mean Q1 Median Q3 Std Dev
# of Patents 25,967 3.890 0.000 0.000 0.000 44.626
𝐼𝑁𝑁𝑂𝑉 25,967 1.291 0.000 0.000 0.000 6.796
𝐸𝑇𝑅 25,967 0.307 0.225 0.350 0.392 0.174
𝐶𝐴𝑆𝐻_𝐸𝑇𝑅 25,967 0.250 0.056 0.243 0.367 0.216
𝐶𝑈𝑅𝑅6 21,234 0.322 0.271 0.345 0.385 0.134
𝐶𝐴𝑆𝐻6 18,956 0.296 0.209 0.305 0.377 0.146
𝑅𝑂𝐴 25,967 0.089 0.035 0.066 0.115 0.085
𝐶𝐴𝑆𝐻 25,967 0.133 0.016 0.059 0.189 0.167
𝐸𝑄𝑈𝐼𝐶 25,967 0.001 0.000 0.000 0.000 0.005
𝑅𝑁𝐷 25,967 0.032 0.000 0.000 0.032 0.063
𝑀𝑉𝐸 25,967 5.210 3.680 5.121 6.708 2.193
𝑁𝑂𝐿 25,967 0.200 0.000 0.000 0.000 0.400
∆𝑁𝑂𝐿 25,967 -0.006 0.000 0.000 0.000 0.066
𝐿𝐸𝑉 25,967 0.177 0.012 0.140 0.290 0.172
𝐹𝐼 25,967 0.009 0.000 0.000 0.000 0.024
𝐼𝑁𝑇𝐴𝑁𝐺 25,967 0.098 0.000 0.006 0.113 0.186
𝐷𝐸𝑃 25,967 0.053 0.032 0.047 0.066 0.034
𝑀𝑇𝐵 25,967 2.923 1.313 2.070 3.431 3.241
𝐼𝑁𝑆𝑇𝑂𝑊𝑁 25,967 0.173 0.000 0.000 0.322 0.246
𝐹𝐸𝐷𝐶𝑈𝑆𝑇 25,967 0.006 0.000 0.000 0.000 0.075
𝐴𝐴𝐸𝑅 25,967 0.035 0.000 0.000 0.000 0.183
This table reports the number of observations (N), Mean, First quartile (Q1), Median, Third
quartile (Q3), and Standard Deviation (Std Dev) for each variable used in the analysis. Each
independent variable is winsorized at the 1st and 99th percentile to reduce the influence of
outliers.
The first row of Table 3 reports descriptive statistics for the number of patents each firm
has. The average firm has 3.89 patents, although the median number of patents is zero. The
innovation measure (𝐼𝑁𝑁𝑂𝑉) is right skewed with a mean of 1.291 and a median of zero. This
situation reflects that fact that most firms do not generate patents. The mean value for 𝐸𝑇𝑅 is

22
0.307, implying an average GAAP effective tax rate of 30.7 percent. This value is comparable to
recent research in this area, such as Dyreng et al. (2010) who report a mean ETR of 30.9 percent.
The mean 𝐶𝐴𝑆𝐻_𝐸𝑇𝑅 is slightly lower at 25 percent, also consistent with recent research in this
area (e.g., Dyreng et al. 2010 report a mean cash effective tax rate of 26.3 percent). The long-run
measures of tax avoidance (𝐶𝑈𝑅𝑅6 and 𝐶𝐴𝑆𝐻6) have higher mean values, reflecting the fact
that avoiding taxes for a prolonged period of time is more difficult than avoiding taxes for one
year. The mean value of 𝑁𝑂𝐿 is 0.20, suggesting that approximately 20 percent of the firm-years
have a net operating loss carryforward. The average firm has 17.3 percent of its stock held by
institutional investors, although the median amount is zero percent, suggesting that this variable
is right-skewed. Finally, only 3.5 percent of firm-years in the sample involve an AAER.
Table 4 contains Spearman correlation coefficients for all variables used in the analysis.
Consistent with the hypothesis, my proxy for innovation (𝐼𝑁𝑁𝑂𝑉) is negatively correlated with
both 𝐸𝑇𝑅 and 𝐶𝑈𝑅𝑅6. However, 𝐼𝑁𝑁𝑂𝑉 is also positively correlated with the other two proxies
for effective tax rates. I caution against putting too much weight on these correlations, as they do
not control for other known determinants of tax avoidance. The innovation measure is positively
correlated with R&D (0.29) and foreign income (0.27). The correlations are sufficiently low as to
suggest that innovation captures a different construct than either R&D or foreign income. In
general, the tax avoidance measures are positively correlated. The fact that none of the
correlations among the tax avoidance measures exceeds 0.62 suggests that these measures
capture different aspects of tax avoidance, consistent with the argument made by Hanlon and
Heitzman (2010). The highest correlation between my variable of interest (𝐼𝑁𝑁𝑂𝑉) and any
other independent variable is that of 𝑅𝑁𝐷 (0.29). I have conducted a variance inflation factor test
and find that the largest variance inflation factor is 1.81, which is far below the threshold of 10

23
Table 4 Spearman Correlations
Variable 1 2 3 4 5 6 7 8 9 10 11 12 13 14
1 𝐼𝑁𝑁𝑂𝑉
2 𝐸𝑇𝑅 -0.02
3 𝐶𝐴𝑆𝐻_𝐸𝑇𝑅 0.06 0.47
4 𝐶𝑈𝑅𝑅6 -0.03 0.60 0.39
5 𝐶𝐴𝑆𝐻6 0.04 0.36 0.62 0.52
6 𝑅𝑂𝐴 0.03 -0.03 0.00 0.00 -0.05
7 𝐶𝐴𝑆𝐻 -0.01 -0.12 -0.07 -0.09 -0.03 0.31
8 𝐸𝑄𝑈𝐼𝐶 0.05 -0.01 -0.01 -0.01 0.01 -0.03 -0.07
9 𝑅𝑁𝐷 0.29 -0.17 -0.05 -0.14 -0.06 0.18 0.31 -0.02
10 𝑀𝑉𝐸 0.24 0.14 0.15 0.07 0.02 0.04 -0.11 0.16 0.04
11 𝑁𝑂𝐿 0.02 -0.12 -0.18 -0.07 -0.11 -0.05 0.03 -0.02 0.10 -0.07
12 ∆𝑁𝑂𝐿 0.00 0.06 0.09 0.04 0.07 -0.08 -0.04 0.00 -0.02 0.10 0.00
13 𝐿𝐸𝑉 -0.01 0.08 -0.02 0.05 -0.07 -0.37 -0.52 0.08 -0.30 0.17 0.02 0.05
14 𝐹𝐼 0.27 -0.01 0.05 -0.02 -0.01 0.07 0.03 0.07 0.24 0.27 0.06 0.01 0.00
15 𝐼𝑁𝑇𝐴𝑁𝐺 0.03 0.13 0.10 0.11 0.08 -0.02 -0.16 0.02 -0.04 0.10 0.06 0.02 0.17 0.10

24
(Table 4 continued)
Variable 𝐼𝑁𝑁𝑂𝑉 𝐸𝑇𝑅 𝐶𝐴𝑆𝐻_𝐸𝑇𝑅 𝐶𝑈𝑅𝑅6 𝐶𝐴𝑆𝐻6 𝑅𝑂𝐴 𝐶𝐴𝑆𝐻 𝐸𝑄𝑈𝐼𝐶 𝑅𝑁𝐷
𝐷𝐸𝑃 0.05 0.00 -0.03 0.02 -0.05 0.06 -0.10 -0.01 0.03
𝑀𝑇𝐵 0.07 -0.01 0.03 -0.01 -0.07 0.40 0.16 -0.01 0.20
𝐼𝑁𝑆𝑇𝑂𝑊𝑁 0.14 0.06 0.12 0.05 0.04 0.10 0.00 0.02 0.10
𝐹𝐸𝐷𝐶𝑈𝑆𝑇 -0.01 -0.01 -0.01 -0.01 0.00 0.00 0.01 -0.01 0.03
𝐴𝐴𝐸𝑅 0.00 -0.01 -0.03 -0.01 -0.03 -0.01 -0.01 0.00 0.00
Variable 𝑀𝑉𝐸 𝑁𝑂𝐿 ∆𝑁𝑂𝐿 𝐿𝐸𝑉 𝐹𝐼 𝐼𝑁𝑇𝐴𝑁𝐺 𝐷𝐸𝑃 𝑀𝑇𝐵 𝐼𝑁𝑆𝑇𝑂𝑊𝑁 𝐹𝐸𝐷𝐶𝑈𝑆𝑇
𝐷𝐸𝑃 0.06 0.03 0.01 0.14 0.04 0.09
𝑀𝑇𝐵 0.38 0.01 0.01 -0.13 0.12 0.09 0.09
𝐼𝑁𝑆𝑇𝑂𝑊𝑁 0.24 -0.02 0.03 -0.05 0.12 0.04 0.03 0.13
𝐹𝐸𝐷𝐶𝑈𝑆𝑇 0.01 0.01 -0.01 -0.01 0.00 0.02 -0.01 0.00 0.01
𝐴𝐴𝐸𝑅 0.00 0.01 0.00 0.00 0.00 0.03 0.00 0.02 -0.05 0.01
This table reports Spearman correlation coefficients. Correlations significant at the 5 percent level are in italics.

25
recommended by both Kennedy (1992) and Neter et al. (1996). Therefore, multicollinearity is
not likely to cloud my inferences for any of the independent variables.

26
5. EMPIRICAL RESULTS
The first column of Table 5 reports the results of estimating Equation (1).
Table 5
Do firms with more innovation avoid more taxes?
Dependent Variable = Effective Tax Rate
Variable Predicted Sign (1) 𝐸𝑇𝑅
(2)
𝐶𝐴𝑆𝐻_𝐸𝑇𝑅 (3) 𝐶𝑈𝑅𝑅6 (4) 𝐶𝐴𝑆𝐻6
𝐼𝑁𝑁𝑂𝑉 - -0.001*** -0.001** -0.001*** -0.000*
[-6.78] [-2.27] [-5.16] [-1.80]
𝑅𝑂𝐴 ? -0.143*** -0.277*** -0.089*** -0.241***
[-6.19] [-12.63] [-3.50] [-8.98]
𝐶𝐴𝑆𝐻 - -0.022** -0.013 -0.021* -0.021
[-2.01] [-1.04] [-1.79] [-1.53]
𝐸𝑄𝑈𝐼𝐶 - -1.401*** -1.771*** -0.541 -0.914**
[-4.32] [-4.82] [-1.57] [-2.42]
𝑅𝑁𝐷 - -0.277*** -0.233*** -0.176*** -0.175***
[-9.70] [-6.94] [-5.50] [-4.62]
𝑀𝑉𝐸 + 0.016*** 0.011*** 0.009*** 0.007***
[16.68] [9.20] [8.84] [5.30]
𝑁𝑂𝐿 - -0.038*** -0.067*** -0.012*** -0.031***
[-9.55] [-14.94] [-3.10] [-6.44]
∆𝑁𝑂𝐿 + 0.146*** 0.198*** 0.110*** 0.190***
[6.73] [11.04] [3.89] [5.56]
𝐿𝐸𝑉 - -0.042*** -0.131*** -0.037*** -0.135***
[-3.77] [-10.45] [-3.17] [-10.50]
𝐹𝐼 - 0.113* 0.035 0.075 -0.084
[1.77] [0.47] [1.22] [-1.22]
𝐼𝑁𝑇𝐴𝑁𝐺 - 0.059*** 0.065*** 0.047*** 0.039***
[6.84] [6.57] [5.65] [4.01]
𝐷𝐸𝑃 - 0.038 -0.025 0.142** -0.061
[0.70] [-0.43] [2.51] [-0.96]
𝑀𝑇𝐵 - -0.003*** -0.002*** -0.002*** -0.003***
[-5.03] [-3.62] [-3.37] [-3.48]
𝐼𝑁𝑆𝑇𝑂𝑊𝑁 - 0.027*** 0.048*** 0.019*** 0.012*
[4.85] [6.36] [3.39] [1.75]
𝐹𝐸𝐷𝐶𝑈𝑆𝑇 + -0.028* -0.024 -0.004 0.005
[-1.80] [-1.38] [-0.26] [0.26]
𝐴𝐴𝐸𝑅 ? -0.012 -0.026*** -0.003 -0.015
𝐶𝑂𝑁𝑆𝑇𝐴𝑁𝑇 ? 0.216*** 0.233*** 0.361*** 0.341***
[6.65] [6.73] [8.75] [6.32]
Adjusted 𝑅2 0.110 0.100 0.077 0.108
[-1.36] [-2.68] [-0.32] [-1.37]

27
(Table 5 continued)
Variable Predicted Sign (1) 𝐸𝑇𝑅
(2)
𝐶𝐴𝑆𝐻_𝐸𝑇𝑅 (3) 𝐶𝑈𝑅𝑅6 (4) 𝐶𝐴𝑆𝐻6
Industry Fixed
Effects
Yes Yes Yes Yes Yes
Year Fixed
Effects
Yes Yes Yes Yes Yes
Observations 25,967 25,967 21,234 18,956
This table contains the results of estimating four linear regressions using ordinary least squares.
Each row displays the estimated coefficient with its associated t-statistic in brackets below. The
dependent variable in (1) is 𝐸𝑇𝑅, in (2) it is 𝐶𝐴𝑆𝐻_𝐸𝑇𝑅, in (3) it is 𝐶𝑈𝑅𝑅6, and in (4) it is
𝐶𝐴𝑆𝐻6. *, **, and *** denote statistical significance at the 10, 5, and 1 percent levels,
respectively, using a two-tailed test. The model includes industry and year fixed effects, where
industries are defined using four-digit GICS codes.
The coefficient on the variable of interest (𝐼𝑁𝑁𝑂𝑉) is -0.001 and it is significant at the 1
percent level using a two-tailed test (t-stat. = -6.78). This indicates that more innovative firms are
associated with lower GAAP effective tax rates. The coefficient on 𝑅𝑂𝐴 is negative and
significant, consistent with the notion that more profitable firms have greater incentives to avoid
taxes due to the larger potential tax savings (Rego 2003; Frank et al 2009; McGuire et al. 2012).
The significantly negative coefficient on 𝐿𝐸𝑉 is consistent with highly levered firms using the
interest expense on their debt as a tax shield in order to pay lower taxes. The adjusted 𝑅2 of the
model is 11 percent, which is consistent with recent research in this area (e.g., Cheng et al.
(2012) report an adjusted 𝑅2 of 0.110).
The second column of Table 5 reports the results of estimating Eq. (1) using the cash
effective tax rate (𝐶𝐴𝑆𝐻_𝐸𝑇𝑅) as the dependent variable. Cash effective tax rates have the
advantage of not being affected by changes in estimates such as valuation allowances (Dyreng et
al. 2008). In addition, a firm could have accelerated depreciation for tax purposes, which would
reduce cash taxes paid but would not affect the GAAP ETR. Therefore, it is important to test

28
whether the results are robust to using the cash effective tax rate to measure tax avoidance.22
The results are quite similar in that the coefficient on 𝐼𝑁𝑁𝑂𝑉 is -0.001 and it is significant at the
5 percent level (t-stat. = -2.27).
Columns 3 and 4 report the results when using long-run effective tax rates to measure tax
avoidance. Long-run effective tax rates have the advantage of being less influenced by short-
term fluctuations in effective tax rates attributable to unusual operating years. The results are
quite similar, with the coefficient on 𝐼𝑁𝑁𝑂𝑉 significant and negative in both regressions. To
summarize, the results reported in Table 5 offer strong support for the hypothesis.
22 See Hanlon (2003) for a thorough discussion of issues in measuring tax avoidance.
29
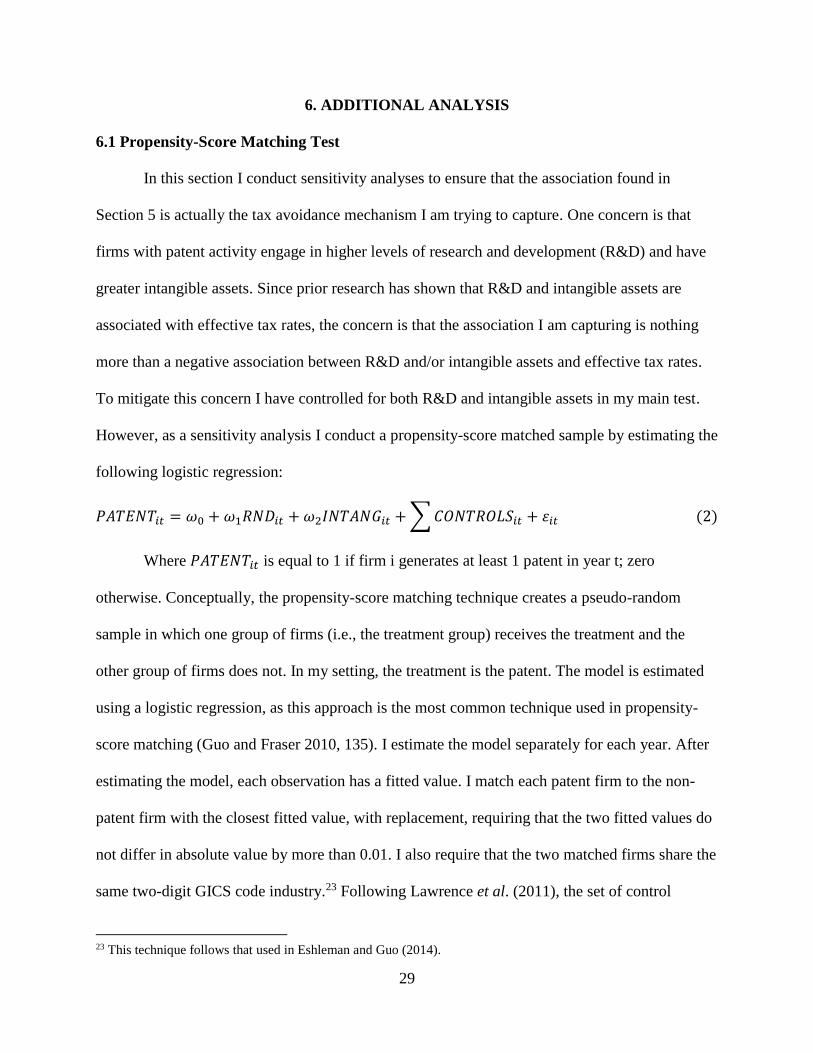
6. ADDITIONAL ANALYSIS
6.1 Propensity-Score Matching Test
In this section I conduct sensitivity analyses to ensure that the association found in
Section 5 is actually the tax avoidance mechanism I am trying to capture. One concern is that
firms with patent activity engage in higher levels of research and development (R&D) and have
greater intangible assets. Since prior research has shown that R&D and intangible assets are
associated with effective tax rates, the concern is that the association I am capturing is nothing
more than a negative association between R&D and/or intangible assets and effective tax rates.
To mitigate this concern I have controlled for both R&D and intangible assets in my main test.
However, as a sensitivity analysis I conduct a propensity-score matched sample by estimating the
following logistic regression:
𝑃𝐴𝑇𝐸𝑁𝑇𝑖𝑡 = 𝜔0 + 𝜔1𝑅𝑁𝐷𝑖𝑡 + 𝜔2𝐼𝑁𝑇𝐴𝑁𝐺𝑖𝑡 + ∑ 𝐶𝑂𝑁𝑇𝑅𝑂𝐿𝑆𝑖𝑡 + 휀𝑖𝑡 (2)
Where 𝑃𝐴𝑇𝐸𝑁𝑇𝑖𝑡 is equal to 1 if firm i generates at least 1 patent in year t; zero
otherwise. Conceptually, the propensity-score matching technique creates a pseudo-random
sample in which one group of firms (i.e., the treatment group) receives the treatment and the
other group of firms does not. In my setting, the treatment is the patent. The model is estimated
using a logistic regression, as this approach is the most common technique used in propensity-
score matching (Guo and Fraser 2010, 135). I estimate the model separately for each year. After
estimating the model, each observation has a fitted value. I match each patent firm to the non-
patent firm with the closest fitted value, with replacement, requiring that the two fitted values do
not differ in absolute value by more than 0.01. I also require that the two matched firms share the
same two-digit GICS code industry.23 Following Lawrence et al. (2011), the set of control
23 This technique follows that used in Eshleman and Guo (2014).

30
variables in the propensity-score matching regression includes the control variables listed in
Equation (1). After performing this procedure, I obtain a propensity-score matched sample of
4,422 firm-year observations. The number of observations is slightly less when using the long-
run effective tax rate measures. The first column of Table 6 reports the results of estimating Eq.
(1) using the propensity-score matched sample.
Table 6
Sensitivity Analysis using Propensity-score Matched Sample
Dependent Variable = Effective Tax Rate
Variable
Predicted
Sign (1) 𝐸𝑇𝑅 (2) 𝐶𝐴𝑆𝐻_𝐸𝑇𝑅 (3) 𝐶𝑈𝑅𝑅6 (4) 𝐶𝐴𝑆𝐻6
𝐼𝑁𝑁𝑂𝑉 - -0.001*** -0.000 -0.000** -0.001*
[-2.83] [-0.72] [-2.15] [-1.68]
𝑅𝑂𝐴 ? 0.013 -0.235*** 0.051 -0.244***
[0.18] [-3.39] [0.88] [-4.08]
𝐶𝐴𝑆𝐻 - 0.032 0.054 0.032 -0.007
[1.12] [1.53] [1.23] [-0.23]
𝐸𝑄𝑈𝐼𝐶 - -2.880*** -2.131*** -1.826*** -1.222**
[-4.26] [-3.12] [-3.02] [-1.97]
𝑅𝑁𝐷 - -0.304*** -0.219*** -0.240*** -0.163**
[-4.87] [-2.72] [-4.33] [-2.11]
𝑀𝑉𝐸 + 0.012*** 0.006** 0.008*** 0.005*
[4.29] [2.07] [3.70] [1.76]
𝑁𝑂𝐿 - -0.004 -0.030*** -0.003 -0.013
[-0.43] [-2.86] [-0.39] [-1.32]
∆𝑁𝑂𝐿 + 0.199** 0.315*** 0.156** 0.184**
[2.15] [5.73] [2.21] [1.98]
𝐿𝐸𝑉 - -0.000 -0.153*** -0.006 -0.105***
[-0.01] [-5.09] [-0.27] [-3.69]
𝐹𝐼 - 0.036 -0.034 -0.023 -0.205*
[0.33] [-0.30] [-0.28] [-1.91]
𝐼𝑁𝑇𝐴𝑁𝐺 - 0.051** 0.115*** 0.040* 0.016
[2.18] [3.49] [1.88] [0.63]
𝐷𝐸𝑃 - 0.025 0.385** 0.112 0.287*
[0.19] [2.12] [1.09] [1.73]
𝑀𝑇𝐵 - -0.002 -0.000 -0.000 -0.001
[-1.46] [-0.14] [-0.31] [-0.37]
𝐼𝑁𝑆𝑇𝑂𝑊𝑁 - 0.013 0.026* -0.012 -0.007
[1.17] [1.89] [-1.24] [-0.54]
𝐹𝐸𝐷𝐶𝑈𝑆𝑇 + -0.047 -0.161*** -0.016 -0.053
[-1.26] [-3.22] [-0.32] [-0.62]

31
(Table 6 continued)
Variable
Predicted
Sign (1) 𝐸𝑇𝑅 (2) 𝐶𝐴𝑆𝐻_𝐸𝑇𝑅 (3) 𝐶𝑈𝑅𝑅6 (4) 𝐶𝐴𝑆𝐻6
𝐴𝐴𝐸𝑅 ? -0.027 -0.023 0.008 -0.005
[-1.41] [-1.20] [0.41] [-0.18]
𝐶𝑂𝑁𝑆𝑇𝐴𝑁𝑇 ? 0.187*** 0.203*** 0.222*** 0.222***
[5.49] [4.89] [8.69] [5.88]
Industry Fixed Effects Yes Yes Yes Yes
Year Fixed Effects Yes Yes Yes Yes
Observations 4,422 4,422 3,977 3,737
Adjusted 𝑅2 0.0807 0.0865 0.0822 0.0973
This table contains the results of estimating four linear regressions using a propensity-score
matched sample. Each row displays the estimated coefficient with its associated t-statistic in
brackets below. The dependent variable in (1) is 𝐸𝑇𝑅, in (2) it is 𝐶𝐴𝑆𝐻_𝐸𝑇𝑅, in (3) it is 𝐶𝑈𝑅𝑅6,
and in (4) it is 𝐶𝐴𝑆𝐻6. *, **, and *** denote statistical significance at the 10, 5, and 1 percent
levels, respectively, using a two-tailed test. The model includes industry and year fixed effects,
where industries are defined using four-digit GICS codes.
The coefficient on 𝐼𝑁𝑁𝑂𝑉 is -0.001 and is significant at the 1 percent level, suggesting
that more innovative firms have lower effective tax rates. The coefficient on 𝐼𝑁𝑁𝑂𝑉 is negative,
but not significant when using 𝐶𝐴𝑆𝐻_𝐸𝑇𝑅 to measure tax avoidance in Column 2. However, the
results are again significant when using long-run measures of tax avoidance in Columns 3 and 4.
Overall, the evidence in Table 6 suggests that the main results are not sensitive to using a
propensity-score matched sample.
6.2 Change Model
The main results are based on an association between a firm’s patent level and its level of
tax avoidance. Although the association is suggestive of patents leading to greater tax avoidance,
it is also consistent with a correlated omitted variable causing both greater patent activity and
greater tax avoidance. In this section I attempt to alleviate these concerns by estimating the
following change model:
∆𝐸𝑇𝑅𝑖𝑡 = 𝛿0 + 𝛿1∆𝑃𝐴𝑇𝐸𝑁𝑇𝑖𝑡 + ∑ 𝐶𝑂𝑁𝑇𝑅𝑂𝐿𝑆𝑖𝑡 + 휀𝑖𝑡 (3)

32
Where ∆𝐸𝑇𝑅𝑖𝑡 is the firm’s effective tax rate in year t less the firm’s effective tax rate in the
prior year, all scaled by the firm’s effective tax rate in the prior year. The variable ∆𝑃𝐴𝑇𝐸𝑁𝑇𝑖𝑡
equals 1 if the firm has at least one patent in year t but did not have any patents in the prior year,
otherwise this variable equals zero. The coefficient 𝛿1 captures the change in the firm’s effective
tax rate attributable to the generation of a patent. The model includes all control variables
included in Eq. (1). Table 7 reports the results of estimating Eq. (3) using the GAAP effective tax
rate and the cash effective tax rate.24
Table 7
Sensitivity Analysis Using a Change Model
Dependent Variable = Change in Effective Tax Rate
Variable Predicted Sign (1) ∆𝐸𝑇𝑅 (2) ∆𝐶𝐴𝑆𝐻_𝐸𝑇𝑅
∆𝑃𝐴𝑇𝐸𝑁𝑇 - -0.434 -1.047***
[-1.57] [-3.49]
𝑅𝑂𝐴 ? -4.456 -1.413
[-1.24] [-0.30]
𝐶𝐴𝑆𝐻 - -0.179 -0.820
[-0.19] [-1.01]
𝐸𝑄𝑈𝐼𝐶 - -14.612** -9.492
[-2.18] [-0.51]
𝑅𝑁𝐷 - -0.058 4.663
[-0.04] [0.70]
𝑀𝑉𝐸 + -0.185*** -0.592***
[-2.78] [-5.48]
𝑁𝑂𝐿 - -0.379 -0.057
[-1.30] [-0.15]
∆𝑁𝑂𝐿 + -0.216 0.408
[-0.24] [0.22]
𝐿𝐸𝑉 - -0.974 -3.398*
[-0.88] [-1.65]
𝐹𝐼 - -3.916 -11.590**
[-1.29] [-2.32]
𝐼𝑁𝑇𝐴𝑁𝐺 - -0.362 3.657
[-0.59] [1.50]
𝐷𝐸𝑃 - 19.981 0.440
[1.17] [0.08]
24 I do not report results using long-run effective tax rates as changes in patents in year t will likely take a
considerable time to affect long-run tax rates.

33
(Table 7 continued)
Variable Predicted Sign (1) ∆𝐸𝑇𝑅 (2) ∆𝐶𝐴𝑆𝐻_𝐸𝑇𝑅
𝑀𝑇𝐵 - 0.110 0.223**
[1.05] [2.03]
𝐼𝑁𝑆𝑇𝑂𝑊𝑁 - -0.815** -1.185*
[-2.12] [-1.93]
𝐹𝐸𝐷𝐶𝑈𝑆𝑇 + 0.538 -1.636
[0.81] [-1.14]
𝐴𝐴𝐸𝑅 ? 0.308 -0.523
[0.56] [-0.90]
𝐶𝑂𝑁𝑆𝑇𝐴𝑁𝑇 ? 0.986 1.910
[0.95] [1.57]
Industry Fixed Effects Yes Yes
Year Fixed Effects Yes Yes
Observations 22,029 20,336
Adjusted 𝑅2 0.002 0.004
This table reports the results of estimating Eq. (3) using either the change in the GAAP effective
tax rate (∆𝐸𝑇𝑅) or the change in the cash effective tax rate (∆𝐶𝐴𝑆𝐻_𝐸𝑇𝑅) as the dependent
variable. Each row displays the estimated coefficient with its associated t-statistic in brackets
below. Standard errors are clustered by firm (Peterson 2009). *, **, and *** denote statistical
significance at the 10, 5, and 1 percent levels, respectively, using a two-tailed test. The model
includes industry and year fixed effects, where industries are defined using four-digit GICS
codes.
The first column reports the results when using the change in the GAAP effective tax rate
as the dependent variable while the second column reports the results when using the cash
effective tax rate. In either case, the coefficient on ∆𝑃𝐴𝑇𝐸𝑁𝑇 is negative. The effective is more
pronounced when using the change in the cash effective tax rate, where the coefficient is -1.047
and it is significant at the 1 percent level (t-stat. = -3.49). To summarize, the results suggest that
the generation of a patent is associated with a reduction in taxes paid. In addition, I have
estimated a model which includes change variables for all of the control variables, with the
exception of dichotomous variables such as 𝐹𝐸𝐷𝐶𝑈𝑆𝑇 or 𝐴𝐴𝐸𝑅. Using this model, I continue to
find a significantly negative coefficient on ∆𝑃𝐴𝑇𝐸𝑁𝑇. However, the number of observations is

34
reduced to 683 for this test, as I require data necessary to calculate change variables for all
variables in the model.
6.3 Alternative Measures of Innovation
The main results are based on measuring innovation using 𝐼𝑁𝑁𝑂𝑉, which is the number
of patents the firm has in a given year divided by the average number of patents firms have in
that year. To assess whether the results are sensitive to alternative measures of innovation, I
construct two additional proxies as follows.
𝑃𝑎𝑡𝑒𝑛𝑡 𝐷𝑢𝑚𝑚𝑦 = 1 if firm has at least one patent, 0 otherwise.
𝑁𝑢𝑚𝑃𝑎𝑡𝑒𝑛𝑡𝑠 = The number of patents the firm has.
I then re-estimate Eq. (1) using all four measures of tax avoidance. Table 8 reports the results for
each of the eight possible combinations of the four tax avoidance proxies and the two innovation
proxies.
Table 8
Sensitivity Analysis Using Alternative Measures of Innovation
Panel A: Alternative Measure is a Patent Dummy Variable
Dependent Variable = Effective Tax Rate
Variable
Predicted
Sign (1) 𝐸𝑇𝑅
(2)
𝐶𝐴𝑆𝐻_𝐸𝑇𝑅
(3)
𝐶𝑈𝑅𝑅6
(4)
𝐶𝐴𝑆𝐻6
𝑃𝑎𝑡𝑒𝑛𝑡 𝐷𝑢𝑚𝑚𝑦 - -0.016*** 0.001 -0.014*** 0.005
[-3.53] [0.14] [-3.07] [0.92]
𝑅𝑂𝐴 ? -0.143*** -0.275*** -0.089*** -0.238***
[-6.16] [-12.54] [-3.47] [-8.86]
𝐶𝐴𝑆𝐻 - -0.021* -0.012 -0.021* -0.019
[-1.94] [-0.93] [-1.73] [-1.42]
𝐸𝑄𝑈𝐼𝐶 - -1.409*** -1.768*** -0.547 -0.912**
[-4.34] [-4.82] [-1.58] [-2.42]
𝑅𝑁𝐷 - -0.278*** -0.237*** -0.176*** -0.184***
[-9.71] [-7.07] [-5.52] [-4.87]
𝑀𝑉𝐸 + 0.016*** 0.010*** 0.009*** 0.006***
[16.30] [8.71] [8.57] [4.73]
𝑁𝑂𝐿 - -0.038*** -0.067*** -0.012*** -0.031***
[-9.53] [-14.98] [-3.08] [-6.46]
∆𝑁𝑂𝐿 + 0.147*** 0.199*** 0.111*** 0.192***
[6.77] [11.11] [3.93] [5.63]
𝐿𝐸𝑉 - -0.041*** -0.131*** -0.037*** -0.134***
[-3.75] [-10.40] [-3.19] [-10.40]

35
(Table 8 continued)
Variable
Predicted
Sign (1) 𝐸𝑇𝑅
(2)
𝐶𝐴𝑆𝐻_𝐸𝑇𝑅
(3)
𝐶𝑈𝑅𝑅6
(4)
𝐶𝐴𝑆𝐻6
𝐹𝐼 - 0.090 0.009 0.057 -0.108
[1.41] [0.13] [0.94] [-1.57]
𝐼𝑁𝑇𝐴𝑁𝐺 - 0.060*** 0.066*** 0.048*** 0.040***
[6.89] [6.65] [5.70] [4.13]
𝐷𝐸𝑃 - 0.034 -0.030 0.139** -0.068
[0.63] [-0.50] [2.45] [-1.07]
𝑀𝑇𝐵 - -0.003*** -0.002*** -0.002*** -0.002***
[-5.04] [-3.55] [-3.38] [-3.39]
𝐼𝑁𝑆𝑇𝑂𝑊𝑁 - 0.027*** 0.047*** 0.019*** 0.011
[4.83] [6.24] [3.41] [1.64]
𝐹𝐸𝐷𝐶𝑈𝑆𝑇 + -0.029* -0.025 -0.005 0.004
[-1.88] [-1.41] [-0.34] [0.23]
𝐴𝐴𝐸𝑅 ? -0.012 -0.027*** -0.003 -0.015
[-1.40] [-2.70] [-0.34] [-1.38]
𝐶𝑂𝑁𝑆𝑇𝐴𝑁𝑇 ? 0.218*** 0.234*** 0.363*** 0.343***
[6.72] [6.75] [8.85] [6.35]
Industry Fixed Effects Yes Yes Yes Yes
Year Fixed Effects Yes Yes Yes Yes
Observations 25,967 25,967 21,234 18,956
Adjusted 𝑅2 0.109 0.0996 0.0757 0.107
Panel B: Alternative Measure is the Number of Patents
Dependent Variable = Effective Tax Rate
Variable
Predicted
Sign (1) 𝐸𝑇𝑅
(2)
𝐶𝐴𝑆𝐻_𝐸𝑇𝑅
(3)
𝐶𝑈𝑅𝑅6
(4)
𝐶𝐴𝑆𝐻6
𝑁𝑢𝑚𝑃𝑎𝑡𝑒𝑛𝑡𝑠 - -0.000** -0.000* -0.000*** -0.000
[-2.57] [-1.68] [-2.92] [-0.95]
𝑅𝑂𝐴 ? -0.142*** -0.276*** -0.088*** -0.239***
[-6.12] [-12.59] [-3.44] [-8.94]
𝐶𝐴𝑆𝐻 - -0.020* -0.013 -0.020* -0.020
[-1.84] [-0.97] [-1.66] [-1.47]
𝐸𝑄𝑈𝐼𝐶 - -1.404*** -1.773*** -0.544 -0.917**
[-4.32] [-4.83] [-1.58] [-2.43]
𝑅𝑁𝐷 - -0.284*** -0.237*** -0.184*** -0.180***
[-9.94] [-7.08] [-5.75] [-4.77]
𝑀𝑉𝐸 + 0.015*** 0.011*** 0.008*** 0.006***
[16.32] [9.17] [8.54] [5.17]
𝑁𝑂𝐿 - -0.038*** -0.067*** -0.013*** -0.031***
[-9.60] [-14.99] [-3.14] [-6.46]
∆𝑁𝑂𝐿 + 0.147*** 0.198*** 0.112*** 0.191***
[6.80] [11.08] [3.95] [5.60]
𝐿𝐸𝑉 - -0.041*** -0.131*** -0.036*** -0.134***
[-3.70] [-10.43] [-3.13] [-10.47]

36
(Table 8 continued)
Variable
Predicted
Sign (1) 𝐸𝑇𝑅
(2)
𝐶𝐴𝑆𝐻_𝐸𝑇𝑅
(3)
𝐶𝑈𝑅𝑅6
(4)
𝐶𝐴𝑆𝐻6
𝐹𝐼 - 0.080 0.020 0.050 -0.096
[1.25] [0.27] [0.82] [-1.41]
𝐼𝑁𝑇𝐴𝑁𝐺 - 0.060*** 0.065*** 0.048*** 0.039***
[6.95] [6.62] [5.75] [4.07]
𝐷𝐸𝑃 - 0.032 -0.027 0.138** -0.064
[0.60] [-0.46] [2.43] [-1.01]
𝑀𝑇𝐵 - -0.003*** -0.002*** -0.002*** -0.003***
[-5.00] [-3.62] [-3.38] [-3.46]
𝐼𝑁𝑆𝑇𝑂𝑊𝑁 - 0.026*** 0.047*** 0.018*** 0.012*
[4.52] [6.23] [3.14] [1.68]
𝐹𝐸𝐷𝐶𝑈𝑆𝑇 + -0.029* -0.025 -0.005 0.004
[-1.88] [-1.42] [-0.34] [0.22]
𝐴𝐴𝐸𝑅 ? -0.012 -0.027*** -0.003 -0.015
[-1.41] [-2.70] [-0.37] [-1.39]
𝐶𝑂𝑁𝑆𝑇𝐴𝑁𝑇 ? 0.219*** 0.234*** 0.363*** 0.342***
[6.71] [6.75] [8.89] [6.34]
Industry Fixed Effects Yes Yes Yes Yes
Year Fixed Effects Yes Yes Yes Yes
Observations 25,967 25,967 21,234 18,956
Adjusted 𝑅2 0.108 0.100 0.076 0.107
This table contains the results of estimating eight linear regressions using ordinary least squares.
Each row displays the estimated coefficient with its associated t-statistic in brackets below. The
dependent variable in (1) is 𝐸𝑇𝑅, in (2) it is 𝐶𝐴𝑆𝐻_𝐸𝑇𝑅, in (3) it is 𝐶𝑈𝑅𝑅6, and in (4) it is
𝐶𝐴𝑆𝐻6. Panel A presents results using 𝑃𝑎𝑡𝑒𝑛𝑡 𝐷𝑢𝑚𝑚𝑦 as a measure of innovation while Panel
B presents results using 𝑁𝑢𝑚𝑃𝑎𝑡𝑒𝑛𝑡𝑠 as a measure of innovation. *, **, and *** denote
statistical significance at the 10, 5, and 1 percent levels, respectively, using a two-tailed test. The
model includes industry and year fixed effects, where industries are defined using four-digit
GICS codes.
Panel A reports the results when using 𝑃𝑎𝑡𝑒𝑛𝑡 𝐷𝑢𝑚𝑚𝑦 to measure innovation. Using
this measure, I find that the coefficient on 𝑃𝑎𝑡𝑒𝑛𝑡 𝐷𝑢𝑚𝑚𝑦 is significantly negative in two out of
the four regressions. Interestingly, the coefficient is not significantly negative for the cash-based
measures of effective tax rates (columns 2 and 4). Panel B reports the results when using
𝑁𝑢𝑚𝑃𝑎𝑡𝑒𝑛𝑡𝑠 to capture innovation. This measure may be more powerful in detecting
innovation than the dichotomous measure used in Panel A. Indeed, the coefficient is negative for

37
all four regressions and is significant for three of them. The results in Table 8 alleviate concerns
that the findings are driven by a specific measure of innovation. It appears the results continue to
hold using alternate measures.
6.4 Does the Effect of Innovation on Tax Avoidance Depend on Firm Size?
In this section I test whether the effect of innovation on tax avoidance depends on the size
of the firm. To do this, I estimate the following linear regression:
𝐸𝑇𝑅𝑖𝑡 = 𝛿0 + 𝛿1𝐼𝑁𝑁𝑂𝑉𝑖𝑡 + 𝛿2𝑀𝑉𝐸𝑖𝑡 + 𝛿3𝐼𝑁𝑁𝑂𝑉𝑖𝑡 × 𝑀𝑉𝐸𝑖𝑡 + ∑ 𝐶𝑂𝑁𝑇𝑅𝑂𝐿𝑆𝑖𝑡
+ 𝐼𝑛𝑑𝑢𝑠𝑡𝑟𝑦 𝐹𝑖𝑥𝑒𝑑 𝐸𝑓𝑓𝑒𝑐𝑡𝑠 + 𝑌𝑒𝑎𝑟 𝐹𝑖𝑥𝑒𝑑 𝐸𝑓𝑓𝑒𝑐𝑡𝑠 + 휀𝑖𝑡 (4)
Subscripts i and t denote firm and year, respectively. The model includes all controls variables
included in Eq. (1) as well as industry and year fixed effects. The variable 𝑀𝑉𝐸𝑖𝑡 is the firm’s
market value of equity, as defined in Table 1. If larger (smaller) firms are better able to take
advantage of patents to avoid taxes, I expect the coefficient on 𝐼𝑁𝑁𝑂𝑉 × 𝑀𝑉𝐸 to be
significantly negative (positive). Table 9 reports the results.
Table 9
Does the Effect of Innovation on Tax Avoidance Depend on Firm Size?
Dependent Variable = Effective Tax Rate
Variable
Predicted
Sign (1) 𝐸𝑇𝑅 (2) 𝐶𝐴𝑆𝐻_𝐸𝑇𝑅 (3) 𝐶𝑈𝑅𝑅6 (4) 𝐶𝐴𝑆𝐻6
𝐼𝑁𝑁𝑂𝑉 - -0.001*** -0.000 -0.001*** -0.000
[-6.17] [-1.53] [-5.18] [-1.19]
𝐼𝑁𝑁𝑂𝑉 × 𝑀𝑉𝐸 ? -0.000 -0.000*** 0.000 -0.000*
[-1.49] [-2.73] [0.16] [-1.65]
𝑅𝑂𝐴 ? -0.143*** -0.277*** -0.089*** -0.241***
[-6.20] [-12.65] [-3.50] [-9.01]
𝐶𝐴𝑆𝐻 - -0.022** -0.013 -0.021* -0.021
[-2.00] [-1.01] [-1.79] [-1.51]
𝐸𝑄𝑈𝐼𝐶 - -1.404*** -1.779*** -0.541 -0.922**
[-4.33] [-4.84] [-1.57] [-2.44]
𝑅𝑁𝐷 - -0.278*** -0.235*** -0.176*** -0.177***
[-9.71] [-7.00] [-5.50] [-4.68]
𝑀𝑉𝐸 + 0.016*** 0.011*** 0.009*** 0.007***
[16.69] [9.24] [8.83] [5.34]

38
(Table 9 continued)
Variable
Predicted
Sign (1) 𝐸𝑇𝑅
(2)
𝐶𝐴𝑆𝐻_𝐸𝑇𝑅 (3) 𝐶𝑈𝑅𝑅6 (4) 𝐶𝐴𝑆𝐻6
𝑁𝑂𝐿 - -0.038*** -0.067*** -0.012*** -0.031***
[-9.55] [-14.97] [-3.10] [-6.47]
∆𝑁𝑂𝐿 + 0.145*** 0.197*** 0.110*** 0.189***
[6.73] [11.02] [3.89] [5.55]
𝐿𝐸𝑉 - -0.042*** -0.131*** -0.037*** -0.135***
[-3.77] [-10.45] [-3.17] [-10.50]
𝐹𝐼 - 0.111* 0.028 0.075 -0.090
[1.74] [0.38] [1.23] [-1.30]
𝐼𝑁𝑇𝐴𝑁𝐺 - 0.059*** 0.065*** 0.047*** 0.039***
[6.84] [6.56] [5.65] [4.00]
𝐷𝐸𝑃 - 0.037 -0.027 0.142** -0.063
[0.69] [-0.45] [2.51] [-0.99]
𝑀𝑇𝐵 - -0.003*** -0.002*** -0.002*** -0.002***
[-5.03] [-3.61] [-3.37] [-3.47]
𝐼𝑁𝑆𝑇𝑂𝑊𝑁 - 0.027*** 0.047*** 0.019*** 0.012*
[4.83] [6.32] [3.39] [1.72]
𝐹𝐸𝐷𝐶𝑈𝑆𝑇 + -0.028* -0.024 -0.004 0.004
[-1.80] [-1.39] [-0.26] [0.25]
𝐴𝐴𝐸𝑅 ? -0.012 -0.026*** -0.003 -0.015
[-1.37] [-2.68] [-0.32] [-1.38]
𝐶𝑂𝑁𝑆𝑇𝐴𝑁𝑇 ? 0.216*** 0.233*** 0.361*** 0.341***
[6.65] [6.73] [8.75] [6.31]
Industry Fixed Effects Yes Yes Yes Yes
Year Fixed Effects Yes Yes Yes Yes
Observations 25,967 25,967 21,234 18,956
Adjusted 𝑅2 0.110 0.100 0.077 0.108
This table contains the results of estimating four linear regressions using ordinary least squares.
Each row displays the estimated coefficient with is associated t-statistic in brackets below. The
dependent variable in (1) is 𝐸𝑇𝑅, in (2) it is 𝐶𝐴𝑆𝐻_𝐸𝑇𝑅, in (3) it is 𝐶𝑈𝑅𝑅6, and in (4) it is
𝐶𝐴𝑆𝐻6. *, **, and *** denote statistical significance at the 10, 5, and 1 percent levels,
respectively, using a two-tailed test. The model includes industry and year fixed effects, where
industries are defined using four-digit GICS codes.
The results indicate that the effect of innovation on corporate tax avoidance is slightly
stronger for larger companies, consistent with these companies being better able to take
advantage of patents to avoid income taxes. Specifically, the coefficient on 𝐼𝑁𝑁𝑂𝑉 × 𝑀𝑉𝐸 is
significantly negative when using 𝐶𝐴𝑆𝐻_𝐸𝑇𝑅 or 𝐶𝐴𝑆𝐻6 as measure of tax avoidance.

39
6.5 Is the Effect of Innovation on Tax Avoidance Affected by Foreign Income?
In this section I test whether the effect of innovation on corporate tax avoidance depends
on the amount of foreign income the firm generates. To test this, I estimate the following model:
𝐸𝑇𝑅𝑖𝑡 = 𝛿0 + 𝛿1𝐼𝑁𝑁𝑂𝑉𝑖𝑡 + 𝛿2𝐹𝐼𝑖𝑡 + 𝛿3𝐼𝑁𝑁𝑂𝑉𝑖𝑡 × 𝐹𝐼𝑖𝑡 + ∑ 𝐶𝑂𝑁𝑇𝑅𝑂𝐿𝑆𝑖𝑡
+ 𝐼𝑛𝑑𝑢𝑠𝑡𝑟𝑦 𝐹𝑖𝑥𝑒𝑑 𝐸𝑓𝑓𝑒𝑐𝑡𝑠 + 𝑌𝑒𝑎𝑟 𝐹𝑖𝑥𝑒𝑑 𝐸𝑓𝑓𝑒𝑐𝑡𝑠 + 휀𝑖𝑡 (5)
Subscripts i and t denote firm and year, respectively. The model includes all controls in Eq. (1)
as well as industry and year fixed effects. If innovation leads to lower taxes only when firms
have substantial foreign income, I expect to observe a significantly negative coefficient on
𝐼𝑁𝑁𝑂𝑉 × 𝐹𝐼 and an insignificant coefficient on 𝐼𝑁𝑁𝑂𝑉 in the regression. Table 10 reports the
results.
Table 10
Does the Effect of Innovation on Tax Avoidance Depend on Foreign Income?
Dependent Variable = Effective Tax Rate
Variable Predicted
Sign (1) 𝐸𝑇𝑅 (2) 𝐶𝐴𝑆𝐻_𝐸𝑇𝑅 (3) 𝐶𝑈𝑅𝑅6 (4) 𝐶𝐴𝑆𝐻6
𝐼𝑁𝑁𝑂𝑉 - -0.001*** -0.000 -0.001*** -0.000
[-5.69] [-1.15] [-3.45] [-0.73]
𝐼𝑁𝑁𝑂𝑉 × 𝐹𝐼 ? 0.005 -0.003 -0.001 -0.004
[1.49] [-0.63] [-0.20] [-0.81]
𝑅𝑂𝐴 ? -0.144*** -0.276*** -0.089*** -0.240***
[-6.22] [-12.61] [-3.50] [-8.95]
𝐶𝐴𝑆𝐻 - -0.022** -0.014 -0.021* -0.021
[-2.00] [-1.04] [-1.79] [-1.53]
𝐸𝑄𝑈𝐼𝐶 - -1.398*** -1.773*** -0.542 -0.918**
[-4.31] [-4.82] [-1.57] [-2.43]
𝑅𝑁𝐷 - -0.277*** -0.233*** -0.176*** -0.176***
[-9.67] [-6.95] [-5.50] [-4.63]
𝑀𝑉𝐸 + 0.016*** 0.011*** 0.009*** 0.007***
[16.69] [9.17] [8.81] [5.26]
𝑁𝑂𝐿 - -0.037*** -0.067*** -0.012*** -0.031***
[-9.51] [-14.95] [-3.10] [-6.45]
∆𝑁𝑂𝐿 + 0.145*** 0.198*** 0.110*** 0.190***
[6.73] [11.04] [3.89] [5.56]
𝐿𝐸𝑉 - -0.042*** -0.131*** -0.037*** -0.135***
[-3.77] [-10.45] [-3.17] [-10.50]

40
(Table 10 continued)
Variable Predicted
Sign (1) 𝐸𝑇𝑅 (2) 𝐶𝐴𝑆𝐻_𝐸𝑇𝑅 (3) 𝐶𝑈𝑅𝑅6 (4) 𝐶𝐴𝑆𝐻6
𝐹𝐼 - 0.094 0.047 0.078 -0.067
[1.37] [0.61] [1.18] [-0.92]
𝐼𝑁𝑇𝐴𝑁𝐺 - 0.059*** 0.065*** 0.047*** 0.039***
[6.85] [6.56] [5.65] [4.00]
𝐷𝐸𝑃 - 0.038 -0.025 0.142** -0.061
[0.71] [-0.43] [2.51] [-0.96]
𝑀𝑇𝐵 - -0.003*** -0.002*** -0.002*** -0.003***
[-5.05] [-3.60] [-3.36] [-3.47]
𝐼𝑁𝑆𝑇𝑂𝑊𝑁 - 0.028*** 0.048*** 0.019*** 0.012*
[4.86] [6.35] [3.39] [1.76]
𝐹𝐸𝐷𝐶𝑈𝑆𝑇 + -0.027* -0.024 -0.004 0.004
[-1.78] [-1.39] [-0.26] [0.25]
𝐴𝐴𝐸𝑅 ? -0.012 -0.026*** -0.003 -0.015
[-1.37] [-2.67] [-0.32] [-1.37]
𝐶𝑂𝑁𝑆𝑇𝐴𝑁𝑇 ? 0.217*** 0.232*** 0.361*** 0.340***
[6.66] [6.73] [8.74] [6.31]
Industry Fixed Effects
Year Fixed Effects
Observations 25,967 25,967 21,234 18,956
Adjusted 𝑅2 0.110 0.100 0.077 0.108
This table contains the results of estimating four linear regressions using ordinary least squares.
Each row displays the estimated coefficient with is associated t-statistic in brackets below. The
dependent variable in (1) is 𝐸𝑇𝑅, in (2) it is 𝐶𝐴𝑆𝐻_𝐸𝑇𝑅, in (3) it is 𝐶𝑈𝑅𝑅6, in (4) it is 𝐶𝐴𝑆𝐻6.
*, **, and *** denote statistical significance at the 10, 5, and 1 percent levels, respectively, using
a two-tailed test. The model includes industry and year fixed effects, where industries are defined
using four-digit GICS codes.
Column 1 reports the results using the effective tax rate as a measure of tax avoidance.
Using this measure, the coefficient on 𝐼𝑁𝑁𝑂𝑉 remains negative and statistically significant (t-
stat. = -5.69) while the coefficient on the interaction of innovation with foreign income
(𝐼𝑁𝑁𝑂𝑉 × 𝐹𝐼) is not significantly different from zero. Similar results are found in Column 3
when using a long-run measure of the firm’s effective tax rate. Although the significance on the
innovation variable wanes in Columns 2 and 4, the coefficient on the interaction of innovation
and foreign income is never statistically different from zero. Thus, it appears that the effect of

41
innovation on corporate tax avoidance is not affected by the amount of foreign income the firm
generates.

42
7. CONCLUSION
In this study I examine the effect of firm innovation on corporate tax avoidance. While
prior literature has found a host of variables to be associated with tax avoidance (e.g., Gupta and
Newberry 1997; Phillips 2003; Rego 2003; Frank et al. 2009; Dyreng et al. 2010; Chen et al.
2010; Robinson et al. 2010; Cheng et al. 2012; McGuire et al. 2012; Badertscher et al. 2013;
Chyz 2013; Lennox et al. 2013; Mills et al. 2013), this literature has not considered firm
innovation. The results I document in this study are consistent with firms selling patents to their
foreign subsidiaries for a very low fee, which allows the foreign subsidiary to generate higher
revenue from the patents. Assuming the foreign subsidiary is located in a jurisdiction with a
lower corporate tax rate than the United States, the firm pays lower taxes. By showing that firms
with more patent activity have lower effective tax rates, this study begins to open the black box
of tax avoidance. Prior studies have not directly tested whether firms use certain tax avoidance
strategies.
However, this study is subject to a few limitations. Most importantly, the evidence in this
study in no way proves that firms actually charge abnormally low fees to their foreign
subsidiaries for the use of patents. In practice, firms generally do not reveal their tax avoidance
strategies, probably out of concern of an IRS audit. Second, the results in this study depend upon
the ability of the tax avoidance proxies to capture firms’ tax avoidance. To mitigate this concern
I have conducted my analyses using four measures of tax avoidance and generally find consistent
results for all four measures. In addition, while my sample ends in the year 1999, there have been
tax law changes introduced afterwards. A major change has been the introduction of schedule M-
1, which requires a reconciliation of book income to taxable income. In addition, the research
and development tax credit was expanded in 2013, the American Jobs Creation Act took place in

43
2004, and there was a major economic stimulus which affected corporate taxes in 2008.25
Therefore, the results in this paper may not be generalizable due to these tax law changes.
25 For a full list of tax law changes since 2000, see http://www.taxpolicycenter.org/legislation/2000.cfm.
44
REFERENCES
Aghion, P., N. Bloom, R. Blundell, R. Griffith, and P. Howitt. 2005. Competition and
Innovation: an Inverted-U Relationship. Quarterly Journal of Economics 120 (2): 701-
728.
Atanassov, J. 2013. Do Hostile Takeovers Stifle Innovation? Evidence form Antitakeover
Legislation and Corporate Patenting. Journal of Finance 68 (3): 1097-1131.
Badertscher, B., S. Katz, and S. Rego. 2010. The Impact of Public and Private Equity
Ownership, Financial Reporting Pressure, and Debt Financing on Corporate Tax
Avoidance. A Working paper, University of Notre Dame.
Badertscher, B., S. Katz, and S. Rego. 2013. The separation of ownership and control and
corporate tax avoidance. Journal of Accounting & Economics 56 (2/3): 228-250.
Bartelsman, E.J. and R. Beetsma. 2003. Why pay more? Corporate tax avoidance through
transfer pricing in OECD countries. Journal of Public Economics 87: 2225-2252.
Bernstein, S. 2012. Does Going Public Affect Innovation? A working paper, Stanford
University (February 28, 2014). Available at:
http://flatbush.sauder.ubc.ca/seminar/bernstein.pdf.
Bhojraj, S., C. Lee, and D. Oler. 2003. What’s my line? A comparison of industry classification
schemes for capital market research. Journal of Accounting Research 41 (5): 745-774.
Bonner, S., J. Davis, and B. Jackson. 1992. Expertise in corporate tax planning: The issue at the
identification stage. Journal of Accounting Research 30 (Supplement): 1-28.
Brav, A. W. Jiang, and X. Tian. 2014. Shareholder Power and Corporate Innovation:
Evidence from Hedge Fund Activism (March 14, 2014). Available
at: http://ssrn.com/abstract=2409404.
Brown, J. 2011. The spread of aggressive corporate tax reporting: A detailed examination of the
corporate-owned life insurance shelter. The Accounting Review 86 (1): 23-57.
Chen, S., X. Chen, Q. Cheng, and T. Shevlin. 2010. Are family firms more aggressive than non-
family firms? Journal of Financial Economics 95 (1): 41-61.
Cheng, C.S.A., H. Huang, Y. Li, and J. Stanfield. 2012. The effect of hedge fund activism on
corporate tax avoidance. The Accounting Review 87 (5): 1493-1526.
Chyz, J. 2013. Personally tax aggressive executives and corporate tax sheltering. Journal of
Accounting & Economics 56 (2/3): 311-328.

45
Clausing, K.A. 2003. Tax-motivated transfer pricing and US intrafirm trade prices. Journal of
Public Economics 87: 2207-2223.
Clausing, K.A. 2009. Multinational Firm Tax Avoidance and Tax Policy. National Tax Journal
62: 703-725.
Dechow, P., W. Ge, C.R. Larson, and R.G. Sloan. 2011. Predicting Material Accounting
Misstatements. Contemporary Accounting Research 28 (1): 17-82.
Desai, M., and D. Dharmapala. 2006. Corporate tax avoidance and high-powered incentives.
Journal of Financial Economics 79: 145-179.
Desai, M.A., and D. Dharmapala. 2009. Corporate Tax Avoidance and Firm Value. The Review
of Economics and Statistics 91 (3): 537-546.
Desai, M.A., I. Dyck, and L. Zingales. 2007. Theft and Taxes. Journal of Financial Economics
84: 591-623.
Dhaliwal, D., S.X. Huang, W. Moser, and R. Pereira. 2011. Corporate Tax Avoidance and the
Level and Valuation of Firm Cash Holdings. Available at:
http://papers.ssrn.com/sol3/papers.cfm?abstract_id=1905076.
Donohoe, M.P., and R.W. Knechel. 2014. Does corporate tax aggressiveness influence audit
pricing? Contemporary Accounting Research. Forthcoming.
Dyreng, S., M. Hanlon, and E. Maydew. 2008. Long-run corporate tax avoidance. The
Accounting Review 83 (1): 61-82.
Dyreng, S., M. Hanlon, and E. Maydew. 2010. The Effects of Executives on Corporate Tax
Avoidance. The Accounting Review 85 (4): 1163-1189.
Eshleman, J.D. and P. Guo. 2014. Do Big 4 Auditors Provide Higher Audit Quality After
Controlling for the Endogenous Choice of Auditor? A Working paper, Louisiana State
University.
Frank, M., L. Lynch, and S. Rego. 2009. Tax Reporting Aggressiveness and Its Relation to
Aggressive Financial Reporting. The Accounting Review 84 (2): 467-496.
Gleckman, H. 2013. The Real Story on Apple’s Tax Avoidance: How Ordinary It Is (February
27, 2014). Available at: http://www.forbes.com/sites/beltway/2013/05/21/the-real-story-
about-apples-tax-avoidance-how-ordinary-it-is/.
Gow, I.D., G. Ormazabal, and D.J. Taylor 2010. Correcting for Cross-Sectional and Time-Series
Dependence in Accounting Research. The Accounting Review 85 (2): 483-512.

46
Grubert, H. 1998. Taxes and the Divison of Foreign Operating Income Among Royalties,
Interest, Dividends, and Retained Earnings. Journal of Public Economics 68 (2): 269-
290.
Grubert, H. 2003. Intangible Income, Intercompany Transactions, Income Shifting, and the
Choice of Location. National Tax Journal 56: 221-242.
Grubert, H. and J. Slemrod. 1998. The effect of taxes on investment and income shifting into
Puerto Rico. Review of Economics and Statistics 75: 365-373.
Guo, S., and M. Fraser. 2010. Propensity Score Analysis: Statistical Methods and Applications.
Thousand Oaks, CA: SAGE Publications Inc.
Gupta, S., and K. Newberry. 1997. Determinants of the variability in corporate effective tax
rates: evidence from longitudinal study. Journal of Accounting and Public Policy 1-34.
Hall, B., A. Jaffe, and M. Trajtenberg. 2001. The NBER patent citation data file: lessons,
insights and methodological tools. Unpublished working paper.
Hanlon, M. 2003. What can we infer about a firm’s taxable income from its financial
statements? National Tax Journal 56 (4): 831-863.
Hanlon, M., and S. Heitzman. 2010. A review of tax research. Journal of Accounting &
Economics 50: 127-178.
He, J. and X. Tian. 2013. The dark side of analyst coverage: The case of innovation. Journal of
Financial Economics 109: 856-878.
Hirshleifer, D., P.H. Hsu, and D. Li. 2013. Innovative efficiency and stock returns. Journal of
Financial Economics 107: 632-654.
Hirshleifer, D., A. Low, and S.H. Teoh. 2012. Are Overconfident CEOs Better Innovators?
Journal of Finance 67 (4): 1457-1498.
Hirshleifer, D. and S. Teoh. 2003. Limited attention, information disclosure, and financial
reporting. Journal of Accounting & Economics 36: 337-386.
Huizinga, H. and L. Laeven. 2008. International profit shifting within multinationals: A multi-
country perspective. Journal of Public Economics 92 (5/6): 1164-1182.
47
Kennedy, P. 1992. A Guide to Econometrics. MIT Press, Cambridge, MA.
Klassen, J.K. and S.K. Laplante. 2012a. Are U.S. Multinational Corporations Becoming More
Aggressive Income Shifters? Journal of Accounting Research 50 (5): 1245-1285.
Klassen, K.J. and S.K. Laplante. 2012b. The Effect of Foreign Reinvestment and Financial
Reporting Incentives on Cross-Jurisdictional Income Shifting. Contemporary Accounting
Research 29 (3): 928-955.
KPMG. 2013. Corporate tax rates table (March 2, 2014). Available at:
http://www.kpmg.com/global/en/services/tax/tax-tools-and-resources/pages/corporate-
tax-rates-table.aspx.
Lawrence, A., M. Minutti-Meza, and P. Zhang. 2011. Can Big 4 versus Non-Big 4 Differences
in Audit-Quality Proxies Be Attributed to Client Characteristics? The Accounting Review
86 (1): 259-286.
Lennox, C., P. Lisowsky, and J. Pittman. 2013. Tax Aggressiveness and Accounting Fraud.
Journal of Accounting Research 51 (4): 739-778.
Manzon, G.B., and G.A. Plesko. 2002. The Relation between Financial and Tax Reporting
Measure of Income. Tax Law Review 55: 175-214.
Marzilli, T. 2012. Apple’s Reputation tougher than GE’s based on recent tax avoidance scandal
(August 8). Available at: http://www.brandindex.com/article/apple%E2%80%99s-reputation-
tougher-ge%E2%80%99s-based-recent-tax-avoidance-scandal.
McGuire, S.T., T.C. Omer, and D. Wang. 2012. Tax Avoidance: Does Tax-Specific Industry
Expertise Make a Difference? The Accounting Review 87 (3): 975-1003.
Mills, L., S.E. Nutter, and C.M. Schwab. 2013. The Effect of Political Sensitivity and
Bargaining Power on Taxes: Evidence from Federal Contractors. The Accounting Review
88 (3): 977-1005.
Mukherjee, A., M. Singh, and A. Zaldokas. 2014. Do Corporate Taxes Hinder Innovation?
(May 23, 2014). Available at: papers.ssrn.com/sol3/papers.cfm?abstract_id=2365980.
Neter, J., M.H. Kutner, C.J. Nachtsheim, and W. Wasserman. 1996. Applied Linear Regression
Models: 3rd Edition. McGraw-Hill Companies Inc.
Newberry, K.J. and D.S. Dhaliwal. 2001. Cross-Jurisdictional Income Shifting by U.S.
Multinationals: Evidence from International Bond Offerings. Journal of Accounting
Research 39 (3): 643-662.

48
Peterson, M. 2009. Estimating Standard Errors in Finance Panel Data Sets: Comparing
Approaches. Review of Financial Studies 22: 435-480.
Phillips, J. 2003. Corporate tax-planning effectiveness: the role of compensation-based
incentives. The Accounting Review 78: 847-874.
Pielke, R. 2012 R&D is not Innovation (June 11, 2014). Available at:
http://rogerpielkejr.blogspot.com/2012/06/r-is-not-innovation.html.
Porcano, T.M., G.T. Tsakumis, and A. Curtola. 2011. Tax Evasion, National Cultural
Dimensions, and Other Country-Structural Metrics. Journal of Forensic and
Investigative Accounting 3 (1): 86-115.
Rego, S. 2003. Tax avoidance activities of U.S. Multinational corporations. Contemporary
Accounting Research 20: 805-833.
Robinson, J.R., S.A. Sikes, and C.D. Weaver. 2010. Performance Measurement of Corporate
Tax Departments. The Accounting Review 85 (3): 1035-1064.
Rotkowski, A.M., and S.R. Miller. 2012. Overcoming Obstacles in the Intellectual Property
Transfer Price Analysis (February 27, 2014). Available at:
http://www.willamette.com/insights_journal/12/spring_2012_1.pdf.
Shackelford, D., and T. Shevlin. 2001. Empirical tax research in accounting. Journal of
Accounting & Economics 31 (1/3): 321-387.
Skaife, H., L. Swenson, and D. Wangerin. 2014. Classification Shifting and R&D Expense
(April 7, 2014). Available at:
http://papers.ssrn.com/sol3/papers.cfm?abstract_id=1823726&.
Suh, I.S., T. Headrick, and S. Minaburo. 2011. An Effective and Efficient Analytic Technique:
A Bootstrap Regression Procedure and Benford’s Law. Journal of Forensic and
Investigative Accounting 3 (3): 25-45.
Thoma, M. 2005. The Relationship between R&D and Successful Innovation (June 11, 2014).
Available at:
http://economistsview.typepad.com/economistsview/2005/11/the_relationshi.html.

49
Watts, R., and J. Zimmerman. 1986. Towards a Positive Theory of Accounting, Englewood
Cliffs NJ: Prentice Hall.
Zimmerman, J. 1983. Taxes and firm size. Journal of Accounting & Economics 5: 119-149.

50
THE VITA
Peng Guo was born in Beijing, China. She attended Beijing Normal University and came
to the United States in 2006. She earned a masters degree from North Carolina State University
in 2009. Upon graduation, she attended Louisiana State University to pursue a doctorate in
Accounting. Her research interests include taxation, self-selection, and earnings quality. Her
teaching interests include taxation and financial accounting.