The Effect of High Shear Homogenization on Physical ...
10
International Journal of Chemistry; Vol. 8, No. 4; 2016 ISSN 1916-9698 E-ISSN 1916-9701 Published by Canadian Center of Science and Education 52 The Effect of High Shear Homogenization on Physical Stability of Emulsions T. M. Silva 1 , N. N. P. Cerize 1 , A. M. Oliveira 1 1 Institute for Technological Research, Group for BioNanoManufacturing, Av. Prof. Almeida Prado, 532, 05508-901, São Paulo, Brazil. Correspondence: T. M. Silva, Institute for Technological Research, Group for Bio Nano Manufacturing, Av. Prof. Almeida Prado, 532, 05508-901, São Paulo, Brazil. E-mail: [email protected], [email protected] Received: December 21, 2015 Accepted: January 5, 2016 Online Published: September 28, 2016 doi:10.5539/ijc.v8n4p52 URL: http://dx.doi.org/10.5539/ijc.v8n4p52 Abstract Emulsions are thermodynamically unstable systems where droplet size is one of the main factors that affect its physical stability and consequently their quality. In this context, this work analyses the incorporation of a high shear homogenization step in the manufacturing process of an emulsion with the objective of maintaining its physical stability. In order to demonstrate the effects of this homogenization in the manufacturing process, the emulsion characterization was carried out by microscopy, rheology, laser diffraction and analytical photo-centrifugation techniques. The effect of high shear homogenization into the emulsion physical results was dependent on the speed applied to the homogenizer pump, with an effective 3600 rpm speed. There was no evidence of change on pH attributes and emulsion density, although there was a change in volumetric relationship between the droplet family presented in each sample, reducing the population of larger droplets to form a third family of intermediate droplets and increasing the volumetric proportion of the population of smaller droplets. This profile change in the droplet size distribution contributed to increased viscosity and emulsion without the presence of separation after it was submitted to the stress condition of temperature and agitation. Keywords: emulsion, physical process, droplet size, high shear homogenization 1. Introduction Emulsions are widely used as vehicles for cosmetic and pharmaceutical industry where various cosmetic or semi-solid pharmaceutical products are formulated as water in oil emulsion (W/O) or oil in water (O/W). Emulsions are systems with two immiscible liquids (oil and water) and may contain an emulsifying agent with the function of promoting emulsion stability due to its property of allocating in the oil and water interface decreasing the interfacial tension between these phases. Because the emulsion is considered a thermodynamically unstable system, it may present lack of long term stability. It was reported in a publication by Raikar et al. (2011) that commonly used techniques for emulsification require the application of mechanical energy to the two immiscible phases and stabilization of the newly formed interfaces by surfactants. Studies conducted to stabilize emulsions generally focus on the use of emulsifiers, as reported on relevant studies from Tadros (2006) and (2009) Baret et al. (2009). The use of emulsifiers in order to stabilize an emulsion certainly requires a change in the qualitative or quantitative formula of the product. There are other published works with guidance for stabilization of an emulsion, based on studying of the manufacturing process with the aim of improving the manufacturing step. Schultz et al. (2004) classify the different equipment used in the emulsion homogenization step as high pressure homogenizers, and high shear homogenizers; it is possible to observe that such equipment promotes reduction of droplet diameter, ensuring emulsion physical stability. Established products already commercialized, have a registered formula composition, sometimes patented, where their physical stability was confirmed in the climate zone condition in the region in which this product is marketed. When there is a need to adapt the physical stability of the product already registered to address, for example, different climate zone conditions or manufacturing site changes, formula amendments will impose regulatory barriers. However, improvements in the manufacturing process steps will be a more viable alternative from a regulatory and financial perspective.
Transcript of The Effect of High Shear Homogenization on Physical ...

International Journal of Chemistry; Vol. 8, No. 4; 2016 ISSN 1916-9698 E-ISSN 1916-9701
Published by Canadian Center of Science and Education
52
The Effect of High Shear Homogenization on Physical Stability of Emulsions
T. M. Silva1, N. N. P. Cerize1, A. M. Oliveira1 1Institute for Technological Research, Group for BioNanoManufacturing, Av. Prof. Almeida Prado, 532, 05508-901, São Paulo, Brazil.
Correspondence: T. M. Silva, Institute for Technological Research, Group for Bio Nano Manufacturing, Av. Prof. Almeida Prado, 532, 05508-901, São Paulo, Brazil. E-mail: [email protected], [email protected]
Received: December 21, 2015 Accepted: January 5, 2016 Online Published: September 28, 2016
doi:10.5539/ijc.v8n4p52 URL: http://dx.doi.org/10.5539/ijc.v8n4p52
Abstract
Emulsions are thermodynamically unstable systems where droplet size is one of the main factors that affect its physical stability and consequently their quality. In this context, this work analyses the incorporation of a high shear homogenization step in the manufacturing process of an emulsion with the objective of maintaining its physical stability. In order to demonstrate the effects of this homogenization in the manufacturing process, the emulsion characterization was carried out by microscopy, rheology, laser diffraction and analytical photo-centrifugation techniques. The effect of high shear homogenization into the emulsion physical results was dependent on the speed applied to the homogenizer pump, with an effective 3600 rpm speed. There was no evidence of change on pH attributes and emulsion density, although there was a change in volumetric relationship between the droplet family presented in each sample, reducing the population of larger droplets to form a third family of intermediate droplets and increasing the volumetric proportion of the population of smaller droplets. This profile change in the droplet size distribution contributed to increased viscosity and emulsion without the presence of separation after it was submitted to the stress condition of temperature and agitation.
Keywords: emulsion, physical process, droplet size, high shear homogenization
1. Introduction
Emulsions are widely used as vehicles for cosmetic and pharmaceutical industry where various cosmetic or semi-solid pharmaceutical products are formulated as water in oil emulsion (W/O) or oil in water (O/W). Emulsions are systems with two immiscible liquids (oil and water) and may contain an emulsifying agent with the function of promoting emulsion stability due to its property of allocating in the oil and water interface decreasing the interfacial tension between these phases. Because the emulsion is considered a thermodynamically unstable system, it may present lack of long term stability.
It was reported in a publication by Raikar et al. (2011) that commonly used techniques for emulsification require the application of mechanical energy to the two immiscible phases and stabilization of the newly formed interfaces by surfactants.
Studies conducted to stabilize emulsions generally focus on the use of emulsifiers, as reported on relevant studies from Tadros (2006) and (2009) Baret et al. (2009). The use of emulsifiers in order to stabilize an emulsion certainly requires a change in the qualitative or quantitative formula of the product. There are other published works with guidance for stabilization of an emulsion, based on studying of the manufacturing process with the aim of improving the manufacturing step. Schultz et al. (2004) classify the different equipment used in the emulsion homogenization step as high pressure homogenizers, and high shear homogenizers; it is possible to observe that such equipment promotes reduction of droplet diameter, ensuring emulsion physical stability.
Established products already commercialized, have a registered formula composition, sometimes patented, where their physical stability was confirmed in the climate zone condition in the region in which this product is marketed. When there is a need to adapt the physical stability of the product already registered to address, for example, different climate zone conditions or manufacturing site changes, formula amendments will impose regulatory barriers. However, improvements in the manufacturing process steps will be a more viable alternative from a regulatory and financial perspective.

http://ijc.ccsenet.org International Journal of Chemistry Vol. 8, No. 4; 2016
53
This work aims to study the additional step of high shear homogenization through a high shear homogenizer rotor-stator type pump at the end of an emulsion manufacturing process. Moreover, the ability of the high shear homogenizer to reduce the size and to increase uniformity of the droplets to maintain the emulsion physical stability was evaluated. Additionally, to prove the effectiveness of the homogenizing pump, the emulsion physical characterization was performed, in order to demonstrate uniformity of the droplet shape as confirmed by microscopy, and reduction of the droplet size as verified by laser diffraction as well as the reduction of phase separation by photo-analytical centrifugation under speed and temperature stress conditions.
2. Methods
2.1 Emulsion Preparation
Oil in water emulsion was prepared by phase inversion. Industrial lots of 1500Kg were manufactured in 2000L capacity vessel. Initially, the ingredients corresponding to the oil phase 1a (Organic phase component with oily solvent) were heated at 50°C. Subsequently, the emulsion was formed by phase inversion by adding water, phase 1b. The viscosity regulators from phase 1c were added at 50°C, under agitation and recirculation through a lobe pump (Alfa Laval® manufacturer). The surfactant from phase 1d was solubilized in a stainless steel container with the remaining oil phase materials from phase 1d (Organic phase component with oily solvent). Subsequently, this mixture was transferred to the vessel. The emulsion was cooled down and transferred from the vessel to a stainless steel container through a lobe pump and a high shear homogenizer rotor-stator type with three stages (IKA® manufacturer). Table 1 presents the formulation used for seven lots.
Table 1. Formula composition
Phase Function 1a Organic phase component with oily solvent 1b Aqueous phase component1c Viscosity regulator component1d Amphoteric surfactant and Organic phase component with oily solvent
Table 2 presents a summary of the conditions applied to each test.
Table 2. Test conditions summary
Test Manufacturing
Process Lobe pump speed (rpm)
High shear homogenizer speed (rpm)
T1a T1 (1) 223 - T1b T1 (1) 223 - T1c T1 (1) 223 - T2a T2 (2) 223 1800 T3a T3 (3) 223 3600 T3b T3 (3) 223 3600 T3c T3 (3) 223 3600
(1) Process T1 – Without high shear homogenizer. (2) Process T2 – High shear homogenizer at 1800 rpm. (3) Process T3 – High shear homogenizer at 3600 rpm.
2.2 Emulsion Physical Characterization
2.2.1 pH
The pH of the emulsions was determined at 25°C ± 2°C, without dilution, using a digital pH meter (Mettler Toledo® manufacturer, Model pH / Ion meter S220). This test was performed in duplicate 24 hours after batch manufacturing.
2.2.2 Density
The density value of the emulsions was determined by Mettler Toledo densimeter Model 40, with temperature set at 20°C. The analysis was performed in duplicate 24 hours after batch manufacturing.
2.2.3 Viscosity
The viscosity of the emulsions was measured by a Brookfield viscometer model RVDV I+, with spindle number 5, temperature at 25°C and 20 rpm agitation speed. The test was performed in duplicate 24 hours after batch manufacturing. At spindle number 5 shear rate=0.

http://ijc.ccsenet.org International Journal of Chemistry Vol. 8, No. 4; 2016
54
2.2.4 Rheology
The rheology behaviour of the emulsions was analysed using a rheometer from Malvern Kinexus manufacturer, KNX5001 model. The equipment was set to apply an upward continuous shear rate from 0.01 to 1000 Pa at 25°C. The measurement was done 30 days after batch manufacturing.
2.2.5 Droplet Size
The droplet size distribution from the dispersed phase of the emulsion was evaluated by laser diffraction using the equipment Mastersizer Microplus from Malvern Instruments. The required dilution was performed with purified water to obtain obscuration from 10% to 20% in the equipment. The measurement was done 30 days after batch manufacturing. The droplet size distribution (Span) was reported in the form of cumulative percentage volume d[v; 0,1], d[v; 0.5], d[v; 0.9] and mean droplet diameter (d [4,3]). The equipment also calculated the polydispersity index which is an indication of the width of the droplets, reported as range: (d [v; 0.9] - d [v; 0.1]) / d [v; 0.5].
2.2.6 Microscopy
The droplet shape analysis was carried out by optical microscopy microscope Axio Imager Carl Zeiss, model M2M with DIC (interference contrast microscopy). The analysis was performed 30 days after batch manufacturing. The cover slip was gently placed in order to not break emulsion structure.
2.2.7 Analytical Photocentrifuge
In order to check the possibility of phase separation, the centrifuge was performed 24 hours and 30 days after emulsion manufacture stored at 25°C ± 2°C. For this study, centrifuge equipment, model Cientec CT-6000R was used. Centrifugation was performed at 3500 rpm for 15 minutes. From the tubes where separation was observed, the separated phase was removed and weighed to compare the amount of each separated sample.
Beyond the conventional centrifuge test, predictive assessment of physical stability of the emulsion was also carried out after 30 days of manufacture stored at 25°C ± 2°C, by checking phase separation through LUMiSizer® equipment. The equipment is an analytical photo-centrifuge system for measuring the intensity of light transmitted as a function of time and position along the entire length of the sample. The analysis was conducted at 45°C and rotation speed of 4000 rpm.
3. Results and Discussion
3.1 Manufacturing Process
The processes T1, T2 and T3 have in common the same manufacturing steps through the formation of the emulsion by phase inversion and differ only in the last homogenization step when the emulsion passes through a high shear pump, as summarized in the flow reported in Figure 1.
The lobe pump operating by a positive displacement (Eggert, 2011), was used in the manufacturing process with the function of recirculation in the vessel to enhance mixing of the ingredients in the formulation. Moreover, this pump was also used with the function of emulsion pumping, feeding the high shear homogenizer pump IKA® manufacturer at a flow of 2400 liters/hours. This flowrate was confirmed weighing the product that was transferred and time transference. The objective was to keep a steady feeding flow to the homogenizing pump. Thus, the emulsion residence time in the high shear homogenizer pump is constant for the seven tests. Keeping the residence time of emulsion in homogenizer pump, the speed of the homogenizer pump was changed for process T2 (1800 rpm) and process T3 (3600 rpm), in order to assess the effect of speed on the ability to promote different shear on the emulsion droplets. The shear rate applied in a rotor-stator homogenizer pump may increase emulsion temperature (Felton, 2013). It was also observed by Raikar et al. (2011) that substantial increases in the emulsion temperature for multiple passes occur at high pressure. Therefore, only a single pass of the emulsion through the high shear pump was performed and the initial and final temperature of the emulsion was measured using a digital thermometer. According to Table 3, it will be seen that the single pass of the emulsion by rotor-stator system does not increase the emulsion final temperature, even at the highest shear rate at 3600 rpm.

http://ijc.ccsene
Table 3. Emul
3.2 Physical C
The Figure 2 sdifferent batch
3.3 pH and De
There was no was an expectbetween tests Regarding theincorporate ai
Table 4. pH an
et.org
lsion temperatu
Characterizatio
shows the apphes of emulsio
ensity Results
significant vated result sinceT1, T2 and T3e density, it ir into the emu
nd density resu
ure compariso
Test
T1a T1b T1c T2a T3a T3b T3c
on Results
earance of theon, and all tests
Figure
ariation in the re there was no3 did not influis possible to lsion. If this ha
ults
Test
T1a T1b T1c T2a T3a T3b T3c
International J
Figure n - high shear
Initial temp(°C)
---
24,825,124,925,0
e samples by vs presented hom
2. Samples ap
results of pH a change in the
uence the ionizobserve that
ad happened, a
t
Journal of Chem
55
1. Process Flohomogenizer p
perature )
Fi
8190
isual inspectiomogenous with
ppearance by v
and density ame qualitative anation of the emthe difference
a change in de
pH
5,99 ± 0,036,02 ± 0,035,99 ± 0,026,00 ± 0,036,02 ± 0,035,97 ± 0,016,01 ± 0,02
mistry
ow
pump step
inal temperatu(°C)
---
25,325,325,125,3
on. There was nh no signs of p
visual inspectio
mong differentnd quantitativemulsion and the between thensity result wo
Gravity de(g/cm3
1,0136 ± 01,0129 ± 01,0139 ± 01,0129 ± 01,0143 ± 01,0127 ± 01,0142 ± 0
ure
no difference iphase separatio
on
t processes as oe formulation. Thereby promotee homogenizaould be noticed
ensity 3) ,0008,0020,0001,0020,0002,0001,0001
Vol. 8, No.
in appearance on or lumps.
observed in TaThe process die emulsion pH
ation process dd.
4; 2016
between
able 4. It ifference
H change. does not

http://ijc.ccsene
3.4 Droplets S
It can be obseIt could be exphenomenon lthe droplets le
For the procedistribution fodescribing moof intermediatshear homogepeaks related droplets.
According to However therforming a thirtests and a chaend of the droevents. It suppshear which wtests using theT3b and T3c,
Table 5. Drop
Test
T1a T1b T1c T2a T3a T3b T3c
The emulsionshowing the dpump at the sbut it is still ppolydispersitysignificant imp
et.org
Size Distributio
erved in Figurexplained by theleading to breaead to their coa
ess T3 where follows a trimore than one grte droplets andenization step (
to the family
Table 5, therre is a remarkrd family of inange in the dro
oplets size specports the obta
was able to rede high shear howith noticeabl
lets Size Distr
d [4,3]
18,58 | 18,229,22 | 29,132,86 | 29,317,72 | 17,67,29 | 7,86 9,45 | 9,129,84 | 9,12
n drops morphdrops from tesspeed of 1800 possible to obsy. However the
mprovement in t
on and Morpho
e 3 that the diste phenomenonakup of the dialescence form
the emulsionmodal model. I
roup with diffed the last group(T1) as well asy of smaller d
re is not a sigkable reductionntermediate drops distributioctrum is contr
ained result whduce the largeomogenizationle difference in
ribution
(µm) d
24 0,2216 0,2435 0,3562 0,25
0,202 0,192 0,20hology was evsts T1 to be elrpm in the sam
serve that theree use of homothe shape and
International J
ology
tribution of emn of drops breaspersed phase
ming bigger dro
ns undergo higIn this trimoderent droplet sip with larger ds the test with droplets and h
Figure 3. Dro
gnificant differn in the peak rops observed on model from olled by agitathere increasede end of the drn step at 3600rpn the outcome
[v; 0,1] (µm)
2 | 0,264 | 0,235 | 0,265 | 0,260 | 0,239 | 0,210 | 0,23valuated by oongated, with me formulatioe is no homogeogenizing pumsize of the dro
Journal of Chem
56
mulsion dropleakage and coal
into small droops.
gh shear throudal distributioize ranges, wit
droplets. It canlower shear at
high distributio
plets Size Dist
rence in peak distribution foas d50. This fa
m bimodal to trition intensity a
d intensity of troplets size. Thpm was confirof size distribu
d [v; 0,5
13,41 | 13,220,16 | 19,925,65 | 21,213,77 | 13,14,74 | 5,275,23 | 5,095,57 | 5,42
optical microscirregular and
on, T2 test, gaveneity in this e
mp at the speedops, appearing
mistry
t size follows lescence durinoplets whereas
ugh a higher on model, therth a first group
n be seen that at 1800 rpm (T2on volume pe
tribution
distribution ofor the d90 valuact explains thimodal. As repand the small the speed fromhis reduction
rmed to be effeution d [v; 0,9
5] (µm) d
24 45,391 72,26 77,412 41,7
18,226,26,
copy. Figure 4polydispersity
ve an improveemulsion size
d of 3600 rpm more rounded
a bimodal modg emulsion fors collisions by
speed (3600 rre is more thp of smaller drall tests that do2) show a low eaks related to
of smaller droues for the famhe increase of ported by Paulend by the phy
m high shear hin drops distriective and repr9] reported in T
d [v; 0,9] (µm)
36 | 44,36 53 | 71,46 46 | 75,66 76 | 42,40 26 | 19,76 15 | 24,65 87 | 25,20 4 depicts the y size. The useement in polyddispersion whin the same f
d.
Vol. 8, No.
del for T1 andrmation. The b
y the relative m
rpm), the drophan one distinroplets, a secono not use the fivolume of dis
o the family o
ps representedmilies of largethe Span resul et al. (2004) ysics of drop bhomogenizer inibution volumroducible for teTable 5.
Spa
3,367 | 3,333,587 | 3,573,006 | 3,543,014 | 3,213,809 | 3,704,967 | 4,804,788 | 4,60
images of eme of the homodispersity of thhich still presenformulation pr
4; 2016
d T2 tests. breakage
motion of
plet size nct peak, nd group inal high tribution of larger
d by d10.
er drops, lt for T3 the large breakage ncreased e for the ests T3a,
an
32774613070107
mulsions, genizing
he drops, nts some ovided a
http://ijc.ccsene
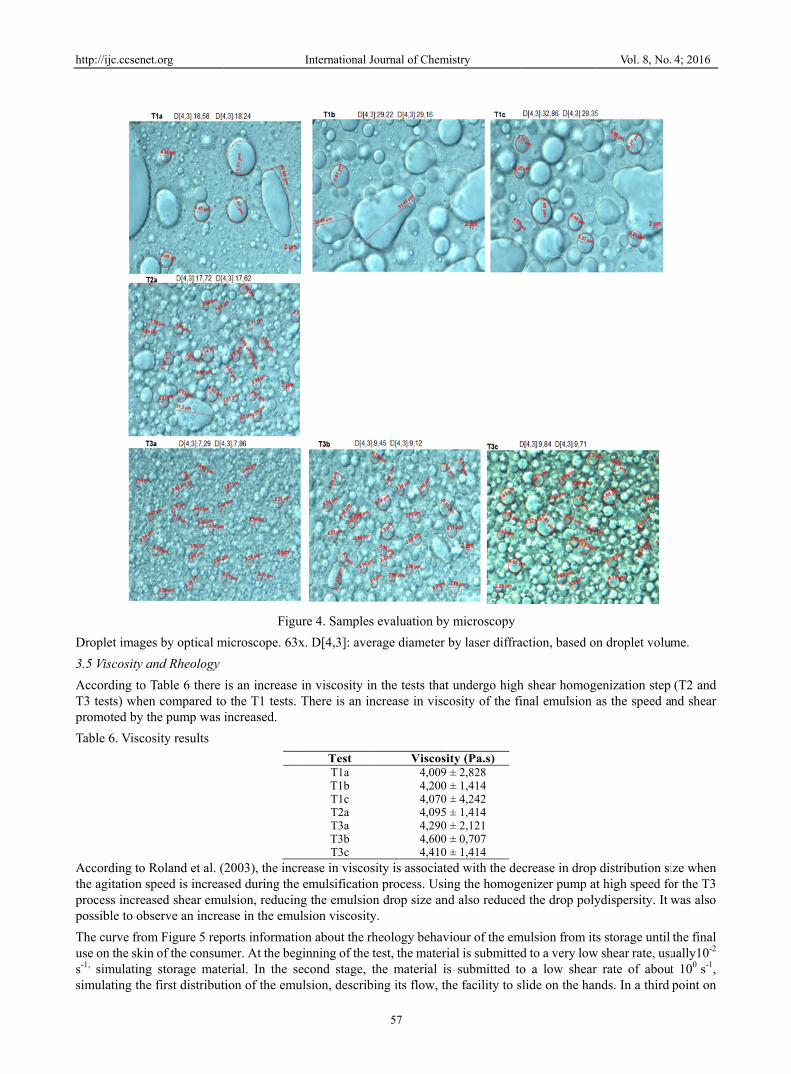
Droplet image
3.5 Viscosity a
According to T3 tests) whenpromoted by t
Table 6. Visco
According to Rthe agitation sprocess increapossible to ob
The curve fromuse on the skins-1, simulatingsimulating the
et.org
es by optical m
and Rheology
Table 6 there n compared tothe pump was
osity results
Roland et al. (speed is increaased shear emubserve an incre
m Figure 5 repn of the consumg storage matee first distribut
Figu
microscope. 63
is an increase o the T1 tests. increased.
(2003), the incrased during theulsion, reducinase in the emu
ports informatimer. At the begerial. In the stion of the emu
International J
ure 4. Samples
x. D[4,3]: aver
in viscosity inThere is an in
TestT1aT1bT1cT2aT3aT3bT3c
rease in viscose emulsificationng the emulsioulsion viscosity
on about the rhginning of the tecond stage, tulsion, describ
Journal of Chem
57
s evaluation by
rage diameter
n the tests thatncrease in visc
Viscosi4,009 4,200 4,070 4,095 4,290 4,600 4,410
sity is associatn process. Usinn drop size any. heology behavtest, the materithe material is
bing its flow, th
mistry
y microscopy
by laser diffra
t undergo highcosity of the fi
ity (Pa.s)± 2,828± 1,414± 4,242± 1,414± 2,121± 0,707± 1,414ed with the deng the homoge
nd also reduced
viour of the emial is submitteds submitted tohe facility to s
action, based on
h shear homoginal emulsion a
crease in dropenizer pump atd the drop poly
mulsion from itd to a very lowo a low shearlide on the han
Vol. 8, No.
n droplet volu
genization stepas the speed a
distribution sit high speed foydispersity. It
s storage until w shear rate, usur rate of aboutnds. In a third
4; 2016
me.
(T2 and and shear
ize when or the T3 was also
the final ually10-2 t 100 s-1, point on

http://ijc.ccsene
the curve, the out of the botthands, when vis applied at th
Source: Adapt
It is noted in the apparent vbehaviour systhickening age
It is also obsreducing the pnon-Newtonia
3.6 Analytical
It is observed
et.org
material is subtle. Finally, thviscosity decrehis stage of the
ted from Franc
Figure 6 that tviscosity as thestem from pseents with pseu
served that thepopulation of an flow curve b
l Photocentrifu
in Table 7 tha
bmitted to an e last stage of
eases. It is posse test (102 s-1).
Figur
ck, 2001; Woo
the applicatione shear rate weudoplastic flu
udoplastic char
e use of the flarger drops (behaviour and
Fig
uge
at the factor of
International J
intermediate sthe test depict
sible to evaluat
re 5. Rheology
d, 2001.
n of shear prowas increased, w
uid. This beharacteristic.
final high she(noted in the s
a pseudoplast
gure 6. Compa
f time (24 hou
Journal of Chem
58
shear rate (101
ts the end use te the spreadab
y behaviour fro
duced a lowerwhich may deaviour was ex
ear homogenizsize distributiotic fluid profile
arison of viscos
urs and 30 day
mistry
s-1), simulatinof the emulsiobility of the em
om storage to f
r internal resisescribe all of thxpected since
zation step in on of droplets)e for all seven
sity versus she
s) does not co
g the action ofon, the breakinmulsion on the
final use
stance with a che batches as the formula c
the formulati), maintained ttests.
ear rate
ntributes signi
Vol. 8, No.
f pumping the ng of the sampskin. A high s
consequent deca non-Newtoncomposition h
ions studied, the characteris
ificantly to an
4; 2016
material le on the hear rate
crease in nian flow has three
although stics of a
increase

http://ijc.ccsene
or decrease inshear homogeshowed no sep
Table 7. Centr
Additionally, manufacture tprofiles are siwhich showed
This could ind
There is no ovscanning light
Figure 8.
et.org
n the amount enisation step paration.
rifuge results c
the predictivthrough LUMiimilar for the d clarification a
dicate a possib
verlap of the lit, indicating in
Visual evalua
of the separatshowed separa
comparison.
Test
T1a T1b T1c T2a T3a T3b T3c
ve assessment Sizer® equipmsamples withoat the top of th
ble phase separ
ight transmissinstability of the
Figure 7. Tra
ation from the t
International J
ed emulsion eation after cen
t Sep
1
of physical ment. In generaout high shearhe tube under s
ration due to a
ion profile for e emulsion.
ansmission pro
tubes after the
Journal of Chem
59
expressed as antrifugation wh
paration % -24 hours
6,40 ± 0,025,10 ± 0,02
10,00 ± 0,123,50 ± 0,010,00 ± 0,000,00 ± 0,000,00 ± 0,00stability of t
al, it can be seer homogenizatstress by agitat
variation in th
these samples
ofile during the
analytical pho
mistry
a percentage. Mhile samples w
Separation30 day
6,50 ± 05,10 ± 0
10,60 ± 03,54 ± 00,00 ± 00,00 ± 00,00 ± 0
the emulsion en from the vartion and high tion and tempe
he droplet size.
and it is possi
e photocentrifu
otocentrifuge t
Moreover, the with high shea
n % -ys ,04,070,24,11,00,00,00was perform
riations of lighshear homoge
erature.
.
ible to observe
uge test
test: (a) First ru
Vol. 8, No.
samples withar homogenizat
med after 30 ht transmissionenization at 18
e a displaceme
un (b) Second
4; 2016
out high tion step
days of n that the 800 rpm,
ent of the
run

http://ijc.ccsenet.org International Journal of Chemistry Vol. 8, No. 4; 2016
60
The phase separation was confirmed after the display of the tubes at the end of the analytical photocentrifuge test in LUMiSizer® equipment.
All samples without high shear homogenization step and the sample with high shear homogenization at 1800 rpm (T2a) showed phase separation at the top of the tubes, as shown in the visual assessment in Figure 8.
For the samples with high shear homogenization at 3600 rpm no phase separation was observed at the top of the tube. Those samples which passed through the high shear process had similar light transmission profile between tests T3 (Figure 7) showing overlapping of the light transmission, confirming the benefit of the additional step of high shear homogenization for emulsion physical stabilization.
Table 8 summarizes the results of the instability index and the average droplet diameter from batches studied.
It is possible to conclude that higher instability indices are obtained for samples that have a larger average droplet size, represented by d [4,3].
Table 8. Instability Index versus Average Droplets Sizes
Test High shear
homogenizer speed (rpm)
Instability Index
Average d [4,3]
(µm)
T1a - 0,2038 0,1987 18,58
T1b - 0,26000,2130 29,22
T1c - 0,27930,2673
32,86
T2a 1800 0,17190,1874 17,72
T3a 3600 0,00680,0052 7,29
T3b 3600 0,00740,0074
9,45
T3c 3600 0,00830,0080 9,84
The instability can be attributed to the lack of homogeneity of size and shape of the droplets present in this emulsion, as evaluated by microscopy and laser diffraction techniques. From this study, we can see that besides the presence of the emulsifier, it is also necessary to have an effective emulsification process producing a homogeneous emulsion in the shape and size distribution of their droplets.
The same qualitative and quantitative formula with the same emulsifier system gives distinct phase separation results according to the homogenization process adopted.
Using the homogenizer pump at high speed (3600 rpm) a higher emulsion shear was obtained, and consequently, there was a possible increase in the interfacial area with better distribution of the emulsifying agent around the emulsion droplets without any change in the quantities used in the formulation.
4. Conclusions
This work focused on studying the influence of high shear homogenization process in maintaining the physical stability of an oil-in-water emulsion, having the same qualitative and quantitative formula composition.
The effect of high shear homogenization on the physical properties of the oil in water emulsion was dependent on the speed applied to the homogenizer pump where 3600rpm speed was confirmed to be effective in improving the physical aspects of size emulsion, drop shape, and eliminating separation of phases when submitted to stress conditions of temperature and agitation.
There was higher emulsion shearing using the homogenizer pump at high speed allowing a better emulsifying agent distribution in the emulsion probably by the increase in interfacial area.
The benefit of high shear homogenization at the end of the manufacturing step was confirmed, due to modification of the volume ratio between the families of droplets sizes present in each sample, thereby reducing the population of larger drops, and forming a third family of intermediate drops and increasing the population of smaller droplets. This effect was also observed in optical microscopy where there was drop polydispersity reduction for the tests that used the homogenization at 3600 rpm, resulting in a slight increase in the emulsion viscosity.
The rheology behaviour showed similar yield stress and consistency index results for the samples that passed through the high shear pump, which differs from the sample without the high shear homogenization step. This difference indicates that

http://ijc.ccsenet.org International Journal of Chemistry Vol. 8, No. 4; 2016
61
the samples that passed through the pump required a lower rate to start to flow, indicating a possible benefit to the consumer, due to potentially improved spreading properties of this emulsion on the skin for samples that passed through high shear homogenization process.
The high shear homogenization step proved to be feasible in maintaining physical stability of emulsions and can be an alternative to be utilized by companies in cases where a formula composition change imposes regulatory barriers.
Acknowledgements
The authors gratefully acknowledge IPT for infrastructure support and PhD Nigel Walshe for valuable comments on this work.
References
Baret, J., Kleinschmidt, F., Harrak, A., & Griffiths, A. D. (2009). Kinetic aspects of emulsion stabilization by surfactants: a microfluid analysis. American Chemical Society-Langmuir Article, 25, 6088-6093. http://dx.doi.org/10.1021/la9000472
Eggert, H. (2011). Rotary lobe pumps run like clockwork. World Pumps, 10, 34-35. http://dx.doi.org/10.1016/S0262-1762(11)70339-X
Franck, A. Understanding Rheology of Structured Fluids. Retrieved June, 04, 2015, from http://www.tainstruments.com/pdf/literature/AAN016_V1_U_StructFluids.pdf
Felton, L. A. (2013). Remington: Essentials of pharmaceutics. London: Pharmaceutical Press.
Paul, E. L., Atiemo-Obeng, V. A., & Kresta, S. M. (2004). Handbook of industrial mixing: science and practice. New Jersey: John Wiley & Sons.
Raikar, N. B., Bhatia, S. R., Malone, M. F., Mcclements, D. J., & Henson, M. A. (2011). Predicting the effect of the homogenization pressure on emulsion drop-size distributions. Industrial & Engineering Chemistry Research, 50, 6089-6100. http://dx.doi.org/10.1021/ie101818h
Roland, I., Piel, G., Delattre, L., & Evrard. B. (2003). Systematic characterization of oil-in-water emulsions for formulation design. International Journal of Pharmaceutics, 263, 85-94. http://dx.doi.org/10.1016/S0378-5173(03)00364-8
Schultz, S., Wagner, G., Urban, K., & Ulrich, J. (2004). High pressure homogenization as a process for emulsion formation. Chemical Engineering & Technology, 27, 361-368. http://dx.doi.org/10.1002/ceat.200406111
Tadros, T. F. (2006). Principles of emulsion stabilization with special reference to polymeric surfactants. Journal of Cosmetic Science, 153-169.
Wood, J. H. (2001). Reologia farmacêutica. In: Lachman, L.; Lieberman, H. A.; Kanig, J. L. Teoria e prática na indústria farmacêutica. Lisboa: Fundação Calouste Gulbenkian.
Copyrights
Copyright for this article is retained by the author(s), with first publication rights granted to the journal.
This is an open-access article distributed under the terms and conditions of the Creative Commons Attribution license (http://creativecommons.org/licenses/by/4.0/).