The Effect of Health Education on Clinical and Self ...
187
University of Central Florida University of Central Florida STARS STARS Electronic Theses and Dissertations, 2004-2019 2014 The Effect of Health Education on Clinical and Self-Reported The Effect of Health Education on Clinical and Self-Reported Outcomes of Diabetes in a Medical Practice Outcomes of Diabetes in a Medical Practice Karen Rav-Marathe University of Central Florida Part of the Public Administration Commons Find similar works at: https://stars.library.ucf.edu/etd University of Central Florida Libraries http://library.ucf.edu This Doctoral Dissertation (Open Access) is brought to you for free and open access by STARS. It has been accepted for inclusion in Electronic Theses and Dissertations, 2004-2019 by an authorized administrator of STARS. For more information, please contact [email protected]. STARS Citation STARS Citation Rav-Marathe, Karen, "The Effect of Health Education on Clinical and Self-Reported Outcomes of Diabetes in a Medical Practice" (2014). Electronic Theses and Dissertations, 2004-2019. 4815. https://stars.library.ucf.edu/etd/4815
Transcript of The Effect of Health Education on Clinical and Self ...

University of Central Florida University of Central Florida
STARS STARS
Electronic Theses and Dissertations, 2004-2019
2014
The Effect of Health Education on Clinical and Self-Reported The Effect of Health Education on Clinical and Self-Reported
Outcomes of Diabetes in a Medical Practice Outcomes of Diabetes in a Medical Practice
Karen Rav-Marathe University of Central Florida
Part of the Public Administration Commons
Find similar works at: https://stars.library.ucf.edu/etd
University of Central Florida Libraries http://library.ucf.edu
This Doctoral Dissertation (Open Access) is brought to you for free and open access by STARS. It has been accepted
for inclusion in Electronic Theses and Dissertations, 2004-2019 by an authorized administrator of STARS. For more
information, please contact [email protected].
STARS Citation STARS Citation Rav-Marathe, Karen, "The Effect of Health Education on Clinical and Self-Reported Outcomes of Diabetes in a Medical Practice" (2014). Electronic Theses and Dissertations, 2004-2019. 4815. https://stars.library.ucf.edu/etd/4815
THE EFFECT OF HEALTH EDUCATION ON CLINICAL AND SELF-REPORTED
OUTCOMES OF DIABETES IN A MEDICAL PRACTICE
by
KAREN RAV-MARATHE
B.S. University of Bombay, 1977
PharmD University of Florida, 2000
M.P.H. University of North Florida, 2006
A dissertation submitted in partial fulfillment of the requirements
for the degree of Doctor of Philosophy
in the Department of Public Affairs
in the College of Health and Public Affairs
at the University of Central Florida
Orlando, Florida
Fall Term
2014
Major Professor: Thomas T.H. Wan

ii
© 2014 Karen Rav-Marathe

iii
ABSTRACT
A majority of diabetes self-management programs have been shown to improve
knowledge, attitude, practice, and health care outcomes. However, in the literature the
underlying causal mechanisms for the improvement attributable to health education have not
been explored, especially, how diabetes educational intervention may affect diabetes care
outcomes. The purpose of the present study was to identify the causal mechanisms responsible
for improved knowledge, attitude, practice and outcomes, so that educational interventions can
be tailored efficiently and effectively to patients who are most likely to benefit from self-care
management. The study used the knowledge, attitude, practice and outcome (KAP-O)
framework. The specific purpose of the study was to examine the causes of variation in the
outcomes of glycated hemoglobin (A1C), low-density lipoprotein cholesterol (LDLC), functional
capacity (FC), and poor perceived health (PPH).
An experimental study with a randomized control trial design involving 141 participants
was conducted. The experimental group (N = 87) and control group (N = 52) were comparable in
terms of demographics and major diagnoses. The experimental group received diabetes
education. The control and experimental groups received usual customary care. Knowledge,
attitude, practice, functional capacity and poor perceived health were measured before and after
intervention using reliable and valid instruments. The study used a tailored attitudinal instrument.
Glycated hemoglobin (A1C) and low-density lipoprotein cholesterol (LDLC) were measured
before and after intervention. Multiple analytic strategies were applied to examine the
experimental data.
The four outcome variables of (A1C), (LDLC), (FC), and (PPH) did not constitute one
common factor measurement model for outcome evaluation. Results of the Independent sample

iv
t-test showed that health educational intervention directly improves knowledge about diabetes.
The path analysis of panel regression showed that health educational intervention directly lowers
glycated hemoglobin (A1C). The causal modeling of {(Exp_Status)-(K-T2)-(A-T2)-(P-T2)}
model showed that health educational intervention also indirectly improves preventive practice
via knowledge. The effect of attitude (A-T2) was greater than the effect of knowledge on
preventive practice of self-care. The difference-in-differences analysis showed that difference in
practice (DP) statistically significantly affects the difference in glycated hemoglobin (DA1C).
The greater the preventive practice, the greater the lowering of glycated hemoglobin (A1C),
indicating a better control of diabetes. The data from this experiment do not support a strong
causal path of experimental effects on outcomes via knowledge, attitude, and practice of self-
care.
The study should be replicated using the KAP-O model in research based on multi-
centers, multiple providers, and a diverse population of Type 2 diabetes patients. The study
should assess outcomes more than four times over a period of one to two years to elicit the
trajectory of change in outcome variables. Knowledge and attitude should be assessed at baseline
and continuously improved for the duration of the study.

v
ACKNOWLEDGMENTS
I could not have reached this milestone but for the generosity of Dr. Thomas T. H. Wan. I
will ever remain grateful to Dr. Wan for his tireless assistance throughout the prospectus,
research, and dissertation process. I owe a heavy debt of gratitude to Dr. Wan for his unstinting
professional support and personal encouragement.
I wish to express my deep appreciation to my other committee members, Dr. Ning Zhang,
Dr. Myron Fottler, Dr. Allan March, and Dr. Jonathan Matusitz for their insight, review, and
valuable suggestions.
I wish to thank Mr. Blake Dickeson, President of New Millennia Health and Dr. Allan
March for providing the use of Healthy Tutor for this study. They were very responsive and
helpful.
I am grateful to my peer, Ms. Yi-Ling Lin, for technical assistance. I also appreciate the
kindness and support of my friends Dr. Alice Noblin and Dr. Joe Saviak.
The support of the staff, physician, and patients of Medical Specialists enabled me to
reach the goal and complete the research project.
I am thankful to Mrs. Sylvia Wan for her gracious hospitality. I am greatly appreciative
of Sharon Koufas whose formatting and technical assistance was invaluable.
I wish to thank my parents, Shridhar and Vimal Marathe for their encouragement and my
daughters, Kalyani and Kaveri for their forbearance. My husband Shriram deserves my deepest
gratitude for his generous support, guidance, and encouragement.

vi
TABLE OF CONTENTS
LIST OF FIGURES ........................................................................................................................ x
LIST OF TABLES ......................................................................................................................... xi
LIST OF ABBREVIATIONS ...................................................................................................... xiii
CHAPTER ONE: INTRODUCTION ............................................................................................. 1
The Study Purpose ...................................................................................................................... 1
Background on Diabetes ............................................................................................................. 1
Significance of the Study ............................................................................................................ 5
Research Questions ..................................................................................................................... 7
Study Design ............................................................................................................................... 8
Challenges of the Study ............................................................................................................ 14
Overview of the Chapters ......................................................................................................... 17
CHAPTER TWO: LITERATURE REVIEW AND THEORETICAL FRAMEWORK .............. 18
Review of Conceptual/Theoretical Perspectives ...................................................................... 18
The Knowledge, Attitude, Practice Framework ....................................................................... 21
History of KAP Surveys ........................................................................................................... 22
Diabetes KAP Studies ............................................................................................................... 29
Review of the Methodological Rigor of Previous Research ..................................................... 38
Studies Supporting the Concept that Educational Intervention Directly Improves Diabetics’
Knowledge .................................................................................................................... 42
Studies Supporting the Concept that Educational Intervention Directly Improves Attitude .... 45
Studies Supporting the Concept that Educational Intervention Directly Improves Preventive
Practice .......................................................................................................................... 46

vii
Studies Supporting the Concept that Health Educational Intervention Improves Health Care
Outcomes ...................................................................................................................... 47
Studies Supporting the Concept that Educational Intervention Indirectly Improves Practice via
Knowledge and Attitude ............................................................................................... 48
Studies Supporting the Concept that Educational Intervention Indirectly Affects Outcomes,
Mediated via Knowledge, Attitude, and Practice ......................................................... 49
CHAPTER THREE: METHODOLOGY ..................................................................................... 51
Introduction ............................................................................................................................... 51
Preparation for a Randomized Controlled Experiment ............................................................. 52
Description of Intervention and Implementation ...................................................................... 53
Definitions of Constructs .......................................................................................................... 56
Measurement of the Variables .................................................................................................. 58
Measurement Instruments Used ................................................................................................ 59
Validity and Reliability of Measurement: Knowledge, Attitude, Practice, and Outcome
Measures ....................................................................................................................... 63
Sampling and Power Analysis .................................................................................................. 65
CHAPTER FOUR: FINDINGS .................................................................................................... 75
Introduction ............................................................................................................................... 75
Descriptive and Correlation Analysis ....................................................................................... 75
The Intention-to-Treat Analysis: T-Tests ................................................................................. 78
Intention-to-Treat Analysis with Statistical Control of the Prior Score ................................... 84
Difference-in-Differences Analysis .......................................................................................... 89
CHAPTER FIVE: SUMMARY, IMPLICATIONS AND CONCLUSIONS ............................... 96
viii
Introduction ............................................................................................................................... 96
Statistical Procedures ................................................................................................................ 97
Summary of Major Findings ..................................................................................................... 98
Literature Supporting Finding One ......................................................................................... 101
Literature Not Supporting Finding Two ................................................................................. 103
Studies Reporting Improvement in A1C Post-Self-Management Education ......................... 105
Studies Supporting the Indirect Effect of Experimental Status on Preventive Practice via
Knowledge and Attitude ............................................................................................. 105
Studies Supporting the Causal Effect of Preventive Practice on Glycated Hemoglobin (A1C)
.................................................................................................................................... 106
Other Findings ........................................................................................................................ 106
Literature Related to Finding 7 ............................................................................................... 106
The Contribution of the Study ................................................................................................ 108
APPENDIX A: PERMISSION FROM SITE ............................................................................. 116
APPENDIX B: UCF IRB APPROVAL OF HUMAN RESEARCH ......................................... 118
APPENDIX C: LETTER TO PARTICIPANTS......................................................................... 121
APPENDIX D: INFORMED CONSENT .................................................................................. 123
APPENDIX E: LITERACY ASSESSMENT OF DIABETES INSTRUMENT ........................ 128
APPENDIX F: TEST OF FUNCTIONAL CAPACITY (EQ-5D-5L) WITH 5 ADDITIONAL
DIMENSIONS PROPOSED BY PERNEGER AND COURVOISIER (2011) ............. 130
APPENDIX G: TEST OF PERCEIVED POOR HEALTH EUROPEAN QUALITY VISUAL
ANALOGUE SCALE (EQ-VAS) .................................................................................. 133
APPENDIX H: SUMMARY OF DIABETES SELF-CARE ACTIVITIES INSTRUMENT.... 135

ix
APPENDIX I: HEALTHY TUTOR DIABETES KNOWLEDGE TEST .................................. 138
APPENDIX J: ATTITUDE INSTRUMENT.............................................................................. 147
APPENDIX K: FINDINGS OF ANALYSES NOT INCLUDED IN THE TEXT .................... 152
APPENDIX L: SUMMARY OF THE FINDINGS .................................................................... 158
LIST OF REFERENCES ............................................................................................................ 162

x
LIST OF FIGURES
Figure 1. Relationships of KAP-O Components in the Experiment ............................................. 13
Figure 2. Statistical Analysis Plan ................................................................................................ 72
Figure 3. Intention to Treat Analysis Plan .................................................................................... 73
Figure 4. The Net Effect of Experimental Status on Knowledge at T2 (K-T2) ............................ 84
Figure 5. Experimental Status, Knowledge (K-T2), Attitude (A-T2), and Practice (P-T2) at T2
Model .................................................................................................................................... 86
Figure 6. The Net Effect of Experimental Status on Glycated Hemoglobin (A1C) at T2 ........... 88
Figure 7. The Net Effect of Experimental Status and Differences in Knowledge (DK), Attitude
(DA), and Practice (DP) on Difference in Glycated Hemoglobin (DA1C) .......................... 90
Figure 8. The Net Effect of Experimental Status,and Differences in Knowledge (DK), Attitude
(DA), and Practice (DP) on Difference in Low-Density Lipoprotein Cholesterol (DLDLC)
............................................................................................................................................... 92
Figure 9. The Net Effect of Experimental Status and Differences in Knowledge (DK), Attitude
(DA), and Practice (DP) on Difference in Poor Perceived Health (DPPH) .......................... 93
Figure 10. The Net Effect of Experimental Status and Differences in Knowledge (DK), Attitude
(DA), and Practice (DP) on Difference in Functional Capacity (DFC) ................................ 94
Figure 11. The Net Effect of Experimental Status on Attitude at T2 (A-T2) ............................. 153
Figure 12. The Net Effect of Experimental Status on Practice at T2 ......................................... 154
Figure 13. The Net Effect of Experimental Status on Low-Density Lipoprotein Cholesterol
(LDLC) at T2 ...................................................................................................................... 155
Figure 14. The Net Effect of Experimental Status on Functional Capacity (FC) at T2 ............. 156
Figure 15. The Net Effect of Experimental Status on Poor Perceived Health (PPH) at T2 ....... 157

xi
LIST OF TABLES
Table 1. Description of Constructs and Their Measurement ........................................................ 61
Table 2. Pearson Correlations of Age, Ethnicity, Gender, and Comorbidities with Experimental
Status ..................................................................................................................................... 76
Table 3. Correlation Analysis of Four Outcome Variables: A1C, LDLC, PPH, and FC ............. 77
Table 4. Experimental Effect on Knowledge Scores at T2 and Differences between T1 and T2 79
Table 5. Experimental Effect on the Scores for Attitude toward Diabetes at T2 and Differences
between T1 and T2................................................................................................................ 79
Table 6. Experimental Effect on the Scores for Preventive Practice at T2 and the Differences
between T1 and T2................................................................................................................ 80
Table 7. Experimental Effect on the A1C Measures at T2 and Differences between T1 and T2 . 81
Table 8. Experimental Effect on the Measures of Low- Density Lipoprotein Cholesterol (LDLC)
at T2 and the Difference between T1 and T2 ....................................................................... 82
Table 9. Experimental Effect on the Scores for Functional Capacity at T2 and the Differences
between T1 and T2................................................................................................................ 82
Table 10. Experimental Effect on the Scores for Poor Perceived Health at T2 and the Differences
between T1 and T2................................................................................................................ 83
Table 11. Experimental Effect on Practice at T2 via Knowledge and Attitude at T2 .................. 86
Table 12. The Net Effect of Experimental Status and Differences in Knowledge, Attitude, and
Practice on Difference in A1C at T2 ..................................................................................... 91
Table 13. The Net Effect of Experimental Status and Differences in Knowledge (DK), Attitude
(DA), and Practice (DP) on Difference in low-density lipoprotein cholesterol (DLDLC) .. 92

xii
Table 14. The Net Effect of Experimental Status and Differences in Knowledge (DK), Attitude
(DA), and Practice (DP) on Difference in Poor Perceived Health (DPPH) .......................... 93
Table 15. The Net Effect of Experimental Status and Differences in Knowledge (DK), Attitude
(DA), and Practice (DP) on Difference in Functional Capacity (DFC) ................................ 94

xiii
LIST OF ABBREVIATIONS
ADA American Diabetes Association
AMOS Analysis of Moment Structures
BSE Breast Self-Exam
CAD Coronary Artery Disease
CFI Comparative Fit Index
CHF Congenital Heart Failure
CITI Collaborative Institutional Training Initiative
CKD Chronic Kidney Disease
DAS Diabetes Attitude Scale
DKT Diabetes Knowledge Test
DMPA Diabetes Mellitus Patient Attitude Test
EQ-5D European Quality, Five Dimensions
EQ VAS European Quality, Visual Analogue Scale
EuroQol European Quality of Life
GOF Goodness-of-fit
HBM Health Belief Model
IRB Institutional Review Board
ICD9 International Classification of Diseases Ninth
Revision
KAP Knowledge, Attitude, Practice
KAP-O Knowledge, Attitude, Practice, Outcome
LDLC Low Density Lipoprotein Cholesterol

xiv
PAID Problem Areas in Diabetes
PPBG Postprandial Blood Glucose
RMSEA Root Mean Square Error Approximate
RCT Randomized Control Trial
SDSCA Summary of Diabetes Self-Care Activities
SPSS Statistical Package for the Social Sciences
SEM Structural Equation Modeling
UKPDS United Kingdom Prospective Diabetes Study
UCF University of Central Florida
1
CHAPTER ONE: INTRODUCTION
Diabetes is a chronic metabolic disease with no cure (Fradkin, 2012). Although health
education is an essential component of chronic disease management (Horn, 1997), educational
interventions to improve the self-care by diabetes patients have had mixed results. Studies have
shown improvements in some health care outcomes (Adepu, Rasheed, & Nagavi, 2007; Cranor,
Bunting, & Christensen, 2003; Hogue, Babamoto, Jackson, Cohen, & Laitinen, 2003; Korhonen
et al., 1983; Malathy, Narmadha, Ramesh, Alvin, & Dinesh, 2011; Tilly, Belton, & McLachlan,
1995), but for other outcomes no improvement has been shown (Bloomgarden et al., 1987;
Ozmen & Boyvada, 2002).
The Study Purpose
This research studies the causal mechanisms leading to better adherence by diabetes
patients to management of their disease and to better health care outcomes for them, as well as
how to improve the success of educational interventions for such patients.
Background on Diabetes
Diabetes causes a disruption of the body’s metabolism of sugar. All cells of the body
need sugar to function; it is insulin that makes sugar available to muscle and fat cells. The two
major types of diabetes are Type I, when the insulin production is deficient, and Type 2, when
insulin action meets with resistance (Fradkin, 2012). Since 90-95% of all the United States
diabetes patients have Type 2 diabetes (Fradkin, 2012), this research examines the management
of Type 2 diabetes. In Type 2 diabetes, the body cells fail to respond to the normal action of
insulin, so sugar is not taken up and remains in the blood. High sugar levels in the blood damage

2
small and large blood vessels, nerves, and organs and eventually can cause blindness, kidney
diseases, strokes and heart attacks, as shown by the United Kingdom Prospective Diabetes Study
(UKPDS).
Type 2 diabetes and its complications are a huge economic burden. However, the disease
can be controlled with medication to lower blood sugar and blood pressure, as demonstrated in
the UKPDS trial (Leslie, 1999). Moreover, the threat of diabetes has been shown to be
forestalled by a 7% weight loss and 150 minutes of weekly exercise, in the Diabetes Prevention
trial (Knowler et al., 2002). Other trials with pre-diabetics in Sweden, China and Finland also
have reported that lifestyle changes reduced the incidence of Type 2 diabetes by 31% to 63%
(Delahanty &Wylie-Rosette, 2006). Thus studies have shown that Type 2 diabetes is
preventable. Such complications of diabetes as kidney failure, heart attack, and stroke can be
avoided or treated (Fradkin, 2012).
Prevalence, Risk Factors and Costs
According to the Centers for Disease Control and Prevention (2011), Type 2 is a chronic
condition that affects 8.3% of the US population and 26.7% of those aged sixty-five or older
(www.cdc.gov/nchs). This high prevalence of Type 2 makes diabetes a national threat; patients
die prematurely from the resulting complications (Fradkin, 2012). The prevalence of diabetes
Type 2 has been increasing steadily, particularly in younger age groups (Fradkin, 2012).
Risk factors for developing Type 2 diabetes are: genetics, first-degree relatives with
diabetes, obesity, sedentary lifestyle, high-carbohydrate diet, low socioeconomic status, and lack
of access to primary care and to nutritious food, ethnicity, and history of gestational diabetes or
delivery of a baby heavier than 9 lbs., and polycystic ovary syndrome (www.cdc.gov/nchs).
3
Direct health care costs for diagnosed diabetes and lost productivity in 2012 totaled 245
billion dollars. The costs would be higher if indirect costs were included, according to a report
by Yang et al. (2013) for the American Diabetes Association.
Diabetes is asymptomatic in its early stages, but screening for elevated blood sugar
and/or glycated hemoglobin (A1C) in the fasting state can diagnose both pre-diabetes and
diabetes. A better outlook for diabetes patients has been achieved by research that has improved
clinical outcomes and patients’ quality of life. Patients’ economic burden can be reduced if they
control their diabetes, by complying with a medication regimen, self-monitoring blood sugar and
meeting appointments for screening and laboratory tests.
To delay the complications from diabetes also requires controlling blood sugar, blood
pressure, and cholesterol through medications (Fradkin, 2012). The American Diabetes
Association (ADA), in the Executive Summary: Standards of Medical Care in Diabetes (2011),
recommends screening for blood sugar with the glycated hemoglobin (A1C) test, screening
cholesterol, and laboratory tests for kidney disease as well as measurement of blood pressure at
clinic visits. The results of laboratory tests guide the provider in deciding about drug therapy.
Diabetic patients also should be monitored by other medical specialists to avoid and treat
complications.
Physicians follow professional guidelines for the best therapy and also counsel patients
on incorporating regular exercise and healthy diet. However, a physician’s plan will not be
effective unless the patient makes regular office visits and keeps appointments for tests and
screening.
Because Type 2 diabetics have reduced response to insulin, they need to self-monitor
blood glucose to assess the effects of different types and quantities of foods in raising blood

4
sugar, and then must adjust food intake to avoid both high and low blood sugar. Self-monitoring
their blood glucose empowers patients to assess how it is affected by their food intake, physical
activity and medication (Austin, 2005).
A randomized control trial with more than 5,000 Type 2 diabetics conducted by Pi
Sunyer et al. (2007) showed that weight loss through reduced food intake and increased physical
activity complemented a medication regimen so that patients had better clinical outcomes and
needed less medication to control their blood sugar, blood pressure and cholesterol. Since much
of such management depends on the patients, it is important to educate patients. The ADA
(2012) drew on clinical evidence to recommend empowering diabetics with the knowledge and
ability needed for self-care, through self-management education. The curriculum for diabetes
self-management educates patients about the disease process, healthy eating, physical activity,
medication adherence, self-monitoring of blood sugar, self-monitoring of food and activity, goal
setting, problem solving, healthy coping, adherence to medications and having follow-up visits
to reassess health outcomes.
Health education available from popular periodicals or internet search engines may not be
evidence-based. Health educational interventions should be theoretically grounded and
empirically validated in order to incorporate causal mechanisms that lead to effective adherence
to a regimen and so to better health care outcomes.
Randomized control trials of self-management education have focused mostly on
measuring specific clinical and other health care outcomes and noting those that health education
may improve. However, such studies fail to demonstrate any dose-response relationship between
the amount of health education and the degree of outcome improvement with the exception of
glycated hemoglobin (A1C) as described by Norris, Lau, Smith, Schmid and Engelgau (2002).

5
Furthermore, the shortcomings of research on controlling diabetes through health education are
compounded by the failure to consider variation in their study design (Norris, Engelgau, &
Narayan, 2001).
The purpose of the present study is to identify the causal mechanisms responsible for
improved knowledge, attitude, practice and outcomes, so that, educational interventions can be
tailored efficiently and effectively to the groups of patients who are most likely to benefit from
self-care management.
Significance of the Study
The knowledge-attitude-practice-outcome (KAP-O) framework as proposed by Wan
(2014) is used to understand the causal path of educational interventions and changing health
care outcomes through the mediation by the variables of knowledge, attitude, and practice. The
study aims to evaluate whether educational interventions affect outcomes directly or have
indirect effects on outcomes through knowledge, attitude and practice since prior research has
not examined the causal relationships among KAP-O components.
Conceptual or Theoretical Import
The behavioral sciences literature suggests that attitudinal and behavioral changes can be
explained by health beliefs (Rosenstock, 1960 as cited in Glanz et al., 2002, p. 47), cognitive
learning (Malathy et al., 2011), motivational therapy (Williams, Freedman, & Deci, 1998),
behavioral economics (Farina, 2013), and cultural sensitivity (Baradaran, Knill-Jones, Wallia, &
Rodgers, 2006). However, these studies fail to demonstrate how health education works. This
study addresses this deficiency by using a framework composed of knowledge, attitude, practice
and outcomes (KAP-O) proposed by Wan (2014) in the International Journal of Public Policy.
6
This study measures the structural or causal relationships among the components of the KAP–O
framework in a health behavioral system model.
Methodological Rigor
This study delineates the possible causal paths of educational intervention (an exogenous,
or independent, variable) in producing the intervention’s direct influence as well as its presumed
indirect influence on a series of self-reported and clinical outcomes, variables dependent on
changes in patients’ knowledge, attitude, and behavior. Outcomes can be either subjective (i.e.
self-reported perceptions of poor health and functional capacity as measured by reliable,
validated survey instruments) or objective such as glycated hemoglobin (A1C) (UKPDS Trial,
2002) and low- density lipoprotein cholesterol (Zyskind, Jones, Pomerantz, & Barker, 2009).
Because medical practices’ approaches to diabetes control vary, this study aims to
eliminate that confounding factor by examining the practice of a single medical group with a
single provider. Socioeconomic factors may contribute to the variation in health care outcomes
(Manabe et al., 2011; Morales, Lara, Kington, Valdez, & Escarce, 2002). This study examines a
relatively homogeneous patient population served by a single medical practice with a single
provider in St. Augustine and Palm Coast, Florida. A randomized trial for the evaluation of a
health educational intervention has been conducted.
Practical Application
It is very expensive to impart diabetes education in a study of diabetes control. The
continued monitoring and observation of patients’ clinical outcomes is complicated because it
requires the support of clinical and other staff in a medical practice. Fortunately, full cooperation
from the St. Augustine and Palm Coast practices’ physician and staff enabled this randomized

7
trial. A set of assessment instruments was well identified and evaluated for the implementation
of this empirical study.
Policy Relevance
Diabetes is not only a major clinical problem, but a serious public health issue as well.
Type 2 diabetes is increasingly prevalent in younger age groups (www.cdc.gov/nchs), and is
associated with the rising rates of obesity and physical inactivity (King, Aubert, & Herman,
1998). It is important to promote changes toward a healthy lifestyle and greater physical activity
if we are to combat this serious public health problem. In addition, public health officials could
promote healthy outcomes using cost-effective strategies such as health education.
Research Questions
This research studies the causal mechanisms leading to better adherence by diabetes
patients to management of their disease and to better health care outcomes for them, as well as
how to improve the success of educational interventions with such patients. Research questions
pertaining to the KAP-O model were formulated.
Although the reviewed literature assumes that the outcome indicators used here are
related, empirical evidence is lacking to show that these outcome indicators constitute a single
dimension of a theoretical construct: health care outcomes.
Evidence demonstrating the causal mechanisms for improving diabetes patients’
knowledge, attitude, and practice, and, hence the outcome of diabetes care is also needed. Health
education may directly affect knowledge, attitude, practice, and subjective and objective
outcomes. Health educational interventions also may exert indirect effects on practice through
changes in knowledge and attitude. Thus an empirical investigation of health education’s effects

8
could be conducted to answer the first research question: Does health education directly affect
knowledge, attitude, practice of self-care, and health care outcomes? The second research
question: Based on the KAP model, what is the effect of health education on knowledge, attitude,
and practice? Based on the theoretical specification of KAP-O model, it is expected that health
educational intervention may indirectly influence outcome variables via improved knowledge,
attitude, and practice. Thus the third research question: Does health education affect health care
outcomes indirectly through improved changes in knowledge, attitude and self-care practice?
Study Design
The study’s classic experimental design used pre- and post- tests of the KAP-O
components for a randomly selected patient population from a single medical practice with a
single provider. The pre- and post- test study used randomization in which the researcher was an
active agent, and not a passive observer. A thorough literature review revealed a gap in the
potential causal mechanism of the effects of educational intervention on preventive practice and
outcomes. This study attempts to fill the research gap.
The study design was experimental pre-post, with patients randomized to test and control
groups, which is the most powerful method for testing any hypothesis relating to cause and effect
relationships between variables. The experimental group was given access to interactive self-
paced web-based tutorials supplemented with a printout, using the Healthy Tutor (Dickeson &
Scheel, 2014). The control and experimental groups both received usual customary care. The
experiment attempted to delineate whether it was the experimental intervention that caused KAP-
O changes in the experimental group.

9
The study employed a pre- and post- test design. Knowledge, attitude, practice, functional
capacity and poor perceived health were measured at two time points before and after
intervention, using reliable, validated instruments. Baseline and post-intervention glycated
hemoglobin (A1C) and low-density lipoprotein cholesterol (LDLC) were the objective outcomes.
The researcher had no control over the follow-up appointments of patients therefore the two time
points before and after intervention varied for each patient.
Consideration of the Framework for the Study
In this study the diabetic patient is the unit of analysis, and variation in self-care or
preventive practice is the focus. Hence theories of human health behavior were reviewed. The
five theories considered were the health belief model, the theory of planned behavior, the social
cognitive theory, the trans-theoretical model, and the patient empowerment model. None of those
five theories were applicable, for the following reasons: The health belief model concerns with
such determinants of health behavior as perceived costs and perceived benefits, but not the
measurement of behavior. The theory of planned behavior assumes that behavioral intention is
the only prerequisite for actual behavior; however, intention does not always result in behavioral
change. Social cognitive theory regards self-efficacy or the ability to enact behavior as the most
important determinant of behavior, but does not focus on the actual behavior. The trans-
theoretical model is a therapeutic model applicable to intentional behavioral changes, whereas
this study measures both intentional and non-intentional behaviors. Finally, the patient
empowerment model’s emphasis on goal setting and the plan of actions to achieve a goal is not
applicable to this study.

10
The study framework is based on behavioral science, in particular on social psychological
theory of cognition, attitude, behavior, and outcomes. Cognition and attitude are interrelated
constructs. The study focuses on actual practice, not behavioral intention that may or may not
result in healthy behavior.
Health Educational Intervention
According to Simmonds (1976), health education aims at inducing individuals, groups or
large populations to adopt healthy behavior that will promote present and future health and, to
eliminate behaviors that have adverse effects on health (as cited in Glanz et al., 2002, p.8). A
variety of educational products could be used to design an intervention for diabetes patients, for
example, diabetes conversation map created for Merck & Co., Inc., a learning map module called
Managing Your Journey (Garrett et al., 2005).
Knowledge, Attitude, Preventive Practice, and Outcomes (KAP-O) Framework
The literature review suggested that educational interventions improve knowledge and
attitude, and that improved knowledge enhances self-care practice. Improved attitude improves
practice, and improved practice leads to improved outcomes. Therefore the knowledge-attitude-
practice -outcome framework (KAP-O model of behavioral change) as proposed by Wan (2014)
forms the ideal theoretical basis for the study’s examination of the underlying mechanism by
which educational intervention may improve health care outcomes. Application of KAP-O in a
pre- and post- test study may reveal the relative importance of predictors for the variation in
diabetes outcomes.

11
Measurement of Knowledge, Attitude, Practice, and Subjective and Objective Outcomes
Following is a list of instruments used in this study. The Diabetes Knowledge Test
(DKT) instrument was formulated by the researcher to measure knowledge of causes of diabetes,
signs of disease, complications of diabetes, and preventive behaviors for diet, exercise, foot care,
high blood pressure, cholesterol, and meal planning. Thirty-eight questions from a pool of
questions embedded in the seven core tutorials of Healthy Tutor 2010 (Dickeson & Scheel,
2014) formed the DKT instrument used to measure knowledge.
Diabetes Attitude: The researcher also formulated a scale for Diabetes Type 2 Patient
Attitude (DMPA) to measure gradational levels of attitude ranging from like (favor) to dislike
(disfavor). Thirty questions were developed to cover the three domains of attitude: cognitive,
affective and behavioral.
Preventive Practice: Summary of Diabetes Self-Care Activities (SDSCA) is a known
available instrument that measures the practices of following a healthy diet, exercising, testing
blood sugar, checking blood pressure, taking care of feet and avoiding smoking.
Instruments to Measure Subjective Outcomes
Two subjective outcomes are: 1) Functional Capacity, the degree of ability for mobility, self-
care, usual activities, pain/discomfort, anxiety/depression, (EuroQol, 2009) as well as the
dimensions for sleep, memory/concentration, energy, seeing and hearing, and contact with others
(Perneger & Courvoisier, 2011) was measured by a composite instrument of EQ-5D-5L with
five additional dimensions as proposed by Perneger and Courvoisier in 2011; and 2) Poor
Perceived Health: a single index value for health status, which is self-reported with the EQ VAS
analog scale.

12
Measurement of Objective Outcomes
Two clinically assessed outcomes are: 1) Glycated Hemoglobin (A1C), a lab test that
shows the average level of blood glucose over the previous 3 months, indicating the extent of
control of diabetes over a period of time (ADA, 2012). Glycated Hemoglobin (A1C) is tested by
a sample of blood from a vein. 2) Low Density Lipoprotein Cholesterol (LDLC): low density
lipoprotein, which transports cholesterol within the blood, can deposit inside blood vessels and
thus obstruct them. Low Density Lipoprotein Cholesterol (LDLC) is tested in a sample of blood
from a vein.
Sampling
The Type 2 diabetic patients in a single multi-site medical practice located in St. Johns
County and Flagler County, Florida, comprised the sampling frame, since the focus of the study
is not provider performance, but the variation in self-care management by Type 2 diabetic
patients. Patients were randomized into the experimental and the control groups to avoid
systematic bias in the groups.
Analysis Plan
A Pearson correlation was used to detect whether the groups were comparable in terms of
personal characteristics that could, simultaneously with intervention, influence knowledge,
attitude, and practice (proximal outcomes), and outcome measures (distal outcomes). A
correlation analysis of the outcome variables was needed so that the formation of a single latent
endogenous variable (i.e. the diabetes care outcome) could be determined by confirmatory factor
analysis.

13
Multiple independent samples t-tests were needed to detect the differences in baseline
and values at T2 of the endogenous variables, in terms of knowledge, attitude, practice, and
outcome measures. The key outcome variables for detecting whether group differences existed
at T1 and T2 were: glycated hemoglobin (A1C), low density lipoprotein cholesterol (LDLC),
functional capacity (FC), and poor perceived health (PPH).
A causal model was posited with explanatory linkages assumed among health educational
intervention, knowledge, attitude, practice and outcomes in a panel design, as shown in figure 1
below.
Figure 1. Relationships of KAP-O Components in the Experiment
This model was tested to discover whether the hypothesized pathways (direct and indirect
causal paths) specified by the causal model were consistent with the data. Structural equation

14
modeling (SEM) with path analysis tested the causal hypotheses concerning direct and indirect
causal effects of health educational intervention on proximal knowledge, attitude, practice and
distal outcomes of diabetes control. Those techniques enable the researcher to remove the
potential confounding effects of variables other than the intervention variable. Analysis of
Moment Structures (AMOS) 21 was used to run the models at a statistical significance level of
0.05.
Challenges of the Study
Conducting random trials is costly and challenging. The key challenges of a randomized
control trial are related to obtaining adequate sample size, duration of the study (if the study
period is too short, the researchers are not able to elicit changes in outcomes. If the study lasts
too long, the sample dropout rate is high). In longitudinal studies the number of study
participants dwindles over time due to their mobility, the difficulty in locating the participants,
and death or disability in a high-risk population (Polit & Hungler, 1995). Additional difficulties
in the conduct of the experiment were as follows:
1. Recruiting of study participants face-to-face was a challenge; many diabetic patients
declined to participate. (Monetary incentives, which have been shown to increase
participation, were not possible, since there was no financial backing).
2. Conducting the study was tedious and laborious due to the lack of manpower. One
researcher did all the tasks: recruiting patients, which involved time-consuming
conversations to convince them to participate by explaining the benefits of the
research; qualifying patients’ eligibility; showing patients in the intervention group
how to access the online web tutorials; providing lab orders for tests; sending

15
reminders to patients about complying with tests and completing tutorials; locating
hard-to-reach patients, entering clinical data into the computer from electronic charts;
and contacting labs for test results.
3. Some study participants of low socioeconomic status declined to participate, saying
that they did not have access to computers or were not computer literate.
4. The selection of educational material involved choosing an appropriate number of
modules, selecting modules that were relevant to self-care and choosing questions
specific to the knowledge provided by the educational modules. The existing
instruments to measure knowledge, attitude and preventive practice are not very
standardized. Researchers use a variety of different instruments.
5. A suitable instrument was lacking to test the three components of attitude: cognition,
affect and behavioral tendency. Construction of an attitude instrument to test these
three domains of attitude became necessary.
6. Appropriate instruments to test health literacy, practice of preventive behavior,
functional capacity and poor perceived health had to be identified.
The above challenges of the research were overcome by the following actions:
1. Persistence in recruiting despite some earlier resistance from patients paid off
eventually. Evincing concerns for the patients and attending to their needs with
appropriate help, as well as being a member of a health care team enabled the
researcher to enroll about two hundred participants. Informing participants that the
study was endorsed by the University of Central Florida created trust and assured
patients of confidentiality.

16
2. Persistence in accomplishing all relevant tasks enabled data collection. All data
entries for the survey instruments were checked thoroughly.
3. Participation was made convenient for all participants by providing computer access
on large screen monitors and providing private rooms or a conference room where
survey questionnaires could be completed. The researcher sat down with willing
participants and showed them how to access the tutorials. Every possible patient was
approached to participate unless he/she met exclusion criteria or failed the literacy
assessment test. Because the explanations to diabetes patients were very time-
consuming, however, some patients left the clinic before they could be approached.
4. Selection of educational material that would provide information clearly to patients
and empower them to control their disease was essential. A curriculum of ten
modules was reduced to seven core tutorials accessible to patients with varying
educational levels. Thirty-eight questions specific to the content of the modules were
chosen from a pool of more than one hundred questions.
5. Since no existing instruments measure all three of the components of attitude:
cognition, affect, and behavioral tendency, the researcher drew on the literature
review, and consultation with professionals who treat diabetes patients in order to
pinpoint areas of concern for diabetics and create a useful instrument to measure
attitude.
6. The researcher consulted with experts in the field to select appropriate instruments;
their guidance was invaluable.

17
Overview of the Chapters
The dissertation has five chapters. The literature review and theoretical framework
constitutes Chapter 2. The methodology, comprising the study design, sampling, measurements,
and analytical design, is in Chapter 3. The findings for each research question are presented in
Chapter 4. Finally, Chapter 5 presents the implications of the major findings, conclusions, and
future research directions.
18
CHAPTER TWO: LITERATURE REVIEW AND THEORETICAL
FRAMEWORK
Patients diagnosed with diabetes, a progressive chronic condition, need to be engaged in
behavioral change. According to the American Diabetes Association (2011), the goals of
behavioral change as described in standards of medical care in diabetes are: avoid complications,
ensure good control of blood sugar through adherence to medications, self-monitor blood sugar,
develop healthy eating, perform 150 minutes of physical exercise weekly, and follow up with
medical appointments.
This chapter focuses on selected behavioral theories relevant to changing diabetes
patients’ behaviors: the health belief model, the theory of planned behavior, social cognitive
theory, the trans-theoretical model of stages of change, and the patient empowerment model.
These theories seek to identify the determinants of health behavior. This chapter also reviews
studies that measured knowledge, attitude, and practice, and proposes the theoretical framework
and hypotheses.
Review of Conceptual/Theoretical Perspectives
The health belief model (Becker, 1974; Hochbaum, 1958; Janz & Becker, 1984; Kirscht,
1974; Rosenstock, 1960 as cited in Glanz et al., 2002) is one of the oldest theories seeking to
explain human health behavior. An individual will perform a preventive behavior if the
individual believes that he/she is vulnerable to a disease or problem (susceptibility), that the
after-effects of the disease or problem are serious (perceived risk for the severity of illness), that
the prescribed action to deal with the problem is helpful (perceived benefits of action), and that
the action entails more advantages than costs (perceived costs).

19
The health belief model (HBM) has several limitations. One is the fact that habitual
behavior such as smoking tends not to be influenced by active accounting of costs and benefits.
HBM, which attempts to predict human behavior by considering differences in individual beliefs
and attitudes, would predict that Type 2 diabetes patients, to avoid complications of diabetes by
controlling their blood sugar, would be likely to have a healthy diet and exercise regularly. The
HBM model thus identifies as an initial predisposing factor the desire to avoid complications of
diabetes; but the model does not consider factors responsible for enabling and maintaining
preventive behavior over time (Janz, Champion, & Strecher, 2002). Moreover, the Health Belief
Model deals only with personal perceptions such as perceived risk and perceived cost and thus is
too subjective for application in this study. This model does not consider the interaction effects
of a complex set of behavioral determinants. Although HBM identifies potential predictors of
adherence to medical regimens, its contribution to understanding the causal mechanisms of
adherence is limited.
The theory of planned behavior (Ajzen, 1991; Ajzen & Driver, 1991; Azjen & Madden,
1986 as cited in Glanz et al., 2002) states that a person’s behavior is determined by his/her
intention to perform that behavior. The intention is formed by his/her attitudes toward that
behavior, his/her beliefs about what others think he/she should do, his/her motivation to comply
with the wishes of others and perceived behavioral control. If the individual evaluates the
behavior as beneficial, and significant others approve of the behavior, then the individual has
more intention to carry out the behavior and is more likely to do so (Montano & Kasprzyk,
2002). Nevertheless, behavioral intention does not always lead to actual behavior, because
environmental and contextual constraints come into play. The theory of planned behavior does
not consider such interaction effects. The theory of planned behavior traces logical sequence, but

20
human behavior is not always logical. In any case, the current study measures self-care behaviors
as actual actions reported by patients, not just their intentions to act.
Social cognitive theory (SCT) (Bandura 1986, 1997, 2001 as cited in Glanz at el., 2002,
p. 165-184) offers a complex global theory of behavioral change. Determinants of health
behavior are described by the key elements of reciprocal determination, observational learning,
outcome expectancy, and self-efficacy (Baranowski, Perry, & Parcel, 2002). However, SCT
lacks a causal framework linking those components of the theory.
Reciprocal determination denotes that behavior and environment interact and influence
one another. The theory postulates that change results from the interactions between individuals
and their environments as a reciprocal process (Baranowski et al., 2002). Observational learning
is the capacity to learn from observing the behavior of others (Baranowski et al., 2002). Outcome
expectancy refers to a person’s assessment that a given behavior will result in certain beneficial
outcomes (Baranowski et al., 2002). Self-efficacy is the degree of assurance in one’s own ability
to make a change or perform a behavior (Baranowski et al., 2002).
Social cognitive theory recognizes that environmental influence, social norms, cues, and
self–efficacy influence health behavior (Baranowski et al., 2002). The theory implies that health
can be promoted by modifying the social environment and fostering skills that empower
individuals to make healthy behavioral changes (Baranowski et al., 2002). However, this theory
lacks a framework linking the causal components of behavioral change, and it is also resource
intensive. For those reasons it was not used in this study.
The trans-theoretical model (Prochaska & DiClemente, 1983) explains behavioral change
as a cyclical process involving five stages of change. Individuals have varying degrees of
readiness to change and may vacillate between the stages of pre-contemplation, contemplation,

21
preparation, action and maintenance (Prochaska, Redding, & Evers, 2002). Therefore the
implementation of that research framework entails providing individual psychotherapy. As a
model that would require monitoring a large number of study participants as well as the
assistance of licensed therapists, therefore, the trans-theoretical model was not a feasible choice
for this study.
Patient empowerment theory (Funnell, Anderson, & Arnold 1991; Funnell & Anderson
2003 as cited in Mensing, 2006, p.46) postulates that decisions about lifestyle changes cannot be
dictated to patients. Patients should be in charge of their self-care. The theory reasons that since
self-care first of all benefits patients themselves, they should be the primary decision makers
about it (Funnell, Anderson, & Tang, 2006). The patient empowerment model guides educators
and health professionals in recognizing a patient’s wishes to manage and then tailoring a patient-
directed plan for behavioral change (Funnell et al., 2006). This labor-intensive and time-
consuming approach was not feasible for a single researcher.
In summary, the likely human health behavioral theories or models either do not measure
actual health behavior or are very labor- and resource-intensive and time-consuming. Therefore
the Knowledge-Attitude-Practice (KAP) framework was used.
The Knowledge, Attitude, Practice Framework
The KAP behavioral system framework captures both the predisposing factors of
attitudes and knowledge about diabetes control, and actual behavior. It is more complete in its
causal specifications of determinants of preventive practice and outcomes. Knowledge about and
attitudes towards a health disorder are important predictors of adherence to a prescribed regimen.
Although the KAP framework cannot address provider behavior, it is still advantageous when

22
compared to other models in its logical formulation for causal sequences among the determinants
of health behavior and outcomes. The following section briefly reviews the use of the KAP
model in research.
History of KAP Surveys
KAP surveys were first developed in the 1950s. After 1960 KAP surveys were
extensively used in many countries to research family planning practice. The KAP studies are
more cost-effective and conserve resources more than other social research methods, because
they are tightly focused and limited in scope (Eckman & Walker, 2008). This theoretical
framework has been widely used in the health education field and in the developing world for
family planning, and as a guide to understanding the mechanisms of health education for patient
behavioral changes and patient health outcomes (Jaccard, Dittus, & Gordon, 1996). KAP surveys
are now a widely used methodology for studying human behavior when affected by a problem or
disease.
KAP Survey Methodology
“K” stands for knowledge of the problem or disease, “A” for attitude towards the
problem or disease, and “P” for practice or preventive behavior to protect against the problem or
disease. Researchers assume that knowledge, attitude, and practice are related, and that
knowledge and attitude directly influence preventive practice. Surveys are used to measure what
individuals know about the disease or health problem. Attitude instruments measure the feelings
and beliefs of survey participants about the disease or problem, and information on practice
measures the preventive behaviors that individuals follow to avoid a problem or disease.

23
Researchers choose a sample of participants that is representative of the population. The
constructs of knowledge, attitude and practice are further defined below.
Definitions of Constructs
Knowledge: Knowledge is the acquisition, retention, and use of information or skills
(Badran, 1995). Cognition through which knowledge is acquired is a process of understanding
and is distinguished from the experience of feeling. Knowledge accrues from both education and
experience. Knowledge possessed by diabetics refers to their comprehension of the disease, its
progression, and self-care practice necessary for keeping diabetes under control.
Attitude: Eagly and Chaiken (1993) in “The Psychology of Attitude” define attitude as
“a psychological tendency that is expressed by evaluating a particular entity with some degree of
favor or disfavor”. Attitude has three components: cognition, affect, and behavior, as discussed
by Katz & Stotland, 1959; Krech & Crutchfield, 1948; and Rosenberg & Hovland, 1960 as cited
in Eagly & Chaiken, 2007. Cognition comprises true and false beliefs about the attitude object;
health education may change such beliefs. Thus there may be overlap between knowledge and
attitude. For example, some diabetic patients may have beliefs that they may not live healthy,
long lives, because of having heard about older relatives dying at an early age from such
complications of diabetes as heart attack, stroke, or kidney failure; they assume that the same
fate may befall them. The affective component of attitude is the whole gamut of emotions toward
every aspect of the attitude object. Some diabetic patients may have a set of varying attitudes
towards self-care management of diabetes. They may love to exercise, as it makes them feel
good, but hate self-monitoring their blood sugar because they are averse to pricking their skin.
The behavioral components of attitude are the proneness to act in particular ways with reference

24
to the attitude object. Thus some diabetes patients may follow through all recommendations by
physicians, while other patients may not. In summary, attitude toward diabetes refers to any
preconceived ideas about diabetes and its management, patients’ feelings/emotions towards
aspects of diabetes and diabetes care, and the aptness to behave in particular ways about diabetes
and its management.
Practice: Practice demonstrates the acquisition of knowledge (increased understanding of
a problem/disease) and any change in attitude caused by the removal of misconceptions about
problems or disease that translates into preventive behaviors. Thus that demonstration may
reflect a reciprocal relationship between knowledge and attitude. Practice is behaviors or actions
that can avert a disease or delay its progression. In diabetes, practice would involve healthy
eating, increased physical activity, adherence to medications, overcoming the barriers to weight
loss and sedentary lifestyle, avoidance of overeating or inactivity as responses to stress, follow-
up with physicians, and participation in tests to reassess health outcomes. Those practices are the
seven self-care behaviors strongly advocated by the American Association of Diabetes Educators
and the American Diabetes Association.
Objectives of KAP Surveys
KAP surveys have three objectives. The first objective of KAP surveys is to assess in
samples of a population the knowledge, attitudes and practices about an epidemic problem. The
knowledge comprises what members of the sample know about symptoms, transmission and
treatment of the disease. Attitudes towards the disease include sample members’ awareness of
the seriousness of the disease, fear of being infected, and willingness to protect them from the
disease. Practice refers to preventive behavior to avoid harm. The KAP survey can guide the

25
prioritization of resources to populations with very poor KAP scores. Several of the studies
reviewed in the literature assess KAP in either a randomly selected or a convenience sample of a
population with regard to a health problem or a disease. Such assessments are usually cross-
sectional, since those are cheaper to conduct and less time-consuming.
A second objective of KAP study is to enable researchers to identify gaps in knowledge,
attitude and practice and to design an intervention to close those gaps. A third objective of KAP
surveys is to evaluate interventions or programs, noting the differences in knowledge, attitude
and practice scores after an intervention by using the same group in a pre- and post-design.
Some KAP studies explore the relationships of socio-demographic variables to the
variables of knowledge, attitude, and preventive behavior. A number of researchers have
evaluated diabetes programs using the KAP approach. The findings of KAP studies both on
diseases other than diabetes and on diabetes are described.
Non-Diabetes Studies Using KAP Survey Methodology
General studies using KAP survey methodology that assume that knowledge and attitude
are related and that knowledge and attitude affect preventive practice, are cross-sectional and
descriptive; hence they do not enable researchers to generate causal inferences. These studies
lack a strong theoretical framework. Many studies use convenience samples. Most of the studies
lack control or comparison groups. Findings for these studies are discussed below.
A community-based descriptive KAP study in 2012 of a convenience sample of 600
women in Iran (Nafissi, Saghafinia, Motamedi, & Akbari, 2012) that examined knowledge of,
attitude toward, and practice of breast self-examination showed that 30.8 % knew the necessity
of breast self-examination and about 60 % knew how to do breast self-examination, but only

26
12.9 % carried out the preventive practice of breast self-examination regularly. It was assumed
that poor attitude was responsible for the low use of preventive practice.
In 2012, a KAP survey assessed the reporting of adverse effects of drugs to government
agencies by Indian physicians (Kharkar & Bowalekar, 2012). Knowledge about and a positive
attitude toward reporting adverse effects were found in about 55 % of the group. However, only
18.5 % of the physicians reported adverse drug effects. Reasons for that low rate of reporting
were that physicians were wary of government agencies, needed a simple reporting procedure,
had no toll-free number available for reporting and disliked or lacked access to electronic
submission for reporting.
A KAP comparison study of two environmentally different Vietnam communities: an
urban community unaffected by the H5N1 flu virus in 2012 and a rural group affected by H5N1
during that outbreak, was conducted in 2012 (Manabe et al., 2012). The study demonstrated that
the highly educated, affluent urban group exposed to media had more knowledge and a better
attitude, and obtained health care if they had flu symptoms. The rural group affected by the 2010
H5N1 outbreak did not know about or practice precautions in handling sick poultry, as a
consequence of their poverty and illiteracy.
In 2005, pregnant women in Rwanda from areas with prevalent malaria both knew about
the adverse consequences of malaria for pregnancy and had good attitudes yet only 8.3 % used
an insecticide-treated bed net. The unaffordability of the bed nets made the preventive practice
impossible for most of the women (Van Geertruyden et al., 2005).
A 2006 cross-sectional study of randomly selected tuberculosis patients discharged from
a hospital in Romania investigated their limited adherence to medication regimens. Eighty-one
percent of the patients knew that medications had to be continued despite the absence of

27
tuberculosis symptoms and had a good attitude toward doing so, but still some of the patients
failed to continue taking their medications because they could not afford them (Berger & Bratu,
2006).
A convenience sample of women from a clinic in Brazil (Vasconcelos, Pinheiro, Casteol,
Costa, & Oliveira, 2011) was assessed with KAP for use of the pap test. The preventive practice
of pap testing was undertaken by 67 %, even though only 40.4 % of the women had adequate
knowledge scores and only 28 % had good attitude scores. The preventive practice was
nevertheless frequent because the clinic was accessible to patients and many lived with a partner.
Failure to have pap tests for the rest of the women was due to their negative attitudes toward
cervical examination.
A pre- and post- KAP comparison study of the test and control groups in two rural
Vietnam communities that had experienced an H5N1 flu outbreak was conducted in 2011 to
assess the impact of educational intervention. The difference in the groups’ knowledge, attitude,
and practice scores between the pre- and post-tests was not significant. The authors acknowledge
the difficulty of changing the unhealthy behaviors and customs of people in a poor rural area
regarding poultry. Study participants reported touching and eating dead or sick poultry at both
KAP_Time 1 and KAP_Time 2. The questionnaires comprised mostly of closed-ended or
multiple choice questions (Manabe et al., 2011).
In 2013, Wahed et al. did a cross-sectional KAP assessment of urban slum dwellers of
Bangladesh regarding cholera prevention. The sample of 2,830 families was randomized to three
arms: one-third of the families were allocated as control, a third received only vaccine, and the
remaining families received vaccine as well as intervention messages about hygiene and
behavior change. In the majority of the participants, KAP scores for knowledge about cholera

28
were poor and attitude scores were high. Preventive practices were few, however, due to
environmental and economic difficulties. Participants with good knowledge of preventive
measures against cholera could not practice preventive behavior adequately because of the
scarcity of water, gas supply, sanitation and a proper drainage system.
A cross-sectional, telephone KAP survey study conducted in China in 2011 about the
knowledge, attitudes and practices relating to the H1N1 pandemic has limitations. The rate of
immunization against H1N1 was 10.8 % among the respondents, although 69.9 % believed that
vaccine had few adverse effects and the vaccine was available free from state agencies (Lin et
al., 2011).
In summary, the general KAP surveys widely used in non-experimental social research
are correlational (ex post facto) and descriptive. They verify correlations, i.e. whether a tendency
for a variation in one variable is related to the variation in another variable. The studies attempt
to understand the relationships among knowledge of, attitude toward, and preventive behavior
against a naturally occurring phenomenon (e.g., an influenza epidemic), using a randomly
selected sample and no research intervention. Some researchers studied the association of
sample attributes with KAP scores for knowledge, attitude and preventive practice. Such studies
are limited to correlational rather than causal analysis. A researcher conducting an ex post facto
study lacks any control over the independent variables that have already confounded the
association between the independent variable and the dependent variable. As a result, causal
relationships cannot be ascertained due to the inability to accurately manipulate the independent
variable (s). However, correlations may serve as starting points for generating hypotheses or
developing theories. The stronger the association between two variables, the more likely it is to
eventually find a causal link between them, though not in the associative study.

29
These studies indicate that knowledge and attitude influence preventive practice.
However, several studies have shown that lack of money is a serious barrier to preventive
practice. Preventive behavior is encouraged by personal support and accessibility to medical
care.
Diabetes KAP Studies
A review of KAP studies involving diabetic patients shows that most studies are cross-
sectional, using convenience samples or randomly selected participants. The studies aim to
assess scores for knowledge, attitude, and preventive practice as well as clinical outcomes, or to
determine associations between socio-demographic factors and knowledge, attitude and practice.
A few studies have used single-group convenience samples with a pre- and post- intervention
assessment of changes in knowledge, attitude, and practice scores. Other studies have used
randomly assigned participants to test and control groups with a pre- and post- intervention
assessment of changes in knowledge, attitude, and practice scores.
Cross-Sectional KAP Assessments Using Convenience Samples
Using a convenience sample of 75 patients with Type 2 diabetes at an urban center for
diabetes care in Malaysia, Ng et al. (2012) assessed KAP scores for knowledge, attitude and
practice about diabetes. Although KAP scores were satisfactory, outcomes for glycated
hemoglobin (A1C) and fasting blood sugars were not. Eighty-six percent of the participants had
significantly poor clinical test outcomes in spite of adequate knowledge and positive attitudes
about diabetes. Fewer than 50 % of the participants reported exercising regularly. There was a
strong association between knowledge and attitude, and between knowledge and practice. The
attitude questionnaire did not differentiate the three components of attitude: cognition, affect and

30
behavior. This study has limited generalizability, since it was a cross-sectional study of a small,
urban, convenience sample of 75 patients whose responses were collected on a self-reported
questionnaire.
Raj & Angadi (2010) used KAP to assess preventive practice of diabetes in a
convenience sample of 730 Type 2 diabetic patients treated at a hospital in Karnataka, India.
This was a cross- sectional study. A high number of the respondents had good knowledge and
positive attitudes about diabetes, yet had poor practices; 60 % considered diabetes to be a serious
disease; but only 40 % took precautions while travelling, 51 % did not monitor blood glucose
regularly, and 60 % did not exercise at all. The cross-sectional, hospital-based study used an 8-
item, descriptive KAP instrument that could not examine causality among the KAP components.
A convenience sample of 238 Type 2 diabetes patients from 3 hospital clinics in
Saurashtra, Gujrat India were assessed using KAP by Shah V., Kamdar, & Shah N., (2009).
About 46 % of the patients knew about the causes and complications of diabetes. Most patients
in the study had positive attitudes toward self-care. However, they relied more on dietary
modifications than on exercise to manage their diabetes. The study’s findings are limited in
generalizability.
KAP scores and demographic details for 162 newly diagnosed diabetics from an
outpatient clinic in Nepal were assessed by Upadhyay, Mohamed, Alurkar, Mishra, and Palaian
(2012) in a cross-sectional study. Eighty-two percent had no family history of diabetes. Their
knowledge, attitude and practice scores were very low. The attitude instrument consisted of four
questions. The sample population was newly diagnosed and was limited to one hospital from one
region, so generalizability of the findings is very limited.

31
Abubakari et al. (2011) assessed the associations among knowledge, illness perceptions,
self-management and clinical outcomes in a convenience sample of 359 Type 2 diabetic patients
from the London Diabetes Clinics. This study was cross-sectional, using Leventhal’s (1980)
common- sense, self-regulating model and hypothesis. The findings show that perceiving severe
consequences of diabetes was associated with poor self-management in patients of both African
and European origins. Perceptions of personal control were associated with better self-
management in patients of African origin. After controlling for demographic and disease
characteristics, self-management of diabetes did not predict metabolic outcomes in any ethnic
group. The study used psychometric instruments. Since data for this study were collected at one
time point, it was not feasible to determine the direction of the relationships between
determinants and outcomes or to investigate causal relationships. The limitations of the study
were: self-reported data on self-management with concern-for- social-desirability bias, and
memory and recall biases. Face-to-face administration of the questionnaires may have introduced
interviewer bias. Selection bias due to convenience sampling, however, was minimized by the
high participation rate. The authors acknowledged that the sample from the London Diabetes
clinics was not representative, and findings cannot be generalized to other settings.
Venkataraman et al. (2012) studied the relationships among personal, disease and
treatment-related factors, and diabetes control in a convenience sample of 507 hospital patients
diagnosed with Type 2 diabetes in a cross-sectional survey. Self-efficacy positively influenced
mental attitudes. Self-efficacy was the single most important determinant of current diabetes
control. The findings of this study need further validation by a longitudinal study design.
A purposive convenience sample of 100 diabetics among Mexican American and
Mexican-Native volunteers was recruited from a large Catholic church in north central Texas

32
(Melancon, Oomen-Early, & del Rincon, 2009). KAP surveys were conducted to assess diabetes
knowledge, attitudes, disease management, and self-efficacy. Factors promoting or deterring
diabetes prevention and management were identified, using Airihenbuwa’s PEN-3 Model by
Melancon et al. (2009). Eighty- two volunteers completed quantitative surveys and 18
participated in qualitative focus groups. Knowledge and perceived psychosocial impact scores
for the study participants were significantly lower than those from national samples. Since the
sample was not truly representative and data were subject to participants’ recall and feelings at
one point in time, the results from this study cannot be generalized to all Mexican Americans and
Mexican Native adults in the United States with Type 2 diabetes.
Cross-Sectional Studies Using Random or Stratified Samples
A cross-sectional study of 125 randomly selected, low- income- minority patients in
South Carolina with Type 2 diabetes was conducted by Bains and Edgede in 2011, using
psychometrically validated instruments. Health literacy was significantly associated only with
diabetes knowledge. Diabetes knowledge and perceived health status were significantly
associated with glycemic control; health literacy was not associated with glycemic control. Since
this was a cross-sectional study, it was not possible to infer any causality. Furthermore, as this
study was conducted at a single academic center, the findings were not generalizable. The study
did not include either the duration of diabetes or comorbidities as confounding factors. No
theoretical framework guided the analysis.
Another cross-sectional study, by Walker et al. (2012), of 378 consecutively scheduled
primary care patients with Type 2 diabetes in southeastern US examined the impact of diabetes
fatalism on self-care behaviors and medication adherence. Fatalism was defined as a belief that

33
“all events are predetermined and therefore inevitable” and as a psychological state characterized
by perceptions of despair, hopelessness and powerlessness. In the linear regression model,
fatalism was significantly associated with extents of medication adherence, diabetes knowledge,
diet, exercise, and blood sugar testing. This association was further confirmed once depression
was statistically controlled for. Since this was a cross-sectional study, causal directions of the
associations could not be assumed. In addition, findings may not be generalizable to other
populations or geographical regions.
KAP assessment using a cross-sectional survey of 575 randomly selected diabetic
patients of two hospital clinics by Al-Maskari et al. (2013) found that 31% had poor knowledge
about diabetes, 72 % had negative attitudes towards diabetes, 57 % had poor glycemic control
and 10 % admitted noncompliance with medications. There was a weak but statistically
significant correlation between the level of knowledge and practice (r = 0.320, p = 0.001) and
also between attitudes and practice (r = 0.270, p = 0.001). Similarly there was a weak but
statistically significant association between knowledge and attitude scores (r = 0.115, p = 0.006).
Correlations between glycated hemoglobin (A1C) and knowledge, attitude and practice scores
did not reach statistical significance. In this study, there was no correlation between the level of
knowledge and glycemic control. No theoretical framework guided the research.
Khandekar, Harby, Harthy, and Lawatti (2010), in a cross-sectional study, examined
KAP relationships in a randomly selected sample of 750 diabetics from seven regions of Oman
regarding eye complications and self-care for diabetes. This study, with 5 questions on
knowledge, 3 on attitude and 3 on practice, found diabetes knowledge to be satisfactory;
however, attitude and practice were less than satisfactory.

34
An empirical study, using KAP assessment, of 1982 randomly selected diabetics and non-
diabetics from Kenya areas with high prevalence of diabetes was conducted in 2011 (Maina,
Ndegwa, Njenga, & Muchemi, 2011). The study examined how knowledge influenced attitudes
and practices about the prevention and control of diabetes, and used KAP assessments to develop
prevention programs. About 70 % of all respondents from each of four regions had poor
knowledge about diabetes. There was a direct relationship between level of education and
knowledge. Forty-nine percent of the respondents had a positive attitude toward diabetes and
forty-one percent demonstrated good practices toward diabetes. The KAP assessment in this
study indicated the need for diabetes education.
Ardena et al. (2010) assessed KAP and developed an educational program in a stratified
sampling of 156 rural persons with Type 2 diabetes in the Philippines. The associations between
patient factors and knowledge, attitudes, and practices about diabetes were explored. The overall
mean percentage score on knowledge was 43 %. Older patients had lower knowledge scores.
Ten percent believed in tight glucose control; only one percent believed that diabetes was a
serious disease. College graduates had better attitudes than less educated people did. Only 23 %
did regular A1C checks and 34 % examined feet for abnormalities; 25 % continued to smoke
despite medical advice.
Pre- and Post- Test with a Single Group
Pre- and post- intervention evaluation of an educational program for a single group of 67
patients with Type 1 diabetes who were receiving free monthly supplies of human insulin at the
outpatient clinic of a tertiary care hospital in Pondicherry, India was undertaken by
Vimalavathini, Agarwal and Gitanjali (2008), using a KAP survey. The KAP questionnaire
35
consisted of 22 questions, of which four were about attitude. This was a prospective
interventional study using a convenience sample. Knowledge and attitudes about diabetes
improved after the educational intervention. Only marginal improvement in practice scores was
observed; patients cited financial reasons for non-adherence to the insulin regimen. The practice
of storing insulin vials at home did show significant improvement (p < 0.0001). It was
concluded that knowledge, attitude and some aspects of practice improved after the educational
intervention, though some patients were unable to consistently follow an insulin regimen because
they could not afford transportation to the clinic.
In a single-group, prospective pre- and post -intervention study using a postal
questionnaire for 97 diabetic women in Ireland (Type 1, n = 89; Type 2, n = 8), Holmes et al.
(2012) evaluated use of an educational DVD to evaluate whether or not knowledge and attitudes
about preconception care and reproductive health, and behavior changed. The study found a
significant positive change in women’s perceived benefits of, and their personal attitudes about
receiving preconception care and using contraception. There was a significant improvement in
self-efficacy, that is, the self-confidence to use contraception and to access preconception care.
Viewing the DVD significantly increased the women’s knowledge about pregnancy planning and
pregnancy-related risks and significantly reduced perceived barriers to preconception care.
Knowledge, attitude and self-efficacy all improved as a result of the intervention. This study has
limitations, and its findings cannot be generalized. Only 26 % of the women contacted
participated in the study. The sample women were relatively upper class, and there was a lower
percentage of Type 2 diabetics than that in the general population (9 % vs. 17 %). The study did
not measure behavior or practice. More motivated and more highly educated individuals, who
acknowledged having earlier received preconception advice, responded and participated in the

36
study. Since there was no comparison control group, the improvement in knowledge and attitude
cannot be accurately attributed to the intervention alone.
A single-group, pre- and post- education, correlational study of a convenience sample of
168 urban, newly diagnosed Type 2 diabetics attending diabetes group education in Ireland was
conducted by Clarke (2009). The study found that attitude about diabetes was not related to
adoption of diabetes self-care behavior. The study findings were not generalizable since the
sample was not representative of the population.
KAP Studies with a Test-Control, Random-Assignment and Pre-Post Design
Malathy et al. (2011) evaluated a custom-designed counseling program, assessing the
effects of counseling on knowledge and practice in the test group, in a randomized sample of 207
Type 2 diabetes patients in South India, having an intervention group (n = 137) and a control
group (n = 70). KAP scores of the test-group patients improved significantly, in the post-
intervention assessment (p < 0.0001) especially for knowledge and attitude. The practice scores
did not show any improvement (p < 0.06); the baseline practice scores had been relatively high.
No significant changes in KAP scores for the control group were observed. The postprandial
blood glucose levels decreased significantly in the test group; there were no significant changes
in the control group. The study used a questionnaire of 25 questions with only three questions on
attitude. The study did not examine glycated hemoglobin (A1C), which is an important
biomedical marker of blood sugar control over time. Post-prandial blood glucose was assessed at
a single point in time.
A multi-site, prospective study of randomly selected diabetic Asians living in Scotland,
by Baradaran et al. (2006) evaluated an educational intervention tailored for South Asians, using

37
a group comparison of changes in diabetes knowledge between the test group and the ethnic and
the white control groups. The final study sample was 101 patients. The test group had low
baseline KAP scores. In the intervention group scores improved significantly for knowledge
(+12.5 %), serious attitudes (+13.5 %), and practice (+20.0 %). There were no significant
differences in KAP improvement between the members of the two control groups (white &
ethnic).
Evaluation of the effectiveness of a diabetes educational intervention with a small group
was undertaken by Garrett et al. (2005). Volunteers were randomly assigned to an intervention
group (n = 382) or to a control group (n = 382).The intervention group used a book explaining
self-care. After accounting for demographic differences between the groups, significant changes
were found in diabetes knowledge, feeling of control and self-management behavior between the
intervention and the control group. Although the study used a randomly selected sample, the pool
of volunteers had higher motivation than in the general population, which may introduce
selection bias. Hence the study findings had limited generalizability.
In a randomized, prospective study of Type 2 diabetics in India, Adepu et al. (2007)
evaluated the effect of pharmacist- provided counseling on patients' perceptions about disease
management and quality of life. A total of 60 Type 2 diabetes patients were randomly allocated
to the test group (n = 32) or the control group (n = 28). In the test group, knowledge, attitude and
practice scores markedly improved; mean capillary blood glucose levels fell (p < 0.05), and
mean quality-of-life scores rose (p < 0.05). In the test group, a highly significant correlation was
found between the capillary blood glucose levels and the quality-of-life scores (p < 0.05).The
control group showed a reduction in the quality-of-life scores (p < 0.05).

38
In summary, some of these studies indicate that even though patients had good
knowledge and positive attitude they had poor preventive practices and poor clinical outcomes.
In one study lack of money was a serious barrier to preventive practice.
Review of the Methodological Rigor of Previous Research
In order to improve the integrity of research, the methodological rigor of previous studies
is assessed. The following section describes the methodological problems of previous studies.
Problem with the Measurement Instrument
Studies used either a composite questionnaire including questions on knowledge, attitude,
and practice, or separate questionnaires to measure knowledge, attitude and practice. Researchers
may not have clearly defined the constructs of knowledge, attitude and practice. The
questionnaires had closed-ended questions or multiple choice questions. The response to a closed
question does not guarantee that the study subject has fully understood the question as intended
by the researcher. Open-ended questions are preferred on KAP surveys. When KAP studies used
a variety of instruments to assess a particular topic, it is harder to compare their results.
Sometimes KAP survey instruments have to be developed to study a specific subject, for lack of
existing valid instruments. The Diabetes Attitude Scale (DAS) (Anderson, Fitzgerald, Funnell, &
Grupen, 1998) questionnaire, which has been used in some studies, does not assess the affective
component of attitude. There is a paucity of questionnaires to assess health attitude. Several
researchers have created their own questionnaires; however, those assess only one component of
attitude, the cognitive.
Since in previous studies with KAP the researchers did not use psychometrically
validated KAP questionnaires, the results cannot be considered reliable or valid.

39
Problem of Research Design – Cross-sectional
The KAP studies reviewed were cross-sectional, using data collected at one point in time.
Because cross-sectional studies describe relationships among phenomena only at a fixed point in
time, they do not enable causal inferences. The previous studies lack strong theoretical
frameworks. The lack of temporal sequence or specification restricts the ability of those studies
to confirm the mechanisms of behavioral change. Moreover, the findings of those KAP studies
differed about the relationships among knowledge, attitude, and practice.
Lack of Control Group
To assess maturation effects, the change in a dependent (i.e. outcome) variable in the
experimental group receiving treatment is compared to the change in that dependent variable in
the control group that does not receive treatment. Some previous studies lacked a control group,
so it is difficult to separate the effects of maturation from those of the treatment.
Problem of Non-random Assignment of Participants to Groups
In the random assignment of participants into either experimental or control groups,
every participant has an equal chance of being assigned to any group. As a result there is more
likelihood that the groups are equivalent to begin with in regard to any attributes that may affect
the dependent variable under investigation. The lack of randomization in many studies detracts
from the credibility of the interpretation of their findings.
40
Problem of Lack of Theoretical Grounds
Previous KAP studies failed to generate testable hypotheses with clear causal
specifications. A majority of the studies reviewed were not theoretically grounded and lacked the
causal hypotheses deduced from specific assumptions that are needed for a causal inquiry.
Reformulation of Theoretically Informed, Causal Model of KAP-O with Health Educational
Intervention
Health education is known to improve health care outcomes, although not all
interventions are effective. Most of the studies reviewed suggested that educational intervention
leads to positive changes in outcomes or predictive outcomes. A few examples of such studies
are discussed below to frame the causal associations of the KAP-O model.
Study Examples
In 2001, Norris et al. reviewed 72 studies evaluating the effectiveness of self-
management education lasting for a period of six months or less. The authors found that the
interventions improved knowledge and glycemic control; however, they had variable effects on
lipids.
In 2002, Norris et al. with other researchers found that there was a drop of one percent in
glycated hemoglobin (A1C) for every additional 23.6 hours of contact time between educator
and patient. Tilly et al. (1995) evaluated a diabetes educational program by collecting data on
health status, glycemic control (A1C), diabetes-related quality of life, and general health-related
quality of life at multiple time points over a period of 15 months. The authors found significant
improvement in all four health outcomes.

41
A study by Hogue et al. (2003) of a community pharmacy-based diabetes educational
program with 381 participants, based on the American Diabetes Association Standards, found
improvements in Hemoglobin A1C results, fasting blood glucose levels, lipid levels, blood
pressure measurements, and diabetes knowledge scores. Similarly, Cranor et al. (2003) studied
the outcomes for the five years following the initiation of community-based, pharmaceutical care
services for patients with diabetes. The study, with a quasi-experimental, longitudinal, pre-post
cohort design, found improvements in all categories of outcomes and a decrease in the mean for
total direct medical costs per patient per year.
Korhonen et al. (1983) studied the effect of patient education on diabetic control in
insulin-treated diabetic adults in a randomized trial. One group received intensive education and
the second group received printed material. A significant improvement in diabetic control was
observed in both groups immediately after the educational programs, which however returned to
the original level of control later.
A systematic review of other research literature has shown either mixed results or no
improvement in clinical care outcomes attributable to diabetes education. Three of those studies
are summarized below.
Bloomgarden et al. (1987), in a randomized trial involving adults with insulin-treated
diabetes, found that for most, patient education was not as efficacious as therapeutic intervention.
Beeney and Dunn (1990) assessed knowledge and glycated hemoglobin pre- and post-
intervention of 558 patients attending one of five diabetes education programs. There was an
increase in 18% in knowledge scores; however, that improvement in knowledge scores was not
correlated with changes in glycated hemoglobin (A1C).

42
However, Ozmen and Boyvada (2002) provided diabetes education to 359 patients who
were then split into two groups: A and B. Group A received a glucometer and an additional two
hours of education and Group B group received no glucometer and no additional education.
There was no change in A1C in the control group (B), and only some patients in the test group
(A) had improvement in A1C.
The studies summarized above did not investigate causal mechanisms or specifications.
The educational interventions are most likely to have influenced the outcomes through the
mediation of changes in knowledge, attitude, and practice, rather than directly. It is important to
explore which of the two factors, knowledge or attitude, may have a more dominant influence on
preventive practice and thus on diabetes care outcomes. The relative importance of the factors
influencing diabetes care outcomes can guide educational programs to target specific knowledge
or attitudinal components of the behavioral system. Thus research could improve practice and
outcomes.
Because previous KAP studies failed to develop causal specifications of the behavioral
components of preventive practice and outcomes, their results were inconclusive and
inconsistent. The present KAP-O study is designed to test causal specifications and identify the
dominant mediating and moderating factors that influence the preventive practice and health care
outcomes of diabetes care. The KAP-O model was subjected to empirical validation with a
rigorous research design.
Studies Supporting the Concept that Educational Intervention Directly Improves
Diabetics’ Knowledge
Norris et al.’s (2001) review, cited earlier, of 72 studies focusing on the effectiveness of
self-management education for a period of six months or less found that self-management

43
education improves diabetics’ knowledge. The Hogue et al. (2003) study, cited earlier, of
community, pharmacy-based diabetes education based on the American Diabetes Association
Standards with 381 participants found improvements in diabetes knowledge scores, as well as in
glycated hemoglobin (A1C) results, fasting blood glucose levels, lipid levels, and blood pressure
measurements.
Evaluation of the effect of an educational KAP program, through a single-group,
prospective pre- and post-intervention study of 67 Type 1 diabetic patients receiving free
monthly supplies of human insulin at the outpatient clinic of a tertiary care hospital, in
Pondicherry, India was undertaken by Vimalavathini et al. (2008). The study used a convenience
sample. Diabetes knowledge improved after the intervention.
Holmes et al. (2012), as described earlier, conducted in Ireland a single-group,
prospective, pre- and post-intervention study by postal questionnaire of 97 women with diabetes
(Type 1, n = 89; Type 2, n = 8) who were aged 18–40 years. The purpose was to evaluate
whether an educational DVD increased their knowledge about diabetes and changed their
attitudes towards preconception care and reproductive health behavior. After viewing the DVD,
the women’s knowledge about pregnancy planning and pregnancy-related risks had increased
significantly.
Malathy et al. (2011), in evaluating a custom-designed counseling program as described
earlier, assessed the effects of counseling on diabetes knowledge and practice in a test group (n
= 137) versus a control group (n = 70) in a randomized sample of Type 2 diabetes patients in
South India. The knowledge scores of the test group patients improved significantly
(p < 0.0001). There was no statistically significant change in the knowledge scores of the control
group.

44
In other research cited earlier, a multi-site, prospective study of randomly selected South
Asian diabetes patients in Scotland, by Baradaran et al. (2006), evaluated a custom tailored,
educational intervention by comparing the change in diabetes knowledge among the test, ethnic
control and white control groups. The study sample comprised of 101 Type 2 patients. The test
group had low KAP at baseline and significant improvement in the scores for diabetes
knowledge after the intervention.
As described earlier, evaluation of the effectiveness of a small group, diabetes
educational intervention was undertaken by Garrett et al. (2005), using volunteers randomly
assigned to either an intervention group (n = 382) that participated in the small-group learning
activity or a control group (n = 382) that received a diabetes self-care book. Adjusting for
demographic differences between the groups, there was a significant change in diabetes
knowledge in the intervention group as compared to the control group.
In a randomized, prospective study of Type 2 diabetics in India, Adepu et al. (2007),
cited earlier, evaluated the effect of pharmacist- provided counseling on patients' perceptions
about disease management and quality of life. A total of 60 Type 2 diabetes patients were
randomly allocated to the test group (n = 32) or the control group (n = 28). In the test group,
knowledge, scores markedly improved.
In the studies discussed above, health educational interventions led to increases in
knowledge. This evidence led to hypothesis. H1: Health educational intervention directly
improves knowledge.

45
Studies Supporting the Concept that Educational Intervention Directly Improves Attitude
The evaluation by Vimalavathini et al. (2008) of an educational program, cited above,
found that diabetic patients’ attitudes toward self-care improved after educational intervention.
The study conducted by Holmes et al. (2012) in Ireland using educational DVD improved
diabetes knowledge and also the diabetic women’s attitudes towards preconception care,
reproductive health attitudes and behavior. At post-intervention, there was a significant positive
change in women’s perceived benefits of, and their personal attitudes to receiving preconception
care and using contraception.
A one- group, pre- and post- education, correlational study in Ireland of a convenience
sample of 168 urban, newly diagnosed Type 2 diabetics who were attending diabetes group
education was conducted by Clarke (2009) to assess their changing perceptions about diabetes
from attending the group education. The patients’ attitude about the seriousness of diabetes
continued to increase over time.
Malathy et al. (2011), previously cited, evaluated a custom-designed KAP counseling
program in South India and found that the scores of the test group improved significantly
(p<0.0001), for attitude about diabetes at post-intervention. There were no significant changes in
the attitude scores of the control group.
A multi-site, prospective study of 101 South Asian diabetic patients in Scotland by
Baradaran et al. (2006) cited previously, compared changes in diabetes knowledge between the
test and the ethnic control and the white control groups. The test group had low KAP scores at
baseline and significantly improved in scores for attitudes toward the seriousness of diabetes
after the intervention.

46
Adepu et al. (2007), cited earlier, evaluated the effects of pharmacist- provided patient
counseling for Type 2 diabetes patients from two community pharmacies in Calicut, Kerala,
India. The test group scores for attitude about diabetes markedly improved.
The studies discussed above using health educational interventions found resulting
improvements in attitude. This evidence led to hypothesis H2: Health educational intervention
directly improves attitude.
Studies Supporting the Concept that Educational Intervention Directly Improves
Preventive Practice
In an evaluation of the effectiveness of a small-group intervention, described earlier, by
Garrett et al. (2005), there were significant changes in behavior related to self-management of
diabetes in the intervention group as compared to the control group, which had simply received a
diabetes self-care book. The study adjusted for demographic differences between the two groups.
A multi-site, prospective study of randomly selected diabetic Asians living in Scotland,
by Baradaran et al. (2006) evaluated an educational intervention tailored for South Asians, using
a group comparison of changes in diabetes knowledge between the test group and the ethnic and
the white control groups. The final study sample was 101 patients. The test group had low
baseline KAP scores. In the intervention group practice scores improved significantly (+20.0 %).
In a randomized, prospective study of Type 2 diabetics in India, Adepu et al. (2007)
evaluated the effect of pharmacist- provided counseling on patients' perceptions about disease
management and quality of life. A total of 60 Type 2 diabetes patients were randomly allocated
to the test group (n = 32) or the control group (n = 28). In the test group practice scores markedly
improved.
47
These studies suggested that health educational intervention directly increased preventive
practice. This evidence led to the development of the third hypothesis, H3: Health educational
intervention directly improves preventive practice.
Studies Supporting the Concept that Health Educational Intervention Improves Health
Care Outcomes
In 2001, Norris et al. reviewed 72 studies evaluating the effectiveness of self-
management education lasting for a period of six months or less. The authors found that the
interventions improved knowledge and glycemic control; however, they had variable effects on
lipids.
In 2002, Norris with other researchers found that there was a drop of one percent in
glycated hemoglobin (A1C) for every additional 23.6 hours of contact time between educator
and patient. Tilly et al. (1995) evaluated a diabetes educational program by collecting data on
health status, glycemic control (A1C), diabetes-related quality of life, and general health-related
quality of life at multiple time points over a period of 15 months. The authors found significant
improvement in all four health outcomes.
A study by Hogue et al. (2003) of a community pharmacy-based diabetes educational
program with 381 participants, based on the American Diabetes Association Standards, found
improvements in Hemoglobin A1C results, fasting blood glucose levels, lipid levels, blood
pressure measurements, and diabetes knowledge scores. Similarly, Cranor et al. (2003) studied
the outcomes for the five years following the initiation of community-based, pharmaceutical care
services for patients with diabetes. The study, with a quasi-experimental, longitudinal, pre-post
cohort design, found improvements in all categories of outcomes and a decrease in the mean for
total direct medical costs per patient per year. This evidence led to the development of the fourth

48
hypothesis, H4: Health educational intervention directly improves diabetes health care outcomes
which is further detailed by the following hypotheses, H41: Health educational intervention
directly lowers glycated hemoglobin (A1C), H42: Health educational intervention directly lowers
low density lipoprotein cholesterol (LDLC), H43: Health educational intervention directly
improves functional capacity (FC), H44: Health educational intervention directly decreases poor
perceived health (PPH).
Studies Supporting the Concept that Educational Intervention Indirectly Improves
Practice via Knowledge and Attitude
The previously described study by Vimalavathini et al. (2008) evaluated the effects of an
educational program on the diabetes knowledge, attitude and practices of 67 Type-1 patients
receiving free monthly supplies of human insulin at the outpatient clinic of a tertiary care
hospital in India. Patients were of low socioeconomic status, either illiterate or with primary
school education, and had longstanding diabetes. Their diabetes knowledge and attitudes
improved after the intervention. The improvement in practice scores, though significant, was
marginal. The practice of storing insulin vials at home showed significant improvement (<
0.0001), but patients cited financial reasons for not adhering to their insulin regimens.
Baradaran et al. (2006), cited earlier, conducted a multi-site, prospective study of 101
South Asian diabetes patients in Scotland, and compared KAP scores between the test group and
the ethnic and white control groups. The test group had low KAP scores at baseline; their scores
post-intervention improved significantly for knowledge (+12.5 %) and serious attitudes toward
diabetes (+13.5%), and for practice (+20.0 %), as well.
The studies discussed above suggested that health educational intervention indirectly
improves preventive practice via knowledge and attitude. This evidence led to hypothesis H5:

49
Health educational intervention also indirectly improves preventive practice via knowledge and
attitude.
Studies Supporting the Concept that Educational Intervention Indirectly Affects
Outcomes, Mediated via Knowledge, Attitude, and Practice
Adepu et al. (2007) previously cited, evaluated the effect of pharmacist-provided patient
counseling in India on Type 2 diabetes patients' perceptions about disease management and
quality of life. In the test group patients (n = 32), knowledge, attitude and practices scores were
markedly improved post-intervention, mean capillary blood glucose levels was reduced (P <
0.05) and the mean scores for quality of life improved (P < 0.05). The correlation between the
capillary blood glucose levels and quality of life scores was also found to be highly significant in
the test group (r = 0.955).In the control group (n = 28) quality of life score was reduced (P <
0.05).
Malathy et al. (2011) previously cited, assessed the effect of custom-designed counseling
on knowledge and practice for test group (n = 137) and control group (n = 70) of 207 Type 2
diabetes patients in South India. Post-intervention KAP scores of test group patients, especially
knowledge and attitude, improved significantly (p < 0.0001). Practice scores showed no
improvement (p < 0.06), since baseline practice scores were high. The control group showed no
significant changes in KAP score. The outcome for postprandial blood glucose (levels, improved
significantly in the test group.
Norris et al. (2002) found that self-management education improves the outcome of
glycated hemoglobin (A1C) levels at immediate follow-up and that improvement in glycated
hemoglobin (A1C) levels increases if the education continues for a longer time. The benefit of
improved outcome of glycated hemoglobin (A1C) was sustained for 1-3 months after cessation

50
of the intervention. This suggests that knowledge and attitude continue to influence practice and
outcome even after the self-management education ends.
The studies discussed above suggested that influence of health education on clinical
outcomes is not direct but is mediated via knowledge, attitude, and practice. This evidence leads
to hypothesis H6. The influence of health education on diabetes health care outcomes is not
direct, but is mediated via knowledge, attitude, and practice.
The hypotheses are listed below:
H1: Health educational intervention directly improves knowledge.
H2: Health educational intervention directly improves attitude.
H3: Health educational intervention directly improves preventive practice.
H41: Health educational intervention directly lowers glycated hemoglobin (A1C).
H42: Health educational intervention directly lowers low density lipoprotein cholesterol
(LDLC).
H43: Health educational intervention directly improves functional capacity (FC)
H44: Health educational intervention directly decreases poor perceived health (PPH).
H5: Health educational intervention also indirectly improves preventive practice via
knowledge and attitude.
H6: The influence of diabetes health education on health care outcomes is not direct, but
is mediated via knowledge, attitude, and practice.
The hypotheses were empirically tested using a pre-post design, with participants
randomly assigned into experimental and control groups. The following chapter details how the
overall model was validated and the hypotheses tested, using structural equation modeling.
51
CHAPTER THREE: METHODOLOGY
Introduction
The goal of this research study was to examine the causal mechanisms of diabetes
education’s effects on knowledge, attitude, practice and health care outcomes using the
knowledge-attitude-practice-outcome (KAP-O) framework. As discussed in the literature
review, few experimental studies have been done using the KAP-O framework and a pre- post-
test-control design with random assignment of diabetic participants.
Previous studies lacked theoretical grounding with causal specifications implied in the
hypotheses. The descriptive studies failed to define the constructs of knowledge, attitude, and
practice clearly or to measure changes in those constructs. Most of the questionnaires used
composite scores for mainly knowledge-based questions about specific health conditions. The
questions on attitudes did not consider the affective component of attitude, were not
comprehensive, and lacked demonstrable psychometric properties.
The present study used an experimental design with pre- post- assessments of diabetes
patients who had been randomized into experimental and control groups. The rationale for
choosing a randomized clinical trial was to explore the causal relationship between health
educational intervention and knowledge, attitude, practice, clinical outcomes and subjective
outcomes. Randomization of participants to experimental and control groups avoided both biased
selection and any influence from differences in previous characteristics on clinical and subjective
outcomes. The experimental design using experimental and control groups enabled ruling out
any changes in the KAP measures and clinical outcomes due to the maturation effect. The study
employed psychometrically validated tools to enhance validity and reliability of the data
gathered and tailored an attitudinal instrument comprising the cognitive, affective, and

52
behavioral components. This chapter details the research design, sampling, power analysis,
classification of study variables and their measurements, analytical methods including t-tests and
structural equation modeling, and the logical flow of a multi-phase analysis of the KAP-O model
of health educational intervention.
Preparation for a Randomized Controlled Experiment
Preliminary Steps
1. The researcher secured permission from a study site to conduct research.
2. The researcher undertook a refresher online course for Human Research Curriculum
through the Collaborative Institutional Training Initiative (CITI) as a prerequisite for
University of Central Florida, Institutional Review Board (UCF IRB) approval of the
study.
3. The researcher secured approval for a human research study by online application to
UCF IRB.
4. The researcher identified diabetes patients via the medical practice’s electronic data
base and mailed copies of a letter from the physician inviting patients to participate in
the study.
5. The researcher generated the patient sample and obtained patients’ informed consents
for the study.
6. The researcher created a layout of how the research findings would be presented
without any numbers.

53
Description of Intervention and Implementation
The researcher viewed “Introduction to Healthy Tutor” and selected the educational
program for the present study from Healthy Tutor (www.healthytutor.com). That health
educational material is readable by people with at least sixth grade education. A mantra of
health providers seeking to avert the complications of diabetes is “control the ABCs of diabetes:
A1C (an indicator of average blood sugar for 3 months), blood pressure, and cholesterol.” That
mantra guided the selection of seven tutorials: introduction, meal planning, exercising for a
healthy life, high blood pressure, managing cholesterol, foot care, and hypoglycemia.
Healthy Tutor utilizes evidence-based, interactive, self-paced, web-based health
education tutorials produced by the Patient Education Institute in Coralville, Iowa marketed
under the X-Plain trademark. X-Plain tutorials and their associated illustrated hard copy texts,
are suitable for sixth grade readers. To the X-Plain tutorials, Healthy Tutor added pre-tests and
post-tests using patented algorithms. These tutorials are available on the National Library of
Medicine website http://www.nlm.nih.gov/medllineplus/diabete.html . A special permission was
granted by Healthy Tutor for use of their educational materials in this study. Thakurdesai, Kole,
& Pareek (2004) evaluated web-based educational material for diabetes patients according to the
Health Summit Working Group (HSWG) criteria and for coverage of core educational concepts.
From 53 viable web educational programs the authors formulated a list of the 10 best websites
for online diabetes education. They ranked the National Library of Medicine’s website second.
Choice of Instruments to Test Literacy, Knowledge, Attitude, Practice and Outcomes
The study instruments listed below were selected after consultation with experts and as
supported by the literature review.

54
1. LAD – literacy assessment of diabetes (Nath, Sylvester,Yasek, & Gunel, 2001)
2. SDSCA – summary of diabetes self-care activities (Toobert, Hampson, & Glasgow,
2000)
3. Functional Capacity – EQ-5D-5L (2009), with additional items as used by Perneger
and Courvoisier (2011).
4. Perceived Poor Health – European Quality Visual Analogue Scale (EQ-VAS),
(EuroQolOrg, 2009).
5. Knowledge Instrument – thirty-eight questions specific to the seven core diabetes
tutorials (Healthy Tutor, 2010) (Dickeson & Scheel, 2014).
6. Attitude Instrument – An extensive literature review revealed that existing attitude
instruments such as the diabetes attitude scale (DAS) (Anderson et al., 1998) and
problem areas in diabetes (PAID) (Polonsky et al., 1995) do not test the affect
component of attitude. Interactions with patients and a review of current diabetes
instruments pinpointed areas of concern by diabetic patients about the disease, its
complications and its care. Certain questions were adapted or borrowed from
psychometric instruments assessed by Eigenmann, Colagiuri, Skinner, and Trevena
(2009), to develop an instrument to measure attitude that covered all three
components of attitude, namely cognitive, affective, and behavioral tendency. After
pilot testing of the instruments for clarity before the research started, some questions
were reworded to improve clarity.

55
Setting
The project site for the study was Medical Specialists, a two-site internal medicine and
nephrology practice that serves a medically underserved population of 6,176 patients, of whom
62 % are insured by Medicaid. Medical Specialists has been operating since 1983. The medical
practice has at least 500 diabetes patients.
Recruitment of Participants
The electronic charts of patients on the daily appointment schedule were checked to
identify Type 2 diabetes patients. The electronic charts of walk-in patients were reviewed to see
whether they had Type 2 diabetes and met the inclusion criteria. Participation in the study was
voluntary. Research subjects could opt out of the study at any time. Confidentiality was ensured
by assigning a unique identifier to each subject’s record.
The researcher made sustained efforts to recruit potential participants from the clinic
patients through face-to-face recruitment. The prospective participants were told that the
researcher is a doctoral student of the University of Central Florida, and that the findings of the
research were expected to benefit Type 2 diabetes patients and their families. The researcher
offered to provide all participants with a summary report if they were interested in the findings of
the study. No financial incentive to participate was offered.
The research had to be explained to patients to gain their participation. At first many
declined, which discouraged the researcher, who knew the study would go nowhere without their
participation. The patients were assured of the research integrity: that the data would be used
only for scientific inquiry. The patients’ confidence in the study also was boosted when they
were told that it was endorsed by the University of Central Florida. Participation was made as

56
convenient as possible for patients by rescheduling appointments and at times arranging for
transportation through the Council on Aging. For participants who did not have computers, large
screen computers were made available to view tutorials in one to two examination rooms. The
researcher sat with many patients and showed them how to access the tutorials online.
Patients, who agreed to participate, signed informed consent forms. Each potential
participant was assessed for his/her health literacy level. Participants then filled out
questionnaires while waiting to be seen by the physician. Each was given a lab order requisition
for a stat glycated hemoglobin (A1C) and lipid profile. Shortly after enrollment, patients in the
experimental group were reminded in person and by phone to review the tutorials and/or
complete the questionnaires. All patients were asked to fill out the questionnaires again during
follow-up visits at 3 months or 6 months and to have blood tests then for A1C and lipid profile.
Patients were requested to respond to the questionnaires by mail if they could not come to the
office.
Definitions of Constructs
The aim of this research is to examine the relationship of a health educational
intervention to diabetes knowledge, attitude, self-care practice, and clinical outcomes.
Knowledge, attitude, and practice, the KAP components, were measured by patient responses to
pre-and post-questionnaires. Objective outcomes: Glycated hemoglobin (A1C), a measure of
blood sugar; and lipid profile were measured by clinical laboratory blood tests. Subjective
outcomes: Functional capacity was determined by the survey questionnaires: EQ-5D-5L
(EuroQol Org 2009, and five additional items as used by Perneger & Courvoisier, 2011).

57
Poor Perceived health status was determined by visual analogue scale: EQ-VAS (EuroQol/org
2009).
Knowledge is the acquisition, retention and use of information or skills (Badran, 1995).
Acquiring knowledge through cognition is a process of understanding and is distinguished from
an experience of feeling. Knowledge about health accrues as a result of health education or
experience. Health knowledge possessed by diabetics refers to their comprehension of the
disease and its progression, and self-care practice necessary for keeping diabetes under control.
Attitude: Eagly and Chaiken in “The Psychology of Attitude” define attitude as “a
psychological tendency expressed by evaluating a particular entity with some degree of favor or
disfavor” (Eagly & Chaiken, 1993, p.1 as cited in Eagly and Chaiken, 2007). Attitude
encompasses three basic components of cognition, affect, and behavioral tendency as discussed
by Katz & Stotland (1959), Krech & Crutchfield (1948) and Rosenberg & Hovland (1960) as
cited in Eagly and Chaiken, 2007. Cognitions are true and false beliefs about the attitude object.
Health education may change such cognitive perceptions. There may be some overlap of
knowledge and attitude. Some diabetic patients may have preconceived ideas that they may not
live long lives, from having heard about relatives dying at an early age from heart attacks. Some
patients are afraid of disabilities from stroke, limb amputation or kidney failure. The affective
component includes the whole gamut of feelings/emotions about every aspect of the attitude
object. Some patients may have various attitudes towards self-care management of their diabetes.
They may love to exercise because it makes them feel good, but hate self-monitoring of blood
sugar because they are averse to pricking their skin. The behavioral component in attitudes is the
proneness to act in particular ways with reference to the attitude object. Some diabetes patients
may be apt to follow through every recommendation by physicians. Others may not. In
58
summary, attitude toward diabetes refers to any preconceived ideas about diabetes and its
management and feelings/emotions towards certain aspects of diabetes and diabetes care, any of
which may carry an aptness to behave in a particular way regarding diabetes and managing its
care.
A patient’s health practice manifests the level of understanding of health
problems/diseases and her/his attitude toward them. A change in attitude caused by removal of
misconceptions about health problems or disease can translate into preventive behavioral
practices such as self-care. Practice is thus a cluster of actual behaviors or actions that avert a
disease condition or delay its progression. For diabetics, self-care or preventive behavioral
practice involves healthy eating, increased physical activity, adherence to medications,
overcoming barriers to weight loss and active lifestyle, avoidance of responding to stress by
overeating or inactivity, timely follow-up with physicians, and participation in tests to reassess
health outcomes. These seven self-care behaviors are strongly advocated by the American
Association of Diabetes Educators.
The experimental (exogenous) variables, endogenous outcome variables and control
variables of this study are described below.
Measurement of the Variables
1. The experimental or exogenous variable was a self-management educational
intervention delivered by online tutorials or reading a printout of the tutorials. The
experimental group was coded 1 and the control group was coded 0.
2. Endogenous variables: The KAP-O framework was the guide for the development
and selection of endogenous variables as consequences of the health educational

59
intervention. Knowledge (K) was assessed by scoring a questionnaire of 38 items
covering the tutorial content. Attitude toward diabetes and its self-management was
assessed by a questionnaire of 30 items to determine the affective, cognitive, and
behavioral components of the participants’ attitudes. The summary of diabetes self-
care activities was used to evaluate practice. Outcome measures of the Healthy Tutor
2010 (Dickeson & Scheel, 2014) intervention program were laboratory results:
glycated hemoglobin (A1C) and low density lipoprotein cholesterol (LDLC), and
subjective outcomes: functional capacity as evaluated by the questionnaire EuroQol
(EQ-5D-5L) supplemented with 5 items from the Perneger and Courvoisier study in
2011 and poor perceived health as evaluated by European Quality Visual Analog
Scale (EQ-VAS).
3. Control variables or confounders were considered since they might pose potential
threats to the internal validity of the KAP-O model.
4. The pre- and post- tests generated time-specific changes in knowledge, attitudes and
health behavioral practice.
The instruments used to collect the data are described in detail below.
Measurement Instruments Used
LAD (Literacy Assessment for Diabetes): The control of diabetes requires self-care by
patients. Because diabetes patients often have to read instructions and menus, they need adequate
literacy. The Literacy Assessment for Diabetes (Nath et al., 2001) assesses literacy in adult
patients with a words recognition test in which patients read out loud and pronounce the words
on 3 lists. Low word recognition scores suggest low comprehension skill, whereas the ability to

60
read all 60 words predicts successful comprehension of pamphlets and menus. The LAD (Nath et
al., 2001) has shown high concurrent validity and high test-retest reliability.
EQ-5D: (European Quality, Five Dimensions), by the EuroQol Group, is a standardized
measure of health status. EQ-5D has two components, a descriptive EQ-5D and an EQ – visual
analogue scale (EQ VAS). EQ-5D covers the five dimensions of health status. Five dimensions
were added to EQ-5D as tested by Perneger and Courvoisier (2011) to produce a more
comprehensive tool for a multi-attribute assessment of health ability. A completed EQ-5D
provides a descriptive indication of functional capacity. A completed EQ-VAS provides a single
index value for health status. The EQ-5D and EQ-VAS comprise reliable and valid instruments.
SDSCA (Summary of Diabetes Self-Care Activities): A summated scale of diabetes self-
care activities, measuring multiple preventive and self-care practice behaviors, was used. It is a
brief, reliable and valid measure of diabetes self-management (Toobert et al., 2000). Patients
report on the frequency of each of the seven health habits or behavioral practices promoted by
the American Diabetes Association and physicians.
DMPA (Diabetes Mellitus Patient Attitude Test): Since no comprehensive instrument to
measure attitudes toward a specific illness (e.g., diabetes) was available, the researcher created a
30-item questionnaire for the attitude instrument, based on the literature review. Thirty items
cover all three attitude domains: cognition (patient’s perception of diabetes), affective domain
(likes and dislikes of specific aspects of diabetes and diabetes care), and behavioral tendency, the
predisposition to act. The presence of a specific attitude is scored 1, otherwise 0. A summated
score was developed for the attitudinal scale toward diabetes and diabetes care.
DKT (Diabetes Knowledge Test): Thirty-eight questions specific to the tutorial content
were chosen to form the knowledge-based instrument for diabetes and diabetes care, since all

61
experimental group participants had access to all seven core modules and print material
pertaining to the tutorials. Each of these questions was open- ended; participants could choose
from four possible responses. A summated scale of diabetes knowledge was developed.
Table 1. Description of Constructs and Their Measurement
Construct Conceptual Definition Operational Definition Instrument/Process to
Measure Variable
Health
Literacy
Health Literacy is defined as
“ the degree to which
individuals have the capacity
to obtain, process, and
understand basic health
information and services
needed to make appropriate
health decisions.” (IOM) as
cited in Bains and Egede
(2011).
Subjects pronounce 60
words. Subject scores
plus (+) for each
correctly pronounced
word, zero (0) for each
mispronounced word,
and a minus (-) for a
word not attempted. A
word that the patient
self-corrects is counted
as correct and scored
plus (+).The total score
is converted to a
reading grade level
using the conversion
table on the score sheet.
LAD - The Literacy
Assessment for
Diabetes (LAD) is
administered one-on-
one to assess an adult
patient’s ability to read
ordinary nutritional and
medical terms, and
terms specific to
diabetes.
Diabetes
Knowledge
Knowledge of causes of
diabetes, signs of diabetes,
complications of diabetes,
preventive behavior
regarding diet, exercise, foot
care, high blood pressure,
Correct answer was
scored one and wrong
answer scored zero.
DKT- (Diabetes
Knowledge Test) - 38
questions from a pool
of questions embedded
in 7 core modules on
diabetes.

62
Construct Conceptual Definition Operational Definition Instrument/Process to
Measure Variable
cholesterol, and meal
planning.
Diabetes
Attitude
Attitudes are gradational
evaluations of an entity,
ranging from like (favor) to
dislike (disfavor). Attitudes
are beliefs, feelings, and
aptness to behave regarding
diabetes and its
management.
Scored using Likert
scale ranging (1-5)
from strongly disagree
1 to strongly agree 5.
DMPA (Diabetes
Mellitus Type 2 Patient
Attitude) - 30 questions
developed to cover the
3 domains of attitude:
cognition, affective and
behavioral.
Preventive
Practice
Follow a healthy diet,
exercise, test blood sugar,
check blood pressure, use
foot care and avoid smoking.
The number of days
from none to 7 per
week that preventive
practice was carried
out.
SDSCA- the Summary
of Diabetes Self-care
Activities.
Functional
Capacity
1 Degree of ability regarding
mobility, self-care, usual
activities, pain/discomfort,
anxiety/depression
2 Degree of ability for sleep,
memory/concentration,
fatigue/energy, seeing and
hearing, and contact with
others.
Scoring for items:
No problems = 1.
Slight problems = 2.
Moderate problems =
3.
Severe problems = 4.
Unable to, or extreme
problem = 5.
1 EQ-5D-5L
EuroQol (2009)
2 Perneger &
Courvoisier (2011)
Poor
Perceived
Health
A single index value for
health status.
Self-perception of
health by choosing a
number on a scale 0 to
100 where 0 = worst
EQ VAS

63
Construct Conceptual Definition Operational Definition Instrument/Process to
Measure Variable
health and 100 = best
health.
Glycated
Hemoglobin
(A1C)
HbA1C is a lab test that
shows the average level of
blood sugar over the
previous 3 months. It
assesses the control of
diabetes. (American
Diabetes Association, 2012).
Normal: Less than
5.7%
Pre-diabetes: 5.7% to
6.4%
Diabetes: 6.5% or
higher.
(American Diabetes
Association, 2012).
A sample of blood
from a vein is tested in
a clinical laboratory.
Low Density
Lipoprotein
Cholesterol
(LDLC)
Lipoprotein transports
cholesterol within blood. It
can deposit inside blood
vessels and narrow the blood
vessel.
Goal for most people is
LDLC level below 130
mg/dl.
A sample of blood
from a vein is tested in
a clinical laboratory.
In addition to the construct variables the main attributes of the participants were age,
ethnicity, gender and comorbidities. These were coded as follows: age (years), ethnicity (0 =
other, 1 = white), gender (0 = female, 1 = male), and comorbidities (0 = absence of
comorbidities, 1 = presence of comorbidities).
Validity and Reliability of Measurement: Knowledge, Attitude, Practice, and Outcome
Measures
Data for knowledge, attitude, and practice and the outcome measures of functional
capacity and poor perceived health were collected after participants had completed the

64
questionnaires described. The glycated hemoglobin (A1C) and low density lipoprotein
cholesterol (LDLC) were obtained through blood tests.
For quantitative measures, instrument reliability and validity must be evaluated. The
reliability of an instrument is the degree of consistency or accuracy with which it measures the
attribute it is supposed to measure. The reliability of an instrument is specific to the sample and
conditions (Polit & Hungler, 1995). Reliability coefficients, which are an important indicator of
the quality of quantitative measures, range from 0.00 to 1.00 (Polit & Hungler, 1995). The
higher values indicate increased reliability or increased accuracy (Polit & Hungler, 1995). For
group-level comparisons, a coefficient around 0.7 may be sufficient (Polit & Hungler, 1995).
Coefficients of 0.8 or greater are highly desirable (Polit & Hungler, 1995). The reliability
coefficients were computed and are as follows: the alpha for scale reliability of knowledge
instrument = 0.788, the alpha for scale reliability for the attitude instrument is 0.695, the alpha
for scale reliability for the practice measure is 0.801, the alpha for scale reliability for the
functional capacity measure is 0.871.
Validity of an instrument refers to how adequate it is in measuring what it is supposed to
measure. Does the resultant score measure the construct? Researchers have more confidence in
the validity of an instrument when it has demonstrated in several previous studies that it
measured what it was supposed to measure (Polit & Hungler, 1995). The outcome measures of
glycated hemoglobin (A1C) and low density lipoprotein cholesterol (LDLC), as objective
measures obtained from certified laboratories, are relatively unlikely to be distorted.

65
Sampling and Power Analysis
Established Type 2 diabetic patients of the medical practice sites were eligible to be
recruited according to the inclusion and exclusion criteria given below.
Inclusion criteria: Patients older than age 18, diagnosed with diabetes Type 2 as indicated
by one of the International Classification of Diseases Ninth Revision (ICD9) codes 249.00 -
250.99, or who have been told by health practitioners that they have high blood sugar, who take
Metformin, or who present to the clinic with classic symptoms of hyperglycemia and random
plasma glucose of >200 mg/dl. Exclusion criteria are: Patients with Type 1 diabetes, patients
who had completed more than 2 hours of diabetes education within the past 6 months, patients
having reading ability below the sixth grade level as determined by the health literacy survey
instrument, and patients less than eighteen years of age. Diabetic patients with complications
such as kidney stage IV failure (i.e. glomerular filtration rate of 30% or less) or legal blindness
from diabetic retinopathy were excluded. Patients in very poor health and unable to participate
were excluded. Patients with mental impairment were excluded.
Patients were randomly assigned to experimental and control groups. Recruitment period
of subjects for the study was from October 2011 to April 2012. There were three waves of
recruitment. The first wave of recruitment of the subjects for the experimental group occurred in
October 2011, followed by recruitment of the control subjects in November 2011. The pattern of
recruitment was repeated three more times for a total of six months ending in April 2012. The
study was explained to participants in person in the offices of the medical practice and patient
questions were answered.

66
Sample Size
Initially, the researcher attempted to recruit one hundred participants for both
experimental and control groups to accommodate potential attrition and dropout. One hundred
eighty- two patients were recruited. Only 141 patients completed the study with all the
information necessary for analysis. The full KAP-O model has five variables (P = 5) to be
estimated and 4 residual terms (zetas) to be estimated. Thus the total number of parameters to be
estimated by SEM is 9: five parameters and 4 residual terms. The known information is: (p*
(P+1) divided by 2 = 30/2 = 15. Thus, total degree of freedom is 6 (15-9). To estimate 9
parameters in SEM, a minimum of 90 cases was required. In addition, a priori sample size
calculation for anticipated effect size 0.1, desired statistical power level of 0.8, and probability
level of 0.05, recommended a minimum sample size of 100 (Cohen, 1988; Soper, 2014; &
Westland, 2010). In addition, the study had 141 participants and satisfies this requirement.
Power Analysis
Power is the ability of a research design to detect relationships among variables when the
null hypothesis is false; i.e. the ability to ascertain that this relationship between variables is not
due to chance or sampling fluctuations.
The power of a study increases with large sample size, use of precise measuring tools,
and a research design that controls extraneous variables. The probability of a type II error is
termed beta. The complement of beta (1-β) is the probability of obtaining a significant result,
also referred to as the power of a statistical test.
Power analysis is a method for reducing the risk of type II error (wrongly accepting a
false null hypothesis). To perform power analysis, four components are necessary: the level of
67
significance or alpha; sample size; effect size, which refers to the strength of the relationship
among variables (or the salience of the treatment compared to the noise in measurement), and
power (1- β), i.e. the probability of rejecting the null hypothesis. Power analysis was used to
estimate sample size. In addition, the adequacy of the model can be estimated by a significance
level of 0.05, a sample size of 141 with 4 degree of freedom provides a power of 0.67 to detect
the RMSEA ranging between 0 and 0.127.
Internal Validity
Internal validity refers to the extent to which it is possible to make an inference that the
independent variable truly influences the dependent variable and that this relationship is
authentic (Campbell & Stanley, 1963 as cited in Polit & Hungler, 1995, p. 227). This study used
an experimental design where participants were randomly assigned to intervention group and
control group. Alternative explanations for resultant outcomes are referred to as threats to
internal validity.
History Threat
The history threat refers to external events that occur simultaneously with the
intervention and can affect the outcome (viz: participants may watch a documentary on diabetes
on TV). However, since this is a randomized control trial (RCT), the researcher can assume that
external events are likely to affect the experimental group and the control group equally.
Maturation Threat
Maturation refers to changes that occur in an individual with the passage of time,
including aging and developmental changes, independent of the intervention. Maturation threat is

68
not applicable since the two groups, intervention and control, were evaluated for a short period
of six months.
Testing Effects
Answering pre-test questions may affect participants’ performance on a post-test.
However, since this is an experimental study with random assignment to test-control groups, this
effect would be expected to be equal in both groups.
Multiple Group Threats: “Social Interaction” Threats to Internal Validity
Diffusion or imitation of treatment occurs when controls learn about the intervention
from the intervention group. Since patients were assigned to the intervention group in month one
and to the control group in month two, and that pattern was repeated; and since the follow- up
appointments were three months from the date of the initial visit, it was unlikely that the two
groups would interact.
The study used a randomized experimental pre- and post- test design. The unit of analysis
was the diabetic patient. The patients were randomized to an experimental group of patients who
received usual diabetes care such as prescriptions and referrals for tests and specialists and also
education via the web-based program called Healthy Tutor supplemented with print-outs of the
educational modules, and a control group that received simply usual care. The knowledge,
attitude and self-management practice of both experimental and control groups were evaluated at
baseline and post-intervention. The experimental group members, who also watched the online
tutorials and/or read the printouts, were expected to have higher scores on the post-test than on
pre-test, indicating an increase in knowledge.

69
The provider variation is constant since the site is a single practice with a single provider.
The researcher was the only staff responsible for the data collection, analysis, and results of this
study. All participants answered a set of questionnaires at two time points, baseline and post -
intervention (three to six months after enrollment in the study). Random assignment of
participants to the test and the control group is likely to yield equivalent groups vis- a- vis similar
attributes that may affect the dependent variables. The performance of the control group on
dependent variables forms a basis for comparing the performance of the experimental group on
the same dependent variable to separate the effects of maturation from those of exposure to the
intervention, i.e. diabetes self-care education.
Thirty-eight patients could not participate for various reasons: mental impairment,
extreme illness, or having failed the literacy test. The researcher had recruited 182 participants,
but only 141 were available for analysis. The attrition from 182 was accounted for as follows: 1)
two patients underwent gastric bypass surgery after they had filled out the first set of
questionnaires; 2) two patients were dismissed from the practice; 3) two patients died; 4) three
patients left the state; 5) one patient, admitted to the hospital with a stroke had decline in mental
functioning; and 6) thirty-one patients either changed providers soon after recruitment or failed
to provide complete questionnaires.
Data Collection and Management
The pre-analysis steps were as follows: A data analysis plan was created. Each subject’s
completed responses were placed in a folder. The folders for the interventional group and the
control groups were filed separately and alphabetically by last name. The questionnaires were
reviewed for completeness and legibility. Steps were taken to retrieve missing information on
70
questionnaires or missing clinical outcome measures of glycated hemoglobin (A1C) and low
density lipoprotein cholesterol (LDLC). Research data was transformed into numbers by coding
to enable computer analysis. A code book was prepared. Each subject was assigned a unique
identification number.
The software package known as the Statistical Package for the Social Sciences (SPSS) 21
was used for data entry and analysis. Data entries were visually verified. Data were cleaned by
checking for improbable values and replaced with correct values. The data were checked for
consistency. Data were transformed as follows: scoring of items was reversed if they were
negatively worded; individual variables were combined to form composite scores; dichotomous
variables were created for multivariate analysis. Missing values on knowledge items were scored
as zero. There were very few missing Likert scale items. The missing Likert scale items were
replaced with mean for the item, to create a more complete data set. Cases with less than eight
percent missing information were retained.
Data Management
All data were managed and stored by the investigator. The survey results were entered
into SPSS 21 for analysis.
Statistical Analysis Plan
Structural equation modeling is an appropriate statistical methodology to analyze the data
to determine causal relationships between the educational intervention of Healthy Tutor,
knowledge, attitude, practice of self-care and clinical/self-reported outcomes.
This KAP-O model was tested to determine whether the hypothesized direct and indirect
causal pathways from the cause to the effect were consistent with the data.

71
The hypothesized relationships constitute the following testable hypotheses:
H1: Health educational intervention directly improves knowledge.
H2: Health educational intervention directly improves attitude.
H3: Health educational intervention directly improves preventive practice.
H41: Health educational intervention directly lowers glycated hemoglobin (A1C).
H42: Health educational intervention directly lowers low density lipoprotein cholesterol
(LDLC).
H43: Health educational intervention directly improves functional capacity (FC).
H44: Health educational intervention directly decreases poor perceived health (PPH).
H5: Health educational intervention also indirectly improves preventive practice via
knowledge and attitude.
H6: The influence of health education on health care outcomes is not direct, but is
mediated via knowledge, attitude, and practice.
Initially, from the perspective of the intention-to-treat analysis, the assumed direct causal
effects were empirically tested using a pre-post design, with participants randomly assigned into
experimental and control groups. The statistical analysis plan indicating how each of the six
hypotheses was tested is shown below.

72
Figure 2. Statistical Analysis Plan
Step 1
Run Pearson correlation to compare if experimental and control groups
are equivalent in terms of attributes that could influence outcomes
(proximal and distal).
If groups are comparable, proceed to Step 2. If not, control
by statistical process.
Step 2
For confirmatory factor analysis of subjective and objective outcomes,
run a Pearson correlation analysis of outcome variables: A1C, LDLC, FC,
and PPH.
If four outcomes are strongly correlated, treat as a single latent
construct – Diabetes Care Outcomes. If not, treat as four
different outcomes.

73
Figure 3. Intention to Treat Analysis Plan
Step 1
•Testing hypotheses: H1, H2, H3, H41, H42, H43, & H44 by steps 1 & 2 [examine if health education has direct effect on (K), (A), (P) and outcomes (A1C), (LDLC), (FC), & (PPH)].
•Examine the effect of health educational intervention on knowledge, attitude, practice and outcomes glycated hemoglobin (A1C), low density lipoprotein cholesterol (LDLC), functional capacity (FC), and poor perceived health (PPH) by t tests between experimental and control groups for baseline values and values at T-2 to detect whether group differences exist.
Step 2
•Examine the net intervention effect of health education on each of the variables of knowledge, attitude, practice and outcomes glycated hemoglobin (A1C), low density lipoprotein cholesterol (LDLC), functional capacity (FC), and poor perceived health (PPH) through path analysis by holding the prior measure of respective endogenous variable constant as a panel regression model to further confirm whether group differences exist.
Effect
•If group differences and net intervention exist for each of the K, A, P, and O, then health education intervention has a direct effect on K, A, P, and O.
Testing H5
•If group differences and net intervention do not exist for each of the K, A, P, and O, the indirect causal effect of health education intervention is examined by producing changes in outcomes via mediating factors of K, A, P. The Exp_Status is regressed on K, A, P at T2 (K-T2, A-T2, P-T2). The output will indicate whether relationships between variables exist if the link is statistically significant at alpha of 0.05.
Testing H6
•Run the difference- in-differences analysis of Expt_Status-change in knowledge (DK), change in attitude (DA), change in practice (DP), and each of the change outcome variables of glycated hemoglobin (DA1C), change in low density lipoprotein cholesterol (DLDC), change in functional capacity (DFC), and change in poor perceived health (DPPH). The output will indicate at alpha level of 0.05 if health education causes changes in outcomes mediated by factors of DK, DA, and DP.

74
Fit indices and their acceptable thresholds as detailed in Hooper, Coughlan, and Mullen
(2008) are absolute fit indices and incremental fit indices.
Absolute fit indices are: 1) Chi-Square χ2, 2) Relative χ2 (χ2/df), 3) Root Mean Square
Error of Approximation (RMSEA) and; Incremental Fit Indices are NFI, NNFI, and CFI.
1. Absolute fit indices:
a. Chi-Square χ2 – an acceptable threshold level is low χ2 relative to degrees of
freedom with an insignificant p value (p > 0.05) (Barrett, 2007 as cited in
Hooper et al., 2008).
b. Relative χ2 (χ2/df) (Kline, 2005; Tabachnik and Fidell, 2007 as cited in
Hooper et al., 2008) adjusts for sample size.
c. Root Mean Square Error of Approximation (RMSEA) - acceptable values are
less than 0.07 (Steiger, 2007 as cited in Hooper et al., 2008). RMSEA has a
known distribution and favors parsimony. Values less than 0.03 represent
excellent fit.
2. Incremental fit indices:
a. NFI – acceptable values are greater than 0.95. NFI assesses fit relative to a
baseline model which assumes no covariances between the observed
variables. NFI has a tendency to underestimate fit for samples less than 200
(Mulaik et al, 1989; Bentler, 1990 as cited in Hooper et al. 2008), and is thus
not recommended to be solely relied on (Kline, 2005 as cited in Hooper et al.,
2008).
b. NNFI (TLI) – acceptable values are greater than 0.95. TLI favors parsimony.
c. CFI – acceptable values are greater than 0.95.

75
CHAPTER FOUR: FINDINGS
Introduction
The study used a randomized, experimental pretest-posttest design. The unit of analysis
was the diabetic subject. The original plan to have 100-150 subjects each in the intervention and
control groups was not feasible. Thirty eight patients either refused to participate, or were
mentally impaired, were extremely ill, or failed the literacy test. The researcher recruited 182
patients for the study, of whom 141 with complete information were available for the analysis.
The attrition from 182 was accounted for as follows: 1) two patients underwent gastric
bypass surgery after they had filled out the first set of questionnaires; 2) two patients were
dismissed from the practice; 3) two patients died; 4) three patients left the state; 5) one patient,
admitted to the hospital with a stroke had decline in mental functioning; and 6) thirty-one
patients either changed providers soon after recruitment or failed to provide complete
questionnaires.
Descriptive and Correlation Analysis
Comparison of the Experimental and Control Groups
The main attributes of the experimental group (N = 87) and the control group (N = 52)
were obtained from electronic patient charts. Those attributes were: 1) age, ethnicity, and
gender; 2) comorbid conditions of atherosclerosis, coronary artery disease (CAD), congestive
heart failure (CHF), chronic kidney disease (CKD), eye problems, myocardial infarction, stroke,
neuropathy and osteoarthritis. A Pearson correlation to confirm the associations between
normally distributed variables of the experimental and the control group gave the results shown
in Table 2.

76
Table 2. Pearson Correlations of Age, Ethnicity, Gender, and Comorbidities with Experimental
Status
Attributes Exp_Status
Age Pearson Correlation -.098
Sig. (2-tailed) .246
Ethnicity Pearson Correlation -.097
Sig. (2-tailed) .253
Gender Pearson Correlation -.001
Sig. (2-tailed) .990
CAD Pearson Correlation -.048
Sig. (2-tailed) .572
CKD Pearson Correlation .036
Sig. (2-tailed) .674
CHF Pearson Correlation -.003
Sig. (2-tailed) .970
MI Pearson Correlation .022
Sig. (2-tailed) .792
STROKE Pearson Correlation -.041
Sig. (2-tailed) .630
OSTEO Pearson Correlation -.120
Sig. (2-tailed) .157
NERVES Pearson Correlation -.005
Sig. (2-tailed) .957
EYE Pearson Correlation .011
Sig. (2-tailed) .899
Atherosclerosis Pearson Correlation -.086
Sig. (2-tailed) .311
* Correlation is significant at the 0.05 level (2-tailed).
** Correlation is significant at the 0.01 level (2-tailed). (experimental group = 1, control group = 0).

77
The experimental group (N = 87) and the control group (N = 52) were comparable in
terms of age, ethnicity, gender and major diagnoses.
The next consideration was to determine whether there were correlations among the four
distal health outcomes- glycated hemoglobin (A1C), low density lipoprotein cholesterol (LDLC),
functional capacity (FC), and poor perceived health (PPH) in order to formulate a single outcome
construct as a latent variable of health outcomes for diabetes care.
Correlation of Outcome Variables
A correlation matrix of outcome variables at T1 (baseline) is presented in Table 3.
Table 3. Correlation Analysis of Four Outcome Variables: A1C, LDLC, PPH, and FC
Outcome Variables A1C-T1 LDLC-T1 PPH-T1 FC-T1
A1C-T1 Correlation 1
Sig. (2-tailed)
LDLC-T1 Correlation .196* 1
Sig. (2-tailed) .024
PPH-T1 Correlation .058 .091 1
Sig. (2-tailed) .512 .302
FC-T1 Correlation .041 -.074 -.657**
1
Sig. (2-tailed) .640 .399 .000
* Correlation is statistically significant at the 0.05 level (2-tailed).
** Correlation is statistically significant at the 0.01 level (2-tailed).
Correlations among these four outcome variables were relatively weak, with the
exception of moderate correlations between LDLC-T1 and A1C-T1 and FC-T1 and PPH-T1.
Thus the four outcome variables did not constitute a single common factor or construct enabling

78
the development of one common factor measurement model for the outcome evaluation.
Therefore each outcome variable was treated as an endogenous variable in the analysis.
The Intention-to-Treat Analysis: T-Tests
This analysis was performed in 2 steps. First, the experimental effect of health
educational intervention was analyzed using t-tests for each of the seven variables: Knowledge
(K), attitude (A), practice (P), and four outcome variables {glycated hemoglobin (A1C), low-
density 1ipoprotein cholesterol (LDLC), functional capacity (FC), and poor perceived health
(PPH)}. Analyses were performed for Time-1 (T1) and Time-2 (T2) separately without
controlling for the effects of other predictors. Second, the intention-to-treat analysis was
performed by regression analysis to determine the net experimental effect of health educational
intervention on each of the seven study variables (K, A, P, AIC, LDLC, FC and PPH) at T2,
holding the respective prior measure of the variable constant.
Experimental Effect of Health Educational Intervention on Knowledge Scores (H1)
An independent samples t-test was conducted to compare the knowledge scores for the
experimental and the control group. At T1 there was not a statistically significant difference
between the mean knowledge scores for the experimental group and those for the control group.
At T2, the mean knowledge score of the experimental group improved; there was a statistically
significant difference between the mean knowledge scores for the experimental group and those
for the control groups (p < 0.05). The difference between the T1 and T2 scores for the
experimental group showed no statistically significant difference from those of the control group.

79
Table 4. Experimental Effect on Knowledge Scores at T2 and Differences between T1 and T2
Variables Control Group N = 52 Experimental Group N = 87 P-value
Mean SD Mean SD
Knowledge-T1 29.38 4.47 30.24 5.11 0.319
Knowledge-T2 29.56 5.18 31.44 5.30 0.043*
Difference between T2 and T1 0.17 3.89 1.20 3.83 0.133
*Statistically significant at 0.05 or lower level.
Hypothesis H1: Health educational intervention directly improves knowledge about
diabetes is supported.
Experimental Effect of Health Educational Intervention on Attitude Scores (H2)
An independent samples t-test was conducted to compare the scores for attitude towards
diabetes for the experimental and the control groups. At T1 there was not a statistically
significant difference in the mean scores for attitude toward diabetes between the experimental
and the control group. At T2 there was not a statistically significant difference in the mean scores
for attitude toward diabetes between the experimental and the control group (p>0.05). The
difference between the T1 and T2 scores for the experimental group showed no statistically
significant difference from those of the control group.
Table 5. Experimental Effect on the Scores for Attitude toward Diabetes at T2 and Differences
between T1 and T2
Variables Control Group N=52 Experimental Group N=87 P-value
Mean SD Mean SD
Attitude-T1 20.63 4.22 20.23 4.22 0.585
Attitude-T2 20.40 4.01 20.48 3.81 0.908
Difference between T2 and T1 -0.23 3.55 0.25 3.75 0.454
*Statistically significant at 0.05 or lower level.
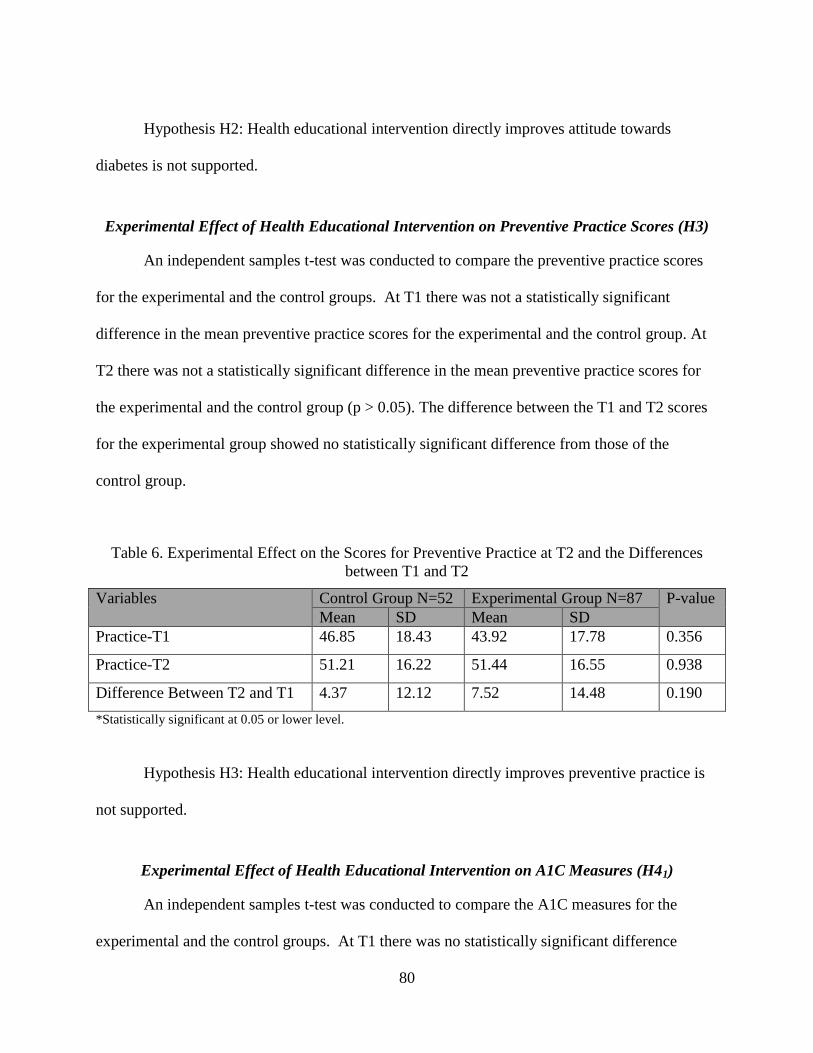
80
Hypothesis H2: Health educational intervention directly improves attitude towards
diabetes is not supported.
Experimental Effect of Health Educational Intervention on Preventive Practice Scores (H3)
An independent samples t-test was conducted to compare the preventive practice scores
for the experimental and the control groups. At T1 there was not a statistically significant
difference in the mean preventive practice scores for the experimental and the control group. At
T2 there was not a statistically significant difference in the mean preventive practice scores for
the experimental and the control group (p > 0.05). The difference between the T1 and T2 scores
for the experimental group showed no statistically significant difference from those of the
control group.
Table 6. Experimental Effect on the Scores for Preventive Practice at T2 and the Differences
between T1 and T2
Variables Control Group N=52 Experimental Group N=87 P-value
Mean SD Mean SD
Practice-T1 46.85 18.43 43.92 17.78 0.356
Practice-T2 51.21 16.22 51.44 16.55 0.938
Difference Between T2 and T1 4.37 12.12 7.52 14.48 0.190
*Statistically significant at 0.05 or lower level.
Hypothesis H3: Health educational intervention directly improves preventive practice is
not supported.
Experimental Effect of Health Educational Intervention on A1C Measures (H41)
An independent samples t-test was conducted to compare the A1C measures for the
experimental and the control groups. At T1 there was no statistically significant difference

81
between the A1C scores for the experimental and the control groups. At T2 there was no
statistically significant difference between the mean A1C measures for the experimental and the
control groups (p > 0.05). The difference between the T1 and T2 scores for the experimental
group showed no statistically significant difference from those of the control group.
Table 7. Experimental Effect on the A1C Measures at T2 and Differences between T1 and T2
Variables Control Group N = 45 Experimental Group N = 85 P-value
Mean SD Mean SD
A1C-T1 8.14 2.212 8.06 2.566 0.863
A1C-T2 8.2578 2.37396 7.5941 1.98190 0.113
Difference Between T2 and T1 0.1222 1.50905 -0.4635 1.66389 0.051
*Statistically significant at 0.05 or lower level.
H41 : Health educational intervention directly lowers glycated hemoglobin (A1C) is not
supported.
Experimental Effect of Health Educational Intervention on Low- Density Lipoprotein
Cholesterol (LDLC) Measures (H42)
An independent samples t-test was conducted to compare the low- density lipoprotein
cholesterol (LDLC) measures for the experimental and the control group. For both T1 and T2,
there was no statistically significant difference in the mean low density lipoprotein cholesterol
(LDLC) measures between the two groups (p>0.05). The difference between the T1 and T2
scores for the experimental group showed no statistically significant difference from those of the
control group.
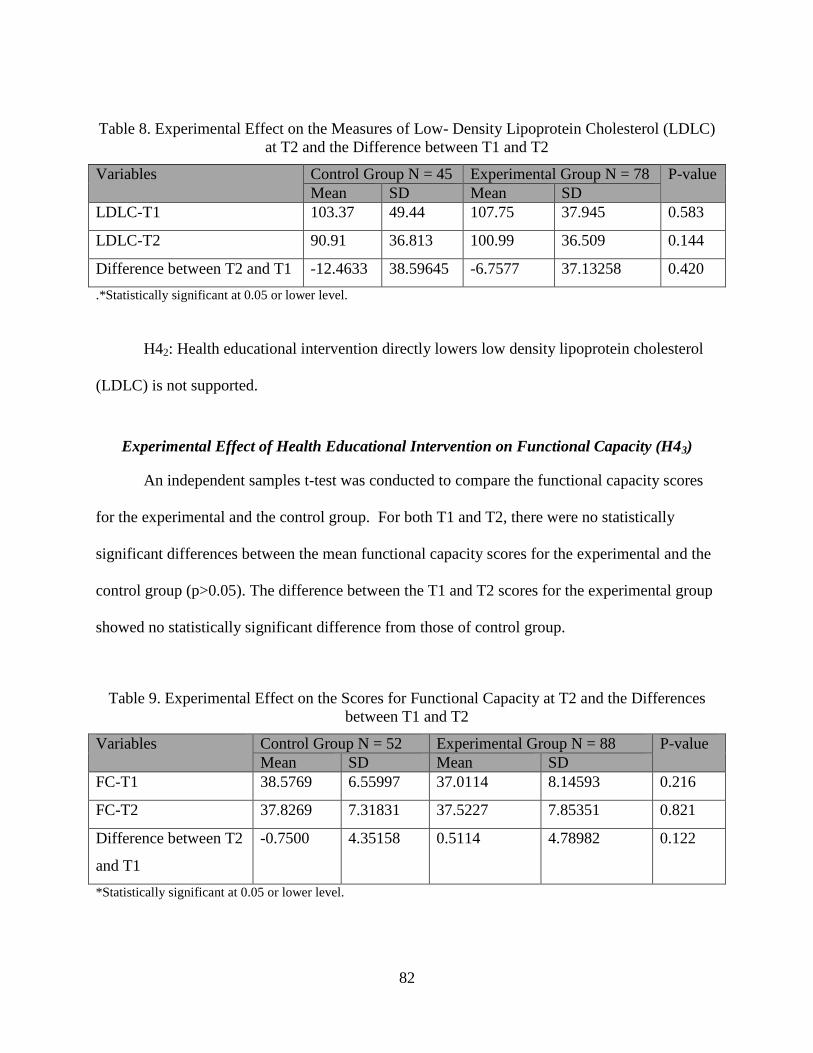
82
Table 8. Experimental Effect on the Measures of Low- Density Lipoprotein Cholesterol (LDLC)
at T2 and the Difference between T1 and T2
Variables Control Group N = 45 Experimental Group N = 78 P-value
Mean SD Mean SD
LDLC-T1 103.37 49.44 107.75 37.945 0.583
LDLC-T2 90.91 36.813 100.99 36.509 0.144
Difference between T2 and T1 -12.4633 38.59645 -6.7577 37.13258 0.420
.*Statistically significant at 0.05 or lower level.
H42: Health educational intervention directly lowers low density lipoprotein cholesterol
(LDLC) is not supported.
Experimental Effect of Health Educational Intervention on Functional Capacity (H43)
An independent samples t-test was conducted to compare the functional capacity scores
for the experimental and the control group. For both T1 and T2, there were no statistically
significant differences between the mean functional capacity scores for the experimental and the
control group (p>0.05). The difference between the T1 and T2 scores for the experimental group
showed no statistically significant difference from those of control group.
Table 9. Experimental Effect on the Scores for Functional Capacity at T2 and the Differences
between T1 and T2
Variables Control Group N = 52 Experimental Group N = 88 P-value
Mean SD Mean SD
FC-T1 38.5769 6.55997 37.0114 8.14593 0.216
FC-T2 37.8269 7.31831 37.5227 7.85351 0.821
Difference between T2
and T1
-0.7500 4.35158 0.5114 4.78982 0.122
*Statistically significant at 0.05 or lower level.

83
H43: Health educational intervention directly improves functional capacity (FC) is not
supported.
Experimental Effect of Health Educational Intervention on Poor Perceived Health Scores
(H44)
An independent samples t-test was performed to compare the poor perceived health
scores for the experimental and the control groups. For both T1 and T2, no statistically
significant differences were found in the mean scores for poor perceived health between the
experimental and the control group (p>0.05). The difference between the T1 and T2 scores for
the experimental group showed no statistically significant difference from those of the control
group.
Table 10. Experimental Effect on the Scores for Poor Perceived Health at T2 and the Differences
between T1 and T2
Variables Control Group N = 52 Experimental Group N=89 P-value
Mean SD Mean SD
PPH-T1 30.7500 21.05630 34.1910 24.44654 0.398
PPH -T2 32.1731 21.57679 34.6292 22.92447 0.532
Difference between T2
and T1
1.4231 20.34732 0.4382 22.19795 0.794
*Statistically significant at 0.05 or lower level.
H44: Health educational intervention directly decreases poor perceived health (PPH) is
not supported.
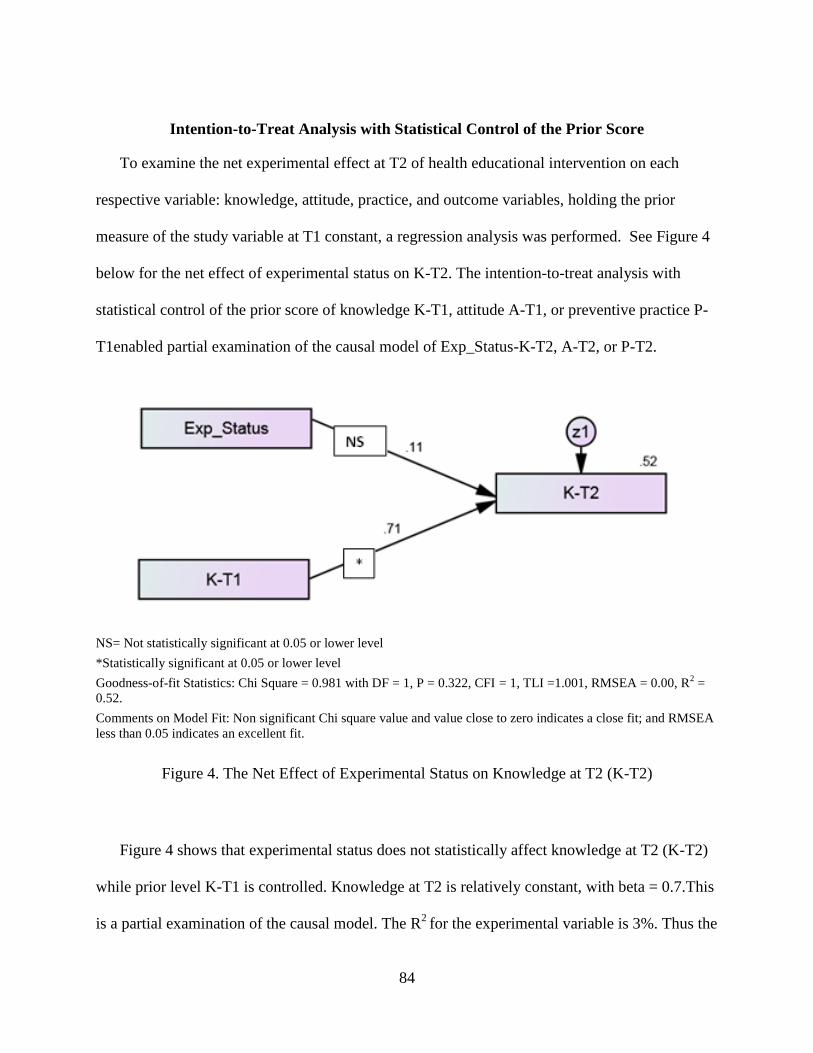
84
Intention-to-Treat Analysis with Statistical Control of the Prior Score
To examine the net experimental effect at T2 of health educational intervention on each
respective variable: knowledge, attitude, practice, and outcome variables, holding the prior
measure of the study variable at T1 constant, a regression analysis was performed. See Figure 4
below for the net effect of experimental status on K-T2. The intention-to-treat analysis with
statistical control of the prior score of knowledge K-T1, attitude A-T1, or preventive practice P-
T1enabled partial examination of the causal model of Exp_Status-K-T2, A-T2, or P-T2.
NS= Not statistically significant at 0.05 or lower level
*Statistically significant at 0.05 or lower level
Goodness-of-fit Statistics: Chi Square = 0.981 with DF = 1, P = 0.322, CFI = 1, TLI =1.001, RMSEA = 0.00, R2 =
0.52.
Comments on Model Fit: Non significant Chi square value and value close to zero indicates a close fit; and RMSEA
less than 0.05 indicates an excellent fit.
Figure 4. The Net Effect of Experimental Status on Knowledge at T2 (K-T2)
Figure 4 shows that experimental status does not statistically affect knowledge at T2 (K-T2)
while prior level K-T1 is controlled. Knowledge at T2 is relatively constant, with beta = 0.7.This
is a partial examination of the causal model. The R2
for the experimental variable is 3%. Thus the
85
experimental status accounts for very little variation in K-T2, i.e. experimental status does not
have much direct influence on knowledge. Similarly, experimental status accounts for very little
variation in attitude at T2 (A-T2) or in practice at T2 (P-T2). The results for these two sub-
models are shown in Appendix K. Health educational intervention has little influence in
changing any of the KAP components. These analyses of the net effects of experimental status
on knowledge, attitude, and practice found that knowledge and practice scores were strongly
related to their prior levels K1, P1 and relatively stable over time, while attitude scores at T1 and
T2 were moderately associated.
Since the intention-to-treat analysis with statistical control of the prior score using
regression analysis showed that health educational intervention has little direct causal influence
on each of the variables: knowledge (K), attitude (A), and practice (P), the concomitant effect of
experimental status, knowledge and attitude on practice was examined by analyzing the model
{(Exp_Status)-(K-T2)-(A-T2)-(P-T2)} in SEM.

86
Goodness-of-fit Statistics: Chi Square = 3.274, with DF = 1, P = 0.070, CFI=0.930, TLI = 0.302, RMSEA = 0.127,
R2 = 0.24,
Comments on Model Fit: Chi square/DF =3.274 (<4) p=0.070 suggests that the model fit reasonably well.
Figure 5. Experimental Status, Knowledge (K-T2), Attitude (A-T2), and Practice (P-T2) at T2
Model
Table 11. Experimental Effect on Practice at T2 via Knowledge and Attitude at T2
Indicator/Item Standardized
Parameter or Factor
Loading
Unstandardized
Factor Loading
Standard
Error (S.E)
P value/
Significance
K-T2 <---
Exp_Status
.175 1.922 .915 .036*
A-T2 <---
Exp_Status
.006 .046 .672 .946
P-T2 <---
Exp_Status
.039 1.336 2.545 .599
P-T2 <--- K-T2 -.204 -.635 .233 .006*
P-T2 <--- A-T2 .449 1.924 .315 ***
NS = Not statistically significant at 0.05 or lower level.
*Statistically significant at 0.05 or lower level.

87
Figure 5 illustrates the model of experimental status, knowledge, attitude, and practice at
T2. This is not a full examination of the model, since prior levels are not controlled. The model
shows the concomitant effects of experimental status, knowledge and attitude, on practice. The
experimental status has no direct impact on the practice of preventive self-care, controlling for
knowledge and attitude at T2. The experimental variable has an indirect effect on self-care
practice through knowledge. Knowledge at T2 has a negative impact on self-care practice that is
statistically significant, with β = -0.204.The impact of the experimental variable on attitude at T2
is not statistically significant. The impact of attitude at T2 (A-T2) on practice at T2 (P-T2) is
positive and statistically significant, with β = 0.449. The impact of attitude (A-T2) is more
dominant than the impact of knowledge. Positive attitude increases the practice of self-
management and vice versa.
H5: Health educational intervention also indirectly improves preventive practice via
knowledge is supported.
Next, the net experimental effect on each of the four outcome variables at T2, holding the
prior measure constant, was examined by regression analysis. The net effect of experimental
status on A1C at T2, holding A1C at T1 constant, is shown in Figure 6 below.

88
NS = Not statistically significant at 0.05 or lower level
*Statistically significant at 0.05 or lower level
Goodness-of-fit Statistics:
Chi Square = 0.037 with DF = 1, P = 0.848, CFI = 1, TLI = 1.053, RMSEA = 0.00, R2 = 0.58.
Comments on Model Fit: Chi square/DF =0.037 (<4) p=0.848 suggests that the model fit reasonably well. RMSEA
is less than 0.05 indicates an excellent fit.
Figure 6. The Net Effect of Experimental Status on Glycated Hemoglobin (A1C) at T2
The impact of experimental status on A1C at T2 (A1C-T2), holding prior A1C constant,
is statistically significant (p<0.05). There is a direct effect of experimental status on A1C.The
impact of A1C at T1 on A1C at T2 is statistically significant, with β = 0.75. H41: Health
educational intervention directly lowers glycated hemoglobin (A1C) is supported.
The net effect of experimental status on each of these outcomes: low-density lipoprotein
cholesterol, functional capacity, and poor perceived health at T2, holding their respective prior
levels constant, was not statistically significant and is illustrated in figures 13, 14 and 15 in
appendix K. The impact of LDLC at T1 on LDLC at T2 is statistically significant, β = 0.56. The
impact of functional capacity (FC) at T1 on functional capacity at T2 is statistically significant,

89
with β = 0.82.The influence of poor perceived health at T1 on poor perceived health at T2 is
statistically significant, with β = 0.557.
These analyses examining net effect of the experimental variable on each of the four
outcome variables when holding prior levels constant demonstrated there is no direct effect of
experimental status on outcome variables, with the sole exception of the direct effect on glycated
hemoglobin (A1C). Thus an indirect causal effect of health education mediated via the change
variables of DK, DA, and DP on outcome variables is assumed in the difference-in-differences
analysis. A difference-in-differences analysis of Expt_Status, change in knowledge (DK), change
in attitude (DA), change in practice (DP), and each of the change outcome variables: change in
glycated hemoglobin (DA1C), change in low- density lipoprotein cholesterol (DLDLC), change
in functional capacity (DFC), and change in poor perceived health (DPPH) was conducted.
Difference-in-Differences Analysis
The causal model of experimental status and differences in knowledge, attitude, practice
and outcomes over time (T2-T1) is an acceptable fit. This model enabled examination of the
direct or indirect effects of health educational intervention on outcome indicators.
Effect of Experimental Status and Differences in Knowledge, Attitude, and Practice on
Difference in A1C at T2
Table 12 below shows that the effects of the experimental variable on change in
knowledge (DK), on change in attitude (DA), and on change in practice (DP) are not statistically
significant. Change in knowledge (DK) and change in attitude (DA) do not have statistically
significant effects on change in practice (DP).

90
Change in practice (DP) has a statistically significant effect on change in the outcome for
A1C (DA1C). Change in practice (DP) has no statistically significant effect on change in any of
the other outcome variables, DLDLC, DPPH, and DFC, as illustrated in Figures 8, 9, and 10 and
the accompanying tables.
NS = Not statistically significant at 0.05 or lower level
*Statistically significant at 0.05 or lower level
Goodness of Fit Statistics: Chi Square = 5.338 with DF = 4, P = 0.254, TLI = 4.247, RMSEA = 0.051, R2 = 0.52.
Comments on Model Fit: Non significant Chi square value and Chi Square/DF= 1.355, p = 0.254 suggests that the
model fit reasonably well; RMSEA less than 0.08 indicates a close fit.
Figure 7. The Net Effect of Experimental Status and Differences in Knowledge (DK), Attitude
(DA), and Practice (DP) on Difference in Glycated Hemoglobin (DA1C)

91
Table 12. The Net Effect of Experimental Status and Differences in Knowledge, Attitude, and
Practice on Difference in A1C at T2
Indicator/Item Standardized
Parameter or
Factor Loading
Unstandardized
Factor Loading
Standard
Error (S.E)
P Value/
Significance
DK <---Expt_Status .139 1.137 .714 .111
DA <--- Expt_Status .046 .357 .675 .597
DP <--- Expt_Status .072 2.109 2.578 .413
DP <--- DK -.023 -.083 .316 .793
DP <--- DA .080 .304 .331 .358
DA1C <--- DP -.173 -.020 .010 .047*
NS = Not statistically significant at 0.05 or lower level.
*Statistically significant at 0.05 or lower level.
H6: The influence of health education on health care outcomes is not direct, but is
mediated via knowledge, attitude, and practice is not supported.

92
NS = Not statistically significant at 0.05 or lower level
*Statistically significant at 0.05 or lower level
Goodness of Fit Statistics: Chi Square = 4.329 with DF = 4, P = 0.363, TLI = 1.164, RMSEA = 0.025, R2 = 0.00.
Comments on Model Fit: Non significant Chi square value and Chi Square/DF=1.082, p = 0.363 suggests that the
model fit reasonably well; RMSEA less than 0.05 indicates an excellent fit.
Figure 8. The Net Effect of Experimental Status,and Differences in Knowledge (DK), Attitude
(DA), and Practice (DP) on Difference in Low-Density Lipoprotein Cholesterol (DLDLC)
Table 13. The Net Effect of Experimental Status and Differences in Knowledge (DK), Attitude
(DA), and Practice (DP) on Difference in low-density lipoprotein cholesterol (DLDLC)
Indicator/Item Standardized
Parameter or Factor
Loading
Unstandardized
Factor Loading
Standard
Error(S.E)
P Value/
Significance
DK <--- Exp_Status .079 .629 .707 .374
DA <--- Exp_Status .049 .366 .665 .582
DP <--- Exp_Status .068 1.967 2.559 .442
DP <--- DK -.065 -.236 .321 .462
DP <--- DA .081 .313 .339 .356
DLDLC <--- DP .024 .065 .247 .793
NS = Not statistically significant at 0.05 or lower level.
*Statistically significant at 0.05 or lower level.

93
NS = Not statistically significant at 0.05 or lower level
*Statistically significant at 0.05 or lower level
Goodness of Fit Statistics: Chi Square = 3.984 with DF = 4, P = 0.408, TLI = 0.966, RMSEA = 0.00, R2 = 0.02.
Comments on Model Fit: Non significant Chi square value and Chi Square/DF = 0.996, p = 0.408, suggests that the
model fit reasonably well. CFI greater than 0.95 is good; RMSEA less than 0.05 indicates an excellent fit.
Figure 9. The Net Effect of Experimental Status and Differences in Knowledge (DK), Attitude
(DA), and Practice (DP) on Difference in Poor Perceived Health (DPPH)
Table 14. The Net Effect of Experimental Status and Differences in Knowledge (DK), Attitude
(DA), and Practice (DP) on Difference in Poor Perceived Health (DPPH)
Indicator/Item Standardized
Parameter or
Factor Loading
Unstandardized
Factor Loading
Standard
Error(S.E)
P Value/
Significance
DK <--- Exp_Status .129 1.031 .671 .124
DA <--- Exp_Status .057 .433 .637 .497
DP <--- Exp_Status .090 2.580 2.424 .287
DP <--- DK .001 .004 .305 .991
DP <--- DA .121 .459 .318 .149
DPPH <--- DP -.146 -.226 .130 .082
NS = Not statistically significant at 0.05 or lower level.
*Statistically significant at 0.05 or lower level.
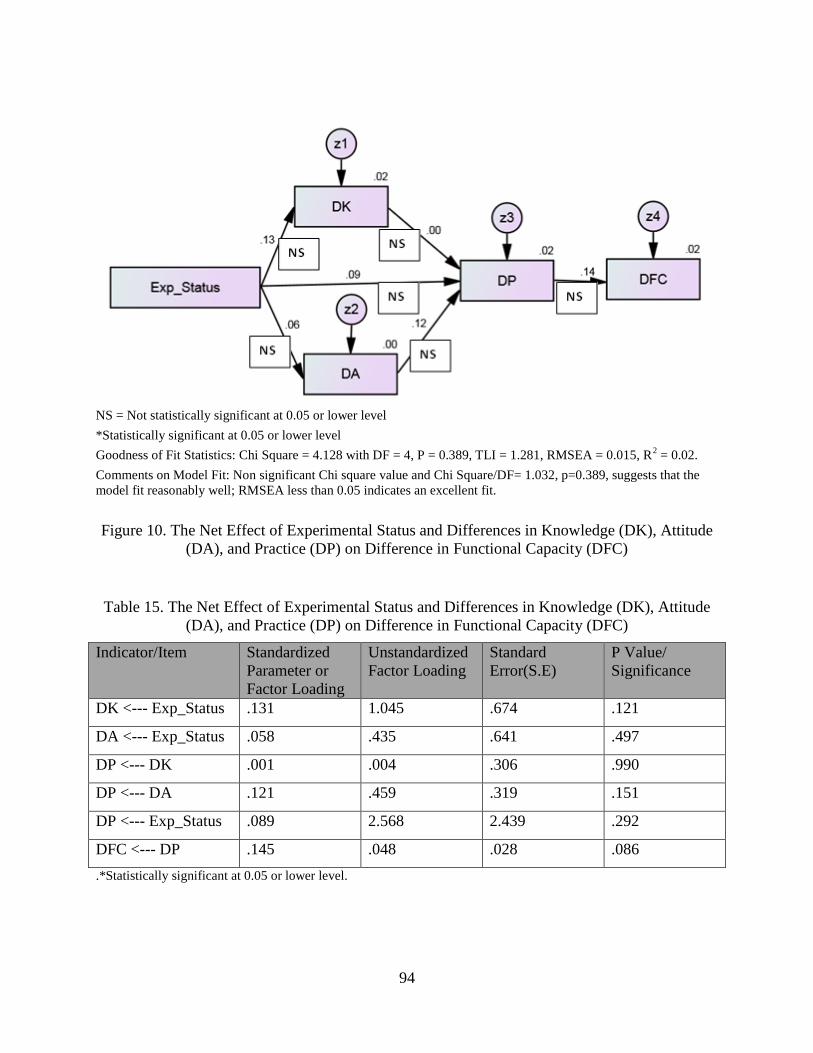
94
NS = Not statistically significant at 0.05 or lower level
*Statistically significant at 0.05 or lower level
Goodness of Fit Statistics: Chi Square = 4.128 with DF = 4, P = 0.389, TLI = 1.281, RMSEA = 0.015, R2 = 0.02.
Comments on Model Fit: Non significant Chi square value and Chi Square/DF= 1.032, p=0.389, suggests that the
model fit reasonably well; RMSEA less than 0.05 indicates an excellent fit.
Figure 10. The Net Effect of Experimental Status and Differences in Knowledge (DK), Attitude
(DA), and Practice (DP) on Difference in Functional Capacity (DFC)
Table 15. The Net Effect of Experimental Status and Differences in Knowledge (DK), Attitude
(DA), and Practice (DP) on Difference in Functional Capacity (DFC)
Indicator/Item Standardized
Parameter or
Factor Loading
Unstandardized
Factor Loading
Standard
Error(S.E)
P Value/
Significance
DK <--- Exp_Status .131 1.045 .674 .121
DA <--- Exp_Status .058 .435 .641 .497
DP <--- DK .001 .004 .306 .990
DP <--- DA .121 .459 .319 .151
DP <--- Exp_Status .089 2.568 2.439 .292
DFC <--- DP .145 .048 .028 .086
.*Statistically significant at 0.05 or lower level.

95
In summary, the difference-in-differences analyses of experimental effect and differences
in knowledge (DK), attitude (DA) and practice (DP) on differences in outcomes shows that
difference in practice affects only the difference in glycated hemoglobin (DA1C), but not
differences in any of the other outcomes: low-density lipoprotein cholesterol, functional
capacity, or poor perceived health. Self-care or lack thereof affects A1C, which is the most
important indicator of the control of diabetes. The data from this experiment do not support a
causal path of experimental status, knowledge, attitude, practice and outcomes.

96
CHAPTER FIVE: SUMMARY, IMPLICATIONS AND CONCLUSIONS
Introduction
Although a majority of diabetes self-management programs have been shown to improve
knowledge, attitude, practice, and health care outcomes, the underlying causal mechanisms for
improvement attributable to health education have not been systematically explored. The
literature has not adequately addressed how diabetes educational intervention may affect diabetes
care outcomes. The purpose of the present study was to identify the causal mechanisms
responsible for improved knowledge, attitude, practice and outcomes so that educational
interventions can be tailored efficiently and effectively to the groups of patients who are most
likely to benefit from self-care management. The study used the knowledge, attitude, practice
and outcome (KAP-O) framework. More specifically, the purpose of the study was to examine
the causes of variation in the outcomes of glycated hemoglobin (A1C), low-density lipoprotein
cholesterol (LDLC), functional capacity (FC), and poor perceived health (PPH).
An experimental study with a randomized control trial design involving 141 participants
was conducted. The experimental group (N = 87) and control group (N = 52) were comparable in
terms of demographics and major diagnoses. The health educational intervention was a predictor
variable of the endogenous variables knowledge, attitude, practice and outcomes. The study
variables were measured pre-and post- intervention, using reliable and valid instruments. The
study employed a newly developed instrument to assess the three components of attitude:
cognition, affect, and behavioral tendency. Multiple analytic strategies were applied to the
analysis of the experimental data.
The study sought answers to the following research questions: 1) Does health education
directly affect knowledge, attitude, practice of self-care, and health care outcomes? 2) Based on

97
the KAP model, what is the effect of health education on knowledge, attitude, and practice? 3)
Based on the theoretical specification of the KAP-O model, does health education affect health
care outcomes indirectly through improved changes in knowledge, attitude and self-care
practice?
Statistical Procedures
The Intention-to-Treat Analysis: Independent Sample T-Tests
First, the experimental effect of health educational intervention was analyzed using
independent sample t-tests for each of the seven variables: knowledge (K), attitude (A), practice
(P), and four outcome variables {glycated hemoglobin (A1C), low-density 1ipoprotein
cholesterol (LDLC), functional capacity (FC), and poor perceived health (PPH)}. The analysis
was performed separately for Time-1 (T1) and Time-2 (T2) without controlling for the effects of
other predictors.
The Intention-to-Treat Analysis with Statistical Control of the Prior Score
Second, the intention-to-treat analysis was performed by regression analysis to determine
the net experimental effect at T2 of health educational intervention on each of the seven study
variables knowledge (K), attitude (A), practice (P), and the four outcomes, holding the respective
prior measures of the variables constant.
Causal Modeling of KAP Relationships in {(Exp_Status)-(K-T2)-(A-T2)-(P-T2)} Model
This model of {(Exp_Status)-(K-T2)-(A-T2)-(P-T2)} was analyzed in SEM to determine
the KAP relationships of experimental status, knowledge, attitude, and practice and the
relationship of knowledge and attitude to preventive practice.
98
Difference-in-Differences Analysis
The difference in differences analysis of the model {(Exp_Status)-(DK)-(DA)-(DP)} with
each difference in the outcome variables: glycated hemoglobin (DA1C), low-density lipoprotein
cholesterol (DLDLC), functional capacity (DFC), and poor perceived health (DPPH) was
analyzed in SEM. This model enables examination of the direct or indirect effects of health
educational intervention on the change in each outcome variable which were analyzed separately
since the four outcomes did not constitute a single latent construct.
Summary of Major Findings
Finding Related to Justification for Treating Outcome Variables as Separate Constructs
Pearson correlation analysis of four outcome variables: glycated hemoglobin (A1C), low-
density lipoprotein cholesterol (LDLC), poor perceived health (PPH), and functional capacity at
T1 was performed. The inter-correlations among the outcome variables are relatively weak, with
the exception of the following pairs of variables: (LDLC-T1 and A1C-T1) and (FC-T1 and
PPH-T1), which have moderate correlations. Thus, these four outcome variables do not
constitute a common factor or construct that enables the development of a single common factor
measurement model for the outcome evaluation. Therefore, independent analysis of the
experimental effect on each outcome variable was performed in SEM.
There have been no comprehensive instruments to measure the three components of
patients’ attitudes: cognition, affect, and behavioral tendency. Therefore, this study created an
instrument that could be used to assess a patient’s attitude and provide appropriate counseling to
improve each of the three components of attitude.

99
Findings of the Intention-to-Treat Analysis: Independent Sample T-Tests
Findings of the analysis through T-tests of the experimental effect of health educational
intervention on knowledge, attitude, practice (KAP), and outcome variables {glycated
hemoglobin (A1C), low-density 1ipoprotein cholesterol (LDLC), functional capacity(FC), and
poor perceived health (PPH)} without controlling for the effect of other predictors are as follows.
At T2, the mean knowledge score of the experimental group improved; there was a
statistically significant difference between the mean knowledge scores for the experimental
group (M = 31.44, SD = 5.30) and those for the control group (M = 29.56, SD = 5.18); (p <
0.05).
Hypothesis H1: Health educational intervention directly improves knowledge about
diabetes is supported.
Health education had no statistically significant direct effect on attitude, preventive
practice, and the outcome variables.
Findings of the Intention-to-Treat Analysis on KAP Components and Outcome Variables with
Statistical Control of the Prior Score
Experimental status did not have statistically significant effect on knowledge, attitude, or
practice at T2 with their prior levels controlled. The analysis showed that the experimental
variable did not contribute much to the variation at T2 in knowledge, attitude, or practice scores;
i.e. health educational intervention had little direct causal influence on any of the variables:
knowledge (K), attitude (A), and practice (P).
The results of the analyses examining the net effect of experimental status on each of the
four outcome variables are as follows: The effect of experimental status on A1C at T2 (A1C-T2)

100
was statistically significant. There was a direct causal effect of experimental status on glycated
hemoglobin (A1C).
H41: Health educational intervention directly lowers glycated hemoglobin (A1C) is
supported.
The net effect of experimental status on each of the outcomes: low-density lipoprotein
cholesterol, functional capacity, and poor perceived health at T2, holding their respective prior
levels constant, was not statistically significant and is illustrated in figures 13, 14 and 15 in
appendix K. This analysis examining the net effect of the experimental variable on each of the
four outcome variables when holding the prior levels constant demonstrated that there was no
direct effect of experimental status on outcome variables, with the sole exception of the direct
effect on glycated hemoglobin (A1C). Thus an indirect causal effect of health education
mediated via the change variables of DK, DA, and DP on outcome variables was assumed in the
difference-in-differences analysis.
The prior levels of all outcome variables at T1 are strongly associated with their
respective levels at T2, with β coefficients of 0.752 for A1C, 0.815 for FC, 0.558 for LDL, and
0.557 for poor perceived health.
Findings of the Causal Modeling of KAP Relationships in {(Exp_Status)-(K-T2)-(A-T2)-(P-
T2)} Model
This was not a full examination of the causal model, since the prior levels were not
statistically controlled. The finding showed a concomitant effect of experimental status,
knowledge and attitude on practice. Experimental status had no direct effect on the practice of
preventive self-care, controlling for knowledge and attitude, at T2. However, the experimental
status had an indirect effect on practice through knowledge. Knowledge at T2 had a statistically

101
significant effect on practice of self-care, with β = -0.204. The effect of experimental status on
attitude at T2 was not statistically significant. The effect of attitude at T2 (A-T2) on practice at
T2 (P-T2) was statistically significant, with β = 0.449. The effect of attitude (A-T2) was greater
than the effect of knowledge on preventive practice of self-care.
Findings of the Difference-in-Differences Analysis
The causal model of experimental status, differences in knowledge (DK), attitude (DA),
and practice (DP) and differences in outcomes over time (T2-T1) has a reasonable fit to the data
as illustrated by GOF statistics. This model enabled examination of the direct or indirect effects
of health educational intervention on the change in each outcome variable-analyzed separately
since the four outcomes in this study did not constitute a single latent construct. The effects of
experimental status on the scores for differences in knowledge (DK), attitude (DA), and practice
(DP) and scores for differences in each outcome (DA1C), (DLDLC), (DFC) and (DPPH) were
analyzed separately between the two time points, T1 and T2. The difference in practice scores
(DP) directly affected only the difference in glycated hemoglobin (DA1C); the difference in
practice scores (DP) did not affect any of the differences in scores for the other outcomes:
(DLDLC), (DFC) and (DPPH). The data from this experiment do not support a strong causal
path of experimental effects on outcomes via knowledge, attitude, and practice of self-care. The
lack of variability in the patients in the practice with a single provider may have prevented an
adequate demonstration of the viability of the proposed causal model.
Literature Supporting Finding One
Finding 1: Several studies support the concept that health education improves knowledge
(Adepu et al., 2007; Baradaran et al., 2006; Garrett et al., 2005; Hogue et al., 2003; Holmes et

102
al., 2012; Malathy et al., 2011; Norris et al., 2001; Vimalavathini et al., 2008). These studies are
described below.
Norris et al. (2001) reviewed 72 studies focusing on effectiveness of self-management
education for a period of six months or less. The findings of the studies were that self-
management education improves knowledge.
A study of a community pharmacy-based program of diabetes education based on the
American Diabetes Association Standards with 381 participants by Hogue et al. (2003) found
improvement in diabetes knowledge scores.
Evaluation of an educational program on the knowledge, attitude and practices (KAP) of
a single-group, prospective pre- and post- intervention in 67 Type 1 diabetic patients who were
receiving free monthly supplies of human insulin at an outpatient clinic of a tertiary care hospital
was undertaken by Vimalavathini et al. (2008). This was a prospective interventional study using
a convenience sample. Diabetes knowledge improved after the intervention.
Holmes et al. (2012) conducted a single-group prospective pre- and post- intervention
study using a postal questionnaire with ninety-seven diabetic women, aged 18–40 years (Type 1,
n = 89; Type 2, n = 8), in Ireland. At post-intervention, knowledge about pregnancy planning
increased significantly, as did knowledge of pregnancy-related risks after viewing the DVD.
Malathy et al. (2011) evaluated a custom-designed counseling program for the effect of
counseling on knowledge in the counseled group (n = 137) vs. a control group (n = 70), in a
randomized sample of Type 2 diabetes patients in South India. While the knowledge scores of
the test group patients improved significantly (P < 0.0001), there was no statistically significant
change in the knowledge scores of the control group.

103
A multi-site, prospective study of South Asians in Scotland randomly selected by
Baradaran et al. (2006) evaluated a custom-tailored educational intervention by doing a group
comparison of change in diabetes knowledge between the test, and the ethnic control and white
control groups. Only 101 patients completed the study. The test group had low KAP at baseline.
There was a significant improvement in scores for knowledge in the intervention group at post-
intervention.
Evaluation of the effectiveness of a small-group diabetes educational intervention was
undertaken by Garrett et al. (2005) using random assignment of volunteers into an intervention
group (n = 382) that participated in the small-group learning activity and a control group (n =
382) that received a diabetes self-care book. There was a significant change in knowledge in the
intervention group as compared to the control group after adjusting for demographic differences
between the groups.
Adepu et al. (2007) evaluated the effect of pharmacist-provided patient counseling on
patients' perception about diabetes management and quality of life in Type 2 diabetes patients
from two community pharmacies. This was a randomized, prospective controlled study of Type
2 diabetes patients in Calicut, Kerala, India. A total of 60 Type 2 diabetes patients were
randomized into test (n = 32) and control (n = 28) groups. Knowledge score in the test group
markedly improved.
Literature Not Supporting Finding Two
Finding 2: Health educational intervention had little causal influence on any of the KAP
components: knowledge (K) attitude (A) and practice (P). No studies have examined the causal
influence of health education on knowledge, attitude, and practice. However, a few studies using

104
a test-control, random assignment, pre-post design have noted increases in knowledge, attitude
and practice scores. Such studies used relatively short instruments to assess knowledge, attitude
and practice. The questionnaires had few items testing attitude.
Malathy et al. (2011) evaluated a custom-designed counseling program and assessed
effects of counseling on knowledge and practice in a randomized sample of 207 Type 2 diabetes
patients in South India with an intervention group (n = 137) and a control group (n = 70). The
knowledge scores and attitude scores in the post-intervention assessment of the test-group
patients improved significantly (p<0.0001). The practice scores showed no improvement
(p<0.06), since the baseline practice scores were relatively high. No significant changes in the
control group’s KAP scores were observed.
A multi-site prospective study of randomly selected Asians in Scotland by Baradaran et
al. (2006) evaluated a custom-tailored educational intervention for South Asians by comparing
the changes in knowledge between the test group, and the ethnic control and white control
groups. Only 101 patients completed the study. The test group had low KAP scores at baseline.
There were significant improvements in scores for knowledge (+12.5%), serious attitudes toward
diabetes (+13.5%), and practice (+20.0%) in the intervention group. Differences in KAP
improvements between the members of the two control groups (white & ethnic) were not
significant.
Evaluation of the effectiveness of a small-group diabetes educational intervention was
undertaken by Garrett et al. (2005). Random assignment of volunteers into an intervention group
(n = 382) and a control group (n = 382) was made to investigate the effect of a learning activity
with a diabetes self-care book. Adjusting for demographic differences between the groups, there
were significant changes in knowledge, feeling of control and behavior related to self-

105
management of diabetes in the intervention group as compared to the control group. Although
the study was based on a randomly selected sample, the volunteers had higher motivation than
would general population members, which may introduce a selection bias. Hence the study
findings were limited in their generalizability.
Adepu et al. (2007) evaluated the effect of pharmacist-provided patient counseling on
patients' perception about disease management and quality of life in Type 2 diabetes patients
from two community pharmacies, in a randomized, prospective controlled study of Type 2
diabetes patients in India. A total of 60 Type 2 diabetes patients were randomized into the test
group (n = 32) and the control group (n = 28). Knowledge, attitude and practices scores
markedly improved (P < 0.05) in the test group patients.
Studies Reporting Improvement in A1C Post-Self-Management Education
Finding 3: There is a direct causal effect of experimental status on glycated hemoglobin
(A1C), an indicator of the control of diabetes. No studies have studied the causal influence of
health education on outcomes such as glycated hemoglobin (A1C).
Studies Supporting the Indirect Effect of Experimental Status on Preventive Practice via
Knowledge and Attitude
Finding 4: Experimental status had an indirect effect on preventive practice via
knowledge (K-T2). The effect of attitude at T2 (A-T2) on practice at T2 (P-T2) was statistically
significant, with β = 0.449.The effect of attitude (A-T2) was greater than the effect of
knowledge. No studies reviewed here have studied the indirect causal effect of experimental
status on preventive practice via attitude and knowledge.

106
Studies Supporting the Causal Effect of Preventive Practice on Glycated Hemoglobin
(A1C)
Finding 5: Change in practice statistically significantly affects change in the outcome of
glycated hemoglobin (A1C). The greater the preventive practice, the more lowering of glycated
hemoglobin (A1C), indicating better control of diabetes. No studies reviewed here have studied
the causal influence of preventive practice on the outcome of glycated hemoglobin (A1C).
Other Findings
Finding 6: The effect of attitude is twice as influential as the effect of knowledge on
preventive practice. Patients with better attitude engage in more preventive behavior, so the
focus of health education should be to increase positive attitude. No previous studies have
focused on whether knowledge or attitude is a more dominant factor influencing preventive care.
Literature Related to Finding 7
Finding 7: Experimental status improves knowledge, and knowledge has a negative effect
on preventive practice. This finding suggests that more knowledge about diabetes may not
improve preventive practice. It is possible that patients rely more on medications than on
preventive practice to control diabetes.
Several of the KAP studies summarized earlier showed that high knowledge and attitude
scores are not necessarily associated with preventive practice. Such studies are described below.
A cross-sectional descriptive community study by Nafissi et al. (2012) in Iran of 650
females aged more than 18 years with no breast complaints found that 30.8% of respondents
knew the importance of breast self-exam (BSE). Although 59.9% of these participants were able
to do BSE, only 12.9% of them practiced BSE regularly.

107
Kharkar and Bowalekar ( 2012), studying a random sample of 870 medical practitioners
from north, south-east and west regions of India, reported that a total of 59.2% recognized the
importance of reporting adverse drug reactions (ADR) to government centers. They were
familiar with the procedure of reporting ADR. However, only 18.5% of physicians reported the
observed ADR to government ADR centers.
Van Geertruyden et al. (2005), in a cross-sectional malaria survey of 1432 pregnant
women attending six health centers in Rwanda, found that most knew that malaria might have
serious consequences for their pregnancy and that insecticide-treated bed nets are useful for
malaria prevention. However, only 8.3 % slept under such a net because the vast majority could
not afford the price.
Romanian patients with smear-positive TB are treated in hospital for 2 months until they
are smear negative and then released. These patients must continue with medication for another
four months to avoid the spread of TB. Berger and Bratu (2006) surveyed 151 Romanian TB
patients. Although a high number acknowledged that it was necessary to continue treatment after
discharge from the hospital, adherence to the medication regimen was not high, because the
doctors’ fees and medications were unaffordable.
Lin et al. (2011), in a telephone survey of 5,300 Chinese citizens, found that although
50% knew prevention and control strategies for pandemic influenza, and 72% knew that
A/H1N1 vaccination was available free of charge, nevertheless the immunization rate for the flu
was only 7.5 % .
Maina et al. (2011) conducted a cross-sectional study of 1982 general population
respondents randomly selected from provinces in Kenya with high prevalence of diabetes and

108
found that only 27% of the respondents had good knowledge of diabetes. However, practices to
manage diabetes in 49% of these respondents were poor.
Abubakari et al. (2011), in a cross-sectional study of 359 diabetes patients in London,
found that perceiving diabetes to have severe consequences was associated with poor self-
management in both African-origin (black-African and black-Caribbean) and European-origin
(white-British) patients with Type 2 diabetes.
The Contribution of the Study
Theoretical Implications
The study makes a novel use of the KAP (Knowledge, Attitude, and Practice) and adds
another construct outcome to form the KAP-O framework. This framework has been noted in a
paper by Wan (2014) in the International Journal of Public Policy. The data of this study did not
support a strong causal path of experimental effects on outcomes via knowledge, attitude, and
practice of self-care. However, other evaluation studies of diabetes education using test- control
,random assignment and pre-post education showed improvement in knowledge, attitude, and
practice scores (Baradaran et al., 2006; Garrett et al., 2005; and Adepu at et., 2007). The study
by Adepu et al.in addition showed improvement in healthcare outcomes of quality of life scores
and capillary blood glucose level. A study using test-control random assignment and pre- post-
design by Malathy et al. (2011) showed improvement in knowledge, attitude, and post prandial
glucose level. A prospective pre-post evaluation study of an educational program for a single
group of 67 Type 1 diabetes patients by Vimalavathini et al. (2008) resulted in improved
knowledge, improved attitude, and improvement in some aspects of practice.

109
These studies did not investigate causal relationships among the components of
knowledge, attitude, practice, and healthcare outcomes and the sample sizes ranged from 60 to
764 patients.
Lack of support for the KAP-O model in this study could be attributed to lack of
variability in the sample due to relatively homogenous patient population selected from a single
medical practice with a single provider. The participants in both the control and the
experimental groups had relatively high knowledge scores at baseline with duration of diabetes
of 8-10 years and had picked up knowledge from interaction with healthcare providers.
The viability of the KAP-O framework needs to be determined using a larger
representative national sample of 100,000 from multiple centers with multiple providers and a
diverse population of Type 2 patients. Also the trajectory of change in each outcome variable
could more easily be delineated by extending the length of the experimental study to 1-2 years
with four or more outcome assessments. Also, knowledge, attitude, and preventive practice need
to be assessed at pre-intervention. The knowledge gaps thus identified need to be addressed
continuously and simultaneously with enhancement of attitude rather than a one shot deal
administration of education right after pre-assessment of knowledge, attitude, and practice.
This study evaluates the outcomes measurement model and causal relationships among
the components of KAP-O (knowledge, attitude, practice, and outcome) in a behavioral system
model.

110
Methodological Implications
Multiple analytical strategies were employed in the analysis of data generated from a
randomized clinical trial to yield solid evidence regarding the assumed relationships among the
KAP-O components under the influence of the educational intervention.
The study confirms the utility of structural equation modeling (SEM) as a valuable
statistical technique to study such complex relationships as those between changes in knowledge,
attitude and practice, and health care outcomes. Most previous studies evaluate educational
programs and measure changes in outcomes. No previous studies sought to determine the causal
mechanism of how health education results in improved outcomes.
Practical Implications
Non-availability of technical staff to help patients with limited technical literacy access
the tutorials may have discouraged patients from using the web-based program and led them to
read the printed text instead (The print content was identical to the web-based context). In this
study, technology was not fully utilized.
However in a tech-savvy population, the study findings can change the service delivery
modality of diabetes education, in that Diabetes Tutor is noted as a web-based, self-management
and educational tool that can broaden access to education.
This study is unique as the first study evaluating the innovative Diabetes Tutor in clinical
practice and as a tool to influence patient health outcomes. There is a need to expand the study in
multiple practices with a diverse population. The dose-response relationship between health
education and outcomes is still unknown.

111
Policy and Practical Implications
From a policy-relevant perspective, the study findings can have a useful influence on the
funding allocation for diabetes education. Identifying the interventions that are more effective
can help allocate resources wisely. Thus far, causal analysis of the effects of diabetes education
has been limited. This study advances the causal analysis of one type of diabetes education,
pointing out where education is most effective and where it is not.
Most diabetes education focuses on improving knowledge, whereas this study showed
that attitude is a more dominant factor than knowledge in influencing preventive practice.
Therefore, it would be necessary to assess the three components of the attitude of a patient with
the purpose of encouraging development of positive attitude; or suggesting behavior changes to
patients that may compensate for poor attitude. Health education for diabetes control should also
include at regular intervals interaction between diabetes educator and patient to yield strategies
for attitudinal change. This implication can inform policy.
The gaps in diabetes patients’ knowledge about their disease should be assessed and
addressed through booster doses of education, since the effects of education at a single point
decrease with time. The effects of education can be reinforced by booster sessions to sustain
knowledge. Since Healthy Tutor can be accessed on desktop, tablet, and mobile computer
interfaces, its tutorials can easily be repeated. Further, Healthy Tutor can inform the provider of
knowledge deficits that persist after completion of each tutorial. This function which enables
focused counseling was not activated for the study.
Providing information about diabetes to a patient at initial diagnosis is not as efficacious
as actively engaging the patient in self-care through continuous interaction with a diabetes
educator, or a very interactive diabetes informational website that also records and tracks patient
112
outcomes. Norris et al. (2002) found that every additional 23.6 hours of education by a patient’s
interaction with a diabetes educator resulted in a 1% decrease in glycated hemoglobin (A1C),
which is a marker of diabetes control.
Patient Comments about Healthy Tutor
Most of the patients had long-standing diabetes, so they were not uninformed. A
majority of the patients liked Healthy Tutor, as it refreshed their knowledge. They thought it
would be a great tool to enhance knowledge of diabetes self-care management in newly
diagnosed diabetic patients. Many patients said they picked up new knowledge. Some patients
said they had started exercising and eating healthy as a result of watching the tutorials but had to
take a break due to either personal health issues or other family obligations. A few of the
patients said that the tutorials could be shorter.
Limitations of the Study
This study was conducted in a single medical practice with a single provider and using a
sample drawn from a homogeneous population, so it is not widely generalizable. There was
some drop-out due to patients switching to a different practice.
Another limitation of the study was that the instructional materials were tailored for a
sixth grade level reader. One type of educational intervention may not suit all groups. When
appropriate, the content of health education should be tailored to people of limited education by
doing a KAP assessment to identify the deficits in knowledge. Information to remedy particular
deficits should be presented, and also reinforced by repetition. Illiterate patients need to view
videos and require hands on demonstration.

113
In addition, the subjects did not receive face-to-face counseling focusing on the
individual subject’s knowledge deficits. Future studies are needed to test Healthy Tutor’s
individualized knowledge deficit assessments and reports. These components are designed for
patient-centered primary care practices.
An important finding in the KAP-O model was that the education intervention did not
influence knowledge much. The participants of the study were not newly diagnosed diabetics;
their onset had generally occurred 8 to 10 years prior to the study. Hence, the subjects may have
already learned about diabetes through group classes, pamphlets, pharmacy encounters, and
conversations with their providers. Both experimental and control groups began with high
knowledge scores. There was no bias, since the subjects were randomly assigned to their
respective groups.
The length of the experimental study could be extended beyond one year with multiple
education sessions and multiple outcome assessments to elicit the trajectory of change of each
outcome variable.
Lessons Learned – Implications for Future Research
The data from this experiment do not support a causal model of experimental status and
predictor change variables DK, DA, DP causing changes in outcome variables DA1C, DLDLC,
DPPH, DFC (KAP-O).
The study was conducted in a single practice with a single provider in a single region.
The provider consistently applied the same treatment protocol for all the diabetic patients.
Participants in both test and control groups were homogeneous exhibiting the same attributes.
The subjects, whether in the experimental or the control group, were compliant using the
114
medication prescribed by the same physician. Consequently, there was not much variation in
outcomes in spite of the intervention.
In that context the functionality of the model remains undetermined. The KAP-O model
could work in other, diverse patient populations. Future studies should use the KAP-O model in
research based on multi-centers with multiple providers treating a diverse population of Type 2
diabetes patients.
The duration of such studies should be of one to two years with four or more outcome
assessments during the course of the study, in order to elicit the trajectory of changes, since the
effects cannot be detected in a study of six months duration.
Most health education providers assume that diabetes education should work once given,
just as medication does, which is a mistake. The results of education should be monitored and
education should be improved to prevent wastage of resources.
Maez et al. (2014) did a review of fifteen articles concerning patient diabetic education in
rural areas and concluded that consistency and follow-up after education is essential for
improved diabetic patient outcomes. Illiterate patients need to view videos and require hands on
demonstration. They also suggested that education should be culturally sensitive. A KAP
assessment in ethnic populations will inform practitioners about patients’ diets, some of which
may have adverse effects on health. For example, ethnic groups who are used to a diet consisting
predominately of high-fat food cooked with butter or lard would find it hard to reduce
consumption of high-fat food; it may be possible to compensate for such eating habits by
increasing physical activity.
A good feature of Healthy Tutor used in the study was that each module started with a
pre-test, followed by education and then post-test. The use of the pre-test may have prompted a
115
more focused learning experience. The post-test may have reinforced the knowledge covered in
the tutorial. The Healthy Tutor tutorials could be more useful if reports of post-tutorial
knowledge gaps were downloaded into the patient’s electronic medical records. This function of
Healthy Tutor which was intentionally deactivated in the study would help the provider follow-
up and counsel patients regarding specific deficits in knowledge.
A booster educational session at regular intervals after face-to-face interaction with a
diabetes educator to address knowledge gaps would help patients’ retain the knowledge. An
important step would be to monitor patients’ preventive practices. Improvement in attitude could
also be fostered by focused interactions with an educator who could suggest a change in practice
that a patient could incorporate to compensate for poor attitude. For example, a patient may find
walking as an exercise, boring. The educator could suggest that the patient watch his favorite
television show while walking on the treadmill. In summary, money could be allocated toward
promoting attitudinal change, self-care, and on increasing knowledge.

116
APPENDIX A: PERMISSION FROM SITE

117
MEDICAL SPECIALISTS
Date:
UCF IRB
RE: Support of research for Karen Rav-Marathe
To Whom It May Concern:
This letter will serve to support the research which will take place in my St Augustine and Palm
coast office. I am strongly interested in this research and keen to learn the determinants of
optimal health status of my patients with diabetes. I would like my patients to have a good
quality of life and delay complications such as heart attack, stroke, kidney disease, eye and nerve
disease. I wholeheartedly support Mrs. Karen Rav-Marathe’s research proposal and will serve as
the host for this study.
Sincerely,
Shriram Marathe MD, PhD

118
APPENDIX B: UCF IRB APPROVAL OF HUMAN RESEARCH

119

120

121
APPENDIX C: LETTER TO PARTICIPANTS

122

123
APPENDIX D: INFORMED CONSENT

124
The Effect of Web-Based Education Sessions on Clinical Outcomes of Patients with Type 2
Diabetes in a Medical Practice Group.
Informed Consent
Principal Investigator(s): Karen Rav-Marathe, Ph.D. Candidate
Faculty Supervisor: Dr. Thomas T. H. Wan,
Department of Public Affairs,
University of Central Florida
Investigational Site(s): 665 State Road 207, Suite 102, St Augustine, FL 32084
4869 Palm Coast Parkway NW, Suite 2, Palm Coast, Fl32137
Introduction: You are being invited to participate in a research study that will include about 200-
300 people who are patients of Medical Specialists. You are being asked to take part in this
research study because your health status satisfies some of the inclusion criteria which are noted
in the paragraph below entitled inclusion criteria.
Inclusion criteria
Patients with diagnosis of diabetes mellitus Type 2 as indicated by some of the, ICD9 codes
249.00-250.99. or who have been told by health practitioners that they have high blood sugar and
are controlled by Metformin and lifestyle interventions or patient who present to clinic with
classic symptoms of hyperglycemia or hyperglycemic crisis and random plasma glucose of >200
mg/dl. All participants will be at least 18 years of age. The surveys utilized in this research
project are only available in English and those who do not speak or write English will not be able
to participate in the study. Patients must take a reading/literacy test “LAD” that will determine
whether they will be able to take part in the study.
Some patients of Medical Specialists are not included in the study because their health status
satisfies some of the exclusion criteria as noted below in paragraph entitled exclusion criteria.

125
Exclusion criteria:
Exclusion criteria will be patients with type I diabetes, patients who have completed more than 2
hours of diabetes education within the past 6 months, patients reading below the sixth grade level
as determined by health literacy survey instrument and individuals less than eighteen years of
age.
Also diabetic patients with complications such as Kidney failure stage IV (i.e. glomerular
filtration rate of 30% or less), CHF, ischemic ulcer, amputations for vascular insufficiency,
irreversible comorbid conditions and legal blindness from diabetic retinopathy." will be excluded
as the disease process has progressed too far and adherence to self-management behavior will not
reverse the disease.
The person doing this research is Mrs. Karen Rav-Marathe of the University of Central Florida,
Department of Public Affairs. She is guided by Dr. Thomas T. H. Wan, a UCF faculty supervisor
in Public Affairs.
Voluntary Participation: Your decision to participate in this research is voluntary. You can
choose to withdraw from the research at any time. If you choose not to participate or choose to
withdraw, you will not be penalized or lose any benefits.
Purpose of the research study: The purpose of this study is to find out if Web-based diabetes
education sessions help patients gain knowledge of their disease, improve their attitude about
diabetes, increase their self-care, and achieve better health.
Several randomized, controlled research trials have demonstrated that patients who complete
diabetes education programs have better clinical outcomes than patients receiving no diabetes
education. Unlike previous studies, this research study uses Web -based, interactive diabetes
education sessions that are convenient, accessible at any time, and capable of being repeated.
What you will be asked to do in the study: Under the guidance of Mrs. Karen Rav-Marathe, you
will first be asked to complete a health literacy survey in the office conference room. Based on
the results of this test you may or may not be eligible to participate in the study. Next you will be
asked to complete a test on diabetes knowledge, an attitude survey, and a self-care survey. You
will again complete the surveys after about 3 months. Your lab test results at 0, 3, and 6 months
will also be documented. Some of you will be selected to complete a series of Web-based
diabetes education sessions on a computer terminal for 5-6 weeks. Patients completing the
education sessions will also answer a 10-question pretest and posttest with each education
session.
Location: The research will be carried out at Medical Specialists two office locations in St
Augustine and Palm Coast.
Time and effort required: You will be in this research study for about six months. You will
require about 30 -40 minutes to complete the surveys. You will be asked to complete the surveys
three times in a period of approximately six months.

126
If you are selected to complete diabetes education sessions on a computer terminal and do not
have access to the Internet in your home, you may have to return to one of the two office
locations once a week to complete the sessions. Each session is 20 to 40 minutes long and
contains colorful pictures and large, easy to read writing.
Benefits and Risks: The study may increase your awareness of how much you know about
diabetes, your attitude about diabetes, and your self-care habits. If you are selected to complete
the health education sessions, you may increase your knowledge of diabetes, change your
attitude about diabetes, change your self-care habits, and improve your health. This study may
benefit society by enhancing the availability of Web-based diabetes education sessions. As a
result of participating in this study, you may develop unanswered questions about diabetes. You
may need to find answers to such questions from your physician, nurse, diabetes educator, or
other trusted source of medical information.
Compensation or payment: There is no payment or reward to you for taking part in this study.
Confidentiality: Your participation in this research is confidential. Your data will be stored at
the Medical Specialists offices in locked cabinets or password protected computer files. The
University of Central Florida Institutional Review Board and other representatives of UCF may
review records related to this research study. If this study results in a publication or presentation,
your personally identifiable information will not be shared. Code numbers will be assigned to
your completed surveys and laboratory data. Only researchers will have access to your identity.
Questions about the study or to report a problem: If you have questions, concerns, or
complaints, talk to Mrs. Karen Rav-Marathe, Graduate Student, College of Health and Public
Affairs, at [email protected] or Dr.Thomas T.H. Wan, Faculty Supervisor,
Department of Public Affairs at [email protected].
IRB contact about your rights or to report a complaint: Please contact Privacy Officer Mrs.
Sharon Koufas, 665 State Road 207, Suite 102, 904 824 8158 first to resolve any issues you may
have. If you are not completely satisfied, you may contact Institutional Review Board, University
of Central Florida, Office of Research & Commercialization, 12201 Research Parkway, Suite
501, Orlando, FL 32826-3246 or by telephone at (407) 823-2901.
Dismissal from the study: The Principal Investigator may remove you from the research study
without your approval. Possible reasons for removal include failure to follow instructions and
failure to complete necessary tasks for the study. You will not be penalized or lose any medical
benefits if you are dismissed from the study.
Medical Specialists federally compliant HIPPA privacy statement item 3 refers to use of patient
health information to evaluate the quality of care received by patients from this practice. The
proposed research study will test the efficacy of a lower cost alternative form of patient
education which necessitates access to your personal health information therefore we request
your consent for release of records for research in addition to your consent to take part in the
study.

127
You may sign below to indicate that you wish to participate in this research study of your own
free will and that you wish to disclose any protected health information related to this study to
the investigators for the purpose of completing the study and nothing more.
Name of participant
Signature of participant Date
Signature of person obtaining consent
Date

128
APPENDIX E: LITERACY ASSESSMENT OF DIABETES INSTRUMENT

129

130
APPENDIX F: TEST OF FUNCTIONAL CAPACITY (EQ-5D-5L) WITH 5
ADDITIONAL DIMENSIONS PROPOSED BY PERNEGER AND
COURVOISIER (2011)

131
(English version for the USA)Under each heading, please check the ONE box that best describes
your health TODAY
MOBILITY
I have no problems walking
I have slight problems walking
I have moderate problems walking
I have severe problems walking
I am unable to walk
SELF-CARE I have no problems washing or dressing myself
I have slight problems washing or dressing myself
I have moderate problems washing or dressing myself
I have severe problems washing or dressing myself
I am unable to wash or dress myself
USUAL ACTIVITIES (e.g. work, study, housework, family or leisure activities)
I have no problems doing my usual activities
I have slight problems doing my usual activities
I have moderate problems doing my usual activities
I have severe problems doing my usual activities
I am unable to do my usual activities
PAIN / DISCOMFORT
I have no pain or discomfort
I have slight pain or discomfort
I have moderate pain or discomfort
I have severe pain or discomfort
I have extreme pain or discomfort
ANXIETY / DEPRESSION
I am not anxious or depressed
I am slightly anxious or depressed
I am moderately anxious or depressed
I am severely anxious or depressed
I am extremely anxious or depressed

132
Additional items as used by Perneger and Courvoisier 2011
Under each heading, please check the ONE box that best describes your health TODAY
SLEEP
I have no problems with sleep
I have moderate difficulties with sleep
I have extreme difficulties with sleep
MEMORY / CONCENTRATION I have no problems with memory or concentration
I have moderate difficulties with memory or concentration
I have extreme difficulties with memory or concentration
FATIGUE / ENERGY I am full of energy
I am moderately tired or lacking in energy
I am extremely tired or lacking in energy
SEEING AND HEARING (with glasses, contact lenses or hearing aid if you have them)
I see and hear without difficulty
I have moderate seeing and hearing
I have extreme difficulties seeing or hearing
CONTACT WITH OTHERS
I have very good contacts with my family and friends
I lack contact with my family and friends
I am completely isolated from my family and friends

133
APPENDIX G: TEST OF PERCEIVED POOR HEALTH EUROPEAN
QUALITY VISUAL ANALOGUE SCALE (EQ-VAS)

134
We would like to know how good or bad your health is
TODAY.
This scale is numbered from 0 to 100.
100 means the best health you can imagine.
0 means the worst health you can imagine.
Mark an X on the scale to indicate how your health is TODAY.
Now, please write the number you marked on the scale in the box
below.
YOUR HEALTH TODAY =
10
0
20
30
40
50
60
80
70
90
100
5
15
25
35
45
55
75
65
85
95
The best health
you can imagine
The worst health
you can imagine

135
APPENDIX H: SUMMARY OF DIABETES SELF-CARE ACTIVITIES
INSTRUMENT

136
The Summary of Diabetes Self-Care Activities
Instructions: The questions below ask you about your diabetes
self-care activities during the past 7 days. If you were sick
during the past 7 days, please think back to the last 7 days that
you were not sick. Please circle one answer for each statement
below.
START HERE
1. Diet – How many of the last seven days have you followed a
healthful eating plan?
1 2 3 4 5 6
7
2. Diet – On average, over the past month, how
many DAYS PER WEEK have you followed your eating
plan?
1 2 3 4 5 6 7
3. Diet – On how many of the last SEVEN DAYS did you eat
five or more servings of fruits and vegetables?
1 2 3 4 5 6 7
4. Diet – On how many of the last SEVEN DAYS did you eat
high fat foods such as red meat or full-fat dairy products?
1 2 3 4 5 6 7
5. Exercise –On how many of the last SEVEN DAYS did you
participate in at least 30 minutes of physical activity?(Total
minutes of continuous activity, including walking).
1 2 3 4 5 6 7
6. Exercise - On how many of the last SEVEN DAYS did you
participate in a specific exercise session (such as swimming,
walking, biking) other than what you do around the house or
as part of your work?
1 2 3 4 5 6 7
7. Blood Sugar Testing- On how many of the last SEVEN DAYS
did you test your blood sugar?
1 2 3 4 5 6 7
8. Blood Sugar Testing- On how many of the last SEVEN DAYS
did you test your blood sugar the number of times
recommended by your health care
1 2 3 4 5 6 7
Please Continue on the Back

137
Instructions: Please circle one answer for each
statement below.
CONTINUE HERE
9. Blood Pressure Checking- On how many of the last SEVEN
DAYS did you check your blood pressure?
1 2 3 4 5 6
7
10. Blood Pressure Checking- On how many of the last SEVEN
DAYS did you check your blood pressure the number of
times recommended by your health care provider?
1 2 3 4 5 6
7
11. Foot Care- On how many of the last SEVEN DAYS did you
check your feet?
1 2 3 4 5 6
7
12. Foot Care- On how many of the last SEVEN DAYS did you
inspect the inside of your shoes?
1 2 3 4 5 6
7
13. Smoking- Have you smoked a cigarette –even one puff –
during the past SEVEN DAYS? If yes, how many cigarettes
did you smoke on an average day?
Number of cigarettes--------------------
No Yes
** Thank you for your time in completing this questionnaire. **

138
APPENDIX I: HEALTHY TUTOR DIABETES KNOWLEDGE TEST

139
1) What is the body's main fuel?
A) Glucose
B) Fructose
C) Lactose
D) Galactose
2) Insulin is a hormone produced naturally by the body and needed to:
A) Break down sugars in the body to make energy
B) Break down fats in the body to make energy
C) All of the above
D) None of the above
3) In order for the body to use the sugar from food for energy:
A) The body must make enough insulin.
B) Insulin must be able to get into the cells to let sugars be used for energy
C) Sugar must be able to get into the cells
D) All of the above
4) If you are told you have Diabetes, this means
A) Your body has problems getting the sugar it needs to make energy.
B) You have an illness with no good treatments that always causes death
C) You have an illness you can only get from your mother or father
D) You have an illness caused by eating too much sugar
5) People with diabetes may have:
A) Problems with sex
B) Increased heart problems
C) All of the above
D) None of the above
6) A person can help to manage their Diabetes by:
A) Eating healthy foods
B) Exercising and staying active
C) All of the above
D) None of the above

140
7) What is the normal range for blood sugar?
A) 50 - 150 mg/dl
B) 200 - 300 mg/dl
C) 60-120 mg/dl
D) 100- 200 mg/dl
8) Sometimes people with Diabetes get too much medicine or don't eat enough and their sugar
levels get too low. Which is a sign of low blood sugar?
A) Feeling weak, dizzy, drowsy, or confused
B) Having a cold clammy feeling
C) All of the above
D) None of the above
9) If your blood sugar drops too low, you should:
A) Drink lots of water
B) Eat or drink something with sugar in it0
C) Take more insulin
D) Call an ambulance right away
10) The body gets most of its glucose from carbohydrates. What are some foods that contain
carbohydrates?
A) Bread
B) Potatoes
C) All of the above
D) None of the above
11) There are 2 types of carbohydrates (carbs). Which of these is a simple carbohydrate?
A) Soda
B) Apples
C) Broccoli
D) Oatmeal
12) Foods with protein are:
A) Fish
B) Peas
C) All of the above
D) None of the above

141
13) People with diabetes should:
A) Eat different kinds of vegetables
B) Have fresh fruits instead of fruit juice
C) All the above
D) None the above
14) The foods that you eat have impact on your diabetes. �To help control your diabetes you
should:
A) Eat regularly
B) Eat a meal or snack every 4-5 hours during the day
C) All of the above
D) None of the above
15) Carbohydrates are found in many different foods. It is important to choose healthy
carbohydrates as part of your diet plan. Some examples of healthy carbohydrates include:
A) Peas, lentils, and beans (examples: pinto, kidney and black beans)
B) Whole grains that include: whole grain breads, cereals, pastas, crackers, brown rice,
Oatmeal, bulgur, barley, whole cornmeal
C) All of the above
D) None of the above
16) Eating carbohydrates affects your blood sugar. �How high your blood sugar rises after
eating carbohydrates depends on:
A) How much insulin you have in your body and how well this insulin works
B) What and how much you ate
C) Both a and b
D) What time you ate
17) Learning to read food labels is important to help you count your carbohydrates and
convert the grams into servings. �Which of the following is true?
A) 1 ounce = 1 serving
B) 15 grams = 1 serving
C) 45 grams = 3 servings
D) Both b and c
18) The energy we get from food is measured in calories.
A) True
B) False

142
19) What are some ways that fiber is important in our diets?
A) It plays an important role in the digestive process, adding bulk to the intestinal
contents
B) Helps lower your blood cholesterol
C) All of the above
D) None of the above
20) Your doctor and dietitian will help you with how many calories and carbohydrates you
need each day. If you are placed on an 1800 calorie ADA diet how could you plan your
carbohydrates for the day?
A) 15 carbohydrate servings for the day
B) 4 servings of carbohydrates for lunch and dinner
C) All of the above
D) None of the above
21) Things that a diabetic person might do to care for their feet are:
A) Using a mirror to look for problems on the bottom of the feet
B) Cutting the skin on the end of the toes
C) Putting lotion between the toes
D) Washing the feet every week
22) Other things people with diabetes can do to prevent foot problems are:
A) Exercise
B) Stop smoking
C) All of the above
D) None of the above
23) Your doctor can find your Healthy Weight by using what measurement?
A) Age
B) Gender
C) Body Mass Index
D) Both a. and c.
24) The best way to begin losing weight is to do what?
A) Explore diet programs
B) Lose weight as fast as you can
C) Try to be active
D) Both a. and c.

143
25) Exercise helps to decrease risks for:
A) diabetes
B) high cholesterol
C) all of the above
D) None of the above
26) Which are types of aerobic exercise?
A) bowling
B) weight lifting
C) walking
D) gardening
27) You should exercise about how many minutes each day?
A) 15
B) 20
C) 30
D) 45
28) When you begin to do regular exercise, it is best to exercise very hard and for long amounts of time.
A) true
B) false
29) There is no need to ever check with your doctor before starting exercise.
A) true
B) false
30) If you get bored with your exercise, you should:
A) stop exercising all together
B) change to a different type of exercise
C) keep on doing that exercise until you are no longer bored
D) call your doctor
31) If you have chest pain when you are exercising, you should:
A) stop exercising and call your doctor
B) keep exercising and hope the pain goes away
C) take an aspirin and keep exercising
D) exercise harder until the pain stops

144
32) A normal, healthy blood pressure is:
A) 140/90
B) 120/80
C) 130/96
D) 160/100
33) Which parts of the body can be harmed when high blood pressure is not treated? :
A) eyes
B) Kidneys
C) All of the above
D) None of the above
34) What can a person with high blood pressure do to make their health better?
A) Exercise
B) Take their blood pressure medicines
C) All of the above
D) None of the above
35) Which of the following foods are NOT high in salt (sodium)?
A) apples
B) pickles
C) canned green beans
D) soda
36) You should just stop your high blood pressure medicine if it makes you feel bad.
A) True
B) False
37) The Heart
A) Is the most important muscle in the body
B) Pumps blood with oxygen and nutrients
C) All of the above
D) None of the above

145
38) Things that can increase your risk for heart disease are:
A) Surgery
B) Being overweight
C) High blood pressure
D) Both B and C
39) Which lowers your risk of heart disease?
A) Eating hamburgers
B) Stopping smoking
C) Working long hours
D) Not exercising
40) Cholesterol can cause blood vessels to narrow.
A) True
B) False
41) Foods high in cholesterol and bad fats are:
A) Red meat
B) Egg whites
C) Fish
D) Wheat Bread
42) Your total cholesterol should be at what level?
A) Below 100
B) Below 200
C) Below 300
D) Below 50
43) What are some things you can do to keep your cholesterol levels down?
A) Losing weight
B) Correcting thyroid problems
C) All of the above
D) None of the above

146
44) What are some dietary guidelines that need to be followed to help control cholesterol
levels?
A) No more than 30% of total daily calories should be from fat, and no more than 8-10% of total
daily calories should be from saturated fat
B) No more 300 mg of cholesterol should be eaten in a day
C) All of the above
D) None of the above

147
APPENDIX J: ATTITUDE INSTRUMENT

148
DMPA (Diabetes Mellitus Type 2 Patient Attitude)
Str
on
gly
Dis
agre
e
Dis
agre
e
Nei
ther
Ag
ree
no
r D
isag
ree
Ag
ree
Str
on
gly
Ag
ree
Instructions: Please circle one answer for each statement
below.
SD D NA/D A SA
START HERE
1. I think Type 2 Diabetes is a serious health condition.
1 2 3 4 5
2. I worry that I will get serious complications if I do have
diabetes under control.
1 2 3 4 5
3. I can be healthy if I follow my doctor’s advice.
1 2 3 4 5
4. I have to spend money and put in a lot of effort to take care
of my diabetes.
1 2 3 4 5
5. I can count on my significant other, relatives, friends and
coworkers for emotional and practical help in taking care
of my diabetes.
1 2 3 4 5
6. I realize that I cannot afford my medicines.
1 2 3 4 5
7. The medical advice I receive regarding diabetes and its
care is different from my cultural beliefs.
1 2 3 4 5
8. I feel deprived regarding my favorite foods.
1 2 3 4 5
Please Continue on the Back
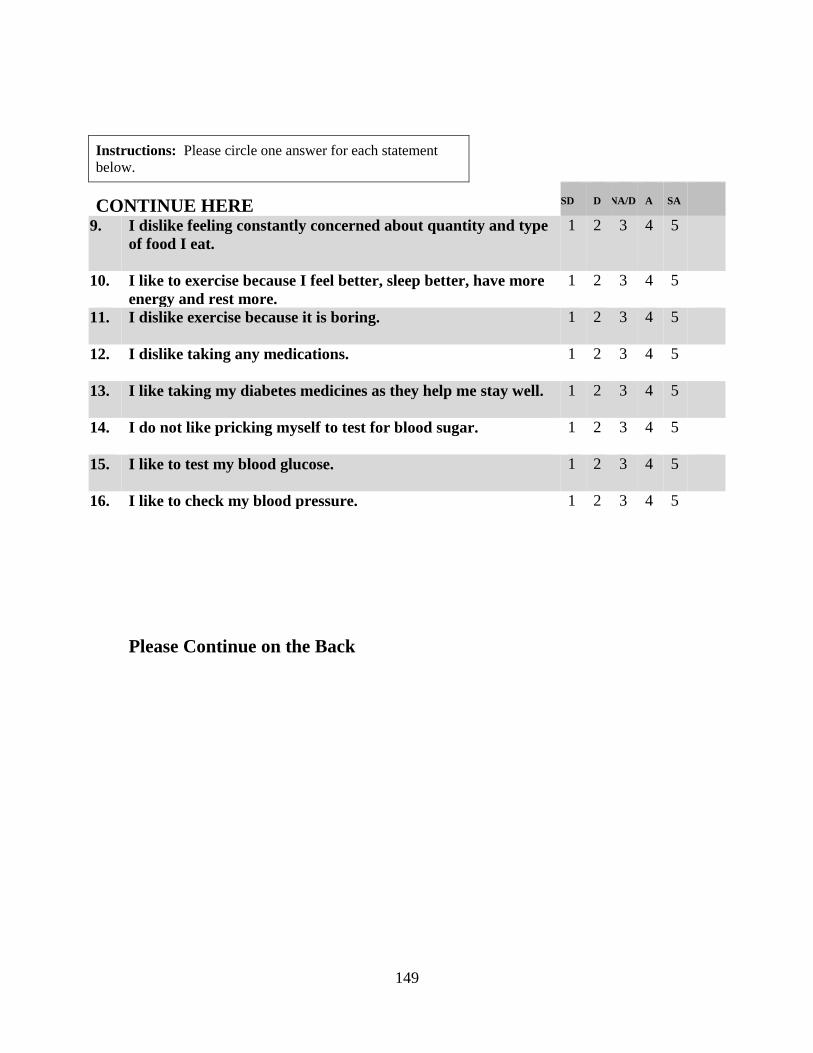
149
Instructions: Please circle one answer for each statement
below.
CONTINUE HERE
SD
D
NA/D
A
SA
9. I dislike feeling constantly concerned about quantity and type
of food I eat.
1 2 3 4 5
10. I like to exercise because I feel better, sleep better, have more
energy and rest more.
1 2 3 4 5
11. I dislike exercise because it is boring.
1 2 3 4 5
12. I dislike taking any medications.
1 2 3 4 5
13. I like taking my diabetes medicines as they help me stay well.
1 2 3 4 5
14. I do not like pricking myself to test for blood sugar.
1 2 3 4 5
15. I like to test my blood glucose.
1 2 3 4 5
16. I like to check my blood pressure. 1 2 3 4 5
Please Continue on the Back

150
Instructions: Please circle one answer for each statement
below.
CONTINUE HERE
SD
D
NA/D
A
SA
17. I like to check my feet.
1 2 3 4 5
18. I like to smoke.
1 2 3 4 5
19. I like regular quarterly visits to my primary care doctor since
my doctor addresses my concerns, discusses my lab results
and lets me know how I am doing and makes changes in my
medicines if necessary.
1 2 3 4 5
20. I dislike seeing any doctor.
1 2 3 4 5
21. My diabetes makes me angry, scared, anxious, upset or
depressed.
1 2 3 4 5
22. I would have to change too many habits to follow my diet.
1 2 3 4 5
23. It is easier for me to find excuses not to exercise than to go out
to do something.
1 2 3 4 5
24. Putting out my tablets in a pill box would make it easier for
me to take my medicine.
1 2 3 4 5
Please Continue on the Back

151
Instructions: Please circle one answer for each statement
below.
CONTINUE HERE
SD
D
NA/D
A
SA
25. It is difficult for me to take my diabetes medicines
consistently.
1 2 3 4 5
26. I tend not to test my blood sugar regularly since I can tell my
blood sugar is abnormal without testing it.
1 2 3 4 5
27. I tend to avoid checking my blood pressure regularly.
1 2 3 4 5
28. I tend not to check my feet regularly.
1 2 3 4 5
29. It is very difficult for me to cut back or give up smoking.
1 2 3 4 5
30. I see my doctor for the slightest discomfort.
1 2 3 4 5
** Thank you for your time in completing this questionnaire. **
Please share any additional comments you have in the box provided below.

152
APPENDIX K: FINDINGS OF ANALYSES NOT INCLUDED IN THE
TEXT

153
The net effect of experimental status on attitude at T2, holding attitude at T1 constant, is
shown in figure 11.
NS= Not statistically significant at 0.05 or lower level.
*Statistically significant at 0.05 or lower level
Goodness-of-fit Statistics: Chi Square = 0.281 with DF = 1, P = 0.596, CFI = 1, TLI = 1.038, RMSEA = 0.00, R2 =
0.35
Comments on Model Fit: Non significant Chi square value and Chi Square/DF=0.281, p=0.596, suggests that the
model fit reasonably well; RMSEA less than 0.05 indicates an excellent fit.
Figure 11. The Net Effect of Experimental Status on Attitude at T2 (A-T2)
Experimental status does not affect attitude at T2 (A-T2) with statistical significance
while holding the prior attitude constant. The influence of attitude at T1 on attitude at T2 is
statistically significant, with β = 0.59. This is a partial examination of the model. There is a very
small change in attitude over time; experimental status does not have much influence on attitude.
The net effect of experimental status on practice at T2, holding practice at T1 constant, is
shown in figure 12.

154
NS = Not statistically significant at 0.05 or lower level.
*Statistically significant at 0.05 or lower level
Goodness-of-fit Statistics: Chi Square = 0.677 with DF = 1, P = 0.411, CFI = 1, TLI = 1.024, RMSEA = 0.00, R2 =
0.47.
Comments on Model Fit: Non significant Chi square value and Chi Square/DF= 0.677, p=0.411, suggests that the
model fit reasonably well; RMSEA less than 0.05 indicates an excellent fit.
Figure 12. The Net Effect of Experimental Status on Practice at T2
The effect of experimental status on practice at T2 (P-T2) is not statistically significant.
The effect of practice at T1 on practice at T2 is statistically significant, with β = 0.68.
Experimental status accounts for very little change in P-T2.
The net effect of experimental status on LDLC at T2, holding LDLC at T1 constant, is
shown in figure 13.

155
NS = not statistically significant at 0.05 or lower level.
*Statistically significant at 0.05 or lower level
Goodness-of-fit Statistics: Chi Square = 0.330, with DF = 1, P = 0.566, CFI = 1, TLI = 1.097, RMSEA = 0.00, R2 =
0.32.
Comments on Model Fit: Non significant Chi square value and Chi Square/DF= 0.330, p=0.566, suggests that the
model fit reasonably well; RMSEA less than 0.05 indicates an excellent fit.
Figure 13. The Net Effect of Experimental Status on Low-Density Lipoprotein Cholesterol
(LDLC) at T2
The effect of experimental status on LDLC at T2 (LDLC-T2), holding prior level of
LDLC-T1 constant, is not statistically significant. The effect of LDLC at T1 on LDLC at T2 is
statistically significant, with β = 0.56.
The net effect of experimental status on functional capacity (FC) at T2 is illustrated in figure
14.

156
NS = not statistically significant at 0.05 or lower level
*Statistically significant at 0.05 or lower level
Goodness-of-fit Statistics: Chi Square = 1.391, with DF = 1, P = 0.238, CFI=0.997, TLI = 0.992, RMSEA = 0.053,
R2 = 0.67.
Comments on Model Fit: Non significant Chi square value and Chi Square/DF=1.391, p = 0.238, suggests that the
model fit reasonably well; RMSEA less than 0.08 indicates a good fit.
Figure 14. The Net Effect of Experimental Status on Functional Capacity (FC) at T2
The effect of experimental status on functional capacity at T2 (FC-T2) is not statistically
significant. The effect of functional capacity FC at T1 on functional capacity at T2 is statistically
significant, with β = 0.82.
The net effect of experimental status on poor perceived health (PPH) at T2, holding PPH
at T1 constant, is illustrated in figure 15.

157
NS = not statistically significant at 0.05 or lower level
*Statistically significant at 0.05 or lower level
Goodness-of-fit Statistics: Chi Square = 0.722, with DF = 1, P = 0.396, CFI=1, TLI = 1.017, RMSEA=0.00, R2
=0.31.
Comments on Model Fit: Non significant Chi square value and Chi Square/DF=0.722, p=0.396, suggests that the
model fit reasonably well, RMSEA less than 0.05 indicates an excellent fit.
Figure 15. The Net Effect of Experimental Status on Poor Perceived Health (PPH) at T2
The effect of experimental status on poor perceived health at T2 (PPH-T2), holding the
prior level PPH-T1 constant, is not statistically significant. The effect of poor perceived health at
T1 on poor perceived health at T2 is statistically significant, with β = 0.557.

158
APPENDIX L: SUMMARY OF THE FINDINGS

159
Summary of the Findings
There was no statistically significant difference between the experimental and the control
group in terms of demographic characteristics and major diagnoses.
The correlations among the four outcome variables were relatively weak. Thus, the four
outcome variables did not constitute one common factor measurement model for outcome
evaluation.
The Intention-to-Treat Analysis: Independent Sample T-Tests
First, the experimental effect of a health educational intervention was analyzed using
independent sample t-tests for each of the seven variables: knowledge (K), attitude (A), practice
(P), and four outcome variables {glycated hemoglobin (A1C), low-density 1ipoprotein
cholesterol, functional capacity, and poor perceived health}. The analysis was performed for
Time-1 (T1) and Time-2 (T2) separately without controlling for the effects of other predictors.
Findings of the analysis of the experimental effect of health educational intervention on
knowledge, attitude, practice (KAP), and outcome variables {glycated hemoglobin (A1C), low-
density lipoprotein cholesterol, functional capacity, and poor perceived health} without
controlling for the effect of other predictors at T2 through t-tests are as follows.
At T2, the mean knowledge score of the experimental group improved; there was a
statistically significant difference between the mean knowledge scores for the experimental
group (M = 31.44, SD = 5.30) and those for the control group (M = 29.56, SD = 5.18); (p<0.05).
Hypothesis H1: Health educational intervention directly improves knowledge about diabetes
is supported.
Health education had no statistically significant direct effect on attitude, preventive practice,
and the outcome variables.
The Intention-to-Treat Analysis with Statistical Control of the Prior Score (Regression
Analysis)
Second, the intention-to-treat analysis was performed by regression analysis to determine the
net experimental effect of health educational intervention on each of the seven study variables
(K, A, P, and four outcomes) at T2, holding the respective prior measure of the variable constant.
This was a partial examination of the causal model. The experimental status did not

160
statistically affect any of knowledge, attitude, and practice at T2 with their prior levels
controlled. The analysis showed that the experimental variable did not contribute much to the
variation at T2 in knowledge, attitude, or practice scores. Health educational intervention had
little direct causal influence on any of the variables: knowledge (K), attitude (A), and practice
(P).
The results of the analysis examining the net effect of experimental status on each of the four
outcome variables are as follows. The effect of experimental status on A1C at T2 (A1C-T2) was
statistically significant (p<0.05). There was a direct causal effect of experimental status on
glycated hemoglobin (A1C).
H41: Health educational intervention directly lowers glycated hemoglobin (A1C) is supported.
The net effect of experimental status on each of the outcomes: low-density lipoprotein
cholesterol, functional capacity, and poor perceived health at T2, holding their respective prior
levels constant, was not statistically significant and is illustrated in figures 13, 14, 15 in appendix
K. This analysis examining the net effect of experimental variable on each of the four outcome
variables when holding the prior levels constant demonstrates that there was no direct effect of
experimental status on outcome variables, with the sole exception of the direct effect on glycated
hemoglobin (A1C). Thus an indirect causal effect of health education mediated via the change
variables of DK, DA, and DP on outcome variables is assumed in the difference-in-differences
analysis.
The prior levels of all outcome variables at T1 are strongly associated with their respective
levels at T2, with β coefficients of 0.752 for A1C, 0.815 for FC, 0.558 for LDL, and 0.557 for
poor perceived health.
Causal Modeling of KAP Relationships in {(Exp_Status)-(K-T2)-(A-T2)-(P-T2)} Model
Next, the model of {(Exp_Status)-(K-T2)-(A-T2)-(P-T2)} was analyzed in SEM. Findings of
the causal modeling of KAP relationships in the {(Exp_Status)-(K-T2)-(A-T2)-(P-T2)} model
are as follows. This was not a full examination of the causal model, since the prior levels were
not statistically controlled. The finding showed a concomitant effect of experimental status,
knowledge and attitude on practice. The experimental status had no direct effect on the practice
of preventive self-care, controlling for knowledge and attitude, at T2. However, the experimental
status had an indirect effect on practice through knowledge. Knowledge at T2 had a statistically
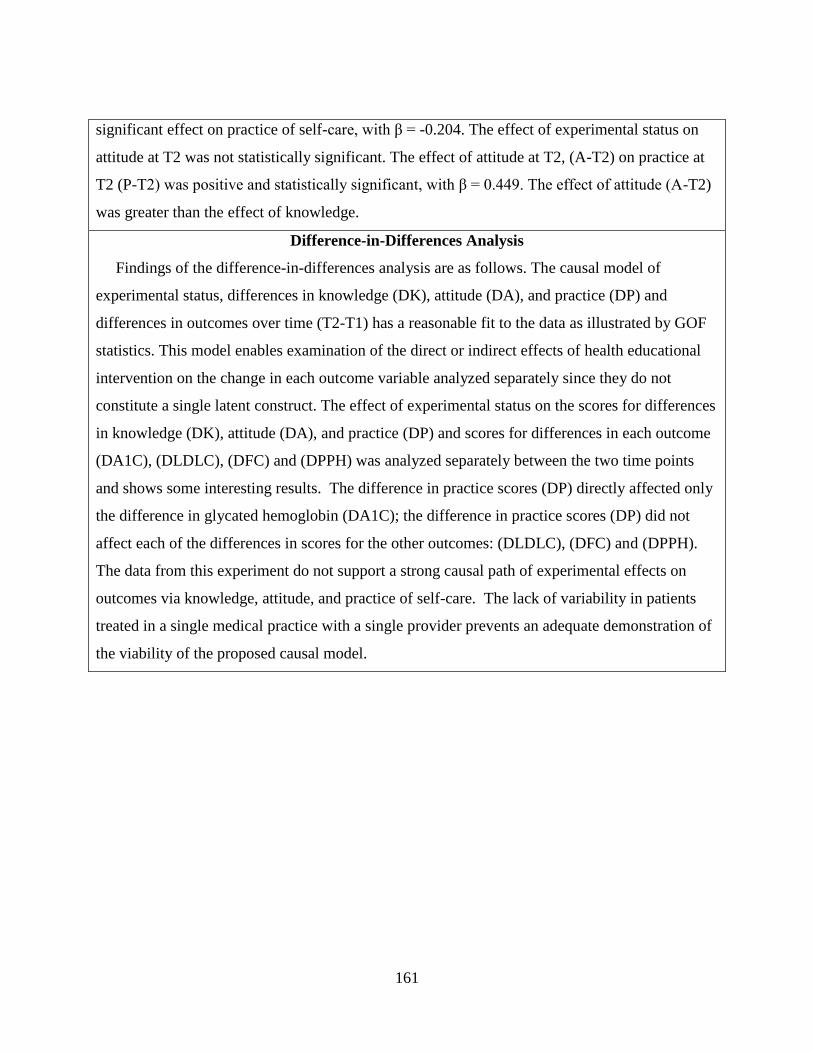
161
significant effect on practice of self-care, with β = -0.204. The effect of experimental status on
attitude at T2 was not statistically significant. The effect of attitude at T2, (A-T2) on practice at
T2 (P-T2) was positive and statistically significant, with β = 0.449. The effect of attitude (A-T2)
was greater than the effect of knowledge.
Difference-in-Differences Analysis
Findings of the difference-in-differences analysis are as follows. The causal model of
experimental status, differences in knowledge (DK), attitude (DA), and practice (DP) and
differences in outcomes over time (T2-T1) has a reasonable fit to the data as illustrated by GOF
statistics. This model enables examination of the direct or indirect effects of health educational
intervention on the change in each outcome variable analyzed separately since they do not
constitute a single latent construct. The effect of experimental status on the scores for differences
in knowledge (DK), attitude (DA), and practice (DP) and scores for differences in each outcome
(DA1C), (DLDLC), (DFC) and (DPPH) was analyzed separately between the two time points
and shows some interesting results. The difference in practice scores (DP) directly affected only
the difference in glycated hemoglobin (DA1C); the difference in practice scores (DP) did not
affect each of the differences in scores for the other outcomes: (DLDLC), (DFC) and (DPPH).
The data from this experiment do not support a strong causal path of experimental effects on
outcomes via knowledge, attitude, and practice of self-care. The lack of variability in patients
treated in a single medical practice with a single provider prevents an adequate demonstration of
the viability of the proposed causal model.

162
LIST OF REFERENCES
Abubakari, A., Jones, M., Lauder, W., Kirk, A., Anderson, J., & Devendra, D. (2011).
Associations between knowledge, illness perceptions, self-management and metabolic
control of type 2 diabetes among African and European-origin patients. Journal of
Nursing & Healthcare of Chronic Illnesses, 3(3), 245-256.
Adepu, R. R., Rasheed, A. A., & Nagavi, B. G. (2007). Effect of Patient Counseling on Quality
of Life in Type-2 Diabetes Mellitus Patients in Two Selected South Indian Community
Pharmacies: A Study. Indian Journal of Pharmaceutical Sciences, 69(4), 519.
Al-Maskari F, El-Sadig M, Al-Kaabi JM, Afandi B, Nagelkerke N, Yeatts, K. (2013)
Knowledge, Attitude and Practices of Diabetic Patients in the United Arab Emirates.
PLoS One 8(1): e52857.
American Diabetes Association. Standards of Medical Care in Diabetes (2012). Diabetes Care.
2013 Jan; 33 Suppl 1:S11-61.
American Diabetes Association. Standards of Medical Care in Diabetes (2011). Diabetes Care.
2011 Jan; 34 Suppl 1:S11-61.
Anderson, R. M., Fitzgerald, J. T., Funnell, M. M., & Gruppen, L. D. (1998). The Third Version
of the Diabetes Attitude Scale. Diabetes Care, 21(9), 1403.
Anderson, B., Funnell, M., & Tang, T. (2006). Self-Management of Health. In C. Mensing, M.
Cypress, C. Halstenson, S. McLaughlin, E. Walker (Eds.), The Art and Science of
Diabetes of Self-Management Education. (pp. 43-58). Chicago: American Association of
Diabetes Educators.
Ardena, G. A., Paz-Pacheco, E., Jimeno, C. A., Lantion-Ang, F., Paterno, E., & Juban, N.
(2010). Knowledge, attitudes and practices of persons with type 2 diabetes in a rural

163
community: Phase I of the community-based Diabetes Self-Management Education
(DSME) Program in San Juan, Batangas, Philippines. Diabetes Research and Clinical
Practice, 90(2), 160-166.
Austin, M. (2005). Importance of Self-care Behaviors in Diabetes Management. US
Endocrinology, (1):16-21.
Bains, S. S., & Egede, L. E. (2011). Associations between health literacy, diabetes knowledge,
self-care behaviors, and glycemic control in a low income population with type 2
diabetes. Diabetes Technology & Therapeutics, (3), 335.
Badran, I. G. (1995). Knowledge, attitude and practice the three pillars of excellence and
wisdom: a place in the medical profession. Eastern Mediterranean Health Journal, 1(1),
8-16.
Baradaran, H. R., Knill-Jones, R. P., Wallia, S., & Rodgers, A. (2006). A controlled trial of the
effectiveness of a diabetes education program in a multi-ethnic community in Glasgow.
BMC Public Health, 6134-9.
Baranowski, T., Perry, C.L., Parcel, G. S. (2002). How Individuals, Environments, and Health
Behavior Interact: Social Cognitive Theory. In. K.Glanz, B. Rimer, & F. M. Lewis
(Eds.), Health Behavior and Health Education Theory, Research, and Practice (pp. 165-
184). San Franciso: Josey-Bass.
Beeney, L., & Dunn, S. (1990). Knowledge improvement and metabolic control in diabetes
education: approaching the limits? Patient Education And Counseling, 16(3), 217-229.
Berger, D., & Bratu, E. (2006). Tuberculosis Knowledge, Attitudes and Practices in Romania: A
Patient-Centered Assessment. Cognitie, Creier, Comportament/Cognition, Brain,
Behavior, 10(1), 93-104.

164
Bloomgarden, Z. T., Karmally, W., Metzger, M., Brothers, M., Nechemias, C., Bookman, J., &
Brown, W. (1987). Randomized, Controlled Trial of Diabetic Patient Education:
Improved Knowledge Without Improved Metabolic Status. Diabetes Care, 10(3), 263.
Centers for Disease Control and Prevention. National center for health statistics. (Online).
Available: http://www.cdc.gov/nchs.htm (Accessed 1 October 2012).
Clarke, A. (2009). Effects of routine education on people newly diagnosed with type 2
diabetes. European Diabetes Nursing, 6(3), 88-94.
Cohen, J. (1988). Statistical Power Analysis for the Behavioral Sciences (2nd Edition). Hillsdale,
NJ: Lawrence Earlbaum Associates.
Cranor, C., Bunting, B., & Christensen, D. (2003). The Asheville Project: long-term clinical and
economic outcomes of a community pharmacy diabetes care program. Journal Of The
American Pharmaceutical Association (Washington, D.C.: 1996), 43(2), 173-184.
Delahanty, L., & Wylie-Rosett, J. (2006). Lifestyle for Prevention: Choices, Changes,
Challenges. In C. Mensing, M. Cypress, C. Halstenson, S. McLaughlin, E. Walker (Eds.),
The Art and Science of Diabetes of Self-Management Education. (pp. 21-42). Chicago:
American Association of Diabetes Educators.
Dickeson, B., Scheel J. Apparatus, System, and Method for Determining a Change in Test
Results, U.S. Patent and Trademark Office. Patent No. 8,721,345. May 13, 2014.
Eagly, A. H., & Chaiken, S. (2007). The advantages of an inclusive definition of attitude. Social
Cognition, (5), 582.
Eigenmann, C. A., Colagiuri, R., Skinner, T. C., Trevena, L. (2009). Are current psychometric
tools suitable for measuring outcomes of diabetes education? Diabetes Med. 26(4):425-
36.

165
Eckman, K., & Walker, R. (2008). Knowledge, Attitudes and Practice (KAP) Survey Summary
Report for the Duluth Lakeside Stormwater Reduction Project (LSRP). Duluth:
University of Minnesota.
European Quality of Life 5D 5L. (Online.) Available: http://euroqol.org.html.
Farina, K. (2013). Can financial incentives improve self-management behaviors? The American
Journal of Managed Care, 19 Spec No. 2E8.
Fradkin, J. (2012). Confronting The Urgent Challenge Of Diabetes: An Overview. Health
Affairs, 31(1), 12-19.
Garrett, N., Hageman, C., Sibley, S., Davern, M., Berger, M., Brunzell, C., Malecha, K.,
Richards, S. (2005). The Effectiveness of an Interactive Small Group Diabetes
Intervention in Improving Knowledge, Feeling of Control, and Behavior. Health
Promotion Practice, 6(3), 320.
Glanz, K., Rimer, R. K., & Lewis, F. M. (2002). Health Behavior and Health Education. San
Fransico: Jossey-Bass.
Healthy Tutor Modules. (Online). Available: http://www.healthytutor.com.htm.
Horn, S. (1997). Tools and Techniques in Disease Management. Disease Management & Health
Outcomes, 1(1), 17-25.
Hogue, V. W., Babamoto, K. S., Jackson, T. B., Cohen, L. B., & Laitinen, D. L. (2003). Pooled
Results of Community Pharmacy-Based Diabetes Education Programs in Underserved
Communities. Diabetes Spectrum, 16(2), 129-133.
Holmes, V., Spence, M., McCance, D., Patterson, C., Harper, R., & Alderdice, F. (2012).
Evaluation of a DVD for women with diabetes: impact on knowledge and attitudes to
preconception care. Diabetic Medicine, 29(7), 950-956.

166
Hooper, D., Coughlan, J., & Mullen, M. R. (2008). Structural Equation Modelling: Guidelines
for Determining Model Fit. Electronic Journal Of Business Research Methods, 6(1), 53-
59.
Jaccard, J., Dittus, P., & Gordon, V. (1996). Maternal correlates of adolescent sexual and
contraceptive behavior. Family Planning Perspectives, 28(4), 159.
Janz, N. K., Champion, V. L., Strecher, V. J. (2002). The Health Belief Model. In. K.Glanz, B.
Rimer, & F. M. Lewis (Eds.), Health Behavior and Health Education Theory, Research,
and Practice (pp. 45-66). San Franciso: Josey-Bass.
Khandekar, R., Harby, S., Harthy, H., & Lawatti, J. (2010). Knowledge, attitude and practice
regarding eye complications and care among Omani persons with diabetes - A cross
sectional study. Oman Journal Of Ophthalmology, 3(2), 60-65.
Kharkar, M., & Bowalekar, S. (2012). Knowledge, attitude and perception/practices (KAP) of
medical practitioners in India towards adverse drug reaction (ADR)
reporting. Perspectives In Clinical Research, 3(3), 90-94.
King, H., Aubert, R., & Herman, W. (1998). Global burden of diabetes, 1995-2025: prevalence,
numerical estimates, and projections. Diabetes Care, 21(9), 1414-1431.
Knowler, W. C., Barrett-Connor, E. E., Fowler, S. E., Hamman, R. F., Lachin, J. M., Walker, E.
A., & Nathan, D. M. (2002). Reduction in the incidence of type 2 diabetes with lifestyle
intervention or metformin. New England Journal Of Medicine, 346(6), 393-403.
Korhonen, T., Huttunen J. K., Aro, A., Hentinen, M., Ihalainen, O., Majander, H., & Pyorala, K.
(1983). A Controlled Trial on the Effects of Patient Education in the Treatment of
Insulin-dependent Diabetes. Diabetes Care, 6(3), 256.

167
Leslie, R. (1999). United Kingdom Prospective Diabetes Study (UKPDS): What now or so
what?. Diabetes-Metabolism Research And Reviews, 15(1), 65-71.
Lin, Y., Huang, L., Nie, S., Liu, Z., Yu, H., Yan, W., Xu, Y. (2011). Knowledge, Attitudes and
Practices (KAP) related to the Pandemic (H1N1) 2009 among Chinese General
Population: a Telephone Survey. BMC Infectious Diseases, 11:128.
Maez, L., Erickson, L., & Naumuk, L. (2014). Diabetic education in rural areas. Rural And
Remote Health, 14(2), 2742.
Maina, W. K., Ndegwa, Z. M., Njenga, E. W., & Muchemi, E. W. (2011). Knowledge, attitude,
and practices related to diabetes among community members in four provinces in Kenya:
a cross-sectional study. African Journal Of Diabetes Medicine, 19(1), 15-18.
Malathy, R., Narmadha, M., Ramesh, S., Alvin, J., & Dinesh, B. (2011). Effect of a diabetes
counseling program on knowledge, attitude and practice among diabetic patients in Erode
district of South India. Journal Of Young Pharmacists, 3(1), 65-72.
Manabe, T., Hanh, T., Lam, D., Do, T., Pham, T., Dinh, T., & Kudo, K. (2012). Knowledge,
Attitudes, Practices and Emotional Reactions among Residents of Avian Influenza
(H5N1) Hit Communities in Vietnam. Plos One, 7(10),
Manabe, T., Pham, T., Vu, V., Takasaki, J., Dinh, T., Nguyen, T., & Kudo, K. (2011). Impact of
educational intervention concerning awareness and behaviors relating to avian influenza
(H5N1) in a high-risk population in Vietnam. Plos One, 6(8).
Melancon, J., Oomen-Early, J., & del Rincon, L. M. (2009). Using the PEN-3 model to assess
knowledge, attitudes, and beliefs about diabetes type 2 among Mexican American and
Mexican Native men and women in North Texas.International Electronic Journal Of
Health Education.

168
Montano, D. E., Kasprzyk, D. (2002). The Theory of Reasoned Action and The Theory of
Planned Behavior. In K.Glanz, B. Rimer, & F. M. Lewis (Eds.), Health Behavior and
Health Education Theory, Research, and Practice (pp. 67-98). San Franciso: Josey-Bass.
Morales, L. S., Lara, M., Kington, R. S., Valdez, R. O., & Escarce, J. J. (2002). Socioeconomic,
cultural, and behavioral factors affecting Hispanic health outcomes. Journal Of Health
Care For The Poor And Underserved, 13(4), 477-503.
Mplus Manual. (Online). Available: http://www.statmodel.com/download/usersguide/
Mplus%20Users%20Guide%20v6.pdf (Accessed September 2013).
Nafissi, N., Saghafinia, M., Motamedi, M., & Akbari, M. (2012). A survey of breast cancer
knowledge and attitude in Iranian women. Journal Of Cancer Research &
Therapeutics, 8(1), 46-49.
Nath, C. R., Sylvester, S. T., Yasek, V., & Gunel, E. (2001). Literacy Assessment for
Diabetes. The Diabetes Educator, 27(6), 857-864.
National Library of Medicine, National Institute of Health. Medline Plus (Online). Available:
http://nlm.nih.gov/medlineplus/diabetes.html.
Ng, Shu Hui, Kheng Hooi, C., Zi Yang, L., Yee Hooi, C., Aishath Noora, ., & Amudha, K.
(2012). Reality vs Illusion: Knowledge, Attitude and Practice among Diabetic
Patients. International Journal Of Collaborative Research On Internal Medicine &
Public Health, (5), 723.
Norris, S., Engelgau, M., & Narayan, K. (2001). Effectiveness of self-management training in
type 2 diabetes: a systematic review of randomized controlled trials. Diabetes
Care, 24(3), 561-587.

169
Norris, S. L., Lau, J., Smith, S. J., Schmid, C. H., Engelgau, M. M. (2002). Self-management
education for adults with type 2 diabetes: a meta-analysis of the effect on glycemic
control. Diabetes Care, 25(7), 1159–1171.
Ozmen, B., & Boyvada, S. (2002). Can self-monitoring blood glucose control decrease glycated
hemoglobin levels in diabetes mellitus. Endocrinologist, 12(4), 349-356.
Perneger, T., & Courvoisier, D. (2011). Exploration of health dimensions to be included in multi-
attribute health-utility assessment. International Journal For Quality In Health
Care, 23(1), 52-59.
Polit, D. F., & Hungler, B. P. (1995). Nursing Research Principles and Methods. Philadelphia:
Lippincott.
Pi-Sunyer, X., Blackburn, G., Brancati, F., Bray, G., Bright, R., Clark, J., & ... Yanovski, S.
(2007). Reduction in weight and cardiovascular disease risk factors in individuals with
type 2 diabetes: one-year results of the look AHEAD trial. Diabetes Care, 30(6), 1374-
1383.
Polonsky, W., Anderson, B., Lohrer, P., Welch, G., Jacobson, A., Aponte, J., & Schwartz, C.
(1995). Assessment of diabetes-related distress. Diabetes Care, 18(6), 754-760.
Prochaska, J. O., Redding, C. A., Evers, K.E. (2002). The Transtheoretical Model and Stages of
Change. In K.Glanz, B. Rimer, & F. M. Lewis (Eds.), Health Behavior and Health
Education Theory, Research, and Practice (pp. 99-120). San Franciso: Josey-Bass.
Raj, C., & Angadi, M. M. (2010). Hospital-based KAP study on diabetes in Bijapur,
Karnataka. Indian Journal Of Medical Specialties, 1(2), 80-83.

170
Shah, V., Kamdar, P. P., & Shah, N. (2009). Assessing the knowledge, attitudes and practice of
type 2 diabetes among patients of Saurashtra region, Gujarat. International Journal Of
Diabetes In Developing Countries, (3).
Soper, D.S. (2014). A-priori Sample Size Calculator for Structural Equation Models [Software].
Available from http://www.danielsoper.com/statcalc
Thakurdesai, P., Kole, P., & Pareek, R. (2004). Evaluation of the quality and contents of diabetes
mellitus patient education on Internet. Patient Education & Counseling, 53(3), 309-313.
Tilly, K. F., Belton, A. B., & McLachlan, J. C. (1995). Continuous Monitoring of Health Status
Outcomes: Experience With a Diabetes Education Program. Diabetes Educator, 21(5),
413.
Toobert, D., Hampson, S., & Glasgow, R. (2000). The Summary of Diabetes Self-Care Activities
measure: results from 7 studies and a revised scale. Diabetes Care, 23(7), 943-950.
Upadhyay, D. K., Mohamed, I. M., Alurkar, V. M., Mishra, P., Palaian, S. (2012). Evaluation of
Knowledge, Attitude, and Practice of Newly Diagnosed Diabetes Patients - a Baseline
Study from Nepal. International Journal of Pharmacy Teaching & Practices, 3(2), 245-
252.
Van Geertruyden, J., Ntakirutimana, D., Erhart, A., Rwagacondo, C., Kabano, A., &
D'Alessandro, U. (2005). Malaria infection among pregnant women attending antenatal
clinics in six Rwandan districts. Tropical Medicine & International Health, 10(7), 681-
688.
Vasconcelos, C., Pinheiro, A., Casteol, A., Costa, L., Oliveira, R. (2011). Knowledge, Attitude
and Practice Related to the Pap Smear Test among Users of a Primary Health Unit. Rev.
Latino-Am.,19(1), 97-105.

171
Venkataraman, K., Kannan, A., Kalra, O., Gambhir, J., Sharma, A., Sundaram, K. K., & Mohan,
V. V. (2012). Diabetes Self-Efficacy Strongly Influences Actual Control of Diabetes in
Patients Attending a Tertiary Hospital in India. Journal Of Community Health, 37(3),
653-662.
Vimalavathini, R., Agarwal, S., & Gitanjali, B. (2008). Educational program for patients with
type-1 diabetes mellitus receiving free monthly supplies of insulin improves knowledge
and attitude, but not adherence. International Journal Of Diabetes In Developing
Countries, 28(3), 86-90.
Wahed, T., Kaukab, S., Saha, N., Khan, I., Khanam, F., Chowdhury, F., & Uddin, J. (2013).
Knowledge of, attitudes toward, and preventive practices relating to cholera and oral
cholera vaccine among urban high-risk groups: findings of a cross-sectional study in
Dhaka, Bangladesh. BMC Public Health, 13.
Walker, R. J., Smalls, B. L., Hernandez-Tejada, M. A., Campbell, J. A., Davis, K. S., & Egede,
L. E. (2012). Effect of diabetes fatalism on medication adherence and self-care behaviors
in adults with diabetes. General Hospital Psychiatry, 34(6), 598-603.
Wan, T. T. H. (2014). A Transdisciplinary Approach to Health Policy Research and Evaluation.
Int. J. Public Policy, 10(4/5), 161-177.
Westland, J.C. (2010). Lower bounds on sample size in structural equation modeling. Electronic
Commerce Research and Applications, 9(6), 476-487.
Williams, G., Freedman, Z., & Deci, E. (1998). Supporting autonomy to motivate patients with
diabetes for glucose control. Diabetes Care, 21(10), 1644-1651.
Yang, W., Dall, T., Halder, P., Gallo, P., Kowal, S., Hogan, P. (2013). Economic Costs of
Diabetes in the U.S. in 2012. Diabetes Care, 36, 1033-1046.

172
Zyskind, A., Jones, K., Pomerantz, K. L., & Barker, A. (2009). Exploring the use of computer
based patient education resources to enable diabetic patients from underserved
populations to self-manage their disease. Information Services & Use, (1). 29.