“The Effect of Foreign Cash Holdings on Internal Capital...
54
ACCOUNTING WORKSHOP “The Effect of Foreign Cash Holdings on Internal Capital Markets and Firm Financing” By Lisa De Simone* Stanford Graduate School of Business Rebecca Lester Stanford Graduate School of Business Thursday, Oct. 26 th , 2017 1:20 – 2:50 p.m. Room C06 *Speaker Paper Available in Room 447
Transcript of “The Effect of Foreign Cash Holdings on Internal Capital...

ACCOUNTING WORKSHOP
“The Effect of Foreign Cash Holdings on Internal Capital Markets and Firm Financing”
By
Lisa De Simone* Stanford Graduate School of Business
Rebecca Lester Stanford Graduate School of Business
Thursday, Oct. 26th, 2017 1:20 – 2:50 p.m.
Room C06 *Speaker Paper Available in Room 447

The Effect of Foreign Cash Holdings on Internal Capital Markets and Firm Financing
Lisa De Simone [email protected]
Rebecca Lester
Preliminary – Please do not quote without permission October 2017
Abstract
Prior literature demonstrates that firms should first use internal capital before accessing costly external finance. However, the U.S. tax system imposes an internal capital market friction by taxing active foreign earnings repatriated from a U.S. multinational corporation’s (MNC) foreign operations, which motivates firms to retain cash offshore (Foley et al., 2007). Consequently, U.S. MNCs with large amounts of tax-induced foreign cash may be unable to inexpensively access their foreign capital. We study to what extent U.S. MNCs use domestic financing rather than incur the repatriation tax to meet domestic cash needs. While prior literature predicts a negative relation between cash holdings and debt, we find that this relation is attenuated among multinationals with high tax-induced foreign cash; these firms have approximately 3.0 to 3.6 percent higher domestic liabilities relative to other MNCs. We also show that domestic liabilities are increasing in tax-induced foreign cash held by U.S. MNCs that require domestic cash for the specific purpose of financing shareholder payouts, but not for other domestic uses of cash such as investment and employment, and by MNCs in R&D-intensive industries. Additional tests show that these results are not driven by a differential cost of debt, trade credit, or intercompany loans and that increased domestic liabilities are incremental worldwide liabilities, not offset by lower foreign borrowing. This paper adds to the literature on internal capital markets by showing how U.S. tax frictions impede the domestic use of internal capital held by foreign subsidiaries, thereby inducing firms to access domestic financing sources.
______________________
We thank Joshua Anderson, Cristi Gleason, James Fetzer, Michelle Hanlon, Shane Heitzman, Jim Hines, Stacie Laplante (Discussant), Zawadi Lemayian, Jon Mandrano, Kevin Markle, Peter Merrill, Patricia Naranjo, Michelle Nessa, Joe Piotroski, Nemit Shroff, Rodrigo Verdi, and Bill Zeile, as well as seminar participants at the Federal Reserve (Washington, D.C.), 2017 George Washington University Cherry Blossoms Conference, the International Tax Policy Form, MIT, Stanford Accounting Summer Camp 2017, and the University of Iowa for helpful comments on this paper. We gratefully acknowledge financial support from the Stanford Graduate School of Business and the International Tax Policy Forum. The statistical analysis of firm-level data on U.S. multinational companies was conducted at the Bureau of Economic Analysis (BEA), Department of Commerce under arrangements that maintain legal confidentiality requirements. The views expressed in this study are those of the authors and do not reflect official positions of the U.S. Department of Commerce.

1
1. Introduction
U.S. multinational corporations (MNCs) hold over $2.5 trillion in foreign earnings
overseas to avoid U.S. taxation (Barthold, 2016), of which approximately $850 billion to $1.2
trillion is estimated to be held in cash and other financial assets (Blouin, Krull, and Robinson,
2016; Dobridge and Landefeld, 2017). One explanation for the large foreign cash holdings is that
the U.S. tax system of deferral, which defers the U.S. taxation of active foreign subsidiary earnings
until these earnings are repatriated to the U.S., motivates firms to retain cash in foreign subsidiaries
(Foley, Hartzell, Titman, and Twite, 2007). Prior literature shows that the large amounts of locked-
out foreign cash affect firm investment (Faulkender and Petersen, 2012; Hanlon, Lester, and Verdi,
2015; Edwards, Kravet, and Wilson, 2016) and dividend policies (Nessa, 2017). This paper
examines how this U.S. tax policy affects firm financing. Specifically, firms with significant
offshore cash attributable to repatriation tax liabilities (tax-induced foreign cash) may be
constrained domestically if the amount of cash generated in the U.S. is insufficient to meet
domestic operational, investment, and payout needs. We study to what extent U.S. MNCs with
significant tax-induced foreign cash use U.S. debt financing to meet these domestic cash needs.
Theory and prior empirical work show that using internal capital to fund operations within
a firm is generally less costly than external capital (Myers, 1984; Myers and Majluf, 1984; Gertner,
Scharfstein, and Stein, 1994; Stein, 1997; Shyam-Sunders and Myers, 1999; Leary and Roberts,
2010), such that value-maximizing managers will select internal capital first to fund domestic cash
needs. This literature shows a negative association between firm cash holdings and external debt
financing. Despite this expected negative relation, firms with a significant amount of cash on their
balance sheets are tapping the external debt market rather than using internal cash holdings
(Linebaugh, 2012). For example, eBay (with 90 percent of cash offshore) issued $3 billion in debt
2
in July 2012 (Mead and Kucera, 2012). Apple (with 79 percent of cash offshore in 2013) satisfied
investor demands for return of capital by borrowing $17 billion in 2013 (Lattman and Eavis, 2013).
Microsoft (with 85 percent of cash offshore for its fiscal year ending June 2011) sold $4.75 billion
in bonds in September 2010 to finance dividends and share repurchases and announced a new
borrowing of $17 billion as recently as January 2017 (Abramowicz, 2017).
Frictions created by repatriation taxes and other U.S. tax rules limiting the use of foreign
assets in domestic operations may explain the use of external debt financing by Microsoft, eBay,
Apple, and other U.S. MNCs.1 In addition to imposing a repatriation tax liability on foreign
dividend payments to the U.S. parent, U.S. tax rules also limit a firm’s ability to loan funds from
foreign operations to the U.S. by recasting many of these loans as deemed dividends. For U.S.
MNCs with trapped foreign cash that require domestic liquidity to fund domestic operations, the
internal cost of capital will reflect repatriation taxes and therefore could be higher than the firm’s
external cost of capital. Thus, the expected negative relation between cash and external domestic
financing will be attenuated if it is more efficient for these firms to use external debt financing
rather than incur the U.S. repatriation tax cost.
Indeed, samples of surveyed firms state that they avoid the repatriation tax liability by
raising capital in the U.S. debt market and that, if these firms repatriated, the cash would be used
to pay down debt (Graham, Hanlon, and Shevlin, 2010; Eisen, 2017). Furthermore, prior work
finds that the probability of a U.S. MNC issuing public debt is positively related to the amount of
foreign subsidiary earnings designated as permanently reinvested, a financial accounting assertion
that reduces deferred taxes and increases reported net income (Albring, 2006; Petzel and Salbador,
1Statements by corporate management validate that all three of these borrowings were motivated by U.S. tax policies and repatriation tax costs. For example, eBay’s CFO stated that the domestic debt issuances were intended to “get the wonderful benefit of an extremely low tax rate, but also get our cash geographically where we would like it to be to enable us to acquire and redistribute cash effectively” (Mead and Kucera, 2012).
3
2016).2 We directly test if the magnitude of tax-induced foreign cash attenuates the negative
relation between cash and domestic liabilities (public and private, internal, and external) using
jurisdiction-specific data from the Bureau of Economic Analysis (BEA), which are otherwise
unobservable using publicly available data.3 These data permit us to precisely quantify the extent
to which firms use this strategy to obtain domestic capital while also minimizing U.S. tax
liabilities. Furthermore, these data permit us to study motivations for firms to engage in this
strategy (i.e., sources of domestic demand for cash), and they allow us to focus on cash tax
incentives rather than financial reporting decisions that can be influenced by earnings management
(Krull, 2004).
Our tests use data for a sample of U.S. multinational C corporations from Compustat and
the BEA over the period 1999 through 2012. The BEA data allow us to observe detailed financial
statement information of U.S. parent companies and their foreign affiliates on an unconsolidated
basis. We first follow Hanlon et al. (2015) and use BEA data on foreign cash holdings to estimate
tax-induced foreign cash, which is the amount of cash held offshore attributable to the firm’s
repatriation tax liability. We then regress measures of total domestic liabilities (also from the BEA)
on a firm’s total worldwide cash, an indicator for firms with high amounts of tax-induced foreign
cash, and their interaction, controlling for other determinants of corporate financing decisions such
as domestic cash holdings, size, investment spending, fixed assets, growth opportunities, the cost
2Albring (2006) and Petzel and Salbador (2016) estimate the probability of a firm issuing public debt as a function of permanently reinvested foreign earnings disclosed in the financial statements, finding a positive relation between permanently reinvested earnings and the likelihood of a public debt issuance. Our study is complementary in that we directly test the relation between tax-induced foreign cash (as opposed to a financial accounting assertion about foreign earnings) and total domestic liabilities to measure the magnitude of this activity for a large sample of MNCs. 3 Two concurrent working papers study the relation between repatriation taxes and the cost of debt. Blaylock, Downes, Mathis, and White (2016) find a positive association between the cost of debt and an interaction of a repatriation tax indicator and foreign earnings. Ma, Stice, and Wang (2016) find a positive association between interest spreads and the repatriation tax cost. Both papers interpret the results as evidence that banks will charge firms with high repatriation tax liabilities higher fees to borrow. Neither of these papers tests if firms choose to actually borrow more despite this higher cost.
4
of debt capital, and firm financial performance. Consistent with prior literature, we observe that
total worldwide cash is negatively related to the level of firms’ total and domestic liabilities – firms
with more cash borrow less.4 However, we predict and find this negative relation is attenuated for
firms with large amounts of tax-induced foreign cash – that is, worldwide cash is less negatively
associated with domestic liabilities among the firms with the most trapped cash offshore, relative
to other MNCs.
To quantify the difference in the level of domestic liabilities due to tax-induced foreign
cash, we then decompose a firm’s worldwide cash holdings into its components: domestic cash,
tax-induced foreign cash, and other foreign cash. If firms view each of these cash holdings as
available and low-cost sources of internal capital, then we expect there to be similar associations
between domestic liabilities and each of these cash components. Indeed, we find that, for the full
sample, all components (including tax-induced foreign cash) are negatively associated with
domestic liabilities on average. However, we again observe an attenuation (i.e., no significantly
negative relation) between tax-induced foreign cash and domestic liabilities for firms with the
highest levels of tax-induced foreign cash. Specifically, firms in the top quintile of tax-induced
foreign cash have an estimated 3.0 to 3.6 percent higher domestic liabilities relative to other U.S.
MNCs. Collectively, these results suggest that large magnitudes of trapped foreign cash are not
viewed by firms as an accessible source of internal capital.
Next, we examine the potential mechanisms motivating these cash-rich firms to borrow
domestically. Specifically, we identify firms with a demand for domestic cash to fund shareholder
payouts, domestic operations, or domestic investments, as well as firms in R&D-intensive
4 BEA data do not provide details of the types of liabilities for most years in our sample period. In additional analysis, we use three years for which such details are available (1994, 2004, and 2009) to confirm that our results are robust to excluding trade notes and accounts payable. Using data available on intercompany loans from 1998 to 2008, we also confirm the results are robust to excluding these related-party loans. We discuss these results in Section 5.

5
industries. We then test whether the association between tax-induced foreign cash and domestic
borrowing is attenuated for these firms. We find that domestic liabilities are increasing in tax-
induced foreign cash for firms with payout obligations, which must be remitted out of the U.S.
parent entity.5 These firms have 3.2 to 3.6 percent higher domestic liabilities relative to other
MNCs. In contrast, we find no differential association between domestic liabilities and tax-induced
foreign cash for firms with a high proportion of domestic employees or compensation expense (as
proxies for the level of domestic operations) or for the firms identified as the most under-invested
domestically (measured following Biddle, Hilary, and Verdi (2009) and extended in Harford,
Wang, and Zhang (2017)). We find an attenuated relation for firms in R&D-intensive industries,
consistent with U.S. MNCs conducting and funding significant R&D activities in the U.S and
having mobile income. These results suggest that some firms with tax-induced foreign cash
balances borrow to fund shareholder payouts or R&D activities, but not to meet domestic capital
needs for operational or investment purposes.
We conduct several additional tests to validate our results and provide additional insights.
First, we find that the cost of debt financing does not affect the relation between tax-induced
foreign cash and domestic liabilities, which provides evidence that our main results are not driven
by firms that simply have a lower cost of debt. Second, additional tests use jurisdiction-specific
BEA data on trade credit and intercompany loans, when available, to confirm that our main results
are not driven by these components of domestic liabilities. Third, we examine whether the higher
levels of domestic liabilities exhibited by firms distributing cash to shareholders constitute either
incremental total liabilities or substituted foreign liabilities. For firms with the attenuated relation
5 Dividends are distributed and repurchases are made by the entity in which shareholders have a direct ownership interest. Although it is possible for a U.S. MNC to have a separately listed foreign subsidiary in which some shareholders own a direct interest, in our study we focus on the behavior of U.S.-incorporated firms with a publicly-traded U.S. parent that would be the primary entity for distributing capital to its shareholders.

6
attributable to payout obligations, we observe higher total worldwide (consolidated) liabilities but
no difference in the level of foreign liabilities, providing evidence consistent with these effects
resulting in incremental total financing.
Our findings contribute to the literature by documenting how the U.S tax policy of
worldwide tax with deferral affects firms’ internal capital markets and external debt financing
decisions. Specifically, we show the extent to which U.S. tax frictions impede the domestic use of
internal foreign capital, thereby inducing firms to access external financing. We also provide
empirical evidence on the characteristics of firms that engage in this type of tax planning by
showing that the negative relation between tax-induced foreign cash and domestic liabilities is
attenuated among payout firms, as well as high-intangibles firms. Finally, this paper contributes
to the literature that documents how the repatriation tax affects MNCs (Foley et al., 2007; Hanlon
et al., 2015; Edwards et al., 2016; De Simone, Piotroski, and Tomy, 2017; Nessa, 2017). It is
important to understand the effects on firm financing because, in addition to circumventing
repatriation taxes, U.S. MNCs with external debt also benefit from U.S. interest deductions, which
further reduce U.S. taxable income and cash taxes due. If repatriation taxes and trapped foreign
cash are associated with increased U.S. debt financing, the U.S. system of deferral may have more
significant tax revenue implications for policy makers than originally estimated.
2. Background and Hypothesis Development
2.1. Overview of Tax Rules for U.S. Multinationals
The United States taxes the worldwide income of companies incorporated in the U.S.
However, U.S. tax law provides an exception, which permits deferral of U.S. taxation of a U.S.
parent’s foreign subsidiaries’ earnings until the earnings are repatriated back to the U.S. parent as

7
a dividend.6 These foreign operating earnings are subject to foreign taxation, if any, in the
jurisdiction where they are earned or sourced, and foreign income taxes paid can be credited
against U.S. taxes upon repatriation. As a result, a U.S. MNC will effectively pay worldwide tax
at the higher of the U.S. or local country rate. Since 1986, most other countries have lowered their
corporate tax rates while the U.S. rate has remained relatively constant (OECD.Stat, 2017); given
that the U.S. now has one of the highest statutory corporate tax rates in the world, most U.S. firms
remit additional U.S. tax upon repatriation.
Related U.S. tax rules prevent firms from circumventing the repatriation tax by restricting
long-term lending to domestic entities by foreign subsidiaries. Code Section 956 prohibits the use
of intercompany loans to deploy foreign cash in domestic operations by recasting long-term
borrowings as deemed dividends, thereby subjecting these loans to repatriation taxes.7 However,
short term loans made by a foreign subsidiary to a related U.S. entity are not subject to deemed
dividend treatment if they are repaid within 30 days and if all loans made by the foreign subsidiary
throughout the year are outstanding for less than 60 days total.8
2.2 Prior Literature and Hypothesis
The prior literature suggests firms with a large amount of cash should use this cash as the
primary source to finance firm operations, investment, and payout policies. Ignoring taxes, the
6 Material passive income is generally taxed immediately under Subpart F of the U.S. Internal Revenue Code. 7 IRC Section 956 recasts certain uses of foreign subsidiary cash as deemed dividend payments to the U.S. parent, triggering repatriation taxes. These uses include i) purchase of tangible property in the U.S.; ii) purchase of a material share of a domestic corporation; iii) an obligation of a U.S. person; or iv) the right to the use of U.S. intangibles developed by a foreign subsidiary. Associated Treasury Regulations elaborate that foreign assets used as collateral or foreign guarantees on U.S. obligations are also subject to repatriation taxes. 8 The rules apply to foreign subsidiaries that are Controlled Foreign Corporations (“CFCs”). Briefly, a CFC is any foreign corporation more than 50 percent owned by U.S. shareholders who at least own ten percent each. In response to the recent financial crisis, the 30/60 day periods were extended to 60/180 days for fiscal years ending after October 3, 2008 and before January 1, 2011 to help firms suffering from domestic liquidity problems. Companies can exploit the tax rules so that these loans are effectively long-term borrowings if the U.S. entity settles the loan with one foreign subsidiary and takes out a loan with another foreign subsidiary on the same day. HP employed such a “revolving loan program” between subsidiaries in Belgium and the Cayman Islands (Permanent Subcommittee, 2012).
8
cost of using internal capital is likely lower than the external cost of capital due to strong internal
monitoring incentives that decrease internal information asymmetry (Williamson, 1975; Alchian,
1969; Gertner et al., 1994; Stein, 1997).9 Managers should therefore prefer internal capital when
available because internal capital is predicted to maximize investment returns and, in turn,
maximize firm value. This literature would suggest that large firm cash holdings (whether
domestic or foreign) should be negatively related to external financing.10
This prediction assumes that firms with tax-induced foreign cash have an efficiently
operating internal capital market in which capital can move freely within the firm. However,
incorporating repatriation taxes into an internal capital market framework suggests that some firms
may be geographically constrained, thereby leading them to obtain external financing. The U.S.
system of deferral and the associated repatriation tax cost motivates firms to shift income to foreign
jurisdictions to benefit from lower foreign tax rates (Grubert, 1998; Klassen and Laplante, 2012a;
Klassen and Laplante, 2012b; Dyreng and Markle, 2016; De Simone, Huang, and Krull, 2017) and
retain the associated cash or other assets offshore (Hines and Hubbard 1990; Desai, Foley, and
Hines, 2001; Foley et al., 2007; Laplante and Nesbitt, 2016; De Simone et al., 2017c). Repatriation
taxes therefore create an internal capital market friction that constrains cash mobility within the
firm and raises the cost of using foreign cash for domestic purposes.11 Instead, a firm’s external
9 Prior literature predicts that internal capital markets benefit from higher quality – and likely greater – information, reducing information asymmetry relative to external capital providers and translating into less costly internal capital because external capital providers will price protect. Models of internal and external capital generally include costs of external financing but minimal or no costs of internal financing. Later theoretical and empirical work examines the “dark side” of internal capital markets (Rajan, Servaes, and Zingales, 2000; Scharfstein and Stein, 2000; Lewellen, 1971), however, these studies do not challenge the assertion that internal capital markets benefit from better monitoring and less information asymmetry. 10 External debt can add value to the firm by generating tax-reducing, and therefore income-increasing, interest deductions (Modigliani and Miller, 1958, 1963; Miller, 1977; DeAngelo and Masulis, 1980; for a review of this literature, see Graham, 2003). This literature on firm capital structure and the tax benefits of debt also motivates a negative association between debt financing and tax-induced foreign cash holdings, which are attributable to relatively lower foreign statutory tax rates; the lower a firm’s marginal tax rate (reflective of lower foreign statutory rates), the lower the benefit of the tax benefits of debt. 11Several related papers focus on firm behavior following the repatriation tax holiday enacted by the American Jobs

9
cost of capital could actually be lower than the cost of internal capital, inclusive of these
repatriation taxes. As a result, we will observe an attenuated negative relation between the level of
external domestic financing and cash holdings for firms with more tax-induced foreign cash, if it
is more efficient (less costly) for these firms to use external debt financing rather than incur the
U.S. repatriation tax cost.12
Three studies provide evidence consistent with this prediction, although they do not
empirically test this relation. In a survey of approximately 400 tax executives, approximately 44
percent state that they issue external debt capital to avoid the repatriation tax (Graham et al. 2010).
Albring (2006) and Petzel and Salbador (2016) estimate the probability that a firm will issue
external debt as a function of the firm’s permanently reinvested foreign earnings, a financial
reporting decision that results in the firm not accruing a deferred tax liability for estimated U.S.
repatriation taxes on foreign earnings. Both papers find that foreign earnings designated as
permanently reinvested are positively associated with the likelihood of the U.S. MNC issuing
public debt.13
Creation Act of 2004, which intended to reduce the internal capital market tax friction by temporarily decreasing repatriation taxes. Blouin and Krull (2009) and Dharmapala, Foley, and Forbes (2011) find that the majority of funds (50 percent and 90 percent, respectively) were paid out to shareholders. Faulkender and Petersen (2012) challenge these results, finding that only a small portion was paid out to shareholders and that financially constrained firms used this cash for investment. Laplante and Nesbitt (2016) use the AJCA to estimate the likelihood and determinants of having trapped foreign cash. De Simone et al. (2017c) examine excess cash holding behavior following the AJCA and proposals in Congress for another (temporary or permanent) repatriation tax reduction. In other work, Chen (2014) examines the effect of repatriation tax costs on investors’ valuation of cash holdings and finds a negative relation. In subsequent tests, she tests and finds that this relation is pronounced in firms with limited domestic borrowing capacity. Harford et al. (2017) also investigate the valuation of foreign cash and discuss how tax costs constrain the internal capital market.12 Prior literature provides an ordering for the use of internal versus external capital, exclusive of tax costs. By adding in tax costs, the cost to access internal capital should increase. However, this does not necessarily mean that information asymmetry with external capital providers will also increase. In fact, external capital providers may know and understand that the firm seeks external capital due to the repatriation tax. Therefore, our hypotheses assume that the external cost of capital is constant (assuming no incremental information asymmetry between the capital providers and the firm due to the repatriation tax and therefore no additional price protection). Empirically, Ma et al. (2016) and Blaylock et al. (2016) interpret their results as evidence of a positive relation between repatriation tax costs and the cost of external debt financing. 13 Albring (2016) studies a relatively small sample of 156 manufacturing firms from 1993 to 2002. Notably, Albring’s (2006) results are not robust to measuring the change in the dollar value of public debt issuances, which is attributed

10
Consistent with these studies, we predict the following:
H1: The negative relation between cash and domestic firm liabilities is attenuated for firms with
greater levels of tax-induced foreign cash.
We also expect that firms with large amounts of tax-induced foreign cash and the greatest
demand for domestic cash, such as those making shareholder payouts (which must be paid by the
U.S. domestic parent company), requiring funding for domestic operations, needing capital for
domestic investment, or with significant R&D activities will turn to external debt financing rather
than incur the repatriation tax cost to access their internal foreign capital. Thus, we predict the
following:
H2: The negative relation between tax-induced foreign cash and domestic firm liabilities is
attenuated for firms with a greater demand for domestic cash.
It is not clear ex ante that we would observe an attenuated negative relation between tax-
induced foreign cash and domestic liabilities across the broader sample for several reasons. First,
Desai et al. (2007) show that approximately 30 percent of U.S. MNCs’ foreign affiliates continue
to pay dividends to the U.S. parent for U.S. investment and payout needs, despite the repatriation
tax liability. This paper therefore suggests that some firms do not need to access external financing
because they are able to use internal funds domestically. Second, Altshuler and Grubert (2003)
show that firms employ different foreign organizational tax planning strategies, which permit firms
to effectively repatriate foreign cash while minimizing the repatriation tax.14 Third, firms may
to an even smaller sample of firms with available data. Petzel and Salbador (2016) study a more recent sample of 222 S&P 500 firms and focus on testing whether the likelihood of debt issuances was different in the pre-AJCA (1998-2002) and post-AJCA (2006-2010) period. They find a positive association in the post-AJCA period but are unable to replicate the Albring (2006) result in the pre-AJCA period. 14 Discussions with practitioners confirm that companies with high expected repatriation costs have developed a number of strategies to tax-efficiently repatriate foreign earnings including separating earnings and profits from foreign taxes, so-called “Killer B” and “Deadly D” reorganizations, basis shifting, and others. An ideal cross-sectional test would identify firms engaging in these strategies and examine the extent to which they have lower domestic debt
11
avoid deemed dividend treatment on intercompany loans from foreign subsidiaries by borrowing
(on a short-term basis) from foreign subsidiaries. Finally, we may not observe a result if firms opt
to trim domestic operations and investment to save domestic cash rather than pay for external
capital, which concurrent papers suggest is higher for firms with greater repatriation tax costs
(Blaylock et al., 2016; Ma et al., 2016). For these reasons, we may observe no attenuation in the
negative relation between tax-induced foreign cash and external firm financing.
3. Research Design, Sample Selection, and Empirical Constructs 3.1.Research Design
To test if the relation between cash and domestic firm financing is mitigated for firms with
large amounts of tax-induced foreign cash (H1), we use the following regression specification:
!"#_%&'(),+ = . +0122_3'4ℎ),+ + 067&8ℎ_9:;3),+ + 0<22_3'4ℎ),+ ∗ 7&8ℎ_9:;3),+ +
3">?@"A4 + B (1)
Dom_Liabi,t is a scaled measure of the dollar amount of domestic liabilities in year t and is
described in more detail in Section 3.2.1. WW_Cashi,t is the firm’s total consolidated worldwide
cash in year t reported in Compustat (CE), scaled by net assets (AT minus CHE). High_TIFCi,t is
an indicator equal to one if TIFCi,t is in the top quintile and zero otherwise, where TIFCi,t is the
firm’s estimated tax-induced foreign cash in year t (following Hanlon et al., 2015 and Foley et al.,
2007) as described in Section 3.2.2.15 We define the controls in Section 3.2.4. We predict 0< > 0.
We also test H1 by decomposing the firm’s total worldwide cash into its components – tax-
induced foreign cash (TIFCi,t), the amount of foreign cash not attributable to the repatriation tax
(PredForCash-Controlsi,t), and domestic cash (Dom_Cashi,t) – and then examining each
component’s relation to domestic liabilities by estimating the following regression specification:
relative to firms unable to capitalize on these strategies; however, we are unable to identify these firms because such strategies are not disclosed. 15 Results are robust to defining High_TIFCi,t based on the top quartile of tax-induced foreign cash holdings.
12
!"#_%&'(),+ = . +019:;3),+ + 06E@FG;"@3'4ℎ − 3">?@"A4),++0<!"#3'4ℎ),+ +
3">?@"A4 + B (2)
We estimate Equation (2) both on the full sample of MNCs and on the sub-sample of MNCs with
large amounts of estimated tax-induced foreign cash (i.e., firm-years for which High_TIFCi,t equals
one). We measure Dom_Cashi,t as the difference between WW_Cashi,t and foreign cash, measured
as the unlogged sum of TIFCi,t, PredForCash-Controlsi,t, and ResidualForCashi,,t, scaled by net
assets.16 Consistent with our first prediction, we expect a more negative relation between domestic
cash and domestic liabilities than between tax-induced foreign cash and domestic liabilities, i.e.,
0I < 01. We make no prediction as to the differences in the other coefficients.
Next, to quantify the extent to which the negative relation between TIFCi,t and Dom_Liabi,t is
attenuated for firms with the greatest domestic demand for cash (H2), we use the following
regression specification:
!"#_%&'(),+ = . +019:;3),+ + 06!"#_!F#'>G),+ + 0<9:;3),+ ∗ !"#!F#'>G),+ +
0IE@FG;"@3'4ℎ − 3">?@"A4),+ + 0K!"#3'4ℎ),+ + 3">?@"A4 + B(3)
where Dom_Demandi,t is an indicator equal to one if the firm has a high demand for domestic cash
in year t relative to other firms in the sample, or zero otherwise; we describe the measurement of
this variable in Section 3.2.3. The other variables are the same as in Equation (1) and are described
in Sections 3.2.2 and 3.2.4. We predict the negative relation between domestic liabilities and tax-
induced foreign cash is attenduated for firms with a domestic demand for cash, i.e., 0< > 0.
16 As detailed below, we observe foreign cash from BEA data 1999 to 2008 and use out-of-sample predicted values for TIFCi,t and PredForCash-Controlsi,t from 1999 through 2012. Thus, we also include ResidualForCashi,t in regressions using the sample for which foreign cash is observable and set ResidualForCashi,t equal to zero for firm-years from 2009 through 2012 for purposes of estimation and calculating Dom_Cashi,t. We eliminate observations with Dom_Cashi,t less than zero, which results in a decrease in sample size from the regression to estimate TIFCi,t in Appendix B (n=5,777) to the sample presented in Column (1) of Table 3 Panel B (n=5,375).
13
All regressions include industry and year fixed effects to control for underlying time trends
and industry-specific characteristics that may affect firm financing decisions unrelated to tax-
induced foreign cash. Variables are winsorized at the 1st and 99th percentiles. Finally, we report
standard errors that are clustered by firm and by year.
3.2.Empirical Proxies
3.2.1. Measures of Financing
Firms generally disclose in their financial statements the total amount of liabilities after
consolidating on a worldwide basis and eliminating intercompany obligations. Therefore, to
observe domestic liabilities, we use data from the BEA. These data permit observation of
jurisdiction-specific (foreign versus domestic) liabilities. To construct Dom_Liabi,t, we use the
total amount of liabilities reported by the U.S. reporter (i.e., the U.S. parent company) on the BEA
annual and benchmark surveys from 1999 through 2012, which includes short-term payables and
trade credit, bank debt, publicly traded debt, intercompany loans, and other long-term liabilities.17
Following Faulkender and Smith (2016), we construct two measures of domestic liabilities,
including Dom_Mkt_Liabi,t, calculated as total domestic liabilities divided by the sum of domestic
liabilities and the market value of equity (CSHO*PRCC_F), and Dom_Book_Liabi,t, calculated as
total domestic liabilities divided by the sum of domestic liabilities and the book value of equity
(SEQ).18
17 The BEA “annual” surveys conducted in 2000-2003, 2005-2008, and 2010-2013 request the amount of “Total Liabilities” for the U.S. parent but do not include additional details as to the type of liability (i.e., trade credit versus long-term debt). The “benchmark” surveys conducted in 1999, 2004, and 2009 include separate line-items for trade accounts/notes payable and other liabilities. In additional tests that use data from these three benchmark years, we confirm that results are robust to excluding the trade credit and intercompany loans. 18 Faulkender and Smith (2016) use BEA data to construct a worldwide weighted-average firm-specific tax rate, calculated as the sum of the proportion of firm income earned in each foreign affiliate’s country, multiplied by the corresponding country’s statutory tax rate. They show that firm debt is increasing in the estimated worldwide weighted-average tax rate. This result also holds when measuring debt using only domestic borrowings. However, Faulkender and Smith (2016) does not test the relation between domestic debt and tax-induced foreign cash, which is the focus of our paper. Our results are also robust to scaling by the sum of worldwide debt and either the market value
14
3.2.2. Tax-Induced Foreign Cash Holdings
To estimate the amount of foreign cash that is held due to repatriation taxes (TIFCi,t), we
use Foley et al.’s (2007) firm-level measure of repatriation taxes. We first calculate the total U.S.
tax that would be due on foreign earnings (before a foreign tax credit) by multiplying a firm’s
foreign income (PIFO) by the U.S. statutory rate (35 percent).19 From this amount, we subtract the
amount of foreign taxes paid (TXFO) as an estimate of the foreign tax credit. The higher of the net
tax due, or zero, is the repatriation tax cost, or REPATi,t. As in prior papers, we acknowledge that
this measure reflects three assumptions: i) foreign reported earnings are an approximation of
unobservable foreign taxable income, ii) use of annual foreign earnings is proportional to the total
stock of foreign earnings that have not yet been repatriated, and iii) foreign tax rates applicable at
the time foreign taxes are paid will be similar to actual foreign rates at the time of repatriation.
To then estimate TIFCi,t, we follow Hanlon et al. (2015) and regress a measure of total
foreign cash in year t on REPAT and control variables (all measured in year t-1). Because foreign
cash data are unavailable from publicly available sources for a large sample of firms, we also
obtain data on foreign cash holdings from the BEA. We present the results of this estimation in
Appendix B and, for comparison purposes, also present Column (1) from Appendix B in Hanlon
et al. (2015). The similarity in the size and economic significance of the coefficients confirms that
the relation between foreign cash and repatriation tax costs has persisted through our more recent
sample period. We then use these coefficients to predict out-of-sample values for the amount of
foreign cash attributable to the repatriation tax, or tax-induced foreign cash (TIFCi,t), for purposes
of equity or the book value of equity. We do not test results using net leverage measures (i.e., total domestic liabilities less domestic cash) because we control for domestic cash in Equations (1)-(3). 19 Foley et al. (2007) use both the statutory tax rate and a firm’s marginal tax rate and arrive at similar empirical results.

15
of estimating Equations (1) through (3).20 To estimate Equation (1), we set the indicator variable
High_TIFCi,t equal to one if TIFCi,t is in the top quintile, and zero otherwise.
3.2.3. Measures of Domestic Demand for Cash
We measure the demand for domestic cash (Dom_Demandi,t) several ways. First, we
construct an indicator variable Payouti,t, which is equal to one if the firm repurchases shares or
pays a dividend in year t, and zero otherwise. Second, we use the proportion of domestic employees
(Dom_Empi,t) as a proxy for domestic capital needed to fund domestic operations. Specifically, we
construct an indicator equal to one if the firm is in the highest quartile based on Dom_Empi,t in a
firm-year, and zero otherwise. We also construct a similar indicator using the proportion of
domestic compensation (Dom_Compi,t). Third, we construct an indicator Underinvesti,t-1, which
is equal to one if the firm is under-invested domestically in year t-1, and zero otherwise. We
identify firms that are domestically underinvested using the worldwide firm-level investment
specification from Biddle et al. (2009), adapted for domestic operations by Harford et al. (2017).
Specifically, we regress domestic capital expenditures scaled by domestic assets in year t-1 on
foreign and domestic measures of sales growth, return on sales, and size, all of which are measured
in year t-2 using BEA data. We use the residual from this regression to construct Underinvesti,t-1
in two ways: first, if the firm has a negative residual, or second, if the residual from this regression
is in the bottom quartile of the sample in that year. Finally, because much R&D activity of U.S.
MNCs occurs domestically, we consider R&D another source of domestic demand for cash. We
measure R&D-intensity based on industry affiliation and construct an indicator, HighR&Di,t, equal
20 Beginning in 2009, the BEA surveys did not include a separate line for foreign affiliates’ cash holdings. Thus, we estimate tax-induced foreign cash for the period 1998 through 2008 using observed foreign cash data and then estimate out-of-sample values for the remaining sample period. Results are robust to excluding 2009 through 2012 (the years for which foreign cash data are not directly observable).

16
to one for firms likely to have high level of domestic R&D expenditures based on Compustat
reporting of a pharmaceutical or computer software industry affiliation, or zero otherwise.21
3.2.4 Control Variables
The control variables include constructs that prior literature has shown to be related to firm
financing, including cash holdings, firm size, financial performance, investment spending, and
shareholder payout policies (Rajan and Zingales, 1995; Frank and Goyal, 2003; Leary and Roberts,
2010; Rauh and Sufi, 2010; Naranjo, Saavedra, and Verdi, 2017). We follow Faulkender and
Smith (2016) to create the empirical proxies for these constructs. We first include Sizei,t, measured
as the logarithm of a firm’s total sales, to control for the firm’s demand for external financing. We
control for the cost of debt by including the indicator Rating_Indi,t, equal to one if the firm has a
bond rating, and zero otherwise. We control for Tangibilityi,t, defined as the sum of the firm’s fixed
assets (PPENT), scaled by the firm’s total assets, and ROAi,t, which is pre-tax income (PI) scaled
by total assets. We include Div_Indicatori,t, which is an indicator equal to one if the firm pays a
dividend, and zero otherwise. We also control for the firm’s investment spending and growth
opportunities by including R&Di,t, the total amount of research and development expense (XRD)
divided by the firm’s assets, and Advertisingi,t, the total amount of advertising expense (XAD)
divided by the firm’s assets. Due to a significant number of missing values, we set R&Di,t and
Advertisingi,t equal to zero if missing. MTBi,t is the ratio of market value of equity
(CSHO*PRCC_F) plus total firm debt (DLTT+DLC) to total assets. To control for the variability
in firm performance and cash flow affecting the firm’s demand for external financing, we calculate
σ(CF)i,t, which is the standard deviation of a firm’s operating cash flows (OANCF) over the five
21 In future work, we intend to leverage BEA data on domestic R&D expenditures to refine this analysis.

17
preceding years; we also control for Depreciationi,t, measured as total depreciation (DP) scaled by
total assets.
3.3. Sample Selection and Descriptive Statistics
We select all U.S. C Corporations in the intersection of Compustat and the BEA for the
period 1999 through 2012 (n=12,284 firm-years). We eliminate observations for firms not
incorporated in the U.S. (n=664 firm-years) and in the financial or utilities industries (n=1,264)
because they are subject to different regulatory provisions that may affect their tax profile. We
require data to estimate TIFCi,t, as well as the measures of domestic liabilities and control
variables, which results in a loss of an additional 1,252 observations. Specifically, we require
positive, non-missing data for total assets (AT), consolidated cash (CE and CHE), pre-tax income
(PI), and sales (SALE). We also require non-missing data to construct measures of the book value
and market value of equity (CEQ, CSHO, PRCC_F), capital expenditures (CAPX), consolidated
debt (DLTT and DLC), domestic liabilities from the BEA, ordinary income (OIBDP), and fixed
assets (PPENT). This results in a sample of 8,764 firm-year observations. Table 1, Panel A
outlines these steps. Table 1, Panel B shows that the sample of firms is evenly distributed across
the period.
Table 2, Panel A presents descriptive statistics. Due to limitations on data disclosure, we
present only mean values and the standard deviation for variables constructed from BEA data. On
average, sample firms have Dom_Mkt_Liabi,t (Dom_Book_Liabi,t) of 0.33 (0.50). Note that these
amounts are higher than the total worldwide leverage Mkt_Levi,t (Book_Levi,t) of 0.23 (0.36),
calculated using consolidated amounts of long-term debt from the publicly reported financial
statements in Compustat. The higher values of domestic liabilities relative to worldwide debt is
attributable to two important differences in the construction of these variables. First, we can only

18
observe total liabilities from BEA, as opposed to the domestic equivalent of long-term debt used
to measure total worldwide market (book) leverage. However, we also calculate worldwide
Mkt_Liabi,t (Book_Liabi,t) using total liabilities from Compustat (LT) instead of long-term debt
(DLC+DLTT) to compare to the BEA measures that we use and present descriptive statistics for
these variables in Table 2 as well. The worldwide averages increase to 0.40 (for Mkt_Liabi,t) and
0.67 (for Book_Liabi,t) and are (as expected) higher than the analogous domestic measures using
BEA data given that they reflect worldwide (not just domestic-only) liabilities. Second, the
measures constructed from BEA data include intercompany debt between the U.S. operations and
foreign affiliates, whereas the consolidated Compustat data eliminate these intercompany loans.
In additional analysis, we also remove these intercompany loans and find robust results; however,
we retain these intercompany loans in these primary measures of financing because they are an
important (and often otherwise unobservable) potential source of financing. In sum, the BEA
measures capture a firm’s total domestic liabilities and allow for subsequent tests of how tax-
induced foreign cash affects the level of both external and internal financing.
The average amount of tax-induced foreign cash (TIFCi,t) is 0.17. This amount is greater
than the 0.10 average reported in Hanlon et al. (2015), likely due to the more recent sample period
during which firms have been earning more amounts of income offshore and retaining (rather than
repatriating) larger amounts of corresponding cash in foreign jurisdictions. The average predicted
amount of cash holdings attributable to other non-tax factors (PredForCash-Controlsi,t) is -4.82,
consistent with the value of -4.87 in Hanlon et al. (2015). The mean values of the control variables
are very similar to those in Faulkender and Smith (2016), including Mkt_Levi,t of 0.23 (0.21 in
Faulkender and Smith 2016), Book_Levi,t of 0.36 (0.34 in Faulkender and Smith 2016),
19
Tangibilityi,t of 0.25 (0.26 in Faulkender and Smith 2016), and Div_Indicatori,t of 0.55 (0.59
Faulkender and Smith 2016). Table 2, Panel B presents a correlation matrix.
4. Results
4.1 Tests of H1
Panel A of Table 3 presents results from estimating Equation (1), in which we regress
measures of domestic liabilities on WW_Cashi,t, High_TIFCi,t, their interaction, and control
variables.22 The first two columns exclude High_TIFCi,t and its interaction with WW_Cashi,t to
validate the negative relation between cash holdings and debt predicted by prior literature.
Columns (1) and (3) use Dom_Mkt_Liabi,t as the dependent variable, and Columns (2) and (4) use
Dom_Book_Liabi,t. All columns estimate Equation (1) on all sample years; we use out-of-sample
predicted values of TIFCi,t for years for which we do not observe foreign cash (2009-2012). Across
the four columns, we find that domestic borrowing is negatively and significantly associated with
a firm’s total cash holdings. This result is consistent with the prior literature on internal capital
markets and the pecking order theory, which states that firms should first use internal cash before
accessing external financing. It is also consistent with the literature on marginal tax rates, which
finds that the lower the marginal tax rate (and, by extension, the higher the repatriation tax cost
and the higher a firm’s tax-induced foreign cash), the lower the amount of external financing.
As a test of our first hypothesis, we include High_TIFCi,t and its interaction with total cash
in Columns (3) and (4). We find that the overall negative relation between cash and debt is
22Although this paper focuses on the effect of repatriation taxes on internal capital markets and domestic financing levels, in untabulated tests we also examine the relation between estimated repatriation taxes and total worldwide liabilities for validation. Because a firm’s repatriation tax cost is negatively correlated with a firm’s marginal tax rate (firms with high estimated repatriation taxes have relatively low global effective tax rates relative to firms with low estimated repatriation taxes), prior literature motivates a negative relation between estimated repatriation taxes or tax-induced foreign cash holdings (which is positively correlated with a firm’s repatriation tax cost liability) and corporate debt financing. Consistent with this prediction, we observe a negative relation between total worldwide market and book liabilities and our proxies for repatriation taxes and tax-induced foreign cash.
20
attenuated for firms with large amounts of tax-induced foreign cash in Column (3). In untabulated
analysis, we also re-estimate this specification across each of the other quintiles and find results
consistent with expectations. In the second through fourth quintile, we observe positive, albeit
insignificant, coefficients among firms with moderate levels of tax-induced foreign cash. In the
first quantile (firms with the lowest level of tax-induced foreign cash), we find a negative and
significant coefficient on the interaction term; this result suggests that, for firms with low levels
of tax-induced foreign cash, this foreign cash is viewed similarly to other cash holdings, consistent
with the repatriation tax not imposing significant internal capital market frictions on these firms.
To estimate the economic magnitude of these results, we standardize all independent
variables to have a mean of zero and a standard deviation of one (untabulated). The coefficient of
-0.037 in Column (3) means that a one-standard-deviation increase in a firm’s worldwide cash is
associated with an approximately 4.6 percentage point decrease in domestic borrowing. Given the
average domestic market liabilities ratio of 0.33 (Table 2, Panel A), this is equivalent to an
approximately 13.9 percent decrease in domestic borrowing. The coefficient on WW_Cashi,t of
0.022 on the interaction of worldwide cash and High_TIFCi,t means that, for firm-years with high
tax-induced foreign cash, a one standard deviation increase in WW_Cashi,t is associated with only
a 2.4 percentage point decrease in domestic borrowings. This translates to an approximately 7.3
percent decrease in domestic liabilities for firms with high tax-induced foreign cash, or
approximately 53 percent of the estimated effect calculated above for firms not in the top quintile
of tax-induced foreign cash.23
23 The standardized coefficient on WW_Cashi,t is -0.046 using the BEA domestic market liabilities ratio; the coefficient on the interaction term WW_Cashi,t*High_TIFCi,t, remains equal to 0.022 given that it is not necessary to standardize the indicator variable High_TIFC, making the net effect for firms with high tax-induced foreign cash 2.4 percentage points (=-0.046+0.022). We calculate the 13.9 and 7.3 percent changes for each group by dividing the coefficient for each group (0.046 and 0.024, respectively) by the sample mean domestic market liabilities ratio (0.33).

21
While we interpret the results in Column (3) as evidence of a significantly attenuated
relation between cash and domestic liabilities for the sub-sample of firms with high levels of
trapped foreign cash, we note that the coefficient on the interaction term in Column (4) is not
significant. In additional tests, we further test the robustness of the relation by using the ratio of
total domestic liabilities to total assets. We find a positive and statistically significant coefficient
of 0.017 (t=2.933), confirming that the results are robust to this alternative measure of domestic
liabilities.
Panel B of Table 3 presents results from estimating Equation (2), in which we regress
measures of domestic liabilities on the components of worldwide cash. Columns (1)-(3) use
Dom_Mkt_Liabi,t as the dependent variable, and Columns (4)-(6) use Dom_Book_Liabi,t. Columns
(1) and (4) estimate Equation (2) on the sample for which we observe foreign cash (1999 through
2008), such that we can also include the residual from the first-stage estimation of TIFCi,t
(presented in Appendix B). The remaining columns use out-of-sample predicted values for all
years from 1999 through 2012. Specifically, Columns (2) and (5) use the full sample of
observations 1999 to 2014, while Columns (3) and (6) limit this full sample to firm-years with
estimated tax-induced foreign cash in the top quintile. Consistent with results in Panel A, across
the broader sample (Columns (1)-(2) and (4)-(5)), we observe negative coefficients on tax-induced
foreign cash, foreign cash held due to other determinants, residual foreign cash, and domestic cash,
and the coefficients on the components other than residual foreign cash are statistically significant.
These coefficients indicate that firms with more cash have lower domestic liabilities.24
24 We note that the negative relation between domestic liabilities and the components of worldwide cash holds for both the sample 1999-2008 with observable foreign cash and the expanded sample that uses predicted foreign cash for 2009-2014, suggesting that our predicted values of tax-induced foreign cash for firm-years that do not report foreign cash are reasonable. We therefore use this sample in all further tests.

22
To estimate the economic magnitude of the results on the full sample, we again standardize
all independent variables to have a mean of zero and a standard deviation of one (untabulated).
The coefficients of -0.035 on TIFCi,t, -0.100 on PredForCash-Controlsi,t, and -0.016 on
Dom_Cashi,t in Column (2) mean that a one-standard-deviation increase in each of these
components of cash holdings is associated with a 1.1 percentage point, 7.1 percentage point, and
2.3 percentage point decrease in domestic borrowing, respectively. Using the average domestic
market liabilities ratio of 0.33 (Table 2, Panel A), these are equivalent to an approximately 3.3
percent, 21.5 percent, and 6.9 percent decrease in domestic borrowing, respectively. The
coefficients in Column (5) and the average domestic book liabilities ratio of 0.50 (Table 2, Panel
A) translate to a 3.6 percent, 12.6 percent, and 6.0 percent decrease in domestic borrowing
associated with a one-standard-deviation increase in TIFCi,t, PredForCash-Controlsi,t, and
Dom_Cashi,t, respectively. Across Columns (1)-(2) and (4)-(5), we estimate that a one-standard-
deviation increase in tax-induced foreign cash is associated with a 3.0 to 3.6 percent decrease in
domestic borrowing.25
When we limit the sample to those firms with the most tax-induced foreign cash (Columns
(3) and (6)), we observe no statistically significant relation between tax-induced foreign cash and
domestic liabilities. Taken together with the above estimated magnitude of the relation between
tax-induced foreign cash and domestic liabilities across the broader sample, this finding suggests
that firms in the top quintile of tax-induced foreign cash have 3.0 to 3.6 higher domestic liabilities
relative to other firms. F tests confirm that the difference in coefficients on TIFCi,t and Dom_Cashi,t
is positive, albeit insignificant, for firms with the most locked out foreign cash, consistent with
25 The standardized coefficients on TIFCi,t in Columns (1)-(2) and (4)-(5) are -0.010, -0.011, -0.016, and -0.018, respectively. We calculate the percent decrease by dividing the standardized coefficient by the mean value of the dependent variable (i.e., 0.33 for the domestic market liabilities ratio and 0.50 for the domestic book liabilities ratio).

23
H1. These results are robust to examining firm-years in the top quartile of estimated tax-induced
foreign cash, and to eliminating trade credit and intercompany loans from the measure of domestic
liabilities. Taken together, the results in Table 3 suggest that large magnitudes of trapped foreign
cash are not viewed as accessible by firms for domestic financing.
4.2 Tests of H2
Table 4 presents results of estimating Equation (3), which tests to what extent the negative
relation between domestic financing and tax-induced foreign cash is attenuated for firms that need
domestic cash. In Panel A, we examine firms requiring domestic cash for shareholder payouts
because distributions to shareholders of U.S. incorporated firms must be made through the U.S.
parent entity. To test the extent to which these payout obligations affect the relation between
TIFCi,t and domestic borrowing, we replace the control variable Div_Indicatori,t with the variable
Payouti,t and interact this variable with TIFCi,t. In Columns (1) and (2), Payouti,t is an indicator
variable equal to one if the firm-year observation either pays a dividend or repurchases shares, and
zero otherwise. In Column (1), we observe a coefficient of -0.063 on TIFCi,t; after standardizing,
this means that a one-standard-deviation increase in tax-induced foreign cash for non-payout firms
is associated with a 2.1 percentage point decrease in domestic borrowing. This translates into a
6.4 percent decrease in domestic borrowing for non-payout firms. We further test the potentially
different effects of dividends and repurchases by setting Payouti,t equal to one if the firm-year
observation pays a dividend (repurchases shares) in Columns (3)-(4) (Columns (5)-(6), or zero
otherwise and continue to find results of similar magnitudes; in these columns, a one-standard-
deviation increase in tax induced foreign cash is associated with a 1.5t o 3.1 percentage point
decrease in domestic borrowing.

24
As predicted in our second hypothesis, we find a positive coefficient on the interaction of
Payouti,t and TIFCi,t across all six columns, consistent with an attenuation of the negative relation
between tax-induced foreign cash and domestic borrowing for firms that need domestic cash to
distribute funds to shareholders. These results are robust to eliminating trade credit or
intercompany loans from the measure of domestic liabilities. The positive coefficient of 0.040 in
Column (1) means that a one-standard-deviation increase in a payout firm’s tax-induced foreign
cash is associated with a 0.9 percentage point decrease in domestic borrowing.26 This translates
into a 2.7 percent decrease in domestic borrowing, or an effect that is approximately 42.9 percent
of the estimated effect for non-payout firms (2.7 percent as compared to 6.3 percent). Similarly,
the positive coefficient of 0.052 in Column (2) means that a one-standard-deviation increase in a
payout firm’s tax-induced foreign cash is associated with a 1.5 percentage point decrease in
domestic borrowing; this translates into a 3.0 percent decrease in domestic borrowing when using
Dom_Book_Liabi,t. These findings suggest that the cost of external domestic finance for firms that
must meet shareholder demands for return of capital is less expensive than incurring the
repatriation tax cost to access the firm’s own foreign capital.
In Panel B, we test if the relation between domestic borrowing and TIFCi,t is attenuated for
firms requiring domestic cash to fund operations, measured based on the proportion of domestic
employees and domestic compensation expense (Dom_Employmenti,t). In Columns (1) and (2),
Dom_Employmenti,t is an indicator variable defined based on whether the firm is in the highest
quartile based on the proportion of domestic employees to the firm’s total employees; in Columns
(3) and (4), it is defined based on whether the firm is in the highest quartile based on the proportion
26 This amount is calculated by adding the standardized coefficient of -0.021 from TIFCi,t with the standardized coefficient of 0.012 on the interaction term.
25
of domestic compensation expense to total compensation expense. We find no evidence of an
attenuated negative relation between TIFCi,t and domestic liabilities for firms with a relatively high
proportion of domestic employees or domestic compensation expense when using the market value
of domestic liabilities as the dependent variable (Columns (1) and (3)). Further, we find some
evidence of a more negative relation when using the book value of domestic leverage as the
dependent variable (Columns (2) and (4)).27 We therefore conclude that U.S. MNCs with tax-
induced foreign cash do not appear to access domestic financing to fund domestic operations,
measured using the proportion of domestic employment levels or compensation expense.
We next consider firms requiring domestic cash to fund domestic investment opportunities,
as prior literature shows that domestic investment opportunities for firms with a significant amount
of permanently reinvested earnings (the financial accounting assertion related to offshore cash) is
more sensitive to domestic cash flow (Blouin et al., 2016). We first identify firms that are
domestically underinvested by estimating domestic capital expenditures as a function of foreign
and domestic sales growth, return on sales, and size (all measured using BEA data), following
Biddle et al. (2009) and adapted by Harford et al. (2017). A negative residual suggests that the
firm is underinvested domestically in that year and thus has some need for domestic cash to fund
these projects. This untanbulated analysis shows that domestic investment is positively associated
with a firm’s domestic assets and is negatively associated with foreign assets.28
27Results are robust to eliminating trade credit from the measure of domestic liabilities. 28 These results reflect estimating investment in year t-1 (relative to year t when the amount of domestic liabilities are measured) using determinants in year t-2. In additional untabulated tests, we also examine investment in year t using determinant measures from year t-1, which yields a larger sample. In these results, we observe that domestic investment is positively and significantly associated with both domestic sales growth and domestic assets, and is negatively associated with foreign sales growth and foreign assets, consistent with the predicted effects from Harford et al. (2017).
26
In Panel C, we present results of estimating Equation (3) when including Underinvesti,t-1
as the measure of domestic demand for cash. We predict a positive coefficient on the interaction
term; that is, we expect that the negative relation between tax-induced foreign cash and domestic
liabilities is attenuated for firms that need to finance domestic investment. In Columns (1) and (2),
Underinvesti,t-1 is an indicator equal to one if the firm-year residual from estimating the domestic
investment model in year t-1 is negative. In Columns (3) and (4), Underinvesti,t-1 is an indicator
equal to one if the residual is in the bottom quartile of the sample. We find mixed evidence of a
differential relation for firms that appear to underinvest domestically; specifically, we observe
positive and significant coefficients in Columns (1) and (2) but negative and significant
coefficients in the remaining columns. It therefore appears that some firms with TIFCi,t borrow
domestically to address domestic underinvestment, but not those firms that are the most
underinvested in the U.S.
We next investigate whether the negative relation between tax-induced foreign cash and
domestic liabilities is attenuated for the subset R&D-intensive firms. We focus on these firms
primarily because much R&D activity of U.S. MNCs occurs domestically, making R&D another
source of domestic demand for cash.29 We measure R&D-intensity based on industry affiliation
and construct an indicator, HighR&Di,t, equal to one for firms likely to have high level of R&D
and intangibles based on Compustat reporting of a pharmaceutical or computer software industry
affiliation, or zero otherwise.30 We present results in Panel D. We observe a positive coefficient
on the interaction term TIFCi,t*HighR&Di,t across both measures of domestic liabilities, and the
29 R&D-intensive firms are interesting to examine for at least two additional reasons. First, Graham et al. (2010) find that repatriation and investment decisions of high-intangibles firms are most sensitive to U.S. repatriation tax accounting and cash tax policies. Second, Pinkowitz et al. (2016) show that the high levels of foreign cash holdings are concentrated in R&D-intensive firms, which are firms with highly mobile income (Harris, Morck, Slemrod, and Yeung, 1993; Grubert and Slemrod, 1998; De Simone, Mills, and Stomberg, 2017). 30 In future work, we intend to refine this measure using BEA data on domestic R&D expenditures.

27
coefficient in Column (1) is statistically significant. To estimate the economic magnitude of these
results, we again standardize TIFCi,t and the control variables to have a mean of zero and a standard
deviation of one (untabulated). The coefficient of -0.036 in Column (1) means that a one-standard-
deviation increase in a firm’s tax-induced foreign cash is associated with an approximately 0.7
percentage point (or 2.1 percent) decrease in the amount of domestic liabilities for the average firm
in the sample.
The collective evidence in Table 4 is generally consistent with our second hypothesis: firms
with a greater domestic demand for cash exhibit an attenuated negative relation between domestic
borrowing and TIFCi,t. However, this result is driven by firms with shareholder payout obligations
and firms in R&D-intensive industries, rather than by the need for domestic cash to fund other
operations or investment projects. Collectively, these results suggest that some firms with tax-
induced foreign cash borrow domestically to subsequently distribute cash to shareholders or
possibly engage in R&D.
5. Additional Analyses
5.1 Falsification Tests
It is possible that our results could reflect that some firms have a lower cost of borrowing
rather than a high domestic demand for cash relative to other firms. To mitigate this concern, our
main tests control for the cost of debt (Rating_Indi,t). Nonetheless, we perform additional tests to
address this alternative explanation for our results. Specifically, we perform a falsification test by
constructing an indicator LowDebtCosti,t, equal to one for firms that we expect to have a lower
cost of debt and zero otherwise, and then re-estimating Equation (3) by replacing this indicator for
Dom_Demandi,t. Table 5 presents these results. We use three measures of LowDebtCosti,t. In
Columns (1) and (2), LowDebtCosti,t is Rating_Indi,t, an indicator equal to one if the firm-year has

28
a bond rating, and zero otherwise.31 In Columns (3) and (4), LowDebtCosti,t is Rating_Cati,t, a
categorical variable equal to zero if the firm has no rating, or equal to one, two, or three if the
firm’s bond rating is in the C range, B range, or A range, respectively, in year t. In Columns (5)
and (6), LowDebtCosti,t is an indicator if the firm is in the bottom tercile based on the firm’s
Whited-Wu Index score. In Columns (1) through (4), we find a positive association between the
main effect of LowDebtCosti,t and domestic financing, suggesting that firms that can access
external capital at a lower cost do so. However, in four out of the six columns we find an
insignificant coefficient on the interaction between LowDebtCosti,t and TIFCi,t, meaning that there
is no statistical difference in the relation between tax-induced foreign cash and domestic liabilities
for firms with a lower cost of debt. In Columns (1) and (3), we find negative and significant
coefficients on the interaction, suggesting that firms with a low cost of debt have lower domestic
liabilities. These results show that our main results are not driven by borrowing behavior of firms
that can more inexpensively access the capital markets.
5.2 Total Worldwide and Foreign Borrowing
Our main results show that the negative relation between TIFCi,t and domestic liabilities is
attenuated for firms with shareholder payout obligations. A natural question is whether the higher
levels of domestic liabilities in these firms reflect either a substitution of foreign liabilities for
domestic liabilities or additional financing that increases the total worldwide liabilities.32
31 This variable is the control variable that we included in the specifications in Tables 3 and 4; in this test, we now consider this a variable of interest and interact it with TIFCi,t. 32 Several papers study how tax rates affect debt placement by examining the level of debt within the foreign subsidiaries of an MNC. Desai, Foley, and Hines (2004) show that a ten percent increase in higher local country rates is associated with 2.7 percent more subsidiary debt because the value of the interest deduction is greater in higher-tax countries. Similarly, Huizinga, Laeven, and Nicodeme (2008) find that firms strategically locate internal intracompany debt in relatively high-tax subsidiaries. Blouin, Huizinga, Laeven, and Nicodeme (2014) examine the extent to which this behavior is curbed by local country thin capitalization regulations and enforcement. In our tests, we study the placement of liabilities in the U.S. parent versus in foreign affiliates. We do not also test the worldwide and foreign debt of firms in R&D-intensive industries as these firms are extensively examined by Pinkowitz et al. (2016).
29
To test the potential substitution of domestic-for-foreign liabilities, we re-estimate
Equation (3) but use measures of total (consolidated) worldwide liabilities as the dependent
variable. Consistent with the tax benefits of debt literature and our results of estimating Equation
(2) on the full sample, we expect a negative relation between tax-induced foreign cash and total
liabilities. We make no prediction about the main effect of shareholder payouts. Our variable of
interest is the interaction between Payouti,t and TIFCi,t. We may find no effect of this interaction
term on total liabilities if the higher domestic liabilities of these payout firms substitute for foreign
liabilities (i.e., the amount of foreign financing goes down as domestic financing increases). In
contrast, the interaction may be positive if the higher domestic liabilities reflect incremental
financing.
Table 6, Panel A presents these results. In Columns (1) and (2), Payouti,t is an indicator
equal to one if the firm-year observation pays either a dividend or repurchases shares, and zero
otherwise. In Columns (3)-(4) (Columns (5)-(6)), Payouti,t is an indicator equal to one if the firm-
year observation pays a dividend (repurchases shares), or zero otherwise. Across all measures of
shareholder payouts and total worldwide liabilities, we estimate a positive and significant
coefficient on the interaction term. These results indicate an attenuation of the negative relation
between tax-induced foreign cash and total liabilities for firms making shareholder payouts,
suggesting that these firms have higher total liabilities relative to other firms. The coefficients in
Columns (3) to (5) suggest that there is no overall decrease in total borrowing associated with an
increase in tax-induced foreign cash; that is, the coefficients of -0.039, -0.052, and 0.053,
respectively, on the main effect of TIFCi,t are completely offset by the coefficients of 0.041, 0.064,
and 0.054, respectively, on the interaction term.

30
To shed further light on whether higher domestic financing is incremental, we next test the
relation between tax-induced foreign cash and foreign liabilities (from BEA) for firms making
shareholder payouts. We present these results in Panel B. If higher domestic liabilities are
additional liabilities that increase the worldwide liabilities, we expect no change to foreign
liabilities, and therefore an insignificant coefficient on the interaction. In contrast, if higher
domestic liabilities replace foreign liabilities, we expect a negative coefficient on the interaction.
In three out of the six columns, we find a significantly positive coefficient on the interaction,
suggesting that the subsample of firms with shareholder payout obligations have higher foreign
debt as well. These results are robust to eliminating trade credit or intercompany loans from the
measure of liabilities. Collectively, the results in Table 6 provide evidence supporting that the
relatively higher levels of domestic liabilities by the subset of payout firms are incremental
worldwide liabilities, not offset by lower foreign borrowing. Further, because total worldwide
liabilities eliminate intercompany debt on consolidation, these findings also support that our main
results are not driven by intercompany loans that circumvent the deemed dividend rules of U.S.
tax law. Given evidence in prior literature that corporations appear to be under-leveraged (e.g.,
Graham 2000), future work could explore whether tax-induced internal capital market constraints
push firms with domestic demand for cash towards a more optimal debt ratio.
5.3 Additional Tests and Future Work
BEA data allow us to observe different components of liabilities in some survey years. We
exploit this granularity to refine our tests when possible. First, we are able to observe trade
payables versus other domestic liabilities for the benchmark years 1999, 2004, and 2009. When
we remove trade payables from our measure of domestic liabilities, we continue to observe a
negative relation between worldwide cash and domestic liabilities and an attenuated negative
31
relation for firm-years with high tax-induced foreign cash and making shareholder payouts. These
tests provide some comfort that our main results are not driven by trade payables but rather by
external interest-bearing debt. Second, we observe data on intercompany loans from 1999 to 2008.
We therefore confirm that our main results obtain when we remove intercompany loans from our
measure of domestic liabilities, again suggesting that our main results are not driven by increased
borrowing by the domestic parent from the foreign subsidiaries. In future work, we intend to
examine what form of domestic liabilities is preferred by MNCs with tax-induced foreign cash. In
addition, we intend to explore whether firms that do not appear to require additional domestic
liabilities to meet domestic cash needs use intercompany loans instead, and we will include tests
that use new debt issuances to examine the relation between tax-induced foreign cash and marginal
financing decisions.
6. Conclusion
In summary, this paper examines how U.S. repatriation taxes and tax-induced foreign cash
affect external financing decisions. The academic literature has begun to document the economic
effects of the U.S. repatriation tax, but there is still much to know about how the large amount of
foreign cash holdings, partially induced by repatriation tax liabilities, affect firms and the U.S.
economy. We extend this line of literature by examining the important decision of why cash-rich
U.S. MNCs access external financing. We revisit the predictions from prior literature that firms
will generally use internal capital first to fund operations, investment, and payout policies. In our
setting, this prediction does not seem to be valid for a subset of firms with large magnitudes of
trapped foreign cash or domestic cash needs, given that the repatriation tax cost makes internal
capital expensive for these firms. We empirically test and show that the negative relation between
domestic borrowing and cash holdings is attenuated for firms with large amounts of tax-induced
32
foreign cash. Further, we show the negative relation between domestic borrowing and tax-induced
foreign cash is attenuated for firms that make shareholder payouts and engage in relatively high
levels of R&D activity. Additional tests suggest that these results are not driven by a differential
cost of debt, trade credit, or intercompany loans and that increased domestic liabilities are
incremental worldwide liabilities, not offset by lower foreign borrowing. Our study adds to both
the capital markets literature and policy discussions about the implications of the U.S. worldwide
tax system.

33
References
Abramowicz, L. 2017. Tech companies to Trump: Show us the tax break. Bloomberg, January 30.
Albring, S. 2006. The Effects of the cost of foreign internal funds on the probability that a firm issues domestic debt. Journal of the American Taxation Association 28: 25-41.
Alchian, A.A. 1969. Corporate management and property rights in H. Manne, ed., Economic Policy and the Regulation of Corporate Securities. American Enterprise Institute 337-360.
Altshuler, R. and Grubert, H. 2003. Repatriation taxes, repatriation strategies and multinational financial policy. Journal of Public Economics 87: 73-107.
Barthold, T. 2016. Joint Committee on Taxation letter to Chairman Brady and Mr. Neal dated August 3, 2016.
Biddle, G., Hilary, G., and Verdi, R. 2009. How does financial reporting quality relate to investment efficiency? Journal of Accounting and Economics 48: 112-131.
Blaylock, B. S., Downes, J. F., Mathis, M. E., and White, S. D. 2016. Measuring the cost of trapped foreign earnings: Evidence from new bond issuances. Working paper.
Blouin, J. L., Huizinga, H., Laeven, L., and Nicodeme, G. 2014. Thin capitalization rules and multinational firm capital structure. Working paper.
Blouin, J. L., and Krull, L. K. 2009. Bringing it home: A study of the incentives surrounding the repatriation of foreign earnings under the American Jobs Creation Act of 2004. Journal of Accounting Research 47: 1027–59.
Blouin, J., L., Krull, L. K., and Robinson, L. 2016. The location, composition, and investment implications of permanently reinvested earnings. Working paper.
Chen, N. 2014. Repatriation taxes and the value of cash holdings. Working paper. De Simone, L., Huang, J., and Krull, L. 2017a. R&D and the rising foreign profitability of U.S.
multinational corporations. Working paper. De Simone, L., Mills, L., and Stomberg, B. 2017b. Using IRS data to examine income shifting
firms. Working paper. De Simone, L., Piotroski, J., and Tomy, R. 2017c. Repatriation taxes and foreign cash holdings:
The impact of anticipated tax policy. Working paper. DeAngelo, H., and Masulis, R. 1980. Optimal capital structure under corporate and personal
taxation. Journal of Financial Economics 8: 3-29. Desai, M., Foley, F. and Hines, J. 2001. Repatriation taxes and dividend distortions. National Tax
Journal 54: 829-851. Desai, M., Foley, F. and Hines, J. 2004. A multinational perspective on capital structure choice
and internal capital markets. Journal of Finance 59: 2451-2487. Desai, M., Foley, F. and Hines, J. 2007. Dividend policy inside the multinational firm. Financial
Management 36: 5-26. Dharmapala, D., Foley, C. F., and Forbes, K. 2011. Watch what I do, not what I say: The
unintended consequences of the Homeland Investment Act. Journal of Finance 66: 753–87.

34
Dobridge, C. and Landefeld, P. 2017. Is the Cash Locked Out? Evidence from U.S. Multinational Tax Filings. Working paper.
Dyreng, S. and Markle, K. 2016. The effect of financial constraints on tax-motivated income shifting by U.S. multinationals. The Accounting Review 91: 1601-1627.
Edwards, A., Kravet, T., and Wilson, R. 2016. Trapped cash and the profitability of foreign cash acquisitions. Contemporary Accounting Research 33: 44-77.
Eisen, B. 2017. Not just stocks: Companies could use repatriated cash to pay down debt. Wall Street Journal, July 11.
Faulkender, M. and Petersen, M. 2012. Investment and capital constraints: Repatriations under the American Jobs Creation Act. Review of Financial Studies 25: 3351-3388.
Faulkender, M. and Smith, J. 2016. Taxes and leverage at multinational corporations. Journal of Financial Economics 122: 1-20.
Foley, F., Hartzell, J., Titman, S., Twite, G. 2007. Why do firms hold so much cash? A tax-based explanation. Journal of Financial Economics 86: 579-607.
Frank, M.Z., and Goyal, V.K. 2003. Testing the pecking order theory of capital structure. Journal of Financial Economics 67: 217-248.
Gertner, R., Scharfstein, D., and Stein, J. 1994. Internal versus external capital markets. Quarterly Journal of Economics 109: 1211-1230.
Graham, J. 2000. How big are the tax benefits of debt? Journal of Finance 55: 1901-1941. Graham, J. 2003. Tax and corporate finance: A review. Review of Financial Studies 16: 1075-
1129. Graham, J., Hanlon, M., and Shevlin, T. 2010. Barriers to mobility: The lockout effect of U.S.
taxation of worldwide corporate profits. National Tax Journal 63: 1111–44. Grubert, H. 1998. Taxes and the division of foreign operating income among royalties, interest,
dividends and retained earnings. Journal of Public Economics 68: 269-290. Grubert, H. and Slemrod, J. 1998. The effect of taxes on investment and income shifting to Puerto
Rico. Review of Economics and Statistics 80: 365-373. Hanlon, M., Lester, R., and Verdi, R. 2015. The effect of repatriation tax costs on firm investment.
Journal of Financial Economics 116: 179-196. Harford, J., Wang, C., and Zhang, K. 2017. Foreign cash: Taxes, internal capital markets, and
agency problems. Review of Financial Studies, forthcoming. Harris, D., Morck, R., Slemrod, J., and Yeung, B. 1993. Income shifting in U.S. multinational
corporations. In Studies in International Taxation, University of Chicago Press. Hines, J.R. and Hubbard, R.G. 1990. Coming home to America: Dividend repatriations by US
multinationals. In: Razin, A., Slemrod, J. (Eds.), Taxation in the Global Economy. University of Chicago Press, Chicago, IL: 161-200.
Huizinga, H., Laeven, L., and Nicodeme, G. 2008. Capital structure and international debt shifting. Jounral of Financial Economics 88: 80-118.
Klassen, K. and Laplante, S. 2012a. The effect of foreign reinvestment and financial reporting incentives on cross-jurisdictional income shifting. Contemporary Accounting Research 29: 928-955.

35
Klassen, K. and Laplante, S. 2012b. Are U.S. multinational corporations becoming more aggressive shifters? Journal of Accounting Research 50: 1245-1286.
Krull, L. 2004. Permanently reinvested foreign earnings, taxes, and earnings management. The Accounting Review 79: 745-767.
Laplante, S. and Nesbitt, W. 2017. Estimating the likelihood that a U.S. multinational firm has cash trapped in foreign subsidiaries. Working paper.
Lattman, P. and Eavis, P. 2013. To satisfy its investors, cash-rich Apple borrows money. New York Times, April 30.
Leary, M.T. and Roberts, M.R. 2010. The pecking order, debt capacity, and information asymmetry. Journal of Financial Economics 95: 332-355.
Lewellen, W.G. 1971. A pure financial rationale for the conglomerate merger. Journal of Finance 26: 521-537.
Linebaugh, K. 2012. Top U.S. firms are cash-rich abroad, cash-poor at home. Wall Street Journal, December 4.
Ma, Z., Stice, D., and Wang, D. 2016. Earnings repatriation and bank loan contracting. Working paper.
Mead, C. and Kucera, D. 2012. EBay skirts cash repatriation with bond issue: Corporate finance. Bloomberg.
Miller, M. H. 1977. Debt and taxes. Journal of Finance 32: 261-275. Modigliani, F., and Miller, M. H. 1958. The cost of capital, corporation finance and the theory of
investment. American Economic Review 48: 261-297. Modigliani, F., and Miller, M. H. 1963. Corporate income taxes and the cost of capital: A
correction (in communications). American Economic Review 53: 433-443. Myers, S. 1984. The capital structure puzzle. Journal of Finance 39: 574-592. Myers, S. and Majluf, N. 1984. Corporate financing decisions when firms have investment
information that investors do not. Journal of Financial Economics, 13: 187-221. Naranjo, P., Saavedra, D. and Verdi, R. 2017. Financial reporting regulation and financing
decisions. Working paper. Nessa, M. 2017. Repatriation tax costs and U.S. multinational companies’ shareholder payouts.
The Accounting Review 92: 217-241. OECD.Stat Table II.1 Statutory Corporate Income Tax Rate. 2017.
http://stats.oecd.org/index.aspx?DataSetCode=TABLE_II1# Petzel, T., and Salbador, H. 2016. Do tax holidays increase expectations of future tax holidays: An
examination of debt issuances pre- and post-AJCA. Working paper, Virginia Polytechnic Institute & State University.
Pinkowitz, L., Stulz, R. M., and Williamson, R. 2016. Do U.S. firms hold more cash than foreign firms do? Review of Financial Studies 29: 309-348.
Rajan, R.G., and Zingales, L. 1995. What do we know about capital structure? Some evidence from international data. Journal of Finance 50: 1421-1460.
Rajan, R.G., Servaes, H., and Zingales, L. 2000. The cost of diversity: the diversification discount and inefficient investment. Journal of Finance, 55: 35-80.
36
Rauh, J. and Sufi, A. 2010. Capital structure and debt structure. Review of Financial Studies 23: 4242-4280.
Scharfstein, D. and Stein, J.C. 2000. The dark side of internal capital markets: divisional rent-seeking and inefficient investment. Journal of Finance 55: 2537-2564.
Shyam-Sunders, L. and Myers, S. 1999. Testing static tradeoff against pecking order models of capital structure. Journal of Financial Economics 51: 219-244.
Stein, J.C. 1997. Internal capital markets and the competition for corporate resources. Journal of Finance 52: 111-133.
U.S. Senate Permanent Subcommittee on Investigations – Committee on Homeland Security and Governmental Affairs. 2012. Offshore Profit Shifting and the U.S. Tax Code.
Whited, T., and Wu, G. 2006. Financial constraints risk. Review of Financial Studies 19: 531-559.
Williamson, O.E. 1975. Markets and hierarchies: Analysis and antitrust implications. Collier Macmillan Publishers, Inc.
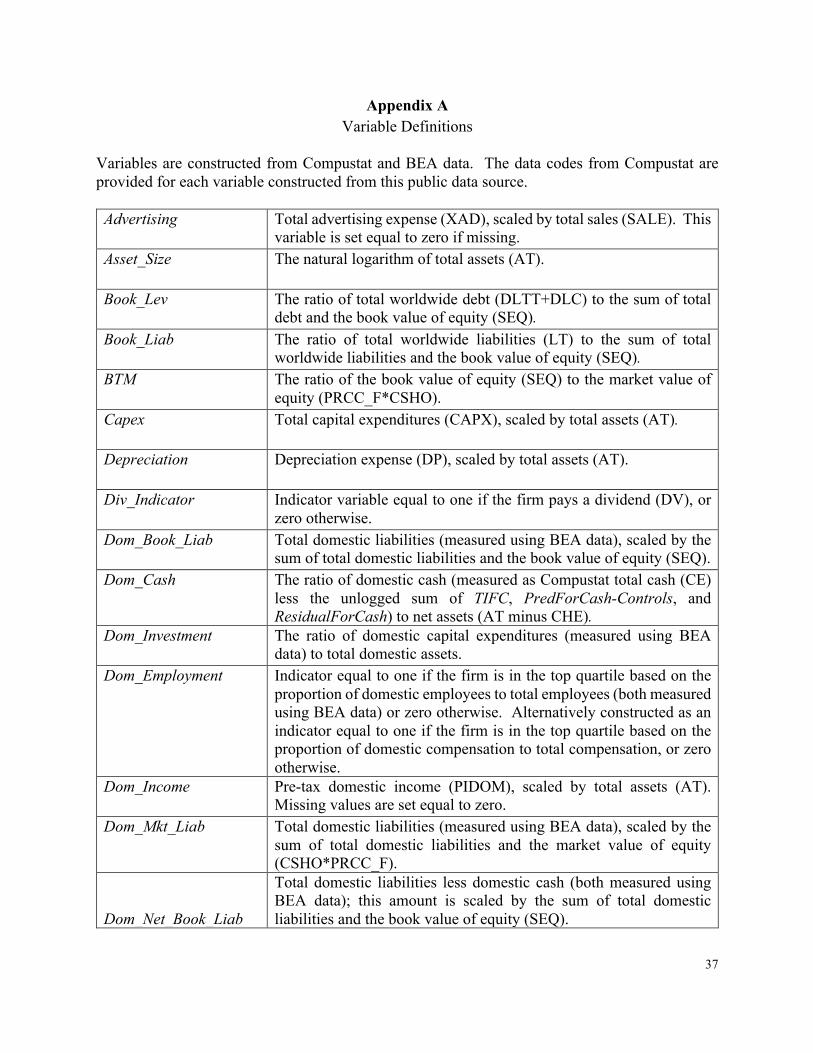
37
Appendix A Variable Definitions
Variables are constructed from Compustat and BEA data. The data codes from Compustat are provided for each variable constructed from this public data source.
Advertising Total advertising expense (XAD), scaled by total sales (SALE). This
variable is set equal to zero if missing. Asset_Size The natural logarithm of total assets (AT).
Book_Lev The ratio of total worldwide debt (DLTT+DLC) to the sum of total debt and the book value of equity (SEQ).
Book_Liab The ratio of total worldwide liabilities (LT) to the sum of total worldwide liabilities and the book value of equity (SEQ).
BTM The ratio of the book value of equity (SEQ) to the market value of equity (PRCC_F*CSHO).
Capex Total capital expenditures (CAPX), scaled by total assets (AT).
Depreciation Depreciation expense (DP), scaled by total assets (AT).
Div_Indicator Indicator variable equal to one if the firm pays a dividend (DV), or zero otherwise.
Dom_Book_Liab Total domestic liabilities (measured using BEA data), scaled by the sum of total domestic liabilities and the book value of equity (SEQ).
Dom_Cash The ratio of domestic cash (measured as Compustat total cash (CE) less the unlogged sum of TIFC, PredForCash-Controls, and ResidualForCash) to net assets (AT minus CHE).
Dom_Investment The ratio of domestic capital expenditures (measured using BEA data) to total domestic assets.
Dom_Employment Indicator equal to one if the firm is in the top quartile based on the proportion of domestic employees to total employees (both measured using BEA data) or zero otherwise. Alternatively constructed as an indicator equal to one if the firm is in the top quartile based on the proportion of domestic compensation to total compensation, or zero otherwise.
Dom_Income Pre-tax domestic income (PIDOM), scaled by total assets (AT). Missing values are set equal to zero.
Dom_Mkt_Liab Total domestic liabilities (measured using BEA data), scaled by the sum of total domestic liabilities and the market value of equity (CSHO*PRCC_F).
Dom_Net_Book_Liab
Total domestic liabilities less domestic cash (both measured using BEA data); this amount is scaled by the sum of total domestic liabilities and the book value of equity (SEQ).

38
Dom_Net_Mkt_Liab Total domestic liabilities less domestic cash (both measured using BEA data); this amount is scaled by the sum of total domestic liabilities and the market value of equity (CSHO*PRCC_F).
Dom_ROS Total domestic net income scaled by domestic sales (both measured using BEA data).
Dom_Sales_Growth The difference in domestic sales from year t-1 to t, scaled by domestic sales in year t-1 (both measured using BEA data).
Dom_Size The natural logarithm of total domestic assets (measured using BEA data).
Foreign_Cash The natural logarithm of the ratio of foreign cash (measured using BEA data) to net assets (AT minus CHE).
For_ROS Total foreign net income scaled by foreign sales (both measured using BEA data).
For_Sales_Growth The difference in foreign sales from year t-1 to t, scaled by foreign sales in year t-1 (both measured using BEA data).
For_Size The natural logarithm of total foreign assets (measured using BEA data).
HighR&D Indicator equal to one if a firm is in a computer or pharmaceutical industry, or zero otherwise.
LowDebtCost This variable is defined in three ways: first, as an indicator equal to one if the firm has a bond rating; second, as a categorical variable equal to 1, 2, or 3 if the firm’s bond rating is in the C range, B range, or A range, respectively; and third, as an indicator equal to one based on the Whited-Wu index.
Mkt_Lev The ratio of total debt (DLTT+DLC) to the sum of total debt and the market value of equity (CHSO*PRCC_F).
Mkt_Liab The ratio of total worldwide liabilities (LT) to the sum of total worldwide liabilities and the market value of equity (CHSO*PRCC_F).
MTB The sum of the market value of equity and total long-term debt (DLTT+DLC) scaled by total assets (AT).
Payout Indicator equal to one if the firm either pays dividends or repurchases shares in year t, or zero otherwise.
PredForCash-Controls
Estimated amount of foreign cash attributable to non-tax factors, estimated following Foley et al. (2007) and Hanlon et al. (2015). This estimation is reported in Appendix B.
ResidualForCash Residual from estimating the Foley et al. (2007) and Hanlon et al. (2015) tax-induced foreign cash model; the residual captures the unexplained portion of foreign cash holdings. This estimation is reported in Appendix B.
Rating_Cat A categorical variable equal to 1, 2, or 3 if the firm’s bond rating is in the C range, B range, or A range, respectively in year t.
Rating_Ind Indicator equal to one if the company has a bond rating, or zero otherwise.
REPAT Measures the incremental U.S. tax due upon repatriation of cash from foreign subsidiaries. This measure is calculated by multiplying

39
foreign earnings (PIFO) by the statutory U.S. tax rate of 35%. From this, foreign taxes (TXFO) are subtracted as an estimate of the allowable foreign tax credit. The remaining liability is the estimated U.S. tax due upon repatriation. The maximum of this difference or zero is scaled by total assets (AT).
R&D Total R&D expenses (XRD), scaled by total sales (SALE). This variable is set equal to zero if missing.
RD_Ratio Total R&D expenses (XRD), scaled by total assets (AT). This variable is set equal to zero if missing.
ROA Pre-tax income (PI) scaled by total assets (AT). σ(CF) Standard deviation, over the preceding five years, of the firm’s
operating cash flow (OANCF) to total assets (AT). σ(OpInc) Standard deviation, over the sample period, of the ratio of the firm’s
EBITDA (OIBDP) to total assets (AT). Size The natural logarithm of total sales (SALE). Tangibility Total plant, property, and equipment (PPENT) scaled by total assets
(AT). TIFC Estimated tax-induced foreign cash estimated by regressing total
foreign cash on REPAT and control variables following Foley et al. (2007) and Hanlon et al. (2015). This estimation is reported in Appendix B.
Underinvest Indicator equal to one if the firm is in the bottom quartile or has a negative residual from the domestic investment model following Biddle et al. (2009) and Harford et al. (2017), zero otherwise.
Whited_Wu An index of firm financing constraints from Whited and Wu (2006) equal to (-0.091*Cash Flow) - (0.062*Dividend_Indicator) + (0.021*Long Term Debt) - (0.044*Size) + (0.102*Industry Sales Growth) - (0.035*Sales Growth).
WW_Cash The ratio of total consolidated worldwide cash (Compustat CE) to net assets (AT minus CHE).

40
Appendix B First-Stage Estimation of Tax-Induced Foreign Cash
1998 through 2008 This table presents estimated coefficients from a first-stage regression in which we regress a firm’s foreign cash holdings (observed from BEA data) on REPATi,t-1, the estimated amount of a firm’s repatriation tax liability, and control variables. This specification allows us to estimate TIFCi,t, the amount of tax-induced foreign cash, for the period 1998 through 2008. The columns present estimated coefficients and t-statistics from the determinants of foreign cash model following Foley et al. (2007) and Hanlon et al. (2015): Foreign_Cashi,t = a + β1*REPATi,t-1 + β2*Sizei,t-1 + β3*Dom_Incomei,t-1 + β4*Div_Indicatori,t-1 +
β5*BTMi,t-1 + β6*σ(OpInc)i,t-1 + β7*R&Di,t-1 + β8*Capexi,t-1 + β9*Mkt_Levi,t-1 + IndustryFE + YearFE The dependent variable Foreign_Cashi,t is the natural logarithm of the ratio of foreign cash to net assets (total assets minus cash). The variable of interest, REPATi,t-1, is the maximum of foreign earnings (PIFO) times the U.S. statutory tax rate of 35 percent less foreign taxes (TXFO), and zero, scaled by total assets. We use the estimated coefficient on REPATi,t-1 to obtain TIFCi,t as follows: TIFCi,t = 0 1*REPATi,t-1. All variables are defined in Appendix A. The regression specification includes year and industry fixed effects. t-statistics are presented in parentheses. Standard errors are clustered by firm. *, **, and *** indicate two-tailed statistical significance at the 10%, 5%, and 1% levels, respectively. Dependent Var: Foreign_Cashi,t Hanlon et al. (2015)
Appendix B, Col. (1) 1989-2003
1998-2008
REPATt-1 45.29*** 43.20*** (5.29) (8.17) DomIncomet-1 -0.70 -0.72* (-0.97) (-1.73) AssetSizet-1 -0.14*** -0.02 (-2.99) (-0.60) Div_Indicatort-1 -0.19 -0.07 (-1.32) (-0.76) BTMt-1 -0.04 -0.01 (-0.67) (-1.38) σ(OpInc)t-1 2.80 2.81** (1.50) (2.07) RD_Ratiot-1 2.04 6.11*** (1.39) (6.37) Capext-1 1.77 -1.57 (1.30) (-1.55) Mkt_Levt-1 -0.66** -1.11*** (-2.08) (-5.70) Industry and Year FE? Y Y Observations 3,012 5,777 R-squared 0.112 0.186
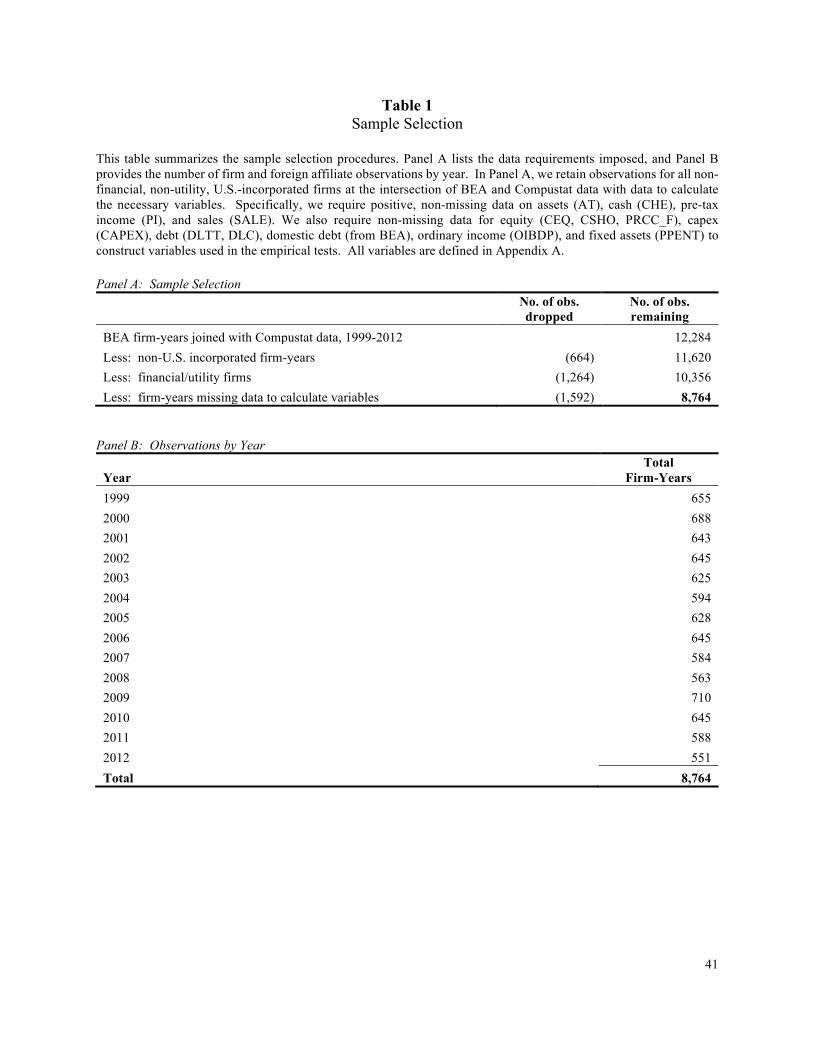
41
Table 1 Sample Selection
This table summarizes the sample selection procedures. Panel A lists the data requirements imposed, and Panel B provides the number of firm and foreign affiliate observations by year. In Panel A, we retain observations for all non-financial, non-utility, U.S.-incorporated firms at the intersection of BEA and Compustat data with data to calculate the necessary variables. Specifically, we require positive, non-missing data on assets (AT), cash (CHE), pre-tax income (PI), and sales (SALE). We also require non-missing data for equity (CEQ, CSHO, PRCC_F), capex (CAPEX), debt (DLTT, DLC), domestic debt (from BEA), ordinary income (OIBDP), and fixed assets (PPENT) to construct variables used in the empirical tests. All variables are defined in Appendix A.
Panel A: Sample Selection
No. of obs. dropped
No. of obs. remaining
BEA firm-years joined with Compustat data, 1999-2012 12,284 Less: non-U.S. incorporated firm-years (664) 11,620 Less: financial/utility firms (1,264) 10,356 Less: firm-years missing data to calculate variables (1,592) 8,764
Panel B: Observations by Year
Year Total
Firm-Years 1999 655 2000 688 2001 643 2002 645 2003 625 2004 594 2005 628 2006 645 2007 584 2008 563 2009 710 2010 645 2011 588 2012 551 Total 8,764
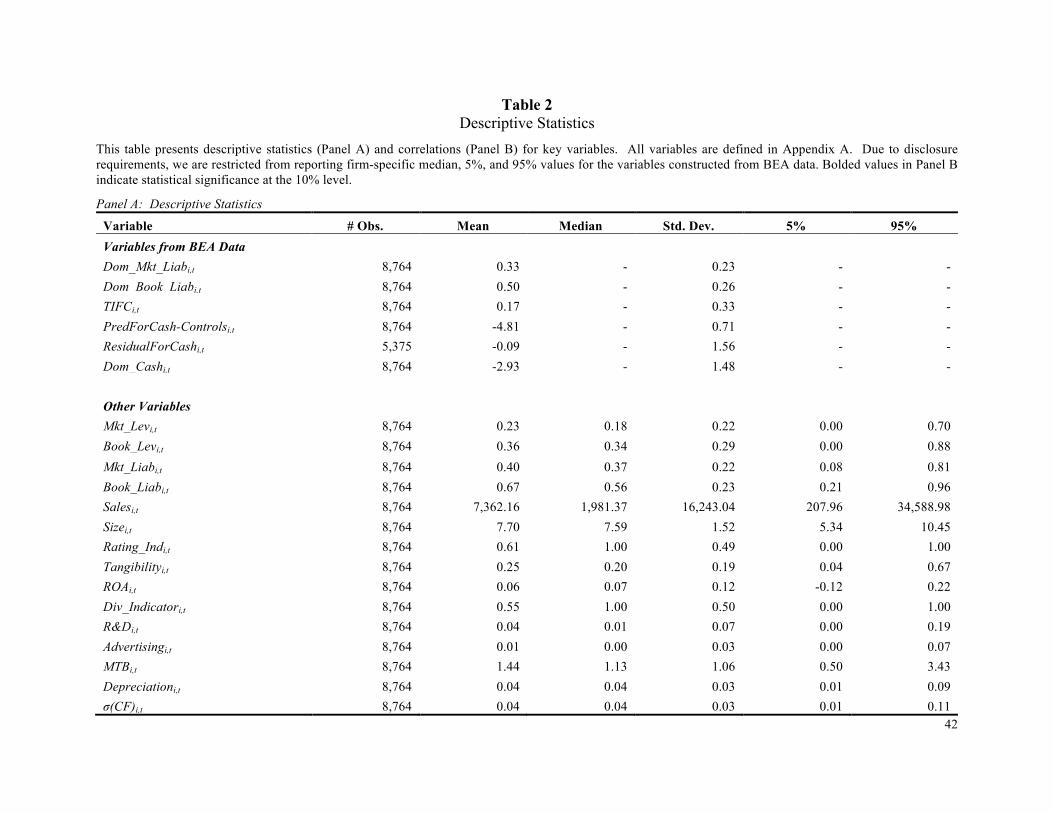
42
Table 2 Descriptive Statistics
This table presents descriptive statistics (Panel A) and correlations (Panel B) for key variables. All variables are defined in Appendix A. Due to disclosure requirements, we are restricted from reporting firm-specific median, 5%, and 95% values for the variables constructed from BEA data. Bolded values in Panel B indicate statistical significance at the 10% level.
Panel A: Descriptive Statistics
Variable # Obs. Mean Median Std. Dev. 5% 95% Variables from BEA Data Dom_Mkt_Liabi,t 8,764 0.33 - 0.23 - - Dom_Book_Liabi,t 8,764 0.50 - 0.26 - - TIFCi,t 8,764 0.17 - 0.33 - - PredForCash-Controlsi,t 8,764 -4.81 - 0.71 - - ResidualForCashi,t 5,375 -0.09 - 1.56 - - Dom_Cashi,t 8,764 -2.93 - 1.48 - - Other Variables Mkt_Levi,t 8,764 0.23 0.18 0.22 0.00 0.70 Book_Levi,t 8,764 0.36 0.34 0.29 0.00 0.88
Mkt_Liabi,t 8,764 0.40 0.37 0.22 0.08 0.81 Book_Liabi,t 8,764 0.67 0.56 0.23 0.21 0.96 Salesi,t 8,764 7,362.16 1,981.37 16,243.04 207.96 34,588.98 Sizei,t 8,764 7.70 7.59 1.52 5.34 10.45 Rating_Indi,t 8,764 0.61 1.00 0.49 0.00 1.00 Tangibilityi,t 8,764 0.25 0.20 0.19 0.04 0.67 ROAi,t 8,764 0.06 0.07 0.12 -0.12 0.22 Div_Indicatori,t 8,764 0.55 1.00 0.50 0.00 1.00 R&Di,t 8,764 0.04 0.01 0.07 0.00 0.19 Advertisingi,t 8,764 0.01 0.00 0.03 0.00 0.07 MTBi,t 8,764 1.44 1.13 1.06 0.50 3.43 Depreciationi,t 8,764 0.04 0.04 0.03 0.01 0.09 σ(CF)i,t 8,764 0.04 0.04 0.03 0.01 0.11

43
Table 2 Descriptive Statistics (cont’d.)
Panel B: Correlation Matrix
(1) (2) (3) (4) (5) (6) (7) (8) (9) (10) (11) (12) (13) (14) (15) (16) (1) Dom_Mtk_Liabi,t 1.00 0.77 -0.25 -0.43 -0.06 -0.35 0.07 0.25 0.22 -0.46 -0.04 -0.32 -0.07 -0.48 0.12 -0.05
(2) Dom_Book_Liabi,t 0.80 1.00 -0.19 -0.36 -0.05 -0.30 0.21 0.34 0.18 -0.26 0.05 -0.26 0.01 -0.20 0.13 -0.06
(3) TIFCi,t -0.25 -0.19 1.00 0.19 0.01 0.17 0.00 -0.05 -0.08 0.16 -0.05 0.22 0.04 0.22 -0.07 0.06
(4) PredForCash-Controlsi,t -0.42 -0.38 0.21 1.00 0.02 0.42 -0.14 -0.25 -0.38 0.06 -0.16 0.55 -0.04 0.24 -0.11 0.20
(5) ResidualForCashi,t -0.08 -0.07 0.03 0.00 1.00 0.11 0.01 -0.02 -0.08 0.03 -0.01 0.01 0.04 0.04 -0.01 0.03
(6) Dom_Cashi,t -0.37 -0.36 0.10 0.43 0.11 1.00 -0.19 -0.27 -0.34 0.06 -0.22 0.36 0.02 0.21 -0.10 0.23
(7) Sizei,t 0.06 0.24 0.04 -0.14 0.05 -0.21 1.00 0.55 0.07 0.20 0.35 -0.16 0.12 0.05 -0.10 -0.27
(8) Rating_Indi,t 0.25 0.38 0.01 -0.24 0.00 -0.28 0.54 1.00 0.20 0.01 0.24 -0.18 0.08 -0.06 -0.01 -0.22
(9) Tangibilityi,t 0.22 0.21 -0.10 -0.36 -0.05 -0.35 0.08 0.18 1.00 -0.05 0.14 -0.30 -0.12 -0.12 0.50 -0.11
(10) ROAi,t -0.55 -0.27 0.21 0.12 0.04 0.08 0.23 0.02 -0.04 1.00 0.23 -0.13 0.08 0.32 -0.29 -0.11
(11) Div_Indicatori,t -0.01 0.10 0.04 -0.14 -0.01 -0.25 0.35 0.24 0.20 0.25 1.00 -0.26 0.06 0.00 -0.09 -0.25
(12) R&Di,t -0.30 -0.19 0.18 0.58 0.03 0.30 -0.10 -0.11 -0.29 0.00 -0.11 1.00 -0.04 0.32 0.05 0.18
(13) Advertisingi,t -0.09 0.00 0.03 0.03 0.04 0.08 0.20 0.04 -0.15 0.11 0.01 0.03 1.00 0.16 -0.05 -0.01
(14) MTBi,t -0.63 -0.29 0.20 0.29 0.01 0.24 0.08 -0.03 -0.13 0.52 0.09 0.31 0.17 1.00 0.01 0.07
(15) Depreciationi,t 0.09 0.08 -0.11 -0.14 0.00 -0.13 -0.09 -0.01 0.60 -0.16 -0.01 0.00 -0.05 -0.01 1.00 0.08
(16) σ(CF)i,t -0.09 -0.12 -0.01 0.15 0.01 0.25 -0.26 -0.20 -0.14 -0.08 -0.25 0.09 0.00 0.00 0.05 1.00
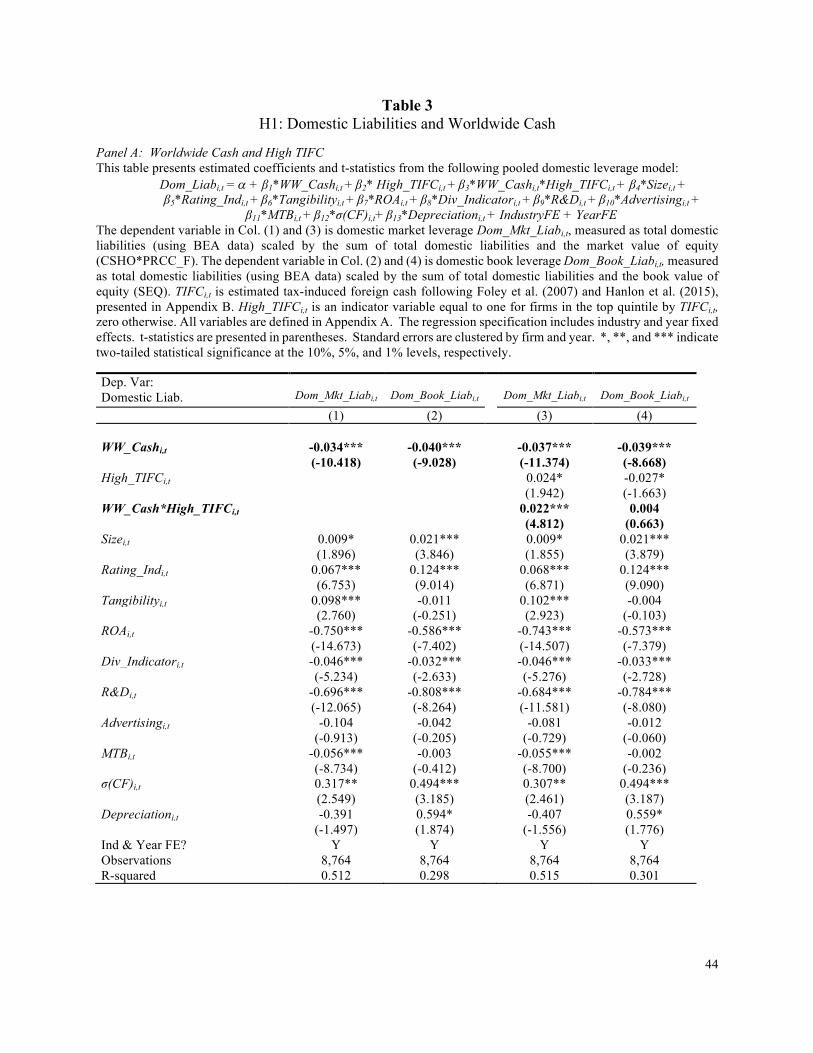
44
Table 3 H1: Domestic Liabilities and Worldwide Cash
Panel A: Worldwide Cash and High TIFC This table presents estimated coefficients and t-statistics from the following pooled domestic leverage model:
Dom_Liabi,t = a + β1*WW_Cashi,t + β2* High_TIFCi,t + β3*WW_Cashi,t*High_TIFCi,t + β4*Sizei,t + β5*Rating_Indi,t + β6*Tangibilityi,t + β7*ROAi,t + β8*Div_Indicatori,t + β9*R&Di,t + β10*Advertisingi,t +
β11*MTBi,t + β12*σ(CF)i,t+ β13*Depreciationi,t + IndustryFE + YearFE The dependent variable in Col. (1) and (3) is domestic market leverage Dom_Mkt_Liabi,t, measured as total domestic liabilities (using BEA data) scaled by the sum of total domestic liabilities and the market value of equity (CSHO*PRCC_F). The dependent variable in Col. (2) and (4) is domestic book leverage Dom_Book_Liabi,t, measured as total domestic liabilities (using BEA data) scaled by the sum of total domestic liabilities and the book value of equity (SEQ). TIFCi,t is estimated tax-induced foreign cash following Foley et al. (2007) and Hanlon et al. (2015), presented in Appendix B. High_TIFCi,t is an indicator variable equal to one for firms in the top quintile by TIFCi,t, zero otherwise. All variables are defined in Appendix A. The regression specification includes industry and year fixed effects. t-statistics are presented in parentheses. Standard errors are clustered by firm and year. *, **, and *** indicate two-tailed statistical significance at the 10%, 5%, and 1% levels, respectively. Dep. Var: Domestic Liab.
Dom_Mkt_Liabi,t
Dom_Book_Liabi,t
Dom_Mkt_Liabi,t
Dom_Book_Liabi,t
(1) (2) (3) (4) WW_Cashi,t -0.034*** -0.040*** -0.037*** -0.039*** (-10.418) (-9.028) (-11.374) (-8.668) High_TIFCi,t 0.024* -0.027* (1.942) (-1.663) WW_Cash*High_TIFCi,t 0.022*** 0.004 (4.812) (0.663) Sizei,t 0.009* 0.021*** 0.009* 0.021*** (1.896) (3.846) (1.855) (3.879) Rating_Indi,t 0.067*** 0.124*** 0.068*** 0.124*** (6.753) (9.014) (6.871) (9.090) Tangibilityi,t 0.098*** -0.011 0.102*** -0.004 (2.760) (-0.251) (2.923) (-0.103) ROAi,t -0.750*** -0.586*** -0.743*** -0.573*** (-14.673) (-7.402) (-14.507) (-7.379) Div_Indicatori,t -0.046*** -0.032*** -0.046*** -0.033*** (-5.234) (-2.633) (-5.276) (-2.728) R&Di,t -0.696*** -0.808*** -0.684*** -0.784*** (-12.065) (-8.264) (-11.581) (-8.080) Advertisingi,t -0.104 -0.042 -0.081 -0.012 (-0.913) (-0.205) (-0.729) (-0.060) MTBi,t -0.056*** -0.003 -0.055*** -0.002 (-8.734) (-0.412) (-8.700) (-0.236) σ(CF)i,t 0.317** 0.494*** 0.307** 0.494*** (2.549) (3.185) (2.461) (3.187) Depreciationi,t -0.391 0.594* -0.407 0.559* (-1.497) (1.874) (-1.556) (1.776) Ind & Year FE? Y Y Y Y Observations 8,764 8,764 8,764 8,764 R-squared 0.512 0.298 0.515 0.301
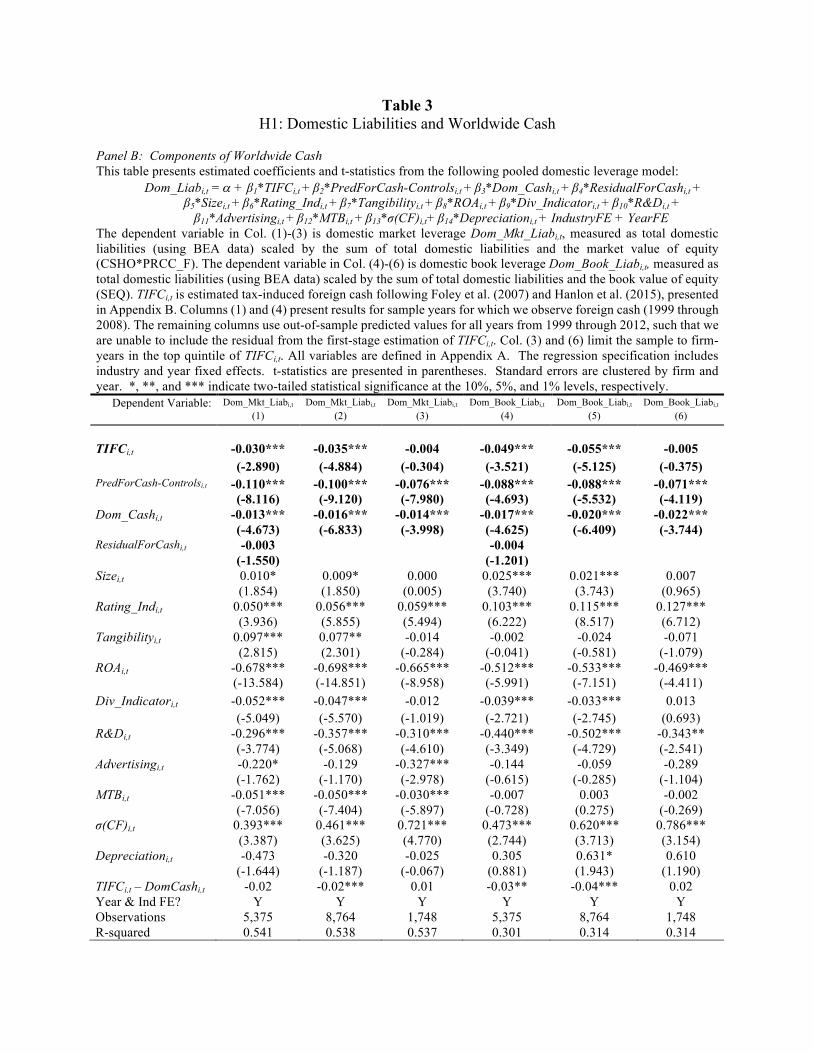
Table 3 H1: Domestic Liabilities and Worldwide Cash
Panel B: Components of Worldwide Cash This table presents estimated coefficients and t-statistics from the following pooled domestic leverage model:
Dom_Liabi,t = a + β1*TIFCi,t + β2*PredForCash-Controlsi,t + β3*Dom_Cashi,t + β4*ResidualForCashi,t + β5*Sizei,t + β6*Rating_Indi,t + β7*Tangibilityi,t + β8*ROAi,t + β9*Div_Indicatori,t + β10*R&Di,t + β11*Advertisingi,t + β12*MTBi,t + β13*σ(CF)i,t+ β14*Depreciationi,t + IndustryFE + YearFE
The dependent variable in Col. (1)-(3) is domestic market leverage Dom_Mkt_Liabi,t, measured as total domestic liabilities (using BEA data) scaled by the sum of total domestic liabilities and the market value of equity (CSHO*PRCC_F). The dependent variable in Col. (4)-(6) is domestic book leverage Dom_Book_Liabi,t, measured as total domestic liabilities (using BEA data) scaled by the sum of total domestic liabilities and the book value of equity (SEQ). TIFCi,t is estimated tax-induced foreign cash following Foley et al. (2007) and Hanlon et al. (2015), presented in Appendix B. Columns (1) and (4) present results for sample years for which we observe foreign cash (1999 through 2008). The remaining columns use out-of-sample predicted values for all years from 1999 through 2012, such that we are unable to include the residual from the first-stage estimation of TIFCi,t. Col. (3) and (6) limit the sample to firm-years in the top quintile of TIFCi,t. All variables are defined in Appendix A. The regression specification includes industry and year fixed effects. t-statistics are presented in parentheses. Standard errors are clustered by firm and year. *, **, and *** indicate two-tailed statistical significance at the 10%, 5%, and 1% levels, respectively.
Dependent Variable: Dom_Mkt_Liabi,t Dom_Mkt_Liabi,t Dom_Mkt_Liabi,t Dom_Book_Liabi,t Dom_Book_Liabi,t Dom_Book_Liabi,t (1) (2) (3) (4) (5) (6)
TIFCi,t -0.030*** -0.035*** -0.004 -0.049*** -0.055*** -0.005 (-2.890) (-4.884) (-0.304) (-3.521) (-5.125) (-0.375) PredForCash-Controlsi,t -0.110*** -0.100*** -0.076*** -0.088*** -0.088*** -0.071*** (-8.116) (-9.120) (-7.980) (-4.693) (-5.532) (-4.119) Dom_Cashi,t -0.013*** -0.016*** -0.014*** -0.017*** -0.020*** -0.022*** (-4.673) (-6.833) (-3.998) (-4.625) (-6.409) (-3.744) ResidualForCashi,t -0.003 -0.004 (-1.550) (-1.201) Sizei,t 0.010* 0.009* 0.000 0.025*** 0.021*** 0.007 (1.854) (1.850) (0.005) (3.740) (3.743) (0.965) Rating_Indi,t 0.050*** 0.056*** 0.059*** 0.103*** 0.115*** 0.127*** (3.936) (5.855) (5.494) (6.222) (8.517) (6.712) Tangibilityi,t 0.097*** 0.077** -0.014 -0.002 -0.024 -0.071 (2.815) (2.301) (-0.284) (-0.041) (-0.581) (-1.079) ROAi,t -0.678*** -0.698*** -0.665*** -0.512*** -0.533*** -0.469*** (-13.584) (-14.851) (-8.958) (-5.991) (-7.151) (-4.411) Div_Indicatori,t -0.052*** -0.047*** -0.012 -0.039*** -0.033*** 0.013 (-5.049) (-5.570) (-1.019) (-2.721) (-2.745) (0.693) R&Di,t -0.296*** -0.357*** -0.310*** -0.440*** -0.502*** -0.343** (-3.774) (-5.068) (-4.610) (-3.349) (-4.729) (-2.541) Advertisingi,t -0.220* -0.129 -0.327*** -0.144 -0.059 -0.289 (-1.762) (-1.170) (-2.978) (-0.615) (-0.285) (-1.104) MTBi,t -0.051*** -0.050*** -0.030*** -0.007 0.003 -0.002 (-7.056) (-7.404) (-5.897) (-0.728) (0.275) (-0.269) σ(CF)i,t 0.393*** 0.461*** 0.721*** 0.473*** 0.620*** 0.786*** (3.387) (3.625) (4.770) (2.744) (3.713) (3.154) Depreciationi,t -0.473 -0.320 -0.025 0.305 0.631* 0.610 (-1.644) (-1.187) (-0.067) (0.881) (1.943) (1.190) TIFCi,t – DomCashi,t -0.02 -0.02*** 0.01 -0.03** -0.04*** 0.02 Year & Ind FE? Y Y Y Y Y Y Observations 5,375 8,764 1,748 5,375 8,764 1,748 R-squared 0.541 0.538 0.537 0.301 0.314 0.314

46
Table 4 H2: Demand for Domestic Cash
Panel A: Payout Policy – Test of Domestic Liabilities and Tax-Induced Foreign Cash This table presents results of tests of H2. Panel A presents estimated coefficients and t-statistics from the following pooled domestic leverage model using the full sample of 8,764 U.S. MNC firm-year observations for 1999 through 2012:
Dom_Liabi,t = a + β1*TIFCi,t + β2*Payouti,t + β3*TIFCi,t*Payouti,t + β4*PredForCash-Controlsi,t + β5*Dom_Cashi,t + β6*Sizei,t + β7*Rating_Indi,t + β8*Tangibilityi,t + β9*ROAi,t + β10*R&Di,t + β11*Advertisingi,t +
β12*MTBi,t + β13*σ(CF)i,t+ β14*Depreciationi,t + IndustryFE + YearFE The dependent variable in Col. (1), (3), and (5) is domestic market leverage Dom_Mkt_Liabi,t, measured as total domestic liabilities (using BEA data) scaled by the sum of total domestic liabilities and the market value of equity (CSHO*PRCC_F). The dependent variable in Col. (2), (4), and (6) is domestic book leverage Dom_Book_Liabi,t, measured as total domestic liabilities (using BEA data) scaled by the sum of total domestic liabilities and the book value of equity (SEQ). TIFCi,t is estimated tax-induced foreign cash following Foley et al. (2007) and Hanlon et al. (2015), presented in Appendix B. In Col. (1)-(2), Payouti,t is an indicator variable equal to one if the firm either pays dividends or repurchases shares in year t, and zero otherwise. In Col. (3)-(4), Payouti,t is an indicator variable equal to one if the firm pays dividends in year t, and zero otherwise. In Col. (5)-(6), Payouti,t is an indicator variable equal to one if the firm repurchases shares in year t, and zero otherwise. We exclude Div_Indicatori,t due to collinearity with Payouti,t. All variables are defined in Appendix A. The regression specification includes industry and year fixed effects. t-statistics are presented in parentheses. Standard errors are clustered by firm and year. *, **, and *** indicate two-tailed statistical significance at the 10%, 5%, and 1% levels, respectively.
Payouti,t = 1 if: Dividend or Repurchase Dividend Repurchase Dependent Variable: Dom_Mkt_Liabi,t
(1) Dom_Book_Liabi,t
(2) Dom_Mkt_Liabi,t
(3) Dom_Book_Liabi,t
(4) Dom_Mkt_Liabi,t
(5) Dom_Book_Liabi,t
(6) TIFCi,t -0.063*** -0.093*** -0.045*** -0.075*** -0.064*** -0.084*** (-4.660) (-4.775) (-5.470) (-5.986) (-4.658) (-4.971) Payouti,t -0.067*** -0.077*** -0.051*** -0.041*** -0.041*** -0.039*** (-5.972) (-5.712) (-5.611) (-3.304) (-4.687) (-3.770) TIFCi,t*Payouti,t 0.040*** 0.052** 0.024* 0.047** 0.048*** 0.047** (2.863) (2.533) (1.833) (2.252) (3.033) (2.280) PredForCash-Controlsi,t -0.100*** -0.088*** -0.100*** -0.088*** -0.098*** -0.087*** (-9.036) (-5.615) (-9.105) (-5.516) (-8.635) (-5.400) Dom_Cashi,t -0.015*** -0.020*** -0.016*** -0.020*** -0.014*** -0.019*** (-6.958) (-6.569) (-6.871) (-6.421) (-6.203) (-6.038) Sizei,t 0.008 0.022*** 0.009* 0.021*** 0.007 0.020*** (1.639) (3.936) (1.880) (3.806) (1.345) (3.524) Rating_Indi,t 0.055*** 0.113*** 0.056*** 0.114*** 0.055*** 0.114*** (5.929) (8.439) (5.836) (8.503) (5.810) (8.360) Tangibilityi,t 0.067** -0.031 0.077** -0.024 0.062* -0.036 (1.995) (-0.755) (2.304) (-0.582) (1.860) (-0.867) ROAi,t -0.691*** -0.514*** -0.697*** -0.532*** -0.701*** -0.530*** (-14.600) (-7.027) (-14.790) (-7.127) (-14.230) (-6.898) R&Di,t -0.324*** -0.489*** -0.358*** -0.504*** -0.310*** -0.471*** (-4.891) (-4.664) (-5.057) (-4.738) (-4.633) (-4.422) Advertisingi,t -0.139 -0.067 -0.139 -0.078 -0.131 -0.058 (-1.285) (-0.329) (-1.248) (-0.377) (-1.200) (-0.287) MTBi,t -0.050*** 0.003 -0.050*** 0.002 -0.050*** 0.003 (-7.503) (0.279) (-7.396) (0.243) (-7.440) (0.264) σ(CF)i,t 0.478*** 0.609*** 0.464*** 0.626*** 0.497*** 0.637*** (3.964) (3.778) (3.634) (3.732) (4.115) (3.958) Depreciationi,t -0.315 0.613* -0.320 0.630* -0.264 0.671** (-1.178) (1.918) (-1.190) (1.938) (-0.968) (2.070) Ind. & Year FE? Y Y Y Y Y Y Observations 8,764 8,764 8,764 8,764 8,764 8,764 R-squared 0.540 0.321 0.538 0.314 0.536 0.314

47
Table 4 H2: Demand for Domestic Cash (cont’d.)
Panel B: Domestic Employment and Compensation – Test of Domestic Liabilities and Tax-Induced Foreign Cash This table presents results of tests of H2. Panel B presents estimated coefficients and t-statistics from the following pooled domestic leverage model using the full sample of 8,764 U.S. MNC firm-year observations for 1999 through 2012:
Dom_Liabi,t = a + β1*TIFCi,t + β2*Dom_Employmenti,t + β3*TIFCi,t*Dom_Employmenti,t + β4*PredForCash-Controlsi,t + β5*Dom_Cashi,t + β6*Sizei,t + β7*Rating_Indi,t + β8*Tangibilityi,t + β9*ROAi,t + β10*R&Di,t +
β11*Advertisingi,t + β12*MTBi,t + β13*σ(CF)i,t+ β14*Depreciationi,t + IndustryFE + YearFE The dependent variable in Col. (1) and (3) is domestic market leverage Dom_Mkt_Liabi,t, measured as total domestic liabilities (using BEA data) scaled by the sum of total domestic liabilities and the market value of equity (CSHO*PRCC_F). The dependent variable in Col. (2) and (4) is domestic book leverage Dom_Book_Liabi,t, measured as total domestic liabilities (using BEA data) scaled by the sum of total domestic liabilities and the book value of equity (SEQ). TIFCi,t is estimated tax-induced foreign cash following Foley et al. (2007) and Hanlon et al. (2015), presented in Appendix B. In Col. (1)-(2), Dom_Employeesi,t is an indicator variable equal to one if the firm’s ratio of domestic employees to total worldwide employees in year t is in the top quartile of the sample, and zero otherwise. In Col. (3)-(4), Dom_Compensationi,t is an indicator variable equal to one if the firm’s ratio of domestic compensation to total worldwide compensation in year t is in the top quartile of the sample, and zero otherwise. All variables are defined in Appendix A. The regression specification includes industry and year fixed effects. t-statistics are presented in parentheses. Standard errors are clustered by firm and year. *, **, and *** indicate two-tailed statistical significance at the 10%, 5%, and 1% levels, respectively.
Dom_Employmenti,t Dom_Employeesi,t Dom_Compensationi,t
Dependent Variable: Dom_Mkt_Liabi,t (1)
Dom_Book_Liabi,t (2)
Dom_Mkt_Liabi,t (3)
Dom_Book_Liabi,t (4)
TIFCi,t -0.026*** -0.044*** -0.027*** -0.041*** (-3.708) (-4.362) (-3.460) (-3.838) Dom_Employmenti,t 0.036*** 0.032** 0.032*** 0.028*** (4.691) (2.568) (4.362) (2.677) TIFCi,t*Dom_Employmenti,t -0.012 -0.049* -0.012 -0.069*** (-0.523) (-1.729) (-0.658) (-3.301) PredForCash-Controlsi,t -0.099*** -0.088*** -0.099*** -0.088*** (-9.388) (-5.678) (-9.327) (-5.655) Dom_Cashi,t -0.016*** -0.020*** -0.016*** -0.020*** (-6.836) (-6.400) (-6.900) (-6.436) Sizei,t 0.009* 0.021*** 0.009* 0.021*** (1.862) (3.751) (1.817) (3.720) Rating_Indi,t 0.056*** 0.114*** 0.056*** 0.114*** (5.919) (8.558) (5.886) (8.536) Tangibilityi,t 0.071** -0.029 0.071** -0.029 (2.164) (-0.706) (2.139) (-0.701) ROAi,t -0.698*** -0.533*** -0.698*** -0.533*** (-14.527) (-7.086) (-14.651) (-7.130) Div_Indicatori,t -0.049*** -0.034*** -0.048*** -0.034*** (-5.840) (-2.880) (-5.833) (-2.850) R&Di,t -0.368*** -0.506*** -0.378*** -0.506*** (-5.212) (-4.781) (-5.401) (-4.792) Advertisingi,t -0.142 -0.073 -0.139 -0.075 (-1.299) (-0.359) (-1.274) (-0.363) MTBi,t -0.050*** 0.002 -0.050*** 0.002 (-7.309) (0.217) (-7.342) (0.248) σ(CF)i,t 0.451*** 0.612*** 0.452*** 0.607*** (3.565) (3.704) (3.635) (3.705) Depreciationi,t -0.277 0.663** -0.283 0.645** (-1.025) (2.054) (-1.046) (2.003) Industry and Year FE? Y Y Y Y Observations 8,764 8,764 8,764 8,764 R-squared 0.540 0.314 0.539 0.314
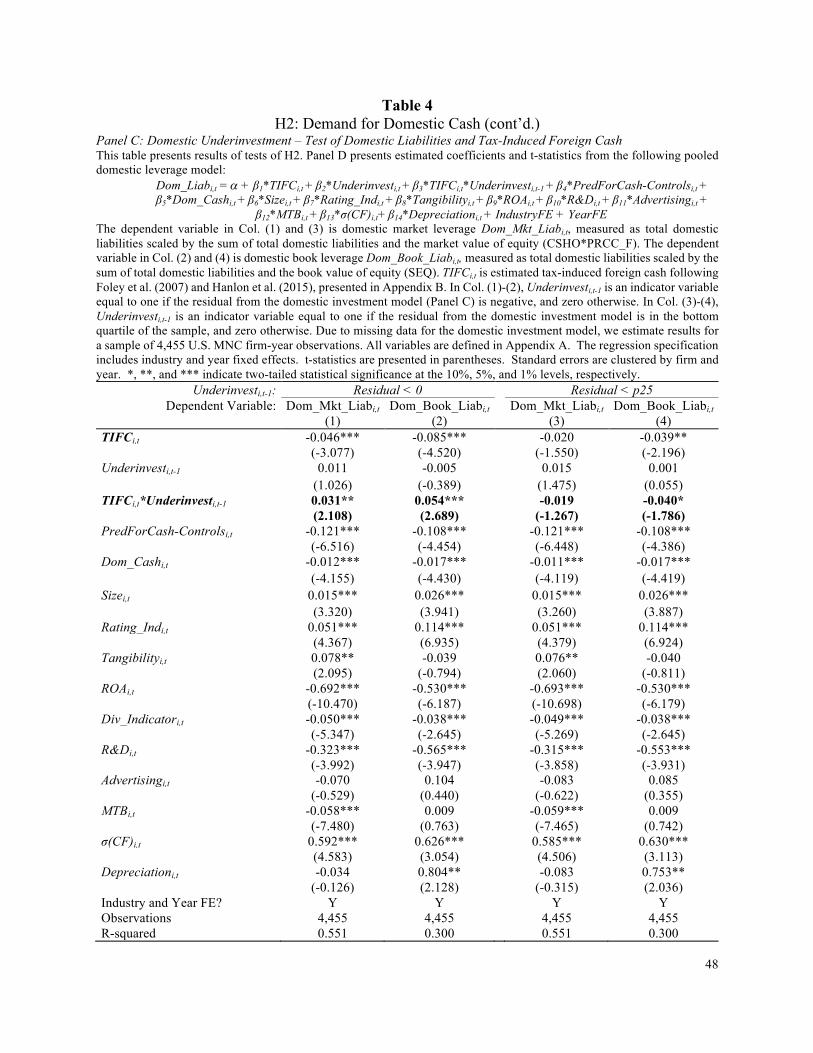
48
Table 4 H2: Demand for Domestic Cash (cont’d.)
Panel C: Domestic Underinvestment – Test of Domestic Liabilities and Tax-Induced Foreign Cash This table presents results of tests of H2. Panel D presents estimated coefficients and t-statistics from the following pooled domestic leverage model:
Dom_Liabi,t = a + β1*TIFCi,t + β2*Underinvesti,t + β3*TIFCi,t*Underinvesti,t-1 + β4*PredForCash-Controlsi,t + β5*Dom_Cashi,t + β6*Sizei,t + β7*Rating_Indi,t + β8*Tangibilityi,t + β9*ROAi,t + β10*R&Di,t + β11*Advertisingi,t +
β12*MTBi,t + β13*σ(CF)i,t+ β14*Depreciationi,t + IndustryFE + YearFE The dependent variable in Col. (1) and (3) is domestic market leverage Dom_Mkt_Liabi,t, measured as total domestic liabilities scaled by the sum of total domestic liabilities and the market value of equity (CSHO*PRCC_F). The dependent variable in Col. (2) and (4) is domestic book leverage Dom_Book_Liabi,t, measured as total domestic liabilities scaled by the sum of total domestic liabilities and the book value of equity (SEQ). TIFCi,t is estimated tax-induced foreign cash following Foley et al. (2007) and Hanlon et al. (2015), presented in Appendix B. In Col. (1)-(2), Underinvesti,t-1 is an indicator variable equal to one if the residual from the domestic investment model (Panel C) is negative, and zero otherwise. In Col. (3)-(4), Underinvesti,t-1 is an indicator variable equal to one if the residual from the domestic investment model is in the bottom quartile of the sample, and zero otherwise. Due to missing data for the domestic investment model, we estimate results for a sample of 4,455 U.S. MNC firm-year observations. All variables are defined in Appendix A. The regression specification includes industry and year fixed effects. t-statistics are presented in parentheses. Standard errors are clustered by firm and year. *, **, and *** indicate two-tailed statistical significance at the 10%, 5%, and 1% levels, respectively.
Underinvesti,t-1: Residual < 0 Residual < p25 Dependent Variable: Dom_Mkt_Liabi,t
(1) Dom_Book_Liabi,t
(2) Dom_Mkt_Liabi,t
(3) Dom_Book_Liabi,t
(4) TIFCi,t -0.046*** -0.085*** -0.020 -0.039** (-3.077) (-4.520) (-1.550) (-2.196) Underinvesti,t-1 0.011 -0.005 0.015 0.001 (1.026) (-0.389) (1.475) (0.055) TIFCi,t*Underinvesti,t-1 0.031** 0.054*** -0.019 -0.040* (2.108) (2.689) (-1.267) (-1.786) PredForCash-Controlsi,t -0.121*** -0.108*** -0.121*** -0.108*** (-6.516) (-4.454) (-6.448) (-4.386) Dom_Cashi,t -0.012*** -0.017*** -0.011*** -0.017*** (-4.155) (-4.430) (-4.119) (-4.419) Sizei,t 0.015*** 0.026*** 0.015*** 0.026*** (3.320) (3.941) (3.260) (3.887) Rating_Indi,t 0.051*** 0.114*** 0.051*** 0.114*** (4.367) (6.935) (4.379) (6.924) Tangibilityi,t 0.078** -0.039 0.076** -0.040 (2.095) (-0.794) (2.060) (-0.811) ROAi,t -0.692*** -0.530*** -0.693*** -0.530*** (-10.470) (-6.187) (-10.698) (-6.179) Div_Indicatori,t -0.050*** -0.038*** -0.049*** -0.038*** (-5.347) (-2.645) (-5.269) (-2.645) R&Di,t -0.323*** -0.565*** -0.315*** -0.553*** (-3.992) (-3.947) (-3.858) (-3.931) Advertisingi,t -0.070 0.104 -0.083 0.085 (-0.529) (0.440) (-0.622) (0.355) MTBi,t -0.058*** 0.009 -0.059*** 0.009 (-7.480) (0.763) (-7.465) (0.742) σ(CF)i,t 0.592*** 0.626*** 0.585*** 0.630*** (4.583) (3.054) (4.506) (3.113) Depreciationi,t -0.034 0.804** -0.083 0.753** (-0.126) (2.128) (-0.315) (2.036) Industry and Year FE? Y Y Y Y Observations 4,455 4,455 4,455 4,455 R-squared 0.551 0.300 0.551 0.300
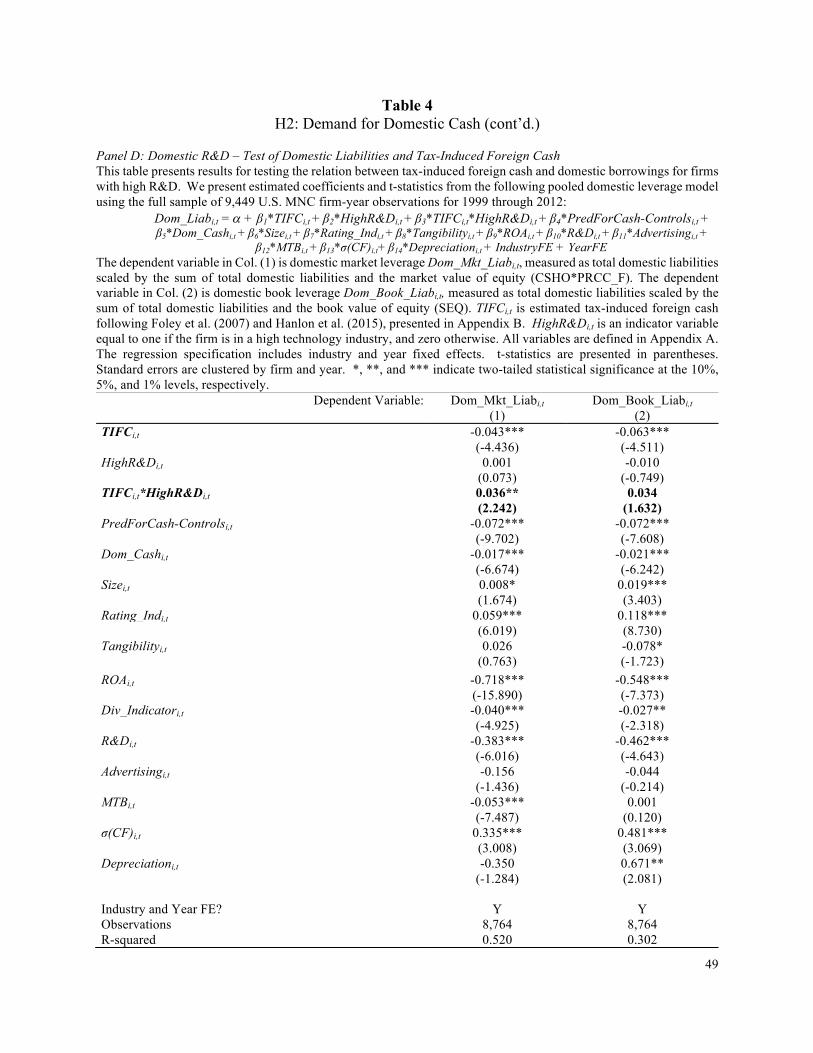
49
Table 4 H2: Demand for Domestic Cash (cont’d.)
Panel D: Domestic R&D – Test of Domestic Liabilities and Tax-Induced Foreign Cash This table presents results for testing the relation between tax-induced foreign cash and domestic borrowings for firms with high R&D. We present estimated coefficients and t-statistics from the following pooled domestic leverage model using the full sample of 9,449 U.S. MNC firm-year observations for 1999 through 2012:
Dom_Liabi,t = a + β1*TIFCi,t + β2*HighR&Di,t + β3*TIFCi,t*HighR&Di,t + β4*PredForCash-Controlsi,t + β5*Dom_Cashi,t + β6*Sizei,t + β7*Rating_Indi,t + β8*Tangibilityi,t + β9*ROAi,t + β10*R&Di,t + β11*Advertisingi,t +
β12*MTBi,t + β13*σ(CF)i,t+ β14*Depreciationi,t + IndustryFE + YearFE The dependent variable in Col. (1) is domestic market leverage Dom_Mkt_Liabi,t, measured as total domestic liabilities scaled by the sum of total domestic liabilities and the market value of equity (CSHO*PRCC_F). The dependent variable in Col. (2) is domestic book leverage Dom_Book_Liabi,t, measured as total domestic liabilities scaled by the sum of total domestic liabilities and the book value of equity (SEQ). TIFCi,t is estimated tax-induced foreign cash following Foley et al. (2007) and Hanlon et al. (2015), presented in Appendix B. HighR&Di,t is an indicator variable equal to one if the firm is in a high technology industry, and zero otherwise. All variables are defined in Appendix A. The regression specification includes industry and year fixed effects. t-statistics are presented in parentheses. Standard errors are clustered by firm and year. *, **, and *** indicate two-tailed statistical significance at the 10%, 5%, and 1% levels, respectively.
Dependent Variable: Dom_Mkt_Liabi,t (1)
Dom_Book_Liabi,t (2)
TIFCi,t -0.043*** -0.063*** (-4.436) (-4.511) HighR&Di,t 0.001 -0.010 (0.073) (-0.749) TIFCi,t*HighR&Di,t 0.036** 0.034 (2.242) (1.632) PredForCash-Controlsi,t -0.072*** -0.072*** (-9.702) (-7.608) Dom_Cashi,t -0.017*** -0.021*** (-6.674) (-6.242) Sizei,t 0.008* 0.019*** (1.674) (3.403) Rating_Indi,t 0.059*** 0.118*** (6.019) (8.730) Tangibilityi,t 0.026 -0.078* (0.763) (-1.723) ROAi,t -0.718*** -0.548*** (-15.890) (-7.373) Div_Indicatori,t -0.040*** -0.027** (-4.925) (-2.318) R&Di,t -0.383*** -0.462*** (-6.016) (-4.643) Advertisingi,t -0.156 -0.044 (-1.436) (-0.214) MTBi,t -0.053*** 0.001 (-7.487) (0.120) σ(CF)i,t 0.335*** 0.481*** (3.008) (3.069) Depreciationi,t -0.350 0.671** (-1.284) (2.081) Industry and Year FE? Y Y Observations 8,764 8,764 R-squared 0.520 0.302
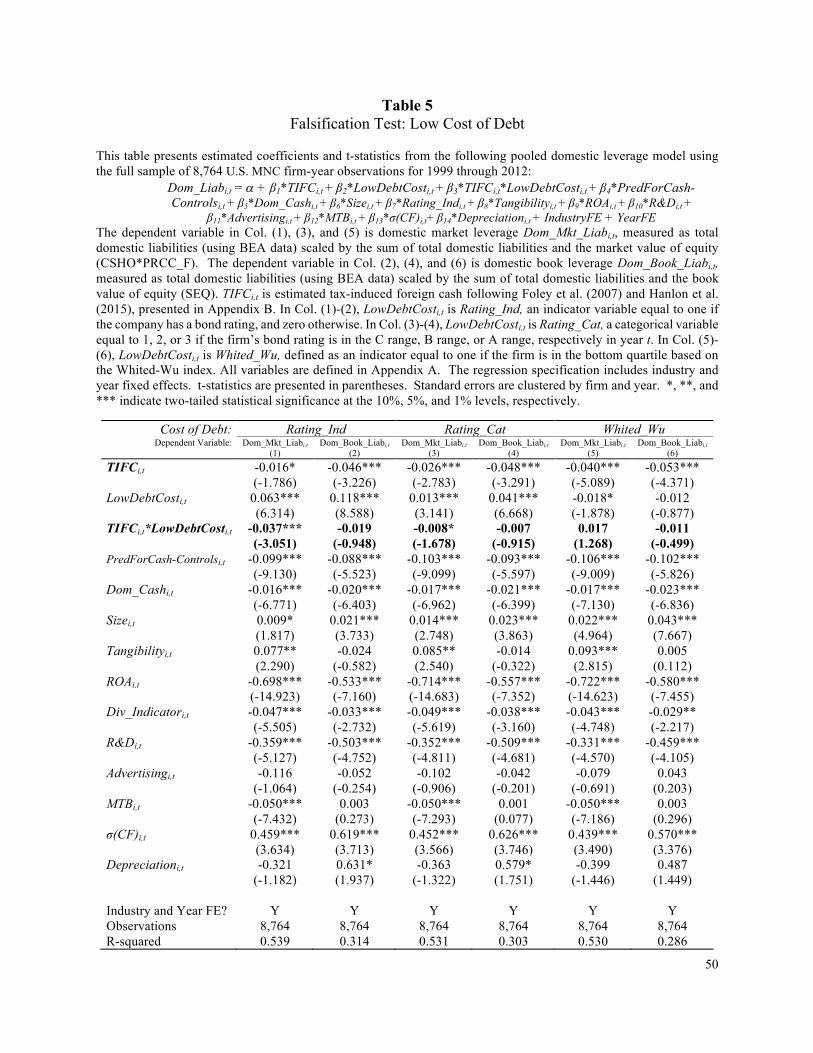
50
Table 5 Falsification Test: Low Cost of Debt
This table presents estimated coefficients and t-statistics from the following pooled domestic leverage model using the full sample of 8,764 U.S. MNC firm-year observations for 1999 through 2012:
Dom_Liabi,t = a + β1*TIFCi,t + β2*LowDebtCosti,t + β3*TIFCi,t*LowDebtCosti,t + β4*PredForCash-Controlsi,t + β5*Dom_Cashi,t + β6*Sizei,t + β7*Rating_Indi,t + β8*Tangibilityi,t + β9*ROAi,t + β10*R&Di,t +
β11*Advertisingi,t + β12*MTBi,t + β13*σ(CF)i,t+ β14*Depreciationi,t + IndustryFE + YearFE The dependent variable in Col. (1), (3), and (5) is domestic market leverage Dom_Mkt_Liabi,t, measured as total domestic liabilities (using BEA data) scaled by the sum of total domestic liabilities and the market value of equity (CSHO*PRCC_F). The dependent variable in Col. (2), (4), and (6) is domestic book leverage Dom_Book_Liabi,t, measured as total domestic liabilities (using BEA data) scaled by the sum of total domestic liabilities and the book value of equity (SEQ). TIFCi,t is estimated tax-induced foreign cash following Foley et al. (2007) and Hanlon et al. (2015), presented in Appendix B. In Col. (1)-(2), LowDebtCosti,t is Rating_Ind, an indicator variable equal to one if the company has a bond rating, and zero otherwise. In Col. (3)-(4), LowDebtCosti,t is Rating_Cat, a categorical variable equal to 1, 2, or 3 if the firm’s bond rating is in the C range, B range, or A range, respectively in year t. In Col. (5)-(6), LowDebtCosti,t is Whited_Wu, defined as an indicator equal to one if the firm is in the bottom quartile based on the Whited-Wu index. All variables are defined in Appendix A. The regression specification includes industry and year fixed effects. t-statistics are presented in parentheses. Standard errors are clustered by firm and year. *, **, and *** indicate two-tailed statistical significance at the 10%, 5%, and 1% levels, respectively.
Cost of Debt: Rating_Ind Rating_Cat Whited_Wu Dependent Variable: Dom_Mkt_Liabi,t
(1) Dom_Book_Liabi,t
(2) Dom_Mkt_Liabi,t
(3) Dom_Book_Liabi,t
(4) Dom_Mkt_Liabi,t
(5) Dom_Book_Liabi,t
(6)
TIFCi,t -0.016* -0.046*** -0.026*** -0.048*** -0.040*** -0.053*** (-1.786) (-3.226) (-2.783) (-3.291) (-5.089) (-4.371) LowDebtCosti,t 0.063*** 0.118*** 0.013*** 0.041*** -0.018* -0.012 (6.314) (8.588) (3.141) (6.668) (-1.878) (-0.877) TIFCi,t*LowDebtCosti,t -0.037*** -0.019 -0.008* -0.007 0.017 -0.011 (-3.051) (-0.948) (-1.678) (-0.915) (1.268) (-0.499) PredForCash-Controlsi,t -0.099*** -0.088*** -0.103*** -0.093*** -0.106*** -0.102*** (-9.130) (-5.523) (-9.099) (-5.597) (-9.009) (-5.826) Dom_Cashi,t -0.016*** -0.020*** -0.017*** -0.021*** -0.017*** -0.023*** (-6.771) (-6.403) (-6.962) (-6.399) (-7.130) (-6.836) Sizei,t 0.009* 0.021*** 0.014*** 0.023*** 0.022*** 0.043*** (1.817) (3.733) (2.748) (3.863) (4.964) (7.667) Tangibilityi,t 0.077** -0.024 0.085** -0.014 0.093*** 0.005 (2.290) (-0.582) (2.540) (-0.322) (2.815) (0.112) ROAi,t -0.698*** -0.533*** -0.714*** -0.557*** -0.722*** -0.580*** (-14.923) (-7.160) (-14.683) (-7.352) (-14.623) (-7.455) Div_Indicatori,t -0.047*** -0.033*** -0.049*** -0.038*** -0.043*** -0.029** (-5.505) (-2.732) (-5.619) (-3.160) (-4.748) (-2.217) R&Di,t -0.359*** -0.503*** -0.352*** -0.509*** -0.331*** -0.459*** (-5.127) (-4.752) (-4.811) (-4.681) (-4.570) (-4.105) Advertisingi,t -0.116 -0.052 -0.102 -0.042 -0.079 0.043 (-1.064) (-0.254) (-0.906) (-0.201) (-0.691) (0.203) MTBi,t -0.050*** 0.003 -0.050*** 0.001 -0.050*** 0.003 (-7.432) (0.273) (-7.293) (0.077) (-7.186) (0.296) σ(CF)i,t 0.459*** 0.619*** 0.452*** 0.626*** 0.439*** 0.570*** (3.634) (3.713) (3.566) (3.746) (3.490) (3.376) Depreciationi,t -0.321 0.631* -0.363 0.579* -0.399 0.487 (-1.182) (1.937) (-1.322) (1.751) (-1.446) (1.449) Industry and Year FE? Y Y Y Y Y Y Observations 8,764 8,764 8,764 8,764 8,764 8,764 R-squared 0.539 0.314 0.531 0.303 0.530 0.286
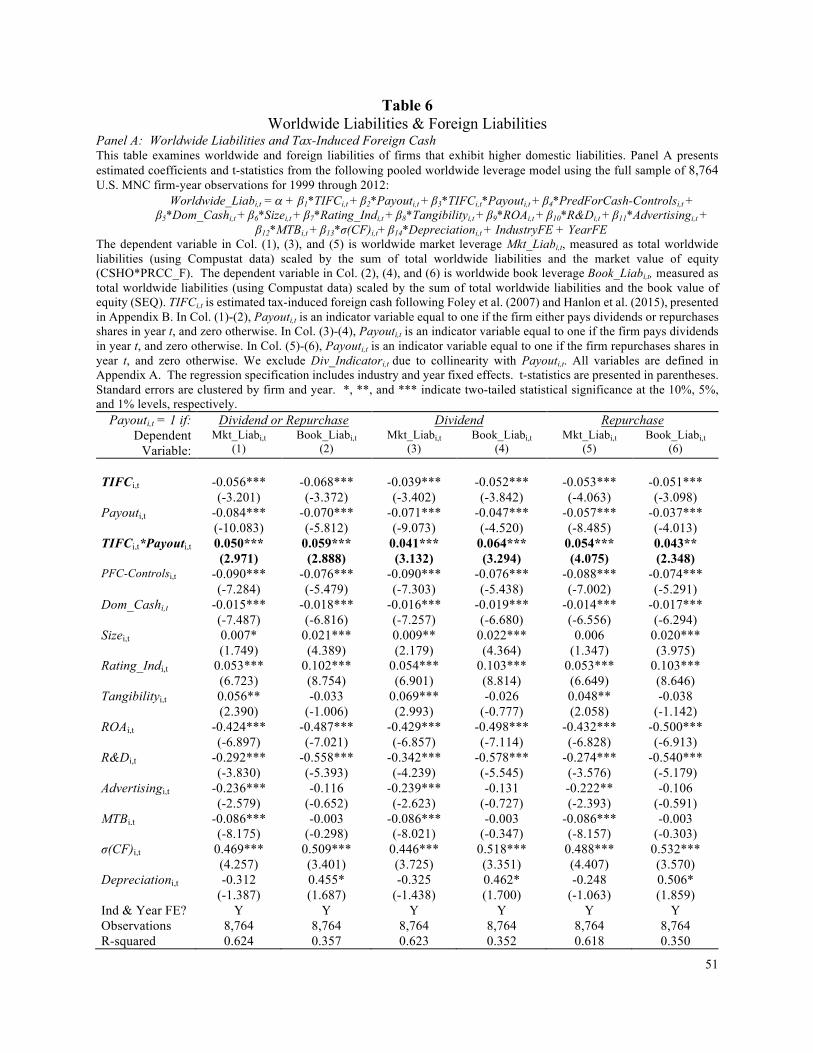
51
Table 6 Worldwide Liabilities & Foreign Liabilities
Panel A: Worldwide Liabilities and Tax-Induced Foreign Cash This table examines worldwide and foreign liabilities of firms that exhibit higher domestic liabilities. Panel A presents estimated coefficients and t-statistics from the following pooled worldwide leverage model using the full sample of 8,764 U.S. MNC firm-year observations for 1999 through 2012:
Worldwide_Liabi,t = a + β1*TIFCi,t + β2*Payouti,t + β3*TIFCi,t*Payouti,t + β4*PredForCash-Controlsi,t + β5*Dom_Cashi,t + β6*Sizei,t + β7*Rating_Indi,t + β8*Tangibilityi,t + β9*ROAi,t + β10*R&Di,t + β11*Advertisingi,t +
β12*MTBi,t + β13*σ(CF)i,t+ β14*Depreciationi,t + IndustryFE + YearFE The dependent variable in Col. (1), (3), and (5) is worldwide market leverage Mkt_Liabi,t, measured as total worldwide liabilities (using Compustat data) scaled by the sum of total worldwide liabilities and the market value of equity (CSHO*PRCC_F). The dependent variable in Col. (2), (4), and (6) is worldwide book leverage Book_Liabi,t, measured as total worldwide liabilities (using Compustat data) scaled by the sum of total worldwide liabilities and the book value of equity (SEQ). TIFCi,t is estimated tax-induced foreign cash following Foley et al. (2007) and Hanlon et al. (2015), presented in Appendix B. In Col. (1)-(2), Payouti,t is an indicator variable equal to one if the firm either pays dividends or repurchases shares in year t, and zero otherwise. In Col. (3)-(4), Payouti,t is an indicator variable equal to one if the firm pays dividends in year t, and zero otherwise. In Col. (5)-(6), Payouti,t is an indicator variable equal to one if the firm repurchases shares in year t, and zero otherwise. We exclude Div_Indicatori,t due to collinearity with Payouti,t. All variables are defined in Appendix A. The regression specification includes industry and year fixed effects. t-statistics are presented in parentheses. Standard errors are clustered by firm and year. *, **, and *** indicate two-tailed statistical significance at the 10%, 5%, and 1% levels, respectively.
Payouti,t = 1 if: Dividend or Repurchase Dividend Repurchase Dependent
Variable: Mkt_Liabi,t
(1) Book_Liabi,t
(2) Mkt_Liabi,t
(3) Book_Liabi,t
(4) Mkt_Liabi,t
(5) Book_Liabi,t
(6) TIFCi,t -0.056*** -0.068*** -0.039*** -0.052*** -0.053*** -0.051*** (-3.201) (-3.372) (-3.402) (-3.842) (-4.063) (-3.098) Payouti,t -0.084*** -0.070*** -0.071*** -0.047*** -0.057*** -0.037*** (-10.083) (-5.812) (-9.073) (-4.520) (-8.485) (-4.013) TIFCi,t*Payouti,t 0.050*** 0.059*** 0.041*** 0.064*** 0.054*** 0.043** (2.971) (2.888) (3.132) (3.294) (4.075) (2.348) PFC-Controlsi,t -0.090*** -0.076*** -0.090*** -0.076*** -0.088*** -0.074*** (-7.284) (-5.479) (-7.303) (-5.438) (-7.002) (-5.291) Dom_Cashi,t -0.015*** -0.018*** -0.016*** -0.019*** -0.014*** -0.017*** (-7.487) (-6.816) (-7.257) (-6.680) (-6.556) (-6.294) Sizei,t 0.007* 0.021*** 0.009** 0.022*** 0.006 0.020*** (1.749) (4.389) (2.179) (4.364) (1.347) (3.975) Rating_Indi,t 0.053*** 0.102*** 0.054*** 0.103*** 0.053*** 0.103*** (6.723) (8.754) (6.901) (8.814) (6.649) (8.646) Tangibilityi,t 0.056** -0.033 0.069*** -0.026 0.048** -0.038 (2.390) (-1.006) (2.993) (-0.777) (2.058) (-1.142) ROAi,t -0.424*** -0.487*** -0.429*** -0.498*** -0.432*** -0.500*** (-6.897) (-7.021) (-6.857) (-7.114) (-6.828) (-6.913) R&Di,t -0.292*** -0.558*** -0.342*** -0.578*** -0.274*** -0.540*** (-3.830) (-5.393) (-4.239) (-5.545) (-3.576) (-5.179) Advertisingi,t -0.236*** -0.116 -0.239*** -0.131 -0.222** -0.106 (-2.579) (-0.652) (-2.623) (-0.727) (-2.393) (-0.591) MTBi,t -0.086*** -0.003 -0.086*** -0.003 -0.086*** -0.003 (-8.175) (-0.298) (-8.021) (-0.347) (-8.157) (-0.303) σ(CF)i,t 0.469*** 0.509*** 0.446*** 0.518*** 0.488*** 0.532*** (4.257) (3.401) (3.725) (3.351) (4.407) (3.570) Depreciationi,t -0.312 0.455* -0.325 0.462* -0.248 0.506* (-1.387) (1.687) (-1.438) (1.700) (-1.063) (1.859) Ind & Year FE? Y Y Y Y Y Y Observations 8,764 8,764 8,764 8,764 8,764 8,764 R-squared 0.624 0.357 0.623 0.352 0.618 0.350
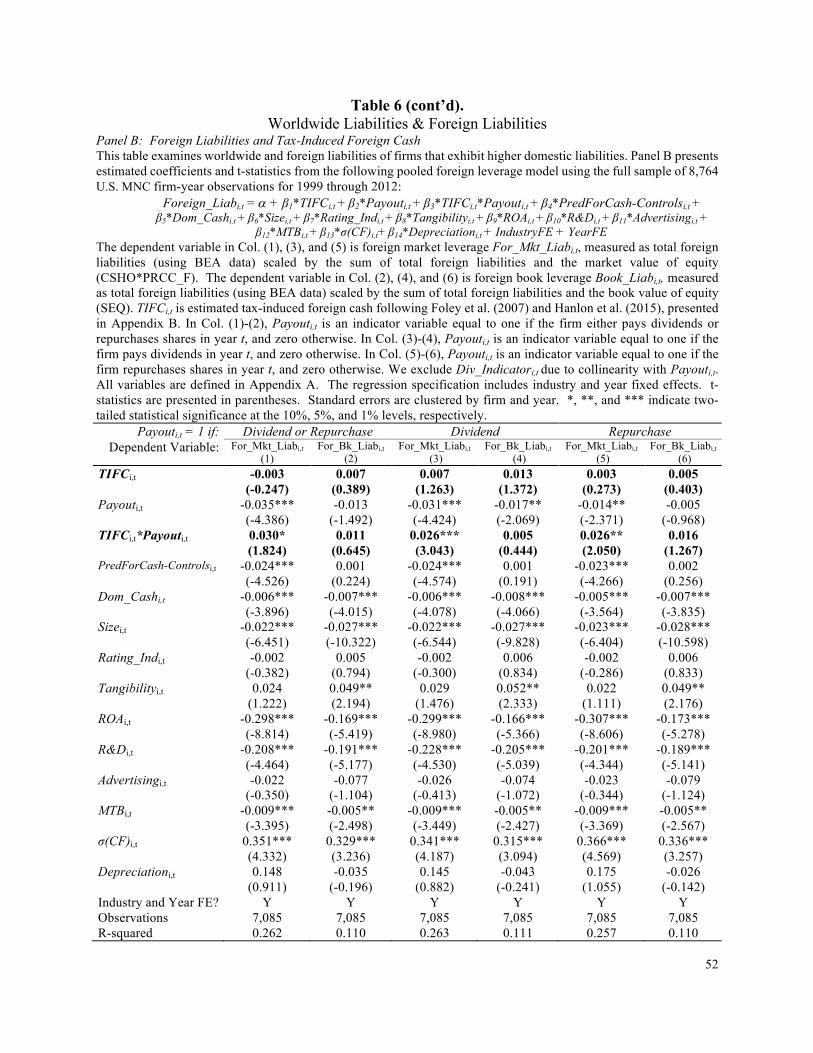
52
Table 6 (cont’d). Worldwide Liabilities & Foreign Liabilities
Panel B: Foreign Liabilities and Tax-Induced Foreign Cash This table examines worldwide and foreign liabilities of firms that exhibit higher domestic liabilities. Panel B presents estimated coefficients and t-statistics from the following pooled foreign leverage model using the full sample of 8,764 U.S. MNC firm-year observations for 1999 through 2012:
Foreign_Liabi,t = a + β1*TIFCi,t + β2*Payouti,t + β3*TIFCi,t*Payouti,t + β4*PredForCash-Controlsi,t + β5*Dom_Cashi,t + β6*Sizei,t + β7*Rating_Indi,t + β8*Tangibilityi,t + β9*ROAi,t + β10*R&Di,t + β11*Advertisingi,t +
β12*MTBi,t + β13*σ(CF)i,t+ β14*Depreciationi,t + IndustryFE + YearFE The dependent variable in Col. (1), (3), and (5) is foreign market leverage For_Mkt_Liabi,t, measured as total foreign liabilities (using BEA data) scaled by the sum of total foreign liabilities and the market value of equity (CSHO*PRCC_F). The dependent variable in Col. (2), (4), and (6) is foreign book leverage Book_Liabi,t, measured as total foreign liabilities (using BEA data) scaled by the sum of total foreign liabilities and the book value of equity (SEQ). TIFCi,t is estimated tax-induced foreign cash following Foley et al. (2007) and Hanlon et al. (2015), presented in Appendix B. In Col. (1)-(2), Payouti,t is an indicator variable equal to one if the firm either pays dividends or repurchases shares in year t, and zero otherwise. In Col. (3)-(4), Payouti,t is an indicator variable equal to one if the firm pays dividends in year t, and zero otherwise. In Col. (5)-(6), Payouti,t is an indicator variable equal to one if the firm repurchases shares in year t, and zero otherwise. We exclude Div_Indicatori,t due to collinearity with Payouti,t. All variables are defined in Appendix A. The regression specification includes industry and year fixed effects. t-statistics are presented in parentheses. Standard errors are clustered by firm and year. *, **, and *** indicate two-tailed statistical significance at the 10%, 5%, and 1% levels, respectively.
Payouti,t = 1 if: Dividend or Repurchase Dividend Repurchase Dependent Variable: For_Mkt_Liabi,t
(1) For_Bk_Liabi,t
(2) For_Mkt_Liabi,t
(3) For_Bk_Liabi,t
(4) For_Mkt_Liabi,t
(5) For_Bk_Liabi,t
(6) TIFCi,t -0.003 0.007 0.007 0.013 0.003 0.005 (-0.247) (0.389) (1.263) (1.372) (0.273) (0.403) Payouti,t -0.035*** -0.013 -0.031*** -0.017** -0.014** -0.005 (-4.386) (-1.492) (-4.424) (-2.069) (-2.371) (-0.968) TIFCi,t*Payouti,t 0.030* 0.011 0.026*** 0.005 0.026** 0.016 (1.824) (0.645) (3.043) (0.444) (2.050) (1.267) PredForCash-Controlsi,t -0.024*** 0.001 -0.024*** 0.001 -0.023*** 0.002 (-4.526) (0.224) (-4.574) (0.191) (-4.266) (0.256) Dom_Cashi,t -0.006*** -0.007*** -0.006*** -0.008*** -0.005*** -0.007*** (-3.896) (-4.015) (-4.078) (-4.066) (-3.564) (-3.835) Sizei,t -0.022*** -0.027*** -0.022*** -0.027*** -0.023*** -0.028*** (-6.451) (-10.322) (-6.544) (-9.828) (-6.404) (-10.598) Rating_Indi,t -0.002 0.005 -0.002 0.006 -0.002 0.006 (-0.382) (0.794) (-0.300) (0.834) (-0.286) (0.833) Tangibilityi,t 0.024 0.049** 0.029 0.052** 0.022 0.049** (1.222) (2.194) (1.476) (2.333) (1.111) (2.176) ROAi,t -0.298*** -0.169*** -0.299*** -0.166*** -0.307*** -0.173*** (-8.814) (-5.419) (-8.980) (-5.366) (-8.606) (-5.278) R&Di,t -0.208*** -0.191*** -0.228*** -0.205*** -0.201*** -0.189*** (-4.464) (-5.177) (-4.530) (-5.039) (-4.344) (-5.141) Advertisingi,t -0.022 -0.077 -0.026 -0.074 -0.023 -0.079 (-0.350) (-1.104) (-0.413) (-1.072) (-0.344) (-1.124) MTBi,t -0.009*** -0.005** -0.009*** -0.005** -0.009*** -0.005** (-3.395) (-2.498) (-3.449) (-2.427) (-3.369) (-2.567) σ(CF)i,t 0.351*** 0.329*** 0.341*** 0.315*** 0.366*** 0.336*** (4.332) (3.236) (4.187) (3.094) (4.569) (3.257) Depreciationi,t 0.148 -0.035 0.145 -0.043 0.175 -0.026 (0.911) (-0.196) (0.882) (-0.241) (1.055) (-0.142) Industry and Year FE? Y Y Y Y Y Y Observations 7,085 7,085 7,085 7,085 7,085 7,085 R-squared 0.262 0.110 0.263 0.111 0.257 0.110