The Effect of Fast-Food Restaurants on School-Level · PDF file · 2015-06-25The...
45
1 The Effect of Fast-Food Restaurants on School-Level Obesity August 2011 Pedro Alviola, Rodolfo M. Nayga, Jr., Michael Thomsen, Diana Danforth, and James Smartt Abstract We analyze the effect of the number of fast food restaurants at different distances from public schools in Arkansas on school-level obesity rates. We use instrumental variable estimation with fast-food restaurant proximity being instrumented by proportion of the population within the 15 to 24 year-old age group and nearness of the school to major highways. Although we find no consistent statistical evidence of the association between the number of fast food restaurants and school-level obesity rates, the impact is greatest when fast-food restaurants are within a quarter of a mile of schools and this impact generally declines as distance between the school and fast-food restaurants increases. The magnitudes of this impact are robust but statistical significance varied depending on model specification. Results also suggest that number of restaurants within a quarter of a mile from the school increases obesity rates in middle/high schools and non-low socioeconomic status schools. Increasing the number of restaurants within half a mile to a mile from the school increases obesity rates in low-socioeconomic status schools. Keywords: childhood obesity, fast food restaurants, schools, instrumental variables.
Transcript of The Effect of Fast-Food Restaurants on School-Level · PDF file · 2015-06-25The...
1
The Effect of Fast-Food Restaurants on School-Level Obesity
August 2011
Pedro Alviola, Rodolfo M. Nayga, Jr., Michael Thomsen, Diana Danforth, and James
Smartt
Abstract
We analyze the effect of the number of fast food restaurants at different distances from
public schools in Arkansas on school-level obesity rates. We use instrumental variable
estimation with fast-food restaurant proximity being instrumented by proportion of the
population within the 15 to 24 year-old age group and nearness of the school to major
highways. Although we find no consistent statistical evidence of the association between
the number of fast food restaurants and school-level obesity rates, the impact is greatest
when fast-food restaurants are within a quarter of a mile of schools and this impact
generally declines as distance between the school and fast-food restaurants increases. The
magnitudes of this impact are robust but statistical significance varied depending on
model specification. Results also suggest that number of restaurants within a quarter of a
mile from the school increases obesity rates in middle/high schools and non-low
socioeconomic status schools. Increasing the number of restaurants within half a mile to
a mile from the school increases obesity rates in low-socioeconomic status schools.
Keywords: childhood obesity, fast food restaurants, schools, instrumental variables.
2
The Effect of Fast-Food Restaurants on School-Level Obesity
Childhood obesity is a major public health issue and is presently receiving great deal of
attention due to its broader economic consequences and long term effects on children’s
overall health, academic accomplishments, quality of life and productivity as they
become adults (Currie 2009). Fortunately, the most recent statistics indicate that growth
in the proportion of children classified as overweight or obese has finally leveled off
(Ogden et al. 2010). However, rates of overweight and obese children remain high.
Nearly 35 percent of children and adolescents aged 6 to 19 are overweight and just under
19 percent are obese (Ogden et al. 2010). With regard to health, the consequences of
overweight/obesity among children include increased risks for a variety of conditions
such as hypertension, coronary heart disease, type 2 diabetes, respiratory problems and
orthopedic abnormalities (Must and Strauss 1999; Ebbeling, Pawlak, and Ludwig 2002).
One of the sectors of the food industry that is being blamed for the prevalence of
childhood obesity is the food-away-from-home (FAFH) sector, particularly fast food.
From the late 1970’s up to the mid 1990’s, the proportion of meals eaten away from
home increased significantly from 16 percent to 29 percent (Lin, Guthrie, and Frazao
1999; Cawley 2006). Chou, Grossman and Saffer (2004) attribute the rapid expansion of
the fast-food industry to major structural changes. These include technological
developments in storage and preparation that have enabled food companies to mass
produce ready-to-cook meals (Philipson and Posner 1999; Lakdawalla and Philipson
2002; Cutler, Glaeser, and Shapiro 2003) and developments in the US labor market that
3
led to increased labor force participation of women (Anderson, Butcher, and Levine
2003b) which consequently reduced the time allocated for food preparation and child care
within the home (Anderson and Butcher 2006). This however ignores the effect of
technical advancements on the ability of women to enter the labor market and how the
entry women in the labor market affected technological developments (Cawley and Liu
2007).
The eating patterns of schoolchildren have mirrored the rapid expansion of the
fast-food industry. In 1977, children on average obtained approximately 20 percent of
their caloric intake from food away from home (FAFH) sources (Guthrie, Lin, and Frazao
2002; Lin, Guthrie, and Frazao 2001). The data from the 2003-2006 National Health and
Nutrition Examination Survey (NHANES) reveal that FAFH accounted for 35 percent of
children’s caloric intake (Mancino et al. 2010). Several studies have suggested that
children who consume more FAFH, especially fast-food, have lower dietary quality and
are likely to be overweight/obese (Mancino et al. 2010; Sebastian et al. 2009; Guthrie,
Lin, and Frazao 2002).
Considering the public policy issues and implications surrounding the need to
reduce child obesity, our main goal in this paper is to determine whether the availability
of fast-food restaurants is a significant driver of obesity rates in children. Fast-food items
typify the dietary characteristics that may increase the likelihood of obesity in children
(Ebbeling, Pawlak, and Ludwig 2002). Fast foods tend to have high glycemic indexes,
are often high in fats, and are sold in large portion sizes. Moreover, individual food items
are generally bundled and sold as energy dense “value” meals. Finally, fast foods are
4
heavily promoted on television and the volume of marketing messages reaching children
has been statistically linked to the problem of overweight children and adolescents
(Chou, Rashad, and Grossman 2008).
A number of studies have attempted to estimate the causal impact of the number
of fast-food restaurants on obesity levels. Currie et al. (2010) and Davis and Carpenter
(2009) assessed the impact of fast-food proximity on obesity rates among California
schoolchildren. Both studies employed indicator variables measuring the presence or
absence of fast-food restaurants within a given distance of the school. However, the two
studies differed in terms of level of aggregation and age of children in the samples. The
main response variable used in the Currie et al. (2010) study was the proportion of obese
9th graders, a school-level aggregate. They found that the presence of fast-food
restaurants within a tenth of a mile increased obesity rates by at least 1.2 percentage
points. The dataset analyzed by Davis and Carpenter (2009) included 7th through 12th
graders and contained BMIs for individual students. Their findings indicate that students
had 1.06 times the odds of being overweight and 1.07 times the odds of being obese when
a fast-food restaurant was located within a half mile of their school. Depending on model
specification, Davis and Carpenter’s (2009) estimates suggest that presence of a fast-food
establishment close to the school caused a student’s BMI to increase by 0.08 to 0.14 BMI
points.
Other recent studies have assessed the relationship between fast-food availability
and adult -- as opposed to child or adolescent -- obesity levels (Dunn 2010; Anderson and
Matsa 2011; and Chen, Florax, and Snyder 2009). In each of these studies the authors
5
acknowledge that fast-food availability is endogenous. In other words, the spatial
distribution of fast-food establishments and consumer residences is determined, in part,
by preferences and behaviors that would otherwise affect weight outcomes.
Consequently, each study makes use of instrumental variable (IV) models to account for
this endogeneity problem.
Both Dunn (2010) and Anderson and Matsa (2011) analyzed data from the
Centers for Disease Control and Prevention (CDC) Behavioral Risk Factor Surveillance
System. While these two studies differed in spatial scales and sample population, the
instrumental variable used in both was based on the proximity of interstate highways to
consumer residences. The argument here is that fast-food establishments tend to cluster
near highway off ramps and so the presence of highways substantially augments the
availability of fast food in a particular locale. Dunn’s (2010) results show statistically
significant responses in BMI to fast-food proximity among female and minority
populations within counties of medium population density. BMI scores among other
subpopulations were not statistically linked to fast-food availability. Anderson and Matsa
(2011) find little causal evidence linking fast-food restaurants to obesity levels among
adults. Unlike Dunn’s study, their focus was centered primarily on Caucasian residents
of rural areas. Their analysis suggests that calories from fast-food are offset by reduced
consumption of food from other sources. Also, they argue that obese individuals eat
more nutritionally deficient foods in general, regardless of whether it is prepared in the
home or sourced from fast-food restaurants.
6
Chen, Florax and Snyder (2009) characterized food environments in Marion
County, Indiana. They examined the relationship between fast-food restaurant and
grocery store access on individual adult BMI scores. They utilized an instrumental
variable -- the amount of zoned non-residential land -- in order to take into account
individual neighborhood selection and spatial dependence across individual observations.
Their results show that BMI scores were directly related to proximity of fast-food
restaurants and were inversely related to availability of supermarkets. However, these
effects, while statistically significant, were small in magnitude.
Two general conclusions from the above studies are as follows. First, the impact
of fast-food availability on weight outcomes appears to be context specific. In particular,
clustering of fast-food restaurants near schools has detrimental effects on weight
outcomes among schoolchildren whereas the evidence directly linking fast-food
availability to weight outcomes in adults is substantially weaker, both statistically and in
terms of overall economic importance.1 Second, it is important to account for potential
endogeneity when attempting to estimate the relationship between fast food and obesity
outcomes. Failure to address this issue will generally bias empirical findings towards an
understatement of the importance of fast food to weight gain (Dunn, 2010).
In this paper, we look at the impact of the number of fast-food restaurants on rates
of obese children in Arkansas public schools.2 Arkansas is an interesting case to study
since it is one of the poorest states and is also one of the least healthy. The Delta region in
particular is home to a historically disadvantaged population. More importantly for our
study, Arkansas’s childhood obesity rate has doubled in the last couple of decades and is
7
one of the highest in the country at nearly 40 percent (Arkansas Center for Health
Improvement 2009). Our study is similar to Currie et al. (2010) in that we use school-
level data to examine the impact of fast-food availability on the proportion of students
that are classified as obese. Also, we model proximity to fast-food restaurants by
counting the number of restaurants within aerial distances of 0 to 0.25 miles, 0.25 to 0.5
miles and 0.5 to 1 mile of schools because fast-food restaurants are likely to be located in
these distances (Currie et al. 2010; Davis and Carpenter 2009). However, our study
differs from Currie et al. (2010) in many respects. First, our sample covers a broader
range of student ages since it includes measurements on children from kindergarten
through 10th grade. Second, we measure the actual count of restaurants within a given
distance. Currie et al. (2010) model the changes in the supply of fast food using binary
variables to indicate the presence of a fast-food establishment within a given distance of
the school. Third, we use an IV regression approach to identify the effects of fast-food
proximity on school-level weight outcomes.
We identify our model with four instruments. One is the proportion of persons
aged 15 to 24 years that reside within the boundaries of the school district in question.
The other three instruments measure the distances between the school and the nearest US
highway, state highway and interstate highway. The logic supporting the use of the
proportion of persons aged 15 to 24 years as an instrument is that fast-food
establishments typically locate in places where there is easy access to this age group (Van
Giezen 1994). We use the highway proximity measures because fast-food restaurants
often choose locations to take advantage of business from highway travelers.
8
Furthermore, earlier studies have found highway proximity measures to be adequate
instruments in identifying the effects of fast food availability on obesity (Dunn 2010;
Anderson and Matsa 2011). We extensively discuss the validity of the instruments in a
separate section of the paper.
In addition to our interest in knowing if the effect of number of fast-food
restaurants decrease in distance, we also wish to know if more mobile students (i.e., older
students) respond more strongly or if schools with low or high socio-economic status
(SES) respond more strongly to fast-food restaurants. Consequently, we added several
model specifications which take into account the different distance thresholds, lower vs
higher SES schools, and student mobility in elementary and middle/high schools. They
were added to address (i) robustness to differential distances, (ii) differences in socio-
economic status, and (iii) weight differential effects of fast-food restaurants on schools
with open campus policy (higher grade schools) and schools which restrict out of school
mobility during school hours (elementary schools). In particular, we specified models
with varying distance thresholds; conducted analysis of schools based on county poverty
rates and analyzed subset of schools between elementary grade schools and schools
containing higher grades.
Our findings are interesting given earlier results presented by Davis and Carpenter
(2009) and Currie et al. (2010). Our estimates do not provide consistent evidence of the
effect of fast food restaurants on childhood and adolescent obesity. However, results
from different specifications relating to different distance thresholds, socio-economic
status and elementary and higher grade schools generally suggest that fast-food
9
restaurants near schools are likely contributing to childhood and adolescent obesity.
Specifically, the impact of fast-food restaurants is greatest when they are within a quarter
of a mile of schools. This impact declines as distance of the school to fast-food
restaurants increases. Moreover, estimates of the magnitude of this impact are robust to
differences in measuring fast-food restaurant proximity. There is also evidence that the
number of restaurants within a quarter of a mile from the school increases obesity rates in
middle/high schools and non-low socioeconomic status schools.
Model Specification
In modeling the effect of fast-food restaurants on school-level obesity rates, the
assumption that the error term is uncorrelated with one or more columns of the regressor
matrix is likely to be violated due to omitted variables, measurement error, and/or reverse
causality (see Baum 2006; Murray 2006). In this context we argue that decisions
regarding child health outcomes are made by the parents. Specifically, children’s food
choices and preferences are largely dependent on parental decisions (Anderson, Butcher,
and Levine 2003a). Endogeneity is likely to be present because adults, based on their
preferences, work status and intrinsic backgrounds may choose to locate near areas where
fast-food restaurants proliferate and conversely these restaurants may also geographically
position themselves based on characteristics of nearby consumers (Dunn 2010; Anderson
and Matsa 2010; Powell, Chaloupka, and Bao 2007). Dunn (2010) further notes that the
direction of the endogeneity bias may be ambiguous. On one hand, fast-food restaurants
could be expected to locate near consumer segments that are generally unconcerned about
10
dietary health, and obesity may well be a more prevalent problem among these
consumers. On the other hand, fast food restaurants might primarily target consumers
with a high opportunity cost of food preparation at home. Such consumers tend to have
higher incomes and higher incomes have been shown to be associated with positive
health outcomes including lower rates of obesity. Also, numerous factors contribute to
weight outcomes, and so the potential for omission of variables that influence both school
BMI and the number of restaurants within the proximity of a school is very real. Given
these concerns, directly regressing obesity rates against the number of restaurants will
likely produce inconsistent estimates of model coefficients. Consequently, we utilize the
IV regression approach.
The relationship of school obesity rates and number of fast-food restaurants can
be represented as:
(1) ∑
where i indexes the schools, j indexes distances between schools and fast-food
restaurants, is the proportion of children within the school that are obese, Xi is a vector
of control variables, the Fij are fast-food restaurant counts and i is an error term. In our
baseline specification, we measure restaurant counts within distances of 0 to 0.25 miles,
0.25 to 0.5 miles and 0.5 to1.0 miles.3
Since we have reason to believe that the number of fast-food restaurants is
endogenous, we estimate the first stage relation involving the instrumentation of the
number of fast-food restaurants. The first stage relation can be represented as:
(2) δ φ ε
11
where Zi is vector of instrumental variables and i is the error term. Four instrumental
variables are used to identify the model. One is the proportion of school district residents
aged 15 to 24 years and the other three are highway proximity measures representing the
distance between the school and the nearest US, state and interstate highway.
In addition to our baseline specification, we also constructed additional
specifications relating to restaurant counts within (a) 0 to 0.25 miles and 0.25 to 1.0
miles; (b) 0 to 0.5 miles and 0.5 to1.0 miles, and (c) within 1.0 mile to assess the
robustness of our results to different distance thresholds. We also developed model
variants that separated the analysis between lower and higher SES schools to determine if
there are differences in the effects of fast-food restaurants by SES level. Lastly, we
conducted separate analysis between lower grade schools and schools containing higher
grades in order to estimate the differential effects of fast-food restaurants on schools with
open campus policy (higher grade schools) and schools which have restricted student
mobility during school hours (elementary schools).
Data Description
The proportion of obese students in Arkansas schools was obtained from the Arkansas
Center for Health Improvement. The obesity rates are based on BMI measurements that
were taken during the 2008-09 school year on children in even numbered grades:
kindergarten, 2nd grade, 4th grade, 6th grade, 8th grade and 10th grade. One advantage of
the obesity rates used here is that they are based on actual weight and height
measurements and were assessed by trained personnel within the school. However, these
12
BMI screenings are subject to strict confidentiality protections and so only school-level
aggregates are in the public domain.
Geo-coded restaurant data were purchased from Acxiom’s Infobase Business list.
Acxiom is a Little Rock based company and their dataset provided the names and
geocoded (latitude and longitude) locations of restaurants within the state. Fast food
restaurants, as used in our study, include the major hamburger chains and drive-in
restaurants (e.g. McDonalds, Burger King, Wendy’s), take-out pizza establishments,
quick-service taco places (e.g., Taco Bell), sandwich delicatessens (e.g., Subway,
Quiznos), fried chicken restaurants (e.g., KFC, Chick-Fil-A), donut shops and ice-cream
parlors. We searched establishment names for keywords such as “burger”, “dairy”,
“chicken”, “drive-in” and “taco” in order to identify local or regional fast-food
establishments, in addition to the national chains. We made specific efforts to exclude
full-service restaurants from our final dataset. Our restaurant data were current for the
summer of 2009, the summer following the school-year under study. Given the large
number of restaurants and statewide coverage of our study, it was not feasible to ground-
truth the physical locations of restaurants in our final sample. However, our restaurant
data contain addresses and latitudinal and longitudinal coordinates.
We used the ArcGIS program to interface fast-food restaurant coordinates with
GIS school maps obtained from the Arkansas Department of Education. These school
maps are maintained in GeoStor, which is the main geographic information systems
platform for the state. From this interface, we were then able to count the number of
restaurants within various distances from each school. Similarly, the highway proximity
13
measures used to instrument our model were constructed by interfacing the GIS school
maps with highway maps from the Arkansas State Highway and Transportation
Department.
Control variables were measured at either the school level or the school district
level depending on data availability. At the school level, control variables included
enrollment proportions in each even numbered grade for which BMI was measured, the
proportion of male students, the proportion of student enrollment by race, the proportion
of students speaking a given language at home and the proportion of students
participating in free and reduced lunch programs. At the school district level, controls
included average teacher salary. Each of these measures was obtained from the Arkansas
Department of Education (ADE).
The proportion of population in the 15-24 year-old age group and additional
controls for broader socio-demographic and economic characteristics of the surrounding
community were constructed from block-level data found in the 2000 Census. Each
census block has a Census School District Unified Code for 2000. The Census State Data
Center in Arkansas provided a list of the census codes and their associated school district
names which we then matched to the ADE school district codes for 2000. School
consolidation information from ADE was then used to reassign school districts in 2000 to
correspond to districts as constituted during the 2008-09 school year. Finally, Arkansas
is a geographically and economically diverse state and so a set of binary control variables
were included to reflect broad regional differences. Regions of the state were defined
according to Arkansas Planning and Development Districts.
14
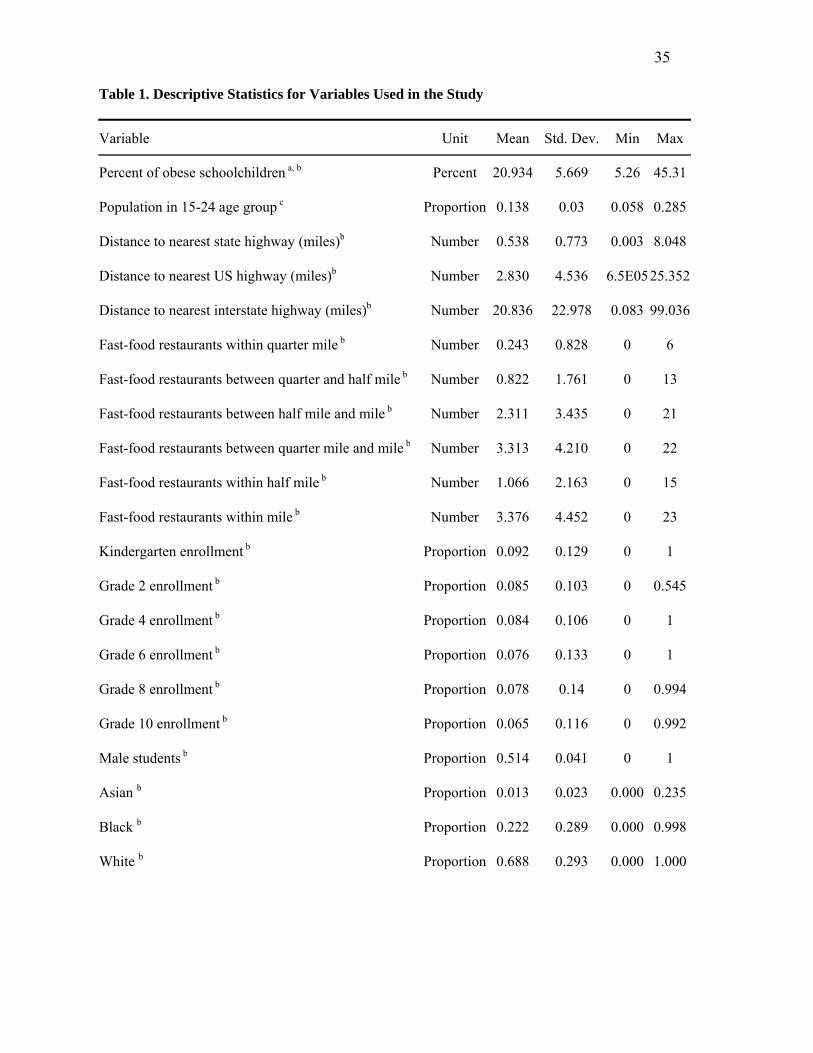
Table 1 presents the descriptive statistics of the variables used in the study. Note
that the average school-level obesity rate is approximately 21 percent while the average
number of fast-food restaurants from a school at different incremental distances is as
follows: 0.243 for the quarter of a mile radius, 0.822 for the quarter mile to half of a mile
radius and 2.311 for the half mile to one mile radius. The average proportion of
individuals in the 15-24 age group by school district is 0.138. On the other hand, the
average distances of a school to nearest major highways are 0.538 mile for State
highways, 2.830 miles for US highways and 20.836 miles for interstate highways.
Information on socioeconomic and demographic characteristics of the school and the
community surrounding the school are also exhibited in table 1.
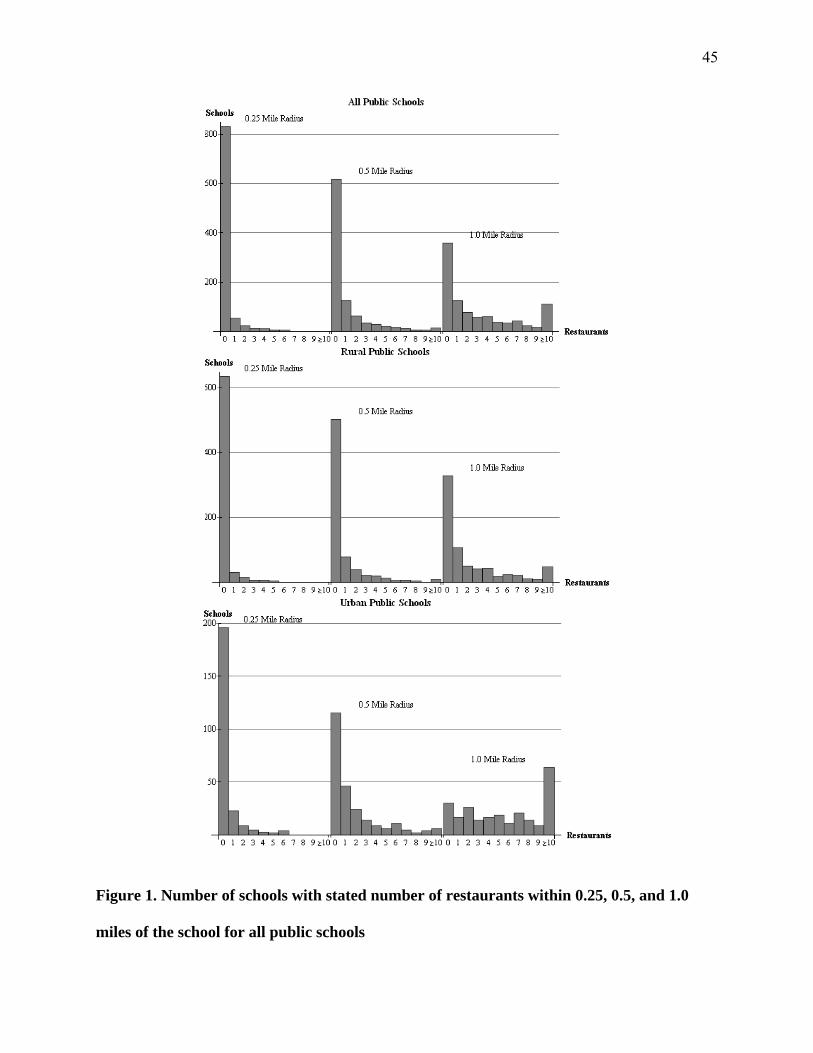
The histograms in figure 1 provide additional information. Overall, 11.8 percent
of schools have at least one fast food restaurant within a quarter of a mile, 34.5 percent
have one or more restaurants within half of a mile, and a majority, 61.9 percent, have one
or more fast food restaurant within a mile of the school. In figure 1, we distinguish
between rural districts and urban districts based on the percentage of urban residents
living within district boundaries. If the percentage of urban residents exceeds 70 percent
we classify the district as urban. Figure 1 shows that schools in urban districts are more
likely to be located near one or more fast food restaurants, but this was by no means an
exclusively urban phenomenon. The majority (53 percent) of rural schools have at least
one fast food restaurant within a one-mile radius. The fraction of rural schools within a
quarter mile of one or more restaurants was roughly half that of urban schools.
15
The analysis conducted for schools based on grade levels separated the sample
between elementary schools and higher grade schools. As for the analysis based on SES,
the sub-samples were created based on the Arkansas county poverty rates. More
specifically, the low SES schools were based on the lowest quartile of Arkansas counties
(19 out of 75 counties) with the highest poverty rates. These counties include Scott (24.5
%), Jefferson (24.7 %), Newton (25.5 %), Columbia (25.7 %), Lafayette (25.7 %), Desha
(25.8 %), Poinsett (26.3 %), Searcy (27 %), Hempstead (27.3 %), Woodruff (27.4 %),
Monroe (27.5 %) Bradley (27.6 %), Crittenden (28.3 %), Jackson (28.4), Lincoln (31.5
%), St. Francis (31.8 %), Chicot (32.8 %), Phillips (34.7 %) and Lee (42.6 %).
Instrument Validity
As mentioned above, four instrumental variables were used to identify our model. The
first is the proportion of population within the 15 to 24 year-old age group residing within
the boundaries of the school district in question. The remaining three instruments used in
our study measure the distance of the school to the nearest US highway, state highway
and interstate highway. There are threats to the validity of all four of these instruments
within the context of our study. We address these in turn.
Proportion of the population within the 15 to 24 year-old age group
The proportion of population within the 15 to 24 year-old age group is a compelling
instrument because the fast-food industry has consistently used minimum wages to
compensate employees (Card and Krueger 1994; Katz and Krueger 1992). Fast-food
establishments also require a great deal of flexibility in arranging work shifts in order to
accommodate conditions of high and low volume throughout the workday (Bills 1999).
16
Consequently, the modal hiring process characterized by Bills (1999) places premiums on
age, personality and past job performance with less emphasis on education and job skills.
Given these factors, teenagers or young adult workers are ideal candidates as they are
generally better able to tolerate low salaries, shifting hours of work and can easily be
made to accept unanimity in a group setting (Schlosser 2001).
The main challenge to the validity of this instrument is that it is possible for
individuals at the upper end of the 15 to 24 year-old age group to be parents of young
schoolchildren. This is problematic for two reasons. First, parents in the 15 to 24 year-
old age group would have had to conceive children while in their teenage years. To the
extent that teenage parents have reduced prospects for education and employment,
children of these parents may be of lower socioeconomic status. Indeed, a number of
studies have found that an inverse relationship exists between childhood obesity and
socioeconomic indicators (see, for example, Berkowitz and Stunkard 2002). Secondly,
regardless of socioeconomic status, younger parents may, in general, be less attentive to
dietary health. In this case, parental choices will impact the home food environment and
can thereby adversely impact weight outcomes among children. We can take some
assurance in the fact that the overlap between the 15 to 24 year-old age cohort and
parents of young schoolchildren is much less than perfect. Indeed, this age cohort would
contain only the very youngest of parents. For example, a 20 year-old parent of a
kindergartner would have been 13 to14 years old when their child was conceived.
Nonetheless, this challenge to instrumental validity is something that does require further
inquiry.
17
We address this challenge by directly assessing whether the behaviors and
characteristics of parents within our instrumental age range are affecting childhood
weight outcomes. More specifically, we examine how the 15 to 24 year-old population is
related to school enrollments. For obvious biological reasons, parents in our instrumental
age cohort could only be contributing to enrollment levels in the early elementary grades.
Of these early grades, it is primarily kindergarten enrollments that are meaningful in
assessing instrument validity within the context of our study.4 Based on the arguments
above, evidence of a statistically positive relationship between kindergarten enrollments
and the proportion of the population in the 15 to 24 age group would cast some doubt on
the validity of our instrument. The first column of table 2 presents coefficients from a
regression of the proportion of students enrolled in kindergarten on the instrumental
variable and controls for socioeconomic and demographic characteristics of the
surrounding communities. While positive, the coefficient on the instrumental variable is
not statistically significant. As a further robustness check, estimates in the second column
in table 2 also show that the proportion of the population in the 15 to 24 age group does
not have a significant effect on second grade enrollment, thus providing further evidence
that the instrument does not affect early-grade enrollments.
Another threat to instrument validity is that locales with a high proportion of
younger people may be attractive to additional business formats, such as convenience
stores, that provide unhealthy food options and this could affect obesity outcomes among
children. We could not address this threat directly at the school or school-district level of
aggregation because our dataset on business locations only included eating places.
18
However, we used County Business Patterns to compile county-level data for the number
of convenience stores per capita in 2008 and matched this to county level data on
population characteristics from the 2000 Census. We conducted regression analysis and
found no statistically significant relationship between convenience stores per capita and
percentage of the population aged 15-24 at the county-level. This finding was robust to
the inclusion/exclusion of controls for other county-level population characteristics.
Distance between the school and nearest US, state and interstate highways
Measures of proximity to highways have been used in earlier studies to identify the
relationship between fast food establishments and adult obesity outcomes (Dunn 2010;
Anderson and Matsa 2011). The logic here is that fast-food establishments tend to cluster
near highway off ramps and so the presence of highways substantially augments the
availability of fast food in a particular locale. Dunn (2010) and Anderson and Matsa
(2011) go to considerable lengths to address the validity of using interstate highways to
instrument fast-food proximity. Both assess whether individuals residing close to
highways differ in terms of physical exercise, fruit and vegetable consumption and other
BMI risk factors and conclude that either there are no significant differences or, in the
case of Dunn (2010), that significant differences are of small magnitude and are unlikely
to be of major importance when measuring the impact of fast-food availability on BMI
outcomes. Furthermore, Anderson and Matsa (2011) conducted surveys showing that the
observed statistical linkage between highway proximity and fast-food availability does
have a direct bearing on fast-food consumption.
19
In the case of US and State highways, it can be argued that these highways can
mimic interstate highways if the interstate system is under developed, small or
nonexistent and if increasing traffic would allow either type of highway to be upgraded to
interstate highway standards. In studying the effects of fast-food availability and obesity
among white and non-white residents in Central Texas, Dunn, Sharkey and Horel (2010)
addressed the endogeneity issue by using the distance between residence and nearest
major highway to instrument fast-food proximity. Consequently, they also included US
and State highways as instruments in addition to the interstate highways. In this study,
we find empirical support to include US and State highways as additional instruments.
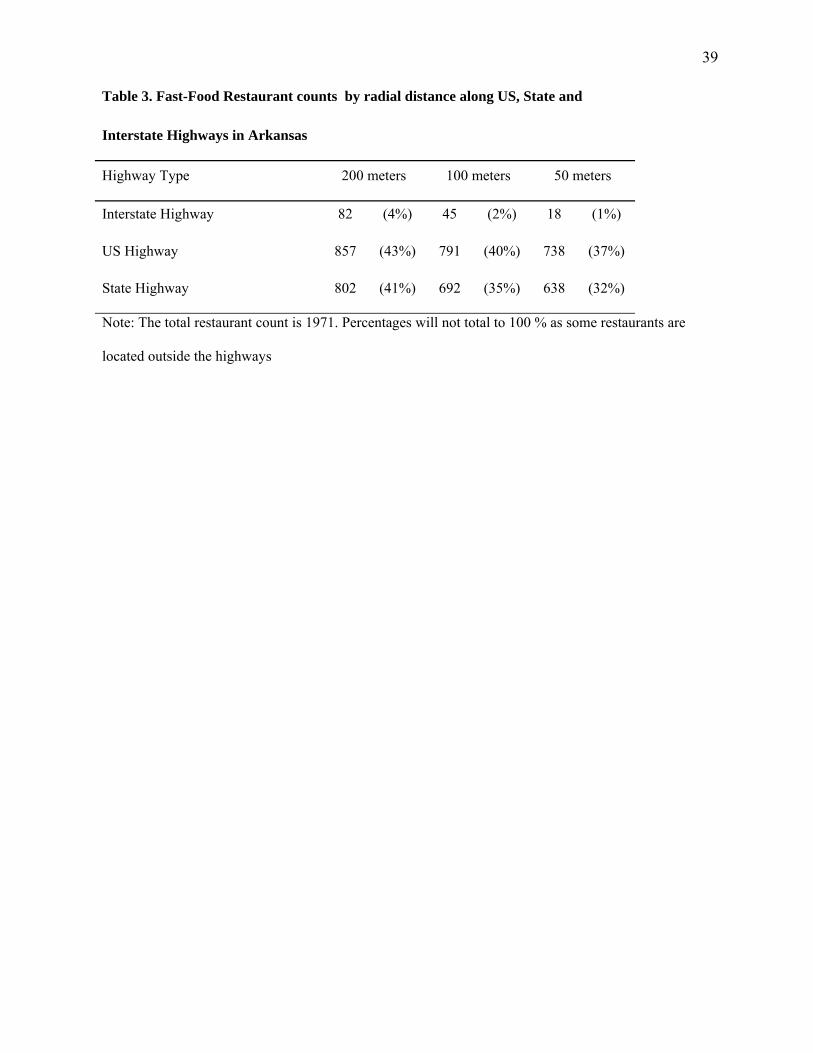
For example, as shown in table 3, we find that within a 200 meter radius from the road,
84 percent of the fast-food restaurants are located in US and State highways. The same
pattern emerges for the 100 and 50 meter radial distances.
Within the context of our study, one additional challenge to the validity of using
highway proximity to instrument the model is that presence of highways may affect
transportation costs and thereby expand food options during the lunch period for students
of driving age. Evidence of a significant statistical relationship, especially between
enrollments in higher grades and the highway proximity variables would weaken the
validity of the highway proximity instruments. To address this, we regressed grade 10
and grade 8 enrollments on the highway proximity instruments.5 Most students become
age-eligible for drivers licenses during grade 10 and even if they are ineligible to drive
themselves, they will be attending school with peers that are of driving age. A
relationship between 8th grade enrollments and the highway instruments is of less
20
concern. However, we do address this because a sizable number of schools in our sample
had 8th grade students enrolled with older students of driving age. Results are presented
in third and fourth columns of table 2. We find no statistical evidence that relates either
grade 10 and or grade 8 enrollments with our highway proximity variables.
First Stage Results and Instrument Relevancy
Table 4 presents the first stage estimation results. In each case, the estimated
relationships are of the expected sign, but statistical significance varies across the fast
food restaurant counts at different distances. We performed various additional tests to
assess the relevancy of our instrument. Specifically, we checked the over-identification
and weak identification conditions (Baum, Schaffer, and Stillman 2007; Bascle 2008).
The results of the Hansen J statistic is insignificant indicating that the null hypothesis of
the instruments being uncorrelated with the error terms is not rejected. On the other
hand, the test statistics (Kleibergen-Paap rk Wald F statistics) for weak identification
show the instruments are marginally relevant (Stock and Yogo 2005).
Since our chosen instruments are relatively weak, we use Fuller’s modified
limited information maximum likelihood (Fuller-LIML) estimation procedure. This
procedure is robust when weak instruments are present and is less sensitive than the two-
stage least squares to finite sample bias (Bascle 2008). The Fuller modified LIML
approach is a modified version of the LIML procedure because it circumvents LIML’s
limitation of having no finite moments. In this modification, α represents an unknown
parameter (where α=1 or α > 0). A value for α can be set by the researcher in order to
21
reduce finite sample bias. In the literature, values of α that have gained good reviews are
α=1 and α=4 (Murray 2006; Davidson and Mackinnon 1993). When weak instruments
are present, both values have been found to generate reasonable point estimates relative
to 2SLS and LIML (Murray 2006). Furthermore, Hahn, Hausman and Kuersteiner (2004)
found that Fuller modified LIML α=4 estimator is more efficient than the α=1 variant. In
this paper we implement the Fuller- LIML procedure with α=4.
Impact of Fast-Food Restaurants on School-level Obesity
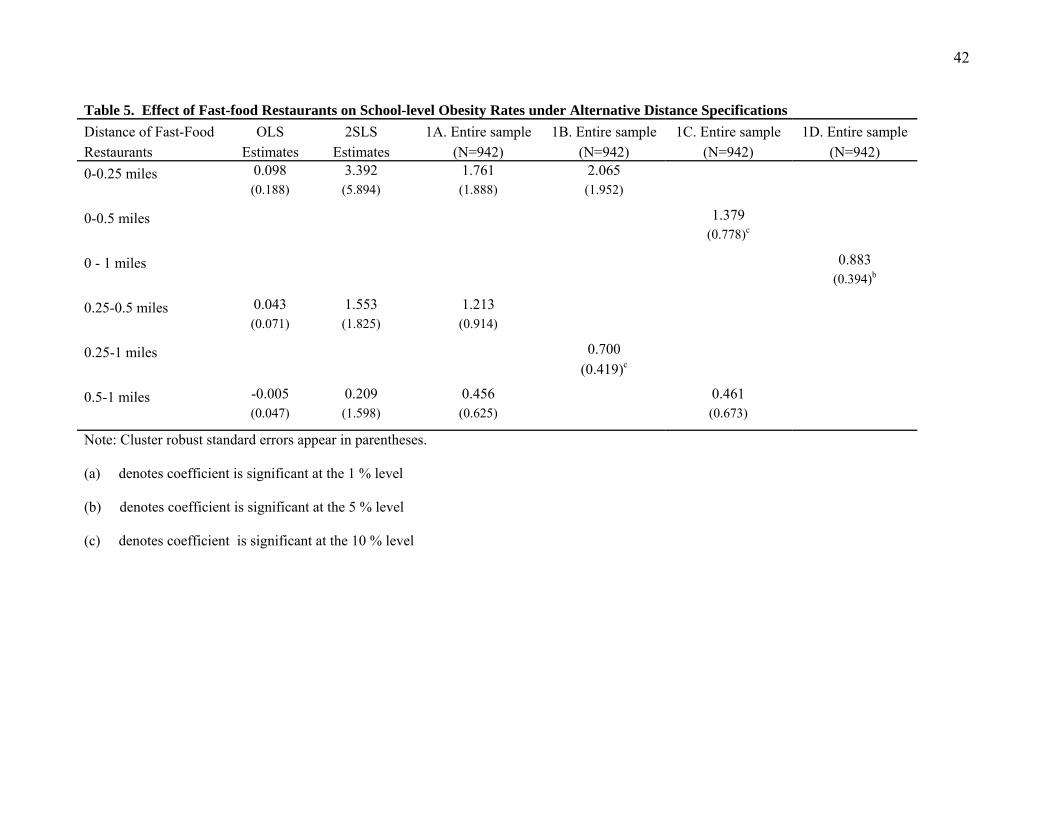
Tables 5 and 6 provide summary results from regression models by estimation
procedure, namely ordinary least squares (OLS naïve results), two stage least squares
(2SLS), Fuller-LIML (α=4) and alternative specifications based on distance thresholds,
socio-economic status and elementary and higher grade schools. Because our instruments
are only marginally relevant, with the exception of the OLS and 2SLS, both tables report
results based on the Fuller-LIML (α=4) weak instrument robust procedure.
Endogeniety Issue
The estimates from the OLS model at all distances from schools are smaller in magnitude
than the IV estimates and so may be understating the true effects. This finding provides
some insight into the nature of the endogeneity problem. As discussed earlier,
endogeniety could result from two plausible equilibrium outcomes. One is an
equilibrium wherein overweight consumers self locate near fast-food restaurants and vice
22
versa and the other is an equilibrium that involves fast-food restaurants being clustered
near households with high incomes and, by extension, high opportunity costs of in-home
food preparation. The fact that the OLS estimates are substantially smaller than the IV
estimates provides evidence in favor of the second outcome in that previous findings of
an inverse relationship between obesity and income would result in a downward bias in
OLS estimates.
The 2SLS estimates are similar in magnitude to the 1.A model specification
which is the Fuller-LIML (α=4) estimates of the IV model. However, none of the
estimated coefficients on the fast food proximity measures are statistically significant.
Although not presented here, other covariates measuring the percentage of students
receiving free and reduced lunch, percentage of students having Spanish as a home
language, and regional location of the schools are statistically associated with school-
level obesity rates.
Magnitude and Directional Effect of Fast food Restaurant on School Obesity Rates
The 0.25, 0.5, and 1.0 mile thresholds used to measure the proximity of fast-food
restaurants are somewhat arbitrary and so we examined alternative specifications with
different assumptions about these thresholds. Coefficient estimates and standard errors
for the baseline specification reported and for specification with alternative fast-food
proximity measures are reported in table 5. The magnitudes and significance levels of the
covariates were robust to these differences in specification and so, in the interest of space,
are not reported.
23
Overall, findings in table 5 generally suggest that statistical evidence on the effect
of fast food restaurants on school obesity outcomes is mixed and significance levels
depend on the specification being used. That said, it is worth pointing out that the
estimated impact of restaurants on school-level obesity rates is robust to the differences
in model specification. For example, when projected through the sample means,
specifications 1A through 1D in table 5 suggest that the average impact of restaurants
within a mile radius of schools ranges from a 2.77 to 3.09 percentage point increase in
school level obesity rates. In other words, there is only about a 0.3 percentage point
difference among these four specifications.
The results provide some support for the hypothesis that restaurants nearest the
school have the greatest impact on obesity levels. For example, specification 1A in table
5 indicates that one additional restaurant within 0.25 miles of a school results in a 1.761
percentage point increase in school-level obesity rates, the addition of a more distant
restaurant within 0.25 to 0.5 miles or 0.5 to 1.0 miles of the school results in a smaller
increase of 1.213 or 0.456 percentage points, respectively. This general pattern is evident
in specifications 1B and 1C as well.
We offer two explanations for the declining effect as distance from school
increases. First, transport costs for students are quite high and distance would matter a
great deal in cases where students are able to leave campus during what are usually very
short lunch breaks. Second, most school days end in the mid to late afternoon -- several
hours after the child has last had a meal. Because many children will have developed an
appetite by this time of day, the presence of a fast-food restaurant near the school may be
24
an especially important stimulus that motivates the child to request fast food on the ride
home or causes him to develop a greater desire for fast-food items that manifests itself on
other dining occasions. The effects of this type of exposure would be more
heterogeneous at longer distances from the school and so would be less likely to show up
in a school-level obesity measure.
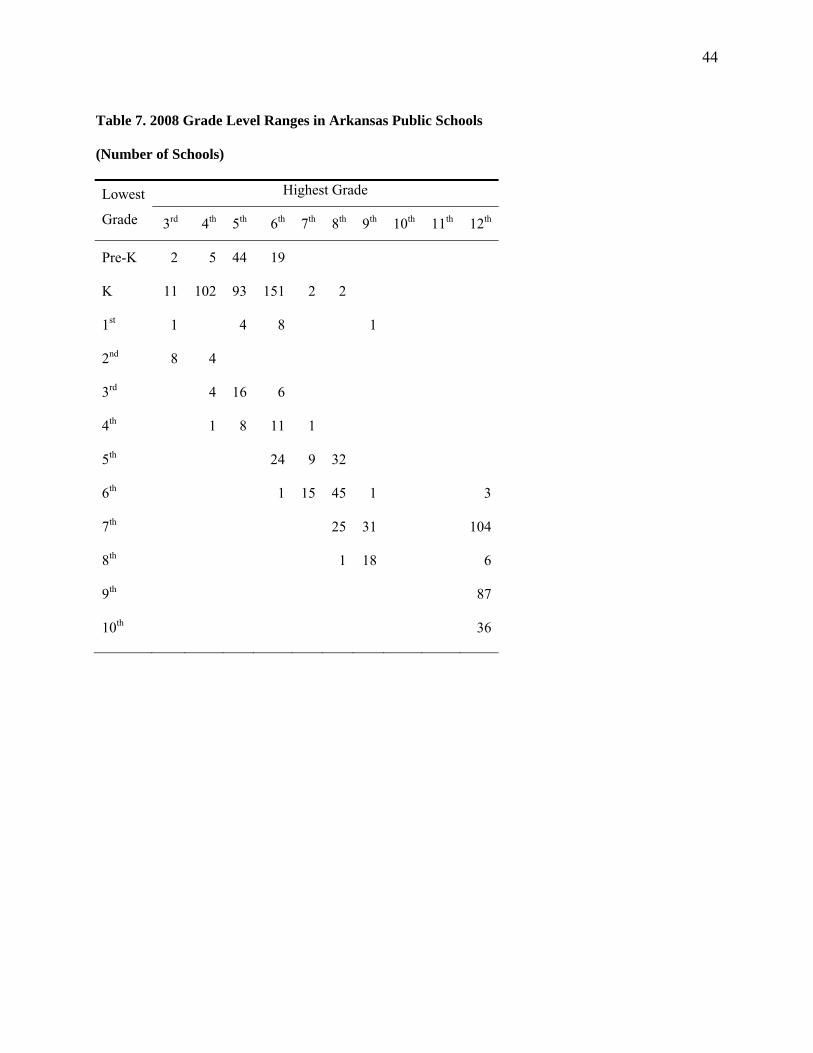
Elementary Schools vs Schools with Higher Grades: Examining the Issue of Student
Mobility
Specification 2A and 2B in table 6 represent an attempt to examine the question of
whether the effect of fast food restaurants are stronger in schools with more or less
mobile students. It is relatively straightforward to argue that transport costs would be
most important for adolescent students who are more likely to leave campus during the
school day and so it would seem reasonable and straightforward to conduct separate
analyses for high schools, junior high or middle schools, and elementary schools. This,
however, is easier said than done. There is a great deal of diversity across our sample in
terms of how different grade levels are housed within schools. While the highest grades
(10th through 12th) are universally found in high schools and the lowest grades
(kindergarten through 4th) are generally found in elementary schools, there are varied
approaches to housing the intermediate grade levels (see table 7). Nonetheless, we did
break our sample into two samples, one for schools with higher grades (most middle
schools, junior high schools, and high schools) and another for elementary schools.
25
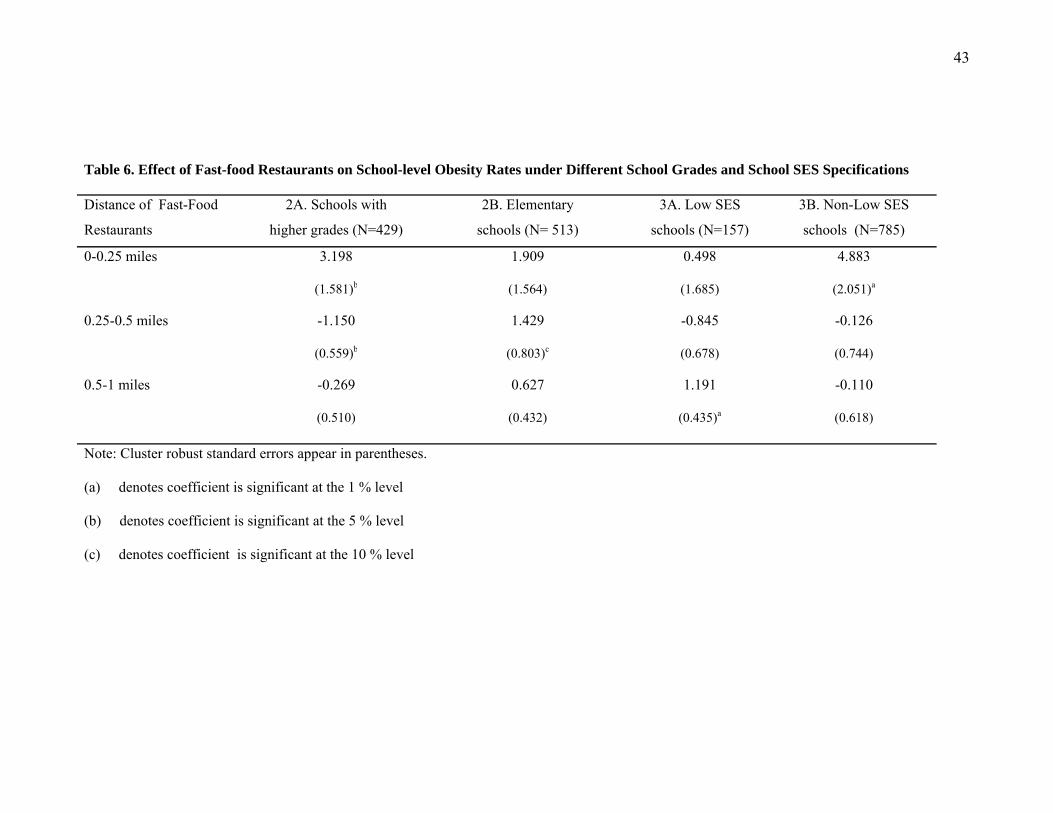
Results in table 6 suggest that both arguments have merit. The estimate for
restaurants within a quarter mile of schools in specification 2A (for the schools with
higher grades) is much larger than that in either specification 2B (for the elementary
schools) or in specifications 1A or 1B (the entire sample). This is consistent with the
transport cost argument and suggests that proximity is more important for students in
upper grades who are more prone to leave campus during the lunch period. Moreover,
the estimated impacts of restaurants at more distant radiuses are much smaller when
based on the sample of schools with higher grade levels. The reverse is true when
estimates are based on the sample of elementary schools. There is a lower estimate for
the impact of nearby restaurants and larger estimates for more distant restaurants when
compared to either the sample of schools with higher grade levels or the entire sample.
Low SES Schools versus Non Low SES Schools
As previously mentioned, we divided our sample between low SES schools and non- low
SES area schools. The low SES schools were based on the lowest quartile of Arkansas
counties (19 out of 75 counties) with the highest poverty rates. Specifications 3A and 3B
in table 6 present the results for schools in these two areas. We find that the effect of
restaurants within the 0.5 to 1.0 mile radius is larger in low SES schools than non-low
SES schools. However, for nearer distances such as the 0 to 0.25 mile radius, the effect of
restaurants is greater in non-low SES schools than in low SES schools.
26
Summary and Conclusions
The principal aim of our paper is to ascertain the impact of the number of fast-food
restaurant on school-level obesity rates. While our study is similar to Currie et al. (2010)
who looked at the proportion of obese 9th graders, we cover a broader range of student
ages since our sample includes measurements on children from kindergarten through 10th
grade. Moreover, in contrast to Currie et al. (2010), we measure the actual count of
restaurants within a given distance from the school and use an instrumental variable
regression approach to identify the effects of fast-food proximity on school-level weight
outcomes. We use four instruments, namely the proportion of school district population
in the 15-24 age-group and nearest distance of school to US, state and interstate highways
to identify the effect of number of restaurants on school obesity rates. We subjected the
instruments to a number of tests to assess its validity and relevancy. The instruments
generated enough correlation to produce consistent estimates. However, results from the
weak identification test suggest that all of the instruments are only marginally relevant.
Consequently, we employed the Fuller-LIML procedure due to its robustness in the
presence of relatively weak instruments.
Our results using the full sample generally suggest that statistical evidence on the
effect of fast food restaurants on school obesity outcomes is mixed considering that the
significance levels of these effects depend on the specification being used. This finding
throws some doubt to the California results of Davis and Carpenter (2009) and Currie et
al. (2010) which suggests that their findings may not be generalizable to broader samples.
Our results indicate that the effect of number of fast food restaurants is highest when
27
they are within 0.25 mile from the school. This effect then diminishes at the incremental
ranges of within 0.25 mile to 0.5 mile from the school and within 0.5 mile to 1 mile from
the school. Our overall findings are robust to different specifications, but statistical
significance varied depending on model specification.
Our results also indicate that the impact of fast food restaurants at longer
distances is larger in low SES schools but for nearer distances, the effect of restaurants is
greater in non-low SES schools. Another result of our study suggests that fast-food
proximity is a key factor for upper grade level students who are less restricted in leaving
campus during breaks. This may imply that proposed zoning policies that are aimed at
limiting the availability of fast-foods restaurants in nearby schools, particularly those in
the upper grade levels, at distances where the effect is highest will likely have a
significant impact on school-level obesity rates. If fast-food restaurants locate further
away from schools, it is possible that the effects of increasing transport costs can become
a major search disincentive for these students.
Future studies should assess the robustness of our findings by grade level given
data availability. Also, considering the mixed results and relative weakness of our
instruments, our findings should be taken with caution. Admittedly, finding completely
valid instruments in IV estimations is a very challenging and almost impossible task due
to the potential of having a number of confounding variables. Despite the challenges of
finding valid and reliable instruments in this type of analysis, future studies should
attempt to test other types of instruments and strategies in identifying these causal effects.
28
Notes 1 Further evidence is provided by Currie et al. (2010). In addition to adolescents in the 9th
grade, their study examined pregnant women, a predominantly adult population. While
they did find that fast-food proximity was statistically linked to weight gain among
pregnant women, the impact was much smaller than that found among early adolescent
schoolchildren. This is related to travel costs. In general, adult populations have much
greater mobility than schoolchildren. The addition of a fast-food restaurant close to the
place of residence amounts to a marginal augmentation to the choice set of an adult
consumer whereas addition of a fast-food restaurant close to a school likely constitutes a
nontrivial change in available food choices of an adolescent.
2 School obesity rates are defined as proportion of children with Body Mass Index (BMI)
scores greater than or equal to the 95th percentile as defined by gender specific CDC
growth charts.
3 In this specification, we are implicitly assuming no variation in fast food menu prices
due to the cross-sectional nature of our data.
4 Enrollments in first grade do not matter in our study because first graders are not
measured for BMI and so do not affect our dependent variable. As explained in the prior
section, BMI is measured only for children enrolled in even numbered grades. Although
we do examine them, it is unlikely that second grade enrollments are very meaningful for
assessing instrument validity because of the eight to nine-year lag between the time a
child is conceived and the time he enters the second grade.

29
5 Again, keep in mind that BMI is measured for adolescents in even numbered grades
through grade 10. This is the reason for our focus on 8th and 10th grade enrollments.
30
References:
Anderson, P., and K. F. Butcher. 2006. Childhood Obesity: Trends and Potential
Causes. The Future of Children 27(1): 19-45.
Anderson, P., K. Butcher, and P. Levine. 2003a. Economic Perspectives on
Childhood Obesity. Economic Perspectives 27: 30-4.
Anderson, P., K. Butcher, and P. Levine. 2003b. Maternal Employment and
Overweight Children. Journal of Health Economics 22: 477-504.
Anderson, M., and D. Matsa. 2011. Are Restaurants Really Supersizing America?
American Economic Journal: Applied Economics 3:152-88.
Arkansas Center for Health Improvement. 2009. Assessment of Childhood and
Adolescent Obesity in Arkansas Year Six. Little Rock Arkansas.
Bascle, G. 2008. Controlling for Endogeneity with Instrumental Variables in Strategic
Management Research. Strategic Organization 6(3): 285-327.
Baum, C. F. 2006. An Introduction to Modern Econometrics using Stata. College
Station, TX: Stata Press.
Baum, C. F., M. E. Schaffer, and S. Stillman. 2007. Enhanced Routines for
Instrumental Variables/GMM Estimation and Testing. Working paper,
Department of Economics, Boston College, Boston.
Berkowitz, R. I., and A. J. Stunkard. 2002. Development of Childhood Obesity, In
Handbook of Obesity Treatment, eds. Thomas Wadden, & Albert Stunkard, 515-
531. Guilford Press, New York.
31
Bills, D. B. 1999. Labor Market Information and Selection in Local Restaurant
Industry: The Tenuous Balance Between Rewards, Commitments, and Costs.
Sociological Forum 14(4): 583-607.
Card, D., and A. D. Kruger. 1994. Wages and Employment: A Case Study of the
Fast-Food Industry in New Jersey and Pennsylvania. The American Economic
Review 84(4): 772-793.
Cawley, J. 2006. Markets and Childhood Obesity Policy. The Future of Children
16(1): 69-88.
Cawley, J., and F. Liu 2007. Maternal Employment and Childhood Obesity: A Search
for Mechanisms in Time Use Data. NBER Technical Working Paper No. 13600.
Chen, S, R. D, Florax, and S. D. Snyder. 2009. Obesity in Urban Food Markets:
Evidence from Georeferenced Micro data. Research report, Dept. Agricultural
Economics, Purdue University, Lafayette.
Chou, S., I. Rashad, and M. Grossman. 2008. Fast-Food Restaurant Advertising on
Television and Its Influence on Childhood Obesity. Journal of Law and
Economics 51: 559-618.
Chou, S., M. Grossman, and H. Saffer. 2004. An Economic Analysis of Adult
Obesity: Results from the Behavioral Risk Factor Surveillance System. Journal of
Health Economics 23: 565-587.
Currie, J. 2009. Health, Wealthy, and Wise: Socioeconomic Status, Poor Health in
Childhood, and Human Capital Development. Journal of Economic Literature 47:
87-122.
32
Currie, J., S. DellaVigna, E. Moretti, and S. Pathania. 2010. The Effect of Fast-food
Restaurants on Obesity and Weight Gain. American Economic Journal: Economic
Policy 2(3): 32-63.
Cutler, D. M., E. L. Glaeser, and J.M. Shapiro. 2003. Why Have Americans Become
More Obese. Journal of Economic Perspectives 17(3): 93-118.
Davidson, R., and J. R. MacKinnon.1993. Estimation and Inference in Econometrics.
New York, NY: Oxford University Press.
Davis, B., and C. Carpenter. 2009. Proximity of fast-food restaurants to schools and
adolescent obesity. American Journal of Public Health 99(3): 505-510.
Dunn, R. A. 2010. Obesity and the availability of fast-food: An Analysis by Gender,
Race and Residential Location. American Journal of Agricultural Economics
92(4): 1149-1164.
Dunn, R. A., J. Sharkey and S. Horel. 2010. The Effect of Fast-Food Availability on
Fast-Food Consumption and Obesity Among Rural Residents: An Analysis by
Race/Ethnicity. Journal of Economics and Human Biology (forthcoming).
East Arkansas Planning and Development District. 2009. Comprehensive and
Economic Development Strategy. Jonesboro Arkansas.
Ebbeling, C., D. Pawlak, and D. Ludwig. 2002. Childhood Obesity: public health
crisis, common sense cure. The Lancet 360(9331): 473-482.
Guthrie, J. F., B. Lin, and E. Frazao. 2002. Role of Food Prepared Away from Home
in the American Diet, 1977-78 versus 1994-1996: Changes and Consequences.
Journal of Nutrition Education and Behavior 34(3): 140-150.
33
Hahn, J., J. Hausman, and G. Kuersteiner. 2004. Estimation with Weak Instruments:
Accuracy of Higher-Order Bias and MSE Approximations. Econometrics Journal
7(1): 272–306
Katz, L. F., and A. Krueger. 1992. The Effect of the Minimum Wage on the Fast-
Food Industry. Industrial and Labor Relations Review 46(1): 6-21.
Lakdawalla, D., and T.J. Philipson. 2002. The Growth of Obesity and Technological
Change: A Theoretical and Empirical Examination. Working Paper, National
Bureau of Economic Research, Cambridge, Massachusetts.
Lin, B. H., J. Guthrie, and E. Frazao. 1999. Quality of Children’s Diets At and Away
From Home: 1994-1996. Food Review January-April: 2-9.
Lin, B. H., J. Guthrie, and E. Frazao. 2001. American Children’s Diets Not Making
The Grade. Food Review 24(2): 8-17.
Mancino, L., J. Todd, J. Guthrie, and B. H. Lin. 2010. How Food Away From Home
Affects Children’s Diet Quality. ERR-105, Economic Research Service, USDA.
Murray, M. P. 2006. The Bad, the Weak and Ugly: Avoiding the Pitfalls of
Instrumental Variables Estimation. Working Paper, Social Science Research
Network,.
Must, A., and R. S. Strauss. 1999. Risks and Consequences of Childhood and
Adolescent Obesity. International Journal of Obesity 23(S2): S2-S11.
Ogden, C.L., M. D. Carroll, L.R. Curtin, M.M. Lamb, and K.M. Flegal. 2010.
Prevalence of High Body Mass Index in US Children and Adolescents, 2007-
2008. Journal of the American Medical Association 303 (3): 242-249.
34
Philipson, T. J., and R.A. Posner. 1999. The Long Run Growth in Obesity as a
Function of Technological Change. Working Paper, National Bureau of Economic
Research, Cambridge, Massachusetts.
Powell, L.M., F. J. Chaloupka, and Y. Bao. 2007. The Availability of Fast-Food and
Full-Service Restaurants in the United States, Associations and Neighborhood
Characteristics. American Journal of Preventive Medicine 33(4s): s240-s245.
Schlosser, E. 2001. Fast Food Nation: the Dark side of the All American Meal. New
York, NY: Houghton Mifflin Company.
Sebastian, R.S., C. W. Enns, and J.D. Goldman. 2009. US Adolescents and
MyPyramid: Associations between Fast-Food Consumption and Lower
Likelihood of Meeting Recommendations. Journal of the American Dietetic
Association 109 (2): 226-235.
Stock, J, H., and M. Yogo. 2005. Testing for weak instruments in linear IV
regression. In Identification and Inference for Econometric Models: A Festschrift
in Honor of Thomas Rothenberg, ed. D. W. K. Andrews and J. Stock, 80–108.
New York, NY: Cambridge University Press, Cambridge.
Van Giezen, R.W. 1994. Occupational Wages in the Fast-Food Restaurant Industry.
Monthly Labor Review August: 24-29.
35
Table 1. Descriptive Statistics for Variables Used in the Study
Variable Unit Mean Std. Dev. Min Max
Percent of obese schoolchildren a, b Percent 20.934 5.669 5.26 45.31
Population in 15-24 age group c Proportion 0.138 0.03 0.058 0.285
Distance to nearest state highway (miles)b Number 0.538 0.773 0.003 8.048
Distance to nearest US highway (miles)b Number 2.830 4.536 6.5E05 25.352
Distance to nearest interstate highway (miles)b Number 20.836 22.978 0.083 99.036
Fast-food restaurants within quarter mile b Number 0.243 0.828 0 6
Fast-food restaurants between quarter and half mile b Number 0.822 1.761 0 13
Fast-food restaurants between half mile and mile b Number 2.311 3.435 0 21
Fast-food restaurants between quarter mile and mile b Number 3.313 4.210 0 22
Fast-food restaurants within half mile b Number 1.066 2.163 0 15
Fast-food restaurants within mile b Number 3.376 4.452 0 23
Kindergarten enrollment b Proportion 0.092 0.129 0 1
Grade 2 enrollment b Proportion 0.085 0.103 0 0.545
Grade 4 enrollment b Proportion 0.084 0.106 0 1
Grade 6 enrollment b Proportion 0.076 0.133 0 1
Grade 8 enrollment b Proportion 0.078 0.14 0 0.994
Grade 10 enrollment b Proportion 0.065 0.116 0 0.992
Male students b Proportion 0.514 0.041 0 1
Asian b Proportion 0.013 0.023 0.000 0.235
Black b Proportion 0.222 0.289 0.000 0.998
White b Proportion 0.688 0.293 0.000 1.000
36
Table 1. Descriptive Statistics for Variables Used in the Study(cont.)
Variable Unit Mean Std. Dev. Min Max
Spanish as home language b Proportion 0.05 0.104 0 0.726
Percent urban c Proportion 0.425 0.354 0 0.996
Free and reduced lunch b Proportion 0.593 0.206 0.049 1
Average teacher salary c $1,000 44.18 5.452 28.926 61.514
Work commute 5-9 minutes c Proportion 0.138 0.06 0.022 0.322
Work commute 10-14 minutes c Proportion 0.161 0.065 0.03 0.296
Work commute 25-29 minutes c Proportion 0.047 0.022 0.01 0.151
Work commute ≥ 90 minutes c Proportion 0.023 0.013 0.003 0.096
Per capita income c $1,000 16.38 2.732 10.914 23.289
Population below poverty c Proportion 0.161 0.057 0.032 0.422
Supplemental security income c Proportion 0.061 0.025 0.016 0.152
Public assistance income c Proportion 0.029 0.012 0.007 0.088
Females in labor force c
Proportion 0.221 0.032 0.105 0.325(females age 16+ with less than age 18)
High school degree or equivalent c, d Proportion 0.352 0.053 0.223 0.483
Some college or associates degree c, d Proportion 0.238 0.045 0.137 0.334
Bachelors degree c, d Proportion 0.099 0.047 0.023 0.219
Advanced degree c, d Proportion 0.05 0.03 0.009 0.167
Children living with single parent c, d Proportion 0.289 0.106 0.122 0.651
37
a Obesity measures are based on students in even numbered grades, kindergarten through 10th grade.
b School-level variables. Proportions represent share of students within the school.
c School-district level variables. Proportions represent share of population or households within
school district boundaries.
d Measures are based on population 25 years of age and older.
e Regional control variables correspond to Arkansas Planning and Development Districts
Table 1. Descriptive Statistics for Variables Used in the Study(cont.)
Variable Unit Mean Std. Dev. Min Max
Regional Indicator variablese
South East Binary 0.086 0.28 0 1
North West Binary 0.17 0.376 0 1
West Central Binary 0.114 0.318 0 1
East Binary 0.154 0.361 0 1
White River Binary 0.096 0.294 0 1
South West Binary 0.101 0.302 0 1
West Binary 0.096 0.294 0 1
Central Binary 0.184 0.387 0 1
38
Table 2. Effects of Percentage Population of 15-24 Age Group and Highway Proximity Measures on Kindergarten
Grade 2, Grade 8 and Grade 10 enrollments
Instrumental Variables Kindergarten Grade 2 Grade 10 Grade 8
Population in the 15-24 age group 0.2578 (0.2184) 0.1442 (0.1983)
Distance to nearest US highway 0.0003 (0.0008) -0.0001 (0.0009)
Distance to nearest State highway -0.0024 (0.0044) -0.0001 (0.0050)
Distance to nearest Interstate highway
0.0002 (0.0002) 0.0000 (0.0003)
Robust standard errors appear in parentheses. Estimates for control variables are omitted in the interest of space.
39
Table 3. Fast-Food Restaurant counts by radial distance along US, State and
Interstate Highways in Arkansas
Highway Type 200 meters 100 meters 50 meters
Interstate Highway 82 (4%) 45 (2%) 18 (1%)
US Highway 857 (43%) 791 (40%) 738 (37%)
State Highway 802 (41%) 692 (35%) 638 (32%)
Note: The total restaurant count is 1971. Percentages will not total to 100 % as some restaurants are
located outside the highways
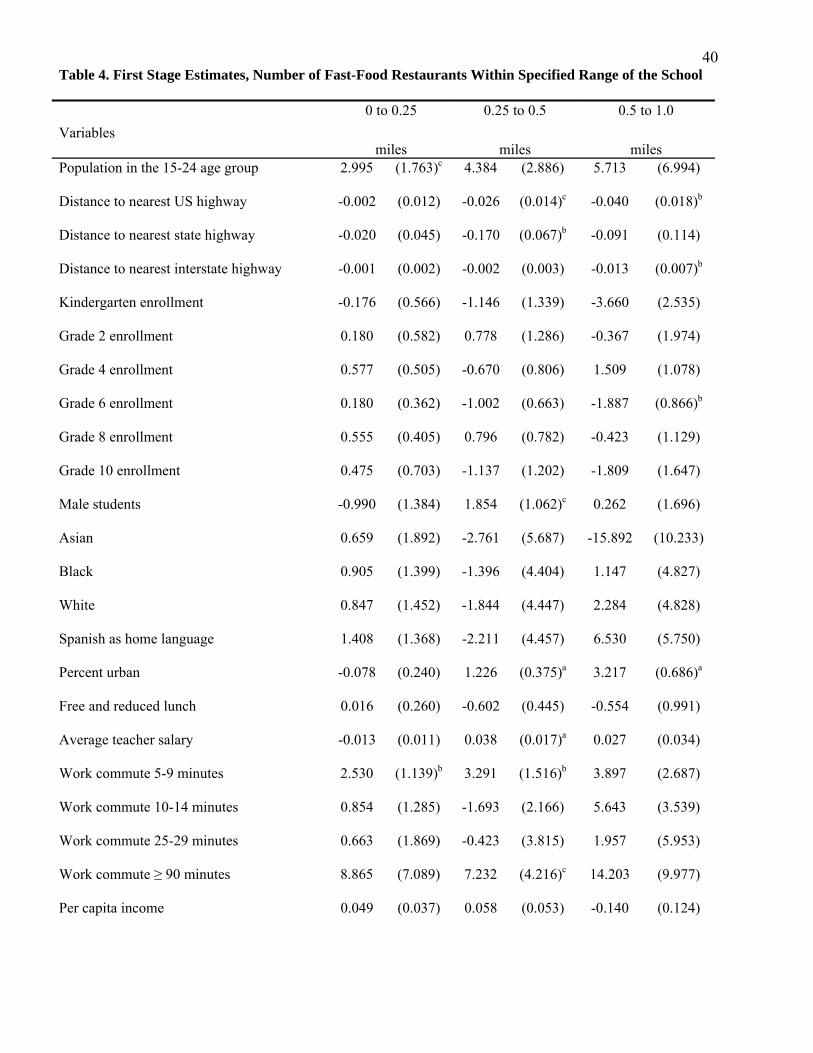
40Table 4. First Stage Estimates, Number of Fast-Food Restaurants Within Specified Range of the School
Variables
0 to 0.25 0.25 to 0.5 0.5 to 1.0
miles miles miles Population in the 15-24 age group 2.995 (1.763)c 4.384 (2.886) 5.713 (6.994)
Distance to nearest US highway -0.002 (0.012) -0.026 (0.014)c -0.040 (0.018)b
Distance to nearest state highway -0.020 (0.045) -0.170 (0.067)b -0.091 (0.114)
Distance to nearest interstate highway -0.001 (0.002) -0.002 (0.003) -0.013 (0.007)b
Kindergarten enrollment -0.176 (0.566) -1.146 (1.339) -3.660 (2.535)
Grade 2 enrollment 0.180 (0.582) 0.778 (1.286) -0.367 (1.974)
Grade 4 enrollment 0.577 (0.505) -0.670 (0.806) 1.509 (1.078)
Grade 6 enrollment 0.180 (0.362) -1.002 (0.663) -1.887 (0.866)b
Grade 8 enrollment 0.555 (0.405) 0.796 (0.782) -0.423 (1.129)
Grade 10 enrollment 0.475 (0.703) -1.137 (1.202) -1.809 (1.647)
Male students -0.990 (1.384) 1.854 (1.062)c 0.262 (1.696)
Asian 0.659 (1.892) -2.761 (5.687) -15.892 (10.233)
Black 0.905 (1.399) -1.396 (4.404) 1.147 (4.827)
White 0.847 (1.452) -1.844 (4.447) 2.284 (4.828)
Spanish as home language 1.408 (1.368) -2.211 (4.457) 6.530 (5.750)
Percent urban -0.078 (0.240) 1.226 (0.375)a 3.217 (0.686)a
Free and reduced lunch 0.016 (0.260) -0.602 (0.445) -0.554 (0.991)
Average teacher salary -0.013 (0.011) 0.038 (0.017)a 0.027 (0.034)
Work commute 5-9 minutes 2.530 (1.139)b 3.291 (1.516)b 3.897 (2.687)
Work commute 10-14 minutes 0.854 (1.285) -1.693 (2.166) 5.643 (3.539)
Work commute 25-29 minutes 0.663 (1.869) -0.423 (3.815) 1.957 (5.953)
Work commute ≥ 90 minutes 8.865 (7.089) 7.232 (4.216)c 14.203 (9.977)
Per capita income 0.049 (0.037) 0.058 (0.053) -0.140 (0.124)
41Table 4. First Stage Estimates, Number of Fast-Food Restaurants Within Specified Range of the School (cont.)
Variables
0 to 0.25 0.25 to 0.5 0.5 to 1.0
miles miles miles
Population below poverty -2.554 (1.385)c -5.276 (2.139)b -3.985 (4.479)
Supplemental security income -4.872 (3.139) -3.342 (4.048) 9.667 (8.089)
Public assistance income 0.643 (4.592) 6.498 (8.109) 10.121 (17.521)
Females in labor force 1.437 (1.136) -0.806 (2.216) -6.464 (4.076)
High school degree or equivalent -1.877 (1.816) 1.928 (2.567) 10.095 (5.629)c
Some college or associates degree -2.694 (1.536)c -4.646 (2.249)b 10.033 (5.613)c
Bachelors degree -5.398 (2.984)c -6.980 (4.768) 16.145 (9.405)c
Advanced degree 4.251 (3.275) 3.279 (6.546) -2.594 (12.911)
Children living with single parent 1.317 (0.961) 1.783 (1.411) 2.670 (2.855)
South East 0.198 (0.212) -0.193 (0.313) -0.485 (0.478)
North West 0.213 (0.157) 0.680 (0.276)b 0.652 (0.516)
West Central -0.031 (0.143) 0.198 (0.221) 0.518 (0.524)
White River 0.061 (0.138) 0.441 (0.222)b 0.693 (0.484)
South West -0.070 (0.140) 0.293 (0.244) 0.300 (0.500)
West 0.090 (0.148) 0.688 (0.268)b 0.877 (0.482)c
Central -0.037 (0.145) 0.384 (0.270) 0.795 (0.612)
Intercept 0.010 (2.179) -0.631 (4.686) -8.917 (6.961)
Number of obs 942 942 942
F-value 3.75a 11.74a 16.26a
F(4, 244)d 1.07 3.26b 3.01b
Root MSE 0.8295 1.685 2.912
Note: Cluster robust standard errors appear in parentheses.
(a) denotes coefficient is significant at the 1 % level
(b) denotes coefficient is significant at the 5 % level
(c) denotes coefficient is significant at the 10 % level
(d) test of excluded instruments
42
Table 5. Effect of Fast-food Restaurants on School-level Obesity Rates under Alternative Distance Specifications
Distance of Fast-Food OLS 2SLS 1A. Entire sample 1B. Entire sample 1C. Entire sample 1D. Entire sample
Restaurants Estimates Estimates (N=942) (N=942) (N=942) (N=942)
0-0.25 miles 0.098 3.392 1.761 2.065
(0.188) (5.894) (1.888) (1.952)
0-0.5 miles 1.379
(0.778)c
0 - 1 miles 0.883
(0.394)b
0.25-0.5 miles 0.043 1.553 1.213
(0.071) (1.825) (0.914)
0.25-1 miles 0.700
(0.419)c
0.5-1 miles -0.005 0.209 0.456 0.461
(0.047) (1.598) (0.625) (0.673)
Note: Cluster robust standard errors appear in parentheses.
(a) denotes coefficient is significant at the 1 % level
(b) denotes coefficient is significant at the 5 % level
(c) denotes coefficient is significant at the 10 % level
43
Table 6. Effect of Fast-food Restaurants on School-level Obesity Rates under Different School Grades and School SES Specifications
Distance of Fast-Food 2A. Schools with 2B. Elementary 3A. Low SES 3B. Non-Low SES
Restaurants higher grades (N=429) schools (N= 513) schools (N=157) schools (N=785)
0-0.25 miles 3.198 1.909 0.498 4.883
(1.581)b (1.564) (1.685) (2.051)a
0.25-0.5 miles -1.150 1.429 -0.845 -0.126
(0.559)b (0.803)c (0.678) (0.744)
0.5-1 miles -0.269 0.627 1.191 -0.110
(0.510) (0.432) (0.435)a (0.618)
Note: Cluster robust standard errors appear in parentheses.
(a) denotes coefficient is significant at the 1 % level
(b) denotes coefficient is significant at the 5 % level
(c) denotes coefficient is significant at the 10 % level
44
Table 7. 2008 Grade Level Ranges in Arkansas Public Schools
(Number of Schools)
Lowest
Grade
Highest Grade
3rd 4th 5th 6th 7th 8th 9th 10th 11th 12th
Pre-K 2 5 44 19
K 11 102 93 151 2 2
1st 1 4 8 1
2nd 8 4
3rd 4 16 6
4th 1 8 11 1
5th 24 9 32
6th 1 15 45 1 3
7th 25 31 104
8th 1 18 6
9th 87
10th 36
45
Figure 1. Number of schools with stated number of restaurants within 0.25, 0.5, and 1.0
miles of the school for all public schools


![[FR] [Restaurants] Sonorisez vos restaurants et fast-foods avec Tracktl](https://static.fdocuments.net/doc/165x107/55c45298bb61eb9a7c8b4696/fr-restaurants-sonorisez-vos-restaurants-et-fast-foods-avec-tracktl.jpg)