The effect of crystalline morphology on the glass ...etheses.bham.ac.uk/3796/1/Toft12MRes.pdf · to...
85
A thesis submitted to The University of Birmingham for the degree of: Masters of Research in the Science and Engineering of Materials Project Supervisor Dr. M. Jenkins Department of Metallurgy and Materials College of Engineering and Physical Sciences The University of Birmingham September 2011 THE EFFECT OF CRYSTALLINE MORPHOLOGY ON THE GLASS TRANSITION AND ENTHALPIC RELAXATION IN POLY (ETHER-ETHER-KETONE) MICHAEL TOFT
Transcript of The effect of crystalline morphology on the glass ...etheses.bham.ac.uk/3796/1/Toft12MRes.pdf · to...

A thesis submitted to The University of Birmingham for the degree of:
Masters of Research in the Science and Engineering of Materials
Project Supervisor
Dr. M. Jenkins
Department of Metallurgy and Materials College of Engineering and Physical Sciences
The University of Birmingham September 2011
THE EFFECT OF CRYSTALLINE MORPHOLOGY ON THE GLASS TRANSITION AND ENTHALPIC
RELAXATION IN POLY (ETHER-ETHER-KETONE)
MICHAEL TOFT

University of Birmingham Research Archive
e-theses repository This unpublished thesis/dissertation is copyright of the author and/or third parties. The intellectual property rights of the author or third parties in respect of this work are as defined by The Copyright Designs and Patents Act 1988 or as modified by any successor legislation. Any use made of information contained in this thesis/dissertation must be in accordance with that legislation and must be properly acknowledged. Further distribution or reproduction in any format is prohibited without the permission of the copyright holder.
Abstract
This work investigates the effect of crystalline morphology on the glass transition and ageing
characteristics of semi-crystalline PEEK. It is shown that an increasing degree of crystallinity acts to
raise the glass transition temperature of the polymer and reduce the overall degree of enthalpic
relaxation. For an equal degree of crystallinity the glass transition temperature is also shown to be
sensitive to isothermal crystallisation temperature.
By compensating for shifts in Tg and the influence of crystalline content, samples of varying
morphology were produced and physically aged at undercoolings tailored to the Tg of the system. A
greater degree of enthalpic relaxation was observed in cold crystallised samples where the degree of
constraint of the amorphous fraction at the crystal/amorphous interface is thought to be greater.
Acknowledgements
I would like to thank Dr. Mike Jenkins for his continued advice and guidance throughout this
project and Frank Biddlestone for his valuable technical support.

Contents
CHAPTER 1 : INTRODUCTION.............................................................................1
1.1 Synthesis and Properties of Poly(ether-ether-ketone)....................................................1
1.2 Crystallisation of Polymers...............................................................................................3
1.3 The Crystalline Morphology of PEEK............................................................................5
1.3.1 Origin of Double Melting: Melting and Recrystallisation....................................6
1.3.2 Origin of Double Melting: Primary and Secondary Crystallisation.....................8
1.4 Nature of The Glass Transition, Physical Ageing and Enthalpic Relaxation.............11
1.4.1 The Glass Transition...........................................................................................11
1.4.2 Physical Ageing..................................................................................................11
1.4.3 Enthalpic Relaxation...........................................................................................12
1.5 The Influence of Crystallinity on the Glass Transition and Enthalpic Relaxation...15
1.6 Scope of the Work...........................................................................................................18
CHAPTER 2 : EXPERIMENTAL...........................................................................20
2.1 Materials...........................................................................................................................20
2.2 Differential Scanning Calorimetry (DSC).....................................................................21
2.2.1 Measurements of Crystallinity............................................................................23
2.2.2 Measurements of Enthalpic Relaxation...............................................................24
2.2.3 Determination of the Glass Transition Temperature...........................................25
2.3 Sample Preparation and Standard Conditioning..........................................................27

CHAPTER 3 : RESULTS AND DISCUSSION.................................................................30
3.1 Influence of Cooling Rate on Enthalpic Relaxation in Amorphous PEEK..............30
3.1.1 Sample Conditioning.........................................................................................30
3.1.2 Results and Discussion......................................................................................32
3.2 Influence of Crystallinity on Enthalpic Relaxation....................................................34
3.2.1 Sample Conditioning.........................................................................................34
3.2.2 Results and Discussion......................................................................................35
3.3 Effect of Crystallinity on the Glass Transition............................................................39
3.3.1 Sample Conditioning.........................................................................................39
3.3.2 Results and Discussion......................................................................................40
3.4 Effect of Isothermal Crystallisation Temperature on the Glass Transition.............42
3.4.1 Sample Conditioning.........................................................................................42
3.4.2 Results and Discussion......................................................................................45
3.5 Effect of Lamellae Thickness on Enthalpic Relaxation..............................................49
3.5.1 Sample Conditioning.........................................................................................49
3.5.2 Results and Discussion......................................................................................53
3.6 General Discussion….......................................................................................................59
CHAPTER 4 : CONCLUSION...........................................................................................61
CHAPTER 5 : FUTURE WORK........................................................................................63
REFERENCES......................................................................................................................65
APPENDIX I : Baseline Subtraction....................................................................................69
APPENDIX II : Formation of Additional Crystallinity on Cooling and Reheating....... 72

List of Figures
FIGURE 1.1 – The Repeat Unit of Poly(ether-ether-ketone)...............................................1
FIGURE 1.2 – Rate of Crystallisation with Change in Temperature....................................4
FIGURE 1.3 – Peak Crystallisation Times with Temperature for PEEK............................6
FIGURE 1.4.A – Deviation of Enthalpy from the Equilibrium Line on Cooling..................13
FIGURE 1.4.B – Entalpic Recovery on Tg and Trace for Zero-Ageing................................13
FIGURE 1.5 – Constrained and Free Amorphous Regions................................................16
FIGURE 2.1 – Trace of Amorphous PEEK Scanned to Melt.............................................21
FIGURE 2.2 – Baseline Determination for Calculating Peak Areas....................................23
FIGURE 2.3.A – Measuring the Glass Transition Temperature.............................................26
FIGURE 2.3.B – Determination of the Glass Transition Temperature in this Work………………..26
FIGURE 3.1.A – Melting Traces of Amorphous PEEK Cooled Through Tg at Various Rates............................................................................................................31
FIGURE 3.1.B – Glass Transition Region of Amorphous PEEK Cooled Through Tg at Various Rates..............................................................................................31
FIGURE 3.2 – Enthalpic Relaxation as a Function of Cooling Rate Through Tg.............33
FIGURE 3.3.A – Non-Isothermal Crystallisation Traces at Different Cooling Rates............36
FIGURE 3.3.B – Isothermal Crystallisation Traces at Different Temperatures......................36
FIGURE 3.4 – Degree of Enthalpic Relaxation for Samples of Various Crystallinities.....38
FIGURE 3.5 – Broadening of The Glass Transition with Increasing Crystallinity............41

FIGURE 3.6 – Glass Transition Temperature as a Function of Crystallinity.....................41
FIGURE 3.7.A – Cooling PEEK from the Melt to Below Tg at 160⁰C/min..........................43
FIGURE 3.7.B – Heating Amorphous PEEK from Below Tg to the Melt at 160⁰C/min......43
FIGURE 3.8 – Double Melting Endotherms of Cold and Melt Crystallised PEEK...........46
FIGURE 3.9 – Glass Transition Temperature as a Function of Isothermal Crystallisation Temperature................................................................................................48
FIGURE 3.10 – Subtraction of a Sample with Zero Ageing Time from that of an Aged Sample to Calculate Enthalpic Relaxation..................................................51
FIGURE 3.11 – Degree of Enthalpic Relaxation for Samples of Equal Crystallinity but Various Lamellae Thickness......................................................................55
List of Tables
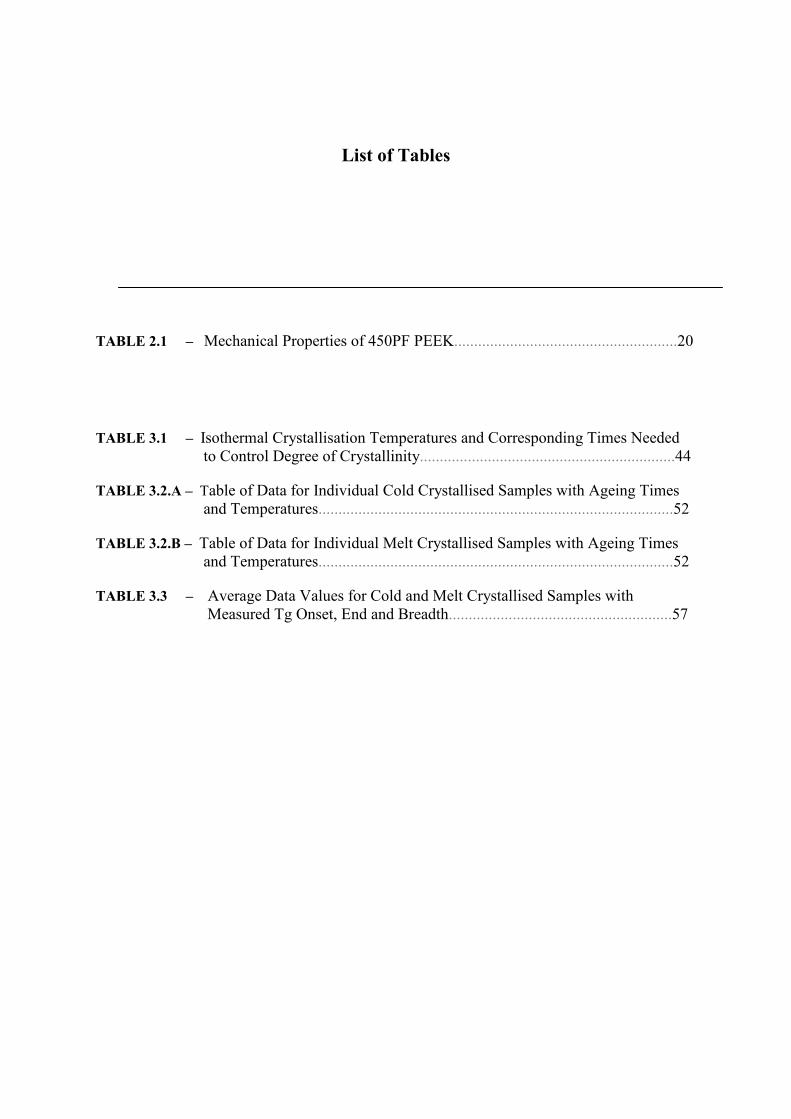
TABLE 2.1 – Mechanical Properties of 450PF PEEK........................................................20
TABLE 3.1 – Isothermal Crystallisation Temperatures and Corresponding Times Needed to Control Degree of Crystallinity................................................................44
TABLE 3.2.A – Table of Data for Individual Cold Crystallised Samples with Ageing Times and Temperatures.........................................................................................52
TABLE 3.2.B – Table of Data for Individual Melt Crystallised Samples with Ageing Times and Temperatures.........................................................................................52
TABLE 3.3 – Average Data Values for Cold and Melt Crystallised Samples with Measured Tg Onset, End and Breadth........................................................57

1
Chapter 1 : Introduction
1.1 Synthesis and Properties of Poly(ether-ether-ketone)
Preparation of the high molecular weight poly(aryletherketone) family by polyether synthesis was
first reported by Attwood et al. [1] and the crystalline unit cell of poly(ether-ether-ketone) or PEEK in
particular was described by Dawson and Blundell [2] and shown to have the following chemical
structure:
PEEK became commercially available as a high temperature performance thermoplastic, with a glass-
transition temperature (Tg) of 144ºC and a crystalline melting point (Tm) of 335ºC attributed to the
rigid ketone links [2]. The advantage of PEEK over other high temperature polymers at the time, such
as poly(ether sulphone), was its degree of crystallinity which improved solvent stress crack resistance
and also increased its useful mechanical strength to above 200ºC. Despite poly(ether sulphone) having
a higher Tg of 225ºC, as the sulphone group prevents crystallinity from developing in the polymer it is
amorphous and all mechanical strength is lost around 220ºC. The high melting PEEK crystals are able
to retain a measurable degree of rigidity in the polymer long after passing through the Tg and do so
until the onset of crystal melting around 300ºC [1, 2].
Figure 1.1. The chemical structure of Poly(ether-ether-ketone). [5]

2
With good mechanical properties, superior chemical resistance and stability at elevated temperatures
PEEK soon became recognised as a high-quality engineering thermoplastic [3]. This attracted a great
deal of early attention with regards to its morphology and crystallisation kinetics due to its potential
use in highly demanding applications [3 – 8]. As a semi-crystalline polymer PEEK also offered
relative ease of manufacture as a composite matrix allowing more complex components to be
fabricated using conventional polymer processing techniques such as compression and injection
moulding, unlike the fibre-reinforced thermosetting polymers [4] .
The physical and mechanical properties of semi-crystalline polymers are highly dependent upon their
degree of crystallinity, the excellent solvent stress crack resistance of PEEK is not seen unless it is
sufficiently crystalline [9, 10]. In addition to this although an increasing degree of crystallinity may
slightly improve the tensile properties of PEEK, for the same increase in crystallinity (from 27 to
43%) the mode I fracture toughness of the polymer has been shown to decrease by a factor of almost 3
due to the reduced amorphous content [11].

3
1.2 Crystallisation of Polymers
The crystallisation of polymers can be seen as a dynamic transition from a highly disordered random
state, known as the amorphous phase, into ordered three-dimensional spherulites built up from stacks
of tightly folded polymer chains, known as lamellae [12]. The crystalline structure of polymers is not
a single crystal, but is built up from an array of spherulites. The size, number, structure and perfection
of these spherulites depends on the previous thermal history of the polymer and processing conditions
such as crystallisation temperature, rate of change of temperature with respect to time, molecular
weight of the polymer and any inclusions [12, 13].
As crystals are formed from a highly disordered state, in practise a 100% crystalline polymer is
unattainable due to the many entanglements preventing all of the polymer chains arranging into the
three-dimensional array required for crystallinity [12]. Therefore polymers which are able to develop
a certain degree of crystallinity are known to be semi-crystalline. As a semi-crystalline polymer,
PEEK can be obtained in either an amorphous or crystalline form as a direct result of the processing
conditions from the melt. A glassy or amorphous state is achieved by rapidly quenching from the melt
to below Tg, whereas slow cooling the melt will allow crystallinity to develop in the sample (melt
crystallisation) [5]. The crystalline form can also be obtained on heating the glass through the Tg (cold
crystallisation) or by holding the polymer at a constant temperature between Tg and Mp(°C) for a
given length of time (isothermal crystallisation) [3, 4].
As crystallisation and melting are thermodynamically driven, in order for phase transformations to
take place there must be a favourable change of the energy in a system [14, 15]. On crystallisation
when cooling from the melt in order to accommodate the change in temperature it is favourable for
the disordered amorphous state of high molecular mobility to arrange into a much more ordered state
of lower energy, resulting in a large negative energy contribution (i.e. the crystallisation exotherm)
[12, 14]. On reheating this crystalline structure into the melt an increase in the energy of the system
no longer favours ordered structures and the absorption of energy results in melting of the crystals and
mobilisation of the amorphous phase (i.e. the melting endotherm) [12, 14].

4
Polymer crystallisation can be broken down into a series of events. Initially the nucleation barrier
must be overcome, where intramolecular forces order chains to form a stable nucleus. Growth of the
crystalline region then occurs as additional chains are aligned at the growing crystal face and long
range order is seen as a regular three-dimensional structure is developed [12, 14]. Growing crystals
may then impinge on neighbouring crystals and should conditions permit, rearrangements within the
crystalline structure can be seen known as crystal perfection [14].
However due to the complex nature of crystallisation, in practical situations nucleation and growth
occur at different points and may proceed at different rates giving a distribution in the size and
perfection of crystallites. As shown in Figure 1.2 crystallisation rate is highly dependent on
temperature and is restricted to a range of temperatures between the Tg and Tm of the polymer.
Figure 1.2. Dependence of crystallisation rate on temperature. [15]

5
At temperatures above Tm there is a great deal of energy in the system and the segmental motion of
the polymer chains is too great for stable nuclei to form and for crystalline growth to occur [12,15].
However as the temperature is reduced below Tm there is an increase in melt viscosity and therefore
an increased opportunity for nucleation to occur, growing a microstructure of few but very large
crystals. As the temperature is further reduced and viscosity increases the rate of crystallisation passes
through a maximum where conditions favour both nucleation and growth of crystallites [12].
On approaching Tg there is much less energy in the system and the molecular motion of the polymer
chains is greatly reduced. In such a viscous state there is a much lower nucleation barrier opposing the
formation of stable nuclei, however due to low molecular mobility transport of the chains to the
crystal growth front is hindered [15]. This gives a microstructure with a greater number of crystallites
but considerably smaller in size. Below Tg the polymer chains are in effect ‘frozen’ in position and no
further crystallisation can take place [16, 17].
1.3 The Crystalline Morphology of PEEK
The first work investigating the morphology of PEEK was done by Blundell and Osborn [5] who
noted that in their system the maximum rate of crystallisation occurred around 230°C as shown in
Figure 1.3. However this is subject to the molecular weight of the polymer which determines factors
such as the onset of crystallisation and crystallisation rates [13]. The upper, melt crystallised, data
points were obtained by melting the polymer at 400°C for 2 minutes to erase any previous thermal
history and then rapidly cooling to the crystallisation temperature (Tc) for a crystallisation time (tc)
and recording the peak time of the crystallisation process. The lower, cold crystallised, data points
were obtained by quenching the polymer in liquid nitrogen directly from the melt to form an
amorphous glassy state before rapidly heating to Tc for tc and again recording the peak crystallisation
time.

6
On scanning samples that had been isothermally crystallised at a range of different temperatures an
interesting phenomenon was observed, known as double melting. When reheating the samples to the
melt a trace was produced with a first low temperature melting peak (or endotherm) that appeared
~10ºC above the original isothermal crystallisation temperature and a second high temperature
endotherm, much larger in magnitude. The second, upper melting peak was found to occur ~335ºC
regardless of isothermal temperature (being slightly higher for samples crystallised at a higher Tc).
1.3.1. Origin of Double Melting: Melting and Recrystallisation
Due to the similarity of PEEK’s main thermal transitions with those of poly(ethylene terephthalate)
(PET), Blundell and Osborn [5] drew upon the well documented behaviour of PET when considering
PEEK’s crystalline morphology. In particular the double melting traces seen for PEEK were
comparable to those produced by Holdsworth and Turner-Jones [18] who cold crystallised PET at
Figure 1.3. Variation in peak crystallisation times for samples isothermally crystallised at different temperatures. [5]

7
various temperatures and times before cooling and rescanning. The phenomenon of double melting
seen in PEEK by Blundell and Osborn was described as the effect of a continuous melting and
recrystallisation process that takes place during the scan [5, 18].
The DSC heating scan of amorphous PET first shows a large and broad exothermic crystallisation
peak, indicating that a range of crystalline entities with a varying degree of crystal perfection are
formed. Between this exothermic peak and the endothermic melting peak there is a wide intermediate
temperature range, in which there is no detectable change in the DSC baseline. However it was
reported that on several samples the area under the melting peak was 20-30% greater than that of the
crystallisation peak [18]. With support from x-ray data they proposed that the increase in crystallinity
is due to an increase in the average perfection of the crystallites, developed over the intermediate
temperature range.
During a DSC heating scan the temperature is continuously increasing. It is postulated that for a given
temperature over the intermediate range the least perfect crystals at that time will experience melting
and will recrystallise to form more perfect crystals later in the scan. At that same time previously less
perfect crystals that have already melted, will undergo recrystallisation to form more perfect crystals.
More perfect, stable crystals will not experience melting or recrystallisation until a high enough
temperature is reached. There is no net movement of heat and therefore no detectable change in the
DSC baseline, despite an overall increase in the average perfection of the crystal population. The
broad endothermic melting peak represents the point where the temperature is too high for
recrystallisation of melting crystals, with a distribution of size and perfection [5, 18].
Both Holdsworth and Turner-Jones along with Blundell and Osborn propose that the double melting
seen on DSC traces is not representative of the polymer morphology present at room temperature
before scanning. They argue that it is the first, low temperature endotherm which is to be associated
with the crystals formed during the thermal treatment, whereas the second, upper endotherm is a
characteristic of the polymer system and due to the melting and recrystallisation process [5, 6, 18].
This is in concurrence with their results and explains why the first peak is found to be slightly above

8
the treatment temperature and also why the second peaks are found at a much more definite
temperature.
If the DSC heating scan is stopped and the system is cooled at a point along the intermediate
temperature range, then the continuous melting and recrystallisation procedure will be suspended.
This will leave a population of crystals that have previously melted and recrystallised to form more
perfect crystals, with a higher melting temperature. On rescanning these crystals melt at a slightly
higher temperature than the treatment temperature, producing the first endotherm before the
equilibrium between continuous melting and recrystallisation processes is re-established [18]. As the
treatment temperature increases and approaches the melting point of the polymer, the recrystallisation
of melted crystals will be prevented and the process will be reduced until only a single peak is
observed representing the original thermal treatment.
It is made clear that the melting and recrystallisation process may only occur in a small portion of the
crystallites and that the whole of the crystal does not necessarily have to melt before recrystallisation
can take place [18]. A distinction is also made between the upper melting peak, where the melting
process passes through a maximum (~335°C), and the thermodynamic melting point for an infinitely
large crystal which is estimated to be 395°C for PEEK [5].
1.3.2 Origin of Double Melting: Primary and Secondary Crystallisation
However the theory that continuous melting and recrystallisation produced the double melting
endotherms in heat treated PEEK became an area of discontent in the literature. Other authors at the
time argued that the double melting peaks were representative of two crystal morphologies formed at
different times during the thermal treatment [3, 4, 7, 8]. They do not support the idea that all the
crystals formed at the treatment temperature are represented by the first endothermic peak and that the
second upper peak is purely associated with melting and reorganisation of these crystals. It is argued
that the area under the first peak is too small to account for the melting of the whole crystalline
9
fraction formed at a given treatment temperature [3, 4]. Instead they hypothesised that for a given
treatment temperature imperfect, unstable crystals may form between existing lamellae and then melt
when heated above this formation temperature, resulting in the lower and upper endotherms.
In particular work done by Bassett et al. [7] using permanganic etching led the authors to argue that
double melting is due to the morphological sitting of two distinct components of crystallinity formed
during separate stages of crystallisation. They propose that the upper melting peak is representative of
a framework of primary lamellae which form in an unrestricted environment to occupy the available
space but not to fill it. The material represented by the lower melting peak then forms in less available
space and a more restricted environment between these primary lamellae. The orientations and
conformations may be predetermined to some degree by molecules along the chain which may
already be entangled in the first lamellae, reducing the stability of these secondary crystals [7]. Thus,
on annealing at increasingly higher temperatures these less stable crystals melt and recrystallise with
an increasingly higher lamellae thickness which will now melt slightly above the annealing
temperature. Also on isothermally crystallising for longer periods of time they are able to develop
more fully, giving rise to the increasing prominence of the lower temperature, secondary peak with
annealing time.
The authors in support of two separate crystal morphologies being the cause of double melting do not
dispute the possibility of modest reorganisation of crystallites on slow heating. It is the origin of the
upper melting peak that is felt to originate from a primary crystal population present at room
temperature, as opposed to coming from a complete reorganisation of the lower temperature
endotherm.
The work presented herein supports the hypothesis of a dual lamellae morphology, with the formation
of a secondary population of crystallites between the initially formed primary crystals on holding for
prolonged periods of time at a given isothermal temperature. The secondary crystallites which form
between the primary population are represented by the lower and upper endotherms respectively. It is
felt that the heat of fusion on melting, as measured from the low temperature endotherm, is too small

10
to account for the total degree of crystallinity developed on crystallisation at a given isothermal
temperature. However it is important to note this work does not dispute the fact that when using slow
scanning rates melting and recrystallisation can be observed [Appendix I & II].

11
1.4 Nature of The Glass Transition, Physical Ageing and Enthalpic Relaxation
1.4.1 The Glass Transition
The glass transition temperature (Tg) refers to the dynamic transformation of a non-crystalline solid
from a liquid to a glassy state or vice versa and in particular describes this change of state for the
amorphous phase of a polymer (whether semi-crystalline or not). On cooling through Tg the glass is
no longer able to remain in a state of structural equilibrium within a finite time scale and thus falls
into a metastable state [16, 17]. Such a structure becomes ‘frozen in’ as on cooling at a given rate
from equilibrium above the Tg, the packing of amorphous molecular chains needed to accommodate
the change in temperature is made impossible by the time-scale imposed by the rate of cooling. It
therefore follows that a faster cooling rate would cause the system to deviate further from the
equilibrium and if stored at sufficiently low temperatures below Tg it would effectively remain in this
state with excess thermodynamic quantities such as volume and enthalpy for an infinite length of time
[19, 20, 21].
However if the polymer is held at temperatures approaching Tg the glass undergoes relaxation
towards its thermodynamic equilibrium with a reduction of excess volume and enthalpy, although
there is only a small temperature range in which such relaxation can be realistically observed. As the
ageing temperature (Ta) (i.e. the temperature the glass is held below Tg) increases, the length of time
it takes for the system to approach equilibrium is vastly increased and it is often not possible to reach
equilibrium further than 15°C below the Tg of a polymer [19]. It is common for ageing experiments to
take place at reasonably small undercoolings from the measured Tg, so that experimental results can
be obtained in an acceptable time frame.
1.4.2 Physical Ageing
The term physical ageing is used to describe the volume relaxation and enthalpy relaxation which
occurs as the glass approaches a more stable state of equilibrium and causes a change in the
mechanical properties of the polymer. It is important to note that physical ageing refers to reversible

12
changes in polymer properties, unlike chemical ageing which is associated with processes such as
degradation or breakage of bonds [20].
When stored at temperatures approaching but below Tg for a given time, physical ageing has been
shown to affect the mechanical properties of polymers. Yield stress has been shown to increase with
ageing time, indicating that more mechanical work is needed to deform the specimen to recover the
degree of enthalpy lost on ageing [22]. Although increases in yield stress are seen with ageing, a
marked decrease in impact strength has also been shown, indicating that the material becomes much
more brittle [22]. Similar increases in tensile yield stress, with more localised yielding, along with a
decrease in impact strength have been shown to occur on ageing amorphous PEEK samples [23]. Due
to the influence of physical ageing on the mechanical properties of polymers it important to
understand the mechanisms behind ageing, this can be done experimentally using techniques to
investigate manifestations of ageing such as enthalpic relaxation.
1.4.3 Enthalpic Relaxation
Although dilatometry can be used to measure the volume relaxation associated with physical ageing,
calorimetric studies are considerably more common and in particular differential scanning calorimetry
can be used to determine enthalpic relaxation on ageing. As DSC is the technique adopted in this
work the discussion shall focus solely on enthalpy relaxation and although it is analogous to volume
relaxation as determined by dilatometry, differences between the two techniques must be stressed
[19]. The concept of enthalpic relaxation on ageing and its subsequent recovery as an endothermic
peak on a DSC trace is best represented schematically, Figure 1.4.

13
On cooling from the liquid state to the glass the amorphous material can be seen to deviate from the
equilibrium line at Tg and proceed to point A in Figure 1.4.a. On ageing the system at temperature Ta
there is a driving force towards the thermodynamic equilibrium H ∞ and a corresponding reduction in
enthalpy. If the system is then aged for time, t, it will have been reduced to the value Ht at point B.
The loss in enthalpy between point A and B, or enthalpic relaxation, is then recovered as an
endothermic peak on the DSC traces between Ta and To as seen in Figure 1.4.b. Trace B is taken first
and is that of the aged sample (from point B), as seen by the much more pronounced enthalpic peak
on Tg. Trace A is recorded by rescanning the sample for zero ageing time (from point A) as on
heating trace B above Tg to To equilibrium is restored and the previous enthalpic relaxation is erased.
Figure 1.4. a) Enthalpy as a function of temperature. On cooling at a constant rate from equilibrium at To, state A is obtained; after ageing at Ta for time t the system reaches state B with an enthalpy relaxation of Ht as it moves
towards the enthalpy equilibrium H∞. b) Specific heat as a function of temperature. Trace B is recorded first and shows the enthalpy recovered on heating through Tg before the sample is cooled at the same rate back to A and
scanned for zero ageing time. [19]

14
This gives two traces which can then be superimposed so that the trace of the sample for zero ageing
time can be subtracted from that of the sample aged at temperature Ta for time ta. Integration of the
resultant area after subtraction must then be performed to determine the enthalpic relaxation, or
physical ageing of the sample, between points A and B [19, 20, 21]. If Ta is moved to increasingly
higher temperatures the rate at which the system is able to relax increases, although as can be seen
from Figure 1.4.a as it has deviated less from the equilibrium line the overall degree of relaxation
possible (H∞) will be reduced.

15
1.5 The Influence of Crystallinity on the Glass Transition and Enthalpic Relaxation
Although Tg and enthalpic relaxation are associated with the amorphous phase of the polymer, in
semi-crystalline structures the crystalline phase (which is already in a state of equilibrium as it is
cooled through Tg) has been shown to influence the nature of the glass transition and also the degree
of enthalpic relaxation on physical ageing. Therefore the traditional two-phase model of semi-
crystalline polymers consisting only of a crystalline and an amorphous fraction could no longer be
used to describe this effect. It became evident that molecular interactions at the crystal/amorphous
interface could be used to describe such effects and consequently work was done to investigate the
morphology of this intermediate region.
A new model for semi-crystalline polymers was first introduced in a series of papers by Struik [24 –
27] whereby crystals disturb the amorphous phase and reduce their segmental mobility, giving the
amorphous phase a Tg distribution. Amorphous regions adjacent to the crystal surface will experience
the greatest degree of restriction, with the effect reducing as you progress through the interface and
reach the amorphous phase unrestricted by crystallites and with properties equal to those of the bulk
amorphous material [24, 25].
A similar interpretation of the crystal/amorphous interface led to the development of a three-phase
model consisting of the crystalline phase, a rigid amorphous fraction (RAF) and a mobile amorphous
fraction (MAF) [28, 29, 30]. Due to the highly entangled nature of polymer systems, on crystallisation
and cooling below Tg amorphous layers which are unable to crystallise themselves become entwined
with crystalline regions and are constrained in loops and chains connected to the crystal surface [30].
This is described as the RAF [Figure 1.5], however the physical tethering of amorphous chains
progressively decreases as you move away from the crystal surface, giving the amorphous fraction an
increasingly greater degree of mobility. The MAF relates to the unconstrained bulk amorphous phase,
which exhibits the sharp liquid to glass transition at Tg as described earlier [30]. For clarity, this work
shall refer to restrictions at the crystal/amorphous interface and the bulk amorphous regions as the
constrained amorphous region and the free amorphous region respectively.

16
This constraint at the crystal/amorphous interface has been shown to have a marked effect on the Tg
of a semi-crystalline polymer when compared to that of its fully amorphous counterpart [31]. As
crystallinity is introduced the position of Tg is shifted upwards, and also due to the progressive
increase in mobility of the constrained amorphous regions with an increase in temperature the breadth
of the transition is considerably increased [31, 32, 33]. The size of the step change at Tg (ΔCp) is also
reduced due to segmental constraints of the amorphous regions, as there is a decrease in the number of
main chain rotational modes which are able to activate at the transition [31, 32].
The introduction of crystallinity into a polymer system not only increases the breadth and measured
position of the glass transition temperature, but has also been shown to reduce the overall degree of
physical ageing. For example the enthalpic relaxation of semi-crystalline poly(ethylene terephthalate)
(PET) was found to be considerably lower than that of its fully amorphous counterpart for an equal Ta
and ta [34]. Although a reduction in enthalpic relaxation may be expected due to a reduced amorphous
content, the ageing effects in semi-crystalline PET could not only be described using a two-phase
model and it became evident that crystallites reduced segmental mobility of the amorphous phase [34,
35]. Work on other semi-crystalline polymers including polypropylene (PP) [36] and PEEK [32] has
also shown that segmental mobility of the amorphous fraction is restricted at the crystal/amorphous
interface and consequently influences the physical ageing characteristics of the polymer.
Figure 1.5. Representation of the constrained amorphous region (RAF) in close proximity to the crystal lamellae in comparison to the free amorphous region (MAF) at distances further
from the interface. [adapted from 30]

17
Although work has been done investigating the effect of crystallinity on the glass transition
temperature and enthalpic relaxation characteristics separately, the two have not been studied in
parallel. As enthalpic relaxation is highly dependent on the degree of undercooling below Tg [19], any
influence of restriction at the crystal/amorphous interface on the glass transition will therefore have an
effect on ageing kinetics. In addition to this variations in crystalline morphology and the degree of
constrained amorphous regions will also contribute to the glass transition and enthalpic relaxation
characteristics, no such work has been done correlating these effects.

18
1.6 Scope of the Work
The purpose of this work is to investigate the effect of crystalline morphology on the glass transition
temperature and degree of enthalpic relaxation seen in poly(ether-ether-ketone). Due to the use of
PEEK as a high performance engineering thermoplastic, often at above ambient temperatures, how the
morphology of the polymer influences its response to physical ageing is of particular commercial
interest.
During the processing of PEEK using techniques such as compression or injection moulding, the
polymer is often quenched from the melt to temperatures below Tg leaving the amorphous phase in a
state far from equilibrium. As outlined above, if the service temperature approaches Tg this will cause
physical ageing and a change in material properties over time. If by altering the morphology you are
able to reduce the amount of physical ageing seen over a period of time at a given temperature this
would be of considerable benefit to the user.
The main focus of this work it to engineer two distinct crystal morphologies into the polymer by melt
crystallising and cold crystallising samples to produce a population of few but large, and many but
small crystallites respectively. It is important to note that the degree of crystallinity in the melt and
cold crystallised samples will be controlled, so that it will be the distribution of lamellae (i.e.
crystallite size) that will influence enthalpic relaxation as opposed to variations in the amount of
amorphous material present.
The originality of this work in particular is to compensate for the shift in Tg’s with change in
crystallite size. Therefore if the Tg is calculated for a given population of lamellae crystals by using
the same degree of undercooling (ΔT) the samples will be aged at a temperature tailored to the
individual morphology of the system as: Tg – ΔT = Ta.
This is essential because if the Tg shift is not accounted for, as is often the case, and Ta remains the
same you are essentially measuring the effect of altering ΔT. As described in section 1.4.3 the further
you age below Tg the slower the relaxation kinetics are, along with a greater possible degree of
enthalpic relaxation towards H∞, up to a point around 15°C below Tg where relaxation cannot be

19
measured on a finite time scale. By tailoring the ageing temperature to the system you are able to
avoid this problem and for samples of equal crystallinity, could therefore investigate how the
enthalpic relaxation is affected by the constraint of an identical amount of amorphous material
between different crystal morphologies.

20
Chapter 2 : Experimental
2.1 Materials
The material used in this study was poly(ether-ether-ketone), as supplied by Victrex in the form of a
semi-crystalline fine powder (450 PF) with the following material properties as given in
supplementary data sheets which can be found at victrex.com:
Table 2.1: Typical Values for selected properties of 450PF PEEK
Material Property Units 450PF
Tensile Strength (23°C) MPa 100
Tensile Modulus (23°C) GPa 3.7
Izod Impact Strength (Notched 23°C) kJm-2 6.5
Glass Transition (Onset) °C 143
Melting Point °C 343

21
2.2 Differential Scanning Calorimetry
Differential scanning calorimetry (DSC) is a technique whereby the temperature and power output to
a sample and reference cell are continuously monitored as they are simultaneously heated and cooled
(non-isothermal) or held (isothermal) at identical temperatures. Therefore any variation in temperature
that occurs between the sample and reference cell is due to a thermal transition in the polymer sample.
The differential technique is used to asses this heat flow and equalise the incident heat gains or losses
between the two cells by increasing or decreasing the power output to the sample cell as required [37,
38]. This change in output (mW) can be monitored in order to determine the heat flow into or out of
the system and plotted with respect to change in temperature for non-isothermal studies or change in
time for isothermal studies [14, 37, 38].
Figure 2.1. DSC trace of amorphous 450PF PEEK scanned from below Tg into the melt exhibiting a) Tg step b) crystallisation exotherm c) melting endotherm.
100 150 200 250 300 350 400
12
14
16
18
20
22
24
26
Heat
Flo
w En
do U
p (m
/W)
Temperature (ºC)
(a)
(c)
(b)
(mW
)

22
Figure 2.1 is a DSC trace obtained on scanning amorphous 450PF PEEK into the melt and shows the
thermal transitions in the order (a) glass transition, (b) crystallisation dip and (c) crystal melting peak
as the polymer is heated from below Tg into the melt. As the sample absorbs energy, in the case of Tg
or the melting of crystallites, there is an increase in heat flow to the sample needed to mobilise
molecular chains which can be described as an endothermic process. On the other hand as the liquid-
like phase moves to a state of lower entropy (crystallisation) there is an output of heat from the
polymer and a resulting decrease in the heat flow to the sample, known as an exothermic process.
Due to the sensitivity of a calorimeter, in order to obtain accurate results there are a number of factors
which must be taken into account to improve the reproducibility of conditions between samples. To
begin with the packing of the sample in the pan is important as this determines the degree of thermal
contact between the sample/pan and ultimately the contact with the sensor [39]. The amount of
sample used is also of importance and in order to maintain the sensitivity of the instrument only a
limited range of sample masses are appropriate. If the sample is too thick then a temperature gradient
may be set up and cause the comparatively cool upper surface, located further from the heating
element, to lag behind that of the hotter base [39, 40]. At increasingly higher scanning rates thermal
lag inherent to DSC has also been shown to broaden sample response so should be taken into account
[40]. Finally due to small sample sizes even the position of the pans inside the DSC cells should be
considered, locating them as centrally as possible to reduce any anomalous effects that may be
introduced by the slight temperature gradient (tenths of a degree) between the centre and outer edge of
the cell [39].
Care should not only be taken during the preparation of samples and running of the DSC but also on
the interpretation and analysis of the traces produced in order for results to be comparable, as
discussed in the following sections.

23
2.2.1 Measurements of Crystallinity
In order to calculate the degree of crystallinity of a semi-crystalline polymer sample the area under the
melting peak, or the heat of fusion (ΔHf), must first be measured. However due to the distribution of
lamellae and crystallite sizes within a polymer, melting may take place over a wide temperature range
making it difficult to determine the onset of crystal melting [41, 42, 43]. As shown in Figure 2.2,
drawing an arbitrary baseline under the melting peak thus becomes a very subjective operation and
any instrumental baseline slope or curvature may significantly alter the estimate of the shape or extent
of the baseline to be drawn [41].
Figure 2.2. Measurements of the crystallisation exotherm and melting endotherm using arbitrarily drawn baselines between T1-T2 and T3-T4 respectively. [44]

24
Methods have been proposed in order to overcome such difficulties whereby the baseline of an empty
pan could be subtracted from the sample trace [41, 42]. However such a procedure did not improve
data sets in this work so was not adopted. As shown in Appendix I measurements made on features of
the melting endotherm were consistent amongst themselves allowing for an accurate heat of fusion to
be determined.
The enthalpy of fusion (ΔHf) for the area measured under the melting peak must then be divided by
the theoretical enthalpy of fusion for fully crystalline PEEK (ΔHfc), taken to be 130 J/g [5] so the
degree of crystallinity (Xc) of the sample can be determined. Despite the importance of the
crystal/amorphous interface when interpreting polymer morphology, the two-phase model is adequate
when taking physical measurements such as the weight fraction of crystalline (x) and amorphous (1 –
x) material [5].
Xc (%) = ΔHf (J/g) (x100)
ΔHfc (J/g)
2.2.2 Measurements of Enthalpic Relaxation
To measure the degree of enthalpy lost on ageing and recovered as an endotherm on reheating through
the glass transition, the trace of the un-aged sample must be subtracted from that of the aged sample
and the resulting area integrated. As shown previously in Figure 1.4.b, in order to obtain accurate
results the glassy and liquid regimes of the two curves must superimpose before and after Tg
respectively, so that only the enthalpy recovered from ageing is measured.
Superposability can be achieved by re-scanning the sample for zero ageing time immediately after the
trace of the aged state has been recorded by heating to a temperature above Tg and cooling back to the
starting temperature at a constant rate [19, 20, 21]. This prevents the introduction of any anomalies

25
into the system from things such as temperature/calibration drift, location of the sample in the cell,
variations in baseline or differences between samples [39]. In order to eliminate any effects of thermal
inertia it is also common practice to cool the sample from the ageing temperature down to some lower
temperature and begin the scan from there [20]. Due to the use of finite heating rates and the
increasingly long time scales needed for relaxation as you cool further below Tg to this lower
temperature, no further enthalpic relaxation is able to take place.
2.2.3 Determination of the Glass Transition Temperature
Due to the complex nature of the glass-transition and its dependence on things such as the rate at
which the polymer is cooled from equilibrium, additional restriction of molecular mobility from the
presence of crystallites and subsequent annealing, interpretation of the DSC trace can be difficult [45,
46, 47]. Therefore in order to determine a meaningful and accurate measure of Tg it is important to
carefully control experimental conditions such as the heating and cooling rate, especially as the
transition is strongly rate dependent and the DSC is a dynamic instrument [45].
As shown in Figure 2.3.a. an accurate value of Tg can be measured at the mid-point of the sigmoidal
change in heat capacity where lines from the glass and liquid phases which lie outside the transition
region can be extrapolated to intersect. The method adopted when defining a glass-transition
temperature on heating from the glassy to the liquid phase in this work is shown in Figure 2.3.b.
where the midpoint of the glass-liquid transition is calculated using Pyris software. As measurements
were not taken on samples with an endothermic relaxation peak on Tg [45], and were instead taken on
the corresponding trace for zero-ageing time, this method is accurate.

26
Figure 2.3.a. Determination of Tg at the interception of lines extrapolated from the liquid and glassy states. [adapted from 47]
glassy
liquid
Tg
120 140 160 180 200
23.5
24.0
24.5
25.0
25.5
26.0
Heat
Flo
w En
do U
p (m
W)
Temperature (ºC)
Figure 2.3.b. Method of calculating Tg as used in this work.

27
2.3 Sample Preparation and Standard Conditioning
In this study a power compensated Perkin-Elmer DSC7 was used and interfaced to a computer for
data acquisition and analysis using Pyris and Origin software. A sample mass of 5.25 mg (±) 0.05mg
was used to ensure good coverage over the base of the Al sample pan for improved sample/pan
contact yet remain thin enough to prevent the establishment of any significant thermal gradient. The
sample was encapsulated in the pan in order to prevent spillage of the powder and also to give a
constant emissivity between samples by reducing any possible heat loss that may occur at high
temperatures for un-lidded pans [39].The DSC was routinely calibrated between two points using
ultra pure metals, for the lower temperature and heat of fusion indium was used (onset: 156.6°C &
ΔHf: 28.45 J/g) and for the upper temperature, zinc (onset: 419.5°C).
In order to remove any previous thermal history introduced into the system during processing the
PEEK samples were heated to 400°C and held there for 2 minutes prior to conditioning, fully melting
the polymer and giving excellent thermal contact between the sample and pan. This would also act to
remove any remaining crystallites which may act as nucleation seeds during subsequent thermal
treatments as this is above the thermodynamic melting point (Tm) of an infinitely large crystal at
395°C [5].
On conditioning samples it was important to engineer into the polymer a sufficient degree of
crystallinity in order to prevent any additional crystallisation on cooling for melt crystallised samples,
or on reheating for cold crystallised samples. Therefore when conducting ageing experiments you can
be sure that you are investigating the intended morphology and degree of crystallinity engineered into
the polymer during sample conditioning, as no additional crystallites would be introduced. For an
illustration of the formation of additional crystallinity developed when scanning between Tg and Tm
refer to Appendix II.
During melt crystallisation in the DSC, samples were rapidly cooled from 400°C to the isothermal
crystallisation temperature (Tc) at a rate of 160°C/min. This was to ensure that no crystallinity could
be introduced prior to reaching the isothermal temperature and that the population of crystals would

28
be representative solely of those formed at Tc over the crystallisation time (tc). The semi-crystalline
samples were then cooled from Tc at a constant rate of 40°C/min through Tg to 80°C, where no
further morphological changes are able to take place over a finite time scale. Due to the formation of
an adequate degree of crystallinity and using a cooling rate of 40°C/min no additional crystallinity
formed on cooling between Tc and Tg.
In order to cold crystallise samples in the DSC, amorphous PEEK was first obtained by quenching
samples from 400°C directly into liquid nitrogen. The amorphous samples were then rapidly heated
from 80°C to Tc at 160°C/min and isothermally crystallised for tc. The samples were then cooled back
from Tc through Tg to 80°C at the constant rate of 40°C/min. After physical ageing was conducted on
the samples due to an adequate degree of crystallinity and a heating rate of 40°C/min no further
crystallinity was introduced on re-scanning between Tg and Tm.
As described earlier, in order to measure the enthalpic relaxation there must be superposability
between the aged an un-aged sample traces. Once the desired degree of crystallinity and morphology
had been engineered into the samples they were cooled to 80°C at 40°C/min, this is the starting
temperature from which samples would be heated to the ageing temperature, Ta, at 40°C/min. The
samples were then aged for time, ta, and cooled back to 80°C at 40°C/min. The first scan to measure
the size of the enthalpy peak developed on ageing was made from 80°C – 200°C – 80°C at 40°C/min
and the trace stored. Immediately after scanning for the enthalpic peak, the trace for zero ageing time
was recorded using the same thermal programme allowing the traces to be subtracted and the
enthalpic relaxation to be calculated. So that the precise degree of crystallinity for a specific sample
could be calculated the system was scanned to the melt, 80 – 400°C at 40°C/min, allowing the
enthalpy of fusion on melting to be measured. As shown in Appendix I, a scanning rate of 40°C was
used as it was found to be in an optimum temperature range that was slow enough to prevent
significant thermal lag yet fast enough to prevent large scale reorganisation on heating and cooling.

29
It is important to note the above discussion provides an overview of the general sample conditioning
for melt crystallisation, cold crystallisation, ageing and measurement of enthalpic relaxation. Due to
the individual experimental nature of investigations conducted in this work, aspects of the
methodology described above have been adapted accordingly. For clarity experimental specific
sample conditioning sections are detailed prior to the discussion of results in each of the following
sections, 3.1, 3.2, 3.3, 3.4, 3.5.

30
Chapter 3 : Results and Discussion
3.1 Influence of Cooling Rate on Enthalpic Relaxation in Amorphous PEEK
It is known that the rate at which you cool through Tg has a considerable effect on the resulting ageing
kinetics as the point at which the amorphous polymer falls out from a state of equilibrium above the
glass transition temperature is determined by the cooling rate imposed on the system [19, 48]. A faster
cooling rate gives less time for the molecular chains to accommodate the change in temperature. This
causes the system to deviate further from equilibrium at a higher temperature and thus gives the
system a greater degree of excess enthalpy to be recovered on ageing as it tends towards equilibrium
[48]. The following describes how such an effect was observed in amorphous PEEK.
3.1.1 Sample Conditioning
A series of amorphous PEEK samples were obtained by quenching directly into liquid nitrogen from
the melt, and were confirmed to be amorphous (or of equal low crystallinity < 2 %) by later scanning
on the DSC. They were heated from 80 – 160°C at a controlled rate of 40°C/min and cooled back
through Tg at a specified rate of 5, 10, 20, 40, 80°C/min. All samples with specified cooling rates
were aged at 135°C (Ta) for 60 mins (ta). They were then heated between 80 – 160°C at 40°C/min and
cooled back between 160 – 80°C at their specified individual cooling rate to obtain the endothermic
peak and repeated for a trace of zero ageing time, to obtain the aged and un-aged traces respectively.
Heating up to 160°C was shown to be high enough above Tg in order to fully relax the amorphous
samples yet low enough to prevent the introduction of any crystallinity into the samples as shown on
finally scanning the samples into the melt in Figure 3.1.a.

31
100 150 200 250 300 350 400
12
14
16
18
20
22
24
26
28
30
Heat
Flo
w En
do U
p (m
W)
Temperature (ºC)
Cooled 5ºC Cooled 10ºC Cooled 20ºC Cooled 40ºC Cooled 80ºC Quenched
Figure 3.1.a. Melting traces of amorphous samples previously cooled through Tg at various rates. (Cooling Rate: °Cmin¯¹)
110 120 130 140 150 160 170
16
18
20
22
24
26
Heat
Flo
w En
do U
p (m
W)
Temperature (ºC)
Cooled 5ºC Cooled 10ºC Cooled 20ºC Cooled 40ºC Cooled 80ºC Quenched
Figure 3.1.b. Tg region on heating amorphous samples previously cooled through Tg at various rates. (Cooling Rate: °Cmin¯¹)

32
3.1.2 Results and Discussion
The effect of cooling rate on the size of the resulting enthalpic peak recovered on heating through Tg
can be seen clearly in Figure 3.1.b. As described earlier, the slower you cool from the equilibrium
liquid state through Tg into the non-equilibrium glassy state, the more time is available for the
molecular chains to accommodate this change in temperature [19, 48], resulting in them ultimately
having to relax less in order to reach H∞. However, it appears in Figure 3.1.b that there is a greater
enthalpic peak developing on Tg with slower cooling rates. This can be assigned to the fact that the
slower the sample is cooled, a longer time period is spent at temperatures in close proximity to the Tg
where rates of relaxation are highest. In effect the slow cooled samples are already being aged on
cooling when compared to the fast cooled samples which spend comparatively little time in the small
temperature range below Tg where physical ageing can take place [48].
However when subtracting the trace for zero ageing time from that of the aged trace for the same
sample, as they have both been cooled through Tg at an identical rate any ageing introduced on
cooling through Tg is negated. It is for this reason the two traces must superimpose perfectly so only
the enthalpic relaxation introduced on ageing is measured.
As shown in Figure 3.2 for a given ageing time much more relaxation is seen on ageing the fast
cooled samples as they are further from equilibrium and also have undergone less relaxation on
cooling. It is clear that during slow cooling the samples did not reach thermodynamic equilibrium as
further relaxation is seen on ageing. However because some relaxation has already occurred on
cooling as they continue to approach H∞ relaxation times increase, so less enthalpic relaxation is
developed on ageing for the same Ta and ta when compared to the fast cooled samples [48].
It is therefore important to control the cooling rate through Tg as this has been shown to affect the
subsequent degree of enthalpic relaxation on ageing [19]. This can be achieved by cooling at a
constant 40°C/min from a state of equilibrium for all samples prior to ageing experiments.

33
0 10 20 30 40 50 60 70 80 90
0.4
0.6
0.8
1.0
1.2
En
thal
pic R
elax
atio
n (J/
g)
Cooling Rate (ºC/min)
Figure 3.2. Enthalpic relaxation as a function of cooling rate for amorphous samples cooled through Tg at various rates and aged at 135°C for 60 mins.

34
3.2 Influence of Crystallinity on Enthalpic Relaxation
As discussed above the rate at which amorphous samples are cooled through the glass transition
region influences the overall degree of enthalpic relaxation, thereby controlling the cooling rate
through Tg this effect can be controlled for. Despite cooling rate having a significant influence on the
ageing kinetics of amorphous polymer, the introduction of crystallinity into a sample has been shown
to reduce the overall degree of enthalpic relaxation due to a reduction of amorphous fraction and a
restriction of chain mobility in the amorphous regions by crystallites [31, 49]. Therefore although
cooling rate is standardised it is not thought that such a profound effect will be seen for semi-
crystalline PEEK, which shall now be further investigated in this work.
3.2.1 Sample Conditioning
As a semi-crystalline polymer PEEK can be crystallised in a number of ways, as previously
introduced. In order to obtain samples of varying degrees of crystallinity one set of samples were non-
isothermally crystallised from the melt to room temperature at 10, 20, 40 and 60°C/min. They were
then rescanned up to 200°C and back to 80°C at 40°C/min to engineer a controlled cooling rate
through Tg into the samples.
A second set of samples was conditioned by isothermally crystallising samples at 300, 305, 310 and
315°C for 5, 10, 15 and 30 minutes respectively to give a controlled degree of crystallinity but varying
morphology, before cooling from Tc to below Tg at 40°C/min.
All samples were aged at 142°C for 180 and 3600 minutes before the enthalpic recovery and zero-
ageing traces were obtained and subtracted as outlined in the experimental. Sample crystallinity was
subsequently measured on scanning samples into the melt and measuring the heat of fusion.

35
3.2.2 Results and Discussion
For non-isothermally crystallised samples on cooling from the melt at various rates it can be seen in
Figure 3.3.a that slower cooling rates allow the onset of crystallisation to occur at higher temperatures
as there is more time for nucleation and growth of crystallites [15]. In addition to this isothermally
crystallised samples held at lower temperatures are able to crystallise at much higher rates due to
more favourable nucleation and growth conditions as shown by the increase in size of the exothermic
peak in Figure 3.3.b. Once the desired morphology had been engineered into the samples they were
aged at the same Ta for an equal ta.

36
200 220 240 260 280 300 320 340 360 380 400
-5
0
5
10
15
20
Heat
Flo
w En
do U
p (m
W)
Temperature (ºC)
10ºC/min 20ºC/min 40ºC/min 60ºC/min
Figure 3.3.a. Non-isothermal crystallisation traces for samples cooled from the melt at various rates.
0 5 10 15 20 25 3017
18
19
20
21
22
23
Heat
Flo
w En
do U
p (m
W)
Time (mins)
315ºC 310ºC 305ºC 300ºC
Figure 3.3.b. Isothermal crystallisation traces of samples held at a given Tc for various lengths of time.

37
Due to variations in enthalpic relaxation between non-isothermal and isothermally crystallised
samples and also variations between inter-sample data sets, for clarity only the samples with the upper
and lower degrees of crystallinity are displayed in Figure 3.4. Samples slow cooled from the melt at
10 and 20°C/min obtained a degree of crystallinity of 36 ± 0.5% and 35 ± 0.5% respectively, whereas
those isothermally crystallised at 300 and 315°C were controlled to 30.50 ± 0.5% crystallinity.
As expected with an increase in the degree of crystallinity the enthalpic relaxation observed at a given
ageing temperature and time is shown to decrease [31, 32, 34]. Figure 3.4 demonstrates that for an
equal Ta and ta the isothermally crystallised samples of a lower crystalline content are able to relax to
a greater extent than the non-isothermally crystallised samples with a higher degree of crystallinity.
This could easily be assigned to the reduction of amorphous fraction present in the isothermally
crystallised samples, however as it was difficult to establish significant trends across these data sets it
is likely that the system is not so simple. Despite controlling the degree of crystallinity for
isothermally crystallised samples, although they showed more ageing than samples of a higher
crystalline fraction, the inter-data sets were considerably scattered. This makes a meaningful
interpretation of the effect of lamellae size on relaxation more difficult, and suggests the
crystal/amorphous interface has a considerable influence on ageing characteristics [31].
Therefore the focus of this work now turns to investigating how the glass transition is influenced by
crystallinity, and more importantly crystalline morphology, so that a specific ageing temperature can
be tailored to an individual polymer system. As isothermal crystallisation allows a greater degree of
control over the size and number of crystallites developed, by altering Tc and tc, this method is
adopted in order to engineer a desired morphology into the sample.

38
100 10000.35
0.40
0.45
0.50
0.55
0.60
0.65
0.70
0.75
0.80
En
thal
pic R
elax
atio
n (J/
g)
log10 (t/min)
Non-iso 10ºC/minNon-iso 20ºC/minIso 300ºCIso 315ºC
Figure 3.4. Enthalpic relaxation as a function of log time for isothermally and non-isothermally crystallised samples with varying degrees of crystallinity. Non-isothermally crystallised at 10 and 20°C/min : 36 and 35 ± 0.5%
crystalline respectively. Isothermally crystallised at 300°C 5 mins and 315°C 30 mins: 30 ± 0.5% crystalline each.

39
3.3 Effect of Crystallinity on the Glass Transition
In Section 3.2 an increase in crystallinity has been shown to reduce the overall degree of enthalpic
relaxation. However it was difficult to establish any significant inter-data trends suggesting that the
selection of an ageing temperature should be considered more carefully with regards to sample
crystallinity and morphology. As the presence of crystallites has previously been shown to affect the
glass transition temperature by reducing segmental mobility of the amorphous phase [24, 25], it shall
now be further investigated in this work with regards to PEEK.
3.3.1 Sample Conditioning
In order to obtain samples of the same morphology with crystallites grown under identical isothermal
conditions, but with varying degrees of crystallinity, PEEK samples were quenched from the same
crystallisation temperature directly into liquid nitrogen after varying lengths of time. The
crystallisation temperature used was 312°C with the following isothermal times 0, 2, 4, 6, 10, 20, 30,
60 minutes. Samples were then scanned from 80 – 400°C at 40°C/min in order to measure Tg and
calculate degree of crystallinity. The crystallinity developed at the isothermal crystallisation
temperature over the varying crystallisation times was determined by subtracting the exothermic
crystallisation peak from the endothermic melting peak [Appendix II].
It is important to note that no further conditioning scans were performed on the samples prior to the
melting scan. This is due to the varying degrees of crystallinity present in the samples which would
cause greater amounts of relaxation in the amorphous samples on cooling through Tg, thus making the
accurate determination of Tg much more difficult. Although an exact cooling rate has not been
engineered into the samples, the rate at which they have been quenched through Tg has at least been
considered and controlled for as they were all processed and quenched through Tg under identical
conditions.

40
3.3.2 Results and Discussion
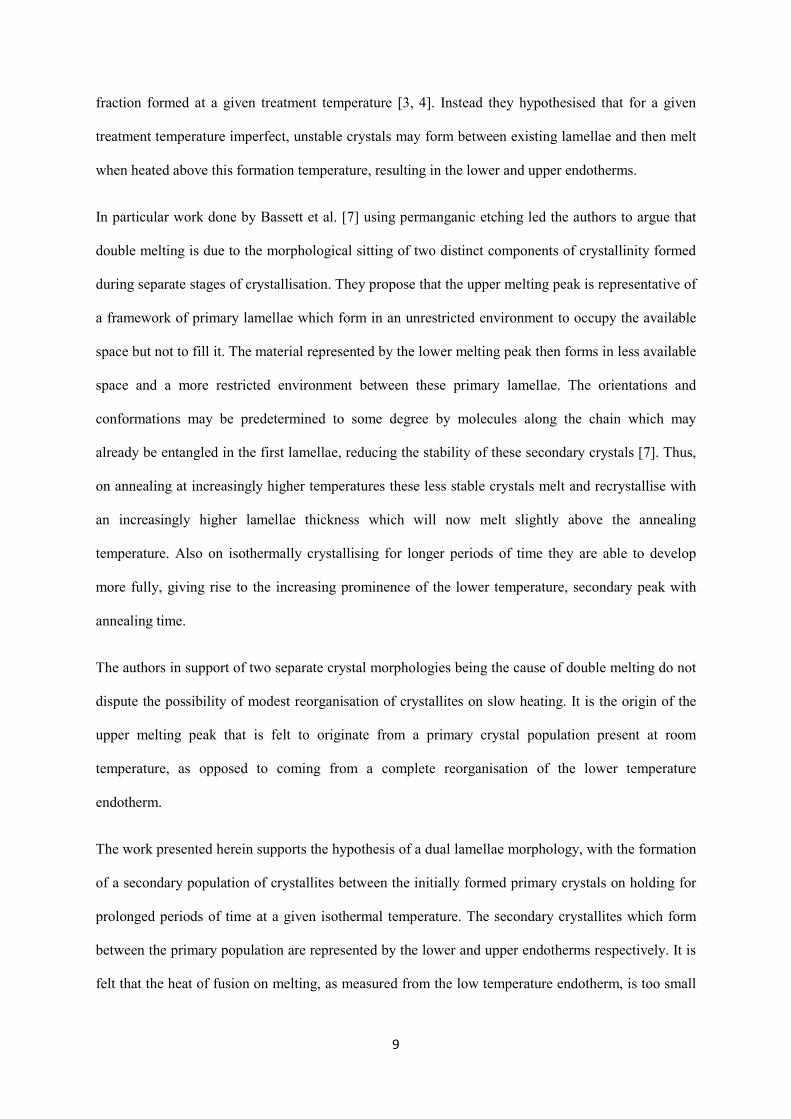
It can be seen in Figure 3.5 that as an increasing degree of crystallinity is developed over a longer
crystallisation time, the breadth of the glass transition is gradually increased. This is due to the effect
of crystallinity reducing the mobility of the amorphous phase, with the amorphous chains in closer
proximity to the crystal surface experiencing a greater degree of restriction [24, 25, 33]. Therefore
with an increasing degree of crystallinity more chains are constrained to a greater degree at the
crystal/ amorphous interface and require higher temperatures in order to mobilise, resulting in the
increased breadth of the transition.
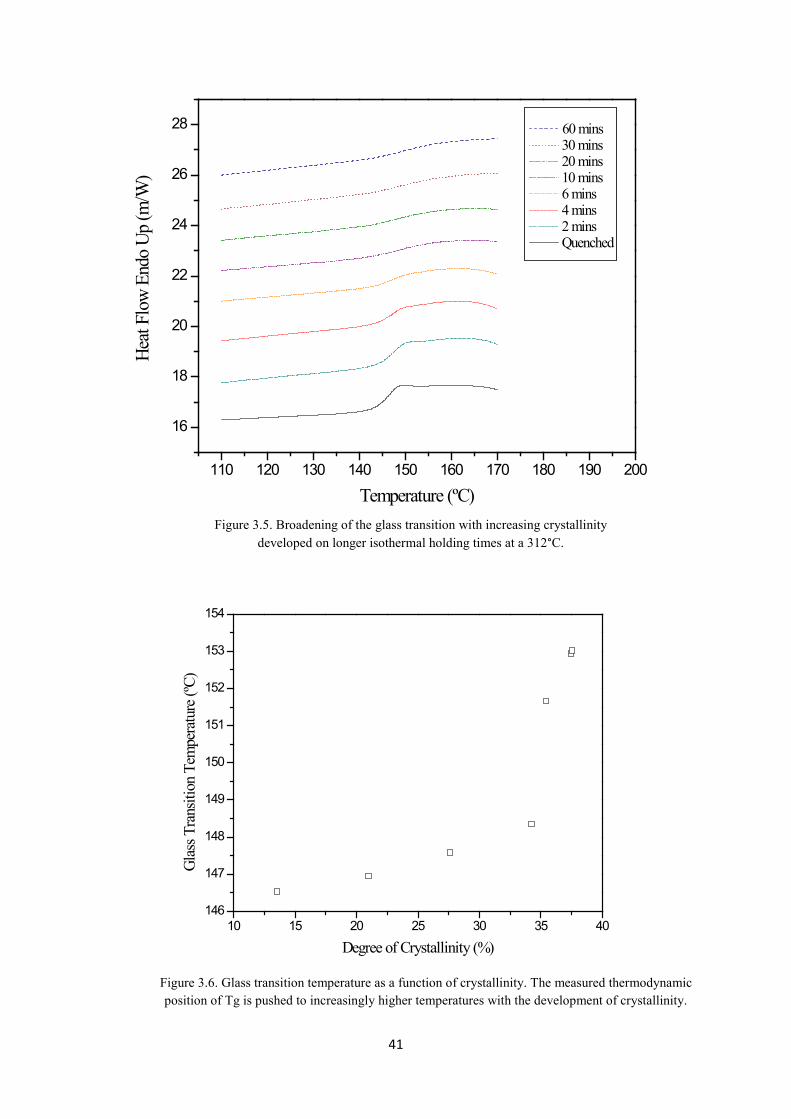
The effect of increasing crystallinity is also shown to push the measured thermodynamic glass
transition upwards as shown in Figure 3.6, again due to the higher temperatures required in order for
more constrained amorphous regions to mobilise. It is important to note that the samples were
isothermally crystallised at the same temperature and under the same conditions before they were
quenched after an individual tc. Therefore the crystallisation kinetics for nucleation and growth of the
crystallites is the same across the samples resulting in a standard morphology of the lamellae crystals.
It is only the degree of crystallinity developed that has been altered between samples and which has
subsequently influenced the glass transition.
41
110 120 130 140 150 160 170 180 190 200
16
18
20
22
24
26
28
Heat
Flo
w En
do U
p (m
/W)
Temperature (ºC)
60 mins 30 mins 20 mins 10 mins 6 mins 4 mins 2 mins Quenched
Figure 3.5. Broadening of the glass transition with increasing crystallinity developed on longer isothermal holding times at a 312°C.
10 15 20 25 30 35 40146
147
148
149
150
151
152
153
154
Glas
s Tra
nsiti
on T
empe
ratu
re (º
C)
Degree of Crystallinity (%)
Figure 3.6. Glass transition temperature as a function of crystallinity. The measured thermodynamic position of Tg is pushed to increasingly higher temperatures with the development of crystallinity.

42
3.4 Effect of Isothermal Crystallisation Temperature on the Glass Transition
As discussed above for samples isothermally crystallised at the same temperature for various times
the degree of crystallinity can have a significant effect on the breadth and measured position of the
glass transition temperature. Therefore in order to investigate the influence of crystalline morphology
on Tg, as determined by the isothermal crystallisation temperature, degree of crystallinity must be
kept constant across melt crystallised and cold crystallised samples.
3.4.1 Sample Conditioning
Figure 3.7.a and Figure 3.7.b show PEEK samples being cooled from the melt and heated from the
quenched amorphous state at 160°C/min respectively in order to determine a suitable Tc to use before
the onset of crystallisation. Melt crystallised samples were cooled from the melt to Tc at 160°C/min
and isothermally held for tc before cooling at 40°C/min to room temperature, no further crystallisation
was seen on cooling. Quenched amorphous samples were heated from 80°C to Tc at 160°C/min and
again isothermally held for tc before cooling back down at 40°C/min to room temperature. All
samples were then scanned to the melt at 40°C/min and the traces recorded in order to determine the
glass transition temperature and heat of fusion on melting. Individual isothermal crystallisation
temperatures and corresponding times used in order to allow a similar degree of crystallinity
(31 ± 1 %) to develop are detailed in Table 3.1.

43
Figure 3.7.b. Trace recorded on scanning a quenched amorphous sample from below Tg into the melt at 160°C/min. For use in determining appropriate isothermal temperatures for cold crystallisation.
100 150 200 250 300 350 400
20
30
40
50
60
70
Heat
Flo
w En
do U
p (m
W)
Temperature (ºC)
100 150 200 250 300 350 400
5
10
15
20
25
30
35
40
45
Heat
Flo
w En
do U
p (m
W)
Temperature (ºC)
Figure 3.7.a. Trace recorded on cooling from the melt to below Tg at 160°C/min. For use in determining appropriate isothermal temperatures for melt crystallisation.

44
Table 3.1. Isothermal crystallisation temperatures, times and corresponding glass transition temperature along with degree of crystallinities for cold and melt crystallised samples.
Cold Crystallised Samples Melt Crystallised Samples
Tc (°C) tc (min) Tg (°C) Xc (%) Tc (°C) tc (min) Tg (°C) Xc (%)
200.0 10 159.5 31.03 250.0 3 155.6 31.27 202.0 10 159.0 30.98 260.0 3 155.2 31.88 210.0 5 158.8 31.42 270.0 3 154.3 31.57 215.0 3 158.8 31.60 280.0 3 154.1 31.62
290.0 5 153.2 31.60 300.0 7 152.9 31.34 305.0 10 152.5 31.03 310.0 15 152.5 30.25 315.0 30 152.3 30.25 320.0 60 152.1 30.18

45
3.4.2 Results and Discussion
In order to obtain a population of crystals which are perfectly representative of a particular isothermal
crystallisation temperature it is important that nucleation has not begun prior to the sample reaching
Tc. However in practice this was very difficult to achieve, especially for cold crystallised samples,
despite the fast heating rate used. As shown in Figure 3.7.b there is a very limited temperature range
above the Tg and below the onset of crystallisation where a single population of crystals can be
developed. In addition to this further complications arise if you attempt to crystallise at temperatures
just above Tg. The development of the lower endotherm at temperatures slightly above Tc makes it
very difficult to extrapolate the liquid line needed to measure Tg, as the onset of crystal melting has
already begun before equilibrium is established. Therefore a number of cold crystallised and melt
crystallised samples had to be held at isothermal temperatures where the onset of crystallisation had
already begun.
However it is important to note that even for melt crystallised samples isothermally held above 290°C
where all the crystals are formed at Tc there is still a broad melting endotherm showing that a range of
crystallite sizes are present within the sample, a factor inherent to polymer morphology [12].
Although in some samples nucleation may have begun prior to reaching the isothermal temperature,
due to the time spent at Tc a sufficient degree of crystallinity is introduced for the measured Tg to be
taken as representative of a crystal population formed at that temperature. This is supported by the
development of an endotherm slightly above Tc which is indicative of crystal growth at a given
isothermal temperature, as shown in Figure 3.8 and previously discussed with regards to multiple
melting endotherms. When calculating the degree of crystallinity for the samples, the heat of fusion
for the small endotherm developed during secondary crystallisation at Tc was added to that of the
upper melting peak of the larger, primary crystals. It is not thought that the smaller endotherm can be
representative of the whole degree of crystallinity formed at Tc as suggested by the melting and
recrystallisation theory as it is too small. However, it is not disputed that on scanning some melting
and recrystallisation of the crystals may be seen at slow scanning rates [Appendix I].

46
100 150 200 250 300 350 400
20
22
24
26
28
30
32
34
36
38
40
42
44
Heat
Flo
w En
do U
p (m
W)
Temperature (ºC)
Melt Cryst 310C Melt Cryst 280C Cold Cryst 215C Cold Cryst 202C
Figure 3.8. A selection of traces for cold and melt crystallised samples scanned from below Tg into the melt. Note the development of a smaller endothermic peak at temperatures slightly above the individual Tc.

47
From Figure 3.9 it can be seen that for a controlled degree of crystallinity the isothermal
crystallisation temperature has a strong influence on the glass transition. Samples crystallised from the
melt at higher temperatures have increasingly larger, but fewer crystallites which corresponds to a
decrease in the glass transition temperature. As all samples have an equal degree of crystallinity, and
therefore an equal amorphous fraction, it follows that the larger crystallites are made up of fewer but
thicker lamellae [31, 49]. Due to the reduced number of lamellae there is a smaller surface area at the
crystal/amorphous interface. As there is less constraint of the amorphous fraction at the crystal
interface there is a greater free amorphous region which is able to mobilise at lower temperatures,
resulting in the lower glass transition temperature.
With decreasing Tc there is an increasing number of progressively smaller and thinner crystallites,
giving a greater area at the crystal/amorphous interface which leads to a greater degree of constrained
amorphous region and raises the Tg. The cold crystallised samples are formed in a viscous
environment of low molecular mobility making nucleation of crystallites easy but growth much more
difficult, giving rise to a population of many much smaller crystals. Again as the crystalline and
amorphous content is equal across the samples, the smaller crystallites will have a greater number of
thinner lamellae stacks and therefore a much greater crystal/amorphous interface [31, 49]. This greater
restricted amorphous fraction requires a higher temperature in order to mobilise and transform from
the glassy to liquid state giving the higher glass transition temperature. A modest decrease in Tg with
increasing cold crystallisation temperature has also been shown before in PEEK samples, again
assigned to a decrease in the constraint of amorphous chain segments by the crystallites [50].

48
190 200 210 220 230 240 250 260 270 280 290 300 310 320 330151
152
153
154
155
156
157
158
159
160
161
Glas
s Tra
nsiti
on T
emp
(ºC)
Isothermal Crystallisation Temp (ºC)
Melt Crystallised Cold Crystallised
Figure 3.9. The glass transition temperature as a function of isothermal crystallisation temperature for cold and melt crystallised samples.
49
3.5 Effect of Lamellae Thickness on Enthalpic Relaxation
Due to the effects of crystallinity and crystalline morphology on the glass transition temperature as
discussed in the preceding sections, when determining the temperature at which to age samples it is
essential to take such factors into account. Even if the degree of crystallinity is controlled the variation
in Tg with lamellae thickness must still be considered. If a standard temperature was set for all ageing
experiments this would result in an undercooling considerably closer to the Tg of some samples than
others. As physical ageing and enthalpic relaxation are highly dependent upon the temperature and
time the polymer is stored below Tg such a variation in proximity could produce misleading results
[19]. If for example a standard ageing temperature of 145°C was used this would be ~7°C below the
Tg of the upper melt crystallised samples but ~14°C below that of the cold crystallised samples
[Figure 3.9]. Therefore accelerated relaxation would be observed for the melt crystallised samples as
they would be driven towards equilibrium at faster rates when aged at temperatures approaching the
Tg, compared to little relaxation over the same ta in the cold crystallised samples where the ageing
temperature is much further from the Tg.
3.5.1 Sample Conditioning
The cold and melt crystallised samples were prepared in very much the same way as described in
Section 3.4.1 where they were heated or cooled to Tc and held for tc before cooling to room
temperature at 40°C/min. In order to control the sample crystallinity to 31± 1% the cold crystallised
samples were held at 202°C and 215°C for 10 and 3 minutes, while the samples isothermally
crystallised from the melt were held at 280°C and 310°C for 3 and 20 minutes respectively.
Samples were then aged at an undercooling of 10°C from their individually measured Tg’s for 180,
360, 900 and 4320 minutes before the trace of Tg with the endothermic recovery peak and that for
zero-ageing time were recorded and subtracted (example Fig. 3.10). In order to confirm the correct
degree of crystallinity had been engineered into each of the samples at their respective isothermal

50
crystallisation temperatures, they were scanned into the melt and the heat of fusion on melting from
the double endothermic peaks was recorded. The measured degree of crystallinity, along with Tg and
ageing temperature for cold crystallised and melt crystallised samples are detailed in Table 3.2.a and
3.2.b respectively.

51
Fig 3.10. To calculate degree of enthalpic relaxation, the trace for zero ageing time was subtracted from that of an aged sample.
aged sample
zero ageing time

52
Table 3.2.a. The individual glass transition temperatures (Tg), ageing temperatures (Ta) and degree of crystallinity (Xc) for different ageing times (ta) of cold crystallised samples.
Cold Crystallised 202°C 10 mins 215°C 3 mins
ta (mins) Tg (°C) Ta (°C) Xc (%) Tg (°C) Ta (°C) Xc (%)
180 158.8 149.0 30.87 158.5 148.5 30.52 360 159.1 149.0 31.01 158.7 148.5 30.59 900 159.2 149.0 30.74 158.5 148.5 31.36
4320 159.2 149.0 31.25 159.2 149.0 31.05
Table 3.2.b. The individual glass transition temperatures (Tg), ageing temperatures (Ta) and degree of crystallinity (Xc) for different ageing times (ta) of melt crystallised samples.
Melt Crystallised 280°C 3 mins 310°C 20 mins
ta (mins) Tg (°C) Ta (°C) Xc (%) Tg (°C) Ta (°C) Xc (%)
180 153.5 143.5 30.98 152.4 142.5 31.55 360 154.2 144.0 31.81 152.4 142.5 31.55 900 153.3 143.5 31.54 152.9 143.0 31.59
4320 154.1 144.0 31.82 153.0 143.0 31.57

53
3.5.2 Results and Discussion
In compensating for the shift in Tg with crystalline morphology and eliminating the influence of
degree of crystallinity on glass transition, it has been possible to directly investigate the effect of
lamellae thickness on physical ageing kinetics. The degree of enthalpic relaxation for 2 cold
crystallised and 2 melt crystallised samples, aged for varying lengths of time is shown in Figure 3.11.
In this work it has been shown that an increase in the degree of crystallinity along with a reduction in
the size of crystallites acts to raise the glass transition temperature of the polymer. This has been
credited to an increase in the area of the crystal/amorphous interfacial region giving a greater degree
of constrained amorphous fraction, which requires higher temperatures in order to mobilise. By taking
this into account and ageing at an equal undercooling of 10°C tailored to the Tg of the system, Figure
3.11 shows that cold crystallised samples undergo a greater degree of enthalpic relaxation for the
same degree of crystallinity over a given ageing time.
This may seem counterintuitive as the increased constrained amorphous fraction introduced by the
numerous, small lamellae has previously been shown to increase Tg due to a greater restriction of
amorphous material at the crystal/amorphous interface. However, a similar finding has been reported
in poly(phenylene sulfide) where the semi-crystalline polymer is again described using a three-phase
model [51]. It is proposed that an increased constrained amorphous phase actually helps to accelerate
the ageing kinetics when compared to the free amorphous phase. This is because the constrained
phase would consist of a greater number of tightly packed chain segments so can increase the rates of
relaxation as more segmental molecular relaxations would be able to contribute to the process [51,
52]. Even though the mobility of this tightly packed restricted amorphous phase may be lower, there
are more segments involved in the relaxation process than in the free amorphous phase, so are able to
contribute more effectively and ultimately accelerate the ageing process [52, 53].
Interestingly in semi-crystalline PEEK the constraint of the amorphous phase by crystallites has
previously been shown to increase the co-operativity of the relaxation process [32] and samples with
larger amounts of constrained amorphous fraction have been shown to relax more [54].

54
Despite the possibility of the increased constrained amorphous fraction in cold crystallised samples
causing the acceleration of enthalpic relaxation, it is important to remember that due to a higher Tg
they were also aged at a higher temperature. Therefore although there may be less free amorphous
material in the cold crystallised samples (as there is a greater degree of the constrained phase) this
would be aged at a higher temperature than the free amorphous phase of the melt crystallised samples
and may be the cause of the greater degrees of ageing seen.

55
100 1000
0.45
0.50
0.55
0.60
0.65
0.70
0.75
0.80
0.85
0.90
0.95
Enth
alpi
c Rel
axat
ion
(J/g)
log10 (t/min)
202ºC 215ºC 280ºC 310ºC
Figure 3.11. The degree of enthalpic relaxation against log time of cold crystallised and melt crystallised samples of an equal degree of crystallinity aged at an undercooling of 10°C below individual Tg’s.
56
It then becomes important to investigate the measured onset, end and breadth of the glass transition in
order to determine whether or not this can account for the increased relaxation observed. Average
values of samples isothermally crystallised at the specified temperatures and over the 4 ageing times
are given in Table 3.3.
In this work the glass transition temperature was taken to be the mid-point of the sigmoidal trace
where lines from the glass and liquid phase could be extrapolated to meet [45, 46, 47] with the ageing
temperature set at an undercooling of 10°C from this ‘thermodynamic’ Tg. However as shown in
Table 3.3 the onset of the glass transition for the melt crystallised samples is at a lower temperature
and the transition itself is much broader than that of the cold crystallised samples. Due to this
increased breadth the average onset for the upper melt crystallised sample [Tc 310°C] is found to be
~10°C below its thermodynamic Tg. As the ageing temperature was set at 10°C below the
thermodynamic Tg measurement, it has been aged very close to the onset of the glass transition when
compared to that of the cold crystallised sample [Tc 202°C] whose onset is ~7°C below its
thermodynamic Tg. Therefore you may expect a greater degree of enthalpic relaxation to be seen in
the melt crystallised samples, from unconstrained amorphous regions which are able to mobilise at
temperatures close to the Tg onset [19]. Although this may contribute initially (giving relaxation
values closer to those seen in cold crystallised samples over shorter ageing times), despite the cold
crystallised samples being aged further from their Tg onset, for the same ΔT of 10°C they continually
exhibit a greater degree of enthalpic relaxation. This supports the hypothesis that the additional
constrained amorphous phase in the cold crystallised samples is able to accelerate the ageing process
due to a greater degree of molecular packing.
Again due to the breadth of the transition, when looking at the Tg end, the value for the cold
crystallised sample [Tc 202°C] is only ~4°C above that of the melt crystallised sample [Tc 310°C] as
opposed to being ~10°C greater in the onset measurements. It is clear that the much more compact
and higher Tg values of the cold crystallised samples are due to the increased constraint of the
amorphous phase at the crystal/amorphous interface of the thinner and more numerous lamellae.

57
Iso Temp
(°C)
Thermodynamic
Tg (°C)
Tg Onset
(°C)
Tg End
(°C)
Tg Breadth
(°C)
Average Ageing
Temp (°C)
Xc (%)
202.0 159.1 152.6 164.7 12.1 149.0 30.97
215.0 158.7 152.4 164.8 12.4 148.6 30.88
280.0 153.8 144.9 161.4 16.5 143.8 31.54
310.0 152.7 142.8 160.1 17.3 142.8 31.57
Table 3.3. Average values of Tg measurements for isothermally crystallised samples.

58
For the same degree of crystallinity there is less crystal/amorphous interface for melt crystallised
samples with thicker lamellae which, although still act to constrain the amorphous region adjacent to
the crystal face, allow mobilisation of the constrained phase at a lower temperature. As there is less
constraint on polymer chains furthest from the crystal interface these are able to relax soon after the
free amorphous phase [24]. Those in close proximity to crystals are far more entangled, so extend the
Tg breadth. However as the Tg end is still below that for cold crystallised samples it suggests that
molecular motion at the interface is less restricted.
The increased restriction of the amorphous phase in cold crystallised samples can be attributed to the
development of crystallites in an increasingly restricted environment. As described by the nucleation
theory the mobility of polymer chains is closely related to temperature [12, 15]. At low temperatures
there is less molecular mobility, creating a highly entangled and viscous system. As there is less
mobility in the system growth of ordered structures becomes more difficult, so during crystallisation
polymer chains which are unable to crystallise may become increasingly entangled and tethered
across lamellae giving rise to a greater degree of constrained amorphous fraction [29, 30]. On
crystallising at higher temperatures the chains have a greater deal of molecular mobility so once
nucleation has begun they are able to transport to the ends of growing lamellae stacks and contribute
to the growing crystal interface with a lesser degree of entanglement.
It is this increased constraint of the amorphous phase in cold crystallised samples and its higher
degree of packing during crystallisation which on ageing allows the acceleration of enthalpic
relaxation. As these regions are more tightly packed it may be that the greater number of constrained
amorphous chain segments contribute to localised relaxations which has the effect of accelerating
physical ageing [51, 52]. Essentially because there are a greater number of possible molecular
relaxations in the more tightly packed amorphous fraction over a given area compared to the free
amorphous fraction, any segmental molecular mobility contributes a greater degree of enthalpic
relaxation and makes the relaxation process more effective.
59
3.6 General Discussion
In support of previous work it was demonstrated that the rate at which a sample is cooled from a state
of equilibrium to below Tg could influence the overall measured degree of enthalpic relaxation [19,
48]. In amorphous PEEK it was shown that for slower cooling rates it was possible to physically age
the polymer on cooling. Therefore in order to cool through Tg without physically ageing the polymer,
the amorphous fraction was reduced by introducing crystallinity and a constant cooling rate through
Tg of 40°C was engineered into the sample prior to ageing.
It was then shown that an increasing degree of crystallinity reduced the degree of enthalpic relaxation
for a given ageing temperature and time, as would be expected due to a reduced amorphous fraction.
However due to difficulties in determining a significant trend between individual isothermally
crystallised and non-isothermally crystallised data sets it was apparent that such an explanation is not
satisfactory, and that the ageing characteristics were influenced by interactions at the crystal/
amorphous interface [31, 34] . Due to the improved control offered by isothermal crystallisation when
engineering a desired degree of crystallinity and crystalline morphology into a sample this method
was subsequently adopted for conditioning.
A greater degree of crystallinity not only reduced enthalpy relaxation but was also shown to increase
the breadth and measured position of the glass transition due to an increased restriction of the
amorphous phase by the crystallites [32, 33]. This constraint of the amorphous fraction at the crystal
interface required greater temperatures in order for chain segments to mobilise and depending on their
proximity to the crystal face would introduce molecular motion at various temperatures, resulting in
the broader transitions seen [24, 25].
This effect of crystallinity on the glass transition was further investigated by isothermally crystallising
samples at high and low temperatures to develop a population of large but few, and small but
numerous crystallites respectively [31, 49]. As the overall degree of crystallinity was kept constant it
was therefore only the crystalline morphology affecting the transition region. It was found that cold
crystallised samples further increased the glass transition temperature, due to thinner lamellae
60
increasing the crystal/amorphous interfacial area and therefore increasing the degree of constrained
amorphous fraction. This can be assigned to the formation of crystallites in an environment of lower
molecular mobility where chains are unable to transport to the growing crystal front and therefore
become entangled and tethered to the crystal surface [29, 30].
As physical ageing is highly dependent upon the degree of undercooling from the glass transition it is
essential the effect of crystalline morphology on Tg was taken into account when specifying the
ageing temperature for a given polymer system [19]. Therefore samples of the same crystallinity, that
had been cooled through Tg at a controlled rate, were all physically aged at 10°C below their
measured thermodynamic glass transition temperature and the resulting enthalpic relaxation
calculated. It was found that for a constant ageing time the cold crystallised samples relaxed to a
greater degree, which initially seemed counterintuitive as the presence of a greater constrained
amorphous fraction had been shown to restrict mobility. However it is this additional degree of
constrained amorphous fraction which is thought to accelerate the physical ageing process [51, 52,
53].
As chains in this region are more tightly packed a greater number of chains are able to participate in
the relaxation process when aged at temperatures approaching Tg, so more effective localised
segmental mobility contributes to a greater degree of enthalpic relaxation [52]. This is because more
amorphous chains are seen per unit area in the constrained region than in the free amorphous region.
Although mobility is restricted at the crystal/amorphous interphase which acts to raise Tg, as the
ageing temperature is tailored to the Tg of the system, this effect of restriction is accounted for
regardless of crystallisation temperature. The degree of crystallinity and consequently the amount of
amorphous fraction present is also controlled between samples. Therefore as the cold crystallised
samples form a greater constrained amorphous fraction on crystallisation [54], when ageing at a
temperature where this restriction is accounted for, increased packing of amorphous regions at the
crystal/amorphous interface accelerates the rate of enthalpic relaxation.

61
Chapter 4 : Conclusions
• Slow cooling though Tg in amorphous PEEK introduces physical ageing
Slow cooling through the glass transition region physically ages amorphous PEEK samples as they
spend a greater period of time in close proximity to Tg than those cooled at a faster rate [19, 48]. On
subsequent ageing experiments the rate of enthalpic relaxation is reduced for slow cooled samples as
they have already begun to relax, and on further approaching H∞ the relaxation rate is continually
reduced [19].
• An increasing degree of crystallinity reduces enthalpic relaxation
Samples of higher crystalline content were shown to relax to a lesser extent than those with a lower
degree of crystallinity. This is due to a reduction in the degree of amorphous material present and also
due to an increasing constraint on the amorphous fraction by crystallites [31, 32, 34].
• An increasing degree of crystallinity raises the glass transition temperature
For a greater degree of crystallinity the breadth and position of the glass transition temperature was
shown to increase. Such an effect was caused by a reduction in mobility of the amorphous fraction at
the crystal/amorphous interface, with amorphous chains closer to the crystal surface experiencing a
greater degree of restriction [24, 25, 33].
• For an equal degree of crystallinity reducing the isothermal crystallisation temperature
acts to raise the glass transition temperature
When degree of crystallinity was controlled, it was found that cold crystallised samples had a higher
glass transition temperature. This is due to the formation of smaller crystals with more numerous
lamellae [31, 49] and a greater constraint of the amorphous fraction at the crystal/amorphous interface
[29, 30].

62
• For an equal degree of crystallinity, when ageing at a temperature which accounts for
the change in Tg with Tc, isothermally cold crystallised samples show a greater degree
of enthalpic relaxation
Due to the greater degree of constrained amorphous fraction, isothermally cold crystallised samples
were able to relax to a greater degree over a given ageing time than melt crystallised samples.
Although this constrained amorphous fraction had been shown to restrict mobility, due to more tightly
packed chain segments a greater number of segmental molecular relaxations are able to contribute to
the process and ultimately accelerate physical ageing [51, 52, 53].

63
Chapter 5 : Further Work
It is evident that further work is required in order to fully support the theory that for an equal
crystallinity, a given ageing time and a controlled undercooling from the measured thermodynamic
Tg, cold crystallised samples show more enthalpic relaxation due to a greater degree of constricted
amorphous phase. However, due to the inherent lengthy nature of physical ageing studies it was not
possible to conduct the full range of experiments desired.
For instance it would be interesting to find whether if left for long enough periods of time the cold
crystallised and melt crystallised samples would fully relax (i.e reach H∞) and show the same degree
of enthalpic recovery on reheating. It is predicted that although the melt crystallised samples may take
longer, as both samples have the same overall amorphous fraction eventually the enthalpy recovered
on ageing after fully relaxing the samples would be equal. If not it may be the case that the
constrained and free amorphous fractions may ultimately only be able to relax to certain degrees.
Such a finding would then require further work to probe the relative degrees of constrained and free
amorphous fractions present in PEEK samples. For example if aged for periods of time long enough
for samples to reach H∞ it may be the case that although it takes longer, the melt crystallised samples
are able to relax to a greater degree. This would suggest that although the constrained amorphous
phase initially accelerates ageing, due to the restrictions imposed by the crystalline regions it cannot
relax to the same degree as the free amorphous region.
Due to the variation in breadth of Tg with crystalline morphology it would also be interesting to
investigate how tailoring the ageing temperature to different Tg measurements affects the results. For
example measure the degree of undercooling from the onset of the transition, as opposed from the
thermodynamic Tg as in this work. By varying the undercooling from various Tg measurements, it
may be possible to determine whether the findings in this work are consistent. It may be seen that on
64
ageing at higher temperatures the results are accentuated as a greater degree of segmental mobility in
the constrained amorphous phase could further accelerate relaxation and contribute to a larger
enthalpic recovery peak.

65
References
1) Attwood, T.E., Dawson, P.C., Freeman, J.L., Hoy, L.R.J., Rose, J.B. & Staniland, P.A. (1981) Synthesis and properties of polyaryletherketones. Polymer, 22: 1096-1103.
2) Dawson, P.C. & Blundell, D.J. (1980) X-ray data for poly(aryl ether ketones). Polymer, 21: 577-578.
3) Cheng, S.Z.D, Cao, M.-Y. & Wunderlich, B. (1986) Glass Transition and melting behaviour of Poly(oxy-1,4-phenyleneoxy-1,4-phenylenecarbonyl-1,4-phenylene). Macromolecules, 19: 1868-1876.
4) Cebe, P. & Hong, S.-D. (1986) Crystallisation behaviour of poly(ether-ether-ketone). Polymer, 27: 1183-1192.
5) Blundell, D.J. & Osborn, B.N. (1983) The morphology of poly(aryl-ether-ether-ketone). Polymer, 24: 953-958.
6) Blundell, D.J. (1987) On the interpretation of multiple melting peaks in poly(ether ether ketone). Polymer, 28: 2248-2251.
7) Bassett, D.C., Olley, R.H. & Al Raheil, I. (1988) On crystallisation phenomena in PEEK. Polymer, 29: 1745-1752
8) Olley, R.H., Bassett, D.C. & Blundell, D.J. (1986) Permanganic etching of PEEK. Polymer, 27: 344-348.
9) Hay, J.H., Kemmish, D.J. (1988) Environmental stress crack resistance of and absorption of low-molecular weight penetrants by poly(aryl ether ether ketone). Polymer, 29: 613-618.
10) Barton, J.M., Goodwin, A.A., Hay, J.N. & Lloyd, J.R. (1991) Absorption of low-molecular-weight penetrants by poly(aryl ether ketone): 2. Bromoform. Polymer, 32 (2): 261-264.
11) Lee, W.I., Talbot, M.F., Springer, G.S., Berglund, L.A. (1987) Effects of cooling rate on the crystallinity and mechanical properties of thermoplastic composites. Journal of Reinforced Plastics and Composites, 6: 2-12.
12) Cowie, J.M.G. (1991) Polymers: chemistry and physics of modern materials. 2nd ed. London: Blackie Academic & Professional.

66
13) Day, M., Deslandes, Y., Roovers, J. & Suprunchuk (1991) Effect of molecular weight on the crystallization behaviour of poly(aryl ether ether ketone): a differential scanning calorimetry study. Polymer, 32 (7): 1258-1266.
14) Wunderlich, B. (2005) Thermal Analysis of Polymeric Materials. Berlin: Springer.
15) Di Loernzo, M.L. & Silvestre, C. (1999) Non-isothermal crystallisation of polymers. Progress in Polymer Science, 24: 917-950.
16) Gibbs, J.H. & Di Marzio, E. (1958) Nature of the glass transition and the glassy state. The Journal of Chemical Physics, 28 (3): 373-383.
17) Richardson, M.J. (1994) “The glass transition region”. In: Mathot, V.B.F. (ed.) Calorimetry and thermal analysis of polymers. Munich: Hanser Publishers. pp: 169-188.
18) Holdsworth, P.J., & Turner-Jones, A. (1970) The melting behaviour of heat crystallized poly(ethylene terephthalate). Polymer, 12: 195-208.
19) Hutchinson, J.M. (1995) Physical ageing of Polymers. Progress in Polymer Science, 20: 703-760.
20) Cowie, J.M.G & Ferguson, R. (1993) Physical ageing of poly(methyl methacrylate) from enthalpy relaxation measurements. Polymer, 34 (10): 2135-2141.
21) Brunacci, A., Cowie, J.M.G., Ferguson, R. & McEwenm I.J. (1997) Enthalpy relaxation in glassy polystyrenes: 1. Polymer, 38 (4): 865-870.
22) Aref-Azar, A., Biddlestone, F., Hay, J.N. & Haward, R.N. (1983) The effect of physical ageing on the properties of poly(ethylene terephthalate). Polymer, 24: 1245-1251.
23) Kemmish, D.J. & Hay, J.N. (1985) The effect of physical ageing on the properties of amorphous PEEK. Polymer, 26: 905-912.
24) Struik, L.C.E (1987) The mechanical and physical ageing of semicrystalline polymers: 1. Polymer, 28: 1521-1533
25) Struik, L.C.E (1987) The mechanical behaviour and physical ageing of semicrystalline polymers: 2. Polymer, 28: 1534-1542.
26) Struik, L.C.E (1989) Mechanical behaviour and physical ageing of semi-crystalline polymers: 3. Prediction of long term creep from short time tests. Polymer, 30: 799-814.
27) Struik, L.C.E (1989) Mechanical behaviour and physical ageing of semi-crystalline polymers: 4. Polymer, 30: 815-830.
28) Ivanov, D.A., Legras, R. & Jonas, A.M. (1999) Interdependencies between the evolution of amorphous and crystalline regions during isothermal cold crystallization of poly(ether-ether-ketone). Macromolecules, 32: 1582-1592.
29) Righetti, M.C. & Tombari, E. (2011) Crystalline, mobile amorphous and rigid amorphous fractions in poly(L-lactic acid) by TMDSC. Thermochimica Acta, Article In Press.

67
30) Ma, Q., Georgiev, G. & Cebe, P. (2011) Constrains in semicrystalline polymers: Using quasi-isothermal analysis to investigate the mechanisms of formation and loss of the rigig amorphous fraction. Polymer, Article In Press.
31) Hay, J.N. (1995) The physical ageing of amorphous and crystalline polymers. Pure & Applied Chemistry, 67 (11): 1855-1858.
32) Atkinson, J.R., Hay, J.N. & Jenkins, M.J. (2002) Enthalpic relaxation in semi-crystalline PEEK. Polymer, 43: 731-735.
33) Mano, J.F., Gomez Ribelles, J.L., Alves, N.M. & Salmeron Sanchez, M. (2005) Glass transition dynamics and structural relaxation of PLLA studied by DSC: Influence of crystallinity. Polymer, 46: 8258-8265.
34) Vigier, G. & Tatibouet, J. (1993) Physical ageing of amorphous and semicrystalline poly(ethylene terephtalate). Polymer, 34 (20): 4257-4266.
35) Zhao, J., Wang, J., Li, C. & Fan, Q. (2002) Study of the amorphous phase in semicrystalline poly(ethylene terephthalate) via physical ageing. Macromolecules, 35: 3097-3103.
36) Hutchinson, J.M. & Kriesten, U. (1994) Physical aging and enthalpy relaxation in polypropylene. Journal of Non-Crystalline Solids, 172-174: 592-596.
37) Hone, G.W.H. (1994) “Fundamentals of differential scanning calorimetry and differential thermal analysis”. In: Mathot, V.B.F. (ed.) Calorimetry and thermal analysis of polymers. Munich: Hanser Publishers. pp: 47-90.
38) Richardson, M.J. (1994) “DSC on polymers: Experimental conditions”. In: Mathot, V.B.F. (ed.) Calorimetry and thermal analysis of polymers. Munich: Hanser Publishers. pp: 91-104.
39) Richardson, M.J. (1997) Quantitative aspects of differential scanning calorimetry. Thermochimica Acta, 300: 15-28.
40) Hutchinson, J.M., Ruddy, M. & Wilson, M. R. (1988) Differential scanning calorimetry of polymer glasses: corrections for thermal lag. Polymer, 29: 152-159
41) Gray, A.P. (1970) Polymer crystallinity determinations by dsc. Thermochimica Acta, 1: 563-579.
42) Blundell, D.J., Beckett, D.R. & Wilcocks, P.H. (1981) Routine crystallinity measurements of polymers by d.s.c. Polymer, 22: 704-707.
43) Kong, Y. & Hay, J.N. (2002) The measurement of the crystallinity of polymers by DSC. Polymer, 43: 3873-3878.
44) Kong, Y. & Hay J.N. (2003) The enthalpy of fusion and degree of crystallinity of polymers as measured by DSC. European Polymer Journal, 39: 1721-1727.
45) Richardson, M.J. & Savill, G.N. (1975) Derivation of accurate glass transition temperatures by differential scanning calorimetry. Polymer, 16: 753-757.

68
46) Aras, L. & Richardson, M.J. (1989) The glass transition behaviour and thermodynamic properties of amorphous polystyrene. Polymer, 30: 2246-2252.
47) Hutchinson, J.M. (2009) Determination of the glass transition temperature. Journal of Thermal Analysis and Calorimetry, 98: 579-589.
48) Surana, R., Pyne, A., Rani, M. & Suryanarayanan, R. (2005) Measurement of enthalpic relaxation by differential scanning calorimetry – effect of experimental conditions. Thermochimica Acta, 433: 173-182.
49) Aref-Azar-A., Arnoux, F., Biddlestone, F. & Hay, J.N. (1996) Physical ageing in amorphous and crystalline polymers. Part 2. Polyethylene terephthalate. Thermochimica Acta, 273: 217-229.
50) Krishnaswamy, R.K. & Kalika, D.S. (1994) Dynamic mechanical relaxation properties of poly(ether ether ketone). Polymer, 35 (6): 1157-1165.
51) Krishnaswamy, R.K., Geibel, J.F. & Lewis, B.J. (2003) Influence of semicrystalline morphology on the physical ageing characteristics of poly(phenylene sulfide). Macromolecules, 36: 2907-2914.
52) Shelby, M.D. & Wilkes, G.L. (1998) Thermodynamic chatacterization of the oriented state of bisphenol A polycarbonate as it pertains to enhanced physical ageing. Journal of Polymer Science: Part B: Polymer Physics, 36: 2111-2128.
53) Shelby, M.D. & Wilkes, G.L. (1998) The effect of molecular orientation on the physical ageing of amorphous polymers – dilatometric and mechanical creep behaviour. Polymer, 39 (26): 6767-6779.
54) Huo, P & Cebe, P. (1992) Temperature-dependent relaxation of the crystal-amorphous interphase in poly(ether ether ketone). Macromolecules, 25: 902-905.

69
Appendix I: Baseline Subtraction
Due to the wide temperature range over which PEEK crystals melt it is important to establish a
consistent method of measuring the heat of fusion on melting so an accurate degree of crystallinity
can be determined. As discussed in the introduction a number of authors have suggested subtracting a
baseline in order to remove the influence of any slope and curvature inherent to DSC.
When investigating whether or not it was necessary to subtract a baseline from the traces recorded in
this work, the effect of heating rate was also probed in order to determine a suitable scanning rate
which was a compromise between the melting and recrystallisation of crystallites observed at slow
scanning rates with that of thermal lag seen at fast scanning rates.
In order to subtract a baseline prior to the sample being crystallised a trace had to be obtained for the
empty sample pan. Scans were recorded for empty pans and lids at 5, 10, 20, 40, 50, 60, 80, 100,
160°C/min from 80 – 400°C and then cooled back to room temperature. The pans were filled and the
lids put back on before the individual polymer sample was heated to the melt and crystallised at
40°C/min to give a standard crystallinity across samples (31 ± 0.5%). When back at room temperature
the filled pans were then scanned to the melt at the same rate they had been when previously unfilled
and the traces recorded.
As shown in Figure I there was very little difference between the baseline subtracted and un-
subtracted traces, and on measuring parameters for the heat of fusion of the melting peak the data sets
were found to be highly consistent. Therefore due to the accuracy of this calorimeter and low intrinsic
slope and curvature over the temperature region of interest it was deemed unnecessary to record an
empty pan and lid baseline prior to each data set for subsequent investigations.

70
Of rather more importance to this work was the selection of an appropriate scanning rate to minimise
the influence of recrystallisation and thermal lag. Samples of an equal degree of crystallinity were
scanned at the various rates outlined above and two thermodynamic points were selected for
comparison, as shown in Figure II these were the peak melt and the last trace of crystallinity. It can be
seen that for slow heating rates (< 20°C/min) the last trace and peak melt are pushed to higher
temperatures due to the recrystallisation phenomenon, and for faster heating rates (> 60°C/min) are
pushed upwards due to thermal lag. Therefore an intermediate temperature of 40°C/min shall be used
in this work as it allows scanning from 80 – 400°C to be completed in an experimentally acceptable
time frame and minimises the influence of recrystallisation and thermal lag. Figure II also supports
the conclusion that a baseline need not be subtracted in this work as the measured data points are in
very good agreement.
100 150 200 250 300 350 400
-10
-5
0
5
10
15
20
25
30
35
40
Heat
Flo
w En
do U
p (m
W)
Temperature (ºC)
Baseline unsubtracted Baseline Baseline Subtracted
Figure I. The effect of baseline subtraction on a sample scanned to the melt at 80°C/min.

71
0 20 40 60 80 100 120 140 160 180336338340342344346348350352354356358360362364366
Te
mpe
ratu
re (º
C)
Heating Rate (ºC/min)
Last Trace BS Last Trace BNS Peak Melt BS Peak Melt BNS
Figure II. The influence of heating rate on the measured values for last trace of crystallinity and peak melting temperatures for samples of equal crystallinity. The effect of subtracting a baseline on the measured values is also plotted. BS: Baseline Subtracted / BNS: Baseline Not Subtracted

72
Appendix II: Formation of Additional Crystallinity on Cooling and
Reheating
When engineering a desired morphology into a polymer at a certain isothermal temperature for a
given time it is important that the degree of crystallinity developed in the sample is sufficient to
prevent any further crystallisation on cooling or reheating. If additional crystallinity is introduced the
crystal morphology will no longer be representative of that developed at Tc and the range of crystal
entities may lead to anomalous results even if the overall degree of crystallinity is kept constant.
The development of additional crystallinity on cooling can be seen in Figure III.a where samples were
isothermally crystallised at 312°C for 2, 4, 6, 10, 20 minutes and then cooled at 40°C/min to room
temperature. It can be seen that on cooling from the melt to 312°C no crystallinity is introduced into
the system prior to reaching Tc due to the rapid cooling rate of 160°C/min. On subsequent cooling
from 312°C it is evident that for shorter crystallisation times the crystallisation exotherm is
increasingly pronounced whereas for longer crystallisation times no such exotherm is observed,
demonstrating that if sufficient crystallinity is not developed at Tc then additional crystallinity is able
to form on cooling.
The subsequent re-heating traces are shown in Figure III.b and the most prominent feature is the
development of a second endotherm on the main melting peak with increasing crystallisation time.
When held at Tc for 2 minutes most, if not all, of the melting peak is that of crystallinity developed on
cooling. However as you hold for longer periods of time, for a tc > 4 mins, less crystallinity is
introduced on cooling and the melting peak is pushed to increasingly higher temperatures with the
emergence of a minor endothermic peak. Should the dual lamellae model of primary and secondary
crystallisation be applied, this indicates that much of the primary crystallisation is nearing a degree of
completion and some secondary crystallisation is taking place – although not complete as further

73
crystallisation is still observed on cooling. For crystallisation times > 10 mins crystallisation is no
longer observed on cooling and the lower temperature, secondary crystallisation peak is far more
pronounced. On cooling to below Tg this is representative of the desired morphology introduced at the
isothermal crystallisation temperature as the degree of crystallinity is sufficient to prevent any
additional crystallites forming over the intermediate temperature range.

74
200 220 240 260 280 300 320 340 360-10-505
1015202530354045505560
Heat
Flo
w En
do U
p (m
W)
Temperature (ºC)
20 mins 10 mins 6 mins 4 mims 2 mins
100 150 200 250 300 350 40016
18
20
22
24
26
28
30
32
34
36
38
40
Heat
Flo
w En
do U
p (m
W)
Temperature (ºC
20 mins 10 mins 6 mins 4 mins 2 mins
Figure III.a. The development of crystallinity on cooling at 40°C/min after crystallising samples at 312°C for various lengths of time.
Figure III.b. Melting traces of the above samples crystallised at 312°C for differing lengths of time and then cooled to below Tg at 40°C/min. The
melting trace is scanned at 40°C/min.

75
The same crystallisation exotherms can also be observed on heating samples which have been
quenched from Tc after holding for various lengths of time and then scanning them into the melt. As
before samples were isothermally crystallised at 312°C for 2, 4, 6, 10, 20 minutes but were then
quenched directly into liquid nitrogen before scanning from 80 – 400°C at 40°C/min to obtain the
melting traces, displayed in Figure IV. As previously observed on cooling, when scanning the
quenched samples into the melt a decreasing crystallisation exotherm is produced in samples which
have been held for increasingly longer times at Tc. Again the secondary endotherm appears with
prolonged times at Tc, suggesting the development of secondary crystallites occurs once primary
crystallisation has taken place. In order to measure the degree of crystallinity introduced for shorter
crystallisation times the area of the exothermic crystallisation peak was subtracted from the heat of
fusion of the endothermic melting peak, thus giving the degree of crystallinity prior to scanning and
the development of any additional crystallinity forming on heating into the melt.
This is an overview of the preliminary work done which was essential in determining adequate
isothermal crystallisation temperatures and times that would allow a desired morphology to be
engineerined into the polymer for subsequent ageing investigations.

76
100 150 200 250 300 350 400121416182022242628303234363840
20 mins 10 mins 6 mins 4 mins 2 mins
Heat
Flo
w En
do U
p (m
/W)
Temperature (ºC)
Figure IV. The 40°C/min heating scans of samples crystallised at 312°C for differing lengths of time and quenched to below Tg.