The effect of crack closure on the reliability of NDT predictions of crack size
7
The effect of crack closure on the reliability of NDT predictions of crack size R. Clark, W.D. Dover and L.J. Bond The aim of this work is to investigate the effect of crack closure on the reliability of NDT predictions of crack size. Tests are performed on mild steel plate specimens each possessing a fatigue crack. The amount of crack opening or closure is controlled using a specially built four-point bending rig. Four NDT techniques are studied: dye penetrant testing, magnetic particle inspection, AC field measurement and an ultrasonic technique using Rayleigh waves. A success/failure criterion for the reliability of sizing is adopted and both the length and depth data are analysed in accordance with this condition. It is found that both magnetic particle inspection and AC field measurement can detect and measure closed cracks but that dye penetrant testing and the ultrasonic Rayleigh-wave technique cannot detect tightly closed cracks. Keywords: crack size, dye penetrant testing, magnetic particle inspection, AC field measurement, ultrasonic Rayleigh-wave technique, mild steel A significant amount of the work that has been performed in the field of NDT has been primarily concerned with the question 'How small is the smallest crack that can be detected and sized?'. Although this is of great importance, the whole area of crack sizing, both length and depth sizing, becomes somewhat dubious if the matter of sizing reliability is not also considered. The reliability of sizing is dependent on many factors including, for example, the operational procedure used, the actions of the person performing the test, the material in which the defect is present, the geometry of the object being tested, the nature of the crack surface, the surface finish of the object and the amount of crack closure. These factors combine to cause a shift in the simplified probability of detection (POD) or reliability of sizing curve as illustrated schematically in Figure 1. To study all of these factors simultaneously would have been im- possible, therefore an attempt has been made to in- vestigate the effect of crack closure in isolation. The work reported is a pilot study on five fatigue-cracked mild steel plate specimens. The data have been analysed using the sampling distribution of proportionslq based on a success/failure criterion which specified that if the measured value (crack length or crack depth) was equal to the actual value ± 10% the result was considered to be a success. A specially designed four-point bending rig enabled the crack closure to be varied under load control. The relative amount of crack opening and closing was measured using a clip gauge prior to the NDT being performed, so that the values of load monitored during inspection could be interpreted in terms of crack opening. For this pilot study four NDT techniques were in- vestigated: dye penetrant testing, magnetic particle inspection (MPI), AC field measurement (ACFM) and an ultrasonic technique using Rayleigh waves. Experimental procedure A four-point bending rig (Figure 2) was designed to enable the amount of crack opening and closing to be varied by means of a hydraulic jack. Incorporated in the design was a facility for changing the position of the two lower points of application of force (Figure 3). This allowed the cracked side of the specimen to be put in tension or compression without having to remove the specimen and turn it over. ~5 "5 Theoretical curve I n-service curve .doeto e j, ,actOr e a. Crack size Fig. 1 POD/reliability of sizing versus crack size 0308-9126/87/050269-07 $3.00 © 1987 Butterworth ~ Co (Publishers) Ltd NDT International Volume 20 Number 5 October 1987 269
Transcript of The effect of crack closure on the reliability of NDT predictions of crack size

The effect of crack closure on the reliability of NDT predictions of crack size
R. Clark, W.D. Dover and L.J. Bond The aim of this work is to investigate the effect of crack closure on the reliability of NDT predictions of crack size. Tests are performed on mild steel plate specimens each possessing a fatigue crack. The amount of crack opening or closure is controlled using a specially built four-point bending rig. Four NDT techniques are studied: dye penetrant testing, magnetic particle inspection, AC field measurement and an ultrasonic technique using Rayleigh waves. A success/failure criterion for the reliability of sizing is adopted and both the length and depth data are analysed in accordance with this condition. It is found that both magnetic particle inspection and AC field measurement can detect and measure closed cracks but that dye penetrant testing and the ultrasonic Rayleigh-wave technique cannot detect tightly closed cracks.
Keywords: crack size, dye penetrant testing, magnetic particle inspection, AC field measurement, ultrasonic Rayleigh-wave technique, mild steel
A significant amount of the work that has been performed in the field of NDT has been primarily concerned with the question 'How small is the smallest crack that can be detected and sized?'. Although this is of great importance, the whole area of crack sizing, both length and depth sizing, becomes somewhat dubious if the matter of sizing reliability is not also considered.
The reliability of sizing is dependent on many factors including, for example, the operational procedure used, the actions of the person performing the test, the material in which the defect is present, the geometry of the object being tested, the nature of the crack surface, the surface finish of the object and the amount of crack closure. These factors combine to cause a shift in the simplified probability of detection (POD) or reliability of sizing curve as illustrated schematically in Figure 1. To study all of these factors simultaneously would have been im- possible, therefore an attempt has been made to in- vestigate the effect of crack closure in isolation.
The work reported is a pilot study on five fatigue-cracked mild steel plate specimens. The data have been analysed using the sampling distribution of proportionslq based on a success/failure criterion which specified that if the measured value (crack length or crack depth) was equal to the actual value ± 10% the result was considered to be a success. A specially designed four-point bending rig enabled the crack closure to be varied under load control. The relative amount of crack opening and closing was measured using a clip gauge prior to the NDT being performed, so that the values of load monitored during inspection could be interpreted in terms of crack opening.
For this pilot study four NDT techniques were in- vestigated: dye penetrant testing, magnetic particle inspection (MPI), AC field measurement (ACFM) and an ultrasonic technique using Rayleigh waves.
Experimental procedure A four-point bending rig (Figure 2) was designed to enable the amount of crack opening and closing to be varied by means of a hydraulic jack. Incorporated in the design was a facility for changing the position of the two lower points of application of force (Figure 3). This allowed the cracked side of the specimen to be put in tension or compression without having to remove the specimen and turn it over.
~5
"5
Theoret ica l curve I n-service curve
.doeto e j , ,actOr e
a. Crack size
Fig. 1 POD/reliabil ity of sizing versus crack size
0308-9126/87/050269-07 $3.00 © 1987 Butterworth ~ Co (Publishers) Ltd
NDT International Volume 20 Number 5 October 1987 269

Fig. 2 Four-point bending rig
Fig. 3 Four-point bending rig showing the points of application of force
The initial plate dimensions were 306 mm long by 76 mm wide by 15 mm thick. A fatigue crack was grown m each specimen from a 3 mm deep starter notch by cyclically loading the plate in three-point bending on an Amsler Vibrophore fatigue machine. Suitable load limits for the cyclic loading were determined using simple fracture mechanicsN. Throughout the fatigue process the crack depth was monitored using the ACFM technique. The crack was allowed to extend until the desired depth was reached (40-50 mm surface length). Each specimen was then removed from the test machine, the starter notch was machined offand the fatigue-cracked surface was given a ground finish.
A clip gauge was used to determine the relative amount of crack opening or closing with changing load. Before fixing the clip gauge to the specimen, the clip gauge was calibrated using an Instron calibration rig. The clip gauge was attached to the specimen using an epoxy cement, so that it straddled the fatigue crack.
Once set up, the specimen was loaded and the clip gauge readings recorded. Two strain gauges attached to the uncracked side of the specimen and connected to a strain gauge bridge and amplifier enabled the applied load to be monitored. The procedure was repeated for each specimen.
Each of the NDT tests was performed three times at each of the chosen loads on each specimen. When loading the specimen it was ensured that the load did not exceed two-
thirds of yield, since this would have caused further crack growth. The NDT tests were conducted as described below.
Dye penetrant testing Ardrox Overchek red penetrant, which could be inspected in either daylight or ultraviolet (UV) light, was used for the dye penetrant tests. For all of the tests the same contact time and development time were used, these being 10 min and 5 min respectively. On inspection the length of any indication was measured using a steel rule.
Magnetic particle inspection An adjustable-yoke electromagnet was used along with Ardrox fluorescent magnetic ink to perform the MPI tests. Inspection was carried out under UV light, the length of any indications being measured using a steel rule.
AC field measurement This technique is based on the fact that when an AC is passed through a metal specimen the current is carried in a thin layer at the metal surface (a skin effect). A hand- held probe was used along with the U7G Crack Microgauge in order to perform the ACFM testsN. Magnets were fixed to the end of the specimen such that the AC field could be injected. Having marked a grid on the cracked surface of the specimen, a series of measurements was taken along the crack and across the crack, thus investigating the AC field in the plate. Cross- crack and reference readings were recorded when taking measurements along the crack, the reference readings being taken 10 mm away from the crack itself. The reference readings were needed in order to obtain crack depth values using the one-dimensional solution. The frequency of the AC was 6 kHz.
Ultrasonic Rayleigh-wave testing The equipment used was a Sonic FTS Mark IV ultrasonic tester. Ultrasonic Rayleigh-wave testing in the form used is a non-conventional ultrasonic technique which involves the use of absolute measurements to size cracks. Rayleigh waves have the characteristic that they travel through the specimen at the specimen surfacel41. A pulse echo technique was used, as outlined by Hudgell et all4]. The theory, based on the fact that mode conversion occurs at a crack tip, was used to produce a set of crack depth values for each specimen over a range of loads. The frequency of the ultrasound was 5 MHz.
Once the testing had been completed, the specimens were cooled in liquid nitrogen at - 196°C for 10 min and then fractured.
Statistical analysis For this study the following analysis was adopted.
Consider a success/failure (S/F) criterion such that
• S if measured value = actual value -t- 10% • F if measured value is outside this region.
Actual value = value from destructive measurement. "Value" refers to the crack length value or the crack depth value, whichever is being considered when performing the analysis.
• N = sample size = S+F.
270 NDT International October 1987

Assume that the population is infinite and that it is binomially distributed. Perform an analysis using the sampling distribution of proportions.
• Sample estimate of POD = P = SIN • Let p = true POD (population POD)
q = l - - p • Sampling distribution of proportions
f(e) = NCNP pNP(I _ p)N(1 -P) • Mean =/ap = p • Standard deviation =op =(pq/N) 1/2 = [p(1-p)]N] 1/2
The distribution can be approximated to the normal distribution, even for sample sizes as low as 10.
• Frequency of P = f(P) dP
op(27r)'/2 - 2 1 ~ , ] l P is taken as a point estimate of the true POD value p
• therefore op = [P(1-P)/N] tl=
If a 90% confidence level is chosen,
" c ° n f i d e n c e l e v e l = i i (_ 1 ) (2rr)l~- exp ~- z 2 dz
• z = normal standardized variable = (P-p)/p
Confidence level = area under the standard normal curve (Figure 4). For a confidence level of 0.90
• z = 1.645 (from standard tables).
Hence the range for the chosen confidence level is
• p = P+zop
Reliability R at a given sample p value (ie a given technique at a given load) is
• R = 1 - - ( p U - - p L ) i fP - ->0 .5 • R = Pu -- pL ifP~<0.5 • PU = upper bound estimate of population POD • PL = lower bound estimate of population POD.
R e s u l t s a n d d i s c u s s i o n
The variation of crack opening displacement with applied load - an example is shown in Figure 5 for one of the specimens - has a linear characteristic throughout the elastic load range when opening the crack. When closing
p (z)
- - Z
Fig. 4 Standard normal curve
0 z z
E 0.12 E
~= 0.08 8
0.04 a
I i I i I I I I , - 8 - 6 - 4 ~2. ,~ •
--X-X" -X -- X--X- X
Crack c l o s u r e --0.04
_ xXX SSI
s - Crack s'~ o p e n i n g
- - sJX ssSx
X S - - X i # _ , x , ; , " ~ I I I i I ~ I ~ I ' 2 4 6 8 10
Load (kN)
Fig. 5 Crack o p e n i n g / c l o s i n g d i s p l a c e m e n t v e r s u s load app l ied
1.0 / / (
/ /
- - O - - - Dayl ight ~ - - - - ® - - - - ~ ) - - - - 4 )
- . ~ - . - UV light /
/ /
/
& _-.-'> .Z/ 0.50 -
/ ' I r~
/" / • /
/ /
,J # !
OV---.L.- . . - --~ - 1 0 --8 - 6 - 4 - 2 0
Load (kN)
Fig. 6 Dye penetrant testing: reliability of sizing versus load applied
t ± 1 2 4 6 8
the crack, however, the displacement values are smaller for a given load increment because the crack acts as if it were shallower. On all of the closure calibration curves a distinct change in slope could be detected. This point was found to correspond to full closure and subsequent loading gave displacements determined by the elastic strain in the specimen material.
For all positive loads (crack opening) the dye penetrant testing was found to have a 100% length sizing reliability based on the chosen success/failure criterion (Figure 6). With large positive loads the technique leads to a slight oversizing of the crack length due to a blurred indication being produced when applying the developer.
On closing the crack (a negative load) the behaviour was completely different. With increasing crack closure the reliability of length sizing decreased steadily until a load value was reached at which the crack could not even be detected (a 0% length sizing reliability). The load at which the indication disappeared for each specimen was not very far removed from the load at which the slope of the displacement versus load plot changed. A useful con- sequence of this could be that the dye penetrant test could be used as a possible indication of when the fatigue crack could be considered as fully closed. Inspection under UV light was seen to produce a greater length sizing reliability than inspection in daylight for situations approaching full closure.
Two important points need to be recognized when interpreting the dye penetrant results. Firstly, it is likely that the results for closing the crack were affected by penetrant remaining in the crack from earlier tests. In order to help overcome this problem the closure tests were performed before the opening tests. Secondly, the contact
N D T Internat ional October 1 9 8 7 2 7 1

- l O
Fig. 7 applied
1.0 X-- X X X
0.50
tv-
. . . . - ° X - . . . . . X . . . . - X
I I [ I I I [ --8 - -6 --4 --2 0 2 4 6 8
Load (kN)
MPI and ACFM (crack length): reliability of sizing versus load
- 8
Fig. 8 applied
1.0
/ :
/ /
/ l
I / I
/ x t
S t /
J
- 6 - 4
0.50 x~ .~_ -$ re-
s,sX . . . . . X . . . . . X
S S
I I I I - 2 0 2 4 6 8
Load (kN)
Ultrasonic technique (crack length): reliability of sizing versus load
time and development time used were chosen arbitrarily to provide a total test time of a reasonable length (about 20 min). It should be realized that increasing the total test time may lead to some form of indication when the crack is nearly fully closed. This possibility would need to be investigated further.
Both MPI and ACFM have a crack length sizing reliability of 100% across the entire load range considered (Figure 7). Since an MPI indication was produced when applying a load that was sufficient to consider the crack to be completely closed based on the clip gauge and dye penetrant test results, it was apparent that the crack was not actually completely closed as a small amount of opening must have been present to cause a flux leakage. Thus when considering the crack to be completely closed a small amount of opening was still present acting as a barrier to the magnetic and electrical paths.
The ACFM length values were all greater than the actual crack length values. This was mainly due to the fact that they were determined from crack profiles plotted using the ACFM depth data, a process that was open to a considerable amount of error.
The crack length sizing reliability characteristic exhibited by the ultrasonic Rayleigh-wave testing technique was similar to that for the dye penetrant testing (Figure 8), the
4.5
--~ 4.0
E
3.5
'-x- x.. x- x x -~x " o ] ~= 3.
2.5
. , . .X
,,x °
-- s o X o ~ ' S ,,.s
I I I I 1 I / I [ I [ --14 --12 --10 --8 --6 --4 --2 0 2 4 6 8 10
Load (kN)
Fig. 9 ACFM: crack depth versus load applied
• "X ,~
- 12 "-10 "--8 10
1.0
= 0.50 / X £E #
S /
/ l
I ~I . I X I ¢*' I [ I [ "--6 " - 4 - 2 0 2 4 6 8
Load (kN)
ACFN (crack depth): reliability of sizing versus load applied Fig. 10
only real difference being that the drop-off in reliability started at a small positive load value for the ultrasonic technique. As with the ACFM length data, the ultrasonic length data were obtained by plotting crack profiles using the ultrasonic depth data, hence a source of error.
It became apparent from the ACFM testing that the measured crack depth was very dependent on the amount of crack closure (Figure 9). At zero load the technique undersized the crack depth by as much as 20%, thus indicating a fairly tightly closed crack. It was not until a positive load of around 4-6 kN had been applied that the measured crack depth value coincided with the actual crack depth value. At large positive loads the tendency was for the ACFM to oversize the crack depth, hence the shape of the reliability plot (Figure 10), the maximum crack depth sizing reliability of around 80% being achieved at a load of 4 kN. Although the depth sizing reliability decreased to 0% at zero load, the technique still detected the crack but considerably undersized the depth at all of the negative load values considered. The small but obvious increase in the measured crack depth with increasing negative load was considered to be worthy of note. It was suspected that the AC field was in some way affected by the compressive bending stresses in the material when closing the crack. Further work would need to be performed to confirm or reject this idea.
A similarly shaped reliability plot to that for the ACFM technique was found for the ultrasonic Rayleigh-wave technique (Figure l 1). Oversizing occurred at large positive loads (Figure 12), hence the peak crack depth sizing reliability ol around 60% was reached at a load of 2 kN. From the peak value the depth sizing reliability dropped off more slowly with decreasing positive load than for the ACFM technique. Therefore at small negative
2 7 2 NDT In te rna t iona l Oc tobe r 1 9 8 7

Fig. 1 1 applied
- 8
Fig. 1 2
---30
Fig. 1 3
1.0
0.50 / s ~
r r I S X
S
XS •
o •
x I . .~° I I I I - 6 - 4 - 2 0 2 4 6 8
Load (kN) Ultrasonic technique (crack depth): reliability of sizing versus load
5.0
4.0
x ~ 3 . 0
S S
/ sX
s S S /
I S
]1 I I - 6 --4 - 2
2.0
1.0
o • ' x s S
E - E
_ _ ' 1 0
X
Actual depth
I I I 0 2 4 6
Load (kN) Ultrasonic technique: crack depth versus load applied
loads there was a value of depth sizing reliability greater than 0%. The reduced values indicated that the ultrasonic technique had a smaller depth sizing reliability in general than the ACFM technique. When the depth sizing reliability became 0% the crack became invisible to the ultrasound and, was no longer detected. Figures 13 and 14 illustrate the measured and actual crack profiles for one of the specimens for the fulPy open crack and for the partially closed crack respectively. The effect of crack closure on the measured crack depth values is clearly demonstrated by Figure 14.
The time base on the ultrasonic tester did not allow the relative value between the ultrasound reflections. 1~ be clearly determined. A finer scale would be n e e d ~ in order to obtain more accurate results• It should be appreciated that the Rayleigh-wave technique is only one particular ultrasonic technique• Thus for a more detailed look at ultrasonic reliability several other techniques would also need to be investigated.
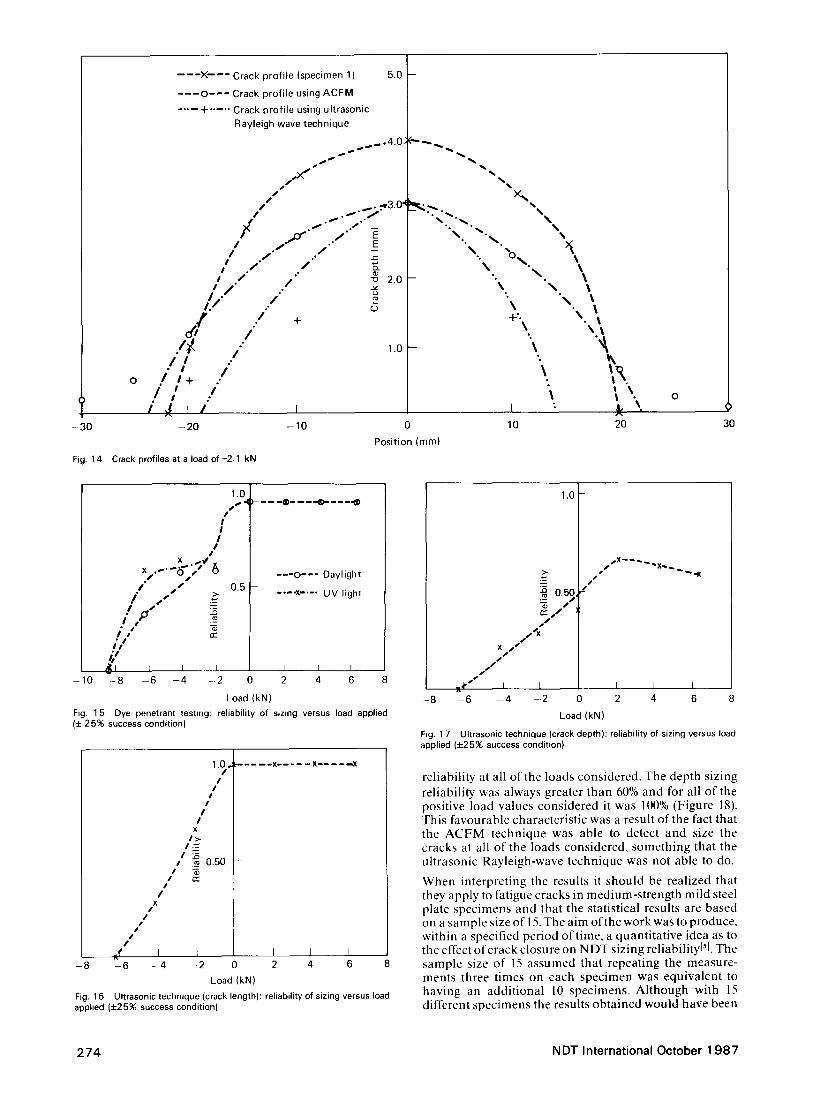
As a comparison, the results were also analysed using a different success/failure criterion. A result was deemed to be a success if the measured value was equal to the actual value + 25%. The dye penetrant and ultrasonic Rayleigh- wave crack length results exhibited a similar pattern to that for the criterion previously considered (Figures 15 and 16 respectively). The only difference was that the reliability of length sizing values for the case of an applied negative load was slightly greater for the less stringent success condition. Both the MPI and ACFM crack length reliability of sizing results were unchanged for the second success/failure criterion, the reliability being 100%.
On considering the crack depth results, the ultrasonic Rayleigh-wave technique had a similar depth sizing reliability pattern to that for the previous analysis, although the reliability of depth sizing values was greater at all of the loads considered when applying the +25% success condition (Figure 17). The ACFM technique showed a significant improvement in crack depth sizing
- - - ) ~ - - - Crack prof i le (specimen 1 )
. . . . O - - - . Crack profi le using ACFM
- - - 4 - - - - Crack profi le using ultrasonic Rayleigh wave technique . . . ° ~ " ,
/~f , , ."+ i ' . , ~. ~ 30
• " ~
. / / e + 7 . f
.. I t / / ' / I" I'
. . I I
/ i / • I / t
I o~ i l
-.-20
Crack profiles at a load of 6.3 kN
== " o
2.0 o
I
- 1 0
I
1 . 0 - -
0
Position (mm)
-N \~ \\ + ' . ~ " \ \
\'!,
I 10
\ V\ . I
' \ I \ • ~ "\
2O
O
30
NDT Internat ional Oc tober 1 9 8 7 2 7 3
- - 3 0
Fig. 14
O
- - - - X - - - - Crack prof i le (specimen 1) 5.0
- - - O - - - Crack profi le using ACFM
. . . . + . . . . . Crack prof i le using ultrasonic
Rayleigh wave technique
.4 .0 ;
/ ~...,~3.0 '~
. . ~ .s
s /"~" "/" s / " /
I • "
I / " " t / " . / "~ 2 . 0
/ / /
o,,g ' + / • / ~ /"
/ s / / I + ..
/ / ; :
i ~ , / I - 2 0 - 1 0
1 . 0 - -
0
Position (ram)
% ,%
% x~
• ° •
• . % ~ .
_ .. \ .
°
+-.\ " \ • I \ l
I 1 : ~ "~,
10 20
Crack profiles at a load of -2.1 kN
30
1.0
I !
I I
S x . . ~ . S
X . . . . ~)~ s S # s
1" s S 0.5 / s S .~ / p,s .~
I s s ,~- n-.
; / V
~ _ _ L I .L
- 1 0 - 8 - 6 - 4 - 2 0
Load (kN)
---0--- Daylight
- , - - x . . . . UV light
2 4 6 8
Fig. 15 Dye penetrant testing: reliability of sizing versus load applied (4- 25% success condition)
/ I
/ X $
/
i v
/
• I - 6 - . 4
1.0,; /
I I I I I I ×
I>.
s I ~ 0.50
rr
x x ,,,,x
I - - - 2 0
Load (kN)
Fig. 16 Ultrasonic technique (crack length): reliability of sizing versus load applied (4-25% success condition)
I I I 2 4 6 8
1.0
0.50, ._ 0# "$ s r~ s /
s X
s J Xs#Is'#Sx s. S
s S
x # SS I l
- 6 - - 4 - 2
#S SX X
I I I
--8 0 2 4 6 8
Load (kN)
Fig. 1 7 Ultrasonic technique (crack depth): reliability of sizing versus load applied (+2596 success condition)
reliability at all of the loads considered. The depth sizing reliability was always greater than 60% and for all of the positive load values considered it was 100% (Figure 18). This favourable characteristic was a result of the fact that the ACFM technique was able to detect and size the cracks at all of the loads considered, something that the ultrasonic Rayleigh-wave technique was not able to do.
When interpreting the results it should be realized that they apply to fatigue cracks in medium-strength mild steel plate specimens and that the statistical results are based on a sample size of 15. The aim of the work was to produce, within a specified period of time, a quantitative idea as to the effect of crack closure on NDT sizing reliabilityls]. The sample size of 15 assumed that repeating the measure- ments three times on each specimen was equivalent to having an additional 10 specimens. Although with 15 different specimens the results obtained would have been
274 NDT International October 1 987

x 1.o,
X ~ " ,,,.X X " ~ X--. X" 4' / --
.~ 0.50
.,~
- - - X - - E - X - E - X - - - - - - X
I [ 1 I I I I 1 I I
- 1 4 - 1 2 - 1 0 - 8 - 6 - 4 - 2 0 2 4 6 8 10
Load (kN)
Fig. 18 ACFM technique (crack depth): reliability of sizing versus load applied (± 25% success condition)
different, since the cracks were all of similar size and were all grown from a similar starter notch using the same fatigue process, it was considered that for the purpose of this pilot study the differences between the two cases would have been small.
Conclusions Remembering the conditions imposed on this pilot study, the following conclusions can be drawn from the work performed.
When opening a crack, all of the techniques were able to predict the crack length to within ___ 10% of the actual value with a reliability of 100%. On closing the crack though, only the MPI and ACFM techniques were able to repeat the 100% reliability characteristic. Both the dye penetrant testing and the ultrasonic technique exhibited a charac- teristic whereby they were fairly reliable for small negative loads, but as the negative load was increased, so the reliability of length sizing decreased, until a point was reached at which the crack could no longer be detected.
When considering the determination of crack depth, the ACFM technique had a greater depth sizing reliability than the ultrasonic technique for loads greater than
2 kN - 70% as opposed to 50%. Below 2 kN the depth sizing reliability decreased for both techniques, that for the ACFM technique decreasing more rapidly than that for the ultrasonic technique. The ACFM technique did have the advantage that, although it did not enable the crack depth to be determined accurately at small negative loads, unlike the ultrasonic technique, it did allow detection at all of the negative loads considered, the largest negative load applied being -12 kN.
Apart from the ACFM crack depth results, the patterns exhibited for a + 25% success criterion were the same as those for the + 10% success criterion. With the less severe success condition all of the techniques exhibited an increased reliability of sizing. On considering the second success/failure criterion, the crack depth values obtained using the ACFM technique showed a marked improve- ment in the reliability of depth sizing. For all of the loads considered the ACFM technique had a crack depth sizing reliability of greater than 60% and for all of the positive loads considered the depth sizing reliability was 100%.
References 1 Guttman, i., Wilks, S.S. a n d H u n t e r , J. Introducing
Engineering Statistics Wiley, New York, 3rd edition (1982) 2 Parker, A.P. Mechanics of Fracture and Fatigue Spon, London,
UK, 1st edition (1981) pp 253-276 3 Charlesworth, F.D.W. and Dover, W.D. 'Some aspects of
crack detection and sizing using AC field measurement" in Advances in Crack Length Measurement ed C.J. Beevers, Engineering Materials Advisory Service, Warley, UK (1982)
4 Hudgell, R.J., Morgan, L.L. and Lumb, R.F. 'Non destructive measurement of the depth of surface breaking cracks using ultrasonic Rayleigh waves' Brit J NDT 16 (September 1974) pp 144-149
5 Clark, R. "Reliability of NDT predictions of crack size" BSc Project Report Department of Mechanical Engineering, University College London 0986)
Authors The authors are in the Department of Mechanical Engineering, University College London, Torrington Place, London WC1E 7JE, UK.
Paper received 2 April 1987. Revised 11 June 1987
NDT International October 1987 275