The Effect of Broiler Breeder Genetic Strain and Parent Flock Age on ...
13
The Effect of Broiler Breeder Genetic Strain and Parent Flock Age on Eggshell Conductance and Embryonic Metabolism J. A. Hamidu,* G. M. Fasenko,* 1 J. J. R. Feddes,* E. E. O’Dea,* C. A. Ouellette,* M. J. Wineland,† and V. L. Christensen† *Department of Agricultural, Food and Nutritional Science, University of Alberta, Edmonton, Alberta, T6G 2P5 Canada; and †Department of Poultry Science, North Carolina State University, Raleigh 27695 ABSTRACT The effect of genetic strain (Ross 308; Cobb 500) and parent flock age [young (29 wk), peak (Ross = 34 wk; Cobb = 36 wk), postpeak (40 wk), mature (45 wk), old (55 wk), and very old (59 wk)] on eggshell conduc- tance and embryonic metabolism were examined. At each flock age, eggs from each strain were incubated for 21.5 d in individual metabolic chambers to measure embry- onic O 2 intake and CO 2 output. From these data, the respiratory quotient (RQ) and metabolic heat production were calculated. Data were analyzed by the GLM proce- dure of SAS at P ≤ 0.05. Neither strain nor flock age influenced conductance. Total embryonic O 2 consump- tion, CO 2 output, RQ, and metabolic heat production over the entire incubation period were not affected by strain. Daily differences existed between strains for embryonic O 2 intake (1, 7, 16, 17, 19, 20 d of incubation), CO 2 output (1 to 4, 16 to 20 d of incubation), and heat production (4, 7, 16 to 19 d of incubation). Embryos from young, mature, Key words: breeder strain, flock age, O 2 consumption, CO 2 production, embryonic metabolism 2007 Poultry Science 86:2420–2432 doi:10.3382/ps.2007-00265 INTRODUCTION In recent years, commercial hatchery employees have noted increases in the environmental temperature sur- rounding the last few egg racks in multistage incubators. These racks hold eggs that are the next to be transferred to the hatcher at 18 d (these eggs have embryos that are the most developed within the incubator). The speculation is that there is greater embryonic heat production from embryos of modern broiler strains selected for growth. When first developed, multistage incubators were de- signed to take advantage of the fact that developmentally advanced embryos produce more metabolic heat, and this heat could be used to help incubate eggs with develop- ©2007 Poultry Science Association Inc. Received June 25, 2007. Accepted July 31, 2007. 1 Corresponding author: [email protected] 2420 old, and very old flocks produced significantly more total embryonic heat over the entire 21 d (1,712, 1,677, 1,808, and 1,832, respectively) than embryos from peak (1,601) and postpeak (1,693) flocks. Average RQ for the entire incubation period was higher in embryos from mature flocks compared with all other flock ages. Daily differ- ences among embryos from different flock ages were shown for O 2 consumption (all but d 8 of incubation), CO 2 production (all but d 7 and 9 of incubation), and heat output. The results showed that genetic strain and parent flock age influence daily embryonic metabolism, especially during the early and latter days of incubation. These daily differences coincide with the days of incuba- tion having a higher incidence of embryonic mortality; these 2 factors may be related. Further investigation into the relationship between embryonic metabolic heat pro- duction and mortality during incubation may lead to the development of specific incubation conditions for differ- ent genetic strains and flock ages. mentally immature embryos that were recently placed in the incubator. Recent research has indicated that broiler breeder ge- netic strains differing in growth potential have different embryonic metabolic rates (Tona et al., 2004). The strains examined were a standard heavy line (selected for broiler growth), an experimental line (heavy line selected for reproductive performance and livability), and a label- type line (selected for a medium size and slow growth). The overall embryonic heat production from 428 h of incubation to hatching was significantly different among all 3 lines (standard > experimental > label). There is growing concern that the embryonic heat out- put of modern broiler embryos is much higher than that from strains of several years ago. This may be causing localized overheating in the incubator in the environment surrounding the last few egg racks, and could be influ- encing embryo survival and hatched chick quality. Recent research in which eggshell surface temperature was used as an indicator of embryonic temperature has examined Downloaded from https://academic.oup.com/ps/article-abstract/86/11/2420/1573678 by guest on 01 April 2018
Transcript of The Effect of Broiler Breeder Genetic Strain and Parent Flock Age on ...
The Effect of Broiler Breeder Genetic Strain and Parent Flock Ageon Eggshell Conductance and Embryonic Metabolism
J. A. Hamidu,* G. M. Fasenko,*1 J. J. R. Feddes,* E. E. O’Dea,* C. A. Ouellette,*M. J. Wineland,† and V. L. Christensen†
*Department of Agricultural, Food and Nutritional Science, University of Alberta, Edmonton, Alberta, T6G 2P5 Canada;and †Department of Poultry Science, North Carolina State University, Raleigh 27695
ABSTRACT The effect of genetic strain (Ross 308; Cobb500) and parent flock age [young (29 wk), peak (Ross =34 wk; Cobb = 36 wk), postpeak (40 wk), mature (45 wk),old (55 wk), and very old (59 wk)] on eggshell conduc-tance and embryonic metabolism were examined. At eachflock age, eggs from each strain were incubated for 21.5d in individual metabolic chambers to measure embry-onic O2 intake and CO2 output. From these data, therespiratory quotient (RQ) and metabolic heat productionwere calculated. Data were analyzed by the GLM proce-dure of SAS at P ≤ 0.05. Neither strain nor flock ageinfluenced conductance. Total embryonic O2 consump-tion, CO2 output, RQ, and metabolic heat production overthe entire incubation period were not affected by strain.Daily differences existed between strains for embryonicO2 intake (1, 7, 16, 17, 19, 20 d of incubation), CO2 output(1 to 4, 16 to 20 d of incubation), and heat production (4,7, 16 to 19 d of incubation). Embryos from young, mature,
Key words: breeder strain, flock age, O2 consumption, CO2 production, embryonic metabolism
2007 Poultry Science 86:2420–2432doi:10.3382/ps.2007-00265
INTRODUCTION
In recent years, commercial hatchery employees havenoted increases in the environmental temperature sur-rounding the last few egg racks in multistage incubators.These racks hold eggs that are the next to be transferredto the hatcher at 18 d (these eggs have embryos that are themost developed within the incubator). The speculationis that there is greater embryonic heat production fromembryos of modern broiler strains selected for growth.When first developed, multistage incubators were de-signed to take advantage of the fact that developmentallyadvanced embryos produce more metabolic heat, and thisheat could be used to help incubate eggs with develop-
©2007 Poultry Science Association Inc.Received June 25, 2007.Accepted July 31, 2007.1Corresponding author: [email protected]
2420
old, and very old flocks produced significantly more totalembryonic heat over the entire 21 d (1,712, 1,677, 1,808,and 1,832, respectively) than embryos from peak (1,601)and postpeak (1,693) flocks. Average RQ for the entireincubation period was higher in embryos from matureflocks compared with all other flock ages. Daily differ-ences among embryos from different flock ages wereshown for O2 consumption (all but d 8 of incubation),CO2 production (all but d 7 and 9 of incubation), andheat output. The results showed that genetic strain andparent flock age influence daily embryonic metabolism,especially during the early and latter days of incubation.These daily differences coincide with the days of incuba-tion having a higher incidence of embryonic mortality;these 2 factors may be related. Further investigation intothe relationship between embryonic metabolic heat pro-duction and mortality during incubation may lead to thedevelopment of specific incubation conditions for differ-ent genetic strains and flock ages.
mentally immature embryos that were recently placed inthe incubator.
Recent research has indicated that broiler breeder ge-netic strains differing in growth potential have differentembryonic metabolic rates (Tona et al., 2004). The strainsexamined were a standard heavy line (selected for broilergrowth), an experimental line (heavy line selected forreproductive performance and livability), and a label-type line (selected for a medium size and slow growth).The overall embryonic heat production from 428 h ofincubation to hatching was significantly different amongall 3 lines (standard > experimental > label).
There is growing concern that the embryonic heat out-put of modern broiler embryos is much higher than thatfrom strains of several years ago. This may be causinglocalized overheating in the incubator in the environmentsurrounding the last few egg racks, and could be influ-encing embryo survival and hatched chick quality. Recentresearch in which eggshell surface temperature was usedas an indicator of embryonic temperature has examined
Downloaded from https://academic.oup.com/ps/article-abstract/86/11/2420/1573678by gueston 01 April 2018
METABOLISM OF EMBRYOS FROM MODERN BROILER STRAINS 2421
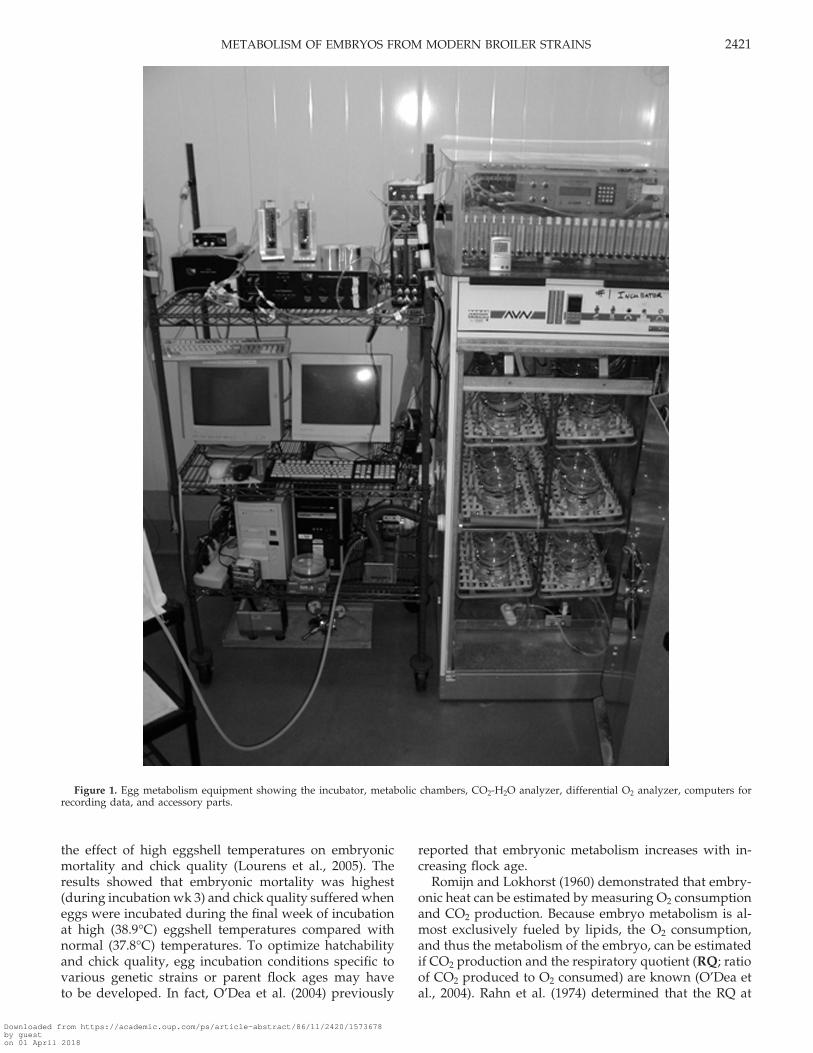
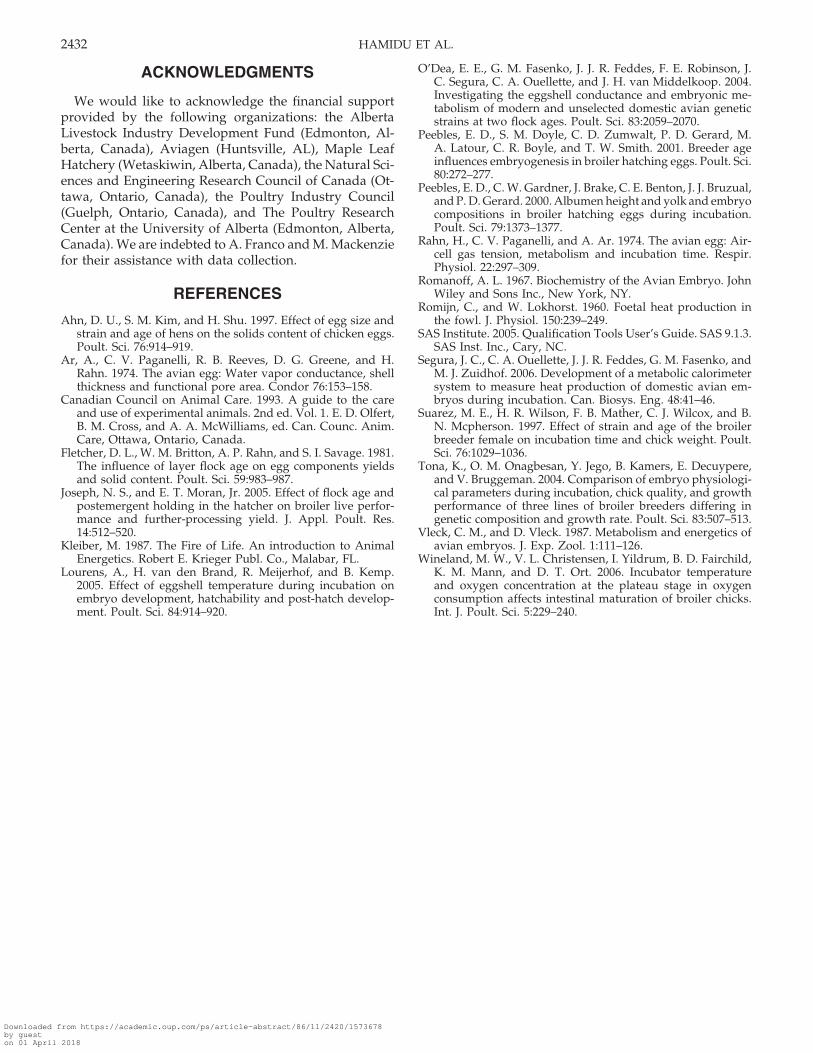
Figure 1. Egg metabolism equipment showing the incubator, metabolic chambers, CO2-H2O analyzer, differential O2 analyzer, computers forrecording data, and accessory parts.
the effect of high eggshell temperatures on embryonicmortality and chick quality (Lourens et al., 2005). Theresults showed that embryonic mortality was highest(during incubation wk 3) and chick quality suffered wheneggs were incubated during the final week of incubationat high (38.9°C) eggshell temperatures compared withnormal (37.8°C) temperatures. To optimize hatchabilityand chick quality, egg incubation conditions specific tovarious genetic strains or parent flock ages may haveto be developed. In fact, O’Dea et al. (2004) previously
reported that embryonic metabolism increases with in-creasing flock age.
Romijn and Lokhorst (1960) demonstrated that embry-onic heat can be estimated by measuring O2 consumptionand CO2 production. Because embryo metabolism is al-most exclusively fueled by lipids, the O2 consumption,and thus the metabolism of the embryo, can be estimatedif CO2 production and the respiratory quotient (RQ; ratioof CO2 produced to O2 consumed) are known (O’Dea etal., 2004). Rahn et al. (1974) determined that the RQ at
Downloaded from https://academic.oup.com/ps/article-abstract/86/11/2420/1573678by gueston 01 April 2018
HAMIDU ET AL.2422
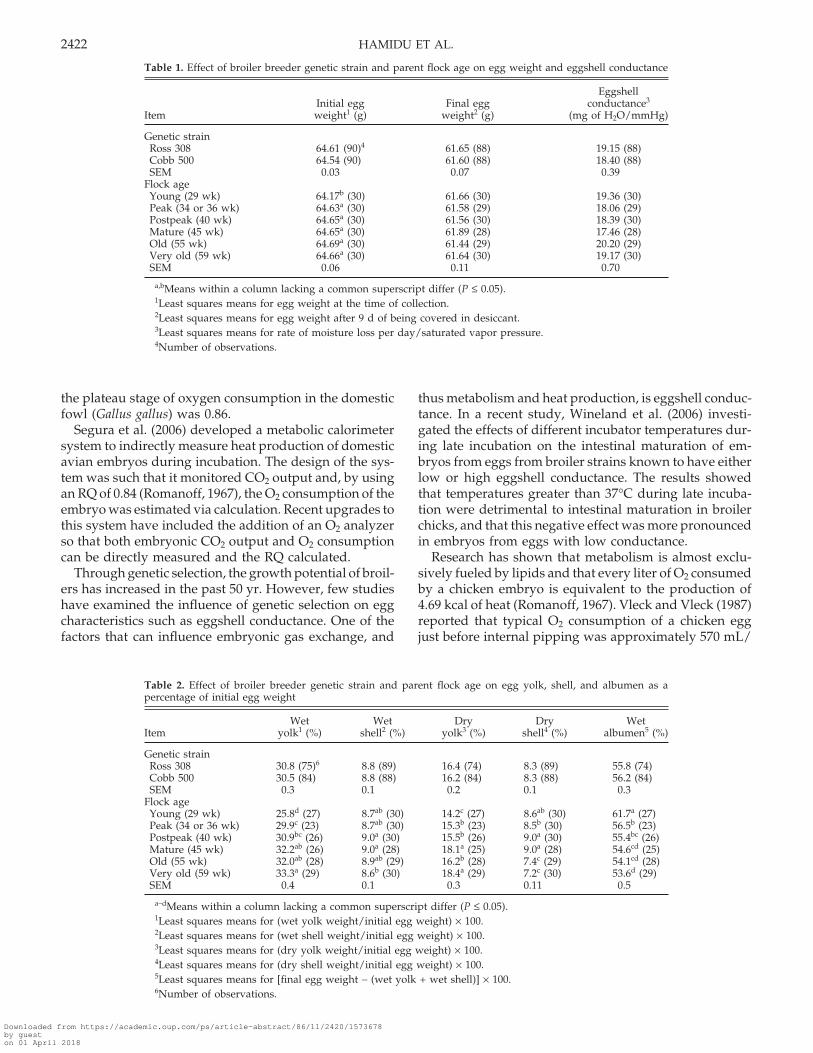
Table 1. Effect of broiler breeder genetic strain and parent flock age on egg weight and eggshell conductance
EggshellInitial egg Final egg conductance3
Item weight1 (g) weight2 (g) (mg of H2O/mmHg)
Genetic strainRoss 308 64.61 (90)4 61.65 (88) 19.15 (88)Cobb 500 64.54 (90) 61.60 (88) 18.40 (88)SEM 0.03 0.07 0.39
Flock ageYoung (29 wk) 64.17b (30) 61.66 (30) 19.36 (30)Peak (34 or 36 wk) 64.63a (30) 61.58 (29) 18.06 (29)Postpeak (40 wk) 64.65a (30) 61.56 (30) 18.39 (30)Mature (45 wk) 64.65a (30) 61.89 (28) 17.46 (28)Old (55 wk) 64.69a (30) 61.44 (29) 20.20 (29)Very old (59 wk) 64.66a (30) 61.64 (30) 19.17 (30)SEM 0.06 0.11 0.70
a,bMeans within a column lacking a common superscript differ (P ≤ 0.05).1Least squares means for egg weight at the time of collection.2Least squares means for egg weight after 9 d of being covered in desiccant.3Least squares means for rate of moisture loss per day/saturated vapor pressure.4Number of observations.
the plateau stage of oxygen consumption in the domesticfowl (Gallus gallus) was 0.86.
Segura et al. (2006) developed a metabolic calorimetersystem to indirectly measure heat production of domesticavian embryos during incubation. The design of the sys-tem was such that it monitored CO2 output and, by usingan RQ of 0.84 (Romanoff, 1967), the O2 consumption of theembryo was estimated via calculation. Recent upgrades tothis system have included the addition of an O2 analyzerso that both embryonic CO2 output and O2 consumptioncan be directly measured and the RQ calculated.
Through genetic selection, the growth potential of broil-ers has increased in the past 50 yr. However, few studieshave examined the influence of genetic selection on eggcharacteristics such as eggshell conductance. One of thefactors that can influence embryonic gas exchange, and
Table 2. Effect of broiler breeder genetic strain and parent flock age on egg yolk, shell, and albumen as apercentage of initial egg weight
Wet Wet Dry Dry WetItem yolk1 (%) shell2 (%) yolk3 (%) shell4 (%) albumen5 (%)
Genetic strainRoss 308 30.8 (75)6 8.8 (89) 16.4 (74) 8.3 (89) 55.8 (74)Cobb 500 30.5 (84) 8.8 (88) 16.2 (84) 8.3 (88) 56.2 (84)SEM 0.3 0.1 0.2 0.1 0.3
Flock ageYoung (29 wk) 25.8d (27) 8.7ab (30) 14.2c (27) 8.6ab (30) 61.7a (27)Peak (34 or 36 wk) 29.9c (23) 8.7ab (30) 15.3b (23) 8.5b (30) 56.5b (23)Postpeak (40 wk) 30.9bc (26) 9.0a (30) 15.5b (26) 9.0a (30) 55.4bc (26)Mature (45 wk) 32.2ab (26) 9.0a (28) 18.1a (25) 9.0a (28) 54.6cd (25)Old (55 wk) 32.0ab (28) 8.9ab (29) 16.2b (28) 7.4c (29) 54.1cd (28)Very old (59 wk) 33.3a (29) 8.6b (30) 18.4a (29) 7.2c (30) 53.6d (29)SEM 0.4 0.1 0.3 0.11 0.5
a–dMeans within a column lacking a common superscript differ (P ≤ 0.05).1Least squares means for (wet yolk weight/initial egg weight) × 100.2Least squares means for (wet shell weight/initial egg weight) × 100.3Least squares means for (dry yolk weight/initial egg weight) × 100.4Least squares means for (dry shell weight/initial egg weight) × 100.5Least squares means for [final egg weight − (wet yolk + wet shell)] × 100.6Number of observations.
thus metabolism and heat production, is eggshell conduc-tance. In a recent study, Wineland et al. (2006) investi-gated the effects of different incubator temperatures dur-ing late incubation on the intestinal maturation of em-bryos from eggs from broiler strains known to have eitherlow or high eggshell conductance. The results showedthat temperatures greater than 37°C during late incuba-tion were detrimental to intestinal maturation in broilerchicks, and that this negative effect was more pronouncedin embryos from eggs with low conductance.
Research has shown that metabolism is almost exclu-sively fueled by lipids and that every liter of O2 consumedby a chicken embryo is equivalent to the production of4.69 kcal of heat (Romanoff, 1967). Vleck and Vleck (1987)reported that typical O2 consumption of a chicken eggjust before internal pipping was approximately 570 mL/
Downloaded from https://academic.oup.com/ps/article-abstract/86/11/2420/1573678by gueston 01 April 2018
METABOLISM OF EMBRYOS FROM MODERN BROILER STRAINS 2423
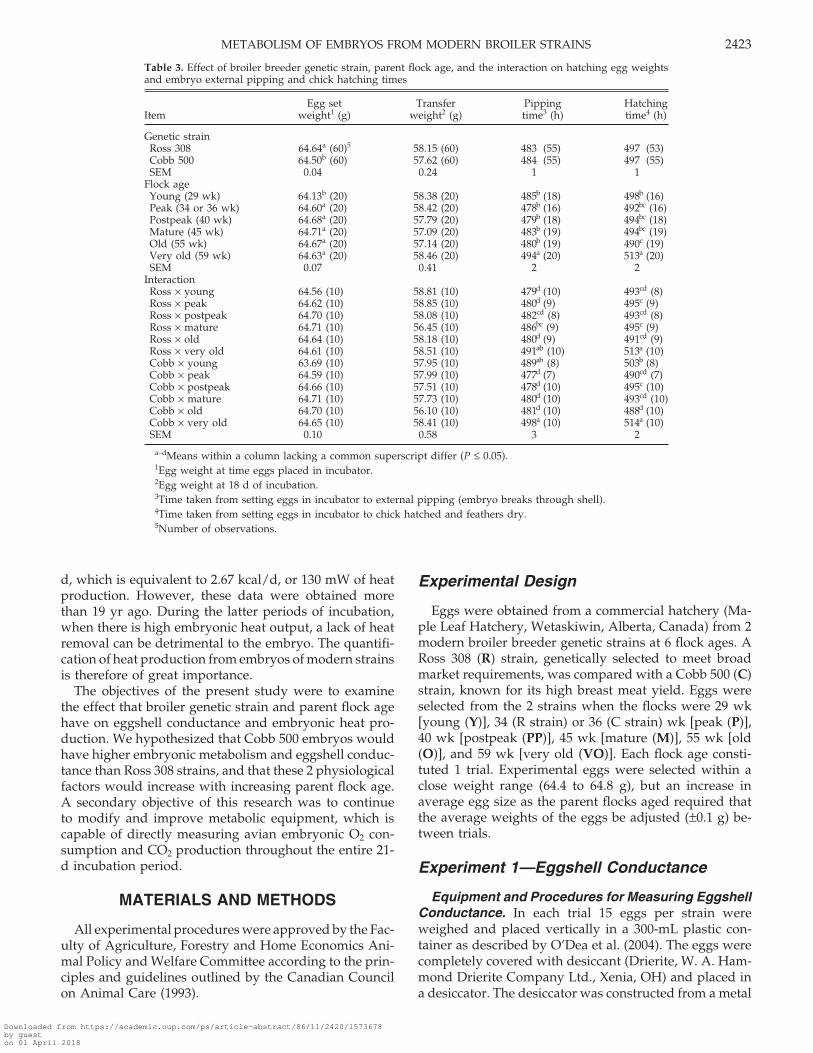
Table 3. Effect of broiler breeder genetic strain, parent flock age, and the interaction on hatching egg weightsand embryo external pipping and chick hatching times
Egg set Transfer Pipping HatchingItem weight1 (g) weight2 (g) time3 (h) time4 (h)
Genetic strainRoss 308 64.64a (60)5 58.15 (60) 483 (55) 497 (53)Cobb 500 64.50b (60) 57.62 (60) 484 (55) 497 (55)SEM 0.04 0.24 1 1
Flock ageYoung (29 wk) 64.13b (20) 58.38 (20) 485b (18) 498b (16)Peak (34 or 36 wk) 64.60a (20) 58.42 (20) 478b (16) 492bc (16)Postpeak (40 wk) 64.68a (20) 57.79 (20) 479b (18) 494bc (18)Mature (45 wk) 64.71a (20) 57.09 (20) 483b (19) 494bc (19)Old (55 wk) 64.67a (20) 57.14 (20) 480b (19) 490c (19)Very old (59 wk) 64.63a (20) 58.46 (20) 494a (20) 513a (20)SEM 0.07 0.41 2 2
InteractionRoss × young 64.56 (10) 58.81 (10) 479d (10) 493cd (8)Ross × peak 64.62 (10) 58.85 (10) 480d (9) 495c (9)Ross × postpeak 64.70 (10) 58.08 (10) 482cd (8) 493cd (8)Ross × mature 64.71 (10) 56.45 (10) 486bc (9) 495c (9)Ross × old 64.64 (10) 58.18 (10) 480d (9) 491cd (9)Ross × very old 64.61 (10) 58.51 (10) 491ab (10) 513a (10)Cobb × young 63.69 (10) 57.95 (10) 489ab (8) 503b (8)Cobb × peak 64.59 (10) 57.99 (10) 477d (7) 490cd (7)Cobb × postpeak 64.66 (10) 57.51 (10) 478d (10) 495c (10)Cobb × mature 64.71 (10) 57.73 (10) 480d (10) 493cd (10)Cobb × old 64.70 (10) 56.10 (10) 481d (10) 488d (10)Cobb × very old 64.65 (10) 58.41 (10) 498a (10) 514a (10)SEM 0.10 0.58 3 2
a–dMeans within a column lacking a common superscript differ (P ≤ 0.05).1Egg weight at time eggs placed in incubator.2Egg weight at 18 d of incubation.3Time taken from setting eggs in incubator to external pipping (embryo breaks through shell).4Time taken from setting eggs in incubator to chick hatched and feathers dry.5Number of observations.
d, which is equivalent to 2.67 kcal/d, or 130 mW of heatproduction. However, these data were obtained morethan 19 yr ago. During the latter periods of incubation,when there is high embryonic heat output, a lack of heatremoval can be detrimental to the embryo. The quantifi-cation of heat production from embryos of modern strainsis therefore of great importance.
The objectives of the present study were to examinethe effect that broiler genetic strain and parent flock agehave on eggshell conductance and embryonic heat pro-duction. We hypothesized that Cobb 500 embryos wouldhave higher embryonic metabolism and eggshell conduc-tance than Ross 308 strains, and that these 2 physiologicalfactors would increase with increasing parent flock age.A secondary objective of this research was to continueto modify and improve metabolic equipment, which iscapable of directly measuring avian embryonic O2 con-sumption and CO2 production throughout the entire 21-d incubation period.
MATERIALS AND METHODS
All experimental procedures were approved by the Fac-ulty of Agriculture, Forestry and Home Economics Ani-mal Policy and Welfare Committee according to the prin-ciples and guidelines outlined by the Canadian Councilon Animal Care (1993).
Experimental Design
Eggs were obtained from a commercial hatchery (Ma-ple Leaf Hatchery, Wetaskiwin, Alberta, Canada) from 2modern broiler breeder genetic strains at 6 flock ages. ARoss 308 (R) strain, genetically selected to meet broadmarket requirements, was compared with a Cobb 500 (C)strain, known for its high breast meat yield. Eggs wereselected from the 2 strains when the flocks were 29 wk[young (Y)], 34 (R strain) or 36 (C strain) wk [peak (P)],40 wk [postpeak (PP)], 45 wk [mature (M)], 55 wk [old(O)], and 59 wk [very old (VO)]. Each flock age consti-tuted 1 trial. Experimental eggs were selected within aclose weight range (64.4 to 64.8 g), but an increase inaverage egg size as the parent flocks aged required thatthe average weights of the eggs be adjusted (±0.1 g) be-tween trials.
Experiment 1—Eggshell Conductance
Equipment and Procedures for Measuring EggshellConductance. In each trial 15 eggs per strain wereweighed and placed vertically in a 300-mL plastic con-tainer as described by O’Dea et al. (2004). The eggs werecompletely covered with desiccant (Drierite, W. A. Ham-mond Drierite Company Ltd., Xenia, OH) and placed ina desiccator. The desiccator was constructed from a metal
Downloaded from https://academic.oup.com/ps/article-abstract/86/11/2420/1573678by gueston 01 April 2018
HAMIDU ET AL.2424
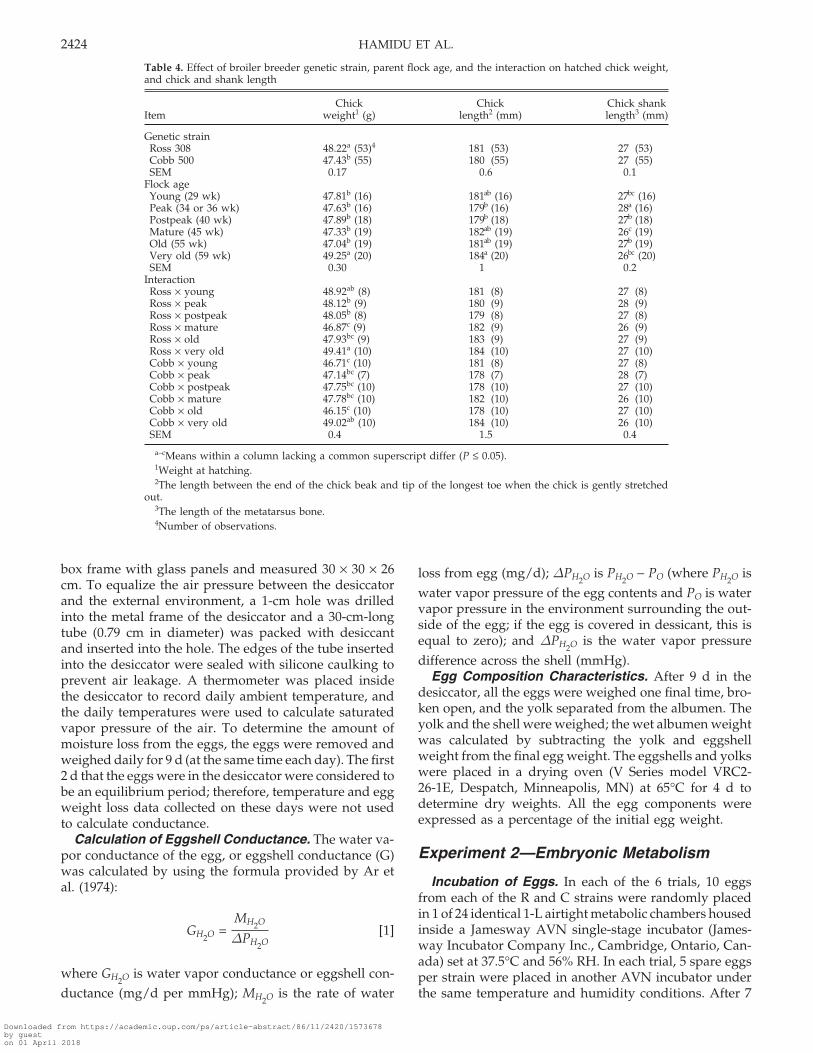
Table 4. Effect of broiler breeder genetic strain, parent flock age, and the interaction on hatched chick weight,and chick and shank length
Chick Chick Chick shankItem weight1 (g) length2 (mm) length3 (mm)
Genetic strainRoss 308 48.22a (53)4 181 (53) 27 (53)Cobb 500 47.43b (55) 180 (55) 27 (55)SEM 0.17 0.6 0.1
Flock ageYoung (29 wk) 47.81b (16) 181ab (16) 27bc (16)Peak (34 or 36 wk) 47.63b (16) 179b (16) 28a (16)Postpeak (40 wk) 47.89b (18) 179b (18) 27b (18)Mature (45 wk) 47.33b (19) 182ab (19) 26c (19)Old (55 wk) 47.04b (19) 181ab (19) 27b (19)Very old (59 wk) 49.25a (20) 184a (20) 26bc (20)SEM 0.30 1 0.2
InteractionRoss × young 48.92ab (8) 181 (8) 27 (8)Ross × peak 48.12b (9) 180 (9) 28 (9)Ross × postpeak 48.05b (8) 179 (8) 27 (8)Ross × mature 46.87c (9) 182 (9) 26 (9)Ross × old 47.93bc (9) 183 (9) 27 (9)Ross × very old 49.41a (10) 184 (10) 27 (10)Cobb × young 46.71c (10) 181 (8) 27 (8)Cobb × peak 47.14bc (7) 178 (7) 28 (7)Cobb × postpeak 47.75bc (10) 178 (10) 27 (10)Cobb × mature 47.78bc (10) 182 (10) 26 (10)Cobb × old 46.15c (10) 178 (10) 27 (10)Cobb × very old 49.02ab (10) 184 (10) 26 (10)SEM 0.4 1.5 0.4
a–cMeans within a column lacking a common superscript differ (P ≤ 0.05).1Weight at hatching.2The length between the end of the chick beak and tip of the longest toe when the chick is gently stretched
out.3The length of the metatarsus bone.4Number of observations.
box frame with glass panels and measured 30 × 30 × 26cm. To equalize the air pressure between the desiccatorand the external environment, a 1-cm hole was drilledinto the metal frame of the desiccator and a 30-cm-longtube (0.79 cm in diameter) was packed with desiccantand inserted into the hole. The edges of the tube insertedinto the desiccator were sealed with silicone caulking toprevent air leakage. A thermometer was placed insidethe desiccator to record daily ambient temperature, andthe daily temperatures were used to calculate saturatedvapor pressure of the air. To determine the amount ofmoisture loss from the eggs, the eggs were removed andweighed daily for 9 d (at the same time each day). The first2 d that the eggs were in the desiccator were considered tobe an equilibrium period; therefore, temperature and eggweight loss data collected on these days were not usedto calculate conductance.
Calculation of Eggshell Conductance. The water va-por conductance of the egg, or eggshell conductance (G)was calculated by using the formula provided by Ar etal. (1974):
GH2O =MH2O
∆PH2O[1]
where GH2O is water vapor conductance or eggshell con-ductance (mg/d per mmHg); MH2O is the rate of water
loss from egg (mg/d); ∆PH2O is PH2O − PO (where PH2O iswater vapor pressure of the egg contents and PO is watervapor pressure in the environment surrounding the out-side of the egg; if the egg is covered in dessicant, this isequal to zero); and ∆PH2O is the water vapor pressuredifference across the shell (mmHg).
Egg Composition Characteristics. After 9 d in thedesiccator, all the eggs were weighed one final time, bro-ken open, and the yolk separated from the albumen. Theyolk and the shell were weighed; the wet albumen weightwas calculated by subtracting the yolk and eggshellweight from the final egg weight. The eggshells and yolkswere placed in a drying oven (V Series model VRC2-26-1E, Despatch, Minneapolis, MN) at 65°C for 4 d todetermine dry weights. All the egg components wereexpressed as a percentage of the initial egg weight.
Experiment 2—Embryonic Metabolism
Incubation of Eggs. In each of the 6 trials, 10 eggsfrom each of the R and C strains were randomly placedin 1 of 24 identical 1-L airtight metabolic chambers housedinside a Jamesway AVN single-stage incubator (James-way Incubator Company Inc., Cambridge, Ontario, Can-ada) set at 37.5°C and 56% RH. In each trial, 5 spare eggsper strain were placed in another AVN incubator underthe same temperature and humidity conditions. After 7
Downloaded from https://academic.oup.com/ps/article-abstract/86/11/2420/1573678by gueston 01 April 2018
METABOLISM OF EMBRYOS FROM MODERN BROILER STRAINS 2425
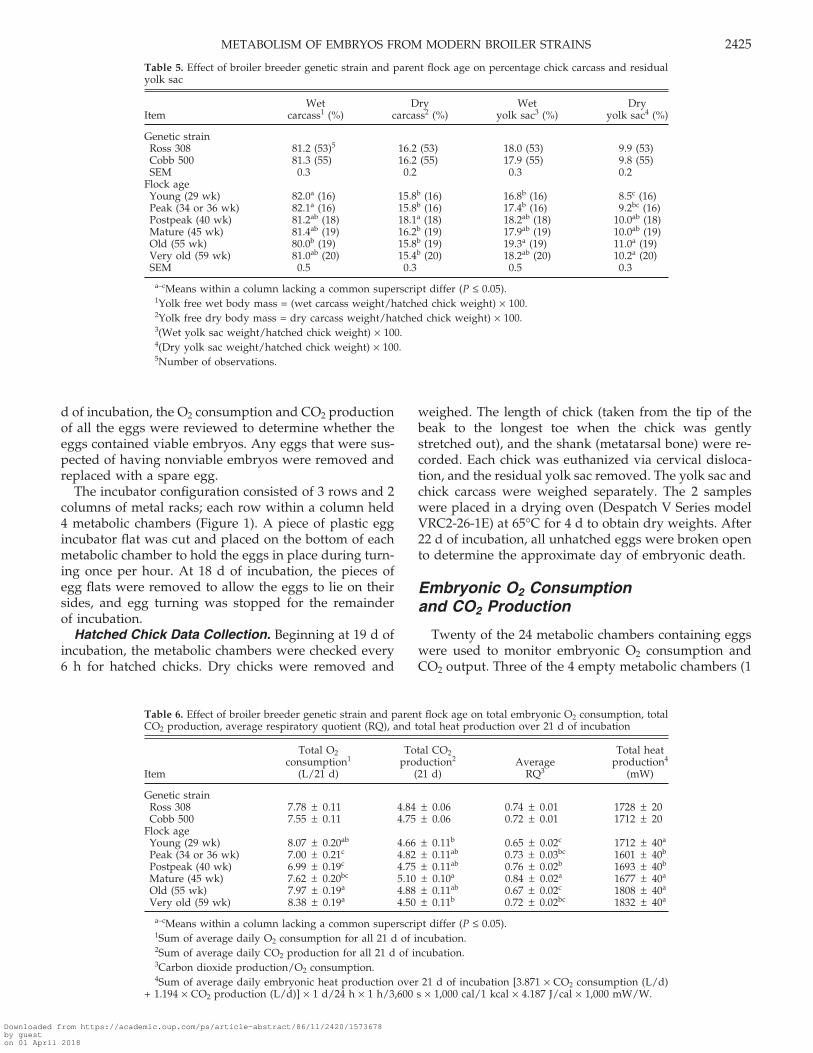
Table 5. Effect of broiler breeder genetic strain and parent flock age on percentage chick carcass and residualyolk sac
Wet Dry Wet DryItem carcass1 (%) carcass2 (%) yolk sac3 (%) yolk sac4 (%)
Genetic strainRoss 308 81.2 (53)5 16.2 (53) 18.0 (53) 9.9 (53)Cobb 500 81.3 (55) 16.2 (55) 17.9 (55) 9.8 (55)SEM 0.3 0.2 0.3 0.2
Flock ageYoung (29 wk) 82.0a (16) 15.8b (16) 16.8b (16) 8.5c (16)Peak (34 or 36 wk) 82.1a (16) 15.8b (16) 17.4b (16) 9.2bc (16)Postpeak (40 wk) 81.2ab (18) 18.1a (18) 18.2ab (18) 10.0ab (18)Mature (45 wk) 81.4ab (19) 16.2b (19) 17.9ab (19) 10.0ab (19)Old (55 wk) 80.0b (19) 15.8b (19) 19.3a (19) 11.0a (19)Very old (59 wk) 81.0ab (20) 15.4b (20) 18.2ab (20) 10.2a (20)SEM 0.5 0.3 0.5 0.3
a–cMeans within a column lacking a common superscript differ (P ≤ 0.05).1Yolk free wet body mass = (wet carcass weight/hatched chick weight) × 100.2Yolk free dry body mass = dry carcass weight/hatched chick weight) × 100.3(Wet yolk sac weight/hatched chick weight) × 100.4(Dry yolk sac weight/hatched chick weight) × 100.5Number of observations.
d of incubation, the O2 consumption and CO2 productionof all the eggs were reviewed to determine whether theeggs contained viable embryos. Any eggs that were sus-pected of having nonviable embryos were removed andreplaced with a spare egg.
The incubator configuration consisted of 3 rows and 2columns of metal racks; each row within a column held4 metabolic chambers (Figure 1). A piece of plastic eggincubator flat was cut and placed on the bottom of eachmetabolic chamber to hold the eggs in place during turn-ing once per hour. At 18 d of incubation, the pieces ofegg flats were removed to allow the eggs to lie on theirsides, and egg turning was stopped for the remainderof incubation.
Hatched Chick Data Collection. Beginning at 19 d ofincubation, the metabolic chambers were checked every6 h for hatched chicks. Dry chicks were removed and
Table 6. Effect of broiler breeder genetic strain and parent flock age on total embryonic O2 consumption, totalCO2 production, average respiratory quotient (RQ), and total heat production over 21 d of incubation
Total O2 Total CO2 Total heatconsumption1 production2 Average production4
Item (L/21 d) (21 d) RQ3 (mW)
Genetic strainRoss 308 7.78 ± 0.11 4.84 ± 0.06 0.74 ± 0.01 1728 ± 20Cobb 500 7.55 ± 0.11 4.75 ± 0.06 0.72 ± 0.01 1712 ± 20
Flock ageYoung (29 wk) 8.07 ± 0.20ab 4.66 ± 0.11b 0.65 ± 0.02c 1712 ± 40a
Peak (34 or 36 wk) 7.00 ± 0.21c 4.82 ± 0.11ab 0.73 ± 0.03bc 1601 ± 40b
Postpeak (40 wk) 6.99 ± 0.19c 4.75 ± 0.11ab 0.76 ± 0.02b 1693 ± 40b
Mature (45 wk) 7.62 ± 0.20bc 5.10 ± 0.10a 0.84 ± 0.02a 1677 ± 40a
Old (55 wk) 7.97 ± 0.19a 4.88 ± 0.11ab 0.67 ± 0.02c 1808 ± 40a
Very old (59 wk) 8.38 ± 0.19a 4.50 ± 0.11b 0.72 ± 0.02bc 1832 ± 40a
a–cMeans within a column lacking a common superscript differ (P ≤ 0.05).1Sum of average daily O2 consumption for all 21 d of incubation.2Sum of average daily CO2 production for all 21 d of incubation.3Carbon dioxide production/O2 consumption.4Sum of average daily embryonic heat production over 21 d of incubation [3.871 × CO2 consumption (L/d)
+ 1.194 × CO2 production (L/d)] × 1 d/24 h × 1 h/3,600 s × 1,000 cal/1 kcal × 4.187 J/cal × 1,000 mW/W.
weighed. The length of chick (taken from the tip of thebeak to the longest toe when the chick was gentlystretched out), and the shank (metatarsal bone) were re-corded. Each chick was euthanized via cervical disloca-tion, and the residual yolk sac removed. The yolk sac andchick carcass were weighed separately. The 2 sampleswere placed in a drying oven (Despatch V Series modelVRC2-26-1E) at 65°C for 4 d to obtain dry weights. After22 d of incubation, all unhatched eggs were broken opento determine the approximate day of embryonic death.
Embryonic O2 Consumptionand CO2 Production
Twenty of the 24 metabolic chambers containing eggswere used to monitor embryonic O2 consumption andCO2 output. Three of the 4 empty metabolic chambers (1
Downloaded from https://academic.oup.com/ps/article-abstract/86/11/2420/1573678by gueston 01 April 2018
HAMIDU ET AL.2426
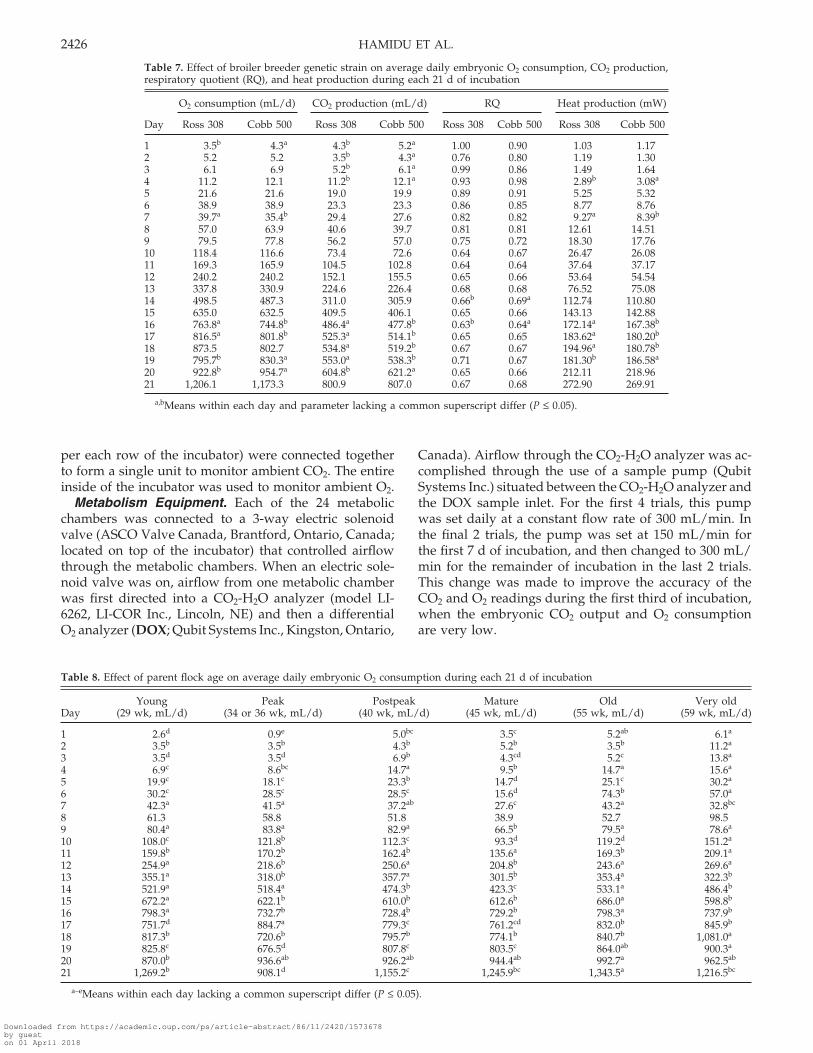
Table 7. Effect of broiler breeder genetic strain on average daily embryonic O2 consumption, CO2 production,respiratory quotient (RQ), and heat production during each 21 d of incubation
O2 consumption (mL/d) CO2 production (mL/d) RQ Heat production (mW)
Day Ross 308 Cobb 500 Ross 308 Cobb 500 Ross 308 Cobb 500 Ross 308 Cobb 500
1 3.5b 4.3a 4.3b 5.2a 1.00 0.90 1.03 1.172 5.2 5.2 3.5b 4.3a 0.76 0.80 1.19 1.303 6.1 6.9 5.2b 6.1a 0.99 0.86 1.49 1.644 11.2 12.1 11.2b 12.1a 0.93 0.98 2.89b 3.08a
5 21.6 21.6 19.0 19.9 0.89 0.91 5.25 5.326 38.9 38.9 23.3 23.3 0.86 0.85 8.77 8.767 39.7a 35.4b 29.4 27.6 0.82 0.82 9.27a 8.39b
8 57.0 63.9 40.6 39.7 0.81 0.81 12.61 14.519 79.5 77.8 56.2 57.0 0.75 0.72 18.30 17.7610 118.4 116.6 73.4 72.6 0.64 0.67 26.47 26.0811 169.3 165.9 104.5 102.8 0.64 0.64 37.64 37.1712 240.2 240.2 152.1 155.5 0.65 0.66 53.64 54.5413 337.8 330.9 224.6 226.4 0.68 0.68 76.52 75.0814 498.5 487.3 311.0 305.9 0.66b 0.69a 112.74 110.8015 635.0 632.5 409.5 406.1 0.65 0.66 143.13 142.8816 763.8a 744.8b 486.4a 477.8b 0.63b 0.64a 172.14a 167.38b
17 816.5a 801.8b 525.3a 514.1b 0.65 0.65 183.62a 180.20b
18 873.5 802.7 534.8a 519.2b 0.67 0.67 194.96a 180.78b
19 795.7b 830.3a 553.0a 538.3b 0.71 0.67 181.30b 186.58a
20 922.8b 954.7a 604.8b 621.2a 0.65 0.66 212.11 218.9621 1,206.1 1,173.3 800.9 807.0 0.67 0.68 272.90 269.91
a,bMeans within each day and parameter lacking a common superscript differ (P ≤ 0.05).
per each row of the incubator) were connected togetherto form a single unit to monitor ambient CO2. The entireinside of the incubator was used to monitor ambient O2.
Metabolism Equipment. Each of the 24 metabolicchambers was connected to a 3-way electric solenoidvalve (ASCO Valve Canada, Brantford, Ontario, Canada;located on top of the incubator) that controlled airflowthrough the metabolic chambers. When an electric sole-noid valve was on, airflow from one metabolic chamberwas first directed into a CO2-H2O analyzer (model LI-6262, LI-COR Inc., Lincoln, NE) and then a differentialO2 analyzer (DOX; Qubit Systems Inc., Kingston, Ontario,
Table 8. Effect of parent flock age on average daily embryonic O2 consumption during each 21 d of incubation
Young Peak Postpeak Mature Old Very oldDay (29 wk, mL/d) (34 or 36 wk, mL/d) (40 wk, mL/d) (45 wk, mL/d) (55 wk, mL/d) (59 wk, mL/d)
1 2.6d 0.9e 5.0bc 3.5c 5.2ab 6.1a
2 3.5b 3.5b 4.3b 5.2b 3.5b 11.2a
3 3.5d 3.5d 6.9b 4.3cd 5.2c 13.8a
4 6.9c 8.6bc 14.7a 9.5b 14.7a 15.6a
5 19.9c 18.1c 23.3b 14.7d 25.1c 30.2a
6 30.2c 28.5c 28.5c 15.6d 74.3b 57.0a
7 42.3a 41.5a 37.2ab 27.6c 43.2a 32.8bc
8 61.3 58.8 51.8 38.9 52.7 98.59 80.4a 83.8a 82.9a 66.5b 79.5a 78.6a
10 108.0c 121.8b 112.3c 93.3d 119.2d 151.2a
11 159.8b 170.2b 162.4b 135.6a 169.3b 209.1a
12 254.9a 218.6b 250.6a 204.8b 243.6a 269.6a
13 355.1a 318.0b 357.7a 301.5b 353.4a 322.3b
14 521.9a 518.4a 474.3b 423.3c 533.1a 486.4b
15 672.2a 622.1b 610.0b 612.6b 686.0a 598.8b
16 798.3a 732.7b 728.4b 729.2b 798.3a 737.9b
17 751.7d 884.7a 779.3c 761.2cd 832.0b 845.9b
18 817.3b 720.6b 795.7b 774.1b 840.7b 1,081.0a
19 825.8c 676.5d 807.8c 803.5c 864.0ab 900.3a
20 870.0b 936.6ab 926.2ab 944.4ab 992.7a 962.5ab
21 1,269.2b 908.1d 1,155.2c 1,245.9bc 1,343.5a 1,216.5bc
a–eMeans within each day lacking a common superscript differ (P ≤ 0.05).
Canada). Airflow through the CO2-H2O analyzer was ac-complished through the use of a sample pump (QubitSystems Inc.) situated between the CO2-H2O analyzer andthe DOX sample inlet. For the first 4 trials, this pumpwas set daily at a constant flow rate of 300 mL/min. Inthe final 2 trials, the pump was set at 150 mL/min forthe first 7 d of incubation, and then changed to 300 mL/min for the remainder of incubation in the last 2 trials.This change was made to improve the accuracy of theCO2 and O2 readings during the first third of incubation,when the embryonic CO2 output and O2 consumptionare very low.
Downloaded from https://academic.oup.com/ps/article-abstract/86/11/2420/1573678by gueston 01 April 2018
METABOLISM OF EMBRYOS FROM MODERN BROILER STRAINS 2427
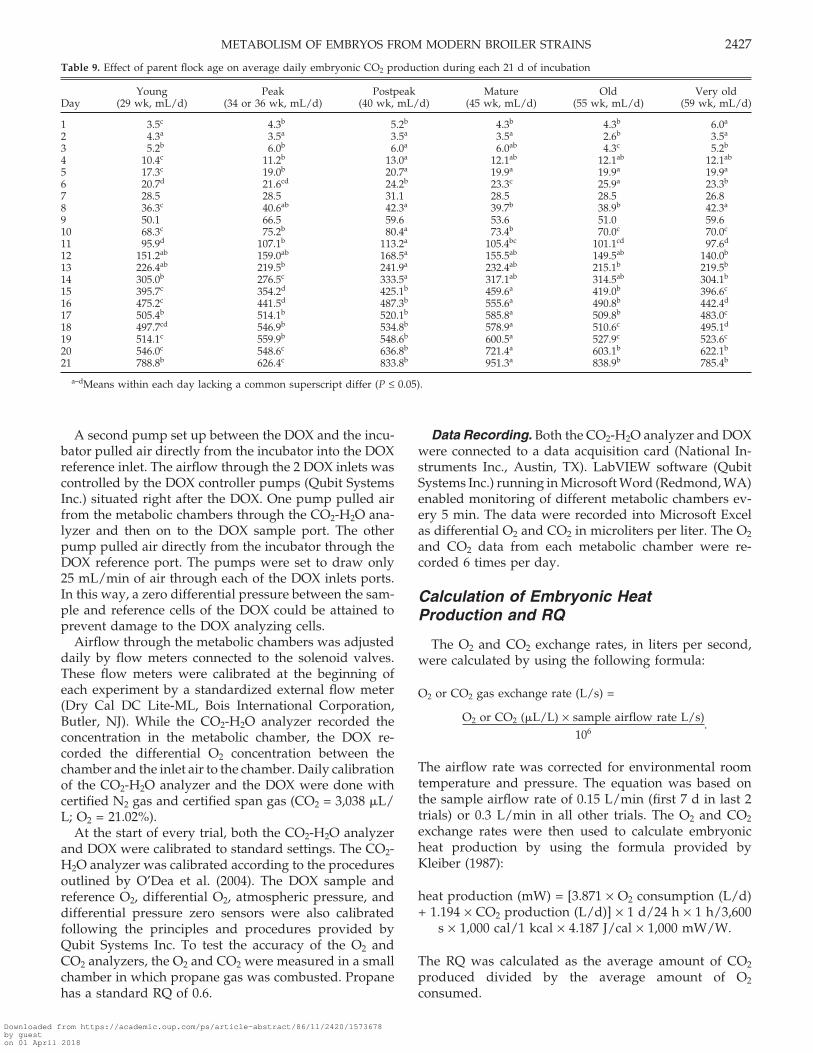
Table 9. Effect of parent flock age on average daily embryonic CO2 production during each 21 d of incubation
Young Peak Postpeak Mature Old Very oldDay (29 wk, mL/d) (34 or 36 wk, mL/d) (40 wk, mL/d) (45 wk, mL/d) (55 wk, mL/d) (59 wk, mL/d)
1 3.5c 4.3b 5.2b 4.3b 4.3b 6.0a
2 4.3a 3.5a 3.5a 3.5a 2.6b 3.5a
3 5.2b 6.0b 6.0a 6.0ab 4.3c 5.2b
4 10.4c 11.2b 13.0a 12.1ab 12.1ab 12.1ab
5 17.3c 19.0b 20.7a 19.9a 19.9a 19.9a
6 20.7d 21.6cd 24.2b 23.3c 25.9a 23.3b
7 28.5 28.5 31.1 28.5 28.5 26.88 36.3c 40.6ab 42.3a 39.7b 38.9b 42.3a
9 50.1 66.5 59.6 53.6 51.0 59.610 68.3c 75.2b 80.4a 73.4b 70.0c 70.0c
11 95.9d 107.1b 113.2a 105.4bc 101.1cd 97.6d
12 151.2ab 159.0ab 168.5a 155.5ab 149.5ab 140.0b
13 226.4ab 219.5b 241.9a 232.4ab 215.1b 219.5b
14 305.0b 276.5c 333.5a 317.1ab 314.5ab 304.1b
15 395.7c 354.2d 425.1b 459.6a 419.0b 396.6c
16 475.2c 441.5d 487.3b 555.6a 490.8b 442.4d
17 505.4b 514.1b 520.1b 585.8a 509.8b 483.0c
18 497.7cd 546.9b 534.8b 578.9a 510.6c 495.1d
19 514.1c 559.9b 548.6b 600.5a 527.9c 523.6c
20 546.0c 548.6c 636.8b 721.4a 603.1b 622.1b
21 788.8b 626.4c 833.8b 951.3a 838.9b 785.4b
a–dMeans within each day lacking a common superscript differ (P ≤ 0.05).
A second pump set up between the DOX and the incu-bator pulled air directly from the incubator into the DOXreference inlet. The airflow through the 2 DOX inlets wascontrolled by the DOX controller pumps (Qubit SystemsInc.) situated right after the DOX. One pump pulled airfrom the metabolic chambers through the CO2-H2O ana-lyzer and then on to the DOX sample port. The otherpump pulled air directly from the incubator through theDOX reference port. The pumps were set to draw only25 mL/min of air through each of the DOX inlets ports.In this way, a zero differential pressure between the sam-ple and reference cells of the DOX could be attained toprevent damage to the DOX analyzing cells.
Airflow through the metabolic chambers was adjusteddaily by flow meters connected to the solenoid valves.These flow meters were calibrated at the beginning ofeach experiment by a standardized external flow meter(Dry Cal DC Lite-ML, Bois International Corporation,Butler, NJ). While the CO2-H2O analyzer recorded theconcentration in the metabolic chamber, the DOX re-corded the differential O2 concentration between thechamber and the inlet air to the chamber. Daily calibrationof the CO2-H2O analyzer and the DOX were done withcertified N2 gas and certified span gas (CO2 = 3,038 �L/L; O2 = 21.02%).
At the start of every trial, both the CO2-H2O analyzerand DOX were calibrated to standard settings. The CO2-H2O analyzer was calibrated according to the proceduresoutlined by O’Dea et al. (2004). The DOX sample andreference O2, differential O2, atmospheric pressure, anddifferential pressure zero sensors were also calibratedfollowing the principles and procedures provided byQubit Systems Inc. To test the accuracy of the O2 andCO2 analyzers, the O2 and CO2 were measured in a smallchamber in which propane gas was combusted. Propanehas a standard RQ of 0.6.
Data Recording. Both the CO2-H2O analyzer and DOXwere connected to a data acquisition card (National In-struments Inc., Austin, TX). LabVIEW software (QubitSystems Inc.) running in Microsoft Word (Redmond, WA)enabled monitoring of different metabolic chambers ev-ery 5 min. The data were recorded into Microsoft Excelas differential O2 and CO2 in microliters per liter. The O2
and CO2 data from each metabolic chamber were re-corded 6 times per day.
Calculation of Embryonic HeatProduction and RQ
The O2 and CO2 exchange rates, in liters per second,were calculated by using the following formula:
O2 or CO2 gas exchange rate (L/s) =
O2 or CO2 (�L/L) × sample airflow rate L/s)106
.
The airflow rate was corrected for environmental roomtemperature and pressure. The equation was based onthe sample airflow rate of 0.15 L/min (first 7 d in last 2trials) or 0.3 L/min in all other trials. The O2 and CO2
exchange rates were then used to calculate embryonicheat production by using the formula provided byKleiber (1987):
heat production (mW) = [3.871 × O2 consumption (L/d)+ 1.194 × CO2 production (L/d)] × 1 d/24 h × 1 h/3,600
s × 1,000 cal/1 kcal × 4.187 J/cal × 1,000 mW/W.
The RQ was calculated as the average amount of CO2
produced divided by the average amount of O2
consumed.
Downloaded from https://academic.oup.com/ps/article-abstract/86/11/2420/1573678by gueston 01 April 2018
HAMIDU ET AL.2428
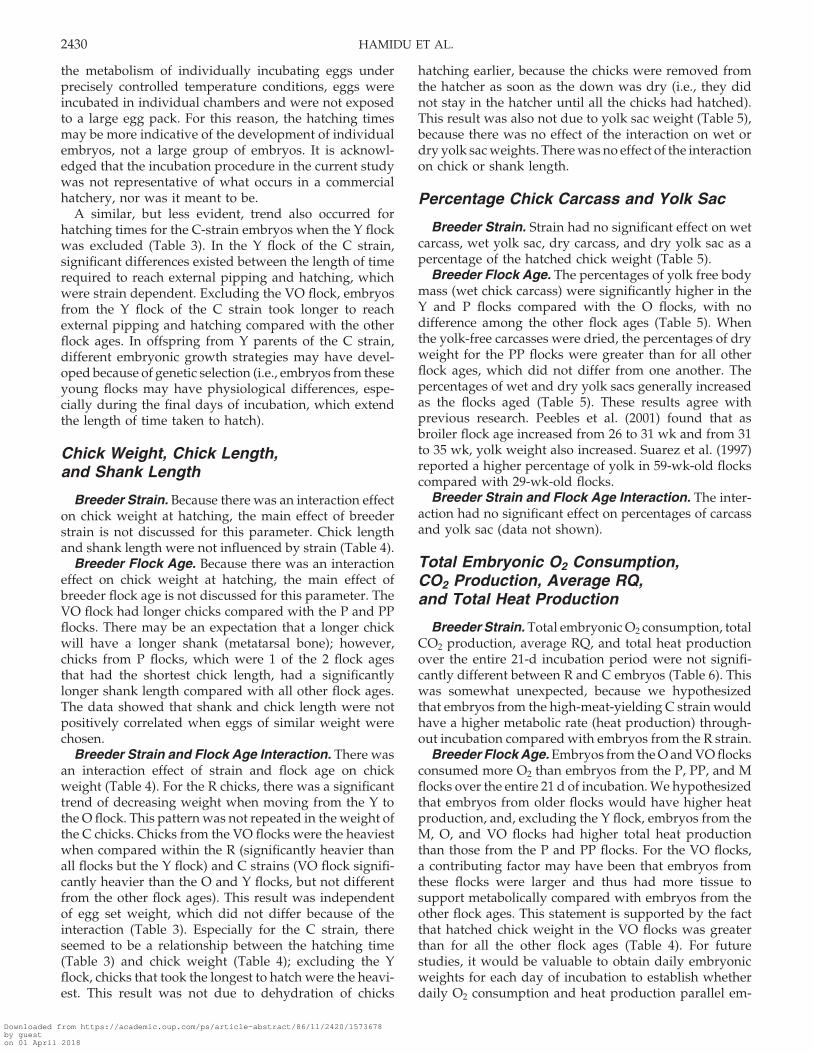
Statistical Analysis
Although O2 consumption, CO2 production, and calcu-lated heat production were recorded as repeated mea-sures (6 readings taken per day), they were analyzed ina single dependent data file with the generalized linearmodel procedure of SAS (SAS Institute, 2005), and meansare expressed as least squares means. Eggshell conduc-tance and egg composition, time taken to externally pipand hatch, wet and dry yolk sac, and chick carcass weightswere analyzed as a 2 × 6 factorial design of the generalizedlinear model of SAS, and means are expressed as leastsquares means. Where significant differences were ob-served, least squares means were separated by the PDIFFprocedure of SAS at P < 0.05.
RESULTS AND DISCUSSION
Experiment 1: Egg Weightand Eggshell Conductance
Breeder Strain. Genetic strain did not influence initialegg weight or final egg weight (Table 1). Because eggweights were selected within a very tight weight range,this result was expected. Eggshell conductance was alsonot influenced by strain, thus showing that in these 2strains when egg weights are the same, there was noeffect of genetic selection on conductance. This finding isin agreement with the study of O’Dea et al. (2004), whofound no differences in eggshell conductance amongmodern high-yielding strains, a modern strain selectedfor the whole bird market, and a broiler strain that hasremained unselected since 1978.
Breeder Flock Age. Initial egg weight was signifi-cantly lower in eggs obtained from Y parents comparedwith other breeder parent ages, even though eggs wereselected to have the same average weight at each flockage (Table 1). Although the lower egg weight observedin the Y flocks was statistically different, it is unlikelythat such a small difference would have any biologicaleffect. Final egg weight and eggshell conductance werenot influenced by flock age. This is in contrast to previousresults showing that eggs from a 37-wk-old parent flockhad higher conductance compared with eggs from eithera 45- or 53-wk-old flock, which did not differ from oneanother (O’Dea et al., 2004).
Breeder Strain and Flock Age Interaction. There wasno effect of the interaction of strain and age on initial andfinal weights or eggshell conductance (data not shown).
Percentage of Egg Components
Breeder Strain. Genetic strain did not significantly af-fect the wet or dry yolk, wet albumen, or wet or dry shellweights as a percentage of the initial egg weight (Table2). This was a result of maintaining egg weights withina tight weight range for both strains.
Breeder Flock Age. As flock age increased, there wasa general trend for the percentage of wet and dry yolk
weights to increase (Table 2). This was expected becauseprevious research has shown that the proportion of yolkincreases with parent flock age (Peebles et al., 2000).
In contrast, the percentage of wet albumen content de-creased with increasing breeder flock age (Table 2). Thiswas previously demonstrated by Ahn et al. (1997), whoshowed that the lowest yolk:albumen ratio was in eggsproduced by 28-wk-old hens and the highest ratio wasin eggs produced by 55- and 78-wk-old hens. Peebles etal. (2000) also found significantly higher yolk:albumenratios as the parent flock aged.
There was no clear pattern with respect to percentageof wet shell weight, but O and VO flocks had lower per-centages of dry shell weights than all other breeder flockages (Table 2). This was an anticipated result based onprevious research indicating that eggshell weight de-creases as flock age increases (Fletcher et al., 1981).
Breeder Strain and Flock Age Interaction. There wasno effect of the interaction of strain and age on the percent-age of egg components (data not shown).
Experiment 2: Egg Set and TransferWeights, and External Pippingand Hatching Times
Breeder Strain. Average egg weight at setting for theeggs placed into metabolic chambers was significantlyhigher in the R strain than the C strain (Table 3). Thiswas unexpected because eggs were specifically selectedto be the same in weight range. By the time of transfer,the weight difference between the 2 strains was erased.Because there was an interaction effect on external pip-ping and hatching times, the main effect of strain is notdiscussed for these variables.
Breeder Flock Age. Table 3 shows that the averageegg weight when the eggs were placed into the metabolicchambers was significantly lower in the Y flocks com-pared with all other flock ages; however, this differencewas not evident by the time of transfer. Because therewas an interaction effect on external pipping and hatchingtimes, the main effect of flock age is not discussed forthese parameters.
Breeder Strain and Flock Age Interaction. Both eggweight at setting and weight at transfer were not affectedby the interaction of strain and flock age (Table 3). Forthe interaction, there was a trend of increasing time takento reach external pipping as the flocks aged. This resultwas exclusive of the O flocks in the R strain and the Yflocks in the C strain, which did not follow this pattern.Eggshell temperatures, as well as incubator temperatures,were measured on all the eggs in the metabolic chambersfor each flock age (data not shown). Neither shell norincubator temperatures were significantly different be-tween the strains or among the flock ages, indicating thatthe different pipping patterns shown by Y flocks in theC strain and O flocks in the R strain were not due to avariation in incubation temperatures. An explanation forthe differences in pipping time in these 2 strain and flock
Downloaded from https://academic.oup.com/ps/article-abstract/86/11/2420/1573678by gueston 01 April 2018
METABOLISM OF EMBRYOS FROM MODERN BROILER STRAINS 2429
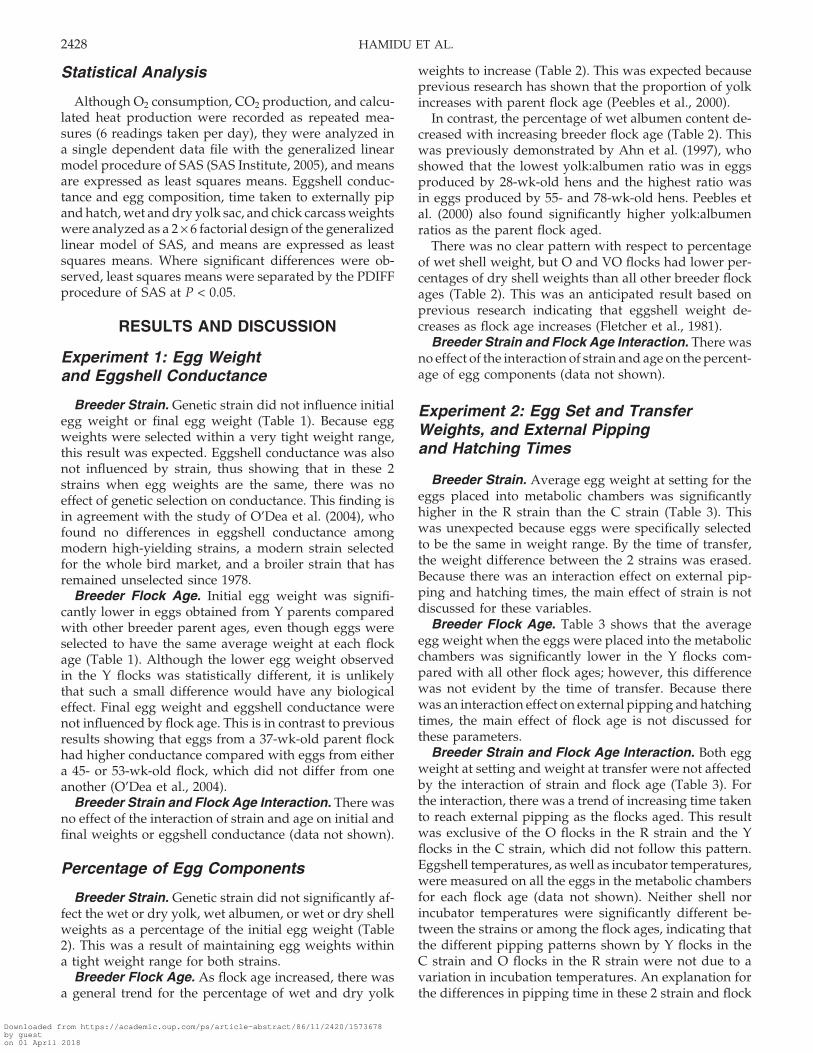
Table 10. Effect of parent flock age on average daily embryonic heat production during each 21 d of incubation
Young Peak Postpeak Mature Old Very oldDay (29 wk, mW) (34 or 36 wk, mW) (40 wk, mW) (45 wk, mW) (55 wk, mW) (59 wk, mW)
1 0.67c 0.52c 1.27ab 1.09b 1.41ab 1.63a
2 0.91b 0.99b 1.11b 1.21b 0.90b 2.36a
3 1.06d 1.12c 1.68b 1.32c 1.32c 2.90a
4 1.97c 2.31c 3.53a 2.61b 3.58a 3.90a
5 4.87c 4.49c 5.59b 3.92d 5.99b 6.85a
6 7.13c 6.67c 6.83c 4.37d 15.46a 12.12b
7 9.82a 9.42a 8.81ab 6.93c 9.92b 8.07b
8 13.76a 13.40a 12.30a 9.65a 12.17a 21.86a
9 18.03a 18.97a 19.19a 15.67b 18.02a 18.30a
10 24.33c 27.18b 25.77bc 21.78d 26.53b 32.06a
11 35.62b 38.11b 37.18b 31.45c 37.10b 44.95a
12 57.60a 50.24b 56.76a 47.39b 54.36a 58.20a
13 78.54a 70.06b 81.21a 69.95b 78.82a 76.21ab
14 115.74ab 121.44a 108.39b 97.88c 118.25a 108.92a
15 149.51a 138.61b 139.17b 141.52b 152.98a 136.25b
16 177.31a 163.28c 164.86c 171.02b 178.21a 163.91c
17 170.33d 195.87a 176.45c 176.80c 185.72b 186.30b
18 182.35bc 167.03d 180.18c 178.77c 187.43b 231.45a
19 184.95b 157.72c 183.42b 185.59b 192.65ab 199.32a
20 194.74c 207.26b 210.96b 219.16b 221.17b 239.91a
21 282.74b 205.94c 268.64b 288.56b 306.21a 276.31b
a–dMeans within each day lacking a common superscript differ (P ≤ 0.05).
age interaction groups cannot be provided by the data ob-tained.
Regardless, these results are very interesting becauseegg weights at transfer for all the strain by age interactionswere equal. The data provide strong evidence that theinteraction effect on external pipping time is independentof egg weight in these 2 strains. One might expect thatpipping time would be related to chick weight; however,there was no relationship between hatched chick weight(Table 4) and external pipping time.
Within the R strain, time to hatching was highest inthe VO flock compared with the other flock ages, whichdid not differ from one another. Although the same strainand similar flock ages were examined, the current results
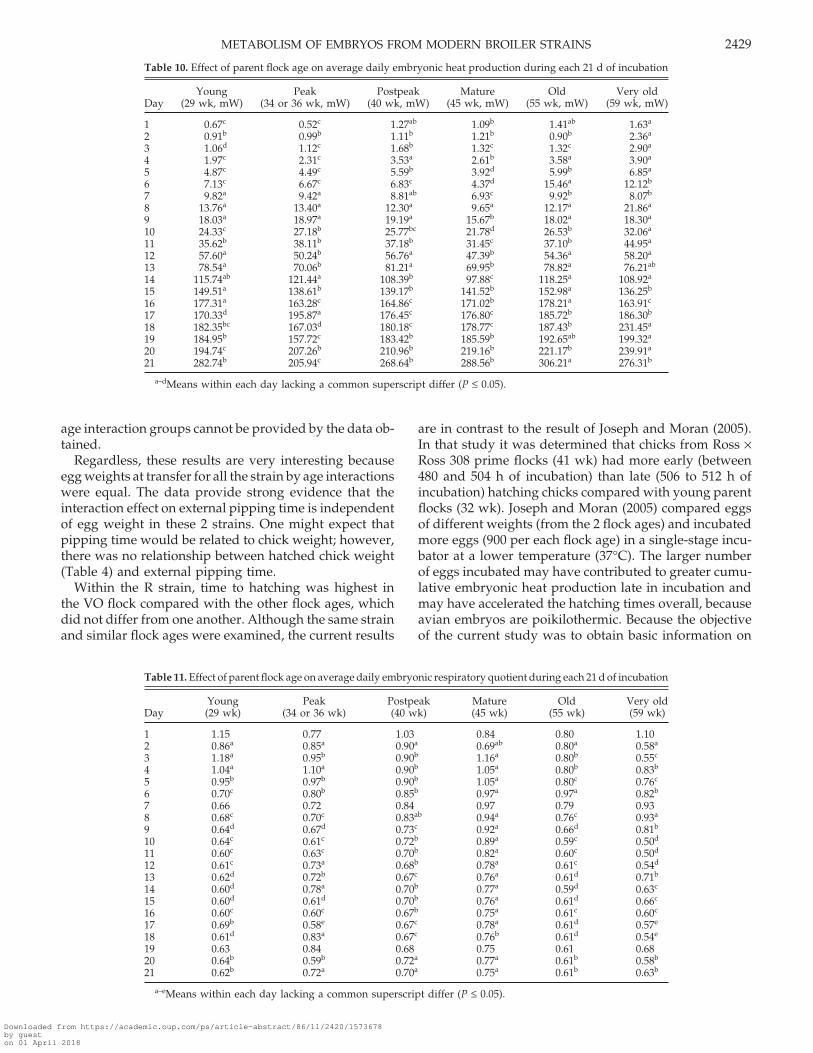
Table 11. Effect of parent flock age on average daily embryonic respiratory quotient during each 21 d of incubation
Young Peak Postpeak Mature Old Very oldDay (29 wk) (34 or 36 wk) (40 wk) (45 wk) (55 wk) (59 wk)
1 1.15 0.77 1.03 0.84 0.80 1.102 0.86a 0.85a 0.90a 0.69ab 0.80a 0.58a
3 1.18a 0.95b 0.90b 1.16a 0.80b 0.55c
4 1.04a 1.10a 0.90b 1.05a 0.80b 0.83b
5 0.95b 0.97b 0.90b 1.05a 0.80c 0.76c
6 0.70c 0.80b 0.85b 0.97a 0.97a 0.82b
7 0.66 0.72 0.84 0.97 0.79 0.938 0.68c 0.70c 0.83ab 0.94a 0.76c 0.93a
9 0.64d 0.67d 0.73c 0.92a 0.66d 0.81b
10 0.64c 0.61c 0.72b 0.89a 0.59c 0.50d
11 0.60c 0.63c 0.70b 0.82a 0.60c 0.50d
12 0.61c 0.73a 0.68b 0.78a 0.61c 0.54d
13 0.62d 0.72b 0.67c 0.76a 0.61d 0.71b
14 0.60d 0.78a 0.70b 0.77a 0.59d 0.63c
15 0.60d 0.61d 0.70b 0.76a 0.61d 0.66c
16 0.60c 0.60c 0.67b 0.75a 0.61c 0.60c
17 0.69b 0.58e 0.67c 0.78a 0.61d 0.57e
18 0.61d 0.83a 0.67c 0.76b 0.61d 0.54e
19 0.63 0.84 0.68 0.75 0.61 0.6820 0.64b 0.59b 0.72a 0.77a 0.61b 0.58b
21 0.62b 0.72a 0.70a 0.75a 0.61b 0.63b
a–eMeans within each day lacking a common superscript differ (P ≤ 0.05).
are in contrast to the result of Joseph and Moran (2005).In that study it was determined that chicks from Ross ×Ross 308 prime flocks (41 wk) had more early (between480 and 504 h of incubation) than late (506 to 512 h ofincubation) hatching chicks compared with young parentflocks (32 wk). Joseph and Moran (2005) compared eggsof different weights (from the 2 flock ages) and incubatedmore eggs (900 per each flock age) in a single-stage incu-bator at a lower temperature (37°C). The larger numberof eggs incubated may have contributed to greater cumu-lative embryonic heat production late in incubation andmay have accelerated the hatching times overall, becauseavian embryos are poikilothermic. Because the objectiveof the current study was to obtain basic information on
Downloaded from https://academic.oup.com/ps/article-abstract/86/11/2420/1573678by gueston 01 April 2018
HAMIDU ET AL.2430
the metabolism of individually incubating eggs underprecisely controlled temperature conditions, eggs wereincubated in individual chambers and were not exposedto a large egg pack. For this reason, the hatching timesmay be more indicative of the development of individualembryos, not a large group of embryos. It is acknowl-edged that the incubation procedure in the current studywas not representative of what occurs in a commercialhatchery, nor was it meant to be.
A similar, but less evident, trend also occurred forhatching times for the C-strain embryos when the Y flockwas excluded (Table 3). In the Y flock of the C strain,significant differences existed between the length of timerequired to reach external pipping and hatching, whichwere strain dependent. Excluding the VO flock, embryosfrom the Y flock of the C strain took longer to reachexternal pipping and hatching compared with the otherflock ages. In offspring from Y parents of the C strain,different embryonic growth strategies may have devel-oped because of genetic selection (i.e., embryos from theseyoung flocks may have physiological differences, espe-cially during the final days of incubation, which extendthe length of time taken to hatch).
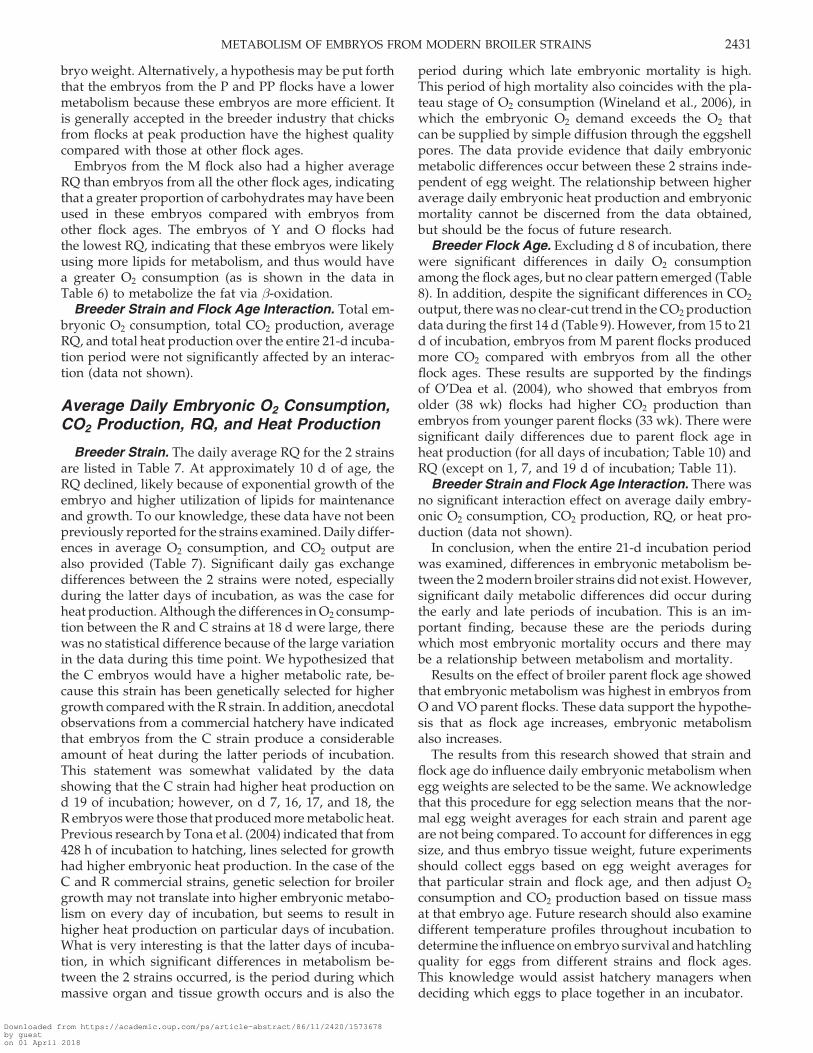
Chick Weight, Chick Length,and Shank Length
Breeder Strain. Because there was an interaction effecton chick weight at hatching, the main effect of breederstrain is not discussed for this parameter. Chick lengthand shank length were not influenced by strain (Table 4).
Breeder Flock Age. Because there was an interactioneffect on chick weight at hatching, the main effect ofbreeder flock age is not discussed for this parameter. TheVO flock had longer chicks compared with the P and PPflocks. There may be an expectation that a longer chickwill have a longer shank (metatarsal bone); however,chicks from P flocks, which were 1 of the 2 flock agesthat had the shortest chick length, had a significantlylonger shank length compared with all other flock ages.The data showed that shank and chick length were notpositively correlated when eggs of similar weight werechosen.
Breeder Strain and Flock Age Interaction. There wasan interaction effect of strain and flock age on chickweight (Table 4). For the R chicks, there was a significanttrend of decreasing weight when moving from the Y tothe O flock. This pattern was not repeated in the weight ofthe C chicks. Chicks from the VO flocks were the heaviestwhen compared within the R (significantly heavier thanall flocks but the Y flock) and C strains (VO flock signifi-cantly heavier than the O and Y flocks, but not differentfrom the other flock ages). This result was independentof egg set weight, which did not differ because of theinteraction (Table 3). Especially for the C strain, thereseemed to be a relationship between the hatching time(Table 3) and chick weight (Table 4); excluding the Yflock, chicks that took the longest to hatch were the heavi-est. This result was not due to dehydration of chicks
hatching earlier, because the chicks were removed fromthe hatcher as soon as the down was dry (i.e., they didnot stay in the hatcher until all the chicks had hatched).This result was also not due to yolk sac weight (Table 5),because there was no effect of the interaction on wet ordry yolk sac weights. There was no effect of the interactionon chick or shank length.
Percentage Chick Carcass and Yolk Sac
Breeder Strain. Strain had no significant effect on wetcarcass, wet yolk sac, dry carcass, and dry yolk sac as apercentage of the hatched chick weight (Table 5).
Breeder Flock Age. The percentages of yolk free bodymass (wet chick carcass) were significantly higher in theY and P flocks compared with the O flocks, with nodifference among the other flock ages (Table 5). Whenthe yolk-free carcasses were dried, the percentages of dryweight for the PP flocks were greater than for all otherflock ages, which did not differ from one another. Thepercentages of wet and dry yolk sacs generally increasedas the flocks aged (Table 5). These results agree withprevious research. Peebles et al. (2001) found that asbroiler flock age increased from 26 to 31 wk and from 31to 35 wk, yolk weight also increased. Suarez et al. (1997)reported a higher percentage of yolk in 59-wk-old flockscompared with 29-wk-old flocks.
Breeder Strain and Flock Age Interaction. The inter-action had no significant effect on percentages of carcassand yolk sac (data not shown).
Total Embryonic O2 Consumption,CO2 Production, Average RQ,and Total Heat Production
Breeder Strain. Total embryonic O2 consumption, totalCO2 production, average RQ, and total heat productionover the entire 21-d incubation period were not signifi-cantly different between R and C embryos (Table 6). Thiswas somewhat unexpected, because we hypothesizedthat embryos from the high-meat-yielding C strain wouldhave a higher metabolic rate (heat production) through-out incubation compared with embryos from the R strain.
Breeder Flock Age. Embryos from the O and VO flocksconsumed more O2 than embryos from the P, PP, and Mflocks over the entire 21 d of incubation. We hypothesizedthat embryos from older flocks would have higher heatproduction, and, excluding the Y flock, embryos from theM, O, and VO flocks had higher total heat productionthan those from the P and PP flocks. For the VO flocks,a contributing factor may have been that embryos fromthese flocks were larger and thus had more tissue tosupport metabolically compared with embryos from theother flock ages. This statement is supported by the factthat hatched chick weight in the VO flocks was greaterthan for all the other flock ages (Table 4). For futurestudies, it would be valuable to obtain daily embryonicweights for each day of incubation to establish whetherdaily O2 consumption and heat production parallel em-
Downloaded from https://academic.oup.com/ps/article-abstract/86/11/2420/1573678by gueston 01 April 2018
METABOLISM OF EMBRYOS FROM MODERN BROILER STRAINS 2431
bryo weight. Alternatively, a hypothesis may be put forththat the embryos from the P and PP flocks have a lowermetabolism because these embryos are more efficient. Itis generally accepted in the breeder industry that chicksfrom flocks at peak production have the highest qualitycompared with those at other flock ages.
Embryos from the M flock also had a higher averageRQ than embryos from all the other flock ages, indicatingthat a greater proportion of carbohydrates may have beenused in these embryos compared with embryos fromother flock ages. The embryos of Y and O flocks hadthe lowest RQ, indicating that these embryos were likelyusing more lipids for metabolism, and thus would havea greater O2 consumption (as is shown in the data inTable 6) to metabolize the fat via β-oxidation.
Breeder Strain and Flock Age Interaction. Total em-bryonic O2 consumption, total CO2 production, averageRQ, and total heat production over the entire 21-d incuba-tion period were not significantly affected by an interac-tion (data not shown).
Average Daily Embryonic O2 Consumption,CO2 Production, RQ, and Heat Production
Breeder Strain. The daily average RQ for the 2 strainsare listed in Table 7. At approximately 10 d of age, theRQ declined, likely because of exponential growth of theembryo and higher utilization of lipids for maintenanceand growth. To our knowledge, these data have not beenpreviously reported for the strains examined. Daily differ-ences in average O2 consumption, and CO2 output arealso provided (Table 7). Significant daily gas exchangedifferences between the 2 strains were noted, especiallyduring the latter days of incubation, as was the case forheat production. Although the differences in O2 consump-tion between the R and C strains at 18 d were large, therewas no statistical difference because of the large variationin the data during this time point. We hypothesized thatthe C embryos would have a higher metabolic rate, be-cause this strain has been genetically selected for highergrowth compared with the R strain. In addition, anecdotalobservations from a commercial hatchery have indicatedthat embryos from the C strain produce a considerableamount of heat during the latter periods of incubation.This statement was somewhat validated by the datashowing that the C strain had higher heat production ond 19 of incubation; however, on d 7, 16, 17, and 18, theR embryos were those that produced more metabolic heat.Previous research by Tona et al. (2004) indicated that from428 h of incubation to hatching, lines selected for growthhad higher embryonic heat production. In the case of theC and R commercial strains, genetic selection for broilergrowth may not translate into higher embryonic metabo-lism on every day of incubation, but seems to result inhigher heat production on particular days of incubation.What is very interesting is that the latter days of incuba-tion, in which significant differences in metabolism be-tween the 2 strains occurred, is the period during whichmassive organ and tissue growth occurs and is also the
period during which late embryonic mortality is high.This period of high mortality also coincides with the pla-teau stage of O2 consumption (Wineland et al., 2006), inwhich the embryonic O2 demand exceeds the O2 thatcan be supplied by simple diffusion through the eggshellpores. The data provide evidence that daily embryonicmetabolic differences occur between these 2 strains inde-pendent of egg weight. The relationship between higheraverage daily embryonic heat production and embryonicmortality cannot be discerned from the data obtained,but should be the focus of future research.
Breeder Flock Age. Excluding d 8 of incubation, therewere significant differences in daily O2 consumptionamong the flock ages, but no clear pattern emerged (Table8). In addition, despite the significant differences in CO2
output, there was no clear-cut trend in the CO2 productiondata during the first 14 d (Table 9). However, from 15 to 21d of incubation, embryos from M parent flocks producedmore CO2 compared with embryos from all the otherflock ages. These results are supported by the findingsof O’Dea et al. (2004), who showed that embryos fromolder (38 wk) flocks had higher CO2 production thanembryos from younger parent flocks (33 wk). There weresignificant daily differences due to parent flock age inheat production (for all days of incubation; Table 10) andRQ (except on 1, 7, and 19 d of incubation; Table 11).
Breeder Strain and Flock Age Interaction. There wasno significant interaction effect on average daily embry-onic O2 consumption, CO2 production, RQ, or heat pro-duction (data not shown).
In conclusion, when the entire 21-d incubation periodwas examined, differences in embryonic metabolism be-tween the 2 modern broiler strains did not exist. However,significant daily metabolic differences did occur duringthe early and late periods of incubation. This is an im-portant finding, because these are the periods duringwhich most embryonic mortality occurs and there maybe a relationship between metabolism and mortality.
Results on the effect of broiler parent flock age showedthat embryonic metabolism was highest in embryos fromO and VO parent flocks. These data support the hypothe-sis that as flock age increases, embryonic metabolismalso increases.
The results from this research showed that strain andflock age do influence daily embryonic metabolism whenegg weights are selected to be the same. We acknowledgethat this procedure for egg selection means that the nor-mal egg weight averages for each strain and parent ageare not being compared. To account for differences in eggsize, and thus embryo tissue weight, future experimentsshould collect eggs based on egg weight averages forthat particular strain and flock age, and then adjust O2
consumption and CO2 production based on tissue massat that embryo age. Future research should also examinedifferent temperature profiles throughout incubation todetermine the influence on embryo survival and hatchlingquality for eggs from different strains and flock ages.This knowledge would assist hatchery managers whendeciding which eggs to place together in an incubator.
Downloaded from https://academic.oup.com/ps/article-abstract/86/11/2420/1573678by gueston 01 April 2018
HAMIDU ET AL.2432
ACKNOWLEDGMENTS
We would like to acknowledge the financial supportprovided by the following organizations: the AlbertaLivestock Industry Development Fund (Edmonton, Al-berta, Canada), Aviagen (Huntsville, AL), Maple LeafHatchery (Wetaskiwin, Alberta, Canada), the Natural Sci-ences and Engineering Research Council of Canada (Ot-tawa, Ontario, Canada), the Poultry Industry Council(Guelph, Ontario, Canada), and The Poultry ResearchCenter at the University of Alberta (Edmonton, Alberta,Canada). We are indebted to A. Franco and M. Mackenziefor their assistance with data collection.
REFERENCES
Ahn, D. U., S. M. Kim, and H. Shu. 1997. Effect of egg size andstrain and age of hens on the solids content of chicken eggs.Poult. Sci. 76:914–919.
Ar, A., C. V. Paganelli, R. B. Reeves, D. G. Greene, and H.Rahn. 1974. The avian egg: Water vapor conductance, shellthickness and functional pore area. Condor 76:153–158.
Canadian Council on Animal Care. 1993. A guide to the careand use of experimental animals. 2nd ed. Vol. 1. E. D. Olfert,B. M. Cross, and A. A. McWilliams, ed. Can. Counc. Anim.Care, Ottawa, Ontario, Canada.
Fletcher, D. L., W. M. Britton, A. P. Rahn, and S. I. Savage. 1981.The influence of layer flock age on egg components yieldsand solid content. Poult. Sci. 59:983–987.
Joseph, N. S., and E. T. Moran, Jr. 2005. Effect of flock age andpostemergent holding in the hatcher on broiler live perfor-mance and further-processing yield. J. Appl. Poult. Res.14:512–520.
Kleiber, M. 1987. The Fire of Life. An introduction to AnimalEnergetics. Robert E. Krieger Publ. Co., Malabar, FL.
Lourens, A., H. van den Brand, R. Meijerhof, and B. Kemp.2005. Effect of eggshell temperature during incubation onembryo development, hatchability and post-hatch develop-ment. Poult. Sci. 84:914–920.
O’Dea, E. E., G. M. Fasenko, J. J. R. Feddes, F. E. Robinson, J.C. Segura, C. A. Ouellette, and J. H. van Middelkoop. 2004.Investigating the eggshell conductance and embryonic me-tabolism of modern and unselected domestic avian geneticstrains at two flock ages. Poult. Sci. 83:2059–2070.
Peebles, E. D., S. M. Doyle, C. D. Zumwalt, P. D. Gerard, M.A. Latour, C. R. Boyle, and T. W. Smith. 2001. Breeder ageinfluences embryogenesis in broiler hatching eggs. Poult. Sci.80:272–277.
Peebles, E. D., C. W. Gardner, J. Brake, C. E. Benton, J. J. Bruzual,and P. D. Gerard. 2000. Albumen height and yolk and embryocompositions in broiler hatching eggs during incubation.Poult. Sci. 79:1373–1377.
Rahn, H., C. V. Paganelli, and A. Ar. 1974. The avian egg: Air-cell gas tension, metabolism and incubation time. Respir.Physiol. 22:297–309.
Romanoff, A. L. 1967. Biochemistry of the Avian Embryo. JohnWiley and Sons Inc., New York, NY.
Romijn, C., and W. Lokhorst. 1960. Foetal heat production inthe fowl. J. Physiol. 150:239–249.
SAS Institute. 2005. Qualification Tools User’s Guide. SAS 9.1.3.SAS Inst. Inc., Cary, NC.
Segura, J. C., C. A. Ouellette, J. J. R. Feddes, G. M. Fasenko, andM. J. Zuidhof. 2006. Development of a metabolic calorimetersystem to measure heat production of domestic avian em-bryos during incubation. Can. Biosys. Eng. 48:41–46.
Suarez, M. E., H. R. Wilson, F. B. Mather, C. J. Wilcox, and B.N. Mcpherson. 1997. Effect of strain and age of the broilerbreeder female on incubation time and chick weight. Poult.Sci. 76:1029–1036.
Tona, K., O. M. Onagbesan, Y. Jego, B. Kamers, E. Decuypere,and V. Bruggeman. 2004. Comparison of embryo physiologi-cal parameters during incubation, chick quality, and growthperformance of three lines of broiler breeders differing ingenetic composition and growth rate. Poult. Sci. 83:507–513.
Vleck, C. M., and D. Vleck. 1987. Metabolism and energetics ofavian embryos. J. Exp. Zool. 1:111–126.
Wineland, M. W., V. L. Christensen, I. Yildrum, B. D. Fairchild,K. M. Mann, and D. T. Ort. 2006. Incubator temperatureand oxygen concentration at the plateau stage in oxygenconsumption affects intestinal maturation of broiler chicks.Int. J. Poult. Sci. 5:229–240.
Downloaded from https://academic.oup.com/ps/article-abstract/86/11/2420/1573678by gueston 01 April 2018