The effect of behavioral bias and frame dependence on real ...
71
THE EFFECT OF BEHAVIORAL BIAS AND FRAME DEPENDENCE ON REAL ESTATE PRICES IN NAIROBI COUNTY BENSON GICHERU NDIRITU D63/76097/2012 A RESEARCH PROJECT SUBMITTED IN PARTIAL FULFILLMENT OF THE REQUIREMENTS FOR THE AWARD OF THE DEGREE OF MASTER OF SCIENCE IN FINANCE OCTOBER 2015
Transcript of The effect of behavioral bias and frame dependence on real ...

THE EFFECT OF BEHAVIORAL BIAS AND FRAME DEPENDENCE ON REAL
ESTATE PRICES IN NAIROBI COUNTY
BENSON GICHERU NDIRITU
D63/76097/2012
A RESEARCH PROJECT SUBMITTED IN PARTIAL FULFILLMENT OF THE
REQUIREMENTS FOR THE AWARD OF THE DEGREE OF MASTER OF SCIENCE
IN FINANCE
OCTOBER 2015

ii
DECLARATION
This research project is my original work and has not been submitted in any other University for
any academic award.
Signature……………………........... Date………………………
Name: Benson Gicheru Ndiritu
Reg. no: D63/76097/2012
This research project has been submitted for examination with my approval as the University
Supervisor.
Signature…………………………. Date…………………………
Mr. Herrick Ondigo
Lecturer
Department of Finance and Accounting,
School of Business,
University of Nairobi.

iii
ACKNOWLEDGEMENTS
I thank the Almighty God for giving me the gift of life, health and the grace to accomplish my
class work and this research project. I would also like to acknowledge the support of my
supervisor, Mr. Herrick Ondigo, moderator, Dr. Iraya for their invaluable counsel. My
appreciation also goes to my family, Noel and Steve for their support and encouragement.

iv
DEDICATION
I dedicate this project to my father Mr. Philip Ndiritu and my mother Jane Wanjiku who gave me
support during the entire time I was working on this project. I sincerely appreciate your support.

v
TABLE OF CONTENTS
DECLARATION........................................................................................................................... ii
ACKNOWLEDGEMENTS ........................................................................................................ iii
DEDICATION.............................................................................................................................. iv
LIST OF ABBREVIATIONS ................................................................................................... viii
LIST OF TABLES ....................................................................................................................... ix
LIST OF FIGURES ...................................................................................................................... x
ABSTRACT .................................................................................................................................. xi
CHAPTER ONE ........................................................................................................................... 1
INTRODUCTION......................................................................................................................... 1
1.1 Background to the Study .................................................................................................. 1
1.1.1 Behavioral Bias ......................................................................................................... 2
1.1.2 Frame Dependence.................................................................................................... 3
1.1.3 Real Estate Prices ...................................................................................................... 5
1.1.4 Effect of Behavioral Bias & Frame Dependence on Real Estate Prices ................... 6
1.1.5 Real Estate Market in Nairobi County ...................................................................... 6
1.2 Research Problem ............................................................................................................. 8
1.3 Objective of the Study .................................................................................................... 10
1.4 Value of the Study .......................................................................................................... 10
CHAPTER TWO ........................................................................................................................ 11
LITERATURE REVIEW .......................................................................................................... 11
2.1 Introduction ................................................................................................................... 11
2.2 Theoretical Review ........................................................................................................ 11
2.2.1 Cascade Theory ....................................................................................................... 11
2.2.2 Prospect Theory .......................................................................................................... 12
2.2.3 Efficient Markets Hypothesis ................................................................................. 14
2.3 Determinants of Real Estate Prices ................................................................................ 15
2.3.1 Introduction ............................................................................................................. 15
2.3.2 Mortgage Rates and Interest Rates ......................................................................... 15
2.3.3 Leverage .................................................................................................................. 17
2.4 Empirical Review ........................................................................................................... 17

vi
2.4.1 International Evidence ............................................................................................ 17
2.4.2 Local Evidence ...................................................................................................... 20
2.5 Summary of the Literature Review ................................................................................ 21
CHAPTER THREE .................................................................................................................... 22
RESEARCH METHODOLOGY .............................................................................................. 22
3.1 Introduction .................................................................................................................... 22
3.2 Research Design ............................................................................................................. 22
3.3 Population....................................................................................................................... 22
3.4 Sample ............................................................................................................................ 23
3.5 Data Collection ............................................................................................................... 23
3.6 Data Analysis ................................................................................................................. 23
3.6.1 Analytical Model .................................................................................................... 24
3.6.2 Operationalizing the Variables ............................................................................... 24
3.6.3 Test of Significance ................................................................................................. 24
CHAPTER FOUR ....................................................................................................................... 25
DATA ANALYSIS, RESULTS AND INTERPRETATION ................................................... 25
4.1 Introduction .................................................................................................................... 25
4.2 Response Rate ................................................................................................................ 25
4.3 Descriptive Statistics ...................................................................................................... 25
4.4.1 Correlation Analysis ................................................................................................... 33
4.4.2 Regression Analysis ................................................................................................ 34
4.4.3 Analysis of Variance ................................................................................................. 36
4.5 Interpretation of the Findings ......................................................................................... 37
CHAPTER FIVE ........................................................................................................................ 39
SUMMARY, CONCLUSION AND RECOMMENDATIONS .............................................. 39
5.1 Introduction .................................................................................................................... 39
5.2 Summary ........................................................................................................................ 39
5.3 Conclusions .................................................................................................................... 40
5. 4 Recommendations for Policy and Practice.................................................................... 41
5.5 Limitations of the Study ................................................................................................. 42
5.6 Suggestion for Further Research .................................................................................... 43

vii
REFERENCES ............................................................................................................................ 44
APPENDICES ............................................................................................................................. 52
Appendix I: List of Property and Real Estate Companies in Kenya as at 19th July 2015 ....... 52
Apendix II: Questionnaire ........................................................................................................ 55

viii
LIST OF ABBREVIATIONS
CBK - Central Bank of Kenya
EMH - Efficient Market Hypothesis
GDP - Gross Domestic Product
MPT - Modern Portfolio Theory
NSE - Nairobi Securities Exchange
REM - Real Estate Market
SPSS - Statistical Packages for Social Sciences
USA - United States of America

ix
LIST OF TABLES
Table 4.1: Effect of Behavioral Factor on Real Estate Prices……………………………………33
Table 4.2: Model Fitting Information……………………………………………………………34
Table 4.3: Pseudo R- Square…………………………………………………………………….35
Table 4.4: Parameter Estimates................................................................................................. ...35
x
LIST OF FIGURES
Figure 4.1 Category of Property Investment………………………………………….....….26
Figure 4.2: Investment period………………………………………….….……….………..28
Figure 4.3: Financing Source for Real Estate Investment………………………….…….....29
Figure 4.4: Main Motivation for Investment in Real Estate……………………….………..30
Figure 4.5: Period which Clients Hold Investment……………………………….…………31
Figure 4.6: Carrying out Valuation of Property to be invested……………………...………32

xi
ABSTRACT
Extreme volatility has plagued financial markets worldwide since the 2008 Global Crisis.
Investor sentiment has been one of the key determinants of market movements. In this context,
studying the role played by frame dependence and behavioral bias in shaping up investment
decisions and real estate prizes seemed important. Behavioral Finance is an evolving field that
studies how psychological factors affect decision making under uncertainty. This project seeked
to find the influence of certain identified behavioral finance concepts (or biases), namely,
emotional time line, herd instinct, mental accounting, loss aversion, behavioral portfolios and the
shadow of the past on the effect of real estate prizes in Nairobi County. The study used survey
questionnaire to collect data targeting real estate agents within Nairobi region the data analysis
was done using descriptive statistics, in which mean, mode, standard deviations, and variances
were used. The logistic regression was used to determine statistical relationship between the
variables, SPSS application was used for the analysis. The study found out that frame
dependence and behavioral bias plays a role in influencing investment decisions of the real estate
investor. From the biases investigated Herd instinct and the Shadow of the past have had the
most profound positive correlation with real estate prizes. Herd instinct could estimate 3.889 of
the real estate prize while the Shadow of the past to an extent of 3.628. Mental accounting,
Narrow Framing and Behavioral Portfolios had an effect on the real estate prizes but it was not
significant. The study recommends that the real estate investors need to do an analysis of all the
investment factors carefully using both traditional finance and behavioral biases before making
an investment decision. The investors should also strive to interpret the market and economic
indicators since they influence the performance targets of the real estate market.

1
CHAPTER ONE
INTRODUCTION
1.1 Background to the Study
Investors can seriously harm their wealth by allowing the behavioral biases to affect their
decision making. As a result of inherent biases built in our brains and bodies, human beings
make suboptimal decisions (Gordon, 2011). According to behavioral finance an investor is
assumed to be normal. Many researchers in the field of behavioral finance conducted research
and suggested that investors do not always behave rationally when making investment decisions
(Ayopo and Adekunle, 2012).
The main areas that were researched were behavioral bias and frame dependence. Behavioral
bias is categorized in two main areas: emotional time line and heard instincts. Emotional time
line describes how people make decision, which is defined by a time line that begins with hope
or fear and ends with pride or regret. Heard instincts describe how people make decision with
regard to how other people make same decision
The other concept is frame dependence, which is categorized in five areas: prospect theory,
mental accounting, Narrow framing, behavioral portfolios and the shadow of the past. Prospect
theory describes how people frame and value decisions involving uncertainty. It shows how
people look at choices with regard to potential gain or losses (Prosad, 2014).
Mental accounting describes how people, put money in different mental accounts and treat a
shilling in one account differently from another account (Thaler, 1999). Narrow framing talks of
how investors look at investments separately rather than the whole portfolio (Shefrin, 2000).

2
Behavioral portfolios show how people have irrational portfolios. It shows how psychological
tendencies prod investors to build their portfolios in a pyramid of assets. The shadow of the past
talks of how past experiences, influence future decisions.
This research was based on: information cascade theory, prospect theory and efficient market
hypothesis. Information cascade theory was developed by Bikhchandani, Hirshleifer, and Welch
(1992). It talks of how people follow the behavior of the preceding individual without regard to
their own information. Prospect theory was developed by Khaneman and Tversky (1979); it
describes how people look at choices in terms of potential gains or losses. Efficient market
hypothesis was developed by Fama (1969), the theory talks of ideal market where prices should
provide signals for accurate resource allocation.
Real estate prices have skyrocketed in Kenya and the study wants to check if these have been
due to behavioral aspects or the appreciation of the real value. This study will therefore
contribute to the knowledge of behavioral finance with regard to real estate in the Kenyan
context.
1.1.1 Behavioral Bias
Behavioral bias can be categorized into two. One is emotional time line and the other herd
instincts and overreaction. Behavioral biases, abstractly, are defined in the same way as
systematic errors are, in judgment (Chen, Kim, Nafsinger and Rui 2007). According to
psychologist Lola Lopes (2002) investors experience a variety of emotions, positive and
negative. The emotions experienced by a person with respect to investment may be expressed
along an emotional time line which begins by decision and ends by the goal.

3
When making the decision, if one is driven by fear this will lead to anxiety and the outcome will
be regret. On the other side hope leads to anticipation and later pride. Hope and fear have a
bearing on how investors evaluate alternatives. Fear induces investors to look at the downside of
things, whereas hope causes them to look at the upside.
There is a natural desire on the part of human beings to be part of a group so people tend to herd
together. Herding in financial markets can be defined as mutual imitation leading to a
convergence of action (Hirshleifer and Teoh, 2003). Moving with the herd, however, magnifies
the psychological biases. It induces one to decide on the “feel” of the herd rather than on
rigorous independent analysis. This tendency is accentuated in the case of decisions involving
high uncertainty. Investors apply to “herd behavior” because they are concerned of what others
think of their investment decisions (Scharfstein and Stein, 1990).
1.1.2 Frame Dependence
The term frame dependence means that the way people behave depends on the way that their
decision problems are framed, (Shefrin, 2000). The essence of frame independence was put
vividly by Miller as follows: “If you transfer a dollar from your right pocket to your left pocket,
you are no wealthier”. Frame independent investors pay attention to changes in their total wealth
because it is this that eventually determines how much they can spend on goods and services
while frame dependent investors look at the nominal value.
Frame dependence sterns from a mix of cognitive and emotional factors. The cognitive aspects
relate to how people organize information mentally, in particular how they code outcomes into
gains and losses. The emotional aspects pertain to how people feel as they register information.

4
These forms of frame dependence can be categorized into: loss aversion, mental accounting,
narrow framing, behavioral portfolios and the shadow of the past.
Loss aversion was conceived by Kahneman and Tversky (1979) and later resulted in Daniel
Kahneman being awarded the Nobel Prize for Economics. It talks of how people value gains and
losses in an S shaped utility function. This means that people feel more pain in loss as compared
to the pleasure in a similar gain. Mental Accounting was coined by Thaler and defined by Thaler
(1999) as the “set of cognitive operations used by individuals and households to organize,
evaluate, and keep track of financial activities.”
While investors understand the principle of diversification, they don‟t form portfolios in the
manner suggested by portfolio theory developed by Markowitz, (1980). According to Hersh
Shefrin and Meir Statman, (2000) the psychological tendencies of investors prod them to build
their portfolios as a pyramid of assets having a proportion in options, property, stocks, bonds,
residential cash etc.
Ideally, investors should pay attention to changes in their total wealth (comprising of real estate,
stocks, bonds, endeavor, future income, and other assets) over their investment horizon because
it is this that determines how much they can spend on goods and services, which is what
ultimately matters to them. In reality, however, investors engage in “narrow framing” they focus
on changes in wealth that are narrowly defined, both in a cross-sectional as well as a temporal
sense, Guiso (2008). The shadow of the past says that people seem to consider a past outcome as
a factor in evaluating a current risky decision.

5
1.1.3 Real Estate Prices
In the current context, real estate prices are not regulated by any authority. Real estate
investments and prices are good measures for reflecting expected real estate demand, and serve
as good predictors of economic growth (Knight Frank, 2011). The “real estate” market and
industry is considered to include land and improvements, their selling and rental prices, the
economic rent of land and returns on buildings and other improvements, and the construction
industry.
Although real estate values are influenced by the supply and demand for properties in a given
locale and the replacement cost of developing new properties, the income approach is the most
common valuation technique for investors. The income approach provided by appraisers of
commercial properties and by underwriters and investors of real estate-backed investments is
very similar to the discounted cash flow analysis conducted on equity and bond investments
(Jennergren, 2011).
The valuation starts by forecasting property income, which takes the form of anticipated lease
payments or, in the case of hotels, anticipated hotel occupancy multiplied by the average cost per
room. Then, by taking all property-level costs, including the financing cost, the analyst arrives at
the net operating income (NOI), or cash flow remaining after all operating expenses.
By subtracting all capital costs, as well as any investment capital to maintain or repair the
property and other non-property-specific expenses from NOI, the result is the net cash flow
(NCF). Because properties don‟t usually retain cash or have a stated dividend policy, NCF equals
cash available to investors and is the same as cash from dividends, which is used for valuing
equity or fixed-income investments. By capitalizing dividends or by discounting the cash flow

6
stream (including any residual value) for a given investment period, the property value is
determined (Dean, 2014).
1.1.4 Effect of Behavioral Bias & Frame Dependence on Real Estate Prices
Asset bubbles are inflated by overconfidence and herding behavior. These bubbles are then kept
alive exactly by the arbitrageurs expected to bring price close to fundamental (or equilibrium
value) and exacerbated by the existing institutional setting which is unable to control and address
conflicts of interest (Constantinescu, 2010). Experiments conducted by Fehr et al. indicate that
positive and negative inflation shocks have asymmetric effects on the price development with
negative shock not leading so readily to price adjustment as positive shock.
Interestingly, a similar effect was observed in the property valuation literature by Harvard (1999)
where appraisers were observed to adjust prices upwards more readily than downward when
given proof of improper estimation. Case and Shiller (1989) have conducted surveys of recent
buyers, showing that buyers in booming markets have greater expected house price appreciation
than buyers in a control market. Buyers in the booming market indicate that they treat the
purchase of a home more as an investment, and discuss housing market changes more frequently.
By contrast, buyers in the control market spend less time discussing the housing market, and
place more weight on the consumption value of a home, as opposed to its investment value.
1.1.5 Real Estate Market in Nairobi County
Values in Kenya‟s residential property market continue to rise, amidst robust economic growth
and a sharp increase in the population of middle-class. Residential property values in Kenya have
skyrocketed a stunning 357% from the year 2000 to Q3 in the year 2014 according to Hass

7
Consult. During the year 2014 to end-Q3 2014, the Hass Composite Property Sales Index, a
measure of asking sales prices of residential properties, rose by 4.7%, a sharp improvement from
increases of 0.05% in Q2 2014, 1.7% in Q1 2014, and 0.3% in Q4 2013, based on a report
released by Hass Consult Limited. Quarter-on-quarter, residential property prices increased 3.1%
in Q3 2014.The Hass index is based on 4,000 to 6,000 properties tracked across Kenya, which
are collected from multiple estate agencies and all publicly available house sales, including in
property magazines, property websites and the national media.
The real estate prices in Nairobi County can be clearly seen to have been on the increase. This
increase in prices has been higher as compared to other major cities, where their economies are
much stronger. According to Statman, Fisher & Anginer, (2008) many people make investment
decisions emotionally. Feelings, fantasy, mood and sentiments have been observed to affect
investment decisions. The real estate market has gained much interest in recent years, and it‟s
most likely that herding has caused speculation and generally an increase on property prices.
The average value of a property in the country surged to KES25.6 million (US$283,000) in
September 2014, from KES7.1 million (US$78,482) in December 2000, according to Hass
Consult. The average price for a 1-3 bedroom residential property is currently KES11.8 million
(US$130,435). On the other hand, the average price for a 4-6 bedroom residential property is
KES36.5 million (USS403, 463) according to Hass Consult Limited.
According to Mayer and Sinai, (2007) there has been considerable debate in recent years
regarding the role of behavioral factors in determining housing prices. The question of whether
psychology matters in the housing market has been settled long ago: the answer is yes. Rather,
8
economists are now debating in what ways psychology impacts market behavior and how large
an effect this impact has on housing prices.
One example of a clear behavioral bubble in housing is the sharp boom-bust in the Vancouver
housing market during the early 1980s. In the 18 months between January 1980 and July 1981,
real house prices grew 87 percent. In the subsequent 18 months, real prices fell by nearly 44
percent, plateauing at a level only 6 percent above where prices were three years earlier before
the boom began. While news and rumors about Britain‟s returning Hong Kong to China may
have swayed sentiment in the Vancouver market, where many wealthy Hong Kong residents own
second homes, it is very difficult to use fundamental factors in explaining the sudden boom-bust
pattern witnessed in the early 1980s ( Mayer & Sinai, 2007)
1.2 Research Problem
The study aimed at identifying the impact of behavioral bias and frame dependence on the real
estate prices. Behavioral bias is defined as a pattern of variation in judgment that occurs in
particular situations, which may sometimes lead to perceptual alteration, inaccurate judgment,
illogical interpretation, or what is largely called irrationality, (Rasheed, Raftar, Fatima and
Maqsood, 2013). There is evidence to show repeated patterns of irrationality in the way humans
arrive at decisions and choices when faced with uncertainty. (Subash,2012). Nofsinger (2001)
says that the assumptions of rationality and unbiasedness of people have been drubbed by
psychologists for a long time.
Real estate has had immense interest globally. This may be due to the unique characteristic of the
industry. Housing has unique characteristics because it can be viewed as both an investment and
9
a consumption good, (Stepanyan, Poghosyan and Bibolov, 2010). Researchers have had a lot of
interest in behavioral finance and real estate. A study by Luong, Ha (2011) on the behavioral
factors influencing individual investor‟s decision in Vietnam, found that behavioral factors affect
investor‟s decision. The study recommend for further research to confirm the findings. A
research by Muthama, (2012) on effects of investor psychology on real estate market prices in
Nairobi concludes that investor psychology actually affects real estate decision. A recent study
by Choka, (2012) on the effects of investor sentiment on real estate investment, concludes that
investor sentiments influence investor‟s decision on real estate.
Miregi, Obere (2014) studied the effects of market fundamental variables on property prices in
Kenya with a case study of Nairobi. The study was seeking to dispel the fear of the prevailing
high real estate prices, using VAR model. Property prices were used as the dependent variable
while stock prices, interest rate, building cost and inflation as the independent variables. On the
basis of the overall objective whether market fundamental variables have effect on the property
prices in Kenya, the study reveals a pricing trend that is not fundamentally supported, at least by
the variables investigated.
From various studies done, as shown above it is clear that the aspects of behavioral finance
studied in relation to investor‟s decision making were found to have an effect. However
behavioral bias and frame dependence effect of real estate prices has not been done, and this
research is intended to fill this gap. Furthermore the study by Miregi, Obere (2014) of the effect
of market fundamentals on real estate prices in Kenya showed no effect of fundamentals on the

10
real estate prices. The researcher recommended a study on other factors that can explain the high
real estate prices, Miregi, Obere (2014). This study was also intended to fill this gap.
This Study intended to address the research question:
- What is the effect of behavioral bias and frame dependence on real estate prices in Nairobi
County?
1.3 Objective of the Study
To investigate the effect of behavioral bias and frame dependence on real estate prices in Nairobi
County.
1.4 Value of the Study
The main importance of the study is to contribute on the knowledge of behavioral finance. The
study will also give a new way of doing things, given on the outcome of the research. In the
Kenyan context, prices of real estate have been on the increase and the study will identify
whether their real value has increased or it‟s an effect of behavior bias and frame dependence.
Therefore the study will give key information to particularly investors on how they make
decisions and caution them in future to make well informed decisions. There has been research
work on the stock exchange on the effect of various behavioral biases, and this study will build
on this knowledge. The study is also intended to identify if we actually are in a boom or a
bubble, and hence caution our economy just in case we are in a bubble.

11
CHAPTER TWO
LITERATURE REVIEW
2.1 Introduction
This chapter looks at the main theories guiding this research. The determinants of real estate
prices are also analyzed. The chapter also looks at various literatures that have been done in
relation to behavioral finance, and more so behavioral biases, frame dependence and real estate
prices. The chapter ends with a summary of the literature review.
2.2 Theoretical Review
The main theories that guided this research were information cascade, prospect theory and
efficient market hypothesis.
2.2.1 Cascade Theory
An informational cascade, the main building block of cascade theory, was developed by
economists (Bikhchandani, Hirshleifer and Welch, 1992). Cascade theory reconciles herd
behavior with the rational-choice approach in the social sciences: it is often rational for an
individual to rely on information conveyed by others. The reason is that gathering information is
costly, even if only in terms of time. Individuals will (formally or informally) buy information
only up to the point where it yields no more net additional benefits than simply using the
information conveyed by the behavior or opinions of others. Informational cascades occur when
everybody relies on such “public” information (Lemieux, 2003). An informational cascade
occurs when it is optimal for an individual, having observed the actions of those ahead of him, to

12
follow the behavior of the preceding individual without regard to his own in-formation,
(Bikchandani et al, 1992).
Essentially, their theory says that large trends or fads begin when individuals ignore their private
information but take cues from the actions of others. The theory implies that people will
normally follow others in making a certain decision, in this case investing in real estate. If new
information arrives investors will normally follow it together. Bikchandani et al. wrote, “If even
a little new information arrives, suggesting that a different course of action is optimal, or if
people even suspect that underlying circumstances have changed (whether or not they really
have), the social equilibrium may radically shift”.
This observation appears very apt for financial markets which are constantly bombarded by new
information. In such markets information cascades lead investors to overreact to both good and
bad news. This is how a stock market bubbles and in the opposite direction a stock market crash
gets started. Eventually, however, the market corrects itself, but it also reminds us that the
market is often wrong. The Kenyan real estate market could be in this kind of a scenario.
2.2.2 Prospect Theory
The prospect theory describes how people frame and value a decision involving uncertainty.
According to the prospect theory, people look at choices in terms of potential gains or losses in
relation to a specific reference point, which is often the purchase price. The theory was originally
conceived by Kahneman and Tversky (1979) and later resulted in Daniel Kahneman being
awarded the Nobel Prize for Economics.
The theory distinguishes two phases in the choice process: the early phase of framing (or editing)
and the subsequent phase of evaluation. Tversky and Kahneman, by developing the Prospect

13
Theory, showed how people manage risk and uncertainty. In essence, the theory explains the
apparent irregularity in human behavior when assessing risk under uncertainty. It says that
human beings are not consistently risk-averse; rather they are risk-averse in gains but risk-takers
in losses. People place much more weight on the outcomes that are perceived more certain than
that are considered mere probable, a feature known as the “certainty effect”. (Kahneman and
Tversky, 1979).
People‟s choices are also affected by the „Framing effect‟. Framing refers to the way in which
the same problem is worded in different ways and presented to decision makers and the effect
deals with how framing can influence the decisions in a way that the classical axioms of rational
choice do not hold. It was also demonstrated systematic reversals of preference when the same
problem was presented in different ways (Tversky and Kahneman, 1981). We can therefore say
that people will not necessary do their independent analysis but will most likely be influenced,
by how investment options are presented.
The value maximization function in the Prospect Theory is different from that in Modern
Portfolio Theory. In the modern portfolio theory, the wealth maximization is based on the final
wealth position whereas the prospect theory takes gains and losses into account. This is on the
ground that people may make different choices in situations with identical final wealth levels. An
important aspect of the framing process is that people tend to perceive outcomes as gains and
losses, rather than as final states of wealth. Gains and losses are defined relative to some neutral
reference point and changes are measured against it in relative terms, rather than in absolute
terms (Kahneman and Tversky, 1979).

14
2.2.3 Efficient Markets Hypothesis
Modern finance is built upon the Efficient Markets Hypothesis (EMH) by Fama (1970). EMH is
the notion that securities‟ prices already reflect all available information. The EMH argues that
competition between investors seeking abnormal profits drives prices to their “correct” value, so
that any arbitrage opportunities disappear as soon as they arise. Behavioral finance assumes that,
in some circumstances, financial markets are informationally inefficient (Ritter, 2003).
A market is said to be efficient with respect to some information if that information is not useful
in making investors to earn excess positive return (Jordan & Miller, 2008). The market is not
efficient if some investors have access to insider information leading to insider trading and their
ability to earn excess positive returns than other investors. Statman (1999) stated that market
efficiency is at the center of the battle of standard finance versus behavioral finance versus
investment professionals.
He argues that the term “market efficiency” has two meanings. One meaning is that investor‟s
cannot systematically beat the market and Statman concurs with this. The other meaning is that
security prices are rational implying that they reflect only “fundamental” or “utilitarian”
characteristics, such as risk, but not “psychological” or “value-expressive” characteristics, such
as sentiment. Statman strongly disagrees with this second meaning. However from the EMH
theory, Fama did not include psychological bias in his theory and these are therefore not
reflected on the market.
According to EMH, it is very difficult for investors to consistently beat the market (earn positive
excess return) over a long period of time. The excess return is the difference between the
earnings of a particular investment and the earnings of other investments with similar risk. A

15
positive excess return means that an investment has out-performed other investments of the same
risk (Jordan & Miller, 2008). Odean (1999) states that excessive trading in retail brokerage
accounts could result from either investors‟ overconfidence or from the influence from brokers
wishing to generate commissions. Excessive institutional trading could also result from
overconfidence or from agency relationships. He cites a study by Dow and Gorton (1997) which
shows that money managers, who would otherwise not trade, do so for the mere reason of
signaling to their employers that they are earning their fees and are not “simply doing nothing”.
2.3 Determinants of Real Estate Prices
This section explores the determinants of real estate prices and begins by an explanation with
reference to Behavioral Finance. The section further explores the determinants of real estate. The
determinants discussed are: interest rates, mortgage rates and leverage.
2.3.1 Introduction
Existing literature shows that the house price index can be explained empirically by underlying
fundamentals such as the GDP, the interest rate, the unemployment rate or the population growth
rate (Zilibolti, 2012). However the empirical methods can be very different. With reference to
behavioral finance, the following two determinants are discussed.
2.3.2 Mortgage Rates and Interest Rates
Many people incorrectly assume that the only deciding factor in real estate valuation is the
mortgage rate. However, mortgage rates are only one interest-related factor influencing property
values. Because interest rates also affect capital flows, the supply and demand for capital and

16
investors‟ required rates of return on investment, interest rates will drive property prices in a
variety of ways.
The importance of real estate as an asset class cannot be overstated. Its total value in the US at
the end of 2011 was about $25 trillion, of which more than $16 trillion was in residential
properties. By comparison, at the end of the same year, the capitalization of the US stock market
was in the neighborhood of $18 trillion. Moreover, recent history suggests that fluctuations in
real estate prices, whether in bubble or burst mode, have the potential to buoy up or wreak havoc
on the financial sector and the rest of the economy.
Some of that impact is due to leverage and the fact that real estate is the easiest asset to borrow
against, especially from a household‟s perspective. Indeed, in 2011, about $12 trillion of
outstanding mortgage debt had been issued against the value of residential real estate. But the
connection between real estate and the macro economy is not a bubbles-only phenomenon. Case,
Quigley, and Shiller (2005) show that variations in real estate prices have had a significant effect
on aggregate consumption in the US, in fact more significant than the stock market, even before
the recent volatility in the residential market. Reinhart and Rogoff (2009) document this to be the
case more universally across a number of countries and over longer time periods. From an
economic perspective, understanding what drives real estate values is no less important than
understands the pricing dynamics of other asset classes, such as stocks, bonds, commodities, and
currencies.
17
2.3.3 Leverage
Following the recent real estate crisis, two research areas have generated considerable interest.
First; there has been renewed attention on the role of leverage on house price dynamics.
Theoretical work by Stein (1995), McDonald (1999), Spiegel (2001), and Ortalo-Magn´e and
Rady (2006) and the empirical findings of Linneman and Wachter (1989), Genesove and Mayer
(1997), and Lamont and Stein (1999), Brown (2000), Aoki, Proudman, and Vlieghe (2004), and
Favilukis, Ludvigson, and Van Nieuwerburgh (2011) suggest that leveraged properties are more
sensitive to economic shocks. The main amplifying channel in those papers is due to the fact that
a household‟s ability to borrow is directly tied to asset values. While not all of the papers we
discuss in that section contain direct evidence of real estate predictability, they all suggest that
leverage is an important determinant of house price dynamics.
2.4 Empirical Review
This chapter gives an analysis of both international evidence and national evidence on the effect
of real estate prices by behavioral factors.
2.4.1 International Evidence
Studies by Luong, (2011) in Vietnam on behavioral factors influencing individual investors‟
decision making and performance revealed an effect of behavioral finance. The research
concluded by giving five behavioral factors that impact the investment decisions of individual
investors at the Ho Chi Minh Stock Exchange namely: Herding, Market Prospect,
Overconfidence, gamble‟s fallacy, and Anchoring-ability bias. The herding factor includes four
behavioral variables: following the decisions of the other investors (buying and selling; choice of
18
trading stocks; volume of trading stocks; speed of herding). The market factor consist s of three
variables: price changes, market information, and past trends of stocks.
Study by Mayer and Genesove (2001) from downtown Boston in the 1990s show that loss
aversion determines seller behavior in the housing market. They established that condominium
owners subject to nominal losses 1) set higher asking prices of 25-35 percent of the difference
between the property‟s expected selling price and their original purchase price; 2) attain higher
selling prices of 3-18 percent of that difference; and 3) exhibit a much lower sale hazard than
other sellers. They further point out that list price results were twice as large for owner-occupants
as investors, but hold for both. Their findings are consistent with prospect theory and help
explain the positive price-volume correlation in real estate markets behavior in the Boston
market.
They added that those who bought at the peak listed their homes for sale at 25% to 35% higher
than fair market value in hopes of avoiding regret aversion. This behavior caused their homes to
remain on the market much longer than sellers who purchased more recently and had more
realistic asking prices. Rational behavior can also be deviated from when a person„s private
information is confirmed by an independent, objective external market source. Wang, Zhoa,
Chan, and Chau (2000) 30 demonstrate that developers become over-confident and that their
over-confidence leads to over-building. These actions are found to cause excessive volatility in
the real estate sector and even affect real estate cycles.
Seiler et al (2012) examined the degree of mental accounting and false reference points in the
property markets when moving from holding a real estate investment in isolation versus holding
the asset as part of a mixed-asset portfolio their results demonstrate that mental accounting is

19
prevalent amongst investors in the real estate market. Seller and Seilcr (2010) in their study of
mental accounting and false reference points revealed that mental accounting is commonplace
and investors focus on breaking point as a reference point. Other authors who have used mental
accounting to explain the role of behavioral factors in property price dynamics include Case and
Shiller (1989, & 2004) and Shiller (2007). They all conclude that investors form expectations
about growth in property price and use that expectation as a basis for the asking price clearly
disregarding market forces.
Bokhari and Geltner (2010) in their paper on loss aversion and anchoring in commercial real
estate market data based on all U.S. sales of commercial property greater than $5,000,000 from
January 2001 through December 2009 found that loss aversion plays a significant role in the
endeavor of investors in commercial real estate they also find that more experienced investors,
and larger more sophisticated investment institutions, exhibit at least as much loss aversion
endeavor as less experienced or smaller firms.
A research hypothesis that the existence of speculative price bubbles in the real estate market is
impossible when not accompanied by behavioral factors was put forward by Brezezicka and
Winsniewski (2014) in a study of the price bubble in the real estate market by behavioral
factors. In conclusion the assumed considerations indicated that the housing price bubble could
not exist in the real estate market (REM) if its formation was not accompanied by behavioral
aspects, Brzezicka and Winsniewski (2014). The study was conducted based on the global crisis
environment using the findings of behavioral science.

20
2.4.2 Local Evidence
In Kenya, studies have been done on property pricing determinants Marete (2011) found out that
the key determinants of real estate property prices in Kiambu Municipality in Kenya were
location of a real estate property and estate agents influence on the prices. The study concluded
that prices in the real estate market are dictated by a different set of forces unlike other markets
where price are determined by forces of demand and supply. According to Makena (2012) in her
study of determinants of residential real estate prices in Nairobi she suggests that the level of
money in supply and information gave a better predictor of the real estate market on real estate
prices.
Using databases of more than 680,000 retail investor transactions at the Nairobi Securities
Exchange between 2005 – 2007, Riaga (2008) study shows that trades are systematically
correlated and individuals buy (or sell) in concert with noise trader models collectively the
findings of his study support a role for investor sentiment in the formation of stock returns.
K„Otieno (2012) in a study of investor psychology on investment decision making at Nairobi
Securities Exchange established that although investors tend to put clear the objectives of their
investment to steer investment decisions to ensure that they get returns from their investments,
psychological processes also influence the kind of an investment an individual would want to
engage in. In a study that was examining the effect of financial information on investment in
shares for Kenyan retail investors, applying the behavioral finance theory. The traditional
Efficient Market Hypothesis was deficient to explain investor behaviors in the capital markets
Aroni, 2014.

21
2.5 Summary of the Literature Review
From the literature review it can be seen that behavioral factors have been identified to influence
real estate decisions and prices. A study by Muthama, (2012) on the effects of investor
psychology on real estate market prices in Nairobi Kenya revealed an effect of psychology on
real estate prices. From the findings of the study, it is recommended that psychological factors be
taken into consideration when setting prices of real estate properties. Apart from considering
only the fundamentals, real estate property dealers should endeavor to find out the perceptions of
prospective clients and the particular psychological factors that are likely to strongly influence
the clients‟ decisions to buy and/or sell their properties.
The study further concludes that Psychological influences make real estate investors to at times
make decisions that contradict rationality. This study backed with the notion that behavioral
aspects actually influence real estate prices, will establish the effect this has on real estate prices.
This study will therefore help the economy by identifying if the real estate market is in a bubble
or just a boom. The study will therefore recommend measures to mitigate the effects of a market
crash.

22
CHAPTER THREE
RESEARCH METHODOLOGY
3.1 Introduction
This chapter describes the research design that was used in this study, the population of the
study, sampling design (sample size and sampling technique), data collection methods, data
analysis tools and techniques, and finally data validity and reliability.
3.2 Research Design
The study used a descriptive research design. A descriptive study is concerned with finding out
who, what, where, when, or how much (Cooper & Schindler, 2006). This research is descriptive
because it is concerned with discussing behavioral biases and frame dependence and their
influence on real estate prices. Primary source of data was used in this research.
3.3 Population
According to Mugenda and Mugenda (2003), a population refers to a complete set of individuals,
cases or objects with some common observable characteristics, which differentiate it from other
populations. The target population of this study is real estate agents in Kenya. While identifying
the population, the study used an online source (http://softkenya.com/property) which had an
updated data of the agents. The source had data including but not limited to: physical and postal
addresses, office telephone contacts and emails which was necessary for questionnaire
distribution. The source had 78 real estate agents. (http://softkenya.com/property)
23
3.4 Sample
A sample is a sub-set of a particular population. Sampling design encompasses sampling
technique and sample size. The study used simple random sampling technique. This is
considered appropriate because the population of the study was considered highly homogeneous.
According to Mugenda & Mugenda (2003) a sample size of between 10 and 30 % is a good
representation of the target population and hence the 30% was adequate for analysis. The sample
of this study was therefore 24 which was 30% of the total population of 78.
3.5 Data Collection
Data collection methods refer to the instruments used to gather the required data from
respondents. In this research, data was collected using structured questionnaires to facilitate ease
of analysis. The questionnaires were administered to respondents by the researcher. The
questionnaires were divided in terms of the variables being tested. Therefore each variable had a
question that had a rating on the effect of that variable. These ratings were used to quantify the
effect of that variable.
3.6 Data Analysis
The data collected for the study was analyzed using a logistic regression model. SPSS (Statistical
Packages for Social Sciences) was used to aid in analysis of the data, and was presented by use
of tables and charts. Frequencies and percentages were used to display results of findings.
24
3.6.1 Analytical Model
An appropriate real estate investment model is adopted from Levitt and Syverson (2008).
A model can be developed showing that real estate market prices depend on behavioral bias and
frame dependence as follows:
Mpre = αET + βHI +ζLA+χMA + δNF + εBP + φSH + k
3.6.2 Operationalizing the Variables
The variables used in the model are explained as follows: Mpre represents real estate market
prices; ET,HI,LA,MA,NF,BP and SH correspond to Emotional time line, Herd instinct, Loss
Aversion, Mental Accounting, Narrow Framing, Behavioral portfolios and the shadow of the
past. α, β,ζ, χ, δ, ε and φ are the coefficients of the various behavioral and frame dependence
factors which were determined in terms of the relative degree to which they influence real estate
prices; k is a constant which was introduced into the model to hold constant all other factors that
determine real estate market prices.
3.6.3 Test of Significance
The chi- squire test was used in this research. It is most often used when comparing statistical
models that have been fitted to a data set, in order to identify the model that best fits the
population from which the data are sampled.

25
CHAPTER FOUR
DATA ANALYSIS, RESULTS AND INTERPRETATION
4.1 Introduction
This chapter presents data on the findings of this research. Collected data are presented in the
form of tables and figures to facilitate comparisons using SPSS . The figures are in the form of
charts/graphs. Explanations are also given on the contents of tables and figures.
4.2 Response Rate
The population of the study was real estate agents in Nairobi County. A sample of 24 was
selected through simple random sampling. Out of these 20 responses were received representing
a response rate of 83.33 %. It is data obtained from these respondents that is analyzed and
presented.
4.3 Descriptive Statistics
Descriptive Statistics (mode, median, mean, variance, standard deviation) are used to describe
respondents‟ personal and general information with regard to real estate investment. Descriptive
statistics are also used to describe the influence level of behavioral variables on the real estate
prizes.

26
Figure 4.1 Category of Property Investment
Source: Research Findings
The respondents were requested to indicate the type of property they owned. According to the
findings in table 4.1, 15% indicated residential property, 5% indicated commercial property, 35%
indicated land, 30 % indicated all the property while 15% indicated residential and commercial.
From these findings we can deduce that majority of the property owned by respondents was land.
27
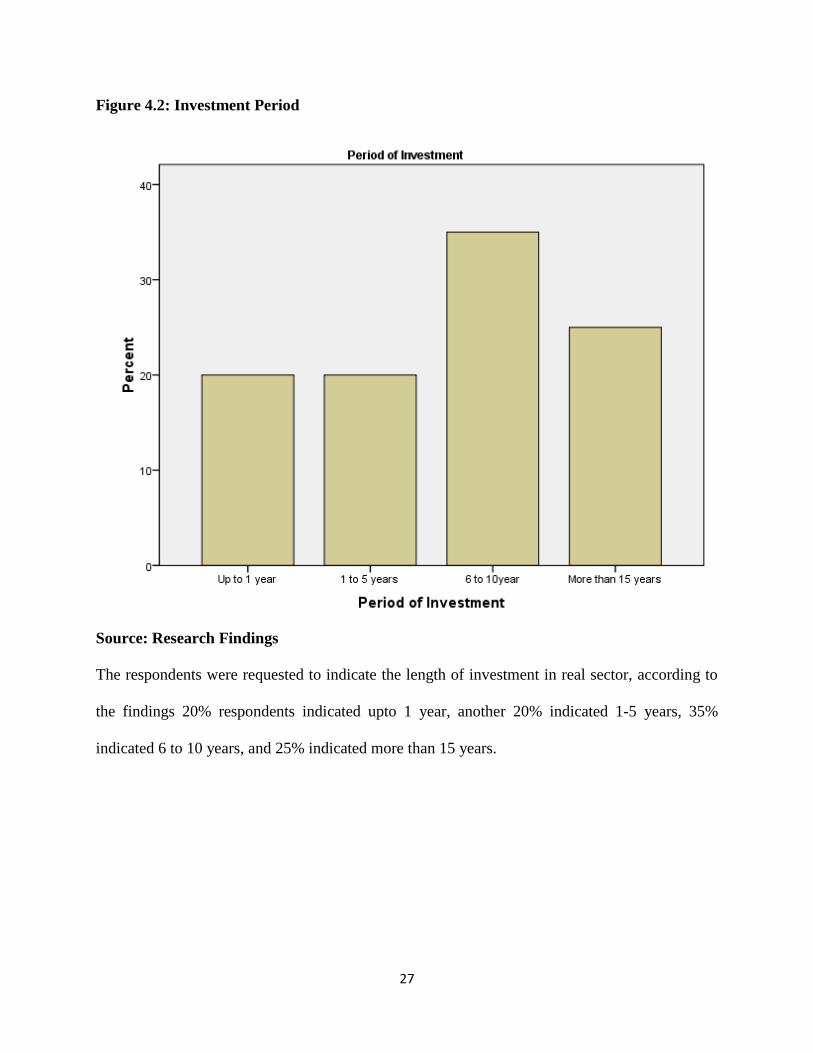
Figure 4.2: Investment Period
Source: Research Findings
The respondents were requested to indicate the length of investment in real sector, according to
the findings 20% respondents indicated upto 1 year, another 20% indicated 1-5 years, 35%
indicated 6 to 10 years, and 25% indicated more than 15 years.

28
Figure 4.3: Financing Source for Real Estate Investment
Source: Research Findings
The respondents were requested to indicate how they financed their investments. According to
the findings the 35% indicated they financed through loans, 15% through mortgage,25% through
cash,10% through loans and cash, another 10% through loans and mortgage and 5% through
mortgage and cash.

29
Figure 4.4: Main Motivation for Investment in Real Estate
Source: Research Findings
The respondents were requested to indicate their motivation for investing in real estate.
According to the findings 25% indicated capital appreciation, 35% indicated expected yield, 30%
indicated speculation, 5% indicated for both capital appreciation and expected yield while the
other 5% indicated for all. From these findings we can deduce the respondents invested mainly
for speculation.

30
Figure 4.5: Period which Clients Hold Investment
Source: Research Findings
The respondents were requested to indicate the time which clients hold investments. According
to the findings 30% indicated 6 to 12 months, 25% indicated 1 to 2 years while 45% indicated
over 2 years. From these findings we can deduce that a majority of the investors in real estate
hold their investment for more than 2 years.
31
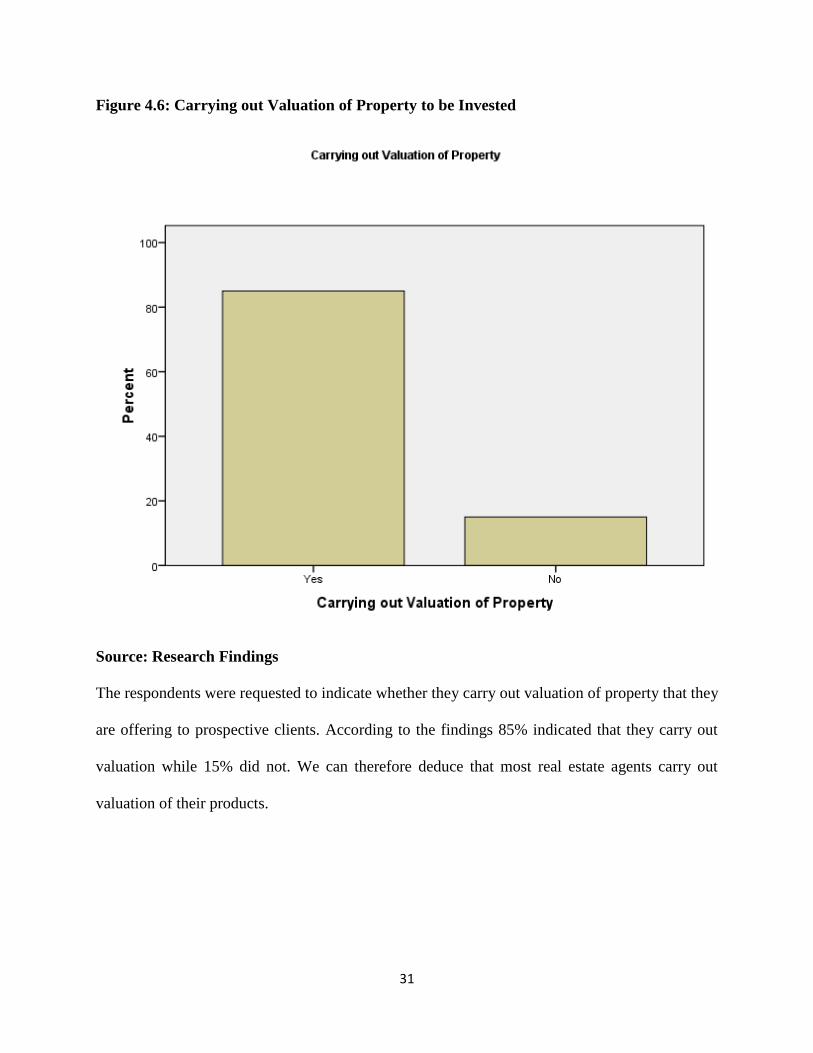
Figure 4.6: Carrying out Valuation of Property to be Invested
Source: Research Findings
The respondents were requested to indicate whether they carry out valuation of property that they
are offering to prospective clients. According to the findings 85% indicated that they carry out
valuation while 15% did not. We can therefore deduce that most real estate agents carry out
valuation of their products.

32
Table 4.1: Effect of Behavioral Factor on Real Estate Prices
Behavioral Factors Mean Std. Deviation
Emotional Time Line 3.0050 1.2344
Herd Instinct 2.4500 0.9989
Loss Aversion 4.3500 0.8127
Mental Accounting 3.3000 0.9787
Narrow Framing 3.0500 0.9445
Behavioral Portfolios 3.9000 0.7881
Shadow of the Past 2.4500 0.6863
Source: Research Findings
From the data collected it indicated that emotional time line had an effect on real estate prizes
with a mean of 3.0050 and standard deviation of 1.2344. Herd instinct had a mean of 2.4500 and
standard deviation of 0.9989. Loss aversion mean was 4.3500 and standard deviation of 0.8127.
Mental accounting had a mean of 3.3000 and standard deviation of 0.9787. Narrow framing had
a mean of 3.0500 and standard deviation of 0.9445. Behavioral portfolios had a mean of 3.9000
and standard deviation of 0.9445 while the shadow of the past had a mean of 2.4500 and a
standard deviation of 0.6863.

33
4.4.1 Correlation Analysis
The main reason for using logits in this study is that when a linear model using probabilities does
not fit the data properly, a linear model using logits does (DeMaris, 1992). For the real estate
decision model, the dependent variable is the real estate prices.
Table 4.2: Model Fitting Information
Model -2Log
Likelihood
Chi-Square
df
Sig.
Intercept Only 111.512
Final 94.153 17.359 7 .015
Source: Research Findings
The results from model fitting in the section provide results of ordinal logistic regression versus
reduced model (intercept) with complimentary log-log link function. The presence of a
relationship between the dependent variable and combination of independent variables is based
on the statistical significance of the final model. From the table, the -2LL of the model with only
intercept is 17.359 while the -2LL of the model with intercept and independent variables is
0.000. That is the difference (Chi-square statistics) is 111.512 -94.153 = 17.359 which is
significant at 0.05 since P=0.015 < 0.05. We can conclude that there is the association between
the dependent and independent variable(s) in complimentary Log-log link function.
34
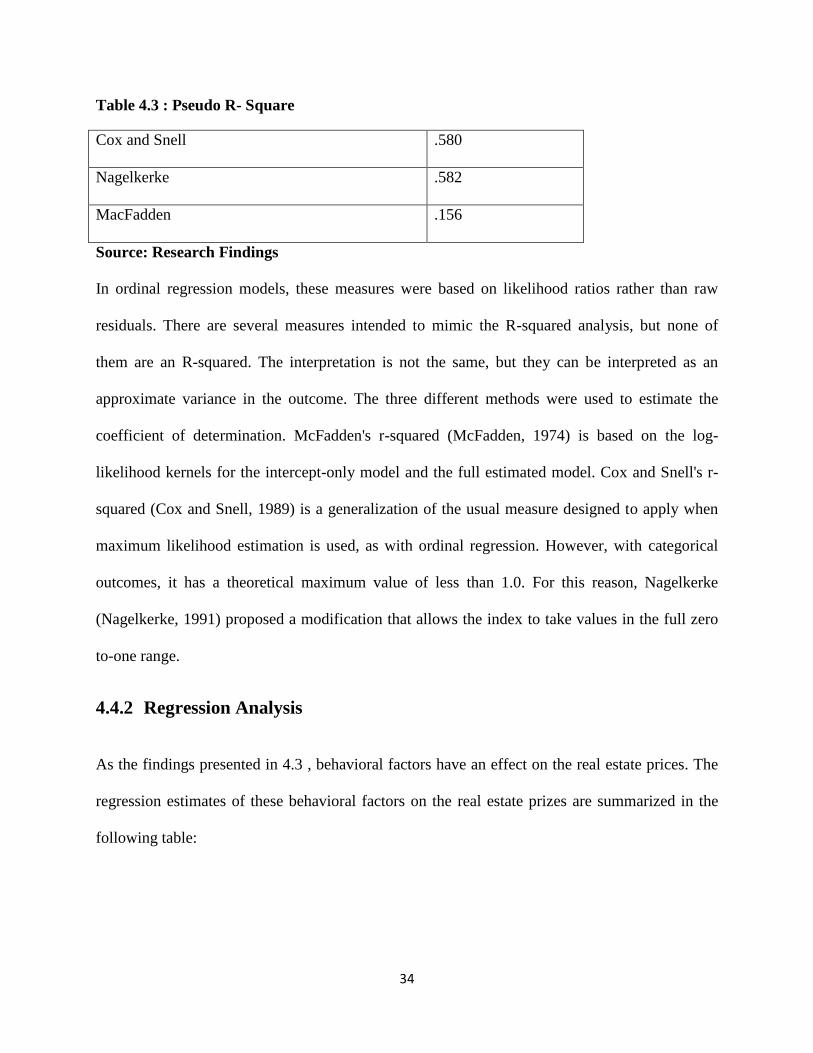
Table 4.3 : Pseudo R- Square
Cox and Snell .580
Nagelkerke .582
MacFadden .156
Source: Research Findings
In ordinal regression models, these measures were based on likelihood ratios rather than raw
residuals. There are several measures intended to mimic the R-squared analysis, but none of
them are an R-squared. The interpretation is not the same, but they can be interpreted as an
approximate variance in the outcome. The three different methods were used to estimate the
coefficient of determination. McFadden's r-squared (McFadden, 1974) is based on the log-
likelihood kernels for the intercept-only model and the full estimated model. Cox and Snell's r-
squared (Cox and Snell, 1989) is a generalization of the usual measure designed to apply when
maximum likelihood estimation is used, as with ordinal regression. However, with categorical
outcomes, it has a theoretical maximum value of less than 1.0. For this reason, Nagelkerke
(Nagelkerke, 1991) proposed a modification that allows the index to take values in the full zero
to-one range.
4.4.2 Regression Analysis
As the findings presented in 4.3 , behavioral factors have an effect on the real estate prices. The
regression estimates of these behavioral factors on the real estate prizes are summarized in the
following table:

35
Table 4.4: Parameter Estimates
Source: Research Findings
In the Parameter Estimates table we see the coefficients, their standard errors, the Wald test and
associated p-values (Sig.), and the 95% confidence interval of the coefficients. All the value for
real estate prices were statistically significant, this implies for example that a one unit increase in
Location
Estimate
Std.
Error
Waid
Df
Sig.
95% Confidence
Interval
Lower
Bound
Upper
Bound
Emotional Time
Line
-2.018 .959 4.429 1 .035 -3.897 -.139
Herd Instinct 3.889 1.377 7.975 1 .005 1.190 6.588
Loss Aversion -2.450 1.148 4.555 1 .033 -4.700 -.200
Mental
Accounting
-1.558 .981 2.525 1 .112 -3.481 .364
Narrow Framing -.979 .679 2.075 1 .150 -2.310 .353
Behavioral
Portfolio
1.153 .868 1.765 1 .184 -.548 2.854
Shadow of the Past 3.628 1.439 6.356 1 .012 .808 6.449
36
herd instinct (going from 1 to 5), we expect a 3.889 increase in real estate prizes, given all of the
other variables in the model are held constant. Test of parallel lines was designed to make
judgment concerning the model adequacy. SPSS tests the proportional odds assumption that is
commonly referred to as the test of parallel lines. The model null hypothesis states that the slope
coefficients in the model are the same across the response categories. Since the significance P-
Value=0.005< 0.05 indicated that there was significant difference for the corresponding slope
coefficients across the response categories for herd instinct, suggesting that the model
assumption of parallel.
4.4.3 Analysis of Variance
Analysis of variance (ANCOVA) is a collection of statistical models used to analyze the
differences among group means and their associated procedures. In its simplest form ANOVA
provides a statistical test of whether or not the means of several groups are equal and therefore
generalize the t- test to more than 2 groups.

37
Table 4.5 Analysis of Variance
MODEL Sum of
Squares
Df Mean
Square
F Sig.
1 Regression 2.241 3 1.243 2.312 0.21
Residual 7.772 74 2.315
Total 2.877 77
Source: Research Findings
The significance value is 0.021 which is less than 0.05 thus the model is statistically significant
in predicting how behavioral bias and frame dependence affect the real estate prizes. The F
calculated at 5% level of significance was 2.312.
4.5 Interpretation of the Findings
From the correlation of variance we can interpret that there is an association between the
dependent an Independent variable(s) in complementary Log-log Link function since the model
is significant at 0.05. Emotional time line, Herd Instinct, Loss Aversion and the Shadow of the
past when regressed at 95% confidence interval were all significant. These variables explain the
dependent variable more than any variable and there change cause a change on the dependent
variable, the dependent variable was also significant. On analysis of variance, the model was
found to be statistically significant in interpreting the effect of behavioral factors on the real
estate prices.
Behavioral factors are seen to have an effect on the real estate prizes. As it can been seen from
the data analysis results the dependent variable is positively correlated to the independent
variables. Of all independent variables Herd instinct and the Shadow of the past have had the

38
most profound positive correlation with real estate prizes. Herd instinct could estimate 3.889 of
the real estate prize while the Shadow of the past to an extent of 3.628. Emotional time line and
Loss Aversion has a negative effect on the real estate prizes. Mental accounting, Narrow
Framing and Behavioral Portfolios has an effect on the real estate prizes but it is not significant.
These results are similar to Javed, Ali, Meer and Naseem (2013) who were testing heuristics
interrupting investors rational decision making. The finding of this study showed that there is a
significant relation and impact of overconfidence, illusion of control, confirmation biases and
excessive optimism on investor decision making and there is a significant relation of status quo,
loss aversion and mantle accounting but having no impact on investor decision making.
39
CHAPTER FIVE
SUMMARY, CONCLUSION AND RECOMMENDATIONS
5.1 Introduction
This chapter presents a summation of the findings of the study. From the data analysis in the
previous chapter, the following conclusions and recommendations of the research were made
based on the findings obtained and interpreted from the data collected.
5.2 Summary
In summary form, behavioral factors have been indeed established in this study, to play a major
role in influencing real estate investors in their investment decisions, and consequently also
influencing real estate prizes. The study targeted 24 respondents in collecting data with regard to
the effect of investor sentiment on real estate investment decisions in Kenya. From the study, 20
out of the 24 sample respondents filled-in and returned the questionnaires making a response rate
of 83%. According to Babbie (2002) any response of 50% and above is adequate for analysis
thus 83% is even better. All the target respondents were real estate agents who have invested in
real estate.
The objective of the study was to establish the effect of behavioral factors on real estate prizes in
Kenya. Emotional time line had an effect on real estate prizes with a mean of 3.0050 and
standard deviation of 1.2344. Herd instinct had a mean of 2.4500 and standard deviation of
0.9989. Loss aversion mean was 4.3500 and standard deviation of 0.8127. Mental accounting
had a mean of 3.3000 and standard deviation of 0.9787. Narrow framing had a mean of 3.0500
40
and standard deviation of 0.9445. Behavioral portfolios had a mean of 3.9000 and standard
deviation of 0.9445 while the shadow of the past had a mean of 2.4500 and a standard deviation
of 0.6863.
K„Otieno (2012) in a study of investor psychology on investment decision making at Nairobi
Securities Exchange established that although investors tend to put clear the objectives of their
investment to steer investment decisions to ensure that they get returns from their investments,
psychological processes also influence the kind of an investment an individual would want to
engage in.
Seiler (2012) examined the degree of mental accounting and false reference points in the
property markets when moving from holding a real estate investment in isolation versus holding
the asset as part of a mixed-asset portfolio their results demonstrate that mental accounting is
prevalent amongst investors in the real estate market. They all conclude that investors form
expectations about growth in property price and use that expectation as a basis for the asking
price clearly disregarding market forces.
5.3 Conclusions
The study findings conclude that behavioral factors are dependent upon herd instinct, emotional
time line, loss aversion and the shadow of the past. From the findings, it can be concluded that
investors in the Kenyan property market are influenced by behavioral factors. Herd instinct and
the shadow of the past are the most dominant influencing behaviors. Thus these factors will fall
into play and hence influence property prizes. This explains why properties would trade beyond
the expert's valuation. Further, Kenyan property investors sometimes use predictive skills, have
high expectations on property returns and uses property price as a reference point in trading.

41
It is worth noting that uncertainty will compel any decision maker to be influenced by behavioral
factors rather than right information and this plays a crucial role in making investment decisions.
In turn, this exposes investors in a situation whereby they find it difficult to disengage
themselves from bad investment or cutting losses because they have put so much trust on gut
feelings. There is need for the investor to place more liability on facts and figures as opposed to
behavioral factors.
5. 4 Recommendations for Policy and Practice
The study therefore recommends that the real estate investors need to do an analysis the
investment factors carefully using the reasonable traditional finance knowledge before making
an investment decision. The investors should also be able to interpret the market and economic
indicators since they influence the performance prospects of the property in the market. They
should also evaluate all the variables in the environment instead of considering only behavioral
factors.
From the findings of this study, it is recommended that behavioral factors be taken into
consideration when evaluating real estate prizes. Apart from considering only the fundamentals,
real estate property investors should make an effort to find out the perceptions of prospective
investments and the particular psychological factors that are likely to strongly influence their
decisions to buy and/or sell their properties.
The regulatory authorities must take into account the behavioral factors affecting the real estate
prizes and proper regulations should be incorporated which could help in reducing irrational
behavior in the real estate industry. The objective to policy makers should focus on creating
awareness and conditions through which behavioral factors have the least amount of impact on

42
the real estate prices. This would also ensure that the economy is cautioned from a market crash
as was witnessed in America and China in 2007.
5.5 Limitations of the Study
The main limitation is the fact that this study only covered Nairobi leaving out other urban areas
of Kenya. It would have been ideal to cover other geographical regions other than Nairobi. The
study was also limited to only some aspects of investor sentiment (frame dependence and
behavioral factors) whereas behavioral finance theory has identified a number of biases that can
influence the investor„s decision making.
Limitation of time made it impractical to have more respondents in the study. More respondents
would have been essential to increase the representation of the real estate investors in Kenya in
this study. There was also a limitation of finances, collection of data proved to be an expensive.
Had there been more funds there could have been a bigger geographical location covered as well
as more questionnaires given out. Respondents were also not very welcoming, as they saw
filling of questionnaires being a distraction from their busy schedules, one needed to be very
patient

43
5.6 Suggestion for Further Research
A similar study is recommended to be undertaken in a different locality in Kenya or even in
another country so as to compare the findings with those of this research.
Further studies would also be recommended in the areas of valuation methods used by the real
estate agents and a comparison to the traditional finance methods should be done. This is so
because during the research most agents admitted to doing valuation but when prompted on the
method used the answers though not analyzed dint seem to be the conventional valuation
methods. I would also suggest a research on the total investments in real estate that are as a result
of psychological factors.
44
REFERENCES
Aroni, J. (2014). The Effect Of Financial Information On Investment In Shares – A Survey Of
Retail Investors In Kenya. International Journal of Business and Commerce Vol. 3,
No.8: Apr 2014[58-69] (ISSN: 2225-2436) Published.
Agnello,L. & Schuknecht,L.(2009). Booms and Busts in Housing Markets Determinants and
Implications. European Central Bank, Working Paper Series no 1071/July 2009.
Birau,R.F (2012). The impact of Behavioral finance on stock markets. Annals of the „Constantin
Brâncuşi” University of Târgu Jiu, Economy Series, Issue 3/2012
Bikhchandani, S., Hirshleifer, D. & Welch. I. 1992. A Theory of Fads, Fashion, Custom, and
Cultural Change as Informational Cascades. Journal of Political Economy 100, 992-
1026.
Bokhari, S., & Geltner, D. (2010). Loss Aversion and Anchoring in Commercial
Real Estate Pricing: Empirical Evidence and Price Index Implications.‖ Real Estate
Economics 39.4 (2011): 635–670.
Brown, David T., (2000) .Liquidity and Liquidation: Evidence from Real Estate Investment
Trusts, The Journal of Finance 55, 469–485.
Brzezicka J. & Wisniewski R., (2014) Price bubble in the real estate market - behavioral aspects,
Real Estate Management and Valuation, vol. 22, no. 1, pp. 80-93.
Case, K. & Shiller, R. (1989). The Efficiency of the Market for Single -Family Homes, American
Economic Review, 79, 125-37.
45
Case, J. M. Quigley, and R. Shiller, 2005, Comparing wealth effects: The stock market versus
the housing market, Advances in Macroeconomics 5, 1.
Constantinescu, M. (2010). “What is the “duration” of Swiss direct real estate?" Journal of
Property Investment & Finance, Vol. 28 Iss: 3, pp.181 – 197.
Cooper, D.R., & Schindler P.S (2006). Businses Research Methods (6th ed).New York, N.Y: Mc
Graw-Hill
Cox.D.R, & Snell.E.J (1989) The analysis of Binary Data. Second Edition,London: Champman
and Hall.
Chen, G., Kim, K.A. Nofsinger, J.R. and Rui, O.M. (2007). Trading performance, disposition
effect, overconfidence, representativeness bias, and experience of emerging market
investors. Journal of Behavioral Decision Making, 20 (4), 425-451.
Chira, I. Adams, M. & Thornton, B. (2008). Behavioral Bias withinthe Decision Making
Process. Journal of Business & Economics Research August 2008 Volume 6, Number 8 11
Daniel, K. Hirshleifer, D.& Subrahmanyam,A.(1998). Investor psychology and security market
under- and overreactions, Journal of Finance 53 (1998), pp. 1839–1886.
Demaris, A (1992). Logit Modeling; Practical Applications. Newbury,P.K,CA : Sage
Dennis,R. Patric ,H.C. Christopher, H.C.M. and Mayer, J. (2002). Determinants of real house
price dynamics. National Bureau of Economic Research 1050 Massachusetts Avenue,
Working paper 9262.
46
Choka.D (2012) The effect of investor sentiment on real estate investment decisions in Kenya.
Unpublished MSC finance project, University of Nairobi.
Fama E. (1965). The Behavior of Stock-Market Prices, Journal of Business, 38(1), pp. 34-105.
Fama E. & French R., (1993), Common Risk Factors in the Returns on Stock and Bonds, Journal
of Financial Economics, 33(1), pp. 3-56.
Favilukis, J. Ludvigson,S & Nieuwerburgh, S.V. (2011). Macroeconomic implications of
housing wealth, housing finance, and limited risk-sharing in generaln equilibrium, NBER
working paper.
Genesove, D. and Mayer, C. (2001). Loss aversion and seller behavior: evidence from the
housing market. Quarterly Journal of Economics, 116 (4), 1233−1260.
Ghysels,E. Plazzi,A. Torous,W. (2012).Forecasting Real Estate Prices. Handbook of
Economic Forecasting: Vol II, G. Elliott and A. Timmermann (Eds.), Elsevier.
Grether,D.M., Mieszkowski,P.(1973).Determinants of Real Estate Values. Journal of urban
economics1, 127-146 (1974)
Genesove, D., & C. Mayer (2001). Loss Aversion and Seller Behavior: Evidence from the
Housing Market," The Quarterly Journal of Economics, 116(4), 1233-1260.
Havard, T. (1999), “ Do Valuers Have a Greater Tendancy to Adjust a Previous Valuation
Upwards or Downwards ” Journal of Property Investment and Finance, Vol 17 No
4,pp.365-373

47
Hirshleifer, David., and Teoh, Slew Hong. 2003. Herd Behavior and Cascading in Capital
Markets: a Review and Synthesis. European Financial Management 9(1): 25 – 66.
Hass Composite Index, (2012), Hass Consult Ltd http://www.hassconsult.co.ke/hass/index
Javed,A. Ali,U. Meer,U.I. and Naseem, M.M.(2013). Emphirical testing of heuristics
interrupting the investor‟s rational decision making. European Scientific Journal Octobe
2013 edition vol.9, No.28 ISSN: 1857 – 7881 (Print) e - ISSN 1857- 7431 432
Kahneman, D & Tversky, A. (1979). “Prospect Theory: An Analysis of Decision under
Risk”, Econometrical, 47(2), 263-291.
Kalunda, E.N & Mbaluka P.K, (2012). Test of Endowment and Disposition Effects under
Prospect Theory on Decision-Making Process of Individual Investors at the Nairobi
Securities Exchange,” Kenya. Research Journal of Finance and Accounting Vol. 3, No 6,
2012, pp 157-171.
Lamont, O. & Stein,J (1999). Leverage and House-Price Dynamics in U.S. Cities, RAND Journal
of Economics 30, 498–514.
Lemieux.P (2003). Informational Cascades: why everybody thinks alike. Lemieux en Liberté.
Montreal, November 22, 2003 / No 133
Luong, P.L Ha, T.T.D (2011). Behavioral factors influencing individual investor‟s decision
making and performance. Survey of the Ho Chi Minh Stock Exchange, Umea School of
Business Spring semester 2011 Master thesis.

48
Macharia, E.W (2013).The effects of Global financial crisis on the financial performance of
commercial banks offering mortgage finance in Kenya. International Journal of
Economics and Finance Vol.1, Issue 2, 2013
Miregi M.O, & Obere.A, (2014). Effects of Market Fundamental Variables on Property Prices in
Kenya – A Case of Nairobi Residential Property Market. IOSR Journal of Economics and
Finance (IOSR-JEF) e-ISSN: 2321-5933, p-ISSN: 2321-5925.Volume 5, Issue 5. (Sep.-
Oct. 2014), PP 101-113.
McDonald, John F., (1999). Optimal leverage in real estate investment, Journal of Real Estate
Finance and Economics 18, 239–252.
McFadden, Daniel (1974). “Conditional Logit Analysis of Quantitive Choice Behavior,” in
Zarembka, Paul, ed., FRONTIERS IN ECONOMETRICS, Academic Press: New
York,105-142
Mayer,J.C., Sinai,T.( 2007). U.S. House Price Dynamics and Behavioral Finance.
Marete .D.K (2011). The determinants of real estate property prices: the case of Kiambu
Municipality in Kenya‖ , Unpublished MBA project, University of Nairobi.
Michael, J. S, Vicky, L. S & Mark A. L, (2012) Mental Accounting and False Reference Points
in Real Estate Investment Decision Making, Journal of Behavioral Finance, 13:1, 17-26
Mugenda, O. M. &Mugenda, A. G. (2003). Research Methods: Quantitative and Qualitative
Approaches. Nairobi: Acts Press.

49
Muthama .D. K, (2012). Effects of Investor Psychology on Real Estate market prices in Nairobi,
Kenya Unpublished MBA project, University of Nairobi.
Nagelkerke, N.J.D (1991). A note on a general definition of the coefficient of determination.
Biometrika,78,691-6925
Nofsinger J, (2001) psychology of investing 3rd edition, USA Prentice Hall
Odean, T (1998). Are Investors Reluctant to Realize Their Losses? Journal of Finance
53, 1775-1798.
Ortalo-Magn´e, F & Rady.S, (2006). Housing Market Dynamics: On the Contribution of Income
Shocks and Credit Constraints, Review of Economic Studies 73,459–485.
Rasheed, U. Rafta,S.S, Fatima S, & Maqsood M.( 2013). Impact of Behavioral Biases on
Investors Decision Making: Male Vs Female. IOSR Journal of Business and
Management (IOSR-JBM)
Scharfstein, David S. & Stein, Jeremy C.2000. Herd Behavior and Investment. The American
Economic Review 80(1) : 465 – 479.
Spiegel, Matthew, (2001). Housing Return and Construction Cycles, Real Estate Economics 29,
521–551.
Subash, R.(2012). Role of Behavioral Finance in Portfolio Investment Decisions: Evidence from
India. Master Thesis, Charles University in Prague.

50
Stepanyan,V. Poghosyan T, & Bibolov A, (2010). House Price Determinants in
Selected Countries of the Former Soviet Union. IMF working Paper
Stohldreier, M.T (2012). The Determinants of House Prices in Chinese Cities. Master
Thesis,University of Zurich.
Shiller,( 2007).Understanding Recent Trends in House Prices and Homeowner-ship."
Yale University - International Center for Finance, Cowles Foundation Discussion
Paper, 2007 (1630).
Shiller, Robert J., and Karl E. Case, (2004). Is there a bubble in the housing market?" Yale
University - Research in Economcs, Cowles Foundation Discussion Paper, 2007
(1089).
Shefrin, Hersh (2007). Behavioral Corporate Finance. Decisions that Create Value. McGraw-
Hill/Irwin. New York, 2007.
Shefrin, Hersh. 2000. Beyond Greed and Fear: Understanding Behavioral Finance and the
Psychology of Investing. New York: Oxford University Press.
Shefrin, H. & Statman, M. (2000), Behavioral Portfolio Theory, The Journal of Financial and
Quantitative Analysis Vol. 35, No. 2 (Jun., 2000), pp. 127-151.
Shleifer,A. & Vishny,R.W (1997), The Limits of Arbitrage, The Journal of Finance, Vol. 52,
No. 1, pp. 35-55.
Shleifer, A. (2000). Inefficient Markets: An Introduction to Behavioral Finance. Oxford, U:
Press, Oxford.
51
Statman, M. fisher, K. Anginer, D. (2008). Affect in a behavioral asset-pricing model, financial
analysis journal, 74(2) 20-29
Stein, Jeremy C., 1995, Prices and Trading Volume in the Housing Market: A Model with
Down-Payment Effects, The Quarterly Journal of Economics 110, 379–406.
Thaler,R.(1999). The End of Behavioral Finance. Financial Analysts Journal,
November/December, 12. The Journal of Behavioral Finance, 5(2): 116-126
Wang, K., Y. Zhoa, S. Chan, & K. Chau. Over-Confidence and Cycles in Real Estate Markets:
Cases in Hong Kong and Asia. International Real Estate Review, 2000, 3:1, 93–108.
Zilibotti.F (2012). The Determinants of House Prices in Chinese Cities. Master of Arts in
Wirtschaftswissenschaften. Unpublished Masters degree, University of Zurich.

52
APPENDICES
Appendix I: List of Property and Real Estate Companies in Kenya as at 19th July 2015
1. Active Homes 2. Josmarg Agencies
3. Afriland Agencies 4. Kali Security Co Ltd
5. Ark Consultants Ltd 6. Karengata Property Managers
7. Barloworld Logistics (Kenya) Ltd 8. Kenya Prime Properties Ltd
9. Betterdayz Estates 10. Kenya Property Point
11. British American Asset Managers 12. Kilifi Konnection
13. Canaan Properties 14. Kiragu & Mwangi Limited
15. Capital City Limited 16. Kitengela Properties Limited
17. CB Richard Ellis 18. Knight Frank Limited
19. Colburns Holdings Ltd 20. Kusyombunguo Lukenya
21. Coral Property Consultants Ltd 22. Land & Homes
23. Country Homes and Properties 24. Land & Homes
25. Crown Homes Management 26. Langata Link Estate Agents
27. Crystal Valuers Limited 28. Langata Link Ltd
29. Daykio Plantations Limited 30. Lantana Homes
31. Double K Information Agents 32. Legend Management Ltd

53
33. Dream Properties 34. Lloyd Masika Limited
35. Dunhlill Consulting Ltd 36. Mamuka Valuers (M) Ltd
37. East Gate Apartments Limited 38. Mark Properties Ltd.
39. East Gate Apartments Limited 40. MarketPower Limited
41. East Gate apartments limited 42. Mentor Group Ltd
43. Eastwood Consulting Limited 44. Merlik Agencies
45. Ebony Estates Limited 46. Metrocosmo Ltd
47. Ebony Estates Limited 48. Mombasa Beach Apartments
49. Elgeyo Gardens Limited 50. Monako Investment Ltd
51. Fairway Realtors And Precision Valuers 52. Muigai Commercial Agencies Ltd.
53. FriYads Real Estate 54. Myspace Properties (K) Ltd.
55. Gimco Limited 56. N W Realite Ltd
57. Greenspan Housing 58. Nairobi Real Estates
59. Hajar Services Limited 60. Neptune Shelters Ltd
61. Halifax Estate Agency Ltd. 62. Oldman Properties Ltd
63. HassConsult 64. Oloip Properties
65. Hewton Limited 66. Ounga Commercial Agencies
67. Homes and lifestyles 68. Palace Projects Limited

54
69. Housing Finance 70. Property Investment Network
71. Jacent Properties Limited 72. property zote.com
73. Jimly Properties Ltd 74. Raju Estate Agency Limited (REAL)
75. Jogoo Road Properties 76. Tysons Limited
77. Josekinyaga Enterprises Ltd 78. Urban Properties Consultants &
Developers Ltd
Source: (http://softkenya.com/property)

55
Apendix II: Questionnaire
Below is a questionnaire that intends to capture your views towards the effect of behavioral
biases and frame dependence on real estate prices in Kenya. Please note that information given is
intended for academic purposes only. Ensure that you respond to all the questions.
Thanks in advance.
THE EFFECT OF BEHAVIORAL BIAS AND FRAME DEPENDENCE ON REAL
ESTATE PRICES IN KENYA
PART 1: BACKGROUND INFORMATION
1. Name of the Real estate agent.
Company/Investor__________________________________
2. Indicate your category of real estate property investment
Residential Properties [ ] Commercial Properties [ ] Land [ ]
3. For how long have you been investing in the real estate sector?
Up to 1 year [ ] 6-10 years [ ] 1-5 years [ ] More than 15 years [ ]
4. How do you mainly finance your investments?
Loans [ ] Mortgage [ ] Cash [ ] other (Please specify) _____________________
5. What is your client‟s main motivation for investment in real estate?
Capital Appreciation [ ] Expected Yield [ ] Speculation [ ]

56
Other (Please specify) _____________________
6. On average, how long do your clients hold investments?
[ ] 1-6 Months [ ] 6-12 Months [ ] 1-2 Years [ ] Over 2 years
7. Do you carry out valuation for property that you are investing in or selling to your
clients?Yes ( ) No ( )
8. What valuation model do you use? please specify
…………………………………………………………………………………………….
……………………………………………………………………………………………
…………………………………………………………………………………………….
9. Do you advice your clients while investing in the real estate on the basis of valuation
carried out.
Yes ( ) No ( )
10. Do your clients maintain an efficient portfolio while investing in real estate?
Yes ( ) No ( )
11. With changes on client‟s investment, do the clients refer to their portfolios?
Yes ( ) No ( )

57
PART 2:
To what extent do the following factors influence your decisions and that of your
clients in investing in real estate property?
Use the following scale: 1= Very Great Extent; 2= Great Extent; 3= Moderate; 4 =
Small Extent; 5 = Very Small Extent.
Tick the extent in the brackets at the end of each question. The questions have
been categorized according to the variables of the study.
Emotional Time Line.
1) To what extent does hope and fear drive your clients while investing in real
estate?
1. ( ) 2. ( ) 3. ( ) 4. ( ) 5. ( )
Herd Instinct.
2) To what extent do you provide real estate valuation to your clients?
1. ( ) 2. ( ) 3. ( ) 4. ( ) 5. ( )
3) To what extent do you use news events when investing in the real estate
market?
1. ( ) 2. ( ) 3. ( ) 4. ( ) 5. ( )

58
4) To what extent do you use the following media for marketing your
property?
Radio. 1. ( ) 2. ( ) 3. ( ) 4. ( ) 5. ( )
TV 1. ( ) 2. ( ) 3. ( ) 4. ( ) 5. ( )
Newspaper 1. ( ) 2. ( ) 3. ( ) 4. ( ) 5. ( )
Business newspaper 1. ( ) 2. ( ) 3. ( ) 4. ( ) 5. ( )
Financial Journals and publications 1. ( ) 2. ( ) 3. ( ) 4. ( ) 5. ( )
5) To what extent do you use as an opinion of other real estate agents/experts
to assess performance of the real estate market?
1. ( ) 2. ( ) 3. ( ) 4. ( ) 5. ( )
6) To what extent do you rely on opinion of peers or family for real estate
investment decisions?
1. ( ) 2. ( ) 3. ( ) 4. ( ) 5. ( )
Loss Aversion.
7) To what extent do your clients view opportunities with regard loss and gain
as compared to total wealth while investing?
1. ( ) 2. ( ) 3. ( ) 4. ( ) 5. ( )

59
Mental Accounting.
8) To what extent does your client speculate on gains in real estate as
compared to their original capital investment?
1. ( ) 2. ( ) 3. ( ) 4. ( ) 5. ( )
Narrow Framing.
9) To what extent do your clients evaluate an investment option in relation to
their portfolios?
1. ( ) 2. ( ) 3. ( ) 4. ( ) 5. ( )
Behavioral Portfolios.
10) To what extent do your clients evaluate an investment decision with
reference
to changes in their total wealth?
1. ( ) 2. ( ) 3. ( ) 4. ( ) 5. ( )
Shadow of the past
11) To what extent do you use past performance as an indicator of future
performance when investing in property?
1. ( ) 2. ( ) 3. ( ) 4. ( ) 5. ( )

60
12) Are there other behavioral factors that influence your client‟s decision
investing in real estate? Please specify.
………………………………………………………………………………………
………………………………………………………………………………………
………………………………………………………………………………………
………………………………………………………………………………………
………………………………………………………………………………………
……………………………………………………….THANK YOU