Cyclical Unemployment Occurs because of a downturn in the economy. (SSEMA1_d)
Upload
truongcongCategory
view
226download
1
99th Congress JOINT COMMITTEE PRINT S. PET1.2d Session I L 99-174
THE ECONOMY, SMALL BUSINESS ANDTHE FEDERAL BUDGET
A REPORT
PREPARED FOR THE USE OF THE
JOINT ECONOMIC COMMITTEECONGRESS OF THE UNITED STATES
BY THE
REPUBLICAN STAFF
OF THE
JOINT ECONOMIC COMMITTEE
AUGUST 15, 1986
62-533 0
Printed for the use of the Joint Economic Committee
U.S. GOVERNMENT PRINTING OFFICE
WASHINGTON: 1986
For sale by the Superintendent of Documents, Congressional Sales OfficeU.S. Government Printing Office, Washington, DC 20402

JOINT ECONOMIC COMMITTEE
[Created pursuant to sec. 5(a) of Public Law 304, 79th Congress]HOUSE OF REPRESENTATIVES
DAVID R. OBEY, Wisconsin, ChairmanLEE H. HAMILTON, IndianaPARREN J. MITCHELL, MarylandAUGUSTUS F. HAWKINS, CaliforniaJAMES H. SCHEUER, New YorkFORTNEY H. (PEME) STARK, CaliforniaCHALMERS P. WYLIE, OhioDAN LUNGREN, CaliforniaOLYMPIA J. SNOWE, MaineBOBBI FIEDLER, California
SENATEJAMES ABDNOR, South Dakota,
Vice ChairmanWILLIAM V. ROTH, JR., DelawareSTEVEN D. SYMMS, IdahoMACK MATTINGLY, GeorgiaALFONSE M. D'AMATO, New YorkPETE WILSON, CaliforniaLLOYD BENTSEN, TexasWILLIAM PROXMIRE, WisconsinEDWARD M. KENNEDY, MassachusettsPAUL S. SARBANES, Maryland
Scorr LIUY, Executive DirectorROBERT J. TOSTERUD, Deputy Director
(ll)

LETTER OF TRANSMITTAL
AUGUST 1, 1986.Hon. DAVID R. OBEY,Chairman, Joint Economic Committee,Congress of the United States, Washington, DC.
DEAR MR. CHAIRMAN: I am pleased to submit a report entitled"The Economy, Small Business and the Federal Budget." Thisreport was prepared by the Republican staff of the Joint EconomicCommittee for the use of the delegates to 1986 White House Con-ference on Small Business.
As small business people from across the Nation convene inWashington, they will address a wide range of issues. They willmake recommendations for government policies that will benefitsmall business and thus the Nation as a whole. Based on a com-monsense approach to decisionmaking, their recommendations areextremely valuable to policymakers in the Government. By pre-senting information on the economy, small business and the Feder-al budget, it is hoped that this report will serve as a useful tool tothe delgates.
Sincerely,JAMES ABDNOR,
Vice Chairman, Joint Economic Committee.
(III)
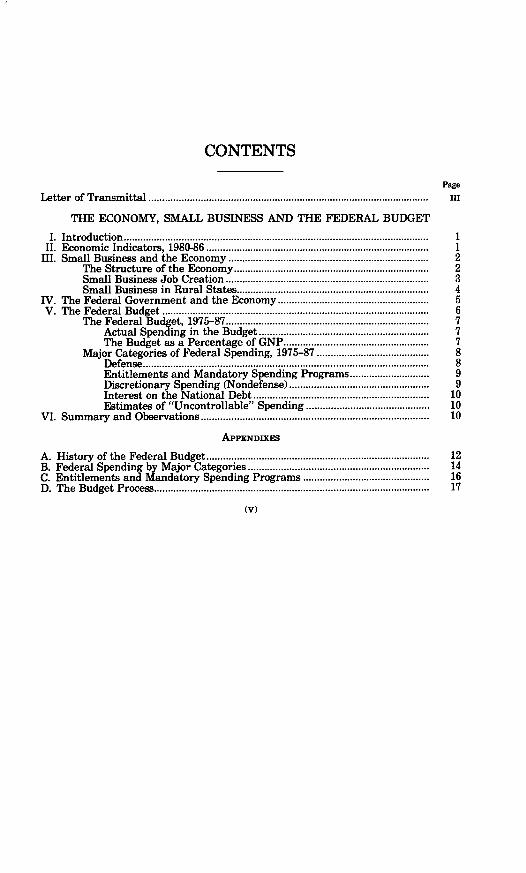
CONTENTS
Page
Letter of Transmittal ........................................................... I
THE ECONOMY, SMALL BUSINESS AND THE FEDERAL BUDGET
I. Introduction ............................................................ 1II. Economic Indicators, 1980-86 ............................................................ 1
III. Small Business and the Economy .......................................................... 2The Structure of the Economy .......................................................... 2Small Business Job Creation ........................................ 3Small Business in Rural States ........................................................... 4
IV. The Federal Government and the Economy . ...................................................... 5V. The Federal Budget ............................................................ 6
The Federal Budget, 1975-87 .......................................................... 7Actual Spending in the Budget .......................................................... 7The Budget as a Percentage of GNP . .................................................... 7
Major Categories of Federal Spending, 1975-87 . ........................................ 8Defense........................................................................................................ 8Entitlements and Mandatory Spending Programs . . 9Discretionary Spending (Nondefense) . .................................................. 9Interest on the National Debt ........................................................... 10Estimates of "Uncontrollable" Spending ............................................. 10
VI. Summary and Observations .................. ......................................... 10
APPENDIXES
A. History of the Federal Budget ........................................................... 12B. Federal Spending by Major Categories ........................................................... 14C. Entitlements and Mandatory Spending Programs ............................ .................. 16D. The Budget Process ........................................................... 17
(V)
THE ECONOMY, SMALL BUSINESS AND THE FEDERALBUDGET
I. INTRODUCTION
Delegates to the White House Conference on Small Businesshave been and will be addressing a wide range of issues. Smallbusiness recommendations for fiscal, tax, monetary, regulatory,and other government policies provide valuable advice to electedand other government officials at all levels.
Small businesses are at the frontlines in the battle for economicprosperity and survival. They are continually confronted with deci-sions that require information, analysis, and common sense. Thepurpose of this document is to provide broad-based information onthe economy, small business, and the Federal budget. It is hopedthat this information will be useful to the delegates as they formu-late their recommendations.
II. ECONOMIC INDICATORS, 1980-86
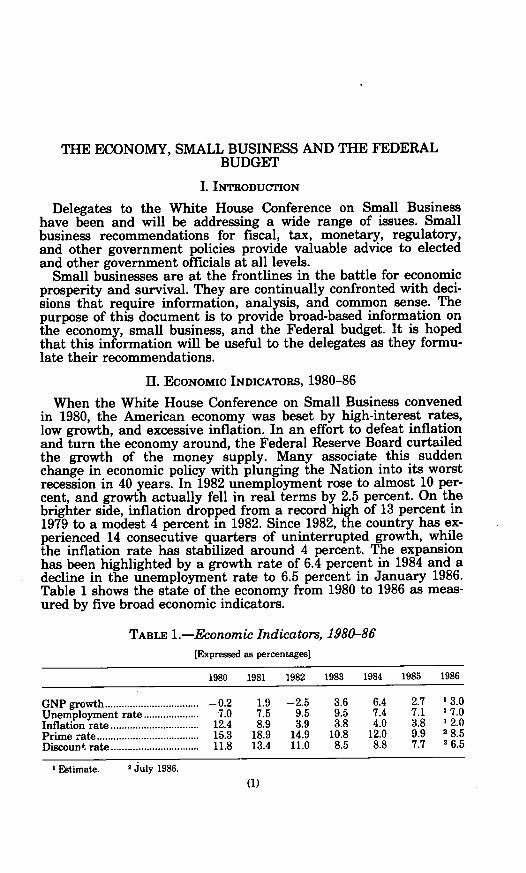
When the White House Conference on Small Business convenedin 1980, the American economy was beset by high-interest rates,low growth, and excessive inflation. In an effort to defeat inflationand turn the economy around, the Federal Reserve Board curtailedthe growth of the money supply. Many associate this suddenchange in economic policy with plunging the Nation into its worstrecession in 40 years. In 1982 unemployment rose to almost 10 per-cent, and growth actually fell in real terms by 2.5 percent. On thebrighter side, inflation dropped from a record high of 13 percent in1979 to a modest 4 percent in 1982. Since 1982, the country has ex-perienced 14 consecutive quarters of uninterrupted growth, whilethe inflation rate has stabilized around 4 percent. The expansionhas been highlighted by a growth rate of 6.4 percent in 1984 and adecline in the unemployment rate to 6.5 percent in January 1986.Table 1 shows the state of the economy from 1980 to 1986 as meas-ured by five broad economic indicators.
TABLE 1.-Economic Indicators, 1980-86[Expressed as percentages]
1980 1981 1982 1983 1984 1985 1986
GNP growth . ..................... -0.2 1.9 -2.5 3.6 6.4 2.7 1 3.0Unemployment rate .................... 7.0 7.5 9.5 9.5 7.4 7.1 1 7.0Inflation rate ...................... 12.4 8.9 3.9 3.8 4.0 3.8 1 2.0Prime rate..................................... 15.3 18.9 14.9 10.8 12.0 9.9 2 8.5Discount rate............................... 11.8 13.4 11.0 8.5 8.8 7.7 2 6.5
I Estimate. 2 July 1986.(1)

2
On balance, the economy improved substantially between 1980and 1986. The simultaneous decline in inflation and unemploymentis unprecedented in U.S. postwar economic history. The dramaticdrop in interest rates is particularly important for business to fi-nance inventories and investment. In addition, a return to long-term, fixed rate mortgages has helped provide stimulus and stabili-ty to homebuyers and the housing industry.
While the Nation as a whole has prospered during the last fouryears, the recovery has been uneven. Areas of the country dominat-ed by agriculture, manufacturing, mining, and natural resource in-dustries have lagged behind. Similarly, while small business hasbenefited from the general decline in interest rates, it still tends toexperience higher borrowing costs than indicated by the primerate.
m. SMALL BUSINESS AND THE ECONOMY
There is no question that small business plays a vital role in theNation's economy. Small and medium-sized businesses have provento be more flexible and adaptable than large businesses. Thatadaptability is crucial because small businesses are generally thefirst to experience economic downturns and the first to lead eco-nomic recoveries. In addition, small and medium-sized businessesare the Nation's leaders in job creation and innovation.
It is difficult, however, to measure fully the role or contributionof small business in the economy. First, small and medium-sizedbusinesses do not fall into any single, simple definition. They arecomprised of sole proprietorships, partnerships, small business cor-porations, and "regular" corporations. They may be privatelyowned by family or friends and participate in every industry. Inshort, they permeate every walk of business life. Second, measur-ing their role in the economy requires a great deal of detailed in-formation to be completely accurate-a mountain of paperworkwould be required to obtain all the necessary information fromsmall and medium-sized businesses.
Notwithstanding these limitations, the Small Business Adminis-tration's Office of Advocacy has compiled excellent data classifyingbusinesses by number of employees. For purposes of this discussion,small businesses are classified as those with less than 100 employ-ees; small and medium-sized businesses as those with less than 500employees. The most recent year for which complete data are avail-able is 1982, although updated data from SBA should be availablein the near future.
The Structure of the EconomyTable 2 shows that small business is a major player in the econo-
my.

3
TABLE 2.-The Structure of the U.S. Economy[In percent]
NumberNumber of Ast Reips Net
Size of firm (by number of employees) of firms employ- A Reeipts incomeees
0 to 19 employees .......................... 88.0 21.0 9.0 17.0 16.520 to 99 employees .......................... 10.5 20.0 13.0 16.0 10.2
Subtotal, under 100 employees.. 98.5 41.0 22.0 33.0 26.7100 to 499 employees .......................... 1.3 12.0 13.0 12.0 8.2
Subtotal, under 500 employees.. 99.8 53.0 35.0 45.0 34.9500 or more employees ....................... 0.2 47.0 65.0 55.0 65.1
Total, all firms ............................. 100.0 100.0 100.0 100.0 100.0
Source: Small Business Administration, Office of Advocacy.
Over 99 percent of all businesses are small and medium sized,and they employ 53 percent of the work force. They own 35 percentof business assets, generating 45 percent of business gross receiptsand 35 percent of net profits. In analyzing these statistics, certaincharacteristics should be noted. First, the concentration of assetownership may reflect the capital-intensive nature of heavy indus-try (steel, autos, mining, energy, utilities, etc.) where financial re-quirements are so large that smaller firms are impractical. Second,the efficiency of small and medium-sized businesses is demonstrat-ed by their relatively high percentage (45 percent) of receipts. Fi-nally, economies of scale exist in large business that may contrib-ute to their relatively larger share of net income.
Small Business Job Creation
Assertions that small business creates the largest share of jobsare well founded. Table 3 presents the growth of jobs between 1976and 1982 according to the size of firms.
TABLE 3.-Job Growth by Size of Firm, 1976-82[In thousands of jobs]
Employment NetNet increase
Size of firm (by number of Net Percent N* as aemployees) 1976 in- 1982 change, crease of total
crease 1976-82 increase
0 to 19 employees ..................... 15,597 4,575 20 172 29.3 4,575 38.520 to 99 employees .................... 12,834 1,676 14,510 13.1 1,676 14.1
Subtotal, under 100 em-ployees .................... 28,431 6,251 34 682 22.0 6,251 52.6
100 to 499 employees ................. 10,866 1,161 12,027 10.9 1,161 9.8
Subtotal, under 500 em-ployees .................... 39,297 7,412 46 709 18.9 7,412 62.4
500 or more employees ............. 36,664 4,459 41,123 12.2 4,459 37.6
Total, all firms .................... 75,961 11,871 87,832 15.6 11,871 100
Source: Small Business Administration, Office of Advocacy.

4
Small and medium-sized businesses generated more than threeout of every five jobs created between 1976 and 1982. The smallestfirms (with less than 20 employees) were the dominating force.They generated 38.5 percent of all the jobs created, more jobs thanlarge business created. In addition, they generated a substantiallyhigher increase in jobs (29.3 percent) than any other classification.These remarkable achievements illustrate the dynamic nature ofsmall business, and that the greatest opportunity for people seek-ing employment exists in the small business sector.
In December 1985, employment in the U.S. economy reached arecord high of nearly 110 million people, with some 10 million newjobs created in, the past five years. Job growth in the United Statescontrasts starkly with that of Europe. According to statistics com-piled by the Organization for Economic Cooperation and Develop-ment between 1974 and 1984, 14 million jobs were created in theUnited States while none were created in Europe. In fact, employ-ment in Europe actually declined by nearly 1 million during thatperiod. While these do not correspond precisely with SBA's dataand timeframe, it is highly probable that small business was thedriving force behind the job creation in the United States.
Small Business in Rural StatesWhile small business plays a vital role in the Nation's economy,
it is the lifeline of rural States. Table 4 shows the percentage ofjobs provided by each State in 1982 for 16 rural States. These areStates in which the rural (nonmetro) population is greater than thecity (metro) population.
TABLE 4.-Small Business Jobs in Rural States, 1982
Percentage of jobs in each State by firm size (in numbers ofemployees)
State Subtotal Subtotal 500 or0-19 20-99 under 100-499 under mor
100 500 mr
Alaska .................... 31 17 48 12 60 40Arkansas .................... 25 15 40 13 53 47Idaho .................... 32 16 48 13 61 39Iowa .................... 25 15 40 13 53 47Kansas .................... 27 17 44 13 57 43Kentucky .................... 21 16 37 11 48 52Maine .................... 24 18 42 16 58 42Mississippi .................... 22 16 38 15 53 47Montana .................... 38 19 57 11 68 32New Mexico .................... 25 16 41 11 52 48North Dakota .................... 32 20 52 14 66 34South Dakota .................... 32 20 52 11 63 37Vermont .................... 31 21 52 17 69 31West Virginia .................... 21 16 37 13 50 50Wyoming .................... 31 21 52 15 67 33
U.S. total .................... 23 16 39 14 53 47
Source: Small Business Administration, Office of Advocacy.
5
In every rural State except Kentucky, small and medium-sizedfirms employed at least 50 percent of the nonagricultural workforce. In South Dakota, North Dakota, Wyoming, Montana, andVermont, small and medium-sized firms employed between 63 per-cent and 69 percent of the work force.
In general, rural areas are more dependent on agriculture, man-ufacturing, mining, and natural resources industries. As previouslyindicated, these are sectors of the economy which have participatedthe least in the economic recovery. With such a large percentage ofjobs depending on them, small business in rural States are facedwith the difficult task of remaining flexible, adaptable, and produc-tive.
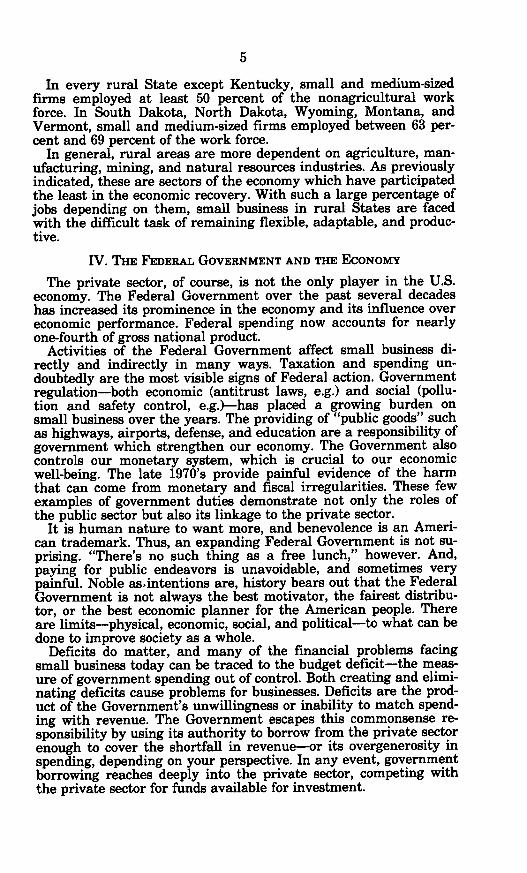
IV. THE FEDERAL GOVERNMENT AND THE ECONOMY
The private sector, of course, is not the only player in the U.S.economy. The Federal Government over the past several decadeshas increased its prominence in the economy and its influence overeconomic performance. Federal spending now accounts for nearlyone-fourth of gross national product.
Activities of the Federal Government affect small business di-rectly and indirectly in many ways. Taxation and spending un-doubtedly are the most visible signs of Federal action. Governmentregulation-both economic (antitrust laws, e.g.) and social (pollu-tion and safety control, e.g.-has placed a growing burden onsmall business over the years. The providing of "public goods" suchas highways, airports, defense, and education are a responsibility ofgovernment which strengthen our economy. The Government alsocontrols our monetary system, which is crucial to our economicwell-being. The late 1970's provide painful evidence of the harmthat can come from monetary and fiscal irregularities. These fewexamples of government duties demonstrate not only the roles ofthe public sector but also its linkage to the private sector.
It is human nature to want more, and benevolence is an Ameri-can trademark. Thus, an expanding Federal Government is not su-prising. "There's no such thing as a free lunch," however. And,paying for public endeavors is unavoidable, and sometimes verypainful. Noble as-intentions are, history bears out that the FederalGovernment is not always the best motivator, the fairest distribu-tor, or the best economic planner for the American people. Thereare limits-physical, economic, social, and political-to what can bedone to improve society as a whole.
Deficits do matter, and many of the financial problems facingsmall business today can be traced to the budget deficit-the meas-ure of government spending out of control. Both creating and elimi-nating deficits cause problems for businesses. Deficits are the prod-uct of the Government's unwillingness or inability to match spend-ing with revenue. The Government escapes this commonsense re-sponsibility by using its authority to borrow from the private sectorenough to cover the shortfall in revenue-or its overgenerosity inspending, depending on your perspective. In any event, governmentborrowing reaches deeply into the private sector, competing withthe private sector for funds available for investment.
6
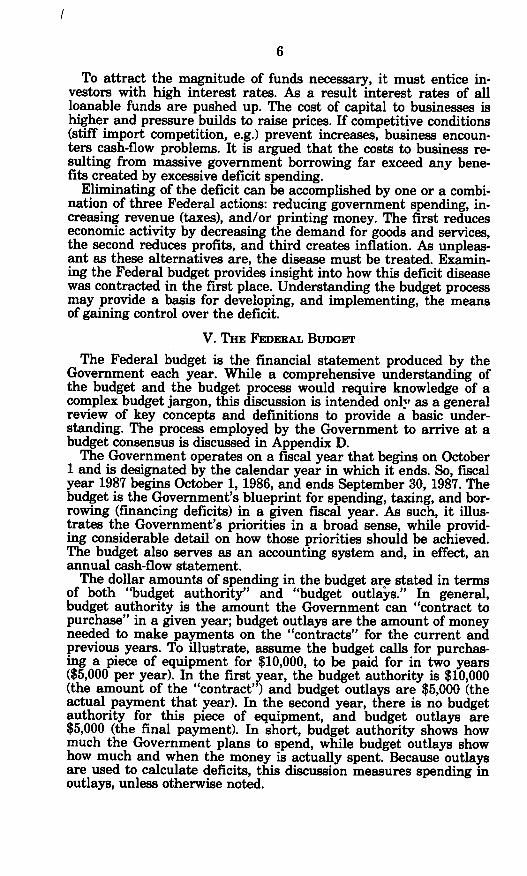
To attract the magnitude of funds necessary, it must entice in-vestors with high interest rates. As a result interest rates of allloanable funds are pushed up. The cost of capital to businesses ishigher and pressure builds to raise prices. If competitive conditions(stiff import competition, e.g.) prevent increases, business encoun-ters cash-flow problems. It is argued that the costs to business re-sulting from massive government borrowing far exceed any bene-fits created by excessive deficit spending.
Eliminating of the deficit can be accomplished by one or a combi-nation of three Federal actions: reducing government spending, in-creasing revenue (taxes), and/or printing money. The first reduceseconomic activity by decreasing the demand for goods and services,the second reduces profits, and third creates inflation. As unpleas-ant as these alternatives are, the disease must be treated. Examin-ing the Federal budget provides insight into how this deficit diseasewas contracted in the first place. Understanding the budget processmay provide a basis for developing, and implementing, the meansof gaining control over the deficit.
V. THE FEDERAL BUDGET
The Federal budget is the financial statement produced by theGovernment each year. While a comprehensive understanding ofthe budget and the budget process would require knowledge of acomplex budget jargon, this discussion is intended only as a generalreview of key concepts and definitions to provide a basic under-standing. The process employed by the Government to arrive at abudget consensus is discussed in Appendix D.
The Government operates on a fiscal year that begins on October1 and is designated by the calendar year in which it ends. So, fiscalyear 1987 begins October 1, 1986, and ends September 30, 1987. Thebudget is the Government's blueprint for spending, taxing, and bor-rowing (financing deficits) in a given fiscal year. As such, it illus-trates the Government's priorities in a broad sense, while provid-ing considerable detail on how those priorities should be achieved.The budget also serves as an accounting system and, in effect, anannual cash-flow statement.
The dollar amounts of spending in the budget are stated in termsof both "budget authority" and "budget outlays." In general,budget authority is the amount the Government can "contract topurchase" in a given year; budget outlays are the amount of moneyneeded to make payments on the "contracts" for the current andprevious years. To illustrate, assume the budget calls for purchas-ing a piece of equipment for $10,000, to be paid for in two years($5,000 per year). In the first year, the budget authority is $10,000(the amount of the "contract') and budget outlays are $5,000 (theactual payment that year). In the second year, there is no budgetauthority for this piece of equipment, and budget outlays are$5,000 (the final payment). In short, budget authority shows howmuch the Government plans to spend, while budget outlays showhow much and when the money is actually spent. Because outlaysare used to calculate deficits, this discussion measures spending inoutlays, unless otherwise noted.
I

7
The Federal Budget, 1975-87
The budget is divided into 20 numbered functions, each of whichcombine numerous spending programs according to common goals.For example, there are separate functions for Defense, Agriculture,Education and Training, Health, Social Security, Veterans, Intereston the National Debt, and 13 other functions. The total for eachfunction is the sum of all spending programs in different agencieswhich contribute to a common goal.
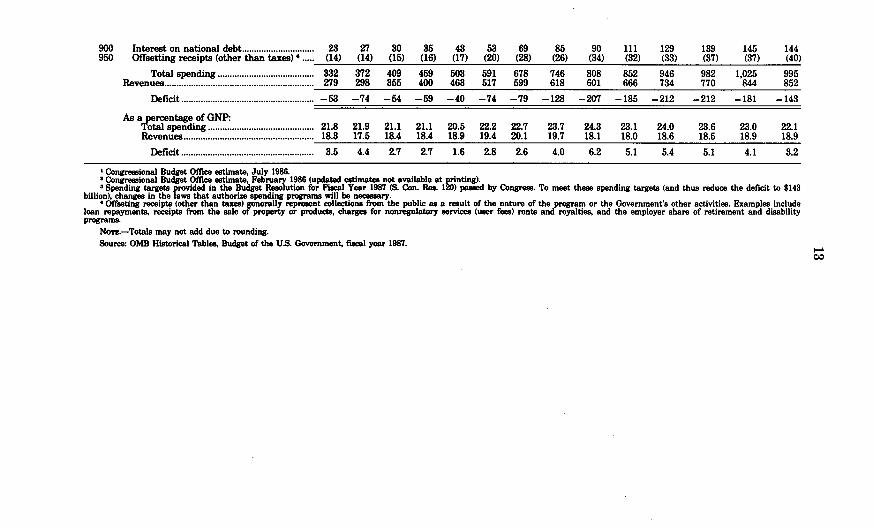
Appendix A shows actual spending by budget function from 1975to 1985, the most recent complete fiscal year, and estimated spend-ing for 1986 and 1987. The two estimates for 1987 represent: (1) theCongressional Budget Office's (CB0) estimate (under its economicassumptions) if spending programs are not changed, and (2) thespending levels adopted by Congress in the Fiscal Year 1987Budget Resolution. Changes in current law will be required toachieve the Budget Resolution levels. Appendix A also showsspending, revenues and deficits as a percentage of Gross NationalProduct (GNP) for the same years.
ACTUAL SPENDING IN THE BUDGET
From 1975 to 1986, annual spending grew from $332 billion to$982 billion-an increase of almost 200 percent. During the sametime, revenues increased 175 percent (from $279 billion to $770 bil-lion), and deficits increased 300 percent (from $53 billion to $212billion).
Of the 20 budget functions, the largest five account for over 80percent of estimated spending in 1986. They are:
AmountBudget function (billions)
Defense............................................................................................................................. $269Social Security .......... . . . . . . ................. 200Interest on the National Debt ........................................................... 139Income Security ........................................................... 118Medicare.......................................................................................................................... 68
Total...................................................................................................................... 794
THE BUDGET AS A PERCENTAGE OF GNP
Because the economy grew during the period, the change inspending, revenues, and deficits relative to GNP was not as dra-matic as the changes in actual spending, revenues, and deficits. Itwas, however, substantial. From 1975 to 1980 spending was in therange of 21 percent to 22 percent of GNP. From 1981 to 1986,spending has been mostly in the high end of the range between 23percent and 24 percent of GNP. The effects of inflation-inducedbracket creep pushed revenues above their postwar average of 18.6percent to 20 percent of GNP in 1981, equaling the postwar high.Following the tax reduction legislation enacted in late 1981, reve-nues receded to between 18 percent and 18.6 percent of GNP from1983 to 1986, corresponding roughly to the range prevailing be-tween 1975 and 1978. From 1975 to 1982, deficits were less than 3percent of GNP except in 1976 (4.4 percent) and 1982 (4.0 percent).The deficit peaked at 6.2 percent of GNP in 1983, but declined to5.1 percent in 1986.

8
Estimates for 1987 project a decrease in both spending and defi-cits as a percentage of GNP and an increase in revenues. The more
-optimistic estimate, the Budget Resolution, projects spending at22.1 percent of GNP, revenues at 18.9 percent of GNP and the defi-cit at 3.2 percent of GNP. It should be noted that actual economicgrowth in 1987 will affect the result, and that changes in laws toachieve the Budget Resolution's levels for spending, revenues, andthe deficit may be required.
Major Categories of Federal Spending, 1975-87As an alternative to the function-by-function analysis used in the
budget process, it is instructive to break down the budget into fourmajor categories of spending. Appendix B presents those four cate-gories in actual spending and as a percentage of the budget from1975 to 1987.
The following chart illustrates the major categories as a percentof the budget in 1976 and 1986. A description of the categories anda further analysis of Appendix B follows the chart.
Major Categories of Spending1976 (as a percentage of the budget)
Entitlements and MandatorySpending Programs
nterest/47% /7 °
Discretionary ProgramsDefense 23%\ 23%/ (non defense)
/ 44% / Interest
Entitlements and Mandatory 13%Spending Programs DIscretionary Programs
1 26% </ (non defense)
26%
DEFENSE
Defense represents the spending for all branches of the ArmedForces and includes spending for compensation for military and ci-vilian employees, operations and maintenance, weapons procure-ment, research and development, and other programs. A majorityof the defense budget is composed of employee compensation andoperations and maintenance. From 1976 to 1981, defense spendingdeclined to 23 percent and 22 percent of the budget, the lowestlevels during the postwar period. In 1982, defense increased to 24

9
percent of the budget and was restored to its 1975 level of 25 per-cent of the budget from 1983 to 1985.
ENTITLEMENTS AND MANDATORY SPENDING PROGRAMS
These are programs that require the Government to make pay-ments, primarily to individuals, to a person who meets the eligibil-ity requirements of the programs. In general, eligibility require-ments are common characteristics (age, disability, retirement, mili-tary service, etc.) written in the law which, if met, entitle a personto payments. An eligible person can sue the Government if the pay-ment is not made. As a result, the Government is legally requiredto pay whatever amount is necessary to people who meet the eligi-bility requirements; the Government cannot arbitrarily limit thetotal amount spent on these programs without changing the under-lying eligibility requirements.
These programs account for the greatest portion of the budget.They comprise 47 percent of the budget in 1976 and 1983; 45 per-cent or 46 percent in the other years between 1975 and 1983; and44 percent from 1984 to 1987.
Appendix C presents actual and estimated spending in this cate-gory from 1985 to 1987. The programs are separated into "non-means-tested" programs (eligibility is not based on financial need)and "means-tested' programs (eligibility based on financial need orlevel of income). Two nonmeans-tested programs-Social Securityand Medicare-accounted for just under 60 percent of all spendingin this category. All nonmeans-tested programs represent about 85percent of total spending for entitlements and mandatory spendingprograms.
In addition to Social Security and Medicare, this category in-cludes payments for retirement and disability programs for theFederal military and civilian work force; unemployment compensa-tion; veterans benefits and pensions; farm price supports; Medicaid;food stamps; child nutrition programs; student loans, and otherprograms. Because of the magnitude of spending for this categoryand the number of individuals who receive their benefits, settingthe future level of spending on these programs requires a consen-sus among current and future recipients.
DISCRETIONARY SPENDING (NONDEFENSE)
Discretionary spending is composed of all the remaining spend-ing programs reflecting the Government's priorities. In general,they are not payments to individuals but represent spending toachieve public or communal goals (good roads and mass transit, en-vironmental protection, education, subsidized housing, job training,etc.). The cost of administering all nondefense programs, both enti-tlements and discretionary, is included in this category. The actualspending for these programs is set annually in legislation passed byCongress and signed by the President. Unlike entitlements, limitson the total amount spent for these programs can be imposed eachyear. As a result,. these programs have experienced the- greatest.pressure in efforts to reduce the deficit. Since 1975, discretionaryspending has decreased from 24 percent of the budget to 17 percentin 1986.

10
INTEREST ON THE NATIONAL DEBT
Very simply, this category represents the cost of paying net in-terest on the cumulative amount the Government has borrowed (byissuing Treasury bills, Treasury notes, and other debt instruments)to finance the sum of deficits in past years. Failure to make thesepayments would result in default on the Government's obligations.As a percentage of the budget, interest has more than doubled,from 6 percent in 1975 to 13 percent in 1986.
ESTIMATES OF "UNCONTROLLABLE" SPENDING
The estimates for actual spending in 1987 are the amountsneeded to pay for programs under current law (assuming the law isnot changed) and to honor contracts from previous years. Contrac-tual obligations and compensation paid to military and civilian em-ployees in the Department of Defense have been characterized asrelatively "uncontrollable" spending. It has been conservatively es-timated that one-half of the Defense budget (13 percent of theentire budget) is "uncontrollable" in this sense. Combining this 13percent with entitlements (44 percent) and interest on the nationaldebt (13 percent) has led to assertions that 70 percent or more ofthe budget is on "automatic pilot." In fact, interest on the nationaldebt is the only spending that is uncontrollable as a practicalmatter. Uncontrollable spending will occur only if no action istaken through laws passed by Congress and signed by the Presi-dent to stop or reduce the spending. With so much of the budget on"automatic pilot," reducing the deficit is a formidable challenge.
VI. SUMMARY AND OBSERVATIONS
Since the 1980 White House Conference on Small Business, con-ditions in the overall economy have improved markedly. Interestrates and inflation have declined dramatically, the economy hasgrown considerably, employment has risen, and the unemploymentrate has improved. The economic recovery has not been uniform,however, as evidenced by the difficult times facing agriculture,manufacturing, mining, and natural resources industries.
Small and medium-sized businesses maintained their traditionalrole as a vital, dynamic force in the economy. Comprising over 99percent of all firms, small and medium-sized businesses make sig-nificant contributions to the economy in terms of assets, gross re-ceipts, and net income. But, their most significant contribution isjob creation, where small and medium-sized businesses are thedominant force. In rural States, they are the lifeline of the commu-nity and economy and are experiencing major adjustments.
Government policymakers also face a major challenge-reducingand eliminating budget deficits. With so much government spend-ing on "automatic pilot," there are no easy answers or simple solu-tions. The Gramm-Rudman-Hollings legislation enacted in 1985 im-poses a definite schedule for eliminating deficits. If deficits cannotbe eliminated by an automatic procedure, they must be confronteddirectly by making the difficult choices needed to do so. Controllingbudget deficits is essential to continued economic prosperity for the

11
Nation as a whole, and to extending prosperity to all sectors of theeconomy.
Since 1981, the Congress and the Administration have laid thefoundation for stable, steady, and noninflationary economic growth.Adhering to those principles can assure us of a record-breakingperiod of prosperity. A generation of economic growth is notbeyond our grasp. The will and determination of the Americanpeople combined with confident leadership can make it a reality.

APPENDIX A
HISTORY OF THE FEDERAL BUDGET, 1975-87[Total spending (by budget function), revenues, and deficits in billions; total spending, revenues, and deficits as a percentage of GNP]
Budget Fiscal year (actual spending (outlays) in billions of dollars) 1987func- Description of function Esti- CBO BudgettNon 1975 1976 1977 1978 1979 1980 1981 1982 1983 1984 195 mate, esti- resolu-No. 1986(l) mates2 tion I
050 Defense ..................................... 87150 Foreign aid (includes Ex-Im Bank) ................. 7250 General science ............... ...................... 4270 Energy ...................................... 3300 Natural resources and environment .............. 7350 Agriculture ...................................... 3370 Commerce and housing ..................................... 10400 Transportation ..................................... 11450 Community and regional development .......... 4500 Education and training ..................................... 16550 Health ..................................... 13570 Medicare ..................................... 13600 Income security....................................... 50650 Social Security .65700 Veterans .17
750 Administration of justice. 3800 General government. 3850 Fiscal assistance (includes revenue shar- 7
ing).
90 97 104 116 134 158 185 210 227 253 2696 6 7 7 13 13 12 12 16 16 174 5 5 5 6 6 7 8 8 9 94 6 8 9 10 15 14 9 7 6 48 10 11 12 14 14 13 13 13 13 133 7 11 11 9 11 16 23 14 26 318 3 6 5 9 8 6 7 7 4 3
14 15 16 18 21 23 21 21 24 26 285 7 12 10 11 11 8 8 8 8 8
19 21 27 30 32 34 27 27 28 29 3116 17 19 20 23 27 27 29 30 34 3616 19 23 26 32 39 47 53 58 66 6861 61 61 66 87 100 108 123 113 128 11874 85 94 104 119 140 156 171 178 189 20018 18 19 20 21 23 24 25 26 26 273 4 4 4 5 5 5 5 6 6 73 3 4 4 4 5 5 5 5 5 67 10 8 8 9 7 6 6 7 6 6
2841595
13234
278
313975
124212
27766
2791494
13242
267 I-
31 to:3873
122209
27753
900 Interest on national debt .............................. 23 27 30 35 43 53 69 85 90 111 129 139 145 144950 Offsetting receipts (other than taxes) 4 ..... (14) (14) (15) (16) (17) (20) (28) (26) (34) (32) (33) (37) (37) (40)
Total spending ................................ 332 372 409 459 503 591 678 746 808 852 946 982 1,025 995Revenues............................................................ .. 279 298 355 400 463 517 599 618 601 666 734 770 844 852
Deficit ............................... -53 -74 -54 -59 -40 -74 -79 -128 -207 -185 -212 -212 -181 -143
As a percentage of GNP:Total spending...................................... 21.8 21.9 21.1 21.1 20.5 22.2 22.7 23.7 24.3 23.1 24.0 23.6 23.0 22.1Revenues. ...................................... 18.3 17.5 18.4 18.4 18.9 19.4 20.1 19.7 18.1 18.0 18.6 18.5 18.9 18.9
Deficit....................................................... 3.5 4.4 2.7 2.7 1.6 2.8 2.6 4.0 6.2 5.1 5.4 5.1 4.1 3.2
' CongressionaI Budget Office estimate, July 1986.' Congressional Budget Office estimate, February 1986 (updated estimates not available at printing).a Spending target provided in the Budget Resolution for Fiscal Year 1987 (S. Con. Res. 120) pnssed by Congress. To meet these spending targets (and thus reduce the deficit to $143
billion), changes in the laws that authorize spending programs will be necessary.' Ofleting receipts (other than taxes) generally represent collections from the public as a result of the nature of the program or the Government's other activities. Examples include
loan repayments, receipts from the sale of property or products, charges for nonregulatory services (user fees) rents and royalties, and the employer share of retirement and disabilityprograms.
NoTs.-Totals may not add due to rounding.Source: OMB Historical Tables, Budget of the U.S. Government, fiscal year 1987.
cAD
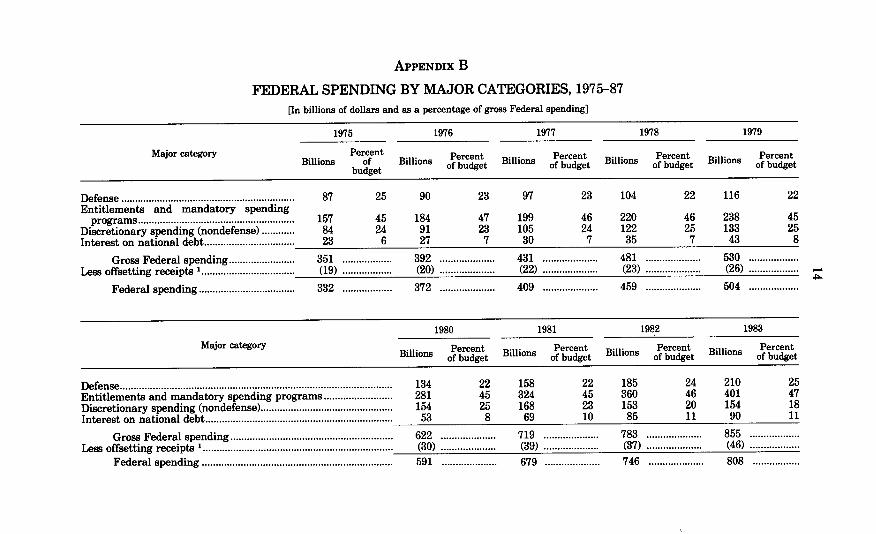
APPENDIX B
FEDERAL SPENDING BY MAJOR CATEGORIES, 1975-87[In billions of dollars and as a percentage of gross Federal spending]
1975 1976 1977 1978 1979
Major category PercentPecnPeetPretPretBillions of Billions Percent Billions Percent Billions Percent Billi Percent
budget of budget of budget of budget Bilos of budget
Defense............................................................... 87 25 90 23 97 23 104 22 116 22Entitlements and mandatory spending
programs......................................................... 157 45 184 47 199 46 220 46 238 45Discretionary spending (nondefense) ............ 84 24 91 23 105 24 122 25 133 25Interest on national debt ............................... 23 6 27 7 30 7 35 7 43 8
Gross Federal spending ........................ . ... 351 .................. 392 .................... 431 .................... 481 .................... 530 ..................Less offsetting receipts I ................................ (19) .......... (20) ........... (22) ........... (23) ........... (26)
Federal spending ............................... 332 ......... 372 .......... 409 .......... 459 ...... .... 504 .
1980 1981 1982 1983
Major category Billions Percent Billions Percent Billions Percent Billions PercentBilos of budget B of budget of budget Bilos of budget_
Defense................................................................................................... 134 22 158 22 185 24 210 25Entitlements and mandatory spending programs .281 45 324 45 360 46 401 47Discretionary spending (nondefense)................................................ 154 25 168 23 153 20 154 18Interest on national debt .53 8 69 10 85 11 90 11
Gross Federal spending........................................................... 622 .................... 719 .................... 783 .................... 855 ..................Less offsetting receipts I ............................................... (30) .......... (39) .......... (37) .......... (46)
Federal spending..................................................................... 591 .................... 679 .................... 746 .................... 808 .................

1984 1985 Estimated, 1986 Estimated, 1987
Billions Percent Billions Percent Billions Percent Billions Percentof budget of budget of budget of budget
Defense................................................................................................... 2 27 25 253 25 270 26 284 26Entitlements and mandatory spending programs ......................... 397 44 440 44 454 44 474 44Discretionary spending (nondefense)................................................ 162 18 172 17 173 17 174 16Interest on national debt ................................................. 111 12 129 13 139 13 145 13
Gross Federal spending........................................................... 897 .................... 994 .................... 1,036 .................... 1,077 ..................Less offsetting receipts1 ...................................................................... (45) .................... (48) .................... (49) .................... (52) ........... (52).
Federal spending...................................................................... 852.................... 946.................... 986................... 946 ...................
1 For budgetary accounting purposes, offsetting receipts (other than taxes) reduce gross Federal spending to determine actual spending (outlays). Because thehistorical composition of offsetting receipts is not available to allocate among the categories, the categories are presented as a percentage of gross Federalspending.
NorE.-Totals may not add due to rounding.Source: Congressional Budget Office, "The Economic and Budget Outlook: Fiscal Years 1987-1991."

APPENDIX C
ENTITLEMENTS AND MANDATORY SPENDING PROGRAMS,1985-86
[In billions of dollars]
Fiscal year
Actual, Estimat- Estimat-1985 ed, 1986 ed, 1987
Nonmeans-tested programs:Retirement and disability programs:
Social Security....................................................M edicare ..............................................................Federal, civilian. ......................................Federal, military.......................................Other.....................................................................
Subtotal, retirement and disability pro-grams ............................................................
Unemployment compensation.................................Veterans' benefits. ......................................Farm price supports. ......................................General revenue sharing..........................................Social services.............................................................Other ............................................................................
Total, non-means-tested programs......................
1867023165
1977324185
2098026185
301 317 33818 16 1713 13 1318 25 185 4 43 4 4
17 5 6
374 384 401
Means-tested programs:Medicaid...................................................................... 23 24 26Food stamps ............ ........................... 12 12 12Supplemental security income ................................ 10 10 11Assistance payments................................................. 8 9 10Veteran's pensions..................................................... 4 4 4Child nutrition............................................................ 4 4 4Guaranteed student loans ....................................... 3 3 3Other............................................................................ 2 3 3
Total, means-tested programs .............................. 66 70 73
Total, entitlements and mandatory spendingprograms.............................................................. 440 454 474
Non.-Programs presented do not coincide precisely with budget functions; accordingly,minor discrepancies may exist when compared to budget functions.
Source: Congressional Budget Office, "The Economic and Budget Outlook: Fiscal Years 1987-1991."
(16)

APPENDIX D
THE BUDGET PROCESS
OVERVIEW AND DEFINITIONS
As previously discussed, the Federal budget illustrates the Government's prior-ities. Those priorities are ultimately implemented by legislation passed by Congressand signed into law by the President. This discussion presents the general steps inthe legislative process that occur to translate the Government's priorities intoactual spending and tax policies.
The U.S. Constitution gives the Congress the exclusive authority to allocate theGovernment's resources. To do so, each year Congress, through the budget process,establishes an overall policy for the level of spending and revenues, and how thespending should be divided among the budget functions. The comprehensive dead-lines established to complete specific steps in the process will not be analyzed in thisdiscussion. Rather, the beginning of a new fiscal year on October 1 of each year isthe ultimate deadline that will serve as a frame of reference.
At the outset, it may be useful to be familiar with the following definitions:Budget Resolution.-A resolution passed by Congress that sets annual targets
for spending, revenues, and deficit levels. It does not become law, so the Presi-dent s signature is not required. Instead, it is the legislative device Congressuses to regulate itself during the budget process. Accordingly, the Budget Reso-lution, by itself, does not change the level of spending, revenues, or deficits.
Authorizations Legislation.-Legislation passed by Congress and signed bythe President that gives government agencies the legal power to spend. It cre-ates or continues spending programs, establishes the conditions for spending(eligibility requirements, specific projects, etc.), and may place a ceiling on theamount that can actually be spent.
Appropriations Legislation.-Legislation passed by the Congress and signedby the President to actually fund spending programs. Checks are issued by theU.S. Treasury on the basis of appropriations acts. Currently, 13 "regular' ap-propriations acts are needed to fund spending programs. If one or more of the'regular" acts has not become law before the fiscal year begins on October 1, a"continuing resolution" is necessary until the "regular" acts become law or thefiscal year ends. In addition, "supplemental" appropriations acts provide addi-tional funding for programs that run out of money before the end of the fiscalyear.
Reconciliation.-A legislative process to enforce the targets in the BudgetResolution. When the Budget Resolution sets targets for spending, revenues andthe deficit that are lower than current law will produce, the Congress must"reconcile" the difference. To do so, the Budget Resolution allocates the spend-ing targets to the House and Senate Committees with jurisdiction over thespending programs. (Note: More than one committee may have jurisdiction overa single budget function. For example, Function 370: Commerce and Housingcontains spending for the Small Business Administration, subsidized housingprograms and other programs, so the Small Business Committees and the Bank-ing Committees each have jurisdiction.) The committees are then required todraft legislation which changes the spending programs or the tax laws to meettheir respective targets. All these drafts are combined into a single package("reconciliation bill") for the House and Senate to debate, amend, and pass. Dif-ferences in the House and Senate bills must be resolved in a conference reportadopted by each Chamber and signed by the President.
Gramm-Rudman-Hollings (GRH).-The commonly used term to identify theBalanced Budget and Emergency Deficit Control Act of 1985. Named for itsthree Senate sponsors, GRH sets maximum limits for deficits that decline until
(17)

18
the budget is balanced in 1991. GRH provides specific procedures and enforce-ment mechanisms to achieve its goals.
STAGES IN THE BuDGET PRocEss
The President's BudgetIn January of each year, the President is required to present Congress with hisrecommendations for the Federal budget in the fiscal year that begins October 1.The President's budget reflects the Administration's priorities for the Government's
fiscal policy and must meet the maximum deficit limits of GRH. It is prepared bythe Office of Management and Budget after a lengthy, extensive process of deter-mining the priorities and needs of the individual Federal agencies.
The Congressional Budget ProcessAfter receiving the President's budget, the House and Senate Budget Committees
hold public hearings and draft Budget Resolutions setting spending, revenue anddeficit targets within the limits of GRH. The Budget Resolutions recommended bythe respective Budget Committees are then presented to the full membership of theHouse and Senate for debate, amendment, and adoption. While amendments nor-mally require a simple majority for adoption, GRH generally requires a three-fifthsmajority to adopt amendments that would result in deficits exceeding the maximumamounts. In effect, amendments must be "deficit neutral" or be adopted by a three-fifths majority. Differences between the House and Senate Budget Resolutions arefrequent, and must be resolved in a conference report adopted by both Chambers.
Authorizations and AppropriationsAfter adopting the Budget Resolution, Congress is expected to pass authorizations
and appropriations legislation (defined above) to achieve the targets in the BudgetResolution. The same legislative process (committee hearings, committee-drafted leg-islation, etc.) is followed, but the President's signature is required. In addition,amendments must be "deficit neutral" or adopted by a three-fifths majority.The Congress has less than nine months from the time it receives the President'sbudget until October 1 of each year when it must adopt and implement the BudgetResolution. Although the last stage of the process (authorizations and appropria-tions legislation) is scheduled for completion on June 15, the large number of billsthat must be enacted separately to complete the process makes it difficult to meetthe deadlines. As a result, Congress in recent years has used reconciliation to makechanges in the law necessary to implement and enforce the targets in the BudgetResolution. Similarly, Congress has used continuing resolutions to appropriate fundsfor spending programs.
GRAMM-RUDMAN-HoLLNGS (GRH)GRH is designed to force Congress and the President to enact legislation that will
result in the following maximum deficits:Fiscal year: Billions1987 ....................................................... $1441988 ....................................................... 1081989 ....................................................... 721990 ....................................................... 361991 ........................................................... 0
If legislation to achieve the maximum deficit is not enacted by a certain date eachyear, GRH prescribes a detailed mechanism to reduce Federal spending by theamount needed to do so. To illustrate, on August 15, 1986, the deficit is estimatedfor the 1987 fiscal year (which begins October 1, 1986), taking into account legisla-tion, if any, enacted to achieve the 1987 deficit level. If the estimated deficit exceedsthe maximum amount, the difference is the amount of savings required to be real-ized through the GRH mechanism. That mechanism is a complex formula that ulti-mately results in reducing spending by a uniform percentage (called "sequestration"or "sequester"). It is not a simple across-the-beard percentage reduction of totalspending because a significant number of progams have special rules or are ex-empted from the sequester entirely. Because th e sequester formula is so complex,only a general discussion of its key elements is presented here.
One-half of the total required saving is assigned to defense spending. The otherhalf must be achieved by reducing nondefense spending. Up to 50 percent of the

19
total required savings can be achieved by eliminating or reducing Cost of Living Ad-justments (COLA's), which are credited as defense and nondefense spending reduc-tions in equal amounts. In general, the sequestration-the uniform percentage re-duction-is determined by dividing the amount of spending reduction that is stillnecessary by the amount of spending that has not been (a) exempted from reduc-tions entirely, or (b) provided special rules for reductions.
The exemptions and special rules are the reasons that all spending programs arenot reduced by a simple and equal across-the-board percentage. By providing exemp-tions and special rules, the amount of spending subject to sequestration is reducedsubstantially. As a result the percentage reduction required of nonexempt programsis larger than it would be if there were no exemptions or special rules. Aftermaking the savings from COLA's and applying special rules for nondefense pro-grams (student loans, foster care and adoption assistance, medicare, and certainhealth care), the sequestration is computed for defense spending and nondefensespending separately.
For defense, no specific program is exempt from sequestration. As with nonde-fense programs, however, spending for by obligations incurred in previous years isnot subject to reduction by sequestration. Even so, the President can achieve all orpart of the savings required through sequestration by canceling or modifying exist-ing defense contracts, unless that action would cause a net loss or violate legal obli-gations. For fiscal year 1987, the Congressional Budget Office (CBO) estimates that$105 billion of defense spending (38 percent of $277 billion total defense spending)will not be subject to sequestration. Accordingly, the remaining $172 billion of de-fense spending could be reduced by sequestration. The uniform percentage reductionwill result from dividing the amount of required defense spending savings by $172billion.
For nondefense spending, a substantial number of programs are exempt from se-questration. In addition to interest on the national debt, the major exempt programsare Social Security, Veteran's benefits, State unemployment benefits, and mostmeans-tested, low-income entitlement programs (Medicaid, food stamps, child nutri-tion, etc.). For fiscal year 1987 CBO estimates that $110 billion of nondefense spend-ing (less than 15 percent of $735 billion total nondefense spending) will be subject tosequestration. The uniform percentage for nondefense spending reductions willresult from dividing the amount of required nondefense savings by $110 billion.
Because of the exemptions and special rules, it is likely that the percentage reduc-tion for defense spending will be lower (but applied to a larger amount of spending)than the percentage for nondefense spending (applied to a smaller amount of spend-ing). The following example will illustrate.
The maximum deficit under GRH for fiscal year 1987 is $144 billion. CBO project-ed a deficit of $181.3 billion which would be reduced by $14.7 billion through legisla-tion, resulting in an estimated deficit of $166.6 billion. (Note: More recent estimatesproject a larger deficit.) Accordingly, the GRH mechanism would reduce the deficitby $22.6 billion ($166.6 billion deficit minus $144 billion maximum equals $22.6 bil-hon) as follows:
Billions of dollars
Defense Nondefense Totspending spending
Total required savings .................................. 11.3 11.3 22.6Less:
COLA savings ................. ................. -. 6 -. 6 -1.2Special rules savings .................................. NA -1.5 -1.5
Remaining required savings .................... 10.7 9.2 19.9Spending subject to sequestration ...................... 172.0 110.0 282.0
Percentage reduction............................................ 6.2 8.4 7.1(10.7÷. 172) (9.2÷ 110) (19.9÷282)
Under this estimate, sequestration would result in a 6.2 percent "across-the-board" reduction in nonexempt defense spending and an 8.4 percent "across-the-board" reduction in nonexempt nondefense spending. In sum, those nondefense pro-grams which have not been exempted or provided special rules will bear the great-est percentage reduction if sequestration is needed to reduce spending in order to
20
meet the maximum deficit amount. These programs will be subject to an even great-er percentage reduction if the deficit exceeds CBO's estimate, which is probable. Atthe same time, defense spending will be reduced by one-half of the amount requiredby the GRH mechanism, even though it accounts for roughly 27 percent of totalFederal spending.
As originally enacted, GRH included an "automatic" feature to implement seques-tration. In short, the General Accounting Office was directed to calculate the per-centage reductions under sequestration, and the President was required to imple-ment them. In early July 1986, however, the U.S. Supreme Court ruled that thisfeature was unconstitutional. In anticipation of this ruling, GRH included a "fall-back" mechanism. In essence, the fallback mechanism is designed to calculate thesequestration reductions in the same manner as discussed above. However, ratherthan being "automatic," the sequestration would require legislation passed by boththe House and the Senate, and signed into law by the President.
As this document goes to print, legislation is being considered to enact an auto-matic feature that will be upheld as constitutional. Without a new, constitutionalautomatic feature, the maximum deficit amounts provided in GRH can only beachieved by enacting legislation to do so.
0
62-5 33 ( 32 )