The Economics of Urban Light Rail: A Guide for Planners ...
16
THE ECONOMICS OF URBAN LIGHT RAIL: A Guide for Planners and Citizens REPORT | May 2020 Connor Harris Policy Analyst
Transcript of The Economics of Urban Light Rail: A Guide for Planners ...

THE ECONOMICS OF URBAN LIGHT RAIL: A Guide for Planners and Citizens
REPORT | May 2020
Connor HarrisPolicy Analyst

The Economics of Urban Light Rail: A Guide for Planners and Citizens
2
About the AuthorConnor Harris is a policy analyst at the Manhattan Institute, where he focuses on infrastructure, transportation, and housing policy. His writing has appeared in publications such as City Journal, the New York Post, and the Harvard Political Review. Harris graduated from Harvard University in 2016 with a B.A. in mathematics and physics.

3
Contents Executive Summary ..................................................................4
I. Introduction ..........................................................................5
II. What Drives Transit Ridership? .............................................6
III. Common Problems in Light Rail Planning ..............................8
IV. Conclusions .......................................................................11
Endnotes ................................................................................14

The Economics of Urban Light Rail: A Guide for Planners and Citizens
4
Executive Summary Most U.S. cities dismantled their streetcar networks in the first half of the previous century, but in the past few decades, some transit agencies have restored them, with help from generous federal grants. Modern light rail systems have appeared in more than a dozen U.S. cities, many of which had little preexisting transit ridership. They run small trains, often in the middle of wide streets along disused rail lines. Proponents of light rail argue that it is cheaper than a full subway line and can carry more riders than buses, as well as attracting new riders by offering a more comfortable ride. One study from 1989, for example, finds that rail systems get 34%–43% better ridership1 than bus lines with equivalent service.
This trend has had critics, including general opponents of public transit2 and pro-transit urban planners,3 who argue that light rail service is costlier and less flexible than bus service. This paper aims to help planners and citizens evaluate when new light rail lines are justified. First, we will explore the economics behind the choice between light rail and buses, as well as how to determine the best locations of lines. Our analysis of ridership on 23 U.S. light rail systems shows that proximity to development and jobs is necessary for success. Unfortunately, very few places that are not already served by light rail systems have the features necessary to make them viable and would be better served by expanded bus service.
Further, we highlight several common errors that light rail planners have made: overexpansion of systems into low-density areas; overvaluing certain classes of destinations such as airports; and the use of low-quality rights-of-way that sacrifice ridership to avoid political controversies during construction. These errors have led to the construction of many existing light rail systems in fundamentally unviable areas.
Although we close by offering a brief list of suggestions for optimizing the efficiency of existing light rail systems and for evaluating expansions, our analysis ultimately suggests that many proposed expansions, and even some existing systems, should be canceled or closed. Outside a handful of areas in the U.S., bus rapid transit (BRT)offers a better, more economically sustainable path forward.
The Economics of Urban Light Rail: A Guide for Planners and Citizens

5
I. IntroductionThe abstract economic case for light rail is simple. Though light rail requires more expensive infrastructure than a bus line, it requires fewer employees to carry the same number of passengers. The Kinki Sharyo light rail trains in use in Dallas, for example, can hold 94 passengers seated or 274 at maximum crowding, or “crush load,”4 more than twice what an articulated bus can. Moreover, light rail vehicles, unlike buses, can couple to form longer trains. In regions where driver wages are expensive relative to infrastructure costs, light rail may be cheaper than buses by allowing the same capacity with fewer vehicles.
Empirical data, however, call this case into question. One study using an abstract model of a transit network and cost parameters taken from Sydney, Australia, found that the operational costs of light rail systems, including both operating costs and the value of passengers’ time, are a few percentage points higher than those of BRT systems under a wide range of modeling assumptions, except possibly in systems that received more than 3 million passengers per day.5 Another literature review finds an operating cost premium of 59% for light rail over BRT per unit of capacity, based on studies from 1993 and 2001.6 Data from the 2018 National Transit Database agree that light rail is more expensive to operate, costing 12%–505% more per vehicle-hour in the cities that were surveyed. The highest light rail premium is in Oceanside, California, while the median light rail cost premium is 108%, in Pittsburgh.7
Capital costs, likewise, are generally lower for buses than for light rail. One of the least expensive recent light rail projects is a 14.5-kilometer line in Besançon, France, which opened in 2014. The project cost €249 million, or roughly $35 million per mile.8 The city government lowered the project cost by soliciting more bids than usual, using simple, standardized station designs, and minimizing street beautification and reconstruction.9 Typical light rail projects cost more, though costs vary widely. The recent T7 line in Paris, for example, cost €228 million for 11.2 kilometers, or about $40 million per mile,10 and the transportation writer Alon Levy gives a range of costs at about $25 million to $80 million per mile,11 though a planned extension of the T7 is estimated at €223 million (at 2011 prices) for 3.7 kilometers and six stations, or about $115 million per mile.12
Costs in the U.S. are generally somewhat higher. The Valley Metro Rail project in Phoenix, completed in 2008, cost about $85 million per mile in today’s money. The final stage of the DART Orange Line extension to Dallas–Fort Worth (DFW) airport, which was finished in 2014, cost $83 million per mile in today’s money, though this project included only one station and would have cost more with a more typical station spacing.13
Because buses rely on preexisting roads, the cost of a bus line, at minimum, is just the cost of buses themselves as well as bus shelters. Nevertheless, many cities have implemented BRT systems, which include infrastructure improvements such as fancier stations, off-board fare-collection machines, raised boarding platforms for mobil-ity-impaired passengers, and dedicated lanes.
THE ECONOMICS OF URBAN LIGHT RAIL: A Guide for Planners and Citizens

The Economics of Urban Light Rail: A Guide for Planners and Citizens
6
These systems can cost a large fraction of what light rail does, though they are still generally cheaper. Costs of BRT projects vary widely: one paper from 2005, for example, found that costs varied by almost an order of magnitude.14 A 2001 report from the U.S. Government Accountability Office gave an average cost of BRT with full busways as $13.5 million per mile (about $20 million today), about 39% of the $34.8 million cost of light rail (about $50 million today).15 More recent systems have tended to be more expensive: a survey of recent U.S. BRT systems by the planner Ari Ofsevit found that costs varied from $27 to $60 million per mile.16 There was one low-end outlier, at $6 million per mile: a narrow one-lane busway in Eugene, Oregon, whose planners scheduled buses carefully so that buses could run in both directions despite only having one lane.
Nevertheless, in general, the difference between light rail and BRT capital costs is about $30 million per mile, with a wide margin of variability. This is an ad-ditional $1.37 in capital costs per ride if amortized over 20 years with daily ridership of 3,000 riders per route-mile, typical for the higher-performing U.S. light rail lines.
These conclusions should be taken with a grain of salt. Construction costs vary widely, and, in certain circumstances (for example, if a preexisting rail line could be converted easily for light rail), light rail may be cheaper. But on the whole, transit agencies should assume that replacement of bus service with light rail, unless buses are already overcrowded, will increase op-erational costs.
Improved capacity and reliability may still make the conversion worthwhile. A phenomenon called “bunching” limits the frequency of bus service. If a bus is slightly delayed—say, by missing a traffic light, or by a disabled passenger who needs additional time to board—more passengers will accumulate at subsequent stops while the bus is delayed. The bus must then stop longer to let the extra passengers board, causing a vicious cycle of delays and overcrowding. Eventually, less crowded buses farther back will catch up to the delayed bus in front.
Some BRT improvements can ameliorate minor bunch-ing by providing more reliable travel and boarding times. Nevertheless, bunching remains a fundamen-tal cap on bus capacity. One expert on BRT suggests that bunching makes the frequency of more than 30 buses per hour impossible, and 22 is ideal.17 Some BRT systems manage higher frequencies by using freeway lanes with no traffic crossings, closing most cross streets, or by using four lanes of a road to allow buses
to pass each other—but installing such systems in most downtown areas is impossible or disruptive. A 2009 literature review suggests that, overall, light rail has a 65% capacity increase over BRT.18
Despite high potential capacity, actual ridership on U.S. light rail systems is low. Boston’s Green Line—which is a small component of a far more extensive and faster subway system—had 6,951 boardings per route-mile on an average weekday in 2018. Only four other systems garner more than 3,000: San Fran-cisco (5,088), Seattle (3,768), Minneapolis (3,411), and northern New Jersey (3,032, including the Hud-son-Bergen Light Rail and the Newark Subway).19
Most trams in Europe, even those in very small cities, perform much better. In France, for example, the trams in the Paris region, located in relatively periph-eral areas, garnered about 12,600 riders per route-mile on an average weekday in 2017.20 The 41.1-mile Bor-deaux tramway in Bordaeaux, meanwhile, received 105.5 million riders in 2018, or an average of 7,000 per day per route-mile, including weekends.21 Even most light rail systems in Canada get much higher rid-ership than in the United States. Calgary’s CTrain, for example, is 36.7 miles long and got 312,300 riders on an average weekday in the fourth quarter of 2018, or about 8,500 per mile.22 Edmonton’s Light Rail Transit, meanwhile, averaged 110,786 riders per weekday in 2018, or about 7,337 per mile.23 These figures call into question whether most U.S. cities have any transit cor-ridors busy enough to merit conversion from buses to light rail.
II. What Drives Transit Ridership?There are two principal drivers of transit ridership. First, and most important, is development density sur-rounding the stations. When travelers have to walk or drive long distances to reach a transit station, driving is almost always faster, even in congested traffic. This is especially true of commuters, who are reluctant to have to travel long distances between their jobs and down-town transit stops (they are generally more tolerant of long trips from transit stops to their homes). This ob-servation is commonly called the “Quarter-Mile Rule”: most commuters on public transit travel no more than a quarter-mile from a transit stop to their jobs, and few travel more than 700 meters, or about 0.43 miles.24
Second is frequency of service. For short-distance trips common on U.S. light rail systems—in 18 of the 23 U.S.

7
systems studied here, the mean trip length is under seven miles—time spent waiting for vehicles can far outweigh time spent traveling. More frequent service, then, has a greater effect on overall trip time than faster speeds. (Waiting-time decreases have a still larger effect on riders’ perceived travel time: studies con-sistently find that riders perceive a minute of waiting time as longer than a minute of in-vehicle time. Some studies find that riders value waiting time more than twice as much as in-vehicle time.)25
Researchers at McGill University, for example, com-pared frequency and ridership statistics for several North American bus systems and found: “The volume of service delivered by a transit agency in a region is by far the largest factor explaining public transit rid-ership in the North American metropolitan regions we studied.”26 Other studies have investigated the elasticity of transit ridership relative to service changes. (“Elas-ticity” is the percentage increase in ridership caused by a 1% increase in service frequency.) One experimental study in Minneapolis estimated an elasticity of about 0.39;27 that is, 1% more service means 0.39% more riders. If the marginal costs of an additional train are less than 39% of the average costs—quite possible, as fixed costs such as track maintenance account for large portions of rail costs—running additional service would be net profitable. Other reviews have found even higher elasticities; one study, for instance, estimates a long-run elasticity of 0.7–1.1.28
These observations are borne out by a simple linear model of light rail ridership, using data from 23 U.S. light rail systems, as shown in the figure on the next page. The graph suggests that service frequency and development of density around light rail stations ac-counts for most of the variation in transit ridership, and shows why light rail construction in low-density areas is typically unsuccessful. It is possible to predict 89% of the variance in their performance almost perfectly from three variables: the total number of jobs within a half-mile of each station; the number of employed workers within a half-mile; and the total number of trains per day per direction (calculated by dividing the total number of train-miles run in an average day by twice the route length of the system).
These figures should not be overinterpreted. Using radii different from a half-mile gives equally good predictions.
Furthermore, frequency of service itself is correlat-ed with other variables that predict ridership: denser areas will naturally merit higher levels of service, and the effects of denser development and better service on
ridership may not be reliably separable with simple sta-tistical tools. Our model, however, estimates that for a typical system with 2,000 riders per day per route-mile and 100 daily trains, an increase to 110 daily trains would improve ridership by approximately 6%, for an elasticity of 0.6. This is within the range of elasticities found by other studies.
Why does the U.S. do so poorly?U.S. light rail systems perform very poorly relative to most European systems, but also compared with systems in Canada that serve cities similar to U.S. cities. Edmonton and Calgary, for example, resemble U.S. cities in their high rates of car ownership and pre-dominance of single-family houses. The population density of Calgary is 3,442 residents per square mile, and that of Edmonton is 3,525 residents per square mile, both comparable with Phoenix, which had 3,207 residents per square mile within the city boundaries in 2018. Despite this, both Edmonton and Calgary have higher rates of light rail ridership.
Different urban-planning decisions may help explain the disparity. U.S. planners devoted vast resources toward facilitating car access to downtowns, build-ing massive expressways, and leveling city blocks for more parking space. The zoning codes in all U.S. cities also require commercial and residential developers to provide large amounts of off-street parking, often far in excess of market demand. Parking minimums effec-tively subsidize driving at property owners’ expense and reduce feasible development densities, thereby suppressing transit demand.
In Edmonton and Calgary, by contrast, planners kept expressways out of downtown. Calgary also deliberate-ly restricted parking construction in the downtown area and encouraged the redevelopment of surface parking lots as buildings, thereby keeping parking prices high.29
Though Canadian zoning codes do include parking requirements and density limits, they tend to be less onerous than in the United States. For example, the code that governs most single-family areas in Calgary requires only 330 square meters of land per house, or about 12 houses per acre, much higher than the standard densities of suburban developments in the United States. In California, by contrast, the median minimum lot size is 6,000 square feet, allowing about seven houses per acre.30

The Economics of Urban Light Rail: A Guide for Planners and Citizens
8
III. Common Problemsin Light Rail PlanningLight rail works best in a very particular set of circumstances. In areas where driving is difficult but travel demand is large and consistent, it can facilitate relatively short trips of a few miles or less. In these cases, the ability to run larger light rail vehicles with less bunching and fewer drivers can offset the increased expenses in capital maintenance. Over longer distances, the low speed of light rail vehicles cannot compete with freeways; with lighter traffic loads, the problem of bus bunching becomes less severe.
The low ridership of most U.S. light rail systems, however, frequently stems from one of two mistakes: overexpansion; and route choices that are more politically expedient than economically efficient.
OverexpansionThe best-performing newer systems in our database, such as Minneapolis, Seattle, and Houston, are all compact, serving urban areas near downtown. By contrast, larger light rail systems that stretch into low-density suburban areas tend to underperform.
Dallas’s DART system (1,024 weekday riders per route-mile in 2018) and Denver’s RTD (1,443 weekday riders per route-mile) are two good examples. Christof Spieler, a planner for Houston’s public transit agency, has detailed the political pressures that led both systems to expand too far. In DART’s case, the system was financed by each participating municipality and had an incentive to cover as many municipalities as possible—often in undesirable locations on corridors cobbled together out of old freight rail rights-of-way.31 Many leading Dallas politicians, meanwhile, had invested in real-estate development in Dallas’s northern suburbs, so they had incentives to push for an expansive, suburb-focused rail network.32 The managers of RTD in Denver, meanwhile, explicitly conceived of light rail as a commuter rail substitute, and its lines reach far out into low-density residential neighborhoods. As a result, most Denver stations have low ridership: of the 66 stations in Denver’s frequent rail network, only 16 average more than 500 boardings per weekday. This is even worse than DART, where 55 of 64 stations get more than 500 riders per day.33
Two species of overexpansion in U.S. cities deserve special mention. First is an overemphasis on serving transit-oriented developments. Many cities have seen new developments on “New Urbanist” principles: apartments with mid-rise units and a mix of commer-
Predicted and Actual 2017 Weekday Ridership per Mile
5,000
4,000
3,000
2,000
1,000
Actu
al W
eekd
ay R
ider
ship
Predicted weekday ridership from service frequency and development density4,0002,0000
OCE
SAC
CLENOR
BALSTL SJ
DENPIT
CLTSLC
SD PDXBUF
LA
PHL
HOUNJ
SEAMSP
SF
DAL
SEA: Seattle, WAMSP: Minneapolis–Saint Paul, MNNJ: New JerseyHOU: Houston, TXLA: Los AngelesPHL: PhiladelphiaBUF: Buffalo, NYPDX: Portland, ORSD: San Diego, CACLT: Charlotte, NCDEN: Denver, COSLC: Salt Lake City, UTPIT: Pittsburgh, PASTL: St. Louis, MOSJ: San Jose, CADAL: Dallas, TXBAL: Baltimore, MDSJ: San Jose, CANOR: Norfolk, VASAC: Sacramento, CACLE: Cleveland, OHOCE, Oceanside, CA
Source: Author’s Calculations based on U.S. Census Bureau, Longitudinal Employer-Household Dynamics and American Public Transportation Association, “Public Transportation Ridership Report” Fourth Quarter, 2018.

9
The Economics of Urban Light Rail: A Guide for Planners and Citizens
10
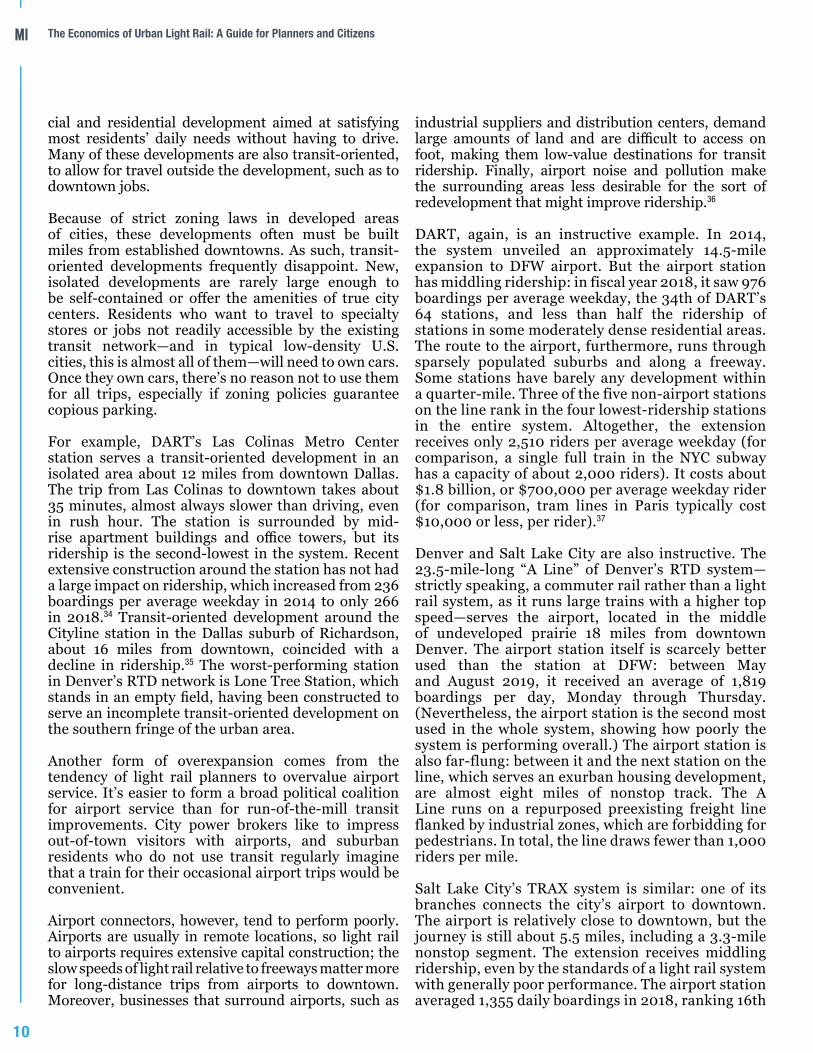
cial and residential development aimed at satisfying most residents’ daily needs without having to drive. Many of these developments are also transit-oriented, to allow for travel outside the development, such as to downtown jobs.
Because of strict zoning laws in developed areas of cities, these developments often must be built miles from established downtowns. As such, transit-oriented developments frequently disappoint. New, isolated developments are rarely large enough to be self-contained or offer the amenities of true city centers. Residents who want to travel to specialty stores or jobs not readily accessible by the existing transit network—and in typical low-density U.S. cities, this is almost all of them—will need to own cars. Once they own cars, there’s no reason not to use them for all trips, especially if zoning policies guarantee copious parking.
For example, DART’s Las Colinas Metro Center station serves a transit-oriented development in an isolated area about 12 miles from downtown Dallas. The trip from Las Colinas to downtown takes about 35 minutes, almost always slower than driving, even in rush hour. The station is surrounded by mid-rise apartment buildings and office towers, but its ridership is the second-lowest in the system. Recent extensive construction around the station has not had a large impact on ridership, which increased from 236 boardings per average weekday in 2014 to only 266 in 2018.34 Transit-oriented development around the Cityline station in the Dallas suburb of Richardson, about 16 miles from downtown, coincided with a decline in ridership.35 The worst-performing station in Denver’s RTD network is Lone Tree Station, which stands in an empty field, having been constructed to serve an incomplete transit-oriented development on the southern fringe of the urban area.
Another form of overexpansion comes from the tendency of light rail planners to overvalue airport service. It’s easier to form a broad political coalition for airport service than for run-of-the-mill transit improvements. City power brokers like to impress out-of-town visitors with airports, and suburban residents who do not use transit regularly imagine that a train for their occasional airport trips would be convenient.
Airport connectors, however, tend to perform poorly. Airports are usually in remote locations, so light rail to airports requires extensive capital construction; the slow speeds of light rail relative to freeways matter more for long-distance trips from airports to downtown. Moreover, businesses that surround airports, such as
industrial suppliers and distribution centers, demand large amounts of land and are difficult to access on foot, making them low-value destinations for transit ridership. Finally, airport noise and pollution make the surrounding areas less desirable for the sort of redevelopment that might improve ridership.36
DART, again, is an instructive example. In 2014, the system unveiled an approximately 14.5-mile expansion to DFW airport. But the airport station has middling ridership: in fiscal year 2018, it saw 976 boardings per average weekday, the 34th of DART’s 64 stations, and less than half the ridership of stations in some moderately dense residential areas. The route to the airport, furthermore, runs through sparsely populated suburbs and along a freeway. Some stations have barely any development within a quarter-mile. Three of the five non-airport stations on the line rank in the four lowest-ridership stations in the entire system. Altogether, the extension receives only 2,510 riders per average weekday (for comparison, a single full train in the NYC subway has a capacity of about 2,000 riders). It costs about $1.8 billion, or $700,000 per average weekday rider (for comparison, tram lines in Paris typically cost $10,000 or less, per rider).37
Denver and Salt Lake City are also instructive. The 23.5-mile-long “A Line” of Denver’s RTD system—strictly speaking, a commuter rail rather than a light rail system, as it runs large trains with a higher top speed—serves the airport, located in the middle of undeveloped prairie 18 miles from downtown Denver. The airport station itself is scarcely better used than the station at DFW: between May and August 2019, it received an average of 1,819 boardings per day, Monday through Thursday. (Nevertheless, the airport station is the second most used in the whole system, showing how poorly the system is performing overall.) The airport station is also far-flung: between it and the next station on the line, which serves an exurban housing development, are almost eight miles of nonstop track. The A Line runs on a repurposed preexisting freight line flanked by industrial zones, which are forbidding for pedestrians. In total, the line draws fewer than 1,000 riders per mile.
Salt Lake City’s TRAX system is similar: one of its branches connects the city’s airport to downtown. The airport is relatively close to downtown, but the journey is still about 5.5 miles, including a 3.3-mile nonstop segment. The extension receives middling ridership, even by the standards of a light rail system with generally poor performance. The airport station averaged 1,355 daily boardings in 2018, ranking 16th

11
in the system out of 58 total stations. The other four stations on the line ranked 25th, 27th, 37th, and 50th, with the poorest-performing station receiving only 168 riders on an average day in 2018.
Avoiding dense, walkable areas for ease of construction
The best place to build light rail, as our findings on the association between density and ridership show, is in dense locations near jobs. Unfortunately, this inevi-tably involves taking street space away from cars and thus is often controversial. The temptation always exists for planners to use easier alignments instead, such as building along freeways or abandoned freight railways, or through industrial zones with few resi-dents to object.
Charlotte’s LYNX system, one of the lowest-performing of the 23 systems we examined, shows how this temptation manifests. South of downtown, much of the city’s light rail line runs alongside an active Norfolk Southern freight line, roughly parallel to South Boulevard, an important commercial street. But accessing South Boulevard from the light rail stations requires walking several hundred feet or more, and the freight line sometimes cuts off the easiest pedestrian routes. Moreover, though many LYNX stations have seen considerable redevelopment, the southern end of the route remains undeveloped. Dallas’s DART Green Line, which runs northwest of the city, likewise uses a freight rail corridor through a large industrial zone. The stations along this line are among the least busy in the system: of the four stations within the industrial zone (Downtown Carrollton, Farmers Branch, Royal Lane, and Walnut Hill/Denton), none ranks above 42nd out of the system’s 64 stations in ridership.
Planners also sacrifice destination quality for expedi-ence by running light rail lines along peripheral roads or freeways. Christof Spieler has observed that many high-value destinations in Denver are served only indi-rectly. For example, the R light rail line skirts one side of the Anschutz Medical Center, along a broad road, rather than running through it;38 much of the medical center is thus over a mile from the station that nom-inally serves it. The main system hub, Denver Union Station, is located on the northwest edge of downtown; many riders must transfer to a free shuttle to get to their final central-city destinations.
Some cities have built substantial portions of their light rail networks along freeways. In Los Angeles, the Green Line is mostly in the median of Interstate 105, which
runs through the southern suburbs of L.A.; two of its stations are located inside freeway interchanges. In Portland, about 14 miles of the MAX light rail system, including the main trunk that carries three lines to the city’s eastern suburbs, are built either in the median or alongside Interstates 84 and 205. Much of Denver’s light rail system, one of the nation’s worst-performing, and a significant underperformer relative to surround-ing development density, runs along Interstates 25 and 225.
Light rail lines along freeways are undesirable for several reasons. First, the freeway takes up much of the land accessible from rail stations on foot. Second, because freeways are convenient to access by automo-bile but unpleasant to live near, they tend to be sur-rounded by lower-value land uses. Third, trips on a light rail line that runs alongside a freeway are compet-ing directly with the region’s fastest car trips. The light rail systems in Seattle, Minneapolis, Houston, and San Francisco, which are all among the best-performing in the United States, have no segments, or only short pe-ripheral segments, along freeways.
The undesirability of lines located in freeway medians can be seen in Los Angeles’s Green Line, which has the weakest ridership in the system: it averaged just 1,542 riders per weekday per route-mile in 2018. The Gold Line (which also runs some distance in a freeway median), by comparison, had 1,630 riders per weekday per route-mile; the Blue and Expo lines, respectively, averaged 2,939 and 4,015 riders per route-mile.39 (The comparison is admittedly imperfect, as the Green Line is also the only one that does not serve downtown Los Angeles.)
IV. ConclusionsThere may be a restricted role for light rail in U.S. cities: handling frequent trips in dense inner urban areas, where passenger demands exceed bus capaci-ty and the higher speed of freeways is less of a selling point. But most light rail systems do not fit this niche: they serve low-ridership corridors, or long-distance trips that cannot compete with freeways.
Most transit agencies should be far more skeptical of building new light rail lines than they have been; any corridor without enough ridership to fill a bus every few minutes should not be a light rail line. Light rail projects that do not serve any current ridership should not be defended on the grounds that future transit-ori-ented development will provide a source of riders. Rid-ership from these developments is often disappointing,

The Economics of Urban Light Rail: A Guide for Planners and Citizens
12
and many residents of far-flung transit-oriented devel-opments would be much happier living in apartment buildings in inner-ring neighborhoods if zoning poli-cies were more rational. For aiding commutes from far-flung suburbs, additional commuter bus service would be faster and cheaper than light rail expansions.
It may be better to simply tear down some especially low-performing lines run by transit agencies with high light rail operating costs. The savings can then be redi-rected to running more frequent service on core parts of the line or simply to reducing the need for tax sub-sidies. Such a move would not be wholly unprecedent-ed. In a recent redesign of its network, San Jose closed down a particularly low-performing outer stretch of its light rail line.40 Other agencies with extremely far-flung lines that receive little ridership, such as DART’s line to DFW airport, may want to consider closing these exten-sions and instead serving the more important stations with express shuttle buses. Some smaller systems may be better off closed entirely. For example, the Sprinter light rail line in northern San Diego County is the low-est-performing light rail system in ridership per mile of the 23 we have studied, and it has the second-highest operational expenses per mile and the highest ratio of light rail to bus expenses. Sprinter also parallels a sig-nificantly faster road—the Ronald Packard Parkway—and the surrounding neighborhood has shown little appetite for high-density redevelopment. Officials in the region should strongly consider replacing Sprinter service with bus service on parallel roads and exper-imenting with other methods of congestion control, such as dynamic tolling.
Unfortunately, some agencies are planning light rail expansions to corridors with unproven, and likely low, demand. In Phoenix, for example, voters recently de-feated a ballot measure that would have halted light rail construction, allowing the expansion of the city’s light rail system to the south and the west. Unfortu-nately, both expansions run through low-value land. The southern extension serves a low-density area cur-rently filled with vacant lots, and the agency itself proj-ects that the project will cost $81,000 per daily rider.41 The planned western expansion, meanwhile, runs mostly alongside Interstate 10 through largely indus-trial areas.
In Houston, the cornerstone of a recently approved light rail system is a line to Hobby Airport through industrial and low-density residential areas, estimat-ed to cost $167,000 per daily rider.42 More promising corridors, such as the long-proposed Universities Line that connects several of Houston’s most important job centers, are receiving only bus upgrades.
In Seattle, finally, Sound Transit has proposed extend-ing the light rail line south from its current terminus at SeaTac airport to the suburb of Federal Way, 20 miles from downtown.43 The extension lacks the virtues that made the existing Seattle light rail network relatively successful. The planned 7.8-mile, $3.16 billion light rail line—at $400 million per mile, an inordinate con-struction cost for an aboveground line—will run along-side Interstate 5 through low-density residential and retail areas with poor pedestrian accessibility. All three cities should reconsider or halt plans for expansion.
Though most transit agencies should not expand light rail systems, many of them could nevertheless improve the use of current lines. For example, adding more fre-quent off-peak service is very cheap.44 Infrastructure and rolling stock expenses are largely determined by the system’s peak capacity, as are crew expenses, since hiring split-shift train drivers, who work only in rush hours and break during midday, is difficult. Neverthe-less, many systems run very low frequencies during off-peak hours. DART, for example, runs only once every 20 minutes; Phoenix’s Valley Metro Rail runs every 24 minutes. Given the low marginal costs of off-peak service as well as the high elasticity of ridership to service frequency, higher off-peak frequencies on many systems would quite likely pay for themselves in improved ridership.
Finally, cities with light rail systems should eliminate all regulatory barriers to using the land around them to the fullest. This means allowing high-density con-struction in regions adjacent to transit stops and elim-inating hidden subsidies for driving, such as parking minimums. As UCLA urban-planning professor Donald Shoup has documented, the off-street parking minimums common in most U.S. zoning codes severe-ly inflate the costs of new residential and, especially, commercial construction.45 They also handicap light rail by subsidizing driving and often force new devel-opment into low-density, pedestrian-hostile forms, such as big-box retail with stores surrounded by large parking lots. Houston has taken a step in the right di-rection by abolishing parking minimums in the Down-town, Midtown, and East Midtown neighborhoods, all of which are served by light rail.
Improving public transportation is a worthy goal. But far-flung light rail networks through industrial zones—though they may get support from suburban residents who think that more transportation options to downtowns and airports are always better—are counterproductive and expensive. The political compromises required to get light rail lines built, furthermore, often result in bad routes that are worse than no line at all. Other than a few dense downtown

13
and near-downtown areas, most of which already have light rail lines, nowhere in the nation has enough public transit demand to justify the cost of rail investment. Public transit advocates should focus on more cost-effective methods for serving low-density suburban areas and on reforming land-use regulations to optimize the use of existing systems.

The Economics of Urban Light Rail: A Guide for Planners and Citizens
14
Endnotes1 Edson L. Tennyson, “Impact on Transit Patronage of Cessation or Inauguration of Rail Service,” Transportation Research Record 1221 (1989).2 Randal O’Toole, “The Worst of Both: The Rise of High-Cost, Low-Capacity Rail Transit,” Policy Analysis (Cato Institute), no. 750 (June 3, 2014).3 Jarrett Walker, “Streetcars: An Inconvenient Truth,” Human Transit (blog), July 3, 2009.4 Dallas Area Rapid Transit (DART), Capital Planning Division, DART Reference Book, Version 10.0, March 2019. 5 Alejandro Tirachini, David A. Hensher, and Sergio R. Jara-Díaz, “Comparing Operator and Users Costs of Light Rail, Heavy Rail and Bus Rapid Transit
over a Radial Public Transport Network,” Research in Transportation Economics 29, no. 1 (2010): 231–42.6 Ming Zhang, “Bus Versus Rail: Meta-Analysis of Cost Characteristics, Carrying Capacities, and Land-Use Impacts,” Transportation Research
Record 2110, no. 1 (January 2009): 87–95.7 Federal Transit Administration, “NTD Data: Expenses.”8 Keith Barrow, “Besançon Inaugurates ‘Low Cost’ Tram Line,” International Railway Journal (Sept. 1, 2014).9 Yonah Freemark, “How Is Besançon Building a Tramway at €16 million/kilometer?” The Transport Politic (blog), Oct. 1, 2010.10 Planitec BTP, “Design and Construction of the T7 Tramway Line Between Villejuif and Athis-Mons.” 11 Alon Levy, “What Are the Strong Tramway Corridors?” Pedestrian Observations (blog), July 20, 2016. 12 Régie Autonome des Transports Parisiens (RATP), “T7 Extension to Juvisy-sur-Orge,” Sept. 18, 2018. 13 U.S. Dept. of Transportation (DOT), “Dallas Area Rapid Transit Project Orange Line Extension (I-3).”14 Daniel B. Hess, Brian D. Taylor, and Allison C. Yoh, “Light Rail Lite or Cost-Effective Improvements to Bus Service? Evaluating Costs of Implementing Bus
Rapid Transit,” Transportation Research Record 1927, no. 1 (2005): 22–30. 15 Ibid.16 Ari Ofsevit, “How Much Does BRT Cost? 7X Less than LRT? (Hint: No),” The Amateur Planner (blog), June 3, 2015. 17 Walter Hook, “Bus Rapid Transit Planning Guide: 2016 Edition,” BRT Planning International, 2016.18 Zhang, “Bus Versus Rail.”19 “Wikipedia: List of North American Light Rail Systems by Ridership,” Wikimedia Foundation, last modified Mar. 4, 2020. All numbers are for 4Q:2018.20 Olivier Razemon, “En région parisienne, le tramway victime de son succès,” Le Monde, June 19, 2019. 21 Denis Lherm, “Tramways et bus à Bordeaux : 168 millions de voyageurs en 2018, le trafic explose,” Sud Ouest, Mar. 28, 2019.22 American Public Transportation Association, “Public Transportation Ridership Report” Fourth Quarter, 2018.23 “2018 LRT Passenger Count Report,” Urban Form and Corporate Strategic Development, City of Edmonton, March 2019.24 Reinhard Clever, “The Last Mile Falling Through the Cracks—Case Study of the San Francisco to San Jose Section of the California High Speed Rail
System,” presentation at the 90th annual meeting of the Transportation Research Board, Washington, D.C., Jan. 24, 2011.25 Yingling Fan, Andrew Guthrie, and David Levinson, “Waiting Time Perceptions at Transit Stops and Stations: Effects of Basic Amenities, Gender, and
Security,” Transportation Research Part A: Policy and Practice 88 (2016): 251–64.26 TransitCenter, “Service Matters: Examining Ridership Trends in 25 North American Cities over Time,” May 29, 2018. 27 Joseph Totten and David Levinson, “Cross-Elasticities in Frequencies and Ridership for Urban Local Routes,” Journal of Public Transportation 19, no. 3
(2016): 117–25. 28 Todd Litman, “Transit Price Elasticities and Cross-Elasticities,” Victoria Transport Policy Institute, Mar. 18, 2019, p. 20.29 Neil McKendrick et al., “Calgary’s CTrain—Effective Capital Utilization,” Calgary Transit, 2007.30 Salim Furth and Olivia Gonzalez, “California Zoning: Housing Construction and a New Ranking of Local Land Use Regulation,” Mercatus Research,
Mercatus Center at George Mason University, August 2019.31 Quoted in Matt Goodman, “DART Successfully Built for Sprawl. So When Will It Design for People?,” D Magazine, Nov. 30, 2018. 32 Jim Schutze, “Dallas Needs to Do a Tammy Wynette on DART—D-I-V-O-R-C-E,” Dallas Observer, Feb. 13, 2020.33 Regional Transportation District Denver, “Rail Station Activity Analyzed,” May 2019.34 DART Capital Planning Division, DART Reference Book, Version 7.0, March 2016; DART Reference Book, Version 10.0.35 Christof Spieler, Trains, Buses, People: An Opinionated Atlas of U.S. Transit (Washington, D.C.: Island Press, 2018), 105. 36 See, e.g., Ermanno Affuso et al., “Is Airport Proximity an Amenity or Disamenity? An Empirical Investigation Based on House Prices,” Land
Economics 95, no. 3 (2019): 391–408; Jacek Batóg et al., “Investigating the Impact of Airport Noise and Land-Use Restrictions on House Prices: Evidence from Selected Regional Airports in Poland,” Sustainability 11, no. 2 (2019): 412.
37 Alon Levy, “Why It’s So Expensive to Build Urban Rail in the U.S.,” CityLab, Jan. 26, 2018. 38 Quoted in Andy Bosselman, “Denver’s Buses and Trains Are Not Useful to Most People. A New Book Shows Why,” StreetsBlog Denver, Jan. 29, 2019. 39 Los Angeles County Metropolitan Transportation Authority, “Interactive Estimated Ridership Stats.” 40 Jarrett Walker, “San Jose and Silicon Valley: Welcome to Your New Network,” Human Transit (blog), Dec. 28, 2019. 41 U.S. DOT, “South Central Light Rail Extension: Phoenix, Arizona.” 42 Connor Harris, “Metro’s Planned Light Rail to Hobby Airport Is a Bad Investment,” City Journal Online, June 30, 2019.43 U.S. DOT, “Federal Way Link Extension: Seattle, Washington.” 44 Alon Levy, “Base Train Service Is Cheap, Peak Train Service Is Expensive,” Pedestrian Observations (blog), Jan. 22, 2018. 45 Donald Shoup, “Parking Reform Will Save the City,” CityLab, Sep. 20, 2019.

15

May 2020