
Suppressing Illegal Gun Markets: Lessons from Drug Enforcement

The Economics of the War on Illegal Drug Production and
Trafficking∗
Daniel Mejia† Pascual Restrepo‡
This version: August 2015
Abstract
We model the war on drugs in source countries as a conflict over scarce inputs in successive
levels of the production and trafficking chain, and study how policies aimed at different stages
affect prices and quantities in upstream and downstream markets. We use the model to study
Plan Colombia, a large intervention aimed at reducing the downstream supply of cocaine by
targeting illicit crops and blocking the transport of cocaine outside this source country. The
model fits the main patterns found in the data, including the displacement of the drug trade
to other source countries, the increase in coca crops’ productivity as a response to eradication,
and the lack of apparent effects in consumer markets. We use a reasonable parametrization
of our model to evaluate the cost-effectiveness of different policies implemented under Plan
Colombia. We find that the marginal cost to the U.S. of reducing cocaine transacted in retail
markets by one kilogram is $940,000, if it subsidizes eradication efforts; and $175,000, if it
subsidizes interdiction efforts in Colombia.
Keywords: Hard Drugs, Conflict, War on Drugs, Plan Colombia.
JEL Classification Numbers: D74, K42.
∗We thank the Associate Editor, Martin Rossi, and three anonymous referees for their valuable comments and suggestions. For
their comments, we also thank Bruce Bagley, Jon Caulkins, Marcela Eslava, Andrew Foster, Hugo Nopo, Gerard Padro-i-Miguel,
Carlos Esteban Posada, Peter Reuter, Enrico Spolaore, Roberto Steiner, Rodrigo Suescun, Juan F. Vargas and Stephen Walt, as well
as seminar participants at Berkeley, Brookings, Brown, IADB, ISSDP 2009, Lacea 2008, RAND, Stanford, Tufts, U.C. Irvine, U. de
los Andes, U. del Rosario, U. of Miami, U. of Warsaw, U. Torcuato Di Tella, the Colombian Ministry of Defense and the II NEAT
workshop. Maria Jose Uribe and Catalina Ulloa provided excellent research assistance. We would especially like to thank Juan Camilo
Castillo, who also provided excellent research assistance and revised the manuscript and formulas thoroughly. All remaining errors
are ours. The first author acknowledges financial support from Fedesarrollo’s “German Botero de los Rios” 2008 Prize for Economic
Research and the Open Society Foundations.†Corresponding author. Department of Economics, Universidad de los Andes, e-mail: [email protected]‡Department of Economics, Massachusetts Institute of Technology, e-mail: [email protected].
1

1 Introduction
Ever since Richard Nixon formally declared a war on drugs in 1971, different policies have been
implemented in producer, transit and consumer countries with the goal of reducing illegal-drugs’
consumption. Source and transit countries, such as Colombia (where about 70% of the cocaine
consumed worldwide is produced), Afghanistan and Mexico, have played a mayor role, and in
alliance with the U.S. and other developed countries, implemented several anti-drug strategies
ranging from the eradication of illicit crops, the detection and destruction of processing labs and
the interdiction of drug shipments en route to consumer markets.
In September 1999, the Colombian government announced Plan Colombia, a strategy which
had two main objectives. The first was to reduce the production of illegal drugs (primarily
cocaine) by 50% within six years; the second was to improve security conditions in Colombia
by reclaiming control over large areas of the country held by illegal armed groups (see the U.S.
Government Accountability Office - GAO, 2008). Since 2000, Plan Colombia has provided the
institutional framework for a military alliance between the U.S. and Colombia in the war against
drug production, trafficking and the organized criminal groups associated with these activities.
According to official figures from the Colombian government (see DNP, 2006), between 2000
and 2008, the U.S. disbursed about $4.3 billion for the military component of Plan Colombia;
while the Colombian government spent about $7.3 billion on several anti-narcotic programs. Joint
expenditures reached, on average, $1.3 billion per year, which corresponds to about 1.2% of Colom-
bia’s GDP, making Plan Colombia on of the largest interventions in a drug producing country.
Despite the financial efforts, the results have been mixed. While the number of hectares of coca
crops cultivated in Colombia decreased by about half (from 161,700 hectares in 1999 and 2000 to
86,000 hectares on average from 2005 to 2008), potential cocaine production only decreased by
about 24% (from 690 metric tons per year from 1998 to 2000, to 550 around 2008). This para-
doxical outcome can be explained by a significant increase in yields per hectare, from roughly 4.3
kg of cocaine per hectare per year prior to 2000, to about 6.6 kg of cocaine per hectare per year
in 2008. Furthermore, the wholesale price of cocaine in consumer countries remained relatively
stable during this period.1
In this paper, we construct a model of the war on drugs in source countries to study the effects
of such interventions in downstream and domestic markets. Our model helps us understand the
mixed results of Plan Colombia and underscores the economic forces explaining the mixed results.
The structure in our model allows us to surpass the inherent data limitations related to the study
1See Mejıa and Posada (2008) for a thorough description of the main stylized facts related to cocaine markets,
both in producer and consumer countries. Despite Plan Colombia, market prices at the wholesale and retail levels
remained relatively stable from 2000 to 2008— the period in which we base our study. Recent data indicates an
increase in wholesale prices since 2008, when Colombia redirected its efforts towards interdiction.
2

of illegal markets, and provides tractable expressions to calculate the cost effectiveness of different
supply-side interventions. These are informative numbers in this context, given that the lack of
good natural experiments and the general equilibrium effects of such large interventions, limit our
ability to grasp the magnitude of such costs from traditional program evaluation analysis.2
We model the drug market as a vertical production chain composed of several stages (or
nested production functions), starting with production in the source country and followed by
trafficking to transit countries. Drugs are then transported and distributed in downstream markets,
until reaching final consumers. Source country interventions take place in two fronts. First, the
eradication front, where policies are aimed at reducing the cultivation of illicit crops (coca or
opium poppy) required to produce hard drugs (cocaine or heroin, respectively). Second, in the
interdiction front, where policies are aimed at blocking the routes required to transport the drugs
from the source country to transit markets and interdicting drug shipments. Both policies affect
downstream markets by curbing the net supply of drugs from the source country.
Our model incorporates several economic forces usually absent from formal analysis of illegal
drug markets or policy discussions. First, we allow producers to combine land and complementary
factors to produce cocaine, which creates the potential for substitution in response to eradication
efforts. This force creates an endogenous increase in land productivity as a response to eradication
campaigns, thus rendering these policies less effective at curbing drug production. Likewise, we
allow traffickers to compensate for interdiction losses by demanding more cocaine. Second, our
model allows other source countries to supply downstream markets when the price of Colombian
cocaine increases. This renders supply reduction efforts in Colombia less effective in reducing
downstream consumption and creates the possibility of displacement effects: Large shifts in cocaine
production among different source or transit countries depending on the extent and effectiveness of
different anti-drug anti-drug strategies implemented in each of these countries. Finally, our model
takes into account that, at each stage, Colombian cocaine only represents a fraction of producers’
costs, while a large chunk of the price is determined by other inputs, including labor used in
distribution networks, bribes for government officials, airplanes or drug submarines, construction
of drug-tunnels, etc. Since supply-reduction policies in Colombia do not directly affect the price
or supply of these inputs, increases in the price of Colombian cocaine do not translate into equal
changes in consumer prices, rendering source country interventions less cost effective.
Essentially, our model allows drug markets to adjust to reductions in coca crops and routes
in a source country through margins other than an increase in consumer prices. The adjustment
may occur through investments aimed at raising land productivity, displacement of production to
2Some recent exceptions include the papers by Mejıa et al. (2014) and Rozo (2014), described in the related
literature section. However, both papers only estimate partial equilibrium effects, and their general equilibrium
implications require filtering the results through a model like the one we propose in this paper.
3

other countries, or a more intensive use of trafficking and distribution networks abroad. Our model
disciplines these margins of adjustment by providing an explicit micro-foundation, and permits us
to quantify them using reasonable parameter values.
Besides the above market structure, we follow the conflict literature (See Grossman and Mejıa,
2008) and model supply-reduction policies in source countries as a conflict between the (Colom-
bian) government and producers or traffickers. For instance, we model eradication as a conflict
between the government and producers over the effective control of land suitable for coca cultiva-
tion. Likewise, we model interdiction as a conflict between the government and drug traffickers
over the effective control of transportation routes. This modeling strategy incorporates another
margin of adjustment; namely, investments by market participants to avoid eradication and in-
terdiction efforts. As a result, the cost of eradication and interdiction depends on how valuable
land and routes are for producers and traffickers, respectively, thus making interventions aimed
at less valuable inputs less costly. However, these cost gains have to be weighed against the fact
that such interventions have a smaller effect on downstream prices— given that the share of such
inputs reflected in consumer prices is small— when computing their cost-effectiveness.
Finally, we also assume source-country interventions are implemented locally, with partial
funding from consumer countries (the U.S.) in an effort to strengthen the resolve of the source
country in curbing its drug supply. This creates the possibility of agency problems, and implies that
source countries’ preferences and objectives will also, from an outsider’s perspective, determine the
costs of eradication and interdiction. In particular, a larger misalignment among both countries’
objectives makes schemes such as Plan Colombia more costly from the outsider’s perspective. For
instance, the Colombian government greatly emphasized eradication during our period of analysis,
presumably because of internal political considerations or in an effort to affect the finances of large
armed groups involved in cocaine production (guerrilla and paramilitary groups). From the U.S.
perspective, such preferences imply that more subsidies will be used in the less efficient (but more
appealing from the Colombian government point of view) eradication, than in interdiction.
After presenting our model, we turn to a quantitative exploration of its implications. Our
model rationalizes several stylized facts of the war on drugs during Plan Colombia. For example,
our model predicts an increase in land productivity following an intensification of eradication
campaigns, as observed in the data. Our model also suggests that, despite large increases in
eradication and interdiction efforts, there are only limited effects on retail quantities and prices.
Consistent with this prediction, the wholesale and retail price of cocaine remained relatively stable
during the years of our study. Our model also predicts a reallocation of cocaine production to
other source countries. Indeed, following the implementation of Plan Colombia, cocaine production
shifted considerably to Peru and Bolivia— the other two producers of cocaine in the Andean region.
In a more ambitious exercise, we turn to quantifying the cost-effectiveness of Plan Colombia
4

using our model. We back up reasonable values for the parameters of our model based on the
available data; these quantify the extent of different margins of adjustment in the cocaine market.
We then compute measures of the cost-effectiveness of eradication and interdiction. Since we
do not have enough data or a reliable identification strategy to estimate all parameters, these
results are only suggestive of the broad quantitative implications of the margins of adjustment
incorporated in our model, and are indicative of how they shape the costs and effectiveness of
different policies. Our findings indicate the marginal cost to the U.S. of reducing consumption
of cocaine in downstream markets by 1kg is about $940,000, if it subsidizes eradication efforts;
and about $175,000, if it subsidizes interdiction efforts in Colombia. Both numbers are large
and suggest source-country interventions are quite ineffective at curbing drug supply in consumer
countries. To put these numbers in perspective, MacCoun and Reuter (2001) estimate that it would
cost the U.S. $33 million per year to reduce consumption by 1% using treatment for addicts, and
between $50 and $275 million per year using prevention policies. These figures imply marginal
costs of reducing consumption by 1kg using treatment of $8,250; and between $12,500 and $68,750
using prevention, respectively. Eradication and interdiction in source countries are, at least, 13
and 3 times more costly than these alternative domestic policies, respectively. Taken at face value,
these numbers suggest that, if the U.S. wants to reduce drug consumption, it is better off investing
in treatment and prevention programs domestically than subsidizing source country interventions,
as Plan Colombia, abroad.3
Our model is based on the case of Colombia and the cocaine trade. Thus, we refer to cocaine as
the illegal drug being produced throughout, and to Colombia as the source country. Nevertheless,
the model and its main insights apply more generally to other producing and transit countries,
such as Afghanistan, where heroin is produced by processing opium poppy seeds and is then
transported to primarily consumer markets in Europe and North America; or Mexico, where
heroin and marijuana are produced and then shipped to final consumer markets in the U.S. In
these countries, the U.S. has also funded anti-narcotic efforts similar to Plan Colombia, for which
some the insights developed in this paper may apply.
2 Related Literature
There is a small but growing empirical literature on Plan Colombia relying on micro evidence.
For instance, Mejıa et al. (2014) estimate the impact of aerial spraying of coca crops (the biggest
component of eradication policies during our period of analysis) on cultivation. The authors
3These numbers are silent about other potential costs or benefits from such source country interventions. While
some commentators claim that Plan Colombia resources helped improve security and brought the professionalization
of the army, other researches point out to some unintended consequences (See Dube and Naidu, 2015).
5

exploit the natural experiment created by Colombia’s diplomatic compromise of not carrying out
spraying campaigns since 2006 in a 10 km strip in the border with Ecuador. They find spraying
campaigns have a statistically significant but small effect on coca cultivation, consistent with the
large marginal cost computed in our paper using a different methodology. Rozo (2014) uses an IV
strategy that exploits the location of natural and indigenous reserves— where spraying campaigns
are forbidden by law— and estimates a negative effect of eradication on coca yields. There is
also some empirical evidence for the effectiveness of the war on drugs on U.S. soil. Kuziemko and
Levitt (2004) find that drug prices increase in states imprisoning more drug offenders, consistent
with an inward shift in supply.
Other studies have focused on the unintended consequences of Plan Colombia, and the war
on drugs in general. For example, Dube and Naidu (2015) examine the impact of U.S. military
assistance on the intensity of conflict in Colombia, and find that it has led to an increase in
the number of paramilitary attacks near military bases. Angrist and Kugler (2008) show the
displacement of the coca trade from Peru to Colombia in the early 90s increased violence in
the country side, consistent with our view that the war on drugs involves conflict over resources
required for production (See also Mejıa and Restrepo, 2013). For other countries, Dell (2011)
uses a regression discontinuity approach in the election of Mexican mayors and documents that
following the election of a PAN mayor (the party spearheading the war on drugs in the country),
drug routes reallocated to neighboring places, increasing violence in these municipalities.
Most of the available applied-theory literature on the effects of anti-drug policies has focused
on partial equilibrium analysis. Caulkins et al. (2001) and Rydell et al. (1996) use this approach
in order to study the policy trade-off between treatment and enforcement policies in reducing
the consumption of illegal drugs. Grossman and Mejıa (2008) study the relative efficiency and
effectiveness of eradication and interdiction efforts in a partial equilibrium game theory model.4
However, the market for illegal drugs hides complex interactions that should be addressed using
models that can account for general equilibrium effects, especially when evaluating large-scale
policy interventions such as Plan Colombia. Some recent papers incorporating these effects include
Becker et al. (2006), Naranjo (2007), Chumacero (2010), Costa Storti and De Grauwe (2009), and
Mejıa and Restrepo (2011).5
4For a thorough survey of the literature on the effects of control interventions in source countries versus the
effects of treatment and prevention policies in consumer countries on reducing the demand for illegal drugs in the
latter, see Caulkins (2004), Reuter (2008), and Mejıa and Posada (2008).5Relatedly, Jeff Miron analyzes the costs of drug prohibition and the budgetary consequences of drug legalization
in the U.S. ((Miron, 2001) and (Miron, 2010)).
6

3 The Model
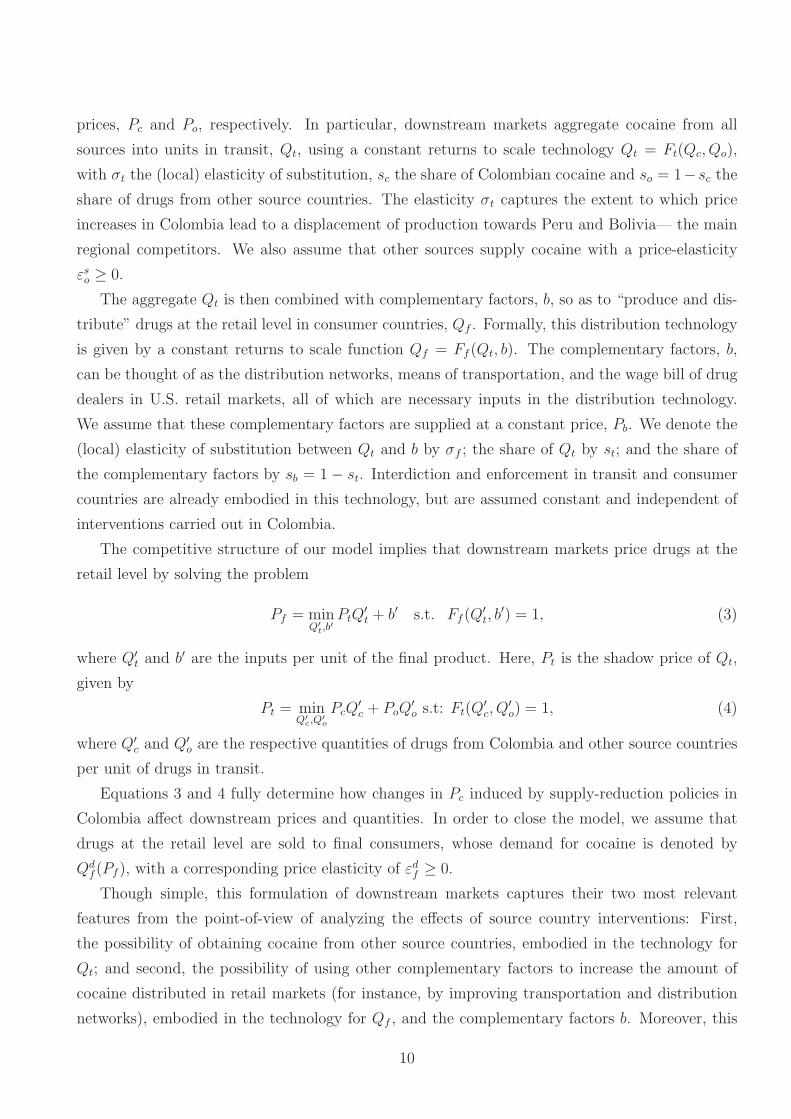
Wemodel the drug market as a vertical production chain where all agents involved are price takers.6
Figure 1 presents a diagram of the actors, markets and technologies involved in our model. It is
useful for readers to keep the diagram in mind as they proceed through the description of our
model.
Figure 1: Cocaine market structure.
3.1 Description of the markets
The first stage in the production of cocaine is the farm gate market, indexed with the subscript fg
and depicted at the left in Figure 1. At this stage, producers cultivate coca crops, harvest them,
and combine the leaves with chemical precursors such as gasoline, cement, sodium permanganate
and sulfuric acid in order to produce cocaine.7 The cultivation and processing of coca crops into
6In our view, this is a better approximation than assuming that certain players have market power. The recent
experience of countries such as Colombia, Peru and Mexico shows that although some groups have territorial and
market control over specific areas, they still face competition from other producers and trafficking organizations
located in other areas or even other countries. Even if some groups derive profits from market power (that is,
profits beyond risk compensation or rents accruing to the control of scarce resources), these would not affect our
conclusions as long as markups do not vary considerably with policies. Though some policies may affect markups,
we believe such effects are second order compared to the broad economic forces examined in our model. Thus, we
abstract from such possibilities in our analysis.7For a thorough description of the different stages of production and trafficking of cocaine in Colombia, see
Mejıa and Rico (2010).
7

cocaine is carried out by farmers, with the protection and direct involvement of illegal armed
groups, which have the capacity to confront the state over the control of the arable land necessary
to cultivate coca crops.8 We aggregate these agents and refer to them as the drug producer. The
final product of this initial stage of production is cocaine at the farm gate (e.g., at processing
facilities in the Colombian countryside). Farm-gate cocaine is purchased by a trafficker — or an
aggregate transportista— who smuggles cocaine outside the source country.
Formally, we assume that the drug producer combines arable land, l, with complementary
factors, a, to produce cocaine at the farm gate, Qfg. Complementary factors are purchased at a
price, Pa, which is assumed to be fixed and not affected by drug markets. Importantly, land is not
obtained in regular markets, but its effective control is contested by the Colombian government. In
particular, we assume that only a fraction, q ∈ [0, 1], of the available arable land, L, is effectively
controlled by the drug producer. In the next sub-section we endogenize this fraction as the outcome
of eradication policies and efforts by the drug producer to avoid them.
The drug production technology is given by a constant returns to scale function Qfg =
Ffg(a, qL), with σfg the (local) elasticity of substitution among inputs; sl the share of land;
and sa = 1 − sl the share of the factors complementary to land in the production of cocaine.9
Price-taking behavior implies the producer problem is given by the following cost minimization
problem:
minl,a
Pll + a s.t. Ffg(a, l) = Qfg, (1)
where the condition l = qL fixes the amount of land used in cocaine production and determines
its shadow price, Pl. The drug producer sells the total amount of farm gate production, Qfg, to a
Colombian trafficker at a price Pfg equal to its unit cost of production.
The second stage is the trafficking market, indexed with the subscript c, and depicted in the
middle and to the left in Figure 1. At this stage, the trafficker transports the drugs, bought at
the farm gate, outside the source country and towards transit countries, where he sells the drugs
that survive interdiction efforts. For instance, we think of traffickers as transportistas in charge
of moving cocaine out of the country and earning a price differential in return.
Formally, we assume the trafficker combines routes, r, with domestic drugs bought at the
farm gate market, Qfg, to “produce” Colombian cocaine in transit countries, Qc, available for
downstream distribution. As with land, we assume routes are not purchased in regular markets,
but their effective control must be secured from the government interdiction efforts. In particular,
8Illegal armed groups such as the Fuerzas Armadas Revolucionarias de Colombia - FARC - and paramilitary
groups have been actively involved during the last 20 years in the initial stages of coca cultivation and cocaine
production in Colombia (See Rangel, 2000; Rabasa and Chalk, 2001; Villalon, 2004). In the case of Afghanistan,
the Taliban has been the group that controls the cultivation of opium poppy.9The constant returns to scale technology implies that, at the aggregate level, it does not make any difference
whether there is just one or many drug producers.
8

we assume that only a fraction, h ∈ [0, 1], of the possible routes used by the trafficker, R, is not
disrupted (or blocked) by government interdiction efforts. In the next sub-section we endogenize
this fraction as the outcome of interdiction policies and efforts by the trafficker to avoid them.
The drug trafficking technology is given by a constant returns to scale functionQc = Fc(Qfg, hR),
with σc the (local) elasticity of substitution among inputs in the trafficking technology; sr the share
of routes; and sfg = 1 − sr the share of farm gate cocaine.10 Price-taking behavior implies the
producer problem is given by the following cost minimization problem:
minQfg ,r
PfgQfg + Prr s.t. Fc(Qfg, r) = Qc, (2)
where the condition r = hR pins down the shadow price of routes, Pr. The drug trafficker sells
the total amount of Colombian cocaine (that survives the government’s interdiction efforts) in
the transit country, Qc, at a price Pc equal to its unit cost of production, and depending on the
equilibrium values of q and h— which determine the price of land and routes.
At this point we obtain the Colombian supply of cocaine in transit markets, P sc (Qc). Despite
our constant returns to scale technologies, this supply is not flat, because land and routes are
available in fixed quantities and at varying (shadow) prices. The structure of our model implies
that supply-reduction policies in Colombia affect downstream markets only by shifting the curve
P sc (Qc).
Though the Colombian supply curve is an interesting object, it is not useful when evaluating
anti-drug policies. Instead, we are interested on how changes in eradication and interdiction
efforts affect downstream markets, and consumers in the U.S. and other countries. To study this,
we incorporate downstream markets (e.g., the wholesale trafficking from transit countries to the
distribution of drugs at retail levels in consumer countries) by introducing a vertically integrated
organization that demands cocaine from Colombia and other source countries (Peru and Bolivia),
smuggles the drugs from transit into the consumer countries and distributes them to consumers in
retail markets. For the sake of simplicity, we refer to this organization as “downstream markets.”
Its real vertical structure or identity does not matter for our purposes, so long as Plan Colombia,
or the source country intervention more generally, does not target the workings of these markets or
the organizations involved in the trade once cocaine leaves the Colombian borders. Downstream
markets are depicted in Figure 1, in the two far right panels.
Formally, we model downstream markets using a nested production function which first allows
them to substitute Colombian cocaine, Qc, for cocaine from other sources, Qo, depending on their
10In the late 80s and early 90s, Colombian traffickers controlled the whole trafficking chain in transit countries.
With the demise of the Medellin and Cali cartels, and the rise of Mexican drug trafficking organizations, the
ownership structure changed and Colombian traffickers started to play a more limited role. For the purposes of
our model, it does not matter if there are several traffickers or if they are vertically integrated with agents in
downstream markets, so long as they are all price takers and there are constant returns to scale.
9
prices, Pc and Po, respectively. In particular, downstream markets aggregate cocaine from all
sources into units in transit, Qt, using a constant returns to scale technology Qt = Ft(Qc, Qo),
with σt the (local) elasticity of substitution, sc the share of Colombian cocaine and so = 1− sc the
share of drugs from other source countries. The elasticity σt captures the extent to which price
increases in Colombia lead to a displacement of production towards Peru and Bolivia— the main
regional competitors. We also assume that other sources supply cocaine with a price-elasticity
εso ≥ 0.
The aggregate Qt is then combined with complementary factors, b, so as to “produce and dis-
tribute” drugs at the retail level in consumer countries, Qf . Formally, this distribution technology
is given by a constant returns to scale function Qf = Ff (Qt, b). The complementary factors, b,
can be thought of as the distribution networks, means of transportation, and the wage bill of drug
dealers in U.S. retail markets, all of which are necessary inputs in the distribution technology.
We assume that these complementary factors are supplied at a constant price, Pb. We denote the
(local) elasticity of substitution between Qt and b by σf ; the share of Qt by st; and the share of
the complementary factors by sb = 1− st. Interdiction and enforcement in transit and consumer
countries are already embodied in this technology, but are assumed constant and independent of
interventions carried out in Colombia.
The competitive structure of our model implies that downstream markets price drugs at the
retail level by solving the problem
Pf = minQ′
t,b′
PtQ′
t + b′ s.t. Ff (Q′
t, b′) = 1, (3)
where Q′
t and b′ are the inputs per unit of the final product. Here, Pt is the shadow price of Qt,
given by
Pt = minQ′
c,Q′
o
PcQ′
c + PoQ′
o s.t: Ft(Q′
c, Q′
o) = 1, (4)
where Q′
c and Q′
o are the respective quantities of drugs from Colombia and other source countries
per unit of drugs in transit.
Equations 3 and 4 fully determine how changes in Pc induced by supply-reduction policies in
Colombia affect downstream prices and quantities. In order to close the model, we assume that
drugs at the retail level are sold to final consumers, whose demand for cocaine is denoted by
Qdf (Pf ), with a corresponding price elasticity of εdf ≥ 0.
Though simple, this formulation of downstream markets captures their two most relevant
features from the point-of-view of analyzing the effects of source country interventions: First,
the possibility of obtaining cocaine from other source countries, embodied in the technology for
Qt; and second, the possibility of using other complementary factors to increase the amount of
cocaine distributed in retail markets (for instance, by improving transportation and distribution
networks), embodied in the technology for Qf , and the complementary factors b. Moreover, this
10

formulation takes into account that the share of Colombian cocaine in the drug trade is just a
small fraction of the overall trade and that the price of Colombian cocaine represents a small share
of the retail price.
3.2 Supply-reduction policies in source Countries
We model the war on drugs in Colombia as consisting of two main fronts: The eradication front
and the interdiction front. Efforts in both fronts are conducted by the source country. We model
the agency problem in the simplest way, by assuming that the source country has a motive of
its own to fight producers and traffickers for the control of key inputs. However the U.S. may
strengthen its resolve by subsidizing a fraction 1 − ω and 1 − Ω of eradication and interdiction
efforts, respectively. The multiplicative structure for subsidies is consistent with the existence
of complementarities between the expenditures of the two governments (the Colombian and U.S.
governments). This, in our view, is an appropriate description of reality, as most of the subsidies
granted by the U.S. government for the war on drugs under Plan Colombia have taken the form
of in-kind support, such as training, aircraft, herbicides for aerial spraying, military intelligence,
the use of satellites for detecting illegal drug shipments, etc.11
Formally, we assume that the Colombian government wants to minimize the social cost imposed
by drug producers and traffickers upon civil society. A flexible and tractable way of introducing
these costs is by assuming that the government faces a net cost per unit of income net of payments
obtained by the drug producer, c1 > 0, and a net cost per unit of income net of payments obtained
by the local trafficker, c2 > 0. This modeling assumption is motivated by the fact that in many
source and transit countries— including Colombia, Mexico and Afghanistan— illegal armed groups
engaged in the production and trafficking of illicit drugs use part of the proceeds from these
activities to finance violent activities against the government, other competing drug trafficking
organizations (DTOs) and civilians; to bribe corrupt politicians; and to weaken local institutions
and the rule of law. In other words, this assumption implies that the objective of the Colombian
government is not necessarily to minimize its supply of cocaine, but rather to target the sources
of revenue of illegal armed groups involved in drug production and trafficking activities.12
On the eradication front, interventions are aimed at disrupting the production of cocaine.
More precisely, we assume the Colombian government fights with drug producers over the effective
11Alternatively, one could abstract from this and simply assume that the U.S. directly invests in eradication
and interdiction efforts, which is equivalent to assuming it provides additive subsidies. The insights and formulas
developed here are quite similar, so this does not change any of the quantitative implications. However, we believe
this omits important and relevant constraints related to the implementation of these programs that are discussed
in the next section.12This implicitly assumes that producer countries do not have a pressing consumption problem, which seems
appropriate for Colombia. For instance, XX?
11

control of the land necessary to cultivate illegal crops. This fight often takes the form of aerial or
manual eradication campaigns, where the Colombian government tries to destroy coca crops and
disrupt the production of cocaine. In other cases, this front takes the form of direct confrontations
between government forces and the illegal armed groups involved in coca cultivation and cocaine
production. Formally, these efforts are aimed at reducing q, the fraction of land under the effective
control of the drug producer in our model. Drug producers try to offset eradication efforts through
various means, for instance, by planting land mines and other explosive devices aimed at preventing
manual eradication teams from entering coca fields, or shooting airplanes used in aerial spraying
campaigns. In other cases, they engage into direct confrontations against government forces in
order to increase their territorial control in areas with coca crops.
Formally, q is endogenously determined by a standard context success function (CSF) of the
following form:13
q(x, z) =φx
φx+ z, (5)
where, z denotes the resources allocated by the government to eradication efforts (aircraft for
aerial spraying, herbicides, military personnel, etc.); x denotes the resources the drug producer
invests in trying to avoid government eradication efforts (insurgents, land mines, etc.); and φ > 0
captures the relative effectiveness of the resources invested by the drug producer in the conflict
over the control of arable land.
The optimal choice of the drug producer, x, can be easily characterized as:
maxx
Plq(x, z)L− x → PlLφz
(φx+ z)2= 1. (6)
Likewise, the government’s problem at this stage is
minzCP = c1(PfgQfg − a) + ωz = c1Plq(x, z)L+ ωz → c1PlL
φx
(φx+ z)2= ω. (7)
The term ωz captures the budgetary cost of eradication efforts, since a fraction 1 − ω of these
expenditures is paid for by the U.S. government.
The equilibrium level of q∗ is determined by the Nash equilibrium (z∗, x∗) derived from the
simultaneous solution of problems 6 and 7. This equilibrium is described by the following equa-
tions:
x∗ = (1− q∗)slPfgQfg, z∗ =c1
ω(1− q∗)slPfgQfg, q∗ =
φω
c1 + φω. (8)
On the interdiction front, interventions are aimed at disrupting drug trafficking. We assume
that the government of the producer country implements interdiction efforts by fighting the traf-
ficker over the effective control of the routes necessary for transporting drugs from the producer
13A contest success function (CSF) is a technology wherein some or all of the contenders for resources incur costs
as they attempt to weaken or disable competitors (See Hirshleifer, 1991; Skaperdas, 1996; Hirshleifer, 2001).
12

to transit countries. These efforts often take the form of crackdowns, surveillance flights, the use
of fast boats and the installation of radars, all aimed at detecting and disrupting drug trafficking
routes. Formally, these efforts are aimed at reducing h, the fraction of routes under the effective
control of the trafficker in our model. Drug traffickers, for their part, try to offset interdiction ef-
forts by adopting better and more efficient trafficking technologies so as to avoid the detection and
disruption of drug shipments. There exists ample anecdotal evidence of drug traffickers reacting
to anti-drug policies by adopting new technologies (semi-submersible vessels, small aircraft, etc.)
in order to prevent radars from detecting illegal drug shipments.
Formally, h is endogenously determined by a standard context success function (CSF) of the
following form:
h(t, s) =γt
γt+ s, (9)
where s denotes the resources allocated by the government to interdiction efforts (airplanes, radars,
fast boats, etc.); t denotes the resources that the local trafficker invests in trying to avoid inter-
diction efforts (semi-submersible vessels, drug tunnels, fast boats, airplanes, pilots, drug mules,
bribes to corrupt government officials and border patrol officials in order to avoid being captured,
etc.); and γ > 0 captures the relative effectiveness of the resources invested by the drug trafficker
in the conflict over routes.
The optimal choice of the producer, t, can be easily characterized as:
maxt
Prh(t, s)R− t → PrRγs
(γs+ t)2= 1. (10)
Likewise, the government’s problem at this stage is
minsCT = c2(PcQc − PfgQfg) + Ωs = c2Prh(t, s)R + Ωs → PrR
γt
(γt+ s)2= Ω. (11)
The term Ωs captures the budgetary cost of interdiction efforts, since a fraction 1 − Ω of these
expenditures is paid for by the U.S. government.
The equilibrium level of h∗ is determined by the Nash equilibrium (s∗, t∗) derived from the
simultaneous solution of problems in equations 10 and 11. This equilibrium is described by the
following equations:
t∗ = (1− h∗)srPcQc, s∗ =c2
Ω(1− h∗)srPcQc, h∗ =
γΩ
c2 + γΩ. (12)
Note that the equilibrium levels of expenditures in counteracting government eradication and
interdiction efforts in equations 8 and 12 are proportional to the total market value of land and
routes, respectively. This is a feature of the contest nature of enforcement in these markets, and
holds in general if the contest success functions are homogeneous of degree 0. These formulas
capture the important insight that the cost of reducing q or h depends on the value of land and
13

routes, respectively, as these determine the willingness of producers and traffickers to counteract
such efforts. Finally, note that q∗ is lower when ω decreases, and U.S. subsidies constitute a
higher share of eradication efforts. Likewise, h∗ is lower when Ω decreases, and the U.S. subsidizes
represent a larger share of interdiction efforts.14
4 Equilibrium and comparative statics
We now define an equilibrium in terms of the subsidies, which are the exogenous variables on
which we focus in order to understand the consequences of the war on drugs. Given any pair
of subsidies, (ω,Ω), the drug market equilibrium can be characterized by a vector of prices
(P ∗
f , P∗
t , P∗
c , P∗
o , P∗
fg, P∗
r , P∗
l ); quantities (Q∗
f , Q∗
t , b∗, Q∗
c , Q∗
o, Q∗
fg, r∗, l∗); conflict-related expenditures
(t∗, s∗, x∗, z∗) and equilibrium outcomes (h∗, q∗), such that markets clear, prices are equal to
marginal costs, and the expenditures (t∗, s∗, x∗, z∗) correspond to the Nash equilibrium strate-
gies given in equations 8 and 12.
The existence and uniqueness of our equilibrium follows by noting that Ω and ω uniquely
determine q and h (a well known result from the conflict literature; see (Skaperdas, 1996)), and
the market equilibrium is unique given that, for fixed values of q and h, technologies and preferences
are jointly concave and standard.
Before moving to the propositions we introduce some notation. We denote by εdl the elasticity of
demand for land; εdr the elasticity of demand for routes; εdfg the elasticity of demand for farm-gate
cocaine; εdc as the elasticity of demand for Colombian cocaine in downstream markets; and εdt as
the elasticity of demand for the cocaine aggregate in transit markets. Using Hicks and Marshall’s
formula (provided in the Appendix), these endogenous elasticities can be computed recursively
based on the consumers’ demand elasticity, εdf , and the (local) elasticities of substitution and
current factor shares. Essentially, these formulas reveal that the elasticity of demand perceived
in a given market is a weighted average of the possibilities to substitute for other factors in
downstream markets and the consumer demand’s elasticity.
The following proposition describes how the cocaine market adjusts to reductions in q and h
14One implicit assumption is that the Colombian government simultaneously plays against producers and traf-
fickers, and does not play a-la Stackelberg, nor anticipates changes in prices. We make this simplifying assumption
for several reasons. First, it imposes symmetry between both sides in the conflict. Second, it makes the model
more tractable and easy to solve. Third, we are interested in the role of Colombia or the respective source country
inasmuch as it helps us explain how U.S. subsidies translate into actual supply reduction efforts. Finally, even if
we allow Colombia to anticipate effects on prices, this would just complicate the formulas for q∗ and h∗, as they
would now depend on the elasticities of demand and cross price elasticities, without providing any new insights.
Moreover, this problem would be well defined only if σt is large enough, so that Colombia has the incentive to
increase Pc and displace production, reducing quantities enough so that revenue falls.
14

caused by eradication and interdiction policies in Colombia. All the proofs are omitted from the
main text and presented in the Appendix.
Proposition 1 (Margins of adjustment inside the source country) Suppose supply-reduction
policies reduce q by d ln q. Then:
1. The (shadow) price of land increases by d lnPl = 1εdl
d ln q > 0. Holding all other factors
constant, this would lead to an increase on Colombian prices of slsfgd lnPl > 0. Thus, the
share of the factor, slsfg, determines the initial extent of the price adjustment required.
2. Once producers and traffickers are allowed to react, the Colombian market adjusts by in-
vesting more in complementary factors, a, per unit of land remaining, thus increasing land
productivity by
(1− sl)σfgd lnPl > 0. (13)
Moreover, σfg makes the demand for land more elastic, reducing d lnPl.
3. If εdc > σc, the trafficker reduces its demand for routes, as these are highly complementary
with the scarce farm-gate cocaine. This reduces the price of routes by
d lnPr =sfg(σc − εdc)
sfgσc + (1− sfg)εdcd lnPfg < 0,
further contributing to a lower effect on Colombian cocaine prices.
4. The resulting net effect on Colombian cocaine prices is smaller than initially expected, and
is given by
d lnPc =sfgσc
sfgσc + (1− sfg)εdc
sl
εdld ln q > 0.
Likewise, suppose supply-reduction policies reduce h by d lnh. Then:
1. The (shadow) price of routes increases by d lnPr = 1εdrd lnh > 0. Holding all other factors
constant, this would lead to an increase in Colombian prices of srd lnPr > 0. Thus, the
share of the factor, sr, determines the initial extent of the price adjustment required.
2. If εdc > σc, the Colombian market adjusts by investing less in farm-gate cocaine. In particular,
the price of farm-gate cocaine falls by
d lnPfg =sr(σc − εdc)
sr(σc + εsfg) + (1− sr)(εsfg + εdc)d lnPr < 0.
Here, εsfg =saslσfg is the elasticity of farm-gate supply.
3. If σfg is large, d lnPfg falls mildly, but complementary factors, a, are considerably reduced,
leading to a decrease in land productivity.
15

4. This adjustment margin implies that a reduction in routes by d lnh has a smaller effect on
Colombian cocaine prices:
d lnPc =sr(σc + εsfg)
sr(σc + εsfg) + (1− sr)(εsfg + εdc)
1
εdrd lnh.
The main implication of the proposition is that, when σfg is large and σc smaller, the Colombian
market responds to changes in q and h by adjusting its use of complementary factors, a. This
adjustment always keeps Colombian prices from increasing by keeping the (shadow) price of land
from increasing sharply.
Thus, policies like eradication, aimed at increasing the price (or the user cost) of land, will
not be reflected in higher cocaine prices even if they successfully reduce the fraction of land with
coca crops. Such policies fail to increase significantly the price of land and, in the case εdc > σc,
reduce the price of routes, thus making them highly inefficient at curbing the Colombian supply
of cocaine. On the other hand, policies like interdiction, may be more successful at raising the
price of routes, which cannot be easily substituted for other factors; while they only have a minor
negative effect on the price of land.
The reason why the condition εdc > σc is required in the proposition is because traffickers face
a scale and a substitution effect. The scale effect dominates in this case, and requires traffickers to
cut down their demand for routes when farm-gate cocaine becomes scarce, or to cut their demand
for farm-gate cocaine when routes are scarce. Thus, in this case, policies are complementary:
Interdiction reduces the price of land (but only mildly if σfg is large); while eradication reduces
the price of routes considerably. Incidentally, this makes policies less effective at raising cocaine
prices, which in equilibrium reflects the price of land and routes— the inelastic factors. The
substitution effect, on the other hand, creates a force in the opposite direction. We focus in the
case in which the scale effect dominates, as it is the relevant one in our empirical exercise.
Finally, the proposition shows that policies aimed at more important factors, measured in
terms of their share in total production, have larger effects on prices— even after taking into
account the subsequent adjustments. The reason is that increases in the price of an unimportant
factor can be easily accommodated by a small increase in consumer prices. This suggests that,
if slsfg < sc— as is the case empirically, eradication is less effective at raising cocaine prices. Of
course, as argued above, this has to be weighted against the fact that it may be cheaper to reduce
q than h, given that routes are more valuable in this case.
As explained in the description of the model, the obtained effects on d lnPc are sufficient to
characterize the downstream effects of source country interventions. This is done in the following
proposition.
16

Proposition 2 (Downstream market effects of source-country interventions) Suppose σt >
εdt and εso is large enough. Reductions in q and h increase Colombian cocaine prices by d lnPc > 0.
This has the following effects in downstream markets:
1. Holding other factors constant, consumer prices would increase by scstd lnPc. Thus, the
share of Colombian cocaine in the cocaine trade determines the initial extent of the price
adjustment required.
2. Downstream markets react by demanding more cocaine from other source countries. In par-
ticular, quantities supplied by other sources increase by
d lnQo =sc(σt − εdt )ε
so
sc(σt + εso) + (1− sc)(εso + εdt )d lnPc > 0.
3. Downstream markets also react by increasing their investment in distribution and trafficking
efforts, b, per unit of cocaine transacted. This adjustment margin implies that downstream
markets may be able to keep final prices from falling by investing in their distribution net-
works.
4. Both adjustment margins reduce the effect of source country interventions on d lnPc, by
making the demand for Colombian cocaine more elastic.
5. The resulting effect on quantities consumed is given by:
Λq =d lnQf
d ln q=
d lnPc
d ln q
d lnPf
d lnPc
d lnQf
d lnPf
=
(
slsfgσc
slσcεdc + (1− sl)σfg(sfgσc + (1− sfg)εdc)
)(
stsc(σt + εso)
sc(σt + εso) + (1− sc)(εso + εdt )
)
εdf > 0,
and
Λh =d lnQf
d lnh=
d lnPc
d lnh
d lnPf
d lnPc
d lnQf
d lnPf
=
(
sr(σc + saσfg/sl)
sr(σc + saσfg/sl)εdc + (1− sr)(saσfg/sl + εdc)σc
)(
stsc(σt + εso)
sc(σt + εso) + (1− sc)(εso + εdt )
)
εdf > 0.
The above proposition captures two forces making the effect of source-country interventions in
retail prices negligible.
First, the fact that the source country represents only a share of the whole trade implies that
retail prices only have to increase mildly to cover the increase in the price of Colombian cocaine.
Again, this has to be weighted against the fact that source country interventions may be cheaper
precisely because they target less valuable stages of the production chain.
Second, the possibility to substitute for other factors in downstream markets makes the demand
for Colombian cocaine more elastic, and reduces the effect of source- country interventions on
prices. In particular, the possibility to substitute for cocaine from other source countries (i.e.,
17

when σt is greater), or later for other complementary factors (i.e., when σf is greater), implies
downstream markets will react to a price increase in Colombian cocaine by moving away from that
source and towards using more cocaine from other source countries, Qo, or using more intensively
distribution and trafficking networks— by increasing b per unit of cocaine transacted— in order
to satisfy demand. Thus, markets are likely to adjust through changes in the quantities of these
inputs without requiring an increase in consumer prices.
In the particular case of substitution for cocaine from other source countries, the above mecha-
nism requires other sources’ supply to be sufficiently elastic, so that the adjustment occurs through
a considerable displacement of production and not simply through a sharp increase in prices in all
source countries.
A by-product of the possibility of substitution for cocaine from other source countries are the
so-called displacement effects. These arise when pressure against illegal-drug production pushes
the problem to other countries or regions without reducing the aggregate trade. Our framework
suggests that these displacement effects are in fact a key determinant of the cost effectiveness
of source country interventions. Displacement effects may also have implications that go beyond
our model. For instance, source country interventions in one source country increase the value
of land and routes in others, creating social costs associated with an increase in trafficking and
drug production elsewhere. This negative feedback between policies in different source countries
implies that the level of enforcement may be inefficiently high from a regional perspective.
A final noteworthy feature of Proposition 2, is that it provides a formula for the elasticities Λq
and Λh in terms of parameters that can be obtained from the data or estimated by researchers.
These elasticities summarize the way in which our market structure adjusts to policies in source
countries.
5 Determinants of the cost-effectiveness of supply reduc-
tion policies
In the previous section, we characterized the effects on prices and quantities of source-country
interventions. In this section, we compute the marginal cost of reducing retail quantities via such
policies, and characterize their determinants.
Let TCUS = (1−ω)z+(1−Ω)s be the total cost to the U.S. of partially funding the producer
country in the war against illegal drug production and trafficking. Recall from equations 12 and
8, that the two subsidies are defined implicitly as functions of q and h, respectively.15 Thus, the
15We focus on the cost of these interventions from the U.S.’s point-of- view, but our analysis can easily be
extended to include the component of the cost covered by Colombia.
18

marginal cost of reducing q by increasing subsidy 1− ω is given by
Cq = −∂TCUS
∂q= c1PlL+ 2(1− ω)φ(1− q)PlL+ (1− ω)φ(1− q)2PlL
1
qεdl
+(1− Ω)γ(1− h)2PrR1
q
d lnPr
d ln q.
(14)
Likewise, the marginal cost of reducing h by increasing subsidy 1− Ω is given by
Ch = −∂TCUS
∂h= c2PrR + 2(1− Ω)γ(1− h)PrR + (1− Ω)γ(1− h)2PrR
1hεdr
+(1− ω)φ(1− q)2PlL1
h
d lnPl
d lnh.
(15)
These costs capture two interesting features: first, they are proportional to the market value
of the total amount of the input being targeted (PlL and PrR), as anticipated in the introduction.
Second, these costs already incorporate all potential distortions arising from the agency problem
between the U.S. and the source country implementing the two policies; these correspond to the
terms c1 and c2 appearing in the formulas.16
These expressions yield simple formulas for the marginal costs, presented in the following
proposition.
Proposition 3 (The marginal costs of reducing cocaine consumption) The marginal cost
of reducing the amount of cocaine transacted in retail markets by 1 unit by increasing subsidies for
eradication is given by
MCω = qCq
QfΛq= Pf
slsfgscst
Λq
(
c1 + 2(1− ω)φ(1− q) + (1− ω)φ(1− q)2
q
1
εdl
)
+Pf
srscst
Λq
(1− Ω)γ(1− h)2
h
d lnPr
d ln q.
(16)
The marginal cost of reducing the amount of cocaine transacted in retail markets by 1kg by in-
creasing subsidies for interdiction is given by
MCΩ = hCh
QfΛh= Pf
srscst
Λh
(
c2 + 2(1− Ω)γ(1− h) + (1− Ω)γ(1− h)2
h
1
εdr
)
+Pf
slsfgscst
Λh
(1− ω)φ(1− q)2
q
d lnPl
d lnh.
(17)
The proposition provides a sharp characterization of the marginal costs in terms of parameters
that can be estimated by researchers, or for which we can make reasonable guesses.
The formulas deserve some comment. The first term in equations 16 and 17 captures the fact
that the U.S. is now paying for a greater fraction of expenditures in each front. The second term
16These costs are calculated on the assumption that the other subsidy remains constant. Thus expenditure in
the other front must necessarily change depending on the value of the input being targeted. This does not affect
any of our conclusions, but simplifies the algebra and presentation.
19

reflects the extra expenditure incurred in outbidding the producer or the trafficker in order to
reduce q or h enough so as to induce a marginal reduction in the quantity of drugs transacted in
retail markets. The third term is always positive and captures the fact that targeting an input in-
creases its price, and makes armed groups contesting it more motivated to avoid enforcement, thus
increasing the cost of the policy. The last term captures the feedback effects between eradication
and interdiction efforts that arise in general equilibrium, inasmuch as any policy will affect the
price of both land and routes. As explained in Proposition 1, when σc < εdc , eradication reduces
the marginal cost of interdiction and vice versa.
The following propositions characterize the main determinants of these marginal cost. For the
sake of exposition, we assume that when doing our comparative statics all other variables remain
fixed. All the proofs follow through differentiation of the above formulas and we omit them to
save space.
Proposition 4 (The role of substitution and scale effects in Colombia) Suppose σc < εdc .
The marginal costs MCω and MCΩ, have the following properties:
• The elasticity of substitution between land and complementary factors, σfg, always increases
MCω. However its effect on MCΩ is ambiguous, but becomes positive when expenditures in
eradication are large relative to expenditures in interdiction.
• The elasticity of substitution between routes and farm gate cocaine, σc, always increases
MCΩ and reduces MCω.
These results are in line with our discussion of Proposition 1. As argued there, a combination
of a large value of σfg and a low value for σc implies that eradication fails to increase sufficiently
the price of land and actually reduces the price of routes. Both effects make MCω large.
On the other hand, a lower σc favors interdiction, as it targets a factor that cannot be easily
substituted. The ambiguous effect of σfg arises because this elasticity keeps land prices from falling
in response to the scale effect created by interdiction. This makes interdiction more effective at
raising prices and curbing supply. However, this has to be weighted against the fact that, in this
case, interdiction generates fewer savings in the cost of eradication.
The following proposition characterizes how different margins of adjustment in downstream
markets affect the marginal costs of reducing cocaine in retail markets.
Proposition 5 (Displacement effects and substitution in downstream markets) Suppose
σt and εso are large enough. Then
• MCω and MCΩ increase with σt and εso. In particular, εso increases both marginal costs when
σt > εdt , and σt increases both marginal costs when εso > v.
20

• MCω and MCΩ increase with σf .
Again, the results in this proposition are in line with the intuitions developed in Proposition
2. When σt > εdt , source-country interventions have a large substitution effect, redirecting the
demand fpr cocaine towards other source countries. This results in lower consumer prices so long
as prices in other sources do not increase considerably (this is why we require εso > v). In this
case, downstream markets adjust by increasing the quantity of cocaine produced in other source
countries without increasing consumer prices significantly. This adjustment makes source-country
interventions in Colombia less effective at reducing cocaine in consumer markets.
Likewise, a larger σf allows downstream markets to compensate for a fall in cocaine production
by improving their trafficking and distribution capabilities, whose prices are fixed, thus rendering
supply reduction programs in source countries less effective.
Importantly, in the previous propositions we have emphasized forces that affect the market
adjustment, but that do not change the cost of supply-reduction policies. In the next proposition
we describe the role of shares, which, as argued above, affect both costs and benefits.
Proposition 6 (The role of factor shares) An increase in the share of land in the cocaine
trade has two opposing effects. On the one hand, an increase in the price of land, Pl, induced by
eradication, has a larger effect on consumer prices. However, the cost of eradication is larger, as
producers are more willing to avoid eradication and hold on to the valuable land. An analogous
discussion applies for interdiction efforts.
Overall, both effects cancel out when computing the marginal costs. In our model, shares
only affect marginal costs by determining substitution patterns, or the adjustment margins, in
downstream markets (that is, by shaping the demand and supply elasticities derived from Hicks
and Marshall’s formulas).
The key new insight in this proposition is that shares have ambiguous effects. We want to
emphasize these findings, because previous analysis claimed it was more cost effective to target
inputs with a large share in the drug trade. In fact, Propositions 1 and 2 shows that this intuition is
partially right, in the sense that targeting such inputs increases retail prices more. But proposition
6 clarifies that this cancels out exactly with the fact that such policies are also more costly.
Targeting relatively unimportant crops may have only a small effect on retail prices, but by the
same token, producers will not fight back as hard. On the other hand, targeting distribution
networks may have a large effect on retail prices, but drug traffickers value them more, so this is
also more costly. Instead, what matters for cost-effectiveness in our model is how markets adjust
to changes in the price of land and routes; not their shares.
Proposition 7 (The role of consumers’ demand) MCω and MCΩ have the following prop-
erties.
21

• Both increase when the demand for cocaine at the retail level is more inelastic; that is,
εdf → 0.
• Both increase when the overall demand for cocaine increases (leaving its elasticity fixed).
• Both are of the same order of magnitude as retail prices.
Amore inelastic consumers’ demand causes price increases to have a smaller effect on quantities,
as has already been pointed out by Becker et al. (2006) and others. In our model, a more inelastic
demand feeds back into upstream markets, making the demand for all inputs more inelastic. This
implies that eradication and interdiction have greater effects on land and routes’ prices, but these
effects are dominated by the fact that these price increases lead to a smaller reduction in consumed
quantities.
Interestingly, in our model, the consumers’ demand elasticity also affects the cost side of supply-
reduction interventions. More precisely, a more inelastic demand implies that Pl and Pr increase
sharply with eradication and interdiction, respectively, thus raising the cost of reducing q or h,
since producers and traffickers value these inputs more. This particular channel arises only when
we model enforcement as a conflict.
Finally, our model implies that both marginal costs are proportional to the retail price. This
is because prices determine the willingness of producers and traffickers to avoid eradication and
interdiction. This has important implications. For instance, policies in consumer countries that
reduce retail demand (e.g., prevention, treatment or rehabilitation) or make it more elastic, have
the extra benefit of lowering the marginal cost of implementing source country interventions(See
Mejıa and Restrepo, 2011, for a similar insight). By the same token, demographic, taste or legal
changes in consumer countries that increase consumption raise the marginal cost of curbing supply
in source countries.
Finally, the dependence of costs on prices has another interesting implication; namely, that the
war on drugs becomes more and more expensive as source countries make important advances.17
The reason is that supply reductions increase consumer prices, and by doing so, raise the value
of land and routes. Thus, producers and traffickers are more willing to avoid eradication and
interdiction effort. As explained above, this effect becomes stronger when the consumers’ demand
is more inelastic so that prices rise sharply. This result suggests the war on drugs cannot be won
abroad: As subsidies increase, and q and h become smaller, the marginal cost of reducing the
amount of drugs transacted in retail markets by one extra unit becomes arbitrarily large.
17The concavity of the contest success function and the fact that the U.S. pays a larger share of the costs create
similar effects in the same direction. We find the effect of prices more interesting and novel, and this is the reason
we emphasize this channel here.
22

The previous propositions characterize the behavior of the marginal costs MCω and MCΩ
without taking a stand on how the U.S. allocates these subsidies. If the U.S. objective was simply
to reduce supply, and Colombia had no say in the allocation of subsidies, it would do it in such a
way as to guarantee that MCω = MCΩ. The following proposition characterizes which levels of
observed expenditure are consistent with such allocation rule.
Proposition 8 (Efficient allocation of subsidies) Let TCωUS and TCΩ
US be the observed expen-
ditures by the U.S. on subsidizing eradication and interdiction efforts respectively. The allocation
is efficient— from the viewpoint of supply reduction— if and only ifTCω
US
TCΩUS
= m. The threshold m
can be computed from the data as
m =Λq
Λh
Ω(1−Ω)(1−h)
+ 2 h1−h
+ 1εdr
+ Λh
Λq
d lnPr
d ln q
ω(1−ω)(1−q)
+ 2 q
1−q+ 1
εdl
+ Λq
Λh
d lnPl
d lnh
. (18)
IfTCω
US
TCΩUS
> m, too much resources are being assigned to eradication; while the opposite happens if
the inequality is reversed.
The above proposition is useful because it gives us an easy heuristic rule to determine how
inefficient is the U.S. allocation of subsidies from a supply-reduction perspective. We provide a
proof of the derivation of m in the Appendix.
The proposition suggests that, for a given set of U.S. expenditures, the U.S. is likely to be
over-investing in eradication whenever Λq
Λhis small. Thus, lower shares sfg and sl make it more
likely that the marginal cost of eradication is higher. This does not contradict our discussion in
Proposition 4 because here we are holding expenditures constant. This proposition is simply saying
that expenditures should, in principle, be proportional to factor shares in an efficient allocation.
Likewise, all factors that reduce Λq
Λhdiscussed in Proposition 1 reduce m. Namely, a larger
elasticity of substitution in production, σfg, and a lower elasticity of substitution in trafficking,
σc. Efficiency requires total expenditures to reflect the different effectiveness of policies, captured
by a lower m.
The empirical observation that the share of land is small, and the adjustment patterns—
captured by a large σfg and small σc— favor interdiction, requires expenditures in eradication to
be lower relative to expenditures in interdiction. However, during Plan Colombia, expenditures in
eradication were significantly larger than expenditures in interdiction, a pattern that is indicative
of too many resources being allocated to eradication.
Finally, the above proposition also clarifies the role of the agency problem. If the U.S. is
interested in reducing supply, it should anticipate that subsidies will lead to expenditures in both
fronts depending on c1 and c2, as shown in equations 8 and 12. Suppose c1 > c2, so that the
Colombian government has a political interest in reducing land cultivated with coca. To achieve
23

efficiency, the U.S. must undo this distortion by assigning less subsidies to eradication, as to
maintain its relative expenditures on both fronts equal to m. In practice, the local government
may not like this assignment and prefer higher subsidies for this front, creating an interesting
divergence of interests when coordinating and financing source-country interventions.
6 Using the model to understand the cocaine market re-
sponse to Plan Colombia
In this section we present the main empirical patterns observed during the implementation of
Plan Colombia, and use our model to make sense of them. We focus on data from 2000 to 2008,
when Plan Colombia received the highest levels of funding, though we also mention some recent
developments in the cocaine market.
We think of Plan Colombia as an increase in both 1−ω and 1−Ω. We confirm this view using
data from the U.S. General Accountability Office GAO (2008). According to this report, the U.S.
disbursed roughly $593 million per year to Plan Colombia from 2000 to 2008, out of which $408
million were used to subsidize programs related to eradication, and the remaining $185 million
subsidized programs related to interdiction efforts.18
Though we do not directly observe the fraction of land effectively controlled by producers, nor
the fraction of routes effectively controlled by traffickers, we have two intuitive proxies for both.
We use the fraction of land used for coca cultivation as our proxy for q.19. For the fraction of
routes controlled by traffickers, we use as a proxy the fraction of cocaine not seized by Colombian
authorities.20 This proxy is arguably less straightforward than the one for q, but we still think it
gives us a reasonable idea concerning the dynamics of the control over routes. For instance, one
would expect seizures to be frequent on routes not controlled by traffickers, and infrequent or zero
on routes under their effective control. Likewise, one could interpret seizures as an iceberg cost of
exporting more cocaine through fewer routes.
Figure 2 shows that q increased until 1998, as coca cultivation shifted from Peru to Colombia.
However, following the implementation of Plan Colombia it decreased sharply, from 0.32 to 0.17.
18See the working paper version of this paper Mejıa and Restrepo (2008) for the details of how we constructed
these numbers and more information regarding the U.S. expenditure figures.19Grossman and Mejıa (2008) estimate that the potential arable land contested for coca cultivation (L in the
model) is around 500,000 hectares. We thus construct our proxy for q using the UNODC data for coca cultivation
in Colombia, divided by 500,000 hectares. One alternative is to use total cultivation divided by cultivation plus
the land where crops were eradicated. The pattern is similar, but this measure leaves out the gains in the control
of land that was never cultivated in the first place.20Cocaine seizures and potential cocaine production were both obtained from UNODC yearly reports (See UN-
ODC, 2013).
24

Likewise, the figure reveals a simultaneous decline in h from 0.91 to 0.78. Importantly, this is not
simply driven by a fall in production, but the level of seizures also increased significantly during
this period, specially in 2008. To summarize, it is reasonable to assume that, in terms of supply
reduction, the main achievement of Plan Colombia was the reduction in q and h of 63% and 16%,
respectively, from 2000 to 2008.
The decline in q and h is consistent with a large increase in subsidies for eradication and
interdiction from 0— before Plan Colombia— to 1 − ω = 0.57 and 1 − Ω = 0.65 afterwards (see
equations 8 and 12). We take the values ω = 0.43 and Ω = 0.35 as a natural benchmark for our
quantitative predictions. These imply that Colombia spent roughly $314 million in eradication
efforts and $100 million in interdiction efforts per year during Plan Colombia. Unfortunately, we
do not have good data on Colombian expenditures by component to verify this, but it certainly
matches the view that the government emphasized primarily eradication efforts from 2000 to 2008.
1994 1996 1998 2000 2002 2004 2006 20080.05
0.1
0.15
0.2
0.25
0.3
0.35
0.4
Fraction of land with coca crops (q)
1994 1996 1998 2000 2002 2004 2006 20080.6
0.65
0.7
0.75
0.8
0.85
0.9
0.95
1
Fraction of drugs not seized (h)
Figure 2: Increase in eradication and interdiction efforts during Plan Colombia.
Nevertheless, and despite the large drop in land and routes controlled by producers and traf-
fickers, there was no similar effect on quantities. The left panel in Figure 3 plots data for potential
cocaine production in Colombia (dotted line) and the estimated amount of drugs successfully traf-
ficked from Colombia to transit countries. As it is apparent from the figure, potential cocaine
production fell only by 24%, while the amount of Colombian cocaine transacted in transit coun-
tries, Qc, decreased by about 32%, from 600 metric tons (MT) prior to Plan Colombia, to about
400 MT afterwards.
This is somewhat paradoxical, since a naive model would predict that a fall in land of this
magnitude should have led to a similar contraction in production. In fact, Plan Colombia was sup-
posed to halve cocaine production by reducing cultivation by 50% by 2006.21 Our framework and
21One of the main objectives of Plan Colombia, as stated in the original documents when the Plan was launched
in 1999, was to reduce cocaine production by 50% within a period of 6 years (that is, circa 2006).
25

the adjustment margins described in Proposition 1, suggest that the possibility of substituting for
other inputs – and the fact that land and routes represent only a fraction of the price of Colombian
cocaine – implies that the drop in q and h will only affect quantities with some elasticities smaller
than one, contrary to what a naive model would suggest.
1994 1996 1998 2000 2002 2004 2006 2008100
200
300
400
500
600
700
Qfg (dotted line) and Qc (solid line)
1998
1994 1996 1998 2000 2002 2004 2006 2008550
600
650
700
750
800
850
Estimated quantity in retail markets
Figure 3: Farm gate production, cocaine trafficked from Colombia (left panel) and estimated
cocaine at the retail level (right panel).
As stated in Proposition 1, the main reason why reductions in q — or eradication policies—
have a limited effects on the supply of cocaine, is because markets adjust by increasing land
productivity. This is exactly what the data in Figure 4 shows. Since 2001, the 24% price increase
in farm gate prices from $1,571 to about $2,000 dollars per kg coincided with a significant increase
(of about 40%) in yields per hectare, from about 4.4 kg of cocaine/hectare/year before 2000 to
about 6.6 kg of cocaine/hectare/year during the period 2005 - 2008. Using the formula in equation
13, we see that the increase in productivity reflects the high elasticity of substitution between land
and complementary factors in the production of cocaine. Our model thus explains the puzzling
increase in yields and ties it to the unobserved elasticity of substitution σfg.
Figure 3 plots retail quantities and their three-year moving average. It shows that, leaving
the declining trend aside, there was no large drop in retail quantities despite the intensification of
supply-reduction policies in Colombia, and the reduction in Colombian supply. This is specially
the case for the early years of our sample, when efforts were aimed specially at eradication, but
were not reflected in changes in downstream markets in the U.S.. Though these comparisons
may be clouded by several confounding factors (trends, policies in other countries, changes in
consumption, and so on), we see them as consistent with the intuitions developed in Proposition
2. In particular, the value of Colombian cocaine outside the country represents only about 6-7%
of the total value added of the trade, suggesting that the observed reductions in the Colombian
supply will tend to have small downstream effects unless they significantly increase the price of
26

1994 1996 1998 2000 2002 2004 2006 20081200
1400
1600
1800
2000
2200
2400
Farm gate price (Pfg)
1994 1996 1998 2000 2002 2004 2006 20084
4.5
5
5.5
6
6.5
7
7.5
8
Land productivity
Figure 4: Increase in farm gate prices and land productivity.
Colombian cocaine.22
Since 2008 these patterns have changed significantly, as interdiction efforts increased while
eradication efforts were scaled-down. Consistent with Proposition 1, interdiction had a strong
scale effect on the farm-gate market, reducing prices and land productivity— as observed since
2008. Moreover, there is some evidence that the shift towards interdiction may have had larger
effects on cocaine markets (see for instance Figure 3). Presumably, the emphasis in interdiction
led to a further increase in route prices (which we cannot observe) and small changes in farm-gate
prices, with larger effects in downstream markets. We see these patterns as highly consistent with
the intuitions developed in Proposition 1.
Our model also suggests that displacement effects are another factor rendering retail quantities
and prices less reactive to interventions in Colombia. We find strong empirical support for this
idea. Figure 5 shows that the increase in farm gate prices in Colombia brought about by Plan
Colombia led markets to substitute Colombian cocaine for the relatively cheaper cocaine from
Peru or Bolivia. Following Plan Colombia, the 32% decline in Colombian cocaine transacted in
transit markets was partially compensated by an increase in the supply from Peru and Bolivia.
As a consequence, and despite the intensification of the war on drugs in Colombia, the estimated
amount of cocaine transacted in transit countries fell only by 6%. Remarkably, the opposite
phenomenon occurred between 1994 and 2000, when production shifted from Peru to Colombia,
22More specifically, about 800 metric tons of cocaine reach transit markets and about 650 metric tons are
actually sold in retail markets, with 54% of the cocaine coming from Colombia. Therefore sc = 54%, and so = 46%.
Moreover, according to different accounts, cocaine in transit countries is transacted at around $10,000 per kg, while
the retail price is around $150,000 per kg, which implies that st ≈ 8%. The only case in which the effects in retail
markets will be large is if σf is sufficiently low, so that the demand for Colombian cocaine becomes inelastic, and
the price of Colombian cocaine rises sharply.
27

when Peru intensified its interdiction policies.
1994 1996 1998 2000 2002 2004 2006 2008100
200
300
400
500
600
700
Qc (solid) and Qo (dashed)
Figure 5: Regional production patterns among different source countries.
7 Calibration and model predictions
To get a rough idea of the size of the adjustment margins in our model, we calibrate the key
elasticities of substitution to match as closely as possible the observed changes in aggregate vari-
ables following the implementation of Plan Colombia. In particular, we compute the values for
σfg, σc, σt, σf and εso in order to match the observed changes in land productivity, Qfg, Pfg, Qt
and Qo described in the previous section, following the observed decline in q and h.23 We make
three adjustments. First, we remove trends from production in Peru and Bolivia, which appear to
be under a secular increase (potentially) unrelated to Plan Colombia. By doing so, we obtain the
targets listed in Table 1.24 Second, we impose an elasticity of consumers’ demand of 0.5, which
we use as our benchmark value.25 Finally, we use observed factor shares obtained from UNODC
reports, and described in Mejıa and Rico (2010).
The targets we match have the advantage that they are clearly related to the parameters
capturing how the cocaine market adjusts following changes in interdiction and eradication. For
instance, the change in productivity is informative about the extent of substitution σfg; while σc
23In a previous version of this paper, we included the change in Qc as an additional moment. However, this is
mechanically collinear with the change in h and Qfg, providing no information.24Removing these trends gives us a conservative estimate of the extent of displacement effects, captured by σt
and εst. With larger values, we obtain larger marginal costs for both fronts of the war on drugs.25This is widely believed to be the case for drugs, especially for cocaine. Becker et al. (2006) summarize the
evidence of an elasticity of less than 1 for most drugs, with a central tendency towards 1/2. See also (Bachman
et al., 1990), (DiNardo, 1993) and (Saffer and Chaloupka, 1999).
28

determines the demand elasticity for farm-gate cocaine and how the adjustment splits between
prices and quantities. Likewise, the increase in production in other countries is informative about
σt and εso. Finally, σf determines the elasticity of demand for Qt, and therefore it is related to
the fall in Qt. However, we recognize that other changes different from Plan Colombia may be
driving some of the matched observations, and that the data is not of ideal quality. Moreover,
we do not have non-targeted moments to verify the out-of sample predictive power of our model.
These limitations must be kept in mind when interpreting our findings, and we prefer to think of
this exercise as an informed calibration suggestive of the quantitative implications of our model.
Table 1 summarizes the targeted changes, the imposed parameters and shares, the resulting
estimates and the predicted fit of the model. As demonstrated, the model does a good job matching
the observed changes (not surprising given that we are matching these moments with the same
number of parameters). The parameters are also in line with our knowledge of the drug market and
the stylized facts presented in the previous section. We find that σfg = 1.09, suggesting that farm-
gate cocaine is approximately a Cobb-Douglas in land and complementary factors, and allowing
producers to significantly increase land productivity by investing on complementary factors, a.
Instead, we find σc = 0.51, suggesting that farm-gate cocaine and routes are gross-complements,
as one would intuitively expect. We also obtain σt = 2.38 and εso = 2.62, which reflect extensive
possibilities to substitute Colombian cocaine for cocaine from other sources. Finally, we obtain
σf = 0.86, suggesting some reasonable possibilities of substitution in downstream markets.
Using these parameters, we are able to calculate the predicted changes in unobservable prices
and quantities. The model predicts a sharp increase in the shadow price of land, which is probably
caused by the observed emphasis on eradication campaigns during Plan Colombia. Instead, the
price of routes, which could be more easily increased via interdiction and has a larger impact on
retail prices, only increased modestly during Plan Colombia. Interestingly, our model suggests
this occurs because interdiction efforts were not as strong, for most of the years analyzed, and
because the reduction in land creates a scale effect in the Colombian market leading to a lower
demand for routes.
The predicted effect of Plan Colombia on prices diminishes as we move downstream: While we
observe an increase of about 24% in farm-gate prices, the model predicts an increase of 13% for
Colombian prices in transit, 8% for cocaine in transit and only 0.7% for consumer prices. These
diminishing effects reflect the possibilities to substitute for more elastic factors of production as
we move downstream. More importantly, the predicted reduction in retail quantities attributed
to Plan Colombia is about 0.33%, suggesting a negligible effect in retail markets in consumer
markets.26
26Our model predicts a lower decrease in Qc than the one observed. This has to do with the way in which we
compute h, which certainly understates the scope of interdiction efforts by not taking into account shipments that
were never sent because of the lack of routes or drugs that are lost while being transported and not reported. If
29

Table 1: Calibration of elasticities of substitution and supply.
Panel A: Targeted changes.
Productivity d lnQfg d lnPfg d lnQt d lnQo
Observed in data: 40.55% -24.88% 24.14% -6.38% 6.41%
Predicted by the model: 39.49% -23.76% 24.14% -6.77% 6.59%
Panel B: Estimated parameters.
σfg σc σt εso σf
Calibrated value 1.09 0.51 2.38 2.62 0.86
Panel C: Imposed parameters.
εfd sl sfg sc st
Imposed value 0.50 0.40 0.31 0.54 0.08
Panel D: Model predictions
d lnPl d lnPr d lnPc d lnPt d lnPf
Change in prices 60.36% 7.77% 12.86% 8.13% 0.66%
d ln a d ln b d lnQc d lnQf
Change in quantities 2.57% 0.24% -18.01% -0.33%
εdt εdc εdfg εsfg εsc
Elasticities 0.83 1.40 0.64 1.64 0.16
Notes: Panel A summarizes the observed changes in the aggregate data used to match the model, and the ones predicted
using the calibrated set of parameters. Panel B presents the obtained parameters. Panel C summarizes the imposed
parameters we already observed in the data. Panel D shows the model predicted price changes and other unobservable
quantity changes attributable to Plan Colombia. It also presents the implied elasticities of demand and supply at each
stage.
Our model also predicts that Plan Colombia increased investments in complementary factors,
a, and, b, by 2.57% and 0.24%. Thus, reductions in land and routes are strongly compensated by
changes in these complementary factors, which keep supply in downstream markets from falling.
The reason why a and b increase is because σfg > εdfg and σf > εdf , implying that as land and
routes became scarce with Plan Colombia, the substitution effect at these stages dominated and
led to these countervailing investments.
We believe both effects are quite plausible and we emphasize this here since these margins of
adjustment play key roles in keeping retail prices down. Indeed, as explained in the introduction
and targeted in the calibration, we observe a sharp increase in land productivity. The observed
increase in productivity has taken many different forms; among others, the use of stronger and
bigger coca plants, a higher density of coca plants per hectare, better planting techniques, and the
we adjust h to match the decrease in Qc, we would require it to fall by about 35%. Using this change for h yields
similar results and does not change our conclusions.
30

use of more efficient chemical precursors in the processing of coca leaf into cocaine. As an example,
cocaine producers developed what they call the “continuous process,” whereby they are able to
produce cocaine hydrochloride starting from cocaine paste without stopping in obtaining solid
cocaine base. By using this new method, they have been able to increase production efficiency
in terms of the use of chemical precursors27, saving time and minimizing losses (SIMCI, 2015).
The use of more efficient methods can be broadly classified as greater use of the complementary
factors embodied in a. Likewise, the anecdotal evidence suggests that trafficking and distribution
networks abroad became more productive during this period— that is, reduced their cost per
unit delivered to consumers. For instance, cartels in Mexico and transportistas in the Caribbean
have introduced sophisticated ways of smuggling cocaine to the U.S., including submarines, tunnels
across the border, and better distribution networks connecting transit countries with retail markets
in consumer countries. Likewise, distribution networks tapped into online anonymous markets.
Though we do not think all these changes were a response to upstream changes brought about
by Plan Colombia, we believe they illustrate the extensive margins of adjustment available to
traffickers and distributors in downstream markets, modeled here as embodied in b.
The bottom panel also reports the implied elasticities of demand and supply at the relevant
stages of the drug market (see the Appendix for details on how we computed them). Two features
are noteworthy: First, despite the inelastic consumers’ demand, the demand for Colombian cocaine
is elastic. This is a consequence of the possibilities to substitute for other sources. This results
rationalizes why countries like Colombia find it worthwhile to fight producers and traffickers on
their own; by doing so, they are able to shift production to other source countries and reduce the
size of the domestic drug market with all of its associated costs. Interestingly, and as discussed
in Proposition 5, if all source countries think alike, they would end up increasing the drug market
size regionally because εdt < 1. Second, εdc > σc— which coincides with the case discussed in
the propositions. This means that scale effects dominate substitution effects in the Colombian
market. The consequences are that eradication leads to a decline in the price of routes, becoming
less effective at raising prices; while interdiction also reduces the demand for farm-gate cocaine,
land productivity and to a lesser extent land prices. We believe this scenario is plausible, and may
explain why the current emphasis in interdiction policies adopted by the Colombian government
since 2008 has led to lower land productivity and somewhat lower farm-gate prices, as discussed
above.
27The continuous process requires less potassium permanganate, as it is not necessary to carry out the re-oxidation
of cocaine base.
31

7.1 The marginal costs of reducing cocaine supply
Our formula for the marginal costs also requires estimates for Pf , c1, c2, φ— the effectiveness of
the producer in the conflict for land— and γ— the effectiveness of the trafficker in the conflict
for routes. We set c1 = 0.71 and c2 = 0.15 in order to match the Colombian yearly expenditure
level for each front ($314 million in eradication subsidies and $100 million in interdiction efforts).
The fact that c1 > c2 is consistent with our view that the government emphasized eradication for
most of the years of Plan Colombia (presumably because it perceived targeting large armed groups
involved in the production stage as a political or security priority).28 We also set φ = 0.33 and
γ = 1.55 in order to match the observed levels of q and h. Finally, we set Pf = 150, 000 following
UNODC (2013).
Our parameters imply that MCω = $940, 900 and MCΩ = $175, 273. As our calculation in the
introduction suggests, these are large numbers when compared to other policies, such as treatment
and prevention, which have a marginal cost below $60, 000. To understand the role of the key
parameters determining both the size and difference in these costs and explore the sensitivity of
our findings, we examine how these marginal costs change as we impose different values of our
parameters.
Table 2 analyzes the role of the adjustment mechanisms in the Colombian cocaine market,
emphasized in Proposition 1. In particular, the table shows how the implied marginal costs
change as we vary the elasticities of substitution σc and σfg. Consistent with our theoretical
results, the marginal cost of reducing retail quantities by subsidizing eradication sharply increases
with σfg and decreases with σc. The marginal cost of reducing retail quantities by subsidizing
interdiction increases mildly with σfg. This is because expenditures on eradication are high relative
to interdiction, and the effect brought about by the savings in eradication costs dominates. This
point is exemplified by the top left corner marginal cost, which is actually negative, indicating large
savings in eradication costs for this particular configuration of parameters. Finally, σc increases
the marginal cost MCω. Importantly, the obtained marginal costs are all larger than those of
alternative policies, especially whenever σfg > 1.
Summarizing, the low value of σc together with the large value of σfg, which are both intuitive
and apparent from the data, imply a large marginal cost for eradication and a lower (though still
large) marginal cost for interdiction. As explained in Proposition 4, this occurs because eradication
does not increases the price of land as much— as it is easy to substitute it— and actually decreases
the price of routes, leading to a small increase in Colombian cocaine prices. On the other hand,
28Ideally, we would prefer to estimate these costs from expenditures reported by the Colombian government, but
these are not available. In any case, we do not want to push the interpretation of these costs too far, as they are
only a modeling tool for capturing the Colombian government’s incentives rather than a true measure of the social
costs of cocaine production and trafficking in Colombia.
32

interdiction is more effective at increasing the price of routes, which are harder to substitute,
while it does not affect as much the price of land, so long as σfg is large. Since the price of land
represents only a small fraction of the Colombian price, while the price of routes represents a larger
fraction, interdiction is more effective at increasing the price of Colombian cocaine and affecting
downstream markets. Importantly, the table shows that for eradication to be as cost-effective as
interdiction, we would need implausibly high levels of σc and low levels of σfg, which are at odds
with the data.
Table 2: Marginal costs and the role of substitution in the Colombian market.
Marginal cost subsidizing eradication MCω
σfg = 0.1 σfg = 0.5 σfg = 1 σfg = 1.5 σfg = 2 σfg = 5
σc = 0.1 $2117.071 $2745.502 $3531.039 $4316.577 $5102.114 $9815.339
σc = 0.5 $602.863 $744.241 $920.964 $1097.687 $1274.409 $2334.745
σc = 1 $413.587 $494.084 $594.705 $695.325 $795.946 $1399.671
σc = 2 $318.949 $369.005 $431.575 $494.145 $556.715 $932.134
σc = 5 $262.166 $293.958 $333.697 $373.436 $413.176 $651.612
Marginal cost subsidizing interdiction MCΩ
σfg = 0.1 σfg = 0.5 σfg = 1 σfg = 1.5 σfg = 2 σfg = 5
σc = 0.1 $-97.959 $90.436 $127.232 $140.541 $147.410 $160.154
σc = 0.5 $143.379 $164.806 $173.511 $177.467 $179.728 $184.391
σc = 1 $208.960 $209.959 $210.534 $210.843 $211.036 $211.480
σc = 2 $248.614 $251.008 $252.846 $254.035 $254.868 $257.102
σc = 5 $275.178 $288.487 $301.668 $312.121 $320.615 $350.173
Notes: The table presents the estimated marginal costs obtained by imposing different values of the elasticities of substi-
tution σfg and σc.
Table 3 examines the role of displacement effects explained in Proposition 5. In particular,
the table shows how the implied marginal costs change as we vary the elasticities σt and εso —
capturing the extent of displacement. Our parameters imply that σt > εdt , so that reductions in the
Colombian supply will be compensated by increasing the quantities supplied by other countries;
that is, the substitution effect dominates in this case. Moreover, the high estimated elasticity
of supply, εso, implies displacement will occur without raising consumer prices. The table shows
that, indeed, displacement effects— captured by larger values of σt and εso— play a major role
in increasing the marginal costs of source country interventions. However, the table also shows
that a higher elasticity of substitution increases marginal costs so long as other sources’ supply is
sufficiently elastic (an elasticity slightly above 0.5 is enough in our case). Otherwise, the resulting
33

price increases in other sources will also be passed to consumers. Likewise, a more elastic supply
εso makes source country interventions less effective only when σt > εdt , and the substitution effect
dominates. These observations combined imply that the large values obtained in the calibration for
both σt and εso, and reflecting the sharp increase in production in other source countries following
the implementation of Plan Colombia, make both marginal costs large.
Table 3: Marginal costs and the role of displacement effects.
Marginal cost subsidizing eradication MCω
σt = 0.5 σt = 1 σt = 1.5 σt = 2 σt = 5 σt = 10
εso = 0 $754.896 $699.238 $680.685 $671.409 $654.712 $649.146
εso = 0.5 $681.171 $720.225 $739.753 $751.469 $777.033 $787.177
εso = 1 $656.595 $730.719 $775.194 $804.843 $878.967 $912.659
εso = 1.5 $644.308 $737.015 $798.821 $842.967 $965.219 $1027.231
εso = 2 $636.935 $741.213 $815.697 $871.560 $1039.149 $1132.254
εso = 5 $620.850 $751.707 $862.432 $957.339 $1327.477 $1615.362
Marginal cost subsidizing eradication MCΩ
σt = 0.5 σt = 1 σt = 1.5 σt = 2 σt = 5 σt = 10
εso = 0 $160.953 $139.720 $132.643 $129.104 $122.734 $120.611
εso = 0.5 $144.422 $143.840 $143.549 $143.375 $142.994 $142.843
εso = 1 $138.912 $145.900 $150.093 $152.888 $159.877 $163.053
εso = 1.5 $136.156 $147.136 $154.456 $159.684 $174.162 $181.507
εso = 2 $134.503 $147.960 $157.572 $164.781 $186.407 $198.422
εso = 5 $130.896 $150.020 $166.201 $180.071 $234.162 $276.234
Notes: The table presents the estimated marginal costs obtained by imposing different values of the elasticities of
substitution σt and supply from other sources εso.
Table 4 examines the role of the elasticity of demand in retail markets, which is a key parameter
we imposed in our calibration. As noted in Proposition 7, the low value assumed for the elasticity
of demand explains to a great extent the high marginal costs for both fronts. Importantly, a
higher elasticity of demand not only makes both policies more effective— by raising Λq and Λh,
but also reduces the cost of making important advances on both fronts— by lowering Cq and
Ch, as discussed in the proposition. This is because a more elastic demand implies that the
respective shadow prices of land and routes do not increase as much with supply reduction policies;
keeping the willingness of producers and traffickers to fight back against the Colombian government
checked. Importantly, even when we allow an implausibly large demand elasticity of 1.5, source
country interventions are still more costly than treatment and prevention policies in consumer
countries (though interdiction approaches the upper range of estimates for the costs of these
34

alternative policies).
Table 4: Costs, effectiveness and the role of the elasticity of demand.
Elasticity of consumers’ demand
εdf = 0.25 εdf = 0.5 εdf = 0.75 εdf = 1 εdf = 1.25 εdf = 1.5
MCω $1859.293 $940.360 $634.049 $480.893 $389.000 $327.738
Cq $57375.097 $57355.280 $57335.922 $57317.008 $57298.523 $57280.452
Λq 0.001 0.002 0.002 0.003 0.004 0.005
MCΩ $347.074 $175.273 $118.005 $89.372 $72.192 $60.738
Ch $21784.955 $21744.646 $21705.272 $21666.801 $21629.201 $21592.445
Λh 0.008 0.015 0.022 0.029 0.036 0.043
Notes: The table presents the estimated marginal costs obtained by imposing different values of the elasticity of demand εdf .
Finally, we discuss the implications of our model for the efficiency of the allocation of subsidies.
As shown in the previous tables, we find throughout that MCω > MCΩ. Indeed, using the
calibrated parameters we obtain m = 0.5. This small value is driven by the low share of land, the
low value of σc and the large value of σfg. The fact that we observe expenditures for eradication
that are twice as high as those for interdiction, suggests an inefficient allocation of resources from
a supply reduction perspective. The inefficiency arises for three reasons: First, given the low share
of land, the efficient allocation of resources involves the U.S. spending a proportional share of
resources in eradication, given that the cost of making advancements in this front is proportional
to the value of land. Spending beyond this proportion corresponds to making too many efforts in
this front, and these efforts run into diminishing returns. Second, given the domestic substitution
patterns determined by the low σc and large σfg, and their effects emphasized in Table 2, the
efficient allocation involves even lower expenditures in eradication. Finally, these forces may be
exacerbated by the fact that c1 > c2. If the U.S. does not anticipate the Colombian government
incentives it would also end up subsidizing eradication efforts in excess.
Though more speculative, the finding that the U.S. subsidizes eradication efforts excessively
is interesting in its own right and could reflect several possibilities. First, it could be that the
U.S. does not know, or ignores, the political objectives of source country leaders, and fails to
adjust its subsidies to take into account that Colombia will tend to invest more in eradication
because c1 > c2. Second, it could be that Colombia itself has a say in the allocation of subsidies,
pushing the U.S. to grant more subsidies to eradication. Finally, it could be that the U.S. has
other simultaneous objectives besides supply reduction, like fighting insurgent movements in the
region. Eradication efforts may be preferred because they target directly the stages where left-wing
guerrillas and illegal armed groups in Colombia are most involved .
35

8 Concluding remarks
In this paper, we propose a model of the war on drugs in source countries, inspired by the experience
of Colombia under Plan Colombia. Our model incorporates several features that we judge to be
relevant to understand the effects of supply-side interventions in drug producing countries. First,
we explicitly model all successive levels of the drug trade, from cultivation to distribution. Second,
we allow actors to substitute for cheaper inputs in response to price changes created by supply
reduction programs in source countries. In particular, we allow producers to substitute land
for chemical precursors and other factors of production that are complementary to land in the
production of hard drugs, such as cocaine or heroine; traffickers to substitute routes for more
cocaine being shipped; and downstream markets to substitute for other sources of drugs or to
invest in factors that improve its distribution capabilities. All of these responses shape the way in
which source country interventions affect quantities and prices throughout the whole production
and distribution chain.
We model anti-narcotic efforts as a conflict over scarce inputs at successive levels of the produc-
tion and trafficking chain. We also incorporate the fact that source countries implement policies
with partial funding from an interested outsider (e.g., the government of a consumer country inter-
ested in reducing supply), so there is potentially an agency problem. The U.S., or other consumer
countries, wishing to curb supply in their domestic markets have to rely on subsidies to strengthen
the resolve of producer and transit countries in their war against producer and traffickers.
We use the model to study Plan Colombia, a large-scale intervention in Colombia aimed at
reducing the supply of cocaine by targeting illicit crops and the illegal armed groups’ control of
routes for transporting drugs outside the country, two of the main inputs in the production and
trafficking of cocaine. The model fits many of the patterns observed in the data and help us
interpret some puzzling findings. For instance, the model explains why, despite the large increase
in eradication and interdiction in Colombia, retail and wholesale markets in the U.S. remained
essentially unaffected. The model also explains the large increase in land productivity observed
following the implementation of Plan Colombia, and the recent shift in production towards Peru
and Bolivia.
For a reasonable set of parameters, our model predicts that the marginal cost to the U.S. of
reducing by one kilogram the amount of cocaine transacted in retail markets is about $940,360
if resources are allocated to subsidizing eradication efforts; and about $175,273 if resorces are
allocated to subsidizing interdiction efforts in Colombia. Both numbers are large. MacCoun and
Reuter (2001) estimate that it would cost the U.S. about $8,250 and between $12,500 and $68,750
per year to reduce consumption by the same amount (one kg) using treatment and prevention
policies, respectively. Source country interventions such as Plan Colombia, therefore, are very
costly strategies for curbing the supply of drugs in consumer countries relative to these alternatives.
36

Source-country interventions are also socially costly strategies. To justify subsidies for inter-
diction (the most cost-effective program), one would need to argue that 1kg of cocaine supplied in
retail markets has a social cost of about $325,000 (the marginal cost of enforcement plus the pri-
vate valuation by consumers – e.g., the price). We do not know of estimates for these social costs,
but we find the number to be too large to be accepted without further evidence. Our numerical
exercise suggests that interventions such as Plan Colombia are inefficient and socially costly ways
of reducing drug consumption. More so if one takes into account the share of expenditures paid by
Colombia, as well as the violence and externalities created by the war on drugs in source, transit
and consumer countries.
References
Angrist, J. D. and Kugler, A. D. (2008). Rural Windfall or a New Resource Curse? Coca, Income,
and Civil Conflict in Colombia. The Review of Economics and Statistics, 90(2):191–215.
Bachman, J. G., Johnston, L. D., and O’Malley, P. M. (1990). Explaining the recent decline in
cocaine use among young adults: Further evidence that perceived risks and disapproval lead to
reduced drug use. Journal of Health and Social Behavior, 31:173–184.
Becker, G. S., Murphy, K. M., and Grossman, M. (2006). The market for illegal goods: The case
of drugs. The Journal of Political Economy, 114(1):38–60.
Caulkins, J. (2004). Drug policy: Insights from mathematical analysis. Operations Research and
Healthcare, pages 297–332.
Caulkins, J., Feichtinger, G., and Tragler, G. (2001). Optimal dynamic allocation of treatment
and enforcement in illicit drug control. Operations Research, 49(3):352–362.
Chumacero, R. A. (2010). Evo, Pablo, Tony, Diego, and Sonny : General equilibrium analysis
of the market for illegal drugs. In Keefer, P. and Loayza, N., editors, Innocent Bystanders:
Developing Countries and the War on Drugs, pages 165–194. The World Bank.
Costa Storti, C. and De Grauwe, P. (2009). The cocaine and heroin markets in the era of glob-
alisation and drug reduction policies. International Journal of Drug Policy, 20(6):488 – 496.
Special Issue: Drug Policy Analysis.
Dell, M. (2011). Trafficking networks and the mexican drug war. American Economic Review
(forthcomming).
DiNardo, J. (1993). Law enforcement, the price of cocaine and cocaine use. Mathematical and
Computer Modeling, 17(2):53–64.
37

DNP (2006). Balance plan colombia:1999-2005. Reporte, Departamento Nacional de Planeacion,
Colombia.
Dube, O. and Naidu, S. (2015). Bases, bullets and ballots: the effect of u.s. military aid on political
conflict in colombia. The Journal of Politics, 77(1):249–267.
GAO (2008). Plan colombia: Drug reduction goals were not fully met, but security has improved;
u.s. agencies need more detailed plans for reducing assistance. Report, United States Govern-
ment Accountability Office.
Grossman, H. and Mejıa, D. (2008). The war against drug producers. Economics of Governance,
9(1):5–23.
Hirshleifer, J. (1991). The technology of conflict as an economic activity. American Economic
Review, 81(2):130–34.
Hirshleifer, J. (2001). Conflict and rent-seeking success functions: Ratio vs. difference models of
relative success. The Dark Side of the Force, pages 89–101.
Kuziemko, I. and Levitt, S. D. (2004). An empirical analysis of imprisoning drug offenders. Journal
of Public Economics, 88(9-10):2043–2066.
MacCoun, R. J. and Reuter, P. (2001). Drug War Heresies: Learning from Other Vices, Times,
and Places. Cambridge University Press.
Mejıa, D. and Posada, C. E. (2008). Cocaine production and trafficking: What do we know?
Policy Research Working Paper Series 4618, The World Bank.
Mejıa, D. and Restrepo, P. (2008). The War on Illegal Drug Production and Trafficking: An
Economic Evaluation of Plan Colombia. Documento CEDE 19, Universidad de los Andes,
CEDE.
Mejıa, D. and Restrepo, P. (2011). The war on illegal drugs in producer and consumer countries:
A simple analytical framework. Documento CEDE 2, Universidad de los Andes.
Mejıa, D., Restrepo, P., and Rozo, S. (2014). On the effects of enforcement on illegal markets:
Evidence from a quasi-experiment in colombia. Technical report, Mimeo.
Mejıa, D. and Rico, D. (2010). La microeconomıa del trafico y la produccion de drogas en colombia.
Libro Blanco de Drogas, Universidad de los Andes.
Mejıa, D. and Restrepo, P. (2013). Bushes and bullets: Illegal cocaine markets and violence in
colombia. Mimeo, Universidad de los Andes.
38

Mejıa, D. and Rico, D. (2010). La microeconomıa de la produccion y trafico de cocaına en colombia.
Documento CEDE 2010-19 - Universidad de los Andes.
Miron, J. (2001). Violence, guns, and drugs: A cross-country analysis. The Journal of Law and
Economics, 44(S2):615–633.
Miron, J. (2010). The budgetary implications of drug prohibition. Mimeo, Harvard University.
Naranjo, A. (2007). Insurgents, Drug Lords and Anti-Drug Supply Policies in the Andes. Ph.d
dissertation, Department of Economics, Stockholm University.
Rabasa, A. and Chalk, P. (2001). Parasites and predators: Guerillas and the insurrection economy
of colombia. Technical report, Parasites and predators: Guerillas and the Insurrection economy
of Colombia.
Rangel, A. (2000). Parasites and predators: Guerillas and the insurrection economy of colombia.
Journal of International Affairs, 53:577–601.
Reuter, P. (2008). Can production and trafficking of illicit drugs be reduced or merely shifted ?
Policy Research Working Paper Series 4564, The World Bank.
Rozo, S. (2014). On the unintended consequences of enforcement on illegal drug producing coun-
tries. Technical report, University of California, Los Angeles.
Rydell, P., Caulkins, J., and Everingham, S. (1996). Enforcement or Treatment? Modeling the
Relative Efficacy of Alternatives for Controlling Cocaine. Operations Research, 44(5):687–695.
Saffer, H. and Chaloupka, F. (1999). The demand for illicit drugs. Economic Inquiry, 37(3):401–
411.
SIMCI (2015). Monitoreo de cultivos de coca. Technical report, UNODC.
Skaperdas, S. (1996). Contest success functions. Economic Theory, 7:283–290.
UNODC (2013). World Drug Report. United Nations.
Villalon, C. (2004). Cocaine country. National Geographic.
39

Appendix, not for publication
A1 Hicks and Marshall’s rules
LEMMA 1 (Marshall Rules): A producer in a perfectly competitive environment combines two
inputs, x1, x2. to produce a unique good, y, using a constant returns to scale technology F : R2 →
R, which is quasi-concave and continuously differentiable. The elasticity of substitution between
inputs is σ, while their current shares are s and 1 − s for x1 and x2, respectively. Let εis, be the
elasticity of supply of input i, and let εd be the elasticity of demand for output. Following a small
increase in p1 of d ln p1, we find that in the optimum, all prices and quantities change by:
d ln p1 = d ln p1, (A1)
d ln p2 =s(σ − εd)
s(σ + ε2s) + (1− s)(ε2s + εd)d ln p1, (A2)
d ln x1 = −s(σ + ε2s)εd + (1− s)(ε2s + εd)σ
s(σ + ε2s) + (1− s)(ε2s + εd)d ln p1, (A3)
d ln x2 =s(σ − εd)ε
2s
s(σ + ε2s) + (1− s)(ε2s + εd)d ln p1, (A4)
d ln p =s(σ + ε2s)
s(σ + ε2s) + (1− s)(ε2s + εd)d ln p1, (A5)
d ln y = −s(σ + ε2s)εd
s(σ + ε2s) + (1− s)(ε2s + εd)d ln p1. (A6)
This implies that the elasticity of demand for the input x1 is given by
s(σ + ε2s)εd + (1− s)(ε2s + εd)σ
s(σ + ε2s) + (1− s)(ε2s + εd). (A7)
Proof: The thought experiment underlying this calculation is as follows. Imagine that the
price for x1 increases exogenously. How does the quantity of x1 used change, taking into account
the change in x2 along its supply curve? Let p1 and p2 be the prices for x1 and x2, respectively;
and p the price of one unit of output. The CRS and competitive markets assumptions imply that
p = minx′
1,x′
2
x′
1p1 + x′
2p2 s.t: F (x′
1, x′
2) = 1.
Using the envelope theorem, we get (this applies because of the regularity assumptions on F )
d ln p = s1d ln p1 + s2d ln p2, (A8)
and using Euler’s theorem, we get
d ln y = s1d ln x1 + s2d ln x2. (A9)
40

Lastly, by the definition of the elasticity of substitution, we have
σ(d ln p1 − d ln p2) = d ln x2 − d ln x1. (A10)
Since we are moving along the (induced) demand curve of x1, we get
d ln x1 = −ε1dd ln p1, (A11)
where ε1d is the induced elasticity of demand for the input. Also, since we are moving along the
supply curve of x2 we get
d ln x2 = ε2sd ln p2. (A12)
Finally, since we are moving along the demand curve of y, we get
d ln y = εdd ln p. (A13)
Equations A8, A9, A10, A11, A12 and A13 define a system of equations in d ln p2, d ln x1,
d ln x2, d ln p, d ln y, εd1 in terms of all the parameters and the exogenous change in d ln p1. Since
the system is homogeneous in d ln p1, d ln p2, d ln x1, d ln x2, d ln p, d ln y, then clearly the implied
value for εd1 is independent of d ln p1. Solving the system yields
εd1 =s(σ + ε2s)εd + (1− s)(ε2s + εd)σ
s(σ + ε2s) + (1− s)(ε2s + εd). (A14)
The expressions for the other variables are also interesting, because they tell us how the endogenous
variables react to a shock that changes the supply of x1, ultimately increasing its price by d ln p1.
These expressions are as given above.
Corollary 1: The effect of an increase in the price of x1 of d ln p1 on the productivity of this
input (the unit of output per unit of input used) is given by
(1− s)(ε2s + εd)σ
s(σ + ε2s) + (1− s)(ε2s + εd)d ln p1 > 0. (A15)
Proof: This follows directly from computing d ln y − d ln x1 using the above formulas. This
ratio increases because of the q-complementarity between inputs.
LEMMA 2: A producer in a perfectly competitive environment combines two inputs, x1 and
x2, to produce a unique good, y, using a constant returns to scale technology F : R2 → R, which
is quasi-concave and continuously differentiable. The elasticity of substitution between inputs is
σ, and their current shares are s and 1− s for x1 and x2, respectively. Let εis be the elasticity of
supply of input i, and let εd be the elasticity of demand for the output. The induced elasticity of
41

the supply of y (assuming the input markets are at equilibrium) is
d ln p1 =σ + εs2
s1(σ + εs2) + s2(σ + εs1)d ln p, (A16)
d ln p2 =σ + εs1
s1(σ + εs2) + s2(σ + εs1)d ln p, (A17)
d ln x1 =(σ + εs2)ε
s1
s1(σ + εs2) + s2(σ + εs1)d ln p, (A18)
d ln x2 =(σ + εs1)ε
s2
s1(σ + εs2) + s2(σ + εs1)d ln p, (A19)
d ln y =
(
(σ + εs2)s1εs1
s1(σ + εs2) + s2(σ + εs1)+
(σ + εs1)s2εs2
s1(σ + εs2) + s2(σ + εs1)
)
d ln p. (A20)
This implies a price elasticity of supply equal to
(σ + εs2)s1εs1
s1(σ + εs2) + s2(σ + εs1)+
(σ + εs1)s2εs2
s1(σ + εs2) + s2(σ + εs1). (A21)
Proof: First, it is worth clarifying what the proposition says. Standard producer theory
suggests that the supply of a firm with a CRS technology is perfectly elastic, or fixed at one price.
However, since the inputs themselves are provided with some elasticity, this creates an upward
slopping supply for output. The thought experiment thus assumes that input markets are in
equilibrium and then asks what happens to the supplied quantity when the output price increases.
As before, we use the envelope theorem, Euler’s theorem and the definition of the elasticity of
substitution in equations A8, A9 and A10 hold. Moreover, since we are on the supply curve for
x1 and x2, we get
d ln xi = εisd ln pi, (A22)
for i = 1, 2.
Using these relationships, we get a system of equations in d ln p1, d ln p2, d ln x1, d ln x2, d ln y,
with d ln p taken as given (recall the thought experiment). Solving it yields the above results.
A2 Proof of propositions 1 and 2
This section describes the steps required to arrive to Propositions 1 and 2.
We focus on how changes in Ω and ω affect the equilibrium quantities and prices of drugs
transacted at the farm gate and trafficking markets. For the sake of notational simplicity, we do
not index equilibrium variables with an *. Also, demand elasticities are always given in absolute
terms, since all demands are downward slopping in this model.
Suppose the U.S. subsidizes more eradication (e.g., sets a lower ω). We have the following
consequences:
42

• Equation 8 implies that q falls by d ln q > 0, as the government of the drug producing
country now experiences a lower cost of investing resources in eradication efforts.
• The shadow price of land, Pl, increases by
d lnPl =1
εdld ln q > 0.
The elasticity of demand for land, εdl > 0 (in absolute terms), can be computed recursively,
as discussed in the appendix, and is given by:
εdl = slεdfg + (1− sl)σfg.
The elasticity of demand for land is a weighted average of the elasticity of substitution and
elasticity of demand faced by the producer. A higher elasticity of substitution at the farm
gate level implies that eradication efforts do not significantly increase land prices; making
eradication less effective at raising prices.
• An increase in Pl driven by a lower supply of land increases the use of the complementary
factor a. The corollary of lemma 1 in the appendix implies that, due to q−complementarities,
land productivity increases by
(1− sl)σfgd lnPl > 0
Thus, our model endogenously predicts an increase in the productivity of land as a result of
an increase in eradication efforts in Colombia. According to this equation, a large observed
increase in land productivity implies a large elasticity of substitution, σfg, and under such
a setting one ought to expect that eradication becomes less effective at increasing the price
of Colombian cocaine.
• An increase in Pl raises the price of farm gate cocaine by
d lnPfg = sld lnPl > 0,
which captures the fact that if land is relatively unimportant (e.g., if it has a low share,
sl), an increase in its price will not translate into a large increase in the farm gate price of
cocaine.
• The drug trafficker reacts to an increase in Pfg by demanding less farm gate cocaine:
d lnQfg = −εdfgd lnPfg < 0.
The demand elasticity for farm gate cocaine is derived recursively in the appendix and is
given by
εdfg =σcε
dc
sfgσc + (1− sfg)εdc.
43

• An increase in the price of farm gate cocaine has two effects on the value of routes. First, it
generates a substitution effect that leads the trafficker to substitute farm gate cocaine for a
more intensive use of routes, thus increasing his demand for the latter. Second, it generates
a scale effect, which brings about a contraction in the size of the trafficker’s operations, as
he now operates at a larger marginal cost. If σc > εdc , the substitution effect dominates the
scale effect, causing an increase in the demand for routes (otherwise, the opposite happens).
Since the supply of routes is fixed at hR, this translates into a change in the shadow price
of routes that is given by
d lnPr =sfg(σc − εdc)
sfgσc + (1− sfg)εdcd lnPfg ≶ 0
The analysis above shows that when σc > εdc , the shadow price of routes increases, as does
its market value. In this case, a negative feedback exists between different anti-drug policies,
as more eradication efforts increase the cost of implementing interdiction efforts by raising
traffickers’ valuation of routes. When σc < εdc , the opposite happens, and there is a positive
feedback between the two policies.
• Pc, increases by:
d lnPc =sfgσc
sfgσc + (1− sfg)εdcd lnPfg = sfgd lnPfg + (1− sfg)d lnPr > 0.
This equation captures the fact that the increase in prices needs to cover the extra cost of
purchasing more expensive farm gate cocaine. This is why the increase in Pc is proportional
to the share of farm gate drugs, sfg.
Now, suppose the U.S. subsidizes interdiction more (e.g., sets a lower Ω). We have the following
consequences:
• Equation 12 implies that h falls by d lnh > 0.
• The shadow price of routes, Pr, increases by
d lnPr =1
εdrd lnh > 0.
The elasticity of the demand for routes, which determines the size of the price increase, is
derived recursively in the appendix, and is given by:
εdr =sr(σc + εsfg)ε
dc + (1− sr)(ε
sfg + εdc)σc
sr(σc + εsfg) + (1− sr)(εsfg + εdc).
This formula already accounts for the fact that the trafficker can partially substitute routes
for farm gate cocaine and perceives an elasticity in the demand for his products of εdc . This
44

elasticity increases with σc, as the trafficker can substitute for them buying more cocaine at
the farm gate in order to achieve the desired level of trafficking operations. This formula
also accounts for the fact that farm gate cocaine is supplied with an elasticity given by:
εsfg =sa
slσfg,
which increases with σfg. Thus, a higher σfg leads to a more elastic demand for routes, as
a substitute can be purchased without significantly affecting its price.
• An increase in Pr gives rise to two opposing effects on the trafficker’s demand for farm gate
cocaine: a substitution and a scale effect, as explained above. When σc > εdc , the substitution
effect dominates and the increase in Pr causes a net increase in the demand for farm gate
cocaine; otherwise, the opposite happens. The corresponding change in the farm gate price
of cocaine is given by
d lnPfg =sr(σc − εdc)
sr(σc + εsfg) + (1− sr)(εsfg + εdc)d lnPr ≶ 0.
εsfg =sa
slσfg,
As above, when σc < εdc , policies are complementary: increasing interdiction reduces the
demand for farm-gate cocaine, reducing land productivity and its value.
• Finally, an increase in Pr, by raising the trafficker’s marginal cost, leads to an increase in
the price of cocaine in transit markets of
d lnPc =sr(σc + εsfg)
sr(σc + εsfg) + (1− sr)(εsfg + εdc)d lnPr = srd lnPr + (1− sr)d lnPfg > 0.
This equation captures the fact that the increase in prices has to cover the extra cost of
purchasing more expensive routes. This is why the increase in Pc is proportional to the
share of routes, sr.
The analysis above suggests that interdiction and eradication affect downstream markets only
though the induced increase in Pc; that is, by shifting the supply of Colombian cocaine. However,
the above analysis also shows that both policies affect Pc with different elasticities, depending on
factor shares and possibilities for substitution in production and trafficking.
We now analyze how these increases in Colombian cocaine prices, d lnPc > 0, affect downstream
markets and other source countries.
• Downstream markets respond to an increase in Pc by demanding less Colombian cocaine:
d lnQc = −εdcd lnPc < 0.
45

The elasticity of demand for Colombian cocaine in transit markets faced by the trafficker as
derived in the appendix is given by
εdc =sc(σt + εso)ε
dt + (1− sc)(ε
so + εdt )σt
sc(σt + εso) + (1− sc)(εso + εdt ).
This elasticity accounts for the fact that downstream markets can obtain cocaine from other
source countries as a substitute, and that this cocaine is supplied with an elasticity εso.
• The effect on the quantity of cocaine from other source countries is given by
d lnQo =sc(σt − εdt )ε
so
sc(σt + εso) + (1− sc)(εso + εdt )d lnPc ≶,
while the corresponding increase in price is given by
d lnPo =sc(σt − εdt )
sc(σt + εso) + (1− sc)(εso + εdt )d lnPc ≶ .
If σt > εdt , the substitution effect dominates, and the quantity of cocaine demanded from
other sources increases, leading to the so-called displacement effect, whereby supply-reduction
efforts in Colombia increase the production of cocaine in other source countries. Displace-
ment effects are stronger when σt and εso are large.
• The price of the cocaine aggregate, Qt, increases by
d lnPt =sc(σt + εso)
sc(σt + εso) + (1− sc)(εso + εdt )d lnPc = scd lnPc + (1− sc)d lnPo > 0.
This equation captures two features. The first reflects the fact that the increase in prices
needs to cover the extra cost of purchasing more expensive Colombian cocaine. This is why
the increase in Pc is proportional to the share of farm gate cocaine, sc. Second, it shows
that displacement effects (captured by a large σt and εso) reduce the increase of prices in
downstream markets, by providing an elastic alternative to Colombian cocaine.
• Despite the possibilities to substitute, the cocaine aggregate falls by
d lnQt = −εdtd lnPt < 0.
The price elasticity of demand for cocaine in transit countries, which determines the size of
the adjustment in quantities, is given recursively by
εdt = stεdf + (1− st)σf .
This relates recursively all demand elasticities to the elasticity of consumers’ demand (which
is exogenous), the market structure and technologies. A higher elasticity of substitution, σf ,
implies that upstream markets face a more elastic demand; hence, supply reduction efforts in
source countries become less effective, because downstream markets compensate by investing
in better distribution networks , and so on.
46

• The price of cocaine for final consumers in retail markets increases by
d lnPf = std lnPt. (A23)
This simply reflects the fact that the cost of drugs in transit countries is only a share of
the total cost; as a result, only a small increase in the consumer price is required to cover
the extra cost. Likewise, the effect of an increase in the price of Colombian cocaine on the
retail price is proportional to the share of its value in retail markets, stsc— though the exact
formula is more complicated.
• Finally, the decrease in the quantity of cocaine transacted in retail markets is given by
d lnQf = −εdfd lnPf .
A smaller elasticity of the demand of final consumers, εdf , which is taken as exogenous, makes
supply reduction policies less effective in reducing quantities.
A3 Derivation of the elasticities of demand and supply at
different stages
If we apply Lemma 1 to the problem solved by the drug producer, we obtain the price elasticities
of the producer’s demand for land and complementary factors as follows:
εdl = slεdfg + (1− sl)σfg, εda =
σfgεdfg
saσfg + (1− sa)εdfg. (A24)
Also, applying Lemma 2 to the problem in equation 1, we obtain the price elasticity of the
producer’s supply of cocaine in the farm gate market as follows:
εsfg =sa
slσfg. (A25)
In the application of both lemmas, we use the fact that chemicals and complementary factors, a,
are supplied at a constant price, while land is supplied inelastically, since we have fixed q. The
elasticity of the demand for land allows us to understand how a reduction in the fraction of land
held by the producer, q, translates into a higher shadow price for land.
If we apply Lemma 1 to the problem solved by the trafficker, we obtain the price elasticities
of the trafficker’s demand for farm gate cocaine and routes, as follows:
εdfg =σcε
dc
sfgσc + (1− sfg)εdc, εdr =
sr(σc + εsfg)εdc + (1− sr)(ε
sfg + εdc)σc
sr(σc + εsfg) + (1− sr)(εsfg + εdc), (A26)
where εsfg is the price elasticity of the supply of farm gate cocaine in Colombia, obtained above.
The price elasticity of the demand for farm gate cocaine allows us to understand how shifts in
47

the farm gate supply, caused by a reduction in q, affect farm gate prices and quantities. The
price elasticity of the (shadow) demand for routes allows us to understand how a reduction in the
fraction of routes held by the trafficker, h, affects their shadow price, and subsequently the price
of Colombian cocaine in transit.
Applying Lemma 2 to the trafficker’s problem, we obtain the price elasticity of the trafficker’s
supply of Colombian cocaine in the trafficking market, as follows:
εsc =sfgσc
sfgσc + sr(εsfg + σt)εsfg. (A27)
Again, here we use the fact that routes are supplied inelastically, since we have fixed h.
The elasticities in downstream markets can also be characterized using the lemmas. Marshall’s
law implies that the induced price elasticity of the demand for Qc is equal to
εdc =sc(σt + εso)ε
dt + (1− sc)(ε
so + εdt )σt
sc(σt + εso) + (1− sc)(εso + εdt ), (A28)
where, again, the price elasticity of demand for Colombian cocaine by the international drug dealer
is a weighted average of his own (shadow) price elasticity of demand for Qt and the elasticity of
substitution between Colombian cocaine and cocaine from other source countries.
Similarly, Marshall’s law implies that the induced elasticity of demand for Qt is equal to
εdt = stεdf + (1− st)σf . (A29)
Finally, applying lemma 2 in the appendix twice, we obtain the price elasticity of the cocaine
supply in retail markets as
εsf =1
st
(
sc(εso + σt)
sc(εso + σt) + so(εsc + σt)εsc +
so(εsc + σt)
sc(εso + σt) + so(εsc + σt)εso
)
+sb
stσf . (A30)
Here, εsc is the price elasticity of cocaine being trafficked from Colombia.
Using the above formulas, we can compute all demand and supply elasticities in terms of the
observed shares, the elasticities of substitution and the price elasticity of consumers’ demand, εdf ,
and the price elasticity of the supply from other countries, εso. These formulas already assume that
all remaining markets are in equilibrium, so we can directly use the price elasticities of the demand
for land and routes to find the equilibrium effect of a change in q or h on the equilibrium prices of
land and routes, respectively. We can then use the rest of lemmas 1 and 2 to understand how price
changes affect the whole system. What the reader should bear in mind is that, by recursively using
the above formulas, we are able to derive explicit formulas for all of the relevant price elasticities of
supply and demand in terms of observed shares, s, the elasticities of substitution, σ, and exogenous
elasticities εdf and εso. The fact that complementary factors a and b are supplied at constant prices
is already embedded in the formulas, such that they can be generalized to allow for arbitrary price
elasticities in the supply of these inputs.
48

A4 Derivation of m.
Let TCωUS = φ(1− q)2PlL and TCΩ
US = γ(1− h)2PrR be the total U.S. expenditure in subsidizing
eradication and interdiction, respectively. We can rewrite the marginal costs in equations 16 and
17 as:
MCω =1
Λq
TCωUS
Qf
(
1
ω(1− ω)q2(1− q) + 2
q
1− q+
1
εdl
)
+1
Λq
TCΩUS
Qf
d lnPr
d ln q, (A31)
and
MCΩ =1
Λh
TCΩUS
Qf
(
1
Ω(1− Ω)h2(1− h) + 2
h
1− h+
1
εdr
)
+1
Λh
TCωUS
Qf
d lnPl
d lnh. (A32)
Equating both marginal costs we obtain the desired expression for m.
49


![[Illegal] drug uncle fester - secrets of methamphetamine manufacture (3rd ed)](https://static.fdocuments.net/doc/165x107/54143a2b8d7f72006a8b459b/illegal-drug-uncle-fester-secrets-of-methamphetamine-manufacture-3rd-ed.jpg)

