The Economics of Interest-Rate Spreads and Yield...
17
This is “The Economics of Interest-Rate Spreads and Yield Curves”, chapter 6 from the book Finance, Banking, and Money (index.html) (v. 2.0). This book is licensed under a Creative Commons by-nc-sa 3.0 (http://creativecommons.org/licenses/by-nc-sa/ 3.0/) license. See the license for more details, but that basically means you can share this book as long as you credit the author (but see below), don't make money from it, and do make it available to everyone else under the same terms. This content was accessible as of December 29, 2012, and it was downloaded then by Andy Schmitz (http://lardbucket.org) in an effort to preserve the availability of this book. Normally, the author and publisher would be credited here. However, the publisher has asked for the customary Creative Commons attribution to the original publisher, authors, title, and book URI to be removed. Additionally, per the publisher's request, their name has been removed in some passages. More information is available on this project's attribution page (http://2012books.lardbucket.org/attribution.html?utm_source=header) . For more information on the source of this book, or why it is available for free, please see the project's home page (http://2012books.lardbucket.org/) . You can browse or download additional books there. i
Transcript of The Economics of Interest-Rate Spreads and Yield...

This is “The Economics of Interest-Rate Spreads and Yield Curves”, chapter 6 from the book Finance, Banking,and Money (index.html) (v. 2.0).
This book is licensed under a Creative Commons by-nc-sa 3.0 (http://creativecommons.org/licenses/by-nc-sa/3.0/) license. See the license for more details, but that basically means you can share this book as long as youcredit the author (but see below), don't make money from it, and do make it available to everyone else under thesame terms.
This content was accessible as of December 29, 2012, and it was downloaded then by Andy Schmitz(http://lardbucket.org) in an effort to preserve the availability of this book.
Normally, the author and publisher would be credited here. However, the publisher has asked for the customaryCreative Commons attribution to the original publisher, authors, title, and book URI to be removed. Additionally,per the publisher's request, their name has been removed in some passages. More information is available on thisproject's attribution page (http://2012books.lardbucket.org/attribution.html?utm_source=header).
For more information on the source of this book, or why it is available for free, please see the project's home page(http://2012books.lardbucket.org/). You can browse or download additional books there.
i
www.princexml.com
Prince - Non-commercial License
This document was created with Prince, a great way of getting web content onto paper.
Chapter 6
The Economics of Interest-Rate Spreads and Yield Curves
CHAPTER OBJECTIVES
By the end of this chapter, students should be able to:
1. Define the risk structure of interest rates and explain its importance.2. Explain flight to quality.3. Define the term structure of interest rates and explain its importance.4. Describe a yield curve and explain its economic meaning.
109
6.1 Interest-Rate Determinants I: The Risk Structure
LEARNING OBJECTIVE
1. What is the risk structure of interest rates and flight to quality, andwhat do they explain?
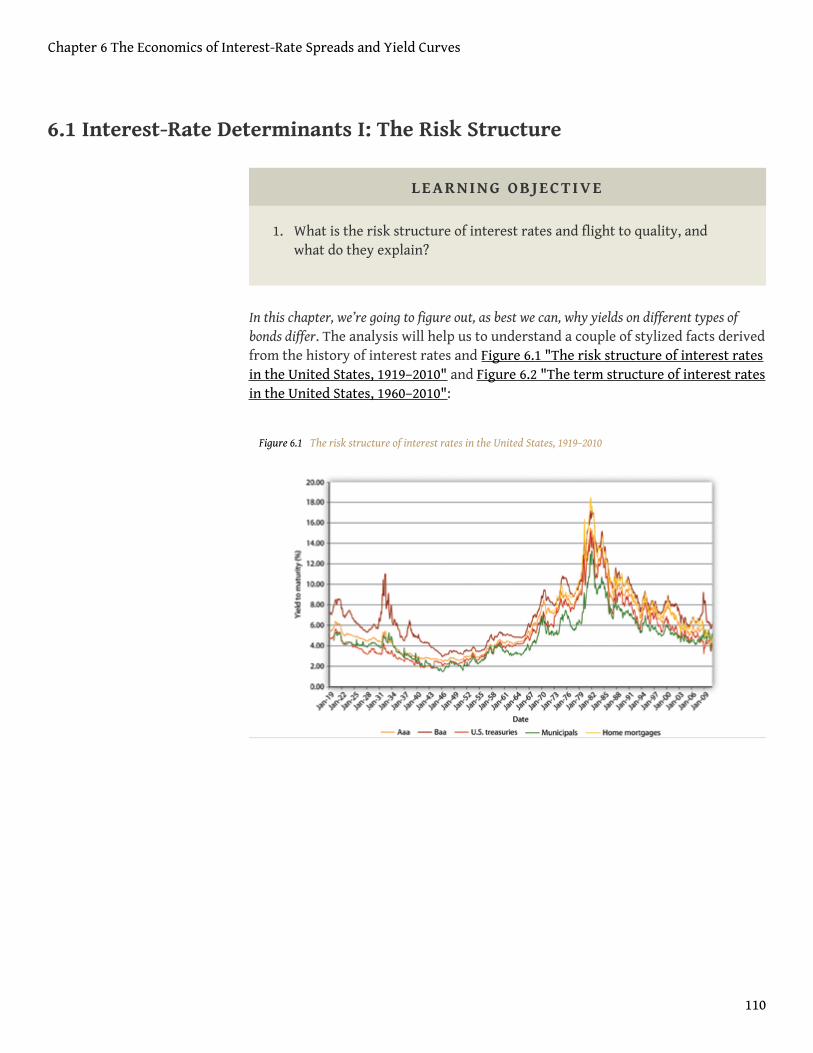
In this chapter, we’re going to figure out, as best we can, why yields on different types ofbonds differ. The analysis will help us to understand a couple of stylized facts derivedfrom the history of interest rates and Figure 6.1 "The risk structure of interest ratesin the United States, 1919–2010" and Figure 6.2 "The term structure of interest ratesin the United States, 1960–2010":
Figure 6.1 The risk structure of interest rates in the United States, 1919–2010
Chapter 6 The Economics of Interest-Rate Spreads and Yield Curves
110
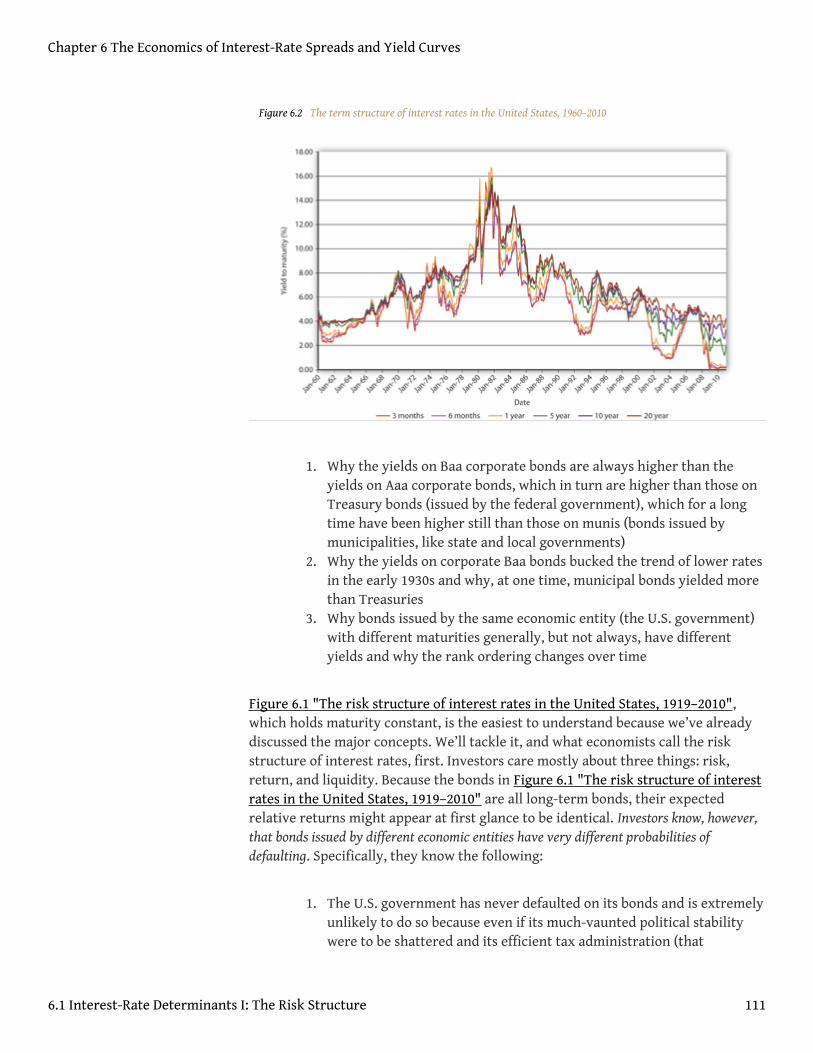
Figure 6.2 The term structure of interest rates in the United States, 1960–2010
1. Why the yields on Baa corporate bonds are always higher than theyields on Aaa corporate bonds, which in turn are higher than those onTreasury bonds (issued by the federal government), which for a longtime have been higher still than those on munis (bonds issued bymunicipalities, like state and local governments)
2. Why the yields on corporate Baa bonds bucked the trend of lower ratesin the early 1930s and why, at one time, municipal bonds yielded morethan Treasuries
3. Why bonds issued by the same economic entity (the U.S. government)with different maturities generally, but not always, have differentyields and why the rank ordering changes over time
Figure 6.1 "The risk structure of interest rates in the United States, 1919–2010",which holds maturity constant, is the easiest to understand because we’ve alreadydiscussed the major concepts. We’ll tackle it, and what economists call the riskstructure of interest rates, first. Investors care mostly about three things: risk,return, and liquidity. Because the bonds in Figure 6.1 "The risk structure of interestrates in the United States, 1919–2010" are all long-term bonds, their expectedrelative returns might appear at first glance to be identical. Investors know, however,that bonds issued by different economic entities have very different probabilities ofdefaulting. Specifically, they know the following:
1. The U.S. government has never defaulted on its bonds and is extremelyunlikely to do so because even if its much-vaunted political stabilitywere to be shattered and its efficient tax administration (that
Chapter 6 The Economics of Interest-Rate Spreads and Yield Curves
6.1 Interest-Rate Determinants I: The Risk Structure 111
wonderful institution, the Internal Revenue Service [IRS]) were tostumble, it could always meet its nominal obligations by creatingmoney. (That might create inflation, as it has at times in the past.Nevertheless, except for a special type of bond called TIPS, thegovernment and other bond issuers promise to pay a nominal value,not a real [inflation-adjusted] sum, so the government does nottechnically default when it pays its obligations by printing money.)
2. Municipalities have defaulted on their bonds in the past and could doso again in the future because, although they have the power to tax,they do not have the power to create money at will. (Although in thepast, most recently during the Great Depression, some issued money-like—let’s call them extralegal—bills of credit, or chits.) Nevertheless,the risk of default on municipal bonds (aka munis) is often quite low,especially for revenue bonds, upon which specific taxes and fees arepledged for interest payments.
3. Interest earned on munis is exempt from most forms of incometaxation, while interest earned on Treasuries and corporate bonds isfully taxable.
4. Corporations are more likely to default on their bonds thangovernments are because they must rely on business conditions andmanagement acumen. They have no power to tax and only a limitedability to create the less-liquid forms of money, a power that decreasesin proportion to their need! (I’m thinking of gift cards, decliningbalance debit cards, trade credit, and so forth.) Some corporations aremore likely to default on their bonds than others. Several credit-ratingagencies, including Moody’s and Standard and Poor’s, assess theprobability of default and assign grades to each bond. There is quite abit of grade inflation built in (the highest grade being not A or even A+but Aaa), the agencies are rife with conflicts of interest, and the marketusually senses problems before the agencies do. Nevertheless, bondratings are a standard proxy for default risk because, as Figure 6.3"Default rates on bonds rated by Moody’s from 1983 to 1999" shows,lower-rated bonds are indeed more likely to default than higher-ratedones. Like Treasuries, corporate bonds are fully taxable.
5. The most liquid bond markets are usually those for Treasuries. Theliquidity of corporate and municipal bonds is usually a function of thesize of the issuer and the amount of bonds outstanding. So the bonds ofthe state of New Jersey might be more liquid than those of a smallcorporation, but less liquid than the bonds of, say, General Electric.
Chapter 6 The Economics of Interest-Rate Spreads and Yield Curves
6.1 Interest-Rate Determinants I: The Risk Structure 112
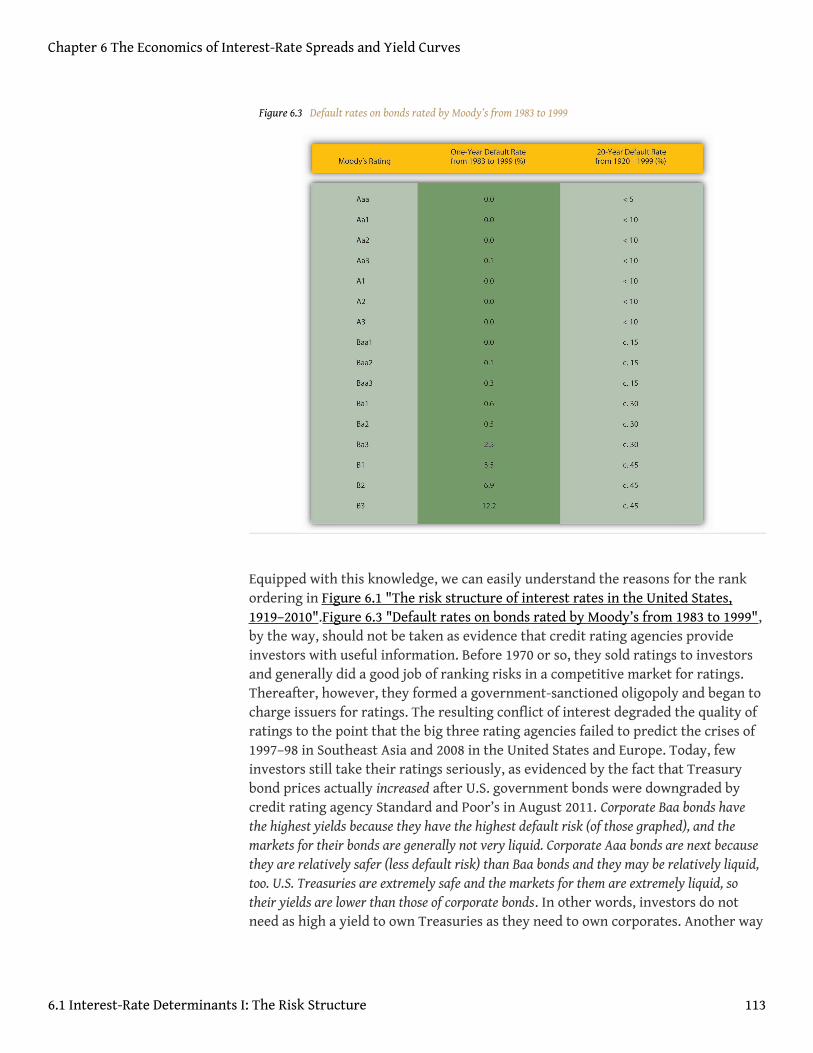
Figure 6.3 Default rates on bonds rated by Moody’s from 1983 to 1999
Equipped with this knowledge, we can easily understand the reasons for the rankordering in Figure 6.1 "The risk structure of interest rates in the United States,1919–2010".Figure 6.3 "Default rates on bonds rated by Moody’s from 1983 to 1999",by the way, should not be taken as evidence that credit rating agencies provideinvestors with useful information. Before 1970 or so, they sold ratings to investorsand generally did a good job of ranking risks in a competitive market for ratings.Thereafter, however, they formed a government-sanctioned oligopoly and began tocharge issuers for ratings. The resulting conflict of interest degraded the quality ofratings to the point that the big three rating agencies failed to predict the crises of1997–98 in Southeast Asia and 2008 in the United States and Europe. Today, fewinvestors still take their ratings seriously, as evidenced by the fact that Treasurybond prices actually increased after U.S. government bonds were downgraded bycredit rating agency Standard and Poor’s in August 2011. Corporate Baa bonds havethe highest yields because they have the highest default risk (of those graphed), and themarkets for their bonds are generally not very liquid. Corporate Aaa bonds are next becausethey are relatively safer (less default risk) than Baa bonds and they may be relatively liquid,too. U.S. Treasuries are extremely safe and the markets for them are extremely liquid, sotheir yields are lower than those of corporate bonds. In other words, investors do notneed as high a yield to own Treasuries as they need to own corporates. Another way
Chapter 6 The Economics of Interest-Rate Spreads and Yield Curves
6.1 Interest-Rate Determinants I: The Risk Structure 113
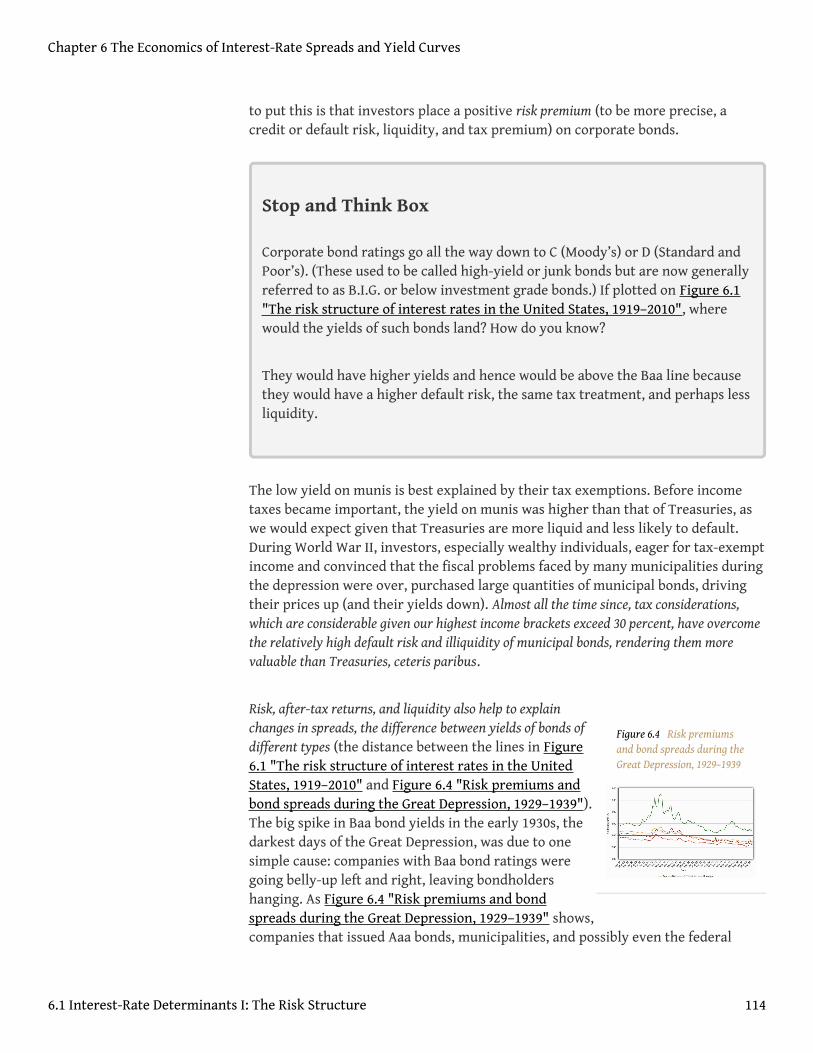
Figure 6.4 Risk premiumsand bond spreads during theGreat Depression, 1929–1939
to put this is that investors place a positive risk premium (to be more precise, acredit or default risk, liquidity, and tax premium) on corporate bonds.
Stop and Think Box
Corporate bond ratings go all the way down to C (Moody’s) or D (Standard andPoor’s). (These used to be called high-yield or junk bonds but are now generallyreferred to as B.I.G. or below investment grade bonds.) If plotted on Figure 6.1"The risk structure of interest rates in the United States, 1919–2010", wherewould the yields of such bonds land? How do you know?
They would have higher yields and hence would be above the Baa line becausethey would have a higher default risk, the same tax treatment, and perhaps lessliquidity.
The low yield on munis is best explained by their tax exemptions. Before incometaxes became important, the yield on munis was higher than that of Treasuries, aswe would expect given that Treasuries are more liquid and less likely to default.During World War II, investors, especially wealthy individuals, eager for tax-exemptincome and convinced that the fiscal problems faced by many municipalities duringthe depression were over, purchased large quantities of municipal bonds, drivingtheir prices up (and their yields down). Almost all the time since, tax considerations,which are considerable given our highest income brackets exceed 30 percent, have overcomethe relatively high default risk and illiquidity of municipal bonds, rendering them morevaluable than Treasuries, ceteris paribus.
Risk, after-tax returns, and liquidity also help to explainchanges in spreads, the difference between yields of bonds ofdifferent types (the distance between the lines in Figure6.1 "The risk structure of interest rates in the UnitedStates, 1919–2010" and Figure 6.4 "Risk premiums andbond spreads during the Great Depression, 1929–1939").The big spike in Baa bond yields in the early 1930s, thedarkest days of the Great Depression, was due to onesimple cause: companies with Baa bond ratings weregoing belly-up left and right, leaving bondholdershanging. As Figure 6.4 "Risk premiums and bondspreads during the Great Depression, 1929–1939" shows,companies that issued Aaa bonds, municipalities, and possibly even the federal
Chapter 6 The Economics of Interest-Rate Spreads and Yield Curves
6.1 Interest-Rate Determinants I: The Risk Structure 114
government were also more likely to default in that desperate period, but they werenot nearly as likely to as weaker companies. Yields on their bonds thereforeincreased, but only a little, so the spread between Baa corporates and other bondsincreased considerably in those troubled years. In better times, the spreadsnarrowed, only to widen again during the so-called Roosevelt Recession of1937–1938.
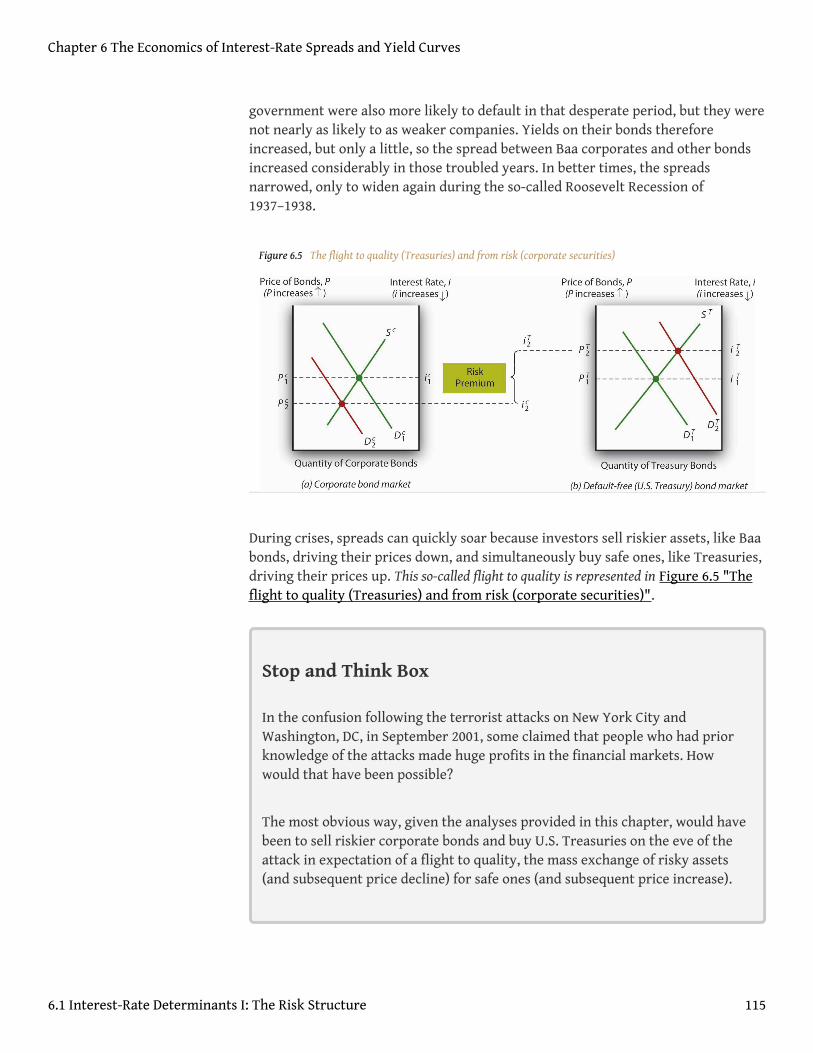
Figure 6.5 The flight to quality (Treasuries) and from risk (corporate securities)
During crises, spreads can quickly soar because investors sell riskier assets, like Baabonds, driving their prices down, and simultaneously buy safe ones, like Treasuries,driving their prices up. This so-called flight to quality is represented in Figure 6.5 "Theflight to quality (Treasuries) and from risk (corporate securities)".
Stop and Think Box
In the confusion following the terrorist attacks on New York City andWashington, DC, in September 2001, some claimed that people who had priorknowledge of the attacks made huge profits in the financial markets. Howwould that have been possible?
The most obvious way, given the analyses provided in this chapter, would havebeen to sell riskier corporate bonds and buy U.S. Treasuries on the eve of theattack in expectation of a flight to quality, the mass exchange of risky assets(and subsequent price decline) for safe ones (and subsequent price increase).
Chapter 6 The Economics of Interest-Rate Spreads and Yield Curves
6.1 Interest-Rate Determinants I: The Risk Structure 115
Time for a check of your knowledge.
EXERCISES
1. What would happen to the spreads between different types of bonds ifthe federal government made Treasuries tax-exempt and at the sametime raised income taxes considerably?
2. If the Supreme Court unexpectedly declared a major source of municipalgovernment tax revenue illegal, what would happen to municipal bondyields?
3. If several important bond brokers reduced the brokerage fee theycharge for trading Baa corporate bonds (while keeping their fees forother bonds the same), what would happen to bond spreads?
4. What happened to bond spreads when Enron, a major corporation,collapsed in December 2001?
KEY TAKEAWAYS
• The risk structure of interest rates explains why bonds of the samematurity but issued by different economic entities have different yields(interest rates).
• The three major risks are default, liquidity, and after-tax return.• By concentrating on the three major risks, you can ascertain why some
bonds are more (less) valuable than others, holding their term(repayment date) constant.
• You can also post-dict, if not outright predict, the changes in rank orderas well as the spread (or difference in yield) between different types ofbonds.
• A flight to quality occurs during a crisis when investors sell risky assets(like below-investment-grade bonds) and buy safe ones (like Treasurybonds or gold).
Chapter 6 The Economics of Interest-Rate Spreads and Yield Curves
6.1 Interest-Rate Determinants I: The Risk Structure 116
6.2 The Determinants of Interest Rates II: The Term Structure
LEARNING OBJECTIVE
1. What is the term structure of interest rates and the yield curve, andwhat do they explain?
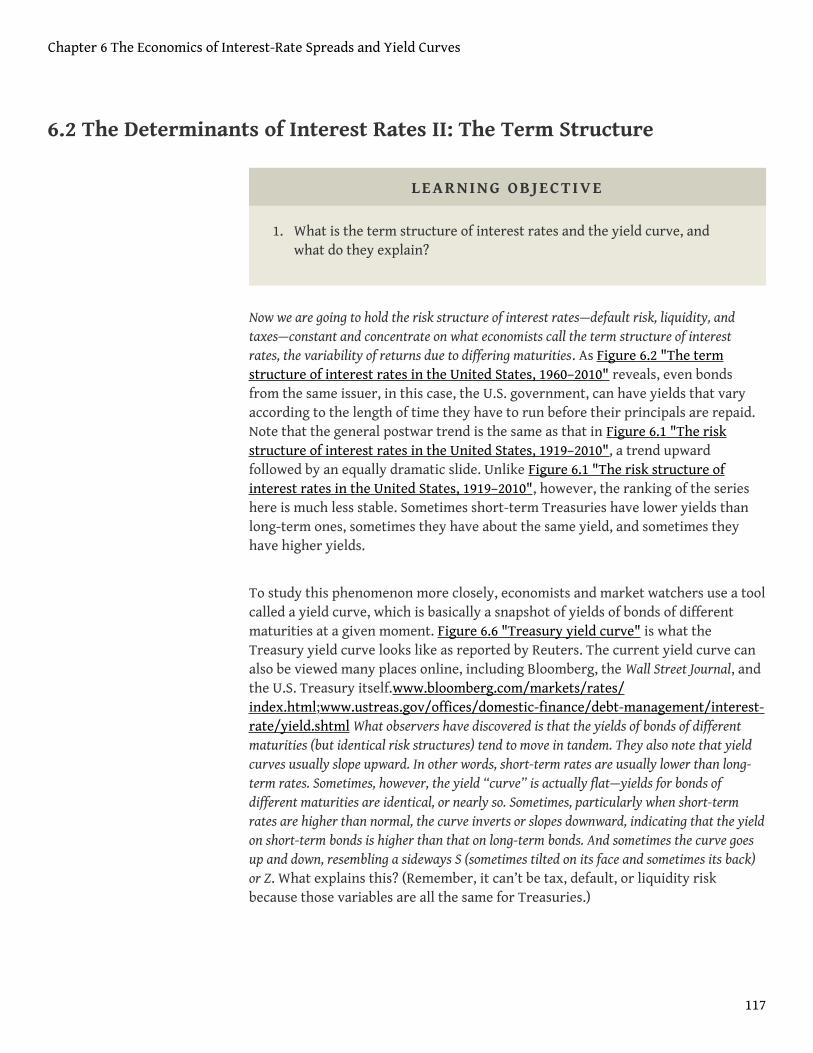
Now we are going to hold the risk structure of interest rates—default risk, liquidity, andtaxes—constant and concentrate on what economists call the term structure of interestrates, the variability of returns due to differing maturities. As Figure 6.2 "The termstructure of interest rates in the United States, 1960–2010" reveals, even bondsfrom the same issuer, in this case, the U.S. government, can have yields that varyaccording to the length of time they have to run before their principals are repaid.Note that the general postwar trend is the same as that in Figure 6.1 "The riskstructure of interest rates in the United States, 1919–2010", a trend upwardfollowed by an equally dramatic slide. Unlike Figure 6.1 "The risk structure ofinterest rates in the United States, 1919–2010", however, the ranking of the serieshere is much less stable. Sometimes short-term Treasuries have lower yields thanlong-term ones, sometimes they have about the same yield, and sometimes theyhave higher yields.
To study this phenomenon more closely, economists and market watchers use a toolcalled a yield curve, which is basically a snapshot of yields of bonds of differentmaturities at a given moment. Figure 6.6 "Treasury yield curve" is what theTreasury yield curve looks like as reported by Reuters. The current yield curve canalso be viewed many places online, including Bloomberg, the Wall Street Journal, andthe U.S. Treasury itself.www.bloomberg.com/markets/rates/index.html;www.ustreas.gov/offices/domestic-finance/debt-management/interest-rate/yield.shtml What observers have discovered is that the yields of bonds of differentmaturities (but identical risk structures) tend to move in tandem. They also note that yieldcurves usually slope upward. In other words, short-term rates are usually lower than long-term rates. Sometimes, however, the yield “curve” is actually flat—yields for bonds ofdifferent maturities are identical, or nearly so. Sometimes, particularly when short-termrates are higher than normal, the curve inverts or slopes downward, indicating that the yieldon short-term bonds is higher than that on long-term bonds. And sometimes the curve goesup and down, resembling a sideways S (sometimes tilted on its face and sometimes its back)or Z. What explains this? (Remember, it can’t be tax, default, or liquidity riskbecause those variables are all the same for Treasuries.)
Chapter 6 The Economics of Interest-Rate Spreads and Yield Curves
117
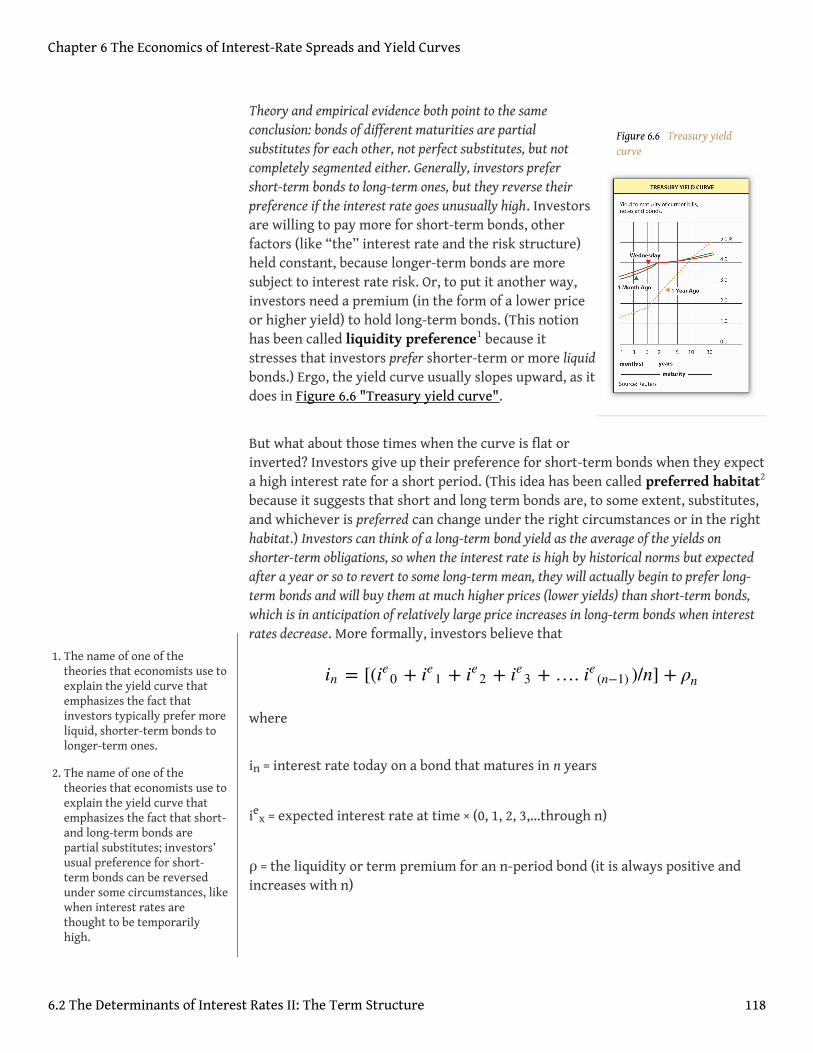
Figure 6.6 Treasury yieldcurve
Theory and empirical evidence both point to the sameconclusion: bonds of different maturities are partialsubstitutes for each other, not perfect substitutes, but notcompletely segmented either. Generally, investors prefershort-term bonds to long-term ones, but they reverse theirpreference if the interest rate goes unusually high. Investorsare willing to pay more for short-term bonds, otherfactors (like “the” interest rate and the risk structure)held constant, because longer-term bonds are moresubject to interest rate risk. Or, to put it another way,investors need a premium (in the form of a lower priceor higher yield) to hold long-term bonds. (This notionhas been called liquidity preference1 because itstresses that investors prefer shorter-term or more liquidbonds.) Ergo, the yield curve usually slopes upward, as itdoes in Figure 6.6 "Treasury yield curve".
But what about those times when the curve is flat orinverted? Investors give up their preference for short-term bonds when they expecta high interest rate for a short period. (This idea has been called preferred habitat2
because it suggests that short and long term bonds are, to some extent, substitutes,and whichever is preferred can change under the right circumstances or in the righthabitat.) Investors can think of a long-term bond yield as the average of the yields onshorter-term obligations, so when the interest rate is high by historical norms but expectedafter a year or so to revert to some long-term mean, they will actually begin to prefer long-term bonds and will buy them at much higher prices (lower yields) than short-term bonds,which is in anticipation of relatively large price increases in long-term bonds when interestrates decrease. More formally, investors believe that
where
in = interest rate today on a bond that matures in n years
iex = expected interest rate at time × (0, 1, 2, 3,…through n)
ρ = the liquidity or term premium for an n-period bond (it is always positive andincreases with n)
in = [(ie0 + ie1 + ie2 + ie3 + …. ie (n−1) )/n] + ρn
1. The name of one of thetheories that economists use toexplain the yield curve thatemphasizes the fact thatinvestors typically prefer moreliquid, shorter-term bonds tolonger-term ones.
2. The name of one of thetheories that economists use toexplain the yield curve thatemphasizes the fact that short-and long-term bonds arepartial substitutes; investors’usual preference for short-term bonds can be reversedunder some circumstances, likewhen interest rates arethought to be temporarilyhigh.
Chapter 6 The Economics of Interest-Rate Spreads and Yield Curves
6.2 The Determinants of Interest Rates II: The Term Structure 118
So the yield today of a bond with 5 years to maturity, if the liquidity premium is .5percent and the expected interest rate each year is 4, is 4.5:
i5 = (4 + 4 + 4 + 4 + 4)/5 + .5 = 20/5 + .5 = 4.5, implying an upward sloping yield curve
because 4 < 4.5.
If the interest rate is expected to rise over the next 5 years, the yield curve slopesupward yet more steeply:
i5 = (4 + 5 + 6 + 7 + 8)/5 + .5 = 30/5 + .5 = 6.5, again implying an upward sloping curve
because 4 < 6.5.
If, on the other hand, interest rates are expected to fall over the next 5 years, theyield curve will slope downward, as in this example:
i5 = (12 + 10 + 8 + 5 + 5)/5 + .5 = 40/5 + .5 = 8.5, implying an inverted yield curve
because 12 > 8.5.
Investors may also realize that long-term bonds will increase in price when interestrates fall (as they are expected to do in this example and as we learned in Chapter 3"Money"), so they are willing to pay more for them now.
Chapter 6 The Economics of Interest-Rate Spreads and Yield Curves
6.2 The Determinants of Interest Rates II: The Term Structure 119

Stop and Think Box
In the nineteenth century, the yield curve was usually flat under normalconditions. (It inverted during financial panics.) In other words, short-term andlong-term bonds issued by the same economic entity did not often differ muchin price. Why might that have been?
One possibility is that there was no liquidity premium then. Then, as now,short-term bonds suffered less interest rate risk than long-term bonds, butinvestors often complained of extremely high levels of reinvestment risk, oftheir inability to easily and cheaply reinvest the principal of bonds andmortgages when they were repaid. Often, lenders urged good borrowers not torepay (but to continue to service their obligations, of course). Another notmutually exclusive possibility is that the long-term price level stabilityengendered by the specie standard made the interest rate less volatile. Theexpectation was that the interest rate would not long stray from its long-termtendency.
The neat thing about this theory is that it reveals the yield curve as the market’s predictionof future short-term interest rates, making it, by extension, an economic forecasting tool.Where the curve slopes sharply upward, the market expects future short-terminterest rates to rise. Where it slopes slightly upward, the market expects futureshort-term rates to remain the same. Where the curve is flat, rates, it is thought,will fall moderately in the future. Inversion of the curve means short-term interestrates should fall sharply, as in the numerical example above. The simplest way toremember this is to realize that the prediction equals the yield curve minus ρn, the term
premium.
Empirical research suggests that the yield curve is a good predictor of future interest rates inthe very short term, the next few months, and the long term, but not in between. Part of thedifficulty is that ρn is not well understood nor is it easily observable. It may change
over time and/or not increase much from one maturity to the next on the short endof the curve. Nevertheless, economic forecasters use the yield curve to makepredictions about inflation and the business cycle. A flat or inverted curve, forinstance, portends lower short-term interest rates in the future, which is consistentwith a recession but also with lower inflation rates, as we learned in Chapter 5 "TheEconomics of Interest-Rate Fluctuations". A curve sloped steeply upward, bycontrast, portends higher future interest rates, which might be brought about by anincrease in inflation rates or an economic boom.
Chapter 6 The Economics of Interest-Rate Spreads and Yield Curves
6.2 The Determinants of Interest Rates II: The Term Structure 120

Time once again to ensure that we’re on the same page, er, Web site.
Chapter 6 The Economics of Interest-Rate Spreads and Yield Curves
6.2 The Determinants of Interest Rates II: The Term Structure 121
EXERCISES
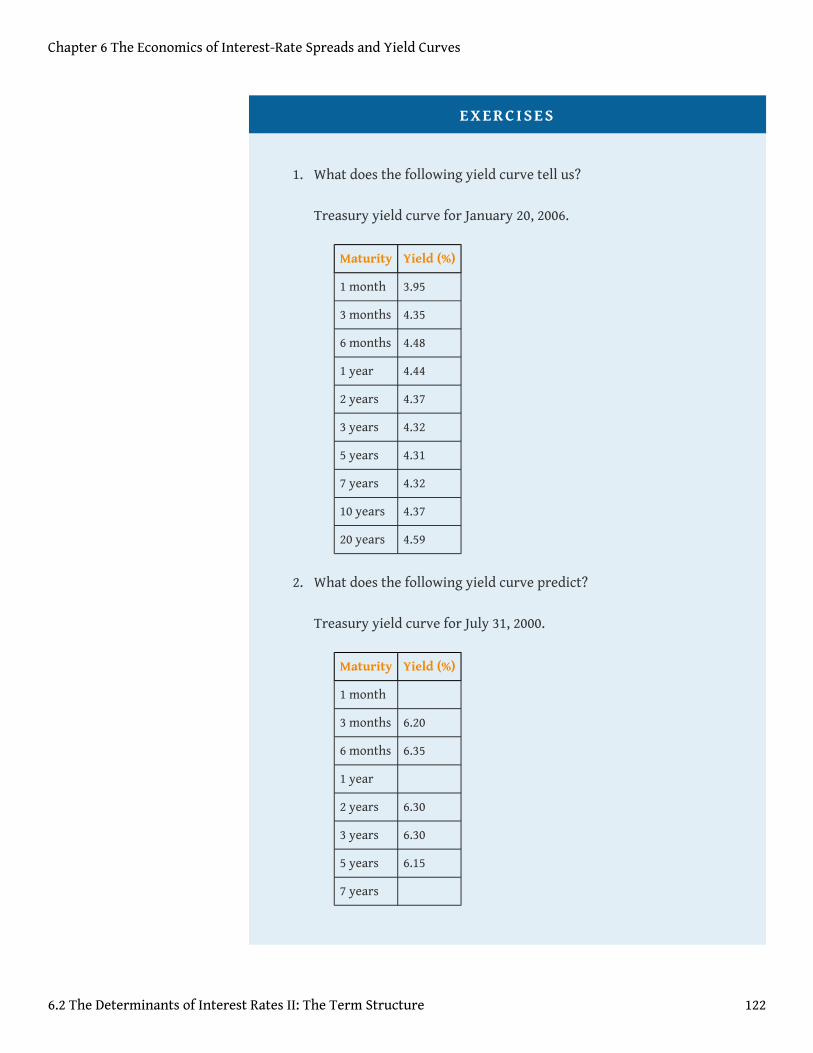
1. What does the following yield curve tell us?
Treasury yield curve for January 20, 2006.
Maturity Yield (%)
1 month 3.95
3 months 4.35
6 months 4.48
1 year 4.44
2 years 4.37
3 years 4.32
5 years 4.31
7 years 4.32
10 years 4.37
20 years 4.59
2. What does the following yield curve predict?
Treasury yield curve for July 31, 2000.
Maturity Yield (%)
1 month
3 months 6.20
6 months 6.35
1 year
2 years 6.30
3 years 6.30
5 years 6.15
7 years
Chapter 6 The Economics of Interest-Rate Spreads and Yield Curves
6.2 The Determinants of Interest Rates II: The Term Structure 122
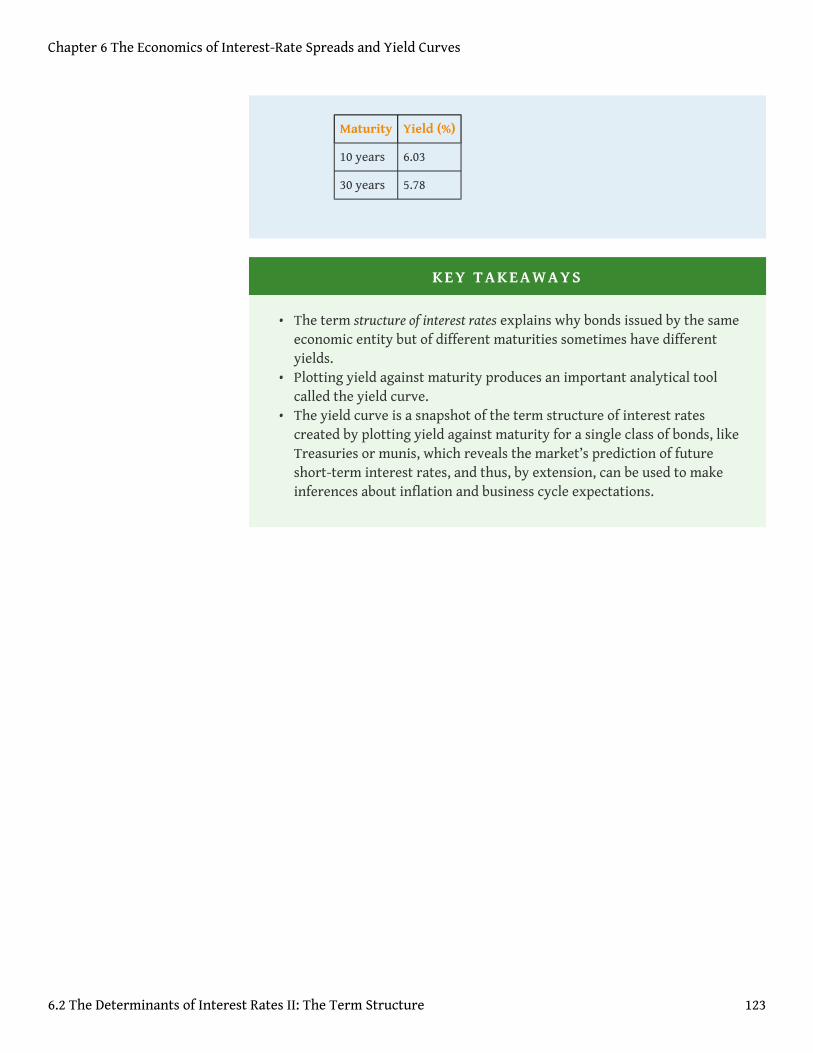
Maturity Yield (%)
10 years 6.03
30 years 5.78
KEY TAKEAWAYS
• The term structure of interest rates explains why bonds issued by the sameeconomic entity but of different maturities sometimes have differentyields.
• Plotting yield against maturity produces an important analytical toolcalled the yield curve.
• The yield curve is a snapshot of the term structure of interest ratescreated by plotting yield against maturity for a single class of bonds, likeTreasuries or munis, which reveals the market’s prediction of futureshort-term interest rates, and thus, by extension, can be used to makeinferences about inflation and business cycle expectations.
Chapter 6 The Economics of Interest-Rate Spreads and Yield Curves
6.2 The Determinants of Interest Rates II: The Term Structure 123

6.3 Suggested Reading
Choudry, Moorad. Analysing and Interpreting the Yield Curve. Hoboken, NJ: John Wileyand Sons, 2004.
Fabozzi, Frank. Interest Rate, Term Structure, and Valuation Modeling. Hoboken, NJ:John Wiley and Sons, 2002.
Fabozzi, Frank, Steven Mann, and Moorad Choudry. Measuring and Controlling InterestRate and Credit Risk. Hoboken, NJ: John Wiley and Sons, 2003.
Homer, Sidney, and Richard E. Sylla. A History of Interest Rates, 4th ed. Hoboken, NJ:John Wiley and Sons, 2005.
Chapter 6 The Economics of Interest-Rate Spreads and Yield Curves
124