The Economics and Potential Protectionism of Food...
43
The Economics and Potential Protectionism of Food Safety Standards and Inspections: An Application to the U.S. Shrimp Market John Beghin Anne-Celia Disdier Stephan Marette January 2013 IATRC Working Paper #13-01 Working Paper
-
Upload
nguyenxuyen -
Category
Documents
-
view
216 -
download
3
Transcript of The Economics and Potential Protectionism of Food...

The Economics and Potential Protectionism of Food Safety Standards and Inspections: An Application to the U.S. Shrimp Market
John Beghin Anne-Celia Disdier Stephan Marette
January 2013 IATRC
Working Paper #13-01
Working Paper

International Agricultural Trade Research Consortium
The Economics and Potential Protectionism of Food Safety Standards
and Inspections: An Application to the U.S. Shrimp Market
John Beghin (Iowa State University) Anne-Celia Disdier (Paris School of Economics-INRA)
Stephan Marette (INRA)*
Working Paper #13-01 The International Agricultural Trade Research Consortium is an informal association of University and Government economists interested in agricultural trade. Its purpose is to foster interaction, improve research capacity and to focus on relevant trade policy issues. It is supported by United States Department of Agriculture (ERS, and FAS), Agriculture and Agri-Food Canada and the participating institutions. The IATRC Working Paper series provides members an opportunity to circulate their work at the advanced draft stage through limited distribution within the research and analysis community. The IATRC takes no political positions or responsibility for the accuracy of the data or validity of the conclusions presented by working paper authors. Further, policy recommendations and opinions expressed by the authors do not necessarily reflect those of the IATRC or its funding agencies. For a copy of this paper and a complete list of IATRC Working Papers, books, and other publications, see the IATRC Web Site http://www.iatrc.org A copy of this paper can be viewed/printed from the IATRC Web Site indicated above. *Shared senior authorship. John Beghin, Iowa State University <[email protected]> Anne-Celia Disdier, Paris School of Economics-INRA Stephan Marette, INRA Correspondence regarding this paper should be addressed to the authors.
January 2013
ISSN 1098-9210 IATRC
Working Paper #13-01

The Economics and Potential Protectionism of Food Safety Standards and Inspections: An Application to the U.S. Shrimp Market
John Beghin (Iowa State University)
Anne-Celia Disdier (Paris School of Economics-INRA)
Stephan Marette* (INRA)
This version: June 26, 2012
Running head: Economics and Protectionism of Food Safety Standards and Inspections
Abstract: We formally investigate the effects of an inspection system influencing safety of foreign and domestic food products in the domestic market. Consumers purchase domestic and imported food and value safety. Potential protectionism à la Fisher and Serra (2000) can arise: inspection frequency imposed on foreign producers set by a domestic social planner would be higher than the corresponding policy set by a global social planner treating all producers as domestic. The domestic social planner tends to impose most if not all of the inspection on foreign producers, which improves food safety for consumers and limits the production loss for domestic producers. Despite this protectionist component, inspections address a potential consumption externality such as health hazard in the domestic country when unsafe food can enter the country undetected. We then calibrate the analytical framework to the U.S. shrimp market incorporating key stylized facts of this market. Identifying protectionist inspection requires much information on inspection, safety, damages, and costs. We also investigate how to finance the inspection policy from a social-planner perspective. Financing instruments differ between the domestic and international welfare-maximizing objectives. Keywords: Food safety, non-tariff measures, inspection, protectionism, HACCP, seafood, shrimp. JEL code: Q17, Q18, Q22, F14
* Shared senior authorship. We thank Arik Levinson, Jeff Perloff, Josh Graff Zivin, and participants at the NBER Agricultural Economics Conference (March 2010) for comments on an earlier version of the chapter. The usual disclaimer applies.

2
Introduction
This chapter formally explores the potential protectionism and effects of an inspection system to
enforce a food safety standard on domestic and foreign producers. The chapter delineates the role
of inspection as discriminatory trade barrier through foreign producers’ difficulties to enter a
market but also their legitimate role to internalize potential external effects from risk of illness.
Food safety regulations are a contentious issue in the context of North-South trade with
contrasting views on safety regulations either as a barrier (Henson and Loader, 2001; Otsuki,
Wilson and Sewadeh, 2001a and 2001b; Wilson and Otsuki, 2004) or catalyst driven by
consumer concerns (Anders and Caswell, 2009; Jaffee and Henson, 2005). Most of these
analyses have focused on standards rather than inspections. Inspections turn standards into
implemented standards and determine the effective quality available on the market. Different
inspection levels at the border and in domestic plants allow to effectively discriminate between
foreign and domestic food producers and to impose differentiated implemented standard via
different inspection rates even though the “official” uniform food standard applies to all
producers. We focus on the economics of these inspections and analyze their role in trade as
protectionist barrier but also as a way to internalize external health effects on consumers.
Identifying protectionist inspections is more daunting than one would presume in presence of
asymmetric safety levels between foreign and domestic firms.
We assume that a social planner chooses an optimum inspection level to enforce food
safety that maximizes domestic welfare (surplus of consumers and domestic producers net of
potential health externalities). The standard itself is assumed to have been fixed at a safe level,
that is, at which no sickness or negative external effect occurs. Potential protectionism à la Fisher
and Serra (2000) arises: inspection frequency imposed on foreign producers set by a domestic
social planner would be higher than the corresponding policies set by a global planner treating all

3
producers as domestic.
The domestic social planner tends to impose the total or a large part of the inspection on
foreign producers to shift cost abroad. Food safety improves (especially for imported food), and
domestic producers’ losses are limited. Despite this protectionist component, the inspection
addresses a consumption externality such as health hazard in the domestic country when unsafe
food can enter the country undetected.
The chapter then applies the conceptual framework to the American seafood market and
more specifically to shrimp. The United States (U.S.) is a significant producer and importer of
seafood products. Seafood imports are seldom inspected at the border, raising the issue of unsafe
food being imported. Cases of contaminated and unsafe seafood imports have been reported
despite extensive food safety standards in existence (Southern Shrimp Alliance, 2007; U.S.
Government Accountability Office – GAO, 2001, 2004, and 2009). When inspections occur,
they often reveal imported products failing U.S. food safety standards (GAO, 2001 and 2004).
Safety problems also affect domestic production, where many products are not processed
following existing food safety regulation (GAO, 2001 and 2004). Hence, our set-up and
approach fully apply to the U.S. seafood market with its safety standards and inspections at the
border and in domestic plants.
Using recent econometric estimates of consumer and producer price responses, cost of
production data, and information on the cost of meeting food safety standards for seafood
exporting countries, we calibrate a partial equilibrium model of the U.S. shrimp market including
imports to derive the socially optimum inspection levels conditioned on a food safety standard.
Consumers in the U.S. and other advanced countries have repeatedly expressed their willingness
to pay for better and safer seafood products in the market place and in laboratory experiments.
We show that even though the optimal policy is protectionist (as defined in the previous

4
paragraph), it is optimal for an importing country to impose differential implemented standards
via tighter inspections on foreign producers.
We also determine the optimum way to finance the inspection policy from a social-
planner’s perspective. Financing instruments are different under the domestic welfare-
maximizing objective as opposed to the case of the international welfare- maximizing objective
inclusive of foreign profits.
Related literature
The results of this chapter differ from the previous literature on standards and protectionism
(Fisher and Serra, 2000; Marette and Beghin, 2010) by focusing on inspections to implement
discriminatory effective standards, rather than the standard itself. We also depart from the
existing literature on borders inspection, by providing a complete welfare analysis with both
conceptual and empirical contributions. From an empirical point of view, the results of this study
contribute to the literature on food safety inspection by providing a complete welfare analysis
with calibrated estimations. Previous papers by Mayer, Nickerson and Owan (2004), Starbird
(2005, 2007), and Starbird and Amanor-Boadu (2006) restricted their analyses to the supply
chain organization and the determination of inspection policy without explicitly considering
consumers’ welfare.
In addition, our results extend the literature on how to finance inspections to an open-
economy context. In particular, Crespi and Marette (2001) study different types of financing
instruments without considering trade issues with foreign producers. We show the consequences
of considering foreign welfare rather than just domestic welfare on financing options.
Regarding the shrimp market, our approach differs from previous seafood studies which
focus only on the ex post evaluation of past measures and imports (Cato and Lima dos Santos,

5
1998; Debaere, 2005; Anders and Caswell, 2009, among others). Our analysis evaluates future
potential, i.e. ex ante, policy with a simulation integrating welfare measure, market
imperfections, and consumers’ valuation of food safety attributes, which can assist decision
makers and inform the public policy debate. Our analysis follows the approach proposed by
Beghin et al. in chapter 1 but with the added focus on inspection rather than the standard itself.
Among the ex post analyzes of food safety issues with seafood imports, Anders and
Caswell (2009) evaluate the trade impact of the 1997 Hazard Analysis and Critical Control Point
regulation (HACCP) on U.S. seafood imports. They use a gravity model and panel data for 1990-
2004 and 33 seafood exporters. Results show a negative and significant effect of the HACCP’s
introduction on aggregate U.S. seafood imports but with a composition effect penalizing
developing countries’ products and favouring developed countries’ exports. Further, country-
level analysis shows that the introduction of HACCP had a positive impact on exports of larger
seafood exporters and a negative one on exports of small exporters, independently of the
development level of a country. A similar gravity equation investigation of French seafood
imports by Peridy, Guillotreau, and Bernard (2000) shows a significantly small impact (elasticity
of −0.092) of trade barriers on aggregate seafood imports for the period 1988-1994.
Cato and Lima dos Santos (1998) suggest that the 1997 European ban on shrimp imports
originating from Bangladesh pushed the same shrimps to be exported to Japan and the United
States, raising the issue of differential standards and inspection levels across importing countries.
More recently, Nguyen and Wilson (2009) estimate a panel gravity model on U.S., European,
and Japanese imports of seafood products. The trade impact of food safety standards is negative
and significant but differentiated across seafood products. Shrimps appear to be the most
sensitive to changing food safety policies, while fish is the least sensitive.
Using data on shrimp trade, Debaere (2005) empirically investigates the effect of trade

6
policy on international prices and countries’ welfare. He shows that European Union (EU) trade
policy (especially strict standards on antibiotic residues compared to the ones applied by the
U.S.) significantly impacted the world shrimp market and shifted exports away from Europe
towards the U.S. in the late 1990s and early 2000s with the added consequence of depressing
U.S. prices for shrimp.
Hudson, Hite, Jaffar and Kari (2003) examine ex ante the effects of a potential ban on
shrimp imports by the United States from countries non-complying with the Turtle Excluder
Device system. They estimate a linear expenditure system to obtain the own-price elasticity of
demand for shrimp imports. They find that such a ban will generate a welfare loss for U.S.
consumers. The magnitude of the effect will depend on whether lost imports from banned
countries are reallocated to other countries.
Alberini, Lichtenberg, Mancini and Galinato (2008) propose a theoretical model of
enforcement and compliance in a regulatory environment similar to the one created by HACCP
in the seafood industry. Predictions on optimal Food and Drug Administration (FDA) monitoring
strategy and firms’ compliance efforts are derived. Using FDA seafood inspection data, the
authors show that, contrary to the predictions of the model, FDA inspections are based on
product risk but not on past compliance. On the other hand, firms’ compliance efforts do not
increase with the threat of an inspection.
Lastly, Disdier and Marette (2010) combine the results of a gravity equation with a
partial equilibrium model to determine the welfare impact of a standard capping residues of
chloramphenicol, a toxic antibiotic. Their empirical analysis of crustacean imports in the U.S.,
EU, Canada and Japan suggests that both trade and welfare effects do not necessarily go in the
same direction. However, they do not investigate the issue of inspections.

7
Background on seafood inspections by the FDA
Food safety in many advanced countries, including the U.S., is implemented through HACCP, a
preventive approach to food safety. This approach imposes food safety standards at critical
junctures of food processing susceptible of contamination and health hazards to reduce health
risk. The standard enforcement and the suppliers’ compliance directly depend on the inspection
policy.
The U.S. HACCP program for seafood is managed by the U.S. FDA. The FDA is
supposed to inspect plants and products to make sure that they meet health standards included in
and implied by the HACCP system. HACCP was initiated in 1997. The program has been
repeatedly criticized as insufficient (GAO, 2001 and 2004). Several papers analyze FDA’s
seafood inspections, detentions and refusal decisions for products not meeting standards
(Ababouch, Gandini and Ryder, 2005; Allshouse, Buzby, Harvey and Zorn, 2003; Buzby,
Unnevehr and Roberts, 2008). Allshouse et al. (2003) provide the most detailed description.
There are two types of detentions: “Regular” detentions of shipments for which physical analysis
shows that FDA standards are violated, and detentions without physical analysis. The latter are
based on past history and/or other information leading to the resumption that the product (and
further shipments) may not meet standard. In this case, the shipper or importer should prove that
the product satisfies FDA standards.
These investigations convey some key stylized facts. The FDA inspects only a small
percentage of imports. Detentions occur seldom. On average, from 1999 to 2001, less than 1% of
shipments were detained, and 78% of detained shipments were eventually released for import
into the U.S. Detentions for fishery/seafood represented 27% of total FDA import detentions (2nd
behind vegetables). The major reasons for seafood detentions were (i) adulteration (safety,
packaging, sanitary problems – 83.6% of violations), and (ii) misbranding (untruthful or missing

8
labelling – 14.3% of violations). Among exporters, 80 out of 130 exporting countries had
violations for adulteration. The number of detentions (for adulteration) per U.S. dollar (USD) of
import value is low (0.46 detention per USD 1 million of imports). The top three countries in
terms of number of violations for adulteration in 2001 were Vietnam, Thailand, and Indonesia.
Salmonella was the most common violation for adulteration (34% of the cases). Shrimp and
prawns accounted for more than 25% of the detentions for adulteration.
Buzby et al. (2008) provide some statistics of U.S. import refusals from 1998 to 2004
using data from FDA Import Refusal Reports. They reach similar conclusions as the
investigations of detention data did. More interestingly, Buzby et al. (2008) describe import
alerts. They can be informational or can call for intensified surveillance of a particular food
product from a particular exporter but can also place an exporter/product on detention without
physical examination. Shipments are refused entry into the U.S., unless the exporter provides
evidence (such as test results) to the FDA that its product meets FDA standards. These facts
suggest that import inspections and refusals are not a result of a random sampling of imports but
rather of some kind of Bayesian process. The U.S. policy initially involves random sampling at
the border. Importers with a previous nonconformity record are supposed to be classified into the
Automatic Detention List, with their next five consecutive shipments subject to inspection. If
requirements are satisfied by the 5 shipments, the importer is moved back to the random
sampling list. In reality, inspections may not work as described above (Alberini et al., 2008;
GAO, 2001 and 2004).
GAO (2001, and 2004) found a myriad of problems with the HACCP program
implemented since 1997 by the FDA. With imported products, the FDA does not have
equivalence or compliance agreements with any exporting country. U.S. importers are required
but not able to demonstrate that imported seafood is produced in accordance with the U.S.

9
HACCP regulation. When the FDA identifies problems in inspected foreign seafood firms it does
not follow up with automatic detention and inspection of products. Few inspections take place:
In 1999, less than 1% of imported seafood was subject to laboratory examination. Regarding
domestic production, many seafood products are not processed under HACCP because the FDA
cannot identify all seafood-processing firms (no registry exists); only the subset of the
commercial fishing fleet processing fish on board is subject to HACCP requirements. About 1/3
of seafood products are not required to have a HACCP plan because seafood firms can
determine, with FDA acquiescing, that food safety hazards are unlikely. When firms have a
HACCP plan, more than half of FDA inspections found violations and the FDA did not issue
warning letters in a timely manner. Finally, the FDA does not have objective data to assess the
effectiveness of HACCP.
U.S. consumers have recently expressed concerns about FDA inspections. In a recent
survey realised by Consumer Reports, two-thirds of respondents said “the FDA should inspect
domestic and foreign food-processing facilities at least once a month, more in line with meat
inspection practices by USDA” (Consumer Reports, 2008, p.1). While this fact clearly indicates
a strong concern by U.S. consumers, no details are given about the willingness to pay (WTP)
elicitation or the way to finance such an ambitious inspection program. This void explains why
we pay attention to financing aspects.
Externality and health cost
The externality is twofold. First, there is health risk exposure associated with consuming unsafe
food, which is not internalized or known by the consumers. A major concern in that regard is the
presence of bacteria (such as salmonella, E-coli, or Listeria monocytogenes) and the widespread
use of chemical products and antibiotics to address this sanitary problem. In developing

10
countries, seafood producers often use chloramphenicol to fight against bacteria, which leads to
traceable residues in consumer products. There is a well established link between aplastic
anemia, carcinogenicity, reproductive toxicity, and exposure to chloramphenicol. The science
has not established a threshold for low levels of exposure to chloramphenicol. The use of
chloramphenicol mitigates unsafe production but provides another risk of its own.
The second externality is the potential development of bacterial resistance to antibiotics
associated with excessive use of antibiotics in seafood farms (Duran and Marshall, 2005). The
link of chloramphenicol to antibiotic resistance is tedious (World Health Organization, 2001).
Although the science is still being established, a precautionary principle would be legitimate.
Consumers have expressed their WTP for safer food and avoid bacteria such as
salmonella (Hayes, Shogren, Shin and Kliebenstein, 1995). Roheim Wessells and Anderson
(1995) undertake an experimental study to elicit the WTP of Rhode-Island consumers for various
seafood safety inspection and assurance programs using contingent valuation methods. Ten
safety alternatives were considered. Respondents value specific information the most, such as
date caught, catch site, and temperature since caught. The most valued characteristic was date
caught valued at 47 cents above the price of USD 4.5 per pound, roughly, a 10% premium.
Inspections by retailers and processors were the least valued forms of assurance of seafood
safety. The authors also note the limited use of branding in seafood retailing and the lack of
incentives to provide information for seafood harvesters. Holland and Roheim Wessells (1998)
undertake a similar conjoint analysis for salmon. Strong preferences are elicited for U.S.
Department of Agriculture or FDA inspected products relative to non-inspected salmon. The
WTP for inspection is much stronger than for production method and price.
The health cost associated with seafood consumption is hard to pin down. The greater
ignorance is on the number of seafood-borne illnesses. There is underreporting of cases and

11
outbreaks, and consumers cannot attribute illness to a specific consumption. The lack of
inspection and testing of seafood and long term impact of excessive residues of toxic substances
and banned antibiotics contribute to the difficulty to estimate health cost. As noted before, FDA
only inspects a small share of seafood imports and detains about 2% of inspected seafood
imports and actively tests a subset of these detained goods. Hence, less than 1% of seafood
imports are formally tested (GAO, 2009; Allhouse et al., 2003). Domestically, the FDA does
better but still relies extensively on self-reporting by producers and processors and only inspects
a fraction of domestic seafood output.
Cost of HACCP implementation for foreign and domestic producers
The literature suggests that the implementation cost of food safety standards by foreign
producers in developing countries, are initially high. While the fixed cost of doing so is high, the
marginal cost of maintaining these standards is small. This marginal cost is even smaller for U.S.
domestic seafood producers. Cato and Subasinge (2003) analyze these costs in the shrimp
industry in Bangladesh. The EU banned shrimp imports from Bangladesh for sanitary reasons.
The ban was costly, representing about USD 15 million in lost revenues from August to
December 1997. Some exports resumed in 1998. Bangladesh made significant investments in
food safety via HACCP plans. By 1997 the Bangladesh shrimp industry had invested USD 17.6
million in plant upgrades; its government had invested USD 382,000 in laboratory and personnel
upgrades and had received a small assistance from FAO (USD 72,000) in training programs. The
annual recurring costs to maintain HACCP programs and meet international standards would be
about USD 2.2 million for the industry and USD 225,000 for the government.
Cato and Lima dos Santos (2000) conduct a survey of 19 Bangladesh shrimp processing
plants in 1998. The average investment per plant to be in compliance with minimum technical

12
and sanitary standards was USD 277,155. The annual invested amount to maintain a HACCP
plan was USD 34,875 per plant. The cost per kilogram for plant upgrades was USD 0.7141 or
6.72% of the 1997 average price received. The marginal cost per kilogram to maintain a HACCP
plan was between USD 0.0327 and USD 0.0899, representing between 0.31 and 0.85% of the
1997 average price received. The authors also report moderate investments by the Bangladesh
government in laboratories and personnel to monitor HACCP in the shrimp plants of roughly
USD 200,000 per year since 1997. The total investments (industry, government and foreign
institutions) to upgrade Bangladesh shrimp plants to meet minimum HACCP standards
represented 9.4% of export sales for one year. The annual marginal cost to maintain the HACCP
plan represents 1.26% of export sales per year. The Government’s estimated that USD 14.9
millions were needed to implement the highest levels of HACCP monitoring, which is several
orders of magnitude larger than the previously cited figures.
The World Bank (2005) provides a review of the cost in the shrimp industry in Thailand
to meet tightened standards on antibiotics (such as the zero tolerance ban applied by the EU).
The compliance costs to Thai shrimp farmers are reported as follows. The use of alternative
chemicals increases the average cost of production of black tiger shrimp by 5.7% from the
conventional chemical-supplemented shrimp farming method. By shifting to probiotic1 farming,
this cost will decrease by 33%. Moving on to compliance of shrimp processors, their costs would
be much higher, at USD 328 per ton. As highlighted by the World Bank (2005), the government
of Thailand allocates a substantial budget to the shrimp industry. Between 1998 and 2002, 56%
of the whole budget for fisheries was devoted to the shrimp industry or USD 5.35 million in
1998 and USD 0.73 million in 2002. The cost of laboratory services is not included in these
1 Probiotic supplements are a microbial formulation that maintains water quality.

13
figures and represents a bit less than USD 10 per ton of shrimp exports. The additional fixed
costs to comply with EU requirements on drug residues amount to USD 4,301,790. Finally,
International Finance Cooperation (2006) provides numerous examples of programs for
improving shrimp quality adopted by various countries but without cost estimations.
Cato (1998) reviews the available estimates on the cost of implementing and complying
with HACCP in various U.S. fish and seafood industries. The cost, annualized typically
represents less than 0.5% of the price received by producers and processors. The initial cost of
implementing HACCP can be high for small plants, but overall the annualized cost is low, past
the first year of implementation. For example, the annualized cost of HACCP for the U.S. shrimp
processing industry was USD 0.009 per pound, or about 0.3% of the price charged by processors
with a pass-through to consumers of USD 0.025 per pound. Similarly, HACCP cost estimates for
U.S. blue crab plants hover around USD 0.02 per pound, or 0.33% of processor price. For
breaded products, added cost per pound of product for compliance was USD 0.01 for small
plants and USD 0.0002 for large plants with no effects on consumer prices. Cost per pound of
molluscan shellfish and other products produced were estimated at USD 0.05 for small plants
and USD 0.003 for larger plants. Although it is difficult to find more recent estimates of the cost
of HACCP, these older figures suggest that these costs are small and smaller than for compliance
of a foreign producer.
A simple conceptual model
We consider a parsimonious framework to highlight the essence of forces at work and then to
calibrate simulations. A representative foreign producer offers a proportion of non-
contaminated products meeting the safety standard and a proportion of contaminated
0 1fλ≤ ≤
(1 )fλ−

14
products failing the standard and entailing damage for the importing country.2 Similarly, a
representative domestic producer offers proportions of non-contaminated products meeting the
standard and of contaminated products failing the standard and entailing consumer damage as
described later.
A foreign producer has a probability γf of being inspected when its product reaches the
border (the same analysis is developed with probability of being inspected for the domestic
producer). When products are inspected, the inspection provides perfect information about the
product’s safety at a marginal inspection cost H for the importing country. The inspection
procedure is not subject to diagnostic errors for simplicity.3
With probability (1-γf) the foreign producer is not inspected. This producer is able to sell
all products and to benefit from a per unit price for the sold shrimps. A proportion of the
products are non-contaminated, that is, there is no heath damage for the importing country. A
proportion of the foreign products are contaminated and there is a per unit external damage e for
the consumer of the importing country. The proportion is exogenously given, which corresponds
to a short-term situation for which producers cannot improve the safety of their products for
reacting to an inspection policy. A similar assumption holds for domestic producers.
With probability γf, imported shrimps are inspected and a proportion of them pass the
standard test and the producer receives the same per unit price p. A proportion fails the test and
the producer loses this proportion of products. In this case, for simplicity we assume there is no
2 The proportion λf
could be interpreted as probability of having non-contaminated products and sell the products on
the domestic market. It is assumed predetermined to the policy implementation. Making the proportion endogenous
significantly complicates the computation of the optimum inspection rates without offering additional insight on the
protectionist potential of the inspection policy under the domestic regulator.
3 The inspection procedure could be subject to a diagnostic error (false positive test) in an extension.

15
way to sell and divest the rejected product elsewhere.4 Other punishment schemes could be
conceived. Foreign producers’ profits are now briefly discussed.
For a foreign producer with output , the cost function is
where is a variable cost parameter. and are respectively the marginal cost and
the sunk cost linked to proportion λf of safe products. For a same proportion λf, these costs may
differ from the respective domestic costs, and , to express heterogeneous access
to food safety technology and ease of implementation.
We assume that the price received by the foreign producer is parametric (price-taker).
For a foreign producer the expected profit is:
21
2( , , ) (1 ) ( ) ( )f f f f f f f f f f f f f fp pq c q k q Kπ λ γ γ γ λ λ λ⎡ ⎤= − + − − −⎣ ⎦ (1)
Profit maximization yields individual firm supply functions before the inspection equal to:
(2)
By taking into account the probability of inspection and the proportion of safe products, the
foreign supply effectively sold by the foreign producer (after the inspection) is:
(3)
Using a similar approach for domestic producers, we assume that their expected profit is:
(4)
4 A drastic sanction is assumed in this chapter, since a rejected shipment is not necessarily destroyed and could be
used for animal feeding or redirected to other markets. It is also possible to consider less drastic sanctions as
monetary penalties. However the lower monetary penalty, the higher is the number of inspections necessary for
maintaining incentives.
fq21
2 ( ) ( )f f f f f f fc q k q Kλ λ+ +
fc fk ( )fλ ( )f fK λ
dk ( )fλ ( )d fK λ
[(1 ) ] ( )( , , ) f f f f fSf f f
f
p kq p
cγ γ λ λ
λ γ− + −
=
[(1 ) ] ( )( , , ) [(1 ) ] ( ) [(1 ) ] f f f f fS Sf f f f f f f f f f
f
p kQ p q p
cγ γ λ λ
λ γ γ γ λ γ γ λ− + −
= − + = − +
[ ] 212( , , ) (1 ) ( ) ( )d d d d d d d d d d d d d dp pq c q k q Kπ λ γ γ γ λ λ λ= − + − − −

16
where notations linked to subscript d have a similar interpretation to the one detailed for foreign
producers. The domestic supply effectively sold by domestic producers (after the inspection) is:
(5)
The demand of a representative consumer is derived from a quasi-linear utility function
that consists of quadratic preferences for the market good of interest and an additive numéraire:
(6)
Where q is the consumer’s consumption of shrimps and v is the numéraire. The terms
allow capturing the immediate satisfaction of the consumer from consuming shrimps.
The effects of externalities are captured by the term -Irq. The binary parameter I
represents the consumer knowledge regarding the specific characteristic brought by the bad
shrimps; the aversion brought by bad products is captured by the negative sign and by parameter
r, the overall damage per unit consumed. If consumers are unaware of the specific characteristic
or if there is an unaccounted externality linked to the specific characteristic, then I=0.
Conversely, I=1 means that consumers are aware of the specific characteristic and internalize the
externality and reduce their consumption. We assume that consumers are not aware of the
specific characteristic (I=0).5 The maximization of the consumer utility under budget constraint
(v+pq=R) leads to the demand . The consumer surplus is then
.
The expected damage per unit of consumption r is not internalized by consumers and is
5 This assumption can be relaxed particularly with intense press coverage or by the effect of the country-of-origin
labeling (COOL) program that may lead to product differentiation based on the origin, when safety levels differ
according to the origin.
[(1 ) ] ( )( , , ) [(1 ) ]S d d d d dd d d d d d
d
p kQ pc
γ γ λ λλ γ γ γ λ − + −= − +
2( , ) / 2U q v aq Irq bq v= − − +
, 0a b >
( ) ( ) /dQ p a p b= −
( ( ), ( ))d dU Q p R pQ p−

17
defined as following. Recall that if foreign products are not inspected with a probability ,
contaminated foreign products enter the market in a proportion . Foreign supplies are
inspected with a probability γf under which no contaminated products enter the market. With a
per unit damage e, the expected per unit damage linked to foreign products (after the inspection
stage) is given by and the expected per unit damage linked to domestic
products (after the inspection) is given by . The expected damage per sold
unit is defined by .
For a situation with given values of γd and γf, the equilibrium price clears the market by
equalizing demand and overall supply leading to an equilibrium quantity . Fig. 1 shows
domestic demand (D), foreign supply (SF) and the total supply (S) (the domestic supply is
omitted for clarity). The price, p, is located on the vertical axis and the quantity, q, is shown
along the horizontal axis.
Take in Fig. 1
In Fig. 1, is the foreign output and is total output (local plus foreign). The gross
profits correspond to area 0wvpA for foreign producers (since sunk costs are zero) and area wzAv
for domestic producers. The usual surplus of domestic consumers corresponds to area pAAa. The
damage linked to contaminated products does not impact the demand since I=0. However, the
cost of ignorance from the external health cost should be accounted for in the welfare
calculations and is represented by the area 0rtQA. Domestic welfare is the sum of domestic
profits, consumer surplus, cost of ignorance, and overall cost of inspection. This welfare is given
by area pAvwzAa-0rtQA when the cost of inspection is zero. International welfare is the sum of
domestic welfare and foreign producer surplus and is given by area 0zAa-0rtQA when the cost of
(1 )fγ−
(1 )fλ−
(1 )(1 )f f fr eγ λ⎡ ⎤= − −⎣ ⎦
[ ](1 )(1 )d d dr eγ λ= − −
( ) ( ) / ( ) ( )⎡ ⎤ ⎡ ⎤= + +⎣ ⎦ ⎣ ⎦S S S S
f f d d f dr r Q p r Q p Q p Q p
AQ
fAQ

18
inspection is zero. Reinforcing the inspection policy leads to a shift of supply functions to the
left, since it reduces the possibility for dangerous products to enter the market. However, this
reduces the expected per unit damage r influencing the cost of ignorance. The regulatory choice
balances the negative and positive marginal impacts of inspection policies on welfare.
With both domestic and foreign products having some probability of being inspected at a
marginal cost H, the overall cost of inspection to the policy maker is
. For an equilibrium price pA, the domestic welfare is:
(7)
Recall that and . The domestic regulator abstracts
from the foreign producers’ profit for determining its policy. The international global welfare
includes foreign producers and is defined by:
),(),,(),( fddffA
ffdi WpW γγγλπγγ += (8)
The “domestic” regulator maximizes the domestic welfare given by (7), while the regulator
caring about global welfare maximizes the international welfare given by (8).
We now turn to the determination of the optimal frequencies of inspection γd and γf. For
the domestic regulator, the first-order conditions are given by:
(9)
and with the second-order conditions for concavity being satisfied. For the “international”
regulator, the first-order conditions are given by:
[ ( , , ) ( , , )]S Sd d d d f f f fH q p q pγ λ γ γ λ γ+
( , ) ( , , ) ( ( ), ( )) ( ) ( )
[ ( , , ) ( , , )]
A d A A d A S A S Ad d f d d d f f d d
S Sd d d d f f f f
W p U Q p R p Q p Q p r Q p r
H q p q p
γ γ π λ γ
γ λ γ γ λ γ
= + − − −
− +
(1 )(1 )f f fr eγ λ⎡ ⎤= − −⎣ ⎦ [ ](1 )(1 )d d dr eγ λ= − −
* *
* *
( , )0
( , )0
d d f
d
d d f
f
W
W
γ γγγ γγ
⎧∂=⎪ ∂⎪
⎨∂⎪ =⎪ ∂⎩

19
(10)
with a similar check on second order conditions.
Despite the simple setup, the social planners’ problems cannot be solved analytically and
we resort to simulations. Before introducing the calibration linked to the shrimp market in the
U.S., we introduce basic simulations to highlight underlining important mechanisms.
One simple but illuminating case consists in assuming symmetric producers and no cost
for food safety, implying , , , and . For a
heuristic purpose, we fix exogenous proportions , demand intercept a=25, cost
, per unit damage e=15, and marginal cost of inspection H=2.
Fig. 2 clearly shows that the inspection policies crucially differ when the objectives to
maximize are domestic or global as defined by (7) and (8). When the domestic welfare is
maximized the inspection processes differ with a frequency of control imposed on
foreign producers and a frequency of control imposed on domestic producers, despite the
strict similarity between producers (see the left chart).6 By imposing all the controls on the
foreign producers the regulator limits the externality coming from the consumption and foreign
producers profit decreases because of the complete elimination of the proportion of
tainted products. Domestic producers benefit from this elimination since the equilibrium price
6 Exclusion of foreign producers could occur when proportion of tainted products is relatively high leading
to a negative profit in (1). Marette (2007) and Marette and Beghin (2010) detail the producers’ exclusion/exit linked
to regulation.
** **
** **
( , )0
( , )0
i d f
d
i d f
f
W
W
γ γγ
γ γγ
⎧∂=⎪ ∂⎪
⎨∂⎪ =⎪ ∂⎩
f dλ λ= f dc c= ( ) ( ) 0f dK Kλ λ= = ( ) ( ) 0f dk kλ λ= =
0.5f dλ λ= =
2f dc c= =
* 1fγ =
* 0dγ =
(1 )fλ−
(1 )fλ−

20
increases after the elimination of foreign-tainted products.
Take in Fig. 2
Conversely, when international welfare is maximized the optimum inspection rates
are similar for all producers because of the strict similarity between producers
(see the right chart). By imposing similar controls on domestic and foreign producers, the
international regulator limits the externality by equally sharing the effort induced by the partial
elimination of tainted products. Note that , which means that the effort
imposed by the domestic regulator is higher than the cumulated effort imposed by the
international regulator taking into account the foreign profits. To sum up, there is a distortion in
the domestic choice compared to the international choice. This result was not underlined by the
previous literature.
Compared to Fig. 2, we may consider numerous situations with different parameters. For
instance, when health risks differ with safer domestic food ( ), the optimal controls
maximizing the international welfare are such that . The global planner would
seemingly be protectionist. More controls are imposed on foreign producers compared to
domestic producers because foreign products are not as safe as domestic products. With
everything else equal, the change of the foreign proportion leads to a policy
maximizing the international welfare and defined by the inspection frequencies and
, while inspection frequencies and still maximize domestic welfare.
From the international welfare defined by (8), it is legitimate to differentiate the inspection
policy with since . This is an interesting result since the possibility of
legitimate discrimination readily arises from the difference in the proportions of safe products
** ** 0.31d fγ γ= =
** ** * 1d f fγ γ γ+ < =
f dλ λ<
** **d fγ γ<
0.3fλ =
** 0.64fγ =
** 0.09dγ = * 1fγ = * 0dγ =
** **f dγ γ> f dλ λ<
fλ

21
and . The evaluation of the inspection policy maximizing the international welfare is crucial to
characterize policies as protectionist or not, with in the sense of Fisher and Serra
(2000).
The shrimp application
The model previously described is calibrated to estimate welfare effects linked to welfare-
maximizing inspection rates which are implemented as inspection reinforcements over some
initial arbitrary pre-existing levels. Prior to the reinforcement of the inspection, parameters of the
model are initially calibrated such as to replicate prices and quantities of the U.S. shrimp market
for 2006 (see Table 1).
With the observed quantity sold , the observed price , and the direct price elasticity
( ) obtained from econometric estimates whose sources are indicated in
Table 1, the calibration leads to estimated values for the demand parameters equal to
, . For the supply side, both domestic and foreign supplies are calibrated
with the same price elasticity of supply. With the baseline scenario for 2006 (before the
reinforcement of the policy), the calibration of (3) and (5) is made for an initial inspection equal
to γ = 0.01.7 The parameters used for the calibration are presented in Table 1.
Table 1. Values of parameters in 2006 for the calibrated model of the U.S. shrimp market
7 With the baseline scenario (before the reinforcement of the policy), it could be assumed that the initial inspection
rate is equal to 0.01 or γ = 0.01 (close to the official statistics reported in Southern Shrimp Alliance, 2007 or in
GAO, 2001).
dλ
**fγ < *
fγ
Q̂ p̂
$ε /( )D Dp dQ Q dp= ⋅ ⋅
$ˆ ˆ1/ /b Q pε= −% % ˆ ˆa bQ p= +%
Variable Value

22
Notes: Quantities and prices in 2006 come from FAO (2009). 1 The domestic price is estimated by dividing the value of imports by the quantity of imports (FAO, 2009), since the import price is equal to the domestic price by arbitrage. 2 Hudson et al. (2003) for shrimps in the U.S. by taking the average of own prices elasticities of demand over the 4 destinations in Table 4 (p.236). 3 International Institute for Fisheries Economics and Trade (2004) for the aquaculture of shrimps by taking the average of own prices elasticities of demand over the top 5 world producers of shrimps in Table 3 (p.5).
The following simulations provide useful information in a context where data linked to
border inspections are difficult to collect. Ababouch et al. (2005) in their exhaustive study of
border cases mention these difficulties arising from complex access to and treatment of data. The
parameters selected for the simulation show diverse plausible situations that could emerge.
Several cases for the value of the per unit damage e are presented in the simulations. For
ease of interpretation, this damage can be expressed as a percentage of the initial-equilibrium
price p used in the baseline scenario. We now turn to the results.
Table 2 presents surplus variation between different situations. Four cases are presented
to account for potential sensitivity to some parameters. The first column details the surplus
variation for different agents coming from maximizing the domestic welfare with and
(optimal values given parameters in Table 1) compared to the baseline calibration with
. A positive variation for an agent means a gain coming from the optimal domestic
policy. The second column details the surplus variation coming from maximizing the
international welfare with and (optimal values given parameters in Table 1) compared
to the baseline scenario with . The third column presents surplus differences under
the maximized international and domestic welfares. For each row, the value in column 3 is the
*fγ *
dγ
0.01f dγ γ= =
**fγ **
dγ
0.01f dγ γ= =
Consumption in 2006 (thousands of tons) 732.6 Imports in 2006 ( thousands of tons) 593.7 Domestic production for the domestic market in 2006 ( thousands of tons) 138.9 Price1 in 2006 (USD) 6.97 Own-price elasticity of demand2 -1.01 Own-price elasticity of supply3 0.77

23
difference between column 2 and column 1. All the scenarios assume a relative low cost of
inspection (H=0.1)
Table 2. Surplus variation between different scenarios for 2006 (million USD and %)
Case 1: High per unit damage e. Equal foreign and domestic shares of safe food H=0.1, λf = λd = 0.6, e=p
Domestic vs. baseline
International vs. baseline
International vs. domestic
Optimum probabilities of inspection
Reference probabilities of inspection Domestic consumers and cost of ignorance (surplus variation) 822.3 (162%) 403.5 (79%) - 418.8 (-82%)
Domestic producers (profit variation) 171.8 (29%) - 64.9 (-11%) - 236.6 (-40%) Domestic welfare (with cost of controls) 948.5 (86%) 317.8 (29%) - 630.7 (-57%) Foreign exporters (profit variation) - 1,091.0 (-43%) - 277.4 (-11%) 813.6 (32%) International welfare (variation) - 142.5 (-3%) 40.4 (1%) 182.9 (5%) Case 2: High per unit damage e. Safer domestic food (higher domestic share). H=0.1, λf = 0.6, λd = 0.7, e=p
Domestic vs. baseline
International vs. baseline
International vs. domestic
Optimum probabilities of inspection Reference probabilities of inspection Domestic consumers and cost of ignorance (surplus variation) 835.6 (138%) 368.7 (61%) - 467.0 (-77%)
Domestic producers (profit variation) 170.8 (28%) 46.3 (7%) - 124.5 (-21%) Domestic welfare (with cost of controls) 960.9 (80%) 396.0 (33%) -564.9 (-47%) Foreign exporters (profit variation) - 1,090.8 (-43%) - 357.0 (-14%) 733.8 (29%) International welfare (variation) -129.9 (-3%) 39.0 (1%) 168.9 (4%) Case 3: Very high damage per unit e. Equal foreign and domestic shares of safe food. H=0.1, λf = λd = 0.6, e=2p
Domestic versus baseline
International vs. baseline
International vs. domestic
Optimum probabilities of inspection Reference probabilities of inspection Domestic consumers and cost of ignorance (surplus variation) 3,088.8 (203%) 3,088.8 (203%) 0 (0%)
Domestic producers (profit variation) - 234.1 (-39%) - 234.1 (-39%) 0 (0%) Domestic welfare (with cost of controls) 2,796.8 (301%) 2,796.8 (301%) 0 (0%) Foreign exporters (profit variation) - 1,001.1 (-39%) - 1,001.1 (-39%) 0 (0%) International welfare (variation) 1,795.8 (112%) 1,795.8 (112%) 0 (0%) Case 4: Very low damage per unit e. Domestic vs. International vs. International
* *1, 0f dγ γ= = ** **0.29, 0.29f dγ γ= = ** **0.29, 0.29f dγ γ= =
0.01f dγ γ= = 0.01f dγ γ= = * *1, 0f dγ γ= =
* *1, 0f dγ γ= = ** **0.33, 0.01f dγ γ= = ** **0.33, 0.01f dγ γ= =0.01f dγ γ= = 0.01f dγ γ= = * *1, 0f dγ γ= =
* *1, 1f dγ γ= = ** **1, 1f dγ γ= = ** **1, 1f dγ γ= =
0.01f dγ γ= = 0.01f dγ γ= =* *1, 1f dγ γ= =
24
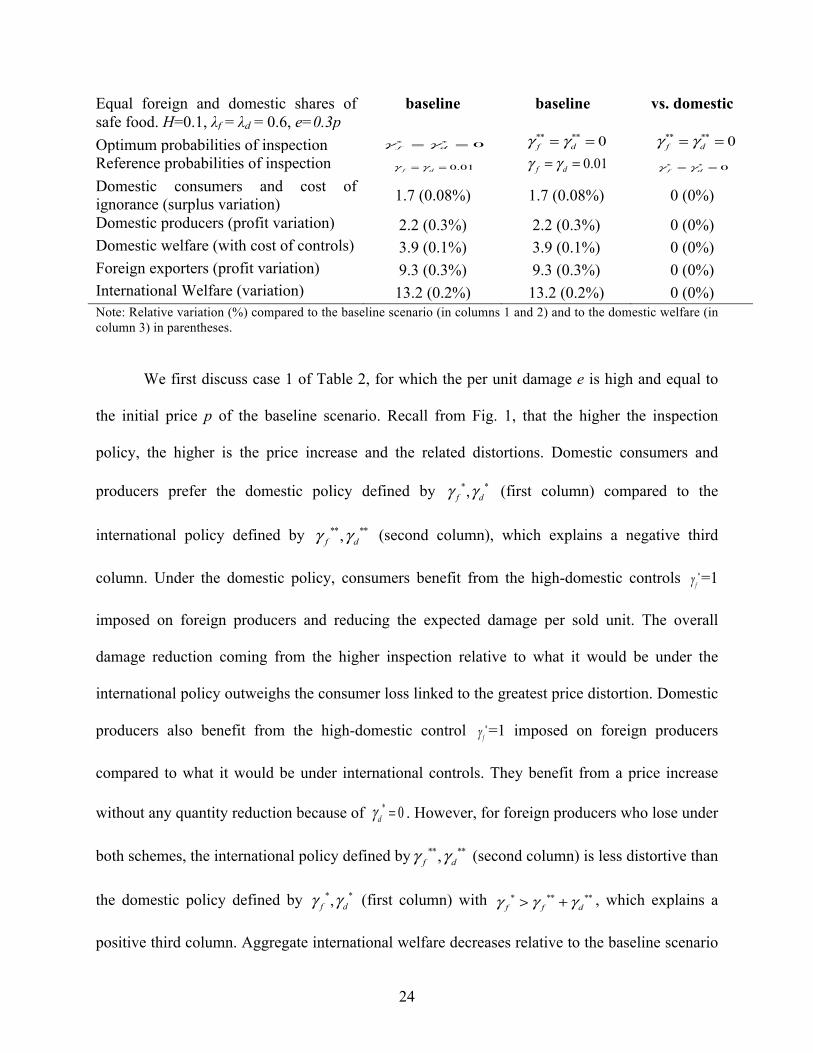
Equal foreign and domestic shares of safe food. H=0.1, λf = λd = 0.6, e=0.3p
baseline baseline vs. domestic
Optimum probabilities of inspection
Reference probabilities of inspection
Domestic consumers and cost of ignorance (surplus variation) 1.7 (0.08%) 1.7 (0.08%) 0 (0%)
Domestic producers (profit variation) 2.2 (0.3%) 2.2 (0.3%) 0 (0%) Domestic welfare (with cost of controls) 3.9 (0.1%) 3.9 (0.1%) 0 (0%) Foreign exporters (profit variation) 9.3 (0.3%) 9.3 (0.3%) 0 (0%) International Welfare (variation) 13.2 (0.2%) 13.2 (0.2%) 0 (0%) Note: Relative variation (%) compared to the baseline scenario (in columns 1 and 2) and to the domestic welfare (in column 3) in parentheses.
We first discuss case 1 of Table 2, for which the per unit damage e is high and equal to
the initial price p of the baseline scenario. Recall from Fig. 1, that the higher the inspection
policy, the higher is the price increase and the related distortions. Domestic consumers and
producers prefer the domestic policy defined by (first column) compared to the
international policy defined by (second column), which explains a negative third
column. Under the domestic policy, consumers benefit from the high-domestic controls =1
imposed on foreign producers and reducing the expected damage per sold unit. The overall
damage reduction coming from the higher inspection relative to what it would be under the
international policy outweighs the consumer loss linked to the greatest price distortion. Domestic
producers also benefit from the high-domestic control =1 imposed on foreign producers
compared to what it would be under international controls. They benefit from a price increase
without any quantity reduction because of . However, for foreign producers who lose under
both schemes, the international policy defined by (second column) is less distortive than
the domestic policy defined by (first column) with , which explains a
positive third column. Aggregate international welfare decreases relative to the baseline scenario
* * 0f dγ γ= =** ** 0f dγ γ= = ** ** 0f dγ γ= =
0.01f dγ γ= = 0.01f dγ γ= = * * 0f dγ γ= =
* *,f dγ γ
** **,f dγ γ
*fγ
*fγ
* 0dγ =
** **,f dγ γ
* *,f dγ γ * ** **f f dγ γ γ> +

25
when the domestic policy menu ( ) is selected (first column), whereas international
welfare increases when the international policy is selected (second column). The domestic policy
is deemed protectionist since and , in the spirit of Fisher and Serra (2000). Note
that the variations of the international welfare are low while the variations for domestic agents or
foreign producers are large, that is, transfers among agents are large. In the first column, the
negative variation of the international welfare when the domestic policy is imposed means that
the foreign-producers’ loss offsets the gains of domestic producers and consumers.
Case 2 keeps the high per unit damage and introduces a larger domestic share of safe
output. The case shows it is legitimate (non protectionist) from the international point of view to
impose a higher level of control on foreign producers compared to domestic producers, with
, because of a higher risk for foreign products with and . Foreign
exporters, especially from developing countries, tend to have a lower expected quality because
meeting the standard is relatively more costly and inspections are uncertain, two documented
stylized facts for shrimps. As case 1 does, case 2 shows that the domestic regulator imposes an
excessive level of inspection because of the relationship . The inspection rates
are protectionist because . Observing the inspection level for domestic
firms lower than the inspection level for foreign firms is not the appropriate criteria, but rather
one should compare their respective levels under domestic and international regulators.
Case 3 assumes a very high value of the per-unit damage e and similar foreign and
domestic safety levels. In this case the optimum domestic policy corresponds to the foreign
policy since the relatively high damage requires a systematic control of all products. Indeed both
probabilities under both welfare maximizations reach the maximum equal to one, while the
* *,f dγ γ
* **f fγ γ> * **
d dγ γ<
** **f dγ γ> 0.6fλ = 0.7dλ =
* ** **f f dγ γ γ> +
* ** * **and f f d dγ γ γ γ> <

26
expected damage r completely disappears since no tainted products are consumed.
In case 4, there is no protectionism since the controls would be counterproductive and
they are equal to zero under both “maximized” domestic and international welfare.8 Domestic
consumers slightly benefit from the reduction of inspections compared to the baseline scenario
because of relatively low damage e and savings from not implementing costly inspections and
the absence of price distortion through inspections.
Making jointly endogenous leads to complex computations with multiple
roots. However, the choice of is subject to the same differences when domestic welfare
and international welfare are taken into account. In the following example using parameters of
Table 1, we restrict our attention to a situation with an inspection policy , marginal
costs and fixed safety costs and
. These values guarantee concavity of profits functions and positive
profits with .
As firms face a probability of being controlled, the maximization of the firms’ profits
leads to the selection of . Despite the cost differences, the effort by foreign
producers is higher than the one by domestic producers, since the higher market share for foreign
8 The value of e for case 4 is likely to correspond to the one provided by experimental studies or by consumers’
surveys. The percent price premium for safe products over conventional product is equal to 30%. We draw on the
value suggested by Hayes et al. (1995) for the U.S. They found respondents willing to pay 15% to 30% more for
food safe from five pathogens in the U.S., including salmonella. We could retain a value equal to w=0.3. We apply
the price p used for the initial calibration, which means that the per-unit damage is equal to e=0.3p (as in case 4 of
table 2) for each country and leads to the cost of ignorance.
, , ,f d f dλ λ γ γ
,f dλ λ
0.3d fγ γ= =
( ) ( ) 0f f f fk kλ λ= = ( )2( ) 1000000000f f fK λ λ=
( )2( ) 500000000d d dK λ λ=
0 1,0 1d fλ λ≤ ≤ ≤ ≤
' 0.25, ' 0.42d fλ λ= =

27
producers allow them to bear a larger sunk cost. We now turn to decisions taken by a regulator
maximizing the domestic welfare or the international welfare and imposing the same standard on
foreign and domestic producers. The regulator maximizing the domestic welfare would select a
standard imposed to all firms. The regulator maximizing the international welfare would
select a standard . As for the inspection policy, the domestic regulator will try to impose
a higher standard since the fixed cost is only incurred by the foreign producers and not
passed on to the domestic consumers. Note that the characterization of the protectionism is based
on the comparison between (namely, the domestic choice) and (the international
choice) and not on the comparison between (the domestic choice) and , that is,
the private choice by the foreign firms reacting to the inspection policy . The
comparison between a policy maximizing the domestic welfare and a policy maximizing the
international welfare is necessary for delineating the frontier between the legitimate regulation
reducing the consumer’ damage and the protectionism injuring foreign producers.
Protectionist, discriminatory pressures and possible distortions imposed on foreign
producers are not limited to the probabilities of inspection or phyto-sanitary standards. Another
important regulatory decision considered here deals with alternative ways to finance controls and
their implications for welfare and potential protectionism. This problem has been overlooked by
the previous literature.
How to finance inspections?
This section complements the previous one, since it also shows that the way to finance the
inspection may also have protectionist consequences. For selected levels of inspection decided
* 1λ =
** 0.85λ =
( )f fK λ
* 1λ = ** 0.85λ =
* 1λ = ' 0.42fλ =
0.3d fγ γ= =

28
by the regulator (as in the previous section), alternative ways to finance inspection could be
selected. Two fiscal instruments can be considered, namely, a fixed fee (whatever the quantity
sold) and a per-unit fee imposed on firms. For simplifying the analysis, those fees are the same
for foreign and domestic producers, which differs from the previous section were discriminations
were possible.
To further simplify the analytical expressions, we keep the previous notations and we
assume a symmetric configuration for producers with λf =λd =λ, cf =cd =c, γf =γd =γ. Moreover,
we assume k(λ) =K(λ) =0 and b=1 for the demand parameter in (6). Obviously, the results of this
section could be combined with the previous results defining different probabilities and . We
can rewrite the profit previously defined by (1), as:
(11)
with a fixed fee G paid by the producer and a per-unit fee g paid per sold unit. These fees
account for refused goods as showed in (13) below. Note that, after the inspection, the sold units
are for foreign producers. The profit maximization yields individual firm supply
function before the inspection equal to:
cgppq sfγγλγ −+−= ])1[()( (12)
with corresponding to the supply function after the inspection (the same can
be done for domestic producers). Note that the fixed fee G does not influence the chosen output
but only impacts the profit. It is chosen such that the budget constraint of the regulator is
satisfied. Similarly to the previous section, the equilibrium price is pA. With the per-unit fee g
paid for each sold unit and the fixed fee G, the budget constraint linked to the inspection and the
fees is:
fγ dγ
[ ] [ ]212( , , , , ) (1 ) (1 )f f f f fp g G pq c q g q Gπ λ γ γ γλ γ γλ= − + − − − + −
[ ](1 ) fqγ γλ− +
[(1 ) ] ( )Sfq pγ γλ− +

29
(13)
where γ is the probability of inspection applied to output and H is the marginal cost of inspection.
The per-unit fee g paid per sold units accounts for all inspected units including the withdrawn
units. With an expected damage per sold unit rf =rd =r and with sold products
, the domestic welfare previously given by (7) is defined
by:
(14)
with . The international welfare is defined by:
(15)
For given values of λ and γ, the domestic regulator maximizes the domestic welfare given
by (14) subject to (13), while the international regulator maximizes the international welfare
given by (15) subject to (13). Result 1 and Fig. 3 are useful to illustrate the financing choices by
a regulator balancing the budget defined by (13). The per-unit fee g is located along the
horizontal axis and the welfare along the vertical axis.
Result 1. When domestic welfare is maximized, the per-unit fee paid by all producers is:
, linked to a
fixed fee
When the international welfare is maximized, the per-unit fee paid by all producers: is
, and with fixed fee
.
[ ( ) ( )] [(1 ) ][ ( ) ( )] 2S A S A S A S Ad f d fH q p q p g q p q p Gγ γ γλ+ = − + + +
( ) [(1 ) ][ ( ) ( )]A S A S Ad fQ p q p q pγ γλ= − + +
( , , , , ) ( ( ), ( )) ( )A A A A Ad dW p g G U Q p R p Q p rQ pπ λ γ= + − −
[ ](1 )(1 )r eγ λ= − −
( , , , , )Af f dW p g G Wπ λ γ= +
( ) [ ] [ ][ ]
2 3
*2 1 (1 ) 2 (1 ) (1 ) (1 ) 2 (1 )
(1 )
c H e ag
c
γ λ γ γ γ γλ λ γ γλ
γ γλ
⎡ ⎤+ + − + − − + − − − +⎡ ⎤⎣ ⎦⎣ ⎦=− +
* **
2
( ) (1 (1 )) (1 (1 )).
2(1 (1 ))a g H g
Gc
γ γ λ γ λγ λ
⎡ ⎤− − − − − −⎣ ⎦=+ − −
[ ]** (1 )(1 ) (1 )(1 )
H eg
γ γ λ γ γλγ γλ
+ − − − +=
− +
** ****
2
( ) (1 (1 )) (1 (1 ))2(1 (1 ))
a g H gG
cγ γ λ γ λ
γ λ⎡ ⎤− − − − − −⎣ ⎦=
+ − −

30
Result 1 shows that the selected fees are completely different because of different welfare
criteria. When the international welfare is maximized, the per-unit fee is positive and greater
than the fee that would satisfy (13) with G=0 (see x in Fig. 3). It is
socially optimal to internalize the cost of inspection into the price, as well as the per unit damage
as a Pigouvian tax. As , the corresponding fixed fee
is negative to balance the budget, which means that firms receive a fixed subsidy that partially
compensates the incurred cost linked to the per-unit fee . This is an interesting result since it
rationalizes having HACCP bankrolled by the domestic regulator (see the previous section on
HACCP). Note that with this mechanism, consumers and firms finance the inspection since the
per-unit fee is passed onto consumers via the equilibrium price.
Take in Fig. 3
When the domestic welfare is maximized, the per-unit fee is negative for relatively
medium-values of H and the corresponding fixed fee is positive to balance budget constraint
(13). It means that both firms mainly finance the inspection with a fixed fee that is not passed on
to consumers into the price. This allows the domestic regulator to finance the inspection policy
via the fixed fee that is incurred by domestic and foreign firms. One part of the financing is
passed onto foreign firms (and countries) and not passed onto domestic consumers. The domestic
choice is distorted compared to international one because the foreign country bears a larger share
of the financing. As foreign producers are not considered in the domestic welfare, it is optimal to
use the fixed fee not passed on to consumers. This result was overlooked in the previous
literature on inspection that does not broach international trade per se. When H is relatively
large, the fee is positive.
**g
/[(1 ) ]x Hγ γ γλ= − +
(1 )(1 )r e γ λ= − − ** /[(1 ) ]g Hγ γ γλ> − + **G
**g
**g
*g
*G
*g

31
The domestic mechanism ( , ) can be judged protectionist compared to the
international mechanism ( , ) since the domestic mechanism decreases the foreign profit,
compared to a situation maximizing the international welfare.
This simple model of financing may lead to extensions. In particular, the exclusion of
foreign producers could be studied. The financing instruments could be different between foreign
and domestic producers, which would re-enforce the discrimination and the protectionism with
higher positive fees imposed on foreign producers compared to domestic producers. The
domestic regulator could be tempted to select fees such that the foreign profit is negative leading
to foreign producers’ exit ( ). This possibility would reinforce the distortion
of the domestic choice compared to the international choice. Eventually, another extension could
restrict the analysis to welfare maximization for which both g and G are positive. This additional
constraint can be added as the positive values of the fees for limiting the firms’ transfers. In this
case, choices are the following. When the international welfare is maximized, the per-unit fee
paid by all producers is , linked to a fixed fee G equal to 0 as implied by the
budget constraint (13) (see x on Fig. 3). When domestic welfare is maximized, the per-unit fee
paid by all producers is zero, linked to a fixed fee >0 to balance the budget. The
interpretation of this result is similar to the one given after result 1.
Conclusion
This chapter explores the potential protectionism of food safety inspection system to implement
a standard and its influence on safety choices by foreign and domestic producers selling food in
the domestic market. Inspections play a key role to turn safety standards into a discriminatory
implementation of the food standard, leading de facto to discriminatory effective or implemented
*g *G
**g **G
( , , , , ) 0Af p g Gπ λ γ <
/[(1 ) ]x Hγ γ γλ= − +
**G

32
standards, often raising the average quality of imports above that of domestic goods. The way
these inspections are financed can also re-enforce the protectionist nature of the inspections. All
these effects occur in absence of any rent seeking by firms. Even when considering global
welfare, discriminatory non protectionist inspections can arise if domestic and foreign firms have
heterogeneous cost structures.
This chapter suggests that more attention should be given to the way domestic and
foreign products are inspected and the way these inspections are financed. Whatever the
instrument (inspection, standard or fees for financing the regulation), we show the comparison
between a policy maximizing the domestic welfare and a policy maximizing the international
welfare is necessary for delineating legitimate regulation reducing the consumer’ damage from
protectionism injuring foreign producers. A larger question is what should policy maker do in
light of non discriminatory principles in trade agreements? For example, domestic treatment
under the World Trade Organization would suggest that these differences in inspection rates and
their financing may be inconsistent with the Agreement.
The empirical analysis raise interesting issues related to the actual U.S. policy. It seems
to be neither a protectionist policy nor a catalyst, given its very low frequency of inspections.
Despite some shortcomings, welfare measures developed in this chapter help streamline the
amount of money earmarked to public-inspection programs. In essence, more attention should be
given to the economic analysis of food safety of shrimps and to the optimal inspection policy at
the border and in domestic plants and its welfare effects.

33
References
Ababouch, L., Gandini, G., & Ryder, J. (2005). Detentions and rejections in international fish
trade. Fisheries technical paper 473, Food and Agriculture Organization, Rome, Italy: FAO.
Retrieved from http://www.fao.org/docrep/008/y5924e/y5924e00.htm
Alberini, A., Lichtenberg, E., Mancini, D., & Galinato, G. (2008). Was It Something I Ate?
Implementation of the FDA Seafood HACCP Program. American Journal of Agricultural
Economics, 90(1), 28-41. doi:10.1111/j.1467-8276.2007.01038.x
Allshouse, J., Buzby, J. C., Harvey, D., & Zorn, D. (2003). International Trade and Seafood
Safety. In J. C. Buzby (Ed.), International Trade and Food Safety: Economic Theory and
Case Studies, AER-828, Chapter 7, U.S. Department of Agriculture, Economic Research
Service, Washington, DC. Retrieved from
http://www.ers.usda.gov/publications/aer828/aer828i.pdf
Anders, S. M, & Caswell, J. (2009). Standards as Barriers versus Standards as Catalysts:
Assessing the Impact of HACCP Implementation on U.S. Seafood Imports. American
Journal of Agricultural Economics, 91(2), 310-321. doi:10.1111/j.1467-8276.2008.01239.x
Beghin, J., Disdier, A.C., Marette, S. and van Tongeren, F. (forthcoming). “A Cost-Benefit
Approach for the Assessment of Non-Tariff Measures in International” in J Beghin, ed., Non
Tariff Measures with Market Imperfections: Trade and welfare Implications, Frontiers of
Economics and Globalization series, Emerald Press, chapter 1.
Buzby, J. C., Unnevehr, L. J., & Roberts, D. (2008). Food Safety and Imports: An Analysis of
FDA Food-Related Import Refusal Reports. Information Bulletin 39, U.S. Department of
Agriculture, Economic Research Service, Washington DC. Retrieved from

34
http://www.ers.usda.gov/publications/eib39/eib39.pdf
Cato, J. C. (1998). Economic values associated with seafood safety and implementation of
seafood Hazard Analysis Critical Control Point (HACCP) programmes. Fisheries technical
paper 381, Food and Agriculture Organization, Rome, Italy: FAO.
Cato, J. C., & Lima dos Santos, C. A. (1998). European Union 1997 Seafood-Safety Ban: The
Economic Impact on Bangladesh Shrimp Processing. Marine Resource Economics, 13, 215-
227.
Cato, J. C., & Lima dos Santos, C. A. (2000). Costs to Upgrade the Bangladesh Frozen Shrimp
Processing Sector to Adequate Technical and Safety Standards and to Maintain a HACCP
Program. In L. Unnevehr (Ed.) The Economics of HACCP: New Studies of Costs and
Benefits (385-402). St. Paul, Minn., USA: Eagan Press.
Cato, J. C., & Subasinge, S. (2003). Food Safety in Food Security and Food Trade – Case Study:
The Shrimp Export Industry in Bangladesh. Focus 10, Brief 9 of 17, International Food
Policy Research Institute, Washington, DC: IFPRI. Retrieved from
http://www.ifpri.org/sites/default/files/publications/focus10_09.pdf
Consumer Reports (2008). Consumer Reports Poll: Two-Thirds of Americans Want the FDA to
Inspect Domestic and Foreign Food Supply Once a Month. Press Released. November 12.
Washington DC, United States.
Crespi, J., & Marette, S. (2001). How Should Food Safety Certification Be Financed. American
Journal of Agricultural Economics, 83(4), 852-861. doi:10.1111/0002-9092.00214
Debaere, P. (2005). Small Fish-Big Issues: The effect of Trade Policy on the Global Shrimp
Market. Discussion paper 5254, Centre for Economic Policy Research, London: CEPR.

35
Disdier, A.C., & Marette, S. (2010). The Combination of Gravity and Welfare Approaches for
Evaluating Non-Tariff Measures. American Journal of Agricultural Economics, 92(3),
713-726. doi: 10.1093/ajae/aaq026
Duran, G. M., & Marshall, D. L. (2005). Ready-to-eat shrimp as an international vehicle of
antibiotic-resistant bacteria. Journal of Food Protection, 68(11), 2395-2401.
Fisher, R., & Serra, P. (2000). Standards and Protection. Journal of International Economics, 52,
377-400. doi:10.1016/S0022-1996(99)00058-6
Food and Agriculture Organization [FAO] (2004). Technical Workshop on Residues of
Veterinary Drugs without ADI/MRL. Final report. Rome, Italy: FAO/WHO. Retrieved from
http://www.fao.org/docrep/008/y5723e/y5723e00.htm
Food and Agriculture Organization [FAO] (2009). FishStat Plus - Universal software for fishery
statistical time series. Rome, Italy: FAO.
Hayes, D., Shogren, J., Shin, Y., & Kliebenstein, J. (1995). Valuing Food Safety in Experimental
Auction Markets. American Journal of Agricultural Economics, 77, 40-53.
doi:10.2307/1243887
Henson, S., & Loader, R. (2001). Barriers to Agricultural Exports from Developing Countries:
The Role of Sanitary and Phytosanitary Requirements. World Development, 29(1), 85-102.
doi: 10.1016/S0305-750X(00)00085-1
Holland, D., & Roheim Wessells, C. (1998). Predicting Consumer Preferences for Fresh Salmon:
The Influence of Safety Inspection and Production Method Attributes. Agricultural and
Resource Economics Review, 27(1), 1-14.
Hudson, D., Hite, D., Jaffar, A., & Kari, F. (2003). Environmental regulation through trade: the

36
case of shrimp. Journal of Environmental Management, 68(3), 231-238. doi:10.1016/S0301-
4797(03)00061-6
International Finance Corporation (2006). Improving Indonesia’s Competitiveness: Case Study
of Textile and Farmed Shrimp Industries. Washington DC, United States: World Bank.
Retrieved from
http://siteresources.worldbank.org/INTEXPCOMNET/Resources/Indonesia_textile_shrimp_
2006.pdf
International Institute for Fisheries Economics and Trade (2004). Disaggregated Projections on
Supply, Demand, and Trade for Developing Asia: Preliminary Results from the Asiafish
Model. IIFET 2004 Japan Proceedings. Retrieved from
http://oregonstate.edu/dept/IIFET/Japan/proceedupdates/306.pdf
Jaffee, S., & Henson, S. (2005). Agro-Food Exports from Developing Countries: The Challenge
Posed by Standards. In M. A. Aksoy and J. C. Beghin (Eds.), Global Agricultural Trade and
Developing Countries (91-114). Washington DC, United States: World Bank.
Marette, S. (2007). Minimum Safety Standard, Consumer’s Information and Competition.
Journal of Regulatory Economics, 32, 259-285. doi:10.1007/s11149-007-9036-x
Marette, S., & Beghin, J. C. (2010). Are Standards Always Protectionist? Review of International
Economics, 18, 179-192. doi:10.1111/j.1467-9396.2009.00856.x
Mayer, K. J., Nickerson, J. A., & Owan, H. (2004). Are supply and plant inspections
complements or substitutes? A strategic and operational assessment of inspection practices in
biotechnology. Management Science, 50(8), 1064-1081. doi:10.1287/mnsc.1040.0235
Nguyen, A. V. T, & Wilson, N. L. W. (2009). Effects of Food Safety Standards on Seafood

37
Exports to US, EU and Japan. Manuscript, Auburn University, United States.
Otsuki, T., Wilson, J. S., & Sewadeh, M. (2001a). What Price Precaution? European
Harmonisation of Aflatoxin Regulations and African Groundnut Exports. European Review
of Agricultural Economics, 28(3), 263-283. doi: 10.1093/erae/28.3.263
Otsuki, T., Wilson, J. S., & Sewadeh, M. (2001b). Saving two in a billion: quantifying the trade
effect of European food safety standards on African exports. Food Policy, 26(5), 495-514.
doi: 10.1016/S0306-9192(01)00018-5
Peridy, N., Guillotreau, P. & Bernard, P. (2000). The Impact of Prices on Seafood Trade: A
Panel Data Analysis of the French Seafood Market. Marine Resource Economics, 15, 45-66.
Roheim Wessells, C., & Anderson, J. G. (1995). Consumer Willingness to Pay for Seafood
Safety Assurance. Journal of Consumer Affairs, 29(1), 85-107. doi:10.1111/j.1745-
6606.1995.tb00040.x
Southern Shrimp Alliance (2007). Request for Comments to the Presidential Interagency.
Working Group on Import Safety [Docket No.2007N-0330], Rockville MD, United States.
Starbird, S. A. (2005). Moral Hazard, Inspection Policy, and Food Safety. American Journal of
Agricultural Economics, 87(1), 15-27. doi:10.1111/j.0002-9092.2005.00698.x
Starbird, S. A. (2007). Testing errors, supplier segregation, and food safety. Agricultural
Economics, 36(3), 325-334. doi:10.1111/j.1574-0862.2007.00210.x
Starbird, S. A., & Amanor-Boadu, V. (2006). Do Inspection and Traceability Provide Incentives
for Food Safety? Journal of Agricultural and Resource Economics, 31(1), 14-26.
United States General Accounting Office [GAO] (2001). FOOD SAFETY. Federal Oversight of

38
Seafood Does Not Sufficiently Protect Consumers. Report GAO-01-204, Washington DC,
United States: GAO. Retrieved from http://www.gao.gov/new.items/d01204.pdf
United States Government Accounting Office [GAO] (2004). FOOD SAFETY. FDA’s Imported
Seafood Safety Program Shows Some Progress, but Further Improvements Are Needed.
Report GAO-04-246, Washington DC, United States: GAO. Retrieved from
http://www.gao.gov/new.items/d04246.pdf
United States Government Accountability Office [GAO] (2009). SEAFOOD FRAUD. FDA
Program Changes and Better Collaboration among Key Federal Agencies Could Improve
Detection and Prevention. Report GAO-09-258, Washington DC, United States: GAO.
Retrieved from http://www.gao.gov/assets/290/287425.pdf
Wilson, J. S., & Otsuki, T. (2004). Standards and Technical Regulations and Firms in
Developing Countries: New Evidence from a World Bank Technical Barriers to Trade
Survey. Washington DC, United States: World Bank. Retrieved from
http://go.worldbank.org/18YE2SZTJ0
World Bank (2005). Shrimp, Fresh Asparagus, and Frozen Green Soybeans in Thailand.
Agriculture and Rural Development Discussion Paper 16, Washington DC, United States:
World Bank.
World Health Organization (2001). WHO Global Strategy for containment of Antimicrobial
Resistance. Document WHO/CDS/CSR/DRS/2001.2, Geneva, Switzerland: WHO.

39
Fig. 1. Market Equilibrium
p
q
D
a
ab0
A
r
Ap
S
t
AQz
FS
v
w fAQ
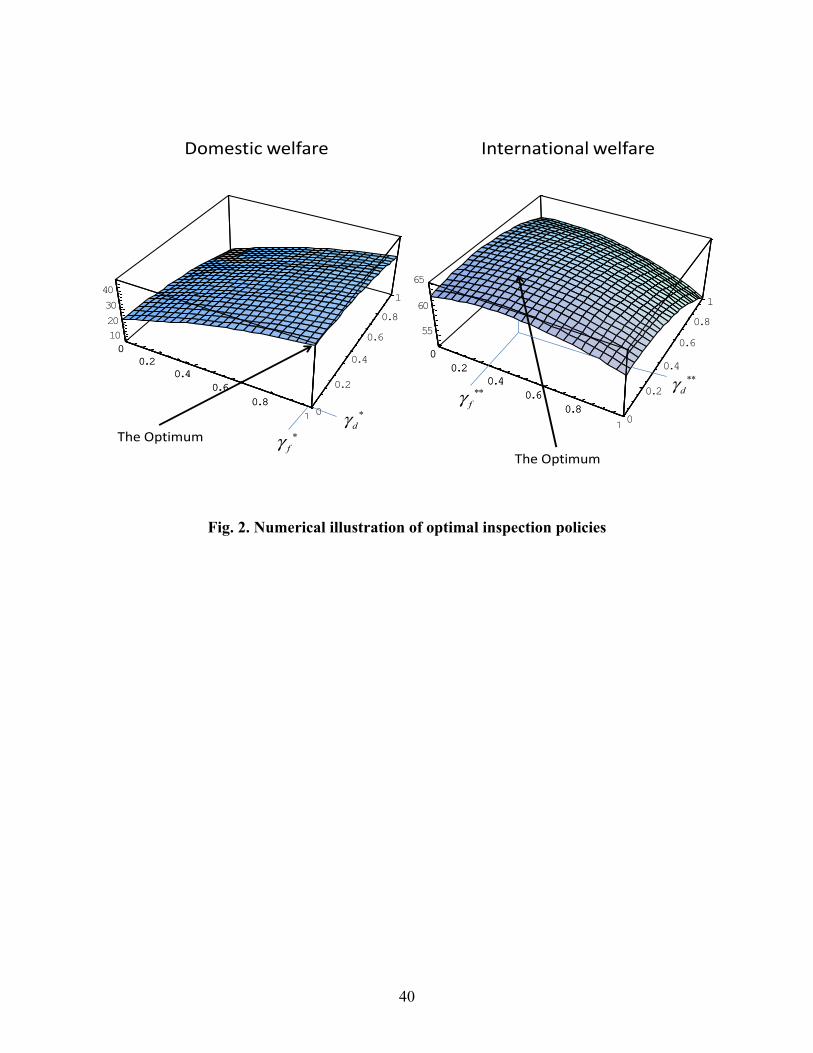
40
Fig. 2. Numerical illustration of optimal inspection policies
00.2
0.40.6
0.8
1 0
0.2
0.4
0.6
0.8
1
55
60
65
00.2
0.40.6
0.8
1
00.2
0.40.6
0.81 0
0.2
0.4
0.6
0.8
1
1020
30
40
00.2
0.40.6
0.81
Domestic welfare International welfare
*fγ
**dγ**
fγ*dγ
The OptimumThe Optimum

41
Fig. 3. Per-unit fees g under different scenarios
g
W
dW
fW
**gx0*g