THE ECONOMIC SITUATION IN THE ECE REGION IN MID-2005 · THE ECONOMIC SITUATION IN THE ECE REGION IN...
55
__________________________________________________________________________________________________ 1 THE ECONOMIC SITUATION IN THE ECE REGION IN MID-2005 1. The global context The global economic expansion is slowing down The global recovery, which started in 2002, peaked in 2004, when world output rose by 5.1 per cent. 1 In 2005, a moderate slowdown to some 4 per cent is currently forecast. In the major seven industrialized economies, real GDP rose by 0.7 in the first quarter of 2005, slightly higher than the increase in the previous three quarters (table 1.1). But this improvement reflects a statistical bias in the estimate of first quarter GDP in Germany and a surprisingly strong rebound in Japan, which is unlikely to be sustained. The slowing cyclical momentum is better reflected in the year-on-year rate of change in economic activity in the G7 countries, which decelerated to only 2.5 per cent in the first quarter of 2005, compared with 3.6 per cent in the same quarter of 2004. Other short-term indicators confirm the weakening of global economic expansion. The volume of world trade in goods appears to have declined in the first quarter of 2005, compared with the preceding quarter, the first fall since the final quarter of 2001. 2 Composite leading indicators for the seven major industrialized economies and for the OECD area for the first four months of 2005 suggest that a pervasive slowdown in the rate of growth lies ahead. The Ifo indicator of the global business climate fell in April for the fifth consecutive month, although remaining above its long-term average. 3 The factor restraining global expansion in 2005 is the sustained rise in oil prices to a relatively high level. In the United States, the expected further tightening of monetary policy should dampen domestic demand. In Asia, moderate growth forces in Japan contrast with a continuing robust, albeit decelerating, rate of economic expansion in China and India. The pace of economic activity is also slowing in Latin America. In the euro 1 IMF, World Economic Outlook (Washington, D.C.), April 2005. This is the world output growth based on weighting national growth rates by GDP valued at purchasing power parities. World output growth based on GDP weights valued at market exchange rates was 4 per cent in 2004. 2 CPB Netherlands Bureau for Economic Policy Analysis, World Trade Monitor, published 18 May 2005 [www.cpb.nl/ eng/pub/memorandum]. 3 Ifo Schnelldienst, 10/2005 (Munich), 31 May 2005, pp. 33-40. area, the lagged effects of the strong appreciation of the euro, combined with the slowdown of world trade will dampen economic activity in 2005, which is already being held back by the persistent sluggishness of domestic demand. A major feature of economic developments in 2005 remains the contrast between weak growth in western Europe and rapid growth in other major regions, including central and eastern Europe and the CIS. Within western Europe the weakness is concentrated in the euro area, and especially in the three major economies (France, Germany, Italy), although their sluggishness has also had adverse effects on some of the smaller west European economies. Oil prices rise to record levels The continuing strong demand for raw materials in combination with a limited supply response led to further increases in commodity prices during the first half of 2005. Crude oil and iron ore prices reached record levels (in nominal terms), while for copper, aluminium and nickel they were at their highest levels in 15 years. Demand for base metals was driven by buoyant world TABLE 1.1 Quarterly changes in real GDP in the major industrialized economies, 2004-2005QI (Percentage change over previous period) 2004 2005 QI QII QIII QIV QI France ............................. 0.6 0.6 0.2 0.7 0.2 Germany .......................... 0.4 0.2 – -0.1 1.0 Italy .................................. 0.5 0.4 0.4 -0.4 -0.5 United Kingdom ............... 0.7 1.0 0.6 0.7 0.5 Canada ............................ 0.6 1.2 0.9 0.5 0.6 United States ................... 1.1 0.8 1.0 0.9 0.9 Japan ............................... 1.3 -0.2 -0.2 0.1 1.2 Total above ......................... 0.9 0.6 0.6 0.6 0.7 Memorandum items: Euro area ........................ 0.7 0.4 0.3 0.2 0.5 EU-15 .............................. 0.7 0.5 0.3 0.2 0.5 EU-25 .............................. 0.7 0.5 0.3 0.3 0.5 Western Europe a .......... 0.7 0.5 0.3 0.3 0.5 Western Europe and North America .............. 0.9 0.7 0.7 0.6 0.7 Source: National statistics; Eurostat, NewCronos Database. Note: Data are seasonally adjusted. a Western Europe: EU-15 plus Norway and Switzerland.
Transcript of THE ECONOMIC SITUATION IN THE ECE REGION IN MID-2005 · THE ECONOMIC SITUATION IN THE ECE REGION IN...

__________________________________________________________________________________________________ 1
THE ECONOMIC SITUATION IN THE ECE REGION IN MID-2005
1. The global context
The global economic expansion is slowing down
The global recovery, which started in 2002, peaked in 2004, when world output rose by 5.1 per cent.1 In 2005, a moderate slowdown to some 4 per cent is currently forecast. In the major seven industrialized economies, real GDP rose by 0.7 in the first quarter of 2005, slightly higher than the increase in the previous three quarters (table 1.1). But this improvement reflects a statistical bias in the estimate of first quarter GDP in Germany and a surprisingly strong rebound in Japan, which is unlikely to be sustained. The slowing cyclical momentum is better reflected in the year-on-year rate of change in economic activity in the G7 countries, which decelerated to only 2.5 per cent in the first quarter of 2005, compared with 3.6 per cent in the same quarter of 2004.
Other short-term indicators confirm the weakening of global economic expansion. The volume of world trade in goods appears to have declined in the first quarter of 2005, compared with the preceding quarter, the first fall since the final quarter of 2001.2 Composite leading indicators for the seven major industrialized economies and for the OECD area for the first four months of 2005 suggest that a pervasive slowdown in the rate of growth lies ahead. The Ifo indicator of the global business climate fell in April for the fifth consecutive month, although remaining above its long-term average.3
The factor restraining global expansion in 2005 is the sustained rise in oil prices to a relatively high level. In the United States, the expected further tightening of monetary policy should dampen domestic demand. In Asia, moderate growth forces in Japan contrast with a continuing robust, albeit decelerating, rate of economic expansion in China and India. The pace of economic activity is also slowing in Latin America. In the euro
1 IMF, World Economic Outlook (Washington, D.C.), April
2005. This is the world output growth based on weighting national growth rates by GDP valued at purchasing power parities. World output growth based on GDP weights valued at market exchange rates was 4 per cent in 2004.
2 CPB Netherlands Bureau for Economic Policy Analysis, World Trade Monitor, published 18 May 2005 [www.cpb.nl/ eng/pub/memorandum].
3 Ifo Schnelldienst, 10/2005 (Munich), 31 May 2005, pp. 33-40.
area, the lagged effects of the strong appreciation of the euro, combined with the slowdown of world trade will dampen economic activity in 2005, which is already being held back by the persistent sluggishness of domestic demand. A major feature of economic developments in 2005 remains the contrast between weak growth in western Europe and rapid growth in other major regions, including central and eastern Europe and the CIS. Within western Europe the weakness is concentrated in the euro area, and especially in the three major economies (France, Germany, Italy), although their sluggishness has also had adverse effects on some of the smaller west European economies.
Oil prices rise to record levels
The continuing strong demand for raw materials in combination with a limited supply response led to further increases in commodity prices during the first half of 2005. Crude oil and iron ore prices reached record levels (in nominal terms), while for copper, aluminium and nickel they were at their highest levels in 15 years. Demand for base metals was driven by buoyant world
TABLE 1.1
Quarterly changes in real GDP in the major industrialized economies, 2004-2005QI
(Percentage change over previous period)
2004 2005
QI QII QIII QIV QI
France ............................. 0.6 0.6 0.2 0.7 0.2 Germany .......................... 0.4 0.2 – -0.1 1.0 Italy .................................. 0.5 0.4 0.4 -0.4 -0.5 United Kingdom ............... 0.7 1.0 0.6 0.7 0.5
Canada ............................ 0.6 1.2 0.9 0.5 0.6 United States ................... 1.1 0.8 1.0 0.9 0.9 Japan ............................... 1.3 -0.2 -0.2 0.1 1.2
Total above ......................... 0.9 0.6 0.6 0.6 0.7
Memorandum items: Euro area ........................ 0.7 0.4 0.3 0.2 0.5 EU-15 .............................. 0.7 0.5 0.3 0.2 0.5 EU-25 .............................. 0.7 0.5 0.3 0.3 0.5 Western Europe a .......... 0.7 0.5 0.3 0.3 0.5 Western Europe and North America .............. 0.9 0.7 0.7 0.6 0.7
Source: National statistics; Eurostat, NewCronos Database. Note: Data are seasonally adjusted. a Western Europe: EU-15 plus Norway and Switzerland.

2 _________________________________________________________________ Economic Survey of Europe, 2005 No. 2
steel markets4 and by China’s soaring consumption. Prices of non-energy commodities, however, have softened somewhat since April 2005 (chart 1.1), reflecting a slower rate of expansion of world industrial production and expectations of increased supply. After several years of minimal investment, the recent upward swing in prices has spurred commodity producers to increase capacity. The additional output of several commodities (including metals) should reach the markets from late 2005, but in the meantime prices are expected to remain at high levels.
Petroleum prices reached record levels in March and again in June 2005, when Brent crude was close to $60/barrel, some 50 per cent higher than a year earlier (chart 1.2). This was a result of the strong growth in demand combined with very limited spare capacity and continuing fears about geopolitical stability. The tightness in the upstream markets was aggravated by the lack of sufficient capacity at the refining stage.5
4 Steel supply and demand continued growing in 2005 – when
they were expected to reach record levels – but at a slower pace than during the boom of 2004. Since early 2005 prices have been falling from their peak levels, pulled down by moderating demand growth, a stock overhang from 2004, increasing exports from China and concerns about worldwide excess capacity.
5 Although OPEC has increased its crude oil output to almost full capacity, worldwide there were refining bottlenecks to process the type of petroleum that the group produces, and therefore the increased output of crude oil failed to lower prices.
However, until mid-2005 rising prices had still not dented the growth of oil consumption, so world petroleum demand is now forecast to rise by 2.2 per cent in 2005 as a whole, after having grown by 3.5 per cent in 2004, the largest annual increase in 25 years.6 Futures market prices and current forecasts indicate that prices will remain high (around $50/barrel) for the next two years. This mainly reflects the view that the currently planned investment in global capacity is not sufficient to reduce the existing vulnerability of the oil market to temporary supply disruptions and demand shocks. Deflating nominal oil prices by the unit value index of manufactures exported by developed countries, crude oil prices during the first half of 2005 were close to their average level following the second oil shock (1980-1985).
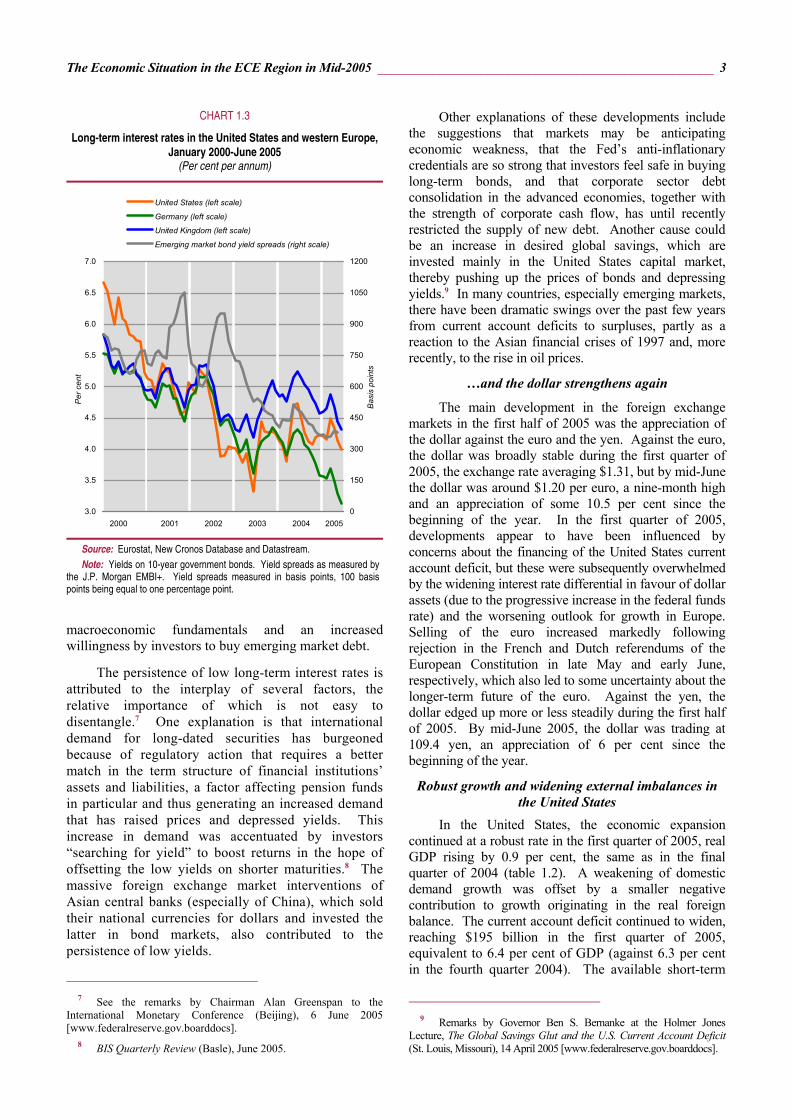
Long-term interest rates remain unusually low
The most striking feature of the international debt securities market in 2005 has been the unusual behaviour of long-term interest rates, which have remained unexpectedly low, despite a 200 basis points increase in the United States federal funds rate since June 2004 (chart 1.3). Yields on 10-year United States treasury bills declined by 80 basis points to about 4 per cent in the 12 months to early June amid persistent economic strength and a rising rate of headline inflation. Long-term rates were also close to or below historic lows in most other countries (except Japan) including in emerging markets.
Spreads on emerging market bonds fell to new lows during the first half of 2005. Borrowing by emerging markets – at record levels in 2004 – remained strong in the first two quarters of 2005, due to improved
6 International Energy Agency, Oil Market Report (Paris), 10
June 2005.
CHART 1.1
Selected non-energy commodity prices, January 2000-May 2005 (Indices, 2000=100)
70
90
110
130
150
170
190
210
230
250
2000 2001 2002 2003 2004 2005
Total non-energy
Non-ferrous metals
Food, including tropical beverages and sugar
Iron and scrap
Source: Hamburg Institute of International Economics (HWWA). Note: Indices calculated on the basis of current dollar prices and weighted
by the average shares of the various product categories in total OECD commodity imports in 1999-2001.
CHART 1.2
Crude petroleum prices, January 2000-June 2005 (Dollars per barrel)
10
15
20
25
30
35
40
45
50
55
60
2000 2001 2002 2003 2004 2005
Source: United States Department of Energy, Weekly Status Petroleum Report (Washington, D.C.), several issues [www.eia.doe.gov].
Note: Spot price of Brent crude, monthly averages.
The Economic Situation in the ECE Region in Mid-2005 _________________________________________________ 3
macroeconomic fundamentals and an increased willingness by investors to buy emerging market debt.
The persistence of low long-term interest rates is attributed to the interplay of several factors, the relative importance of which is not easy to disentangle.7 One explanation is that international demand for long-dated securities has burgeoned because of regulatory action that requires a better match in the term structure of financial institutions’ assets and liabilities, a factor affecting pension funds in particular and thus generating an increased demand that has raised prices and depressed yields. This increase in demand was accentuated by investors “searching for yield” to boost returns in the hope of offsetting the low yields on shorter maturities.8 The massive foreign exchange market interventions of Asian central banks (especially of China), which sold their national currencies for dollars and invested the latter in bond markets, also contributed to the persistence of low yields.
7 See the remarks by Chairman Alan Greenspan to the
International Monetary Conference (Beijing), 6 June 2005 [www.federalreserve.gov.boarddocs].
8 BIS Quarterly Review (Basle), June 2005.
Other explanations of these developments include the suggestions that markets may be anticipating economic weakness, that the Fed’s anti-inflationary credentials are so strong that investors feel safe in buying long-term bonds, and that corporate sector debt consolidation in the advanced economies, together with the strength of corporate cash flow, has until recently restricted the supply of new debt. Another cause could be an increase in desired global savings, which are invested mainly in the United States capital market, thereby pushing up the prices of bonds and depressing yields.9 In many countries, especially emerging markets, there have been dramatic swings over the past few years from current account deficits to surpluses, partly as a reaction to the Asian financial crises of 1997 and, more recently, to the rise in oil prices.
…and the dollar strengthens again
The main development in the foreign exchange markets in the first half of 2005 was the appreciation of the dollar against the euro and the yen. Against the euro, the dollar was broadly stable during the first quarter of 2005, the exchange rate averaging $1.31, but by mid-June the dollar was around $1.20 per euro, a nine-month high and an appreciation of some 10.5 per cent since the beginning of the year. In the first quarter of 2005, developments appear to have been influenced by concerns about the financing of the United States current account deficit, but these were subsequently overwhelmed by the widening interest rate differential in favour of dollar assets (due to the progressive increase in the federal funds rate) and the worsening outlook for growth in Europe. Selling of the euro increased markedly following rejection in the French and Dutch referendums of the European Constitution in late May and early June, respectively, which also led to some uncertainty about the longer-term future of the euro. Against the yen, the dollar edged up more or less steadily during the first half of 2005. By mid-June 2005, the dollar was trading at 109.4 yen, an appreciation of 6 per cent since the beginning of the year.
Robust growth and widening external imbalances in the United States
In the United States, the economic expansion continued at a robust rate in the first quarter of 2005, real GDP rising by 0.9 per cent, the same as in the final quarter of 2004 (table 1.2). A weakening of domestic demand growth was offset by a smaller negative contribution to growth originating in the real foreign balance. The current account deficit continued to widen, reaching $195 billion in the first quarter of 2005, equivalent to 6.4 per cent of GDP (against 6.3 per cent in the fourth quarter 2004). The available short-term
9 Remarks by Governor Ben S. Bernanke at the Holmer Jones
Lecture, The Global Savings Glut and the U.S. Current Account Deficit (St. Louis, Missouri), 14 April 2005 [www.federalreserve.gov.boarddocs].
CHART 1.3
Long-term interest rates in the United States and western Europe, January 2000-June 2005
(Per cent per annum)
3.0
3.5
4.0
4.5
5.0
5.5
6.0
6.5
7.0
2000 2001 2002 2003 2004 2005
Per c
ent
0
150
300
450
600
750
900
1050
1200
Basi
s po
ints
United States (left scale)
Germany (left scale)
United Kingdom (left scale)
Emerging market bond yield spreads (right scale)
Source: Eurostat, New Cronos Database and Datastream. Note: Yields on 10-year government bonds. Yield spreads as measured by
the J.P. Morgan EMBI+. Yield spreads measured in basis points, 100 basis points being equal to one percentage point.
4 _________________________________________________________________ Economic Survey of Europe, 2005 No. 2
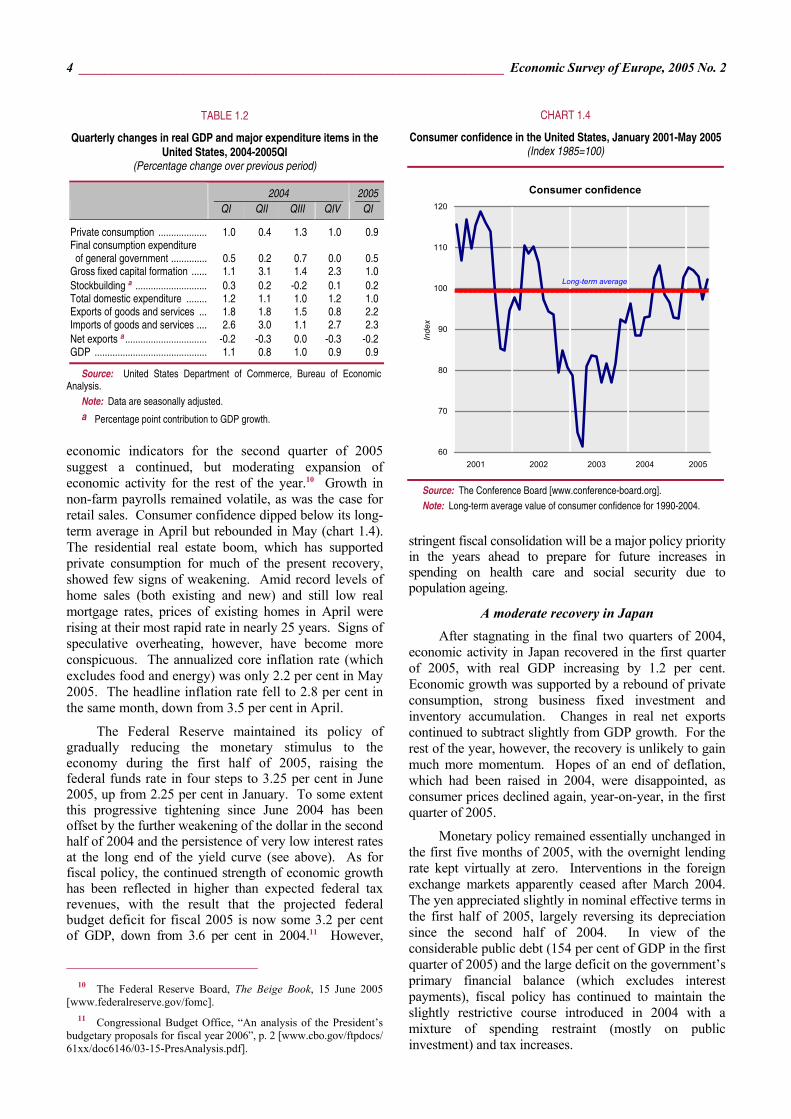
economic indicators for the second quarter of 2005 suggest a continued, but moderating expansion of economic activity for the rest of the year.10 Growth in non-farm payrolls remained volatile, as was the case for retail sales. Consumer confidence dipped below its long-term average in April but rebounded in May (chart 1.4). The residential real estate boom, which has supported private consumption for much of the present recovery, showed few signs of weakening. Amid record levels of home sales (both existing and new) and still low real mortgage rates, prices of existing homes in April were rising at their most rapid rate in nearly 25 years. Signs of speculative overheating, however, have become more conspicuous. The annualized core inflation rate (which excludes food and energy) was only 2.2 per cent in May 2005. The headline inflation rate fell to 2.8 per cent in the same month, down from 3.5 per cent in April.
The Federal Reserve maintained its policy of gradually reducing the monetary stimulus to the economy during the first half of 2005, raising the federal funds rate in four steps to 3.25 per cent in June 2005, up from 2.25 per cent in January. To some extent this progressive tightening since June 2004 has been offset by the further weakening of the dollar in the second half of 2004 and the persistence of very low interest rates at the long end of the yield curve (see above). As for fiscal policy, the continued strength of economic growth has been reflected in higher than expected federal tax revenues, with the result that the projected federal budget deficit for fiscal 2005 is now some 3.2 per cent of GDP, down from 3.6 per cent in 2004.11 However,
10 The Federal Reserve Board, The Beige Book, 15 June 2005
[www.federalreserve.gov/fomc]. 11 Congressional Budget Office, “An analysis of the President’s
budgetary proposals for fiscal year 2006”, p. 2 [www.cbo.gov/ftpdocs/ 61xx/doc6146/03-15-PresAnalysis.pdf].
stringent fiscal consolidation will be a major policy priority in the years ahead to prepare for future increases in spending on health care and social security due to population ageing.
A moderate recovery in Japan After stagnating in the final two quarters of 2004,
economic activity in Japan recovered in the first quarter of 2005, with real GDP increasing by 1.2 per cent. Economic growth was supported by a rebound of private consumption, strong business fixed investment and inventory accumulation. Changes in real net exports continued to subtract slightly from GDP growth. For the rest of the year, however, the recovery is unlikely to gain much more momentum. Hopes of an end of deflation, which had been raised in 2004, were disappointed, as consumer prices declined again, year-on-year, in the first quarter of 2005.
Monetary policy remained essentially unchanged in the first five months of 2005, with the overnight lending rate kept virtually at zero. Interventions in the foreign exchange markets apparently ceased after March 2004. The yen appreciated slightly in nominal effective terms in the first half of 2005, largely reversing its depreciation since the second half of 2004. In view of the considerable public debt (154 per cent of GDP in the first quarter of 2005) and the large deficit on the government’s primary financial balance (which excludes interest payments), fiscal policy has continued to maintain the slightly restrictive course introduced in 2004 with a mixture of spending restraint (mostly on public investment) and tax increases.
TABLE 1.2
Quarterly changes in real GDP and major expenditure items in the United States, 2004-2005QI
(Percentage change over previous period)
2004 2005
QI QII QIII QIV QI
Private consumption ................... 1.0 0.4 1.3 1.0 0.9 Final consumption expenditure of general government .............. 0.5 0.2 0.7 0.0 0.5 Gross fixed capital formation ...... 1.1 3.1 1.4 2.3 1.0 Stockbuilding a ............................ 0.3 0.2 -0.2 0.1 0.2 Total domestic expenditure ........ 1.2 1.1 1.0 1.2 1.0 Exports of goods and services ... 1.8 1.8 1.5 0.8 2.2 Imports of goods and services .... 2.6 3.0 1.1 2.7 2.3 Net exports a ................................ -0.2 -0.3 0.0 -0.3 -0.2 GDP ............................................ 1.1 0.8 1.0 0.9 0.9
Source: United States Department of Commerce, Bureau of Economic Analysis.
Note: Data are seasonally adjusted. a Percentage point contribution to GDP growth.
CHART 1.4
Consumer confidence in the United States, January 2001-May 2005 (Index 1985=100)
Consumer confidence
60
70
80
90
100
110
120
2001 2002 2003 2004 2005
Inde
x
Long-term average
Source: The Conference Board [www.conference-board.org]. Note: Long-term average value of consumer confidence for 1990-2004.

The Economic Situation in the ECE Region in Mid-2005 _________________________________________________ 5
Continued strong growth in emerging markets in Asia
Despite some slowdown, partly due to high oil prices, economic growth remained strong in emerging Asia, supported by expansionary domestic policies and by continued strong growth in China, a key market for much of the region’s exports. Real GDP in China grew 9.4 per cent year-on-year in the first quarter 2005, hardly changed from the 9.5 per cent in the fourth quarter of 2004. The rate of expansion has remained unexpectedly strong despite efforts by the authorities to cool the economy. The ratio of fixed investment to GDP continues to rise and now stands at close to 50 per cent, a level which can hardly be sustained for very long. Exports also continued to grow vigorously (by 30 per cent, year-on-year, in May), supported by a competitive exchange rate and the removal of developed country import quotas for textiles under the WTO’s Agreement on Textiles and Clothing at the beginning of 2005.12 While the risk of overheating and a subsequent hard landing remains, there are some signs of a slowdown in domestic demand. In particular, growth in fixed investment has decelerated from over 40 per cent, year-on-year, in the first quarter of 2004 to some 25 per cent in 2005, reflecting administrative curbs on investment in several sectors. While China until mid-2005 resisted calls to revalue its currency to help redress global current account imbalances, it introduced measures to develop its foreign exchange markets and to rely more on market-based tools of monetary policy, steps that could be seen as preparing the country for greater exchange rate flexibility.
…and Latin America
The rate of economic expansion in Latin America moderated somewhat in 2005, following the most rapid annual rate of growth in real GDP in 25 years (5.7 per cent in 2004). For 2005 as a whole, the average rate of growth is forecast at 4.1 per cent.13 Domestic demand in the two largest economies – Brazil and Mexico – weakened due to tighter monetary policies, while in some countries growth moderated following post-crisis recoveries (e.g. Argentina and Venezuela). Some aspects of the international environment that had previously supported the region’s growth – such as the rapid expansion of world commodity demand and narrow interest rate spreads on international financing – became less favourable. The major downside risk facing the region in 2005 is a strengthening of these two developments, which would translate into smaller
12 The EU, however, has agreed with China a further adjustment
period of three years for European textile producers, in addition to the 10 years provided in the Uruguay Round, and this should slow the expansion of Chinese textile exports below their rate of the first few months of 2005.
13 IMF, World Economic Outlook (Washington, D.C.), April 2005 [www.imf.org].
foreign capital inflows, higher interest rates and a decline in commodity prices.
2. Western Europe and the new EU-10
(i) Western Europe
Economic activity remained sluggish in the euro area
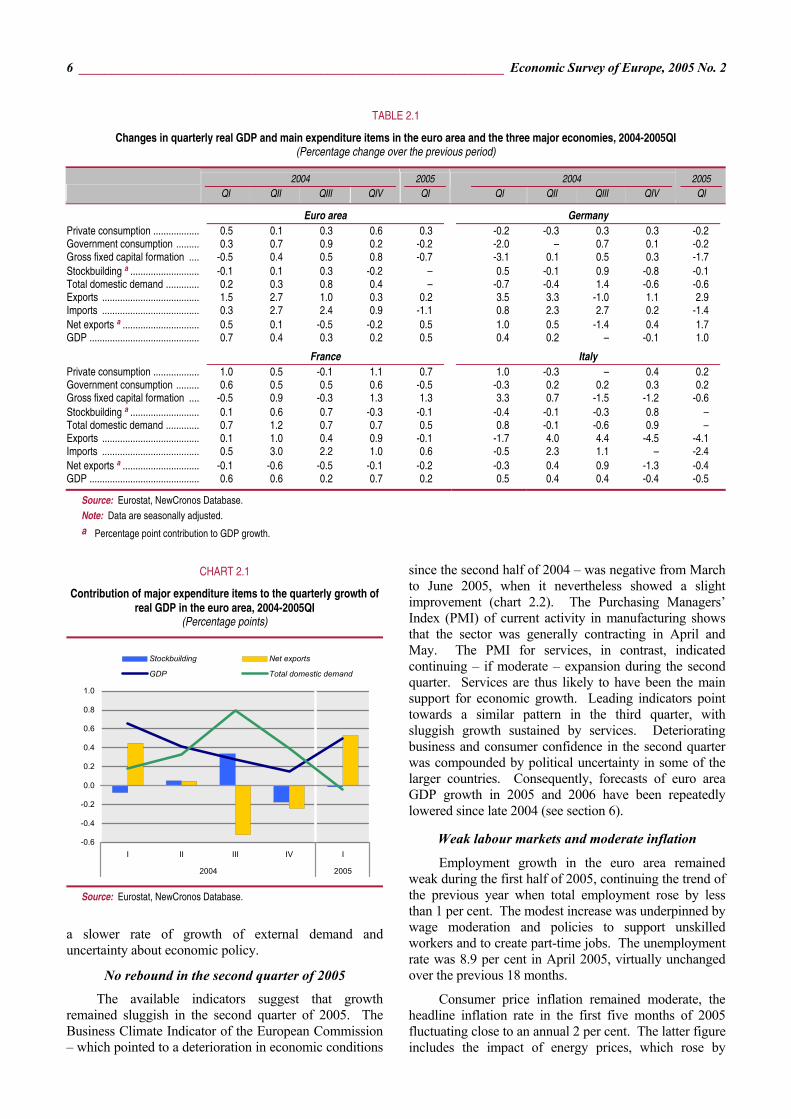
Economic activity in the euro area was subdued during the first half of 2005, continuing the slowdown under way since mid-2004. Real GDP rose by 0.5 per cent during the first quarter of 2005 compared with the preceding quarter, when there was a corresponding increase by only 0.2 per cent (table 2.1). But this improved performance reflected statistical effects.14 Compared with the same period of 2004, aggregate output rose by only 0.9 per cent in the first quarter of 2005, the smallest year-on-year increase in one and a half years. First quarter growth was also unbalanced, resulting solely from an increase in real net exports while domestic demand stagnated (chart 2.1). The volume growth of exports had provided a strong impulse to economic activity from mid-2003 to mid-2004, but it has since decelerated due to the effective appreciation of the euro and the slowdown in world trade in early 2005. The volume of imports declined strongly during the first quarter of 2005.
…held back by weak domestic demand
The growth of private consumption in the euro area slowed down in the first quarter of 2005 to 0.3 per cent, reversing the acceleration of the previous quarter. Household demand was constrained by the slow growth of disposable income, reflecting wage moderation and only a small increase of employment. In addition, the uncertainty concerning pensions and unemployment benefits due to ongoing reforms in several countries has led to higher rates of saving, while higher energy prices have reduced purchasing power for non-energy products. Consumer confidence declined during the first half of 2005 and remains below its long-term average (chart 2.2).
Fixed investment fell by 0.7 per cent during the first quarter of 2005, as temporary factors led to a sharp fall in construction investment, while investment in machinery probably expanded moderately.15 Despite favourable financing conditions, increased profitability and stronger corporate balance sheets, fixed investment has been subdued, due to the strong euro, weak domestic demand,
14 The adjustment for working days resulted in an understatement
of GDP growth in the last quarter of 2004 and an overstatement of growth during the first quarter of 2005.
15 ECB, Monthly Bulletin (Frankfurt am Main), June 2005 [www.ecb.int].
6 _________________________________________________________________ Economic Survey of Europe, 2005 No. 2
a slower rate of growth of external demand and uncertainty about economic policy.
No rebound in the second quarter of 2005
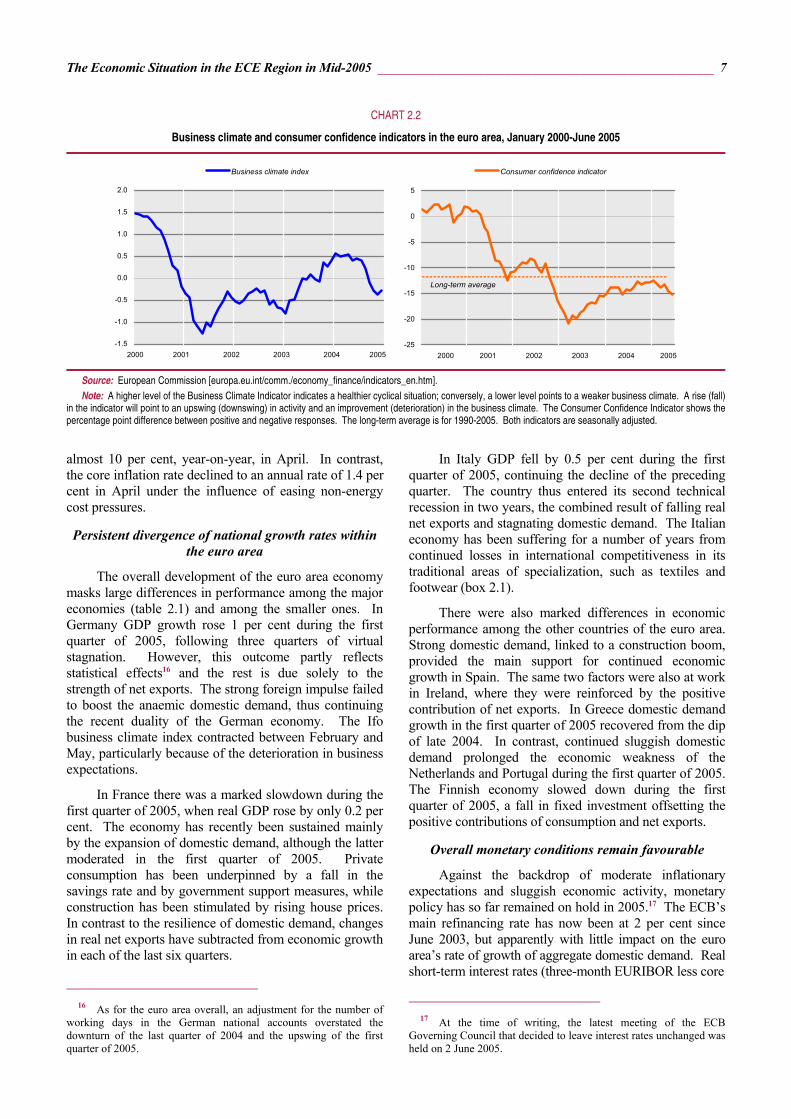
The available indicators suggest that growth remained sluggish in the second quarter of 2005. The Business Climate Indicator of the European Commission – which pointed to a deterioration in economic conditions
since the second half of 2004 – was negative from March to June 2005, when it nevertheless showed a slight improvement (chart 2.2). The Purchasing Managers’ Index (PMI) of current activity in manufacturing shows that the sector was generally contracting in April and May. The PMI for services, in contrast, indicated continuing – if moderate – expansion during the second quarter. Services are thus likely to have been the main support for economic growth. Leading indicators point towards a similar pattern in the third quarter, with sluggish growth sustained by services. Deteriorating business and consumer confidence in the second quarter was compounded by political uncertainty in some of the larger countries. Consequently, forecasts of euro area GDP growth in 2005 and 2006 have been repeatedly lowered since late 2004 (see section 6).
Weak labour markets and moderate inflation
Employment growth in the euro area remained weak during the first half of 2005, continuing the trend of the previous year when total employment rose by less than 1 per cent. The modest increase was underpinned by wage moderation and policies to support unskilled workers and to create part-time jobs. The unemployment rate was 8.9 per cent in April 2005, virtually unchanged over the previous 18 months.
Consumer price inflation remained moderate, the headline inflation rate in the first five months of 2005 fluctuating close to an annual 2 per cent. The latter figure includes the impact of energy prices, which rose by
TABLE 2.1
Changes in quarterly real GDP and main expenditure items in the euro area and the three major economies, 2004-2005QI (Percentage change over the previous period)
2004 2005 2004 2005
QI QII QIII QIV QI QI QII QIII QIV QI
Euro area Germany Private consumption ................... 0.5 0.1 0.3 0.6 0.3 -0.2 -0.3 0.3 0.3 -0.2 Government consumption .......... 0.3 0.7 0.9 0.2 -0.2 -2.0 – 0.7 0.1 -0.2 Gross fixed capital formation ..... -0.5 0.4 0.5 0.8 -0.7 -3.1 0.1 0.5 0.3 -1.7 Stockbuilding a ............................ -0.1 0.1 0.3 -0.2 – 0.5 -0.1 0.9 -0.8 -0.1 Total domestic demand .............. 0.2 0.3 0.8 0.4 – -0.7 -0.4 1.4 -0.6 -0.6 Exports ....................................... 1.5 2.7 1.0 0.3 0.2 3.5 3.3 -1.0 1.1 2.9 Imports ....................................... 0.3 2.7 2.4 0.9 -1.1 0.8 2.3 2.7 0.2 -1.4 Net exports a ............................... 0.5 0.1 -0.5 -0.2 0.5 1.0 0.5 -1.4 0.4 1.7 GDP ............................................ 0.7 0.4 0.3 0.2 0.5 0.4 0.2 – -0.1 1.0
France Italy Private consumption ................... 1.0 0.5 -0.1 1.1 0.7 1.0 -0.3 – 0.4 0.2 Government consumption .......... 0.6 0.5 0.5 0.6 -0.5 -0.3 0.2 0.2 0.3 0.2 Gross fixed capital formation ..... -0.5 0.9 -0.3 1.3 1.3 3.3 0.7 -1.5 -1.2 -0.6 Stockbuilding a ............................ 0.1 0.6 0.7 -0.3 -0.1 -0.4 -0.1 -0.3 0.8 – Total domestic demand .............. 0.7 1.2 0.7 0.7 0.5 0.8 -0.1 -0.6 0.9 – Exports ....................................... 0.1 1.0 0.4 0.9 -0.1 -1.7 4.0 4.4 -4.5 -4.1 Imports ....................................... 0.5 3.0 2.2 1.0 0.6 -0.5 2.3 1.1 – -2.4 Net exports a ............................... -0.1 -0.6 -0.5 -0.1 -0.2 -0.3 0.4 0.9 -1.3 -0.4 GDP ............................................ 0.6 0.6 0.2 0.7 0.2 0.5 0.4 0.4 -0.4 -0.5
Source: Eurostat, NewCronos Database. Note: Data are seasonally adjusted. a Percentage point contribution to GDP growth.
CHART 2.1
Contribution of major expenditure items to the quarterly growth of real GDP in the euro area, 2004-2005QI
(Percentage points)
-0.6
-0.4
-0.2
0.0
0.2
0.4
0.6
0.8
1.0
I II III IV I
2004 2005
Stockbuilding Net exports
GDP Total domestic demand
Source: Eurostat, NewCronos Database.
The Economic Situation in the ECE Region in Mid-2005 _________________________________________________ 7
almost 10 per cent, year-on-year, in April. In contrast, the core inflation rate declined to an annual rate of 1.4 per cent in April under the influence of easing non-energy cost pressures.
Persistent divergence of national growth rates within the euro area
The overall development of the euro area economy masks large differences in performance among the major economies (table 2.1) and among the smaller ones. In Germany GDP growth rose 1 per cent during the first quarter of 2005, following three quarters of virtual stagnation. However, this outcome partly reflects statistical effects16 and the rest is due solely to the strength of net exports. The strong foreign impulse failed to boost the anaemic domestic demand, thus continuing the recent duality of the German economy. The Ifo business climate index contracted between February and May, particularly because of the deterioration in business expectations.
In France there was a marked slowdown during the first quarter of 2005, when real GDP rose by only 0.2 per cent. The economy has recently been sustained mainly by the expansion of domestic demand, although the latter moderated in the first quarter of 2005. Private consumption has been underpinned by a fall in the savings rate and by government support measures, while construction has been stimulated by rising house prices. In contrast to the resilience of domestic demand, changes in real net exports have subtracted from economic growth in each of the last six quarters.
16 As for the euro area overall, an adjustment for the number of
working days in the German national accounts overstated the downturn of the last quarter of 2004 and the upswing of the first quarter of 2005.
In Italy GDP fell by 0.5 per cent during the first quarter of 2005, continuing the decline of the preceding quarter. The country thus entered its second technical recession in two years, the combined result of falling real net exports and stagnating domestic demand. The Italian economy has been suffering for a number of years from continued losses in international competitiveness in its traditional areas of specialization, such as textiles and footwear (box 2.1).
There were also marked differences in economic performance among the other countries of the euro area. Strong domestic demand, linked to a construction boom, provided the main support for continued economic growth in Spain. The same two factors were also at work in Ireland, where they were reinforced by the positive contribution of net exports. In Greece domestic demand growth in the first quarter of 2005 recovered from the dip of late 2004. In contrast, continued sluggish domestic demand prolonged the economic weakness of the Netherlands and Portugal during the first quarter of 2005. The Finnish economy slowed down during the first quarter of 2005, a fall in fixed investment offsetting the positive contributions of consumption and net exports.
Overall monetary conditions remain favourable
Against the backdrop of moderate inflationary expectations and sluggish economic activity, monetary policy has so far remained on hold in 2005.17 The ECB’s main refinancing rate has now been at 2 per cent since June 2003, but apparently with little impact on the euro area’s rate of growth of aggregate domestic demand. Real short-term interest rates (three-month EURIBOR less core
17 At the time of writing, the latest meeting of the ECB
Governing Council that decided to leave interest rates unchanged was held on 2 June 2005.
CHART 2.2
Business climate and consumer confidence indicators in the euro area, January 2000-June 2005
-1.5
-1.0
-0.5
0.0
0.5
1.0
1.5
2.0
2000 2001 2002 2003 2004 2005
Business climate index
-25
-20
-15
-10
-5
0
5
2000 2001 2002 2003 2004 2005
Consumer confidence indicator
Long-term average
Source: European Commission [europa.eu.int/comm./economy_finance/indicators_en.htm]. Note: A higher level of the Business Climate Indicator indicates a healthier cyclical situation; conversely, a lower level points to a weaker business climate. A rise (fall)
in the indicator will point to an upswing (downswing) in activity and an improvement (deterioration) in the business climate. The Consumer Confidence Indicator shows thepercentage point difference between positive and negative responses. The long-term average is for 1990-2005. Both indicators are seasonally adjusted.
8 _________________________________________________________________ Economic Survey of Europe, 2005 No. 2
inflation) were only about half a percentage point in May. Overall monetary conditions, i.e. the combined effect of changes in real short-term interest rates and the real effective exchange rate, eased slightly between late 2004 and April 2005 on account of the depreciation of the euro. The selling pressure on the euro following the referendums in France and the Netherlands in May and June 2005 has led to a further easing of monetary conditions. Nominal long-term interest rates, moreover, remained historically low (see above).
Money supply growth (M3) has remained significantly above the ECB’s reference value of 4.5 per cent since heightened economic risks and uncertainty in 2001 led to an unusually strong shift in investors’ portfolios towards risk-free short-term financial assets. This adjustment led to a decline in the growth of M3 during 2003 until mid-2004, although the process may not be complete. The growth of M3, however, has been
rising since then, at an average rate of 6.5 per cent (year-on-year) during the first four months of 2005. This process, accompanied by large increases in demand for loans from the private sector, is not judged by the ECB to pose an upside risk to inflation in the short term, and, if at all, only in the medium term. Such concerns appear to have argued against a lowering of interest rates in the second half of 2004.18
Fiscal policy will be slightly restrictive in 2005 The progressive deterioration of public finances in
the euro area between 2001 and 2003 was arrested in 2004, when the average general government budget
18 “The monetary pillar of the ECB”, speech by Ottmar Issing,
Member of the Executive Board of the ECB at The ECB and its Watchers VII Conference (Frankfurt am Main), 3 June 2005 [www.ecb.int/press/key/date/2005/html].
BOX 2.1
Adjustment pressures from changes in international competitiveness
The real effective exchange rate (REER) of the euro area, after initially falling in 1999, has been on a progressive rise since 2000.In 2004, its average level was some 19 per cent higher than in 2000, indicating a significant loss of international pricecompetitiveness for the euro area as a whole vis-à-vis the rest of the world. This reflected the pronounced appreciation of thenominal effective exchange rate of the euro, which rose by 25 per cent over this period. Given that foreign (consumer) pricesincreased on average more than in the euro area the real effective appreciation of the euro was correspondingly reduced.
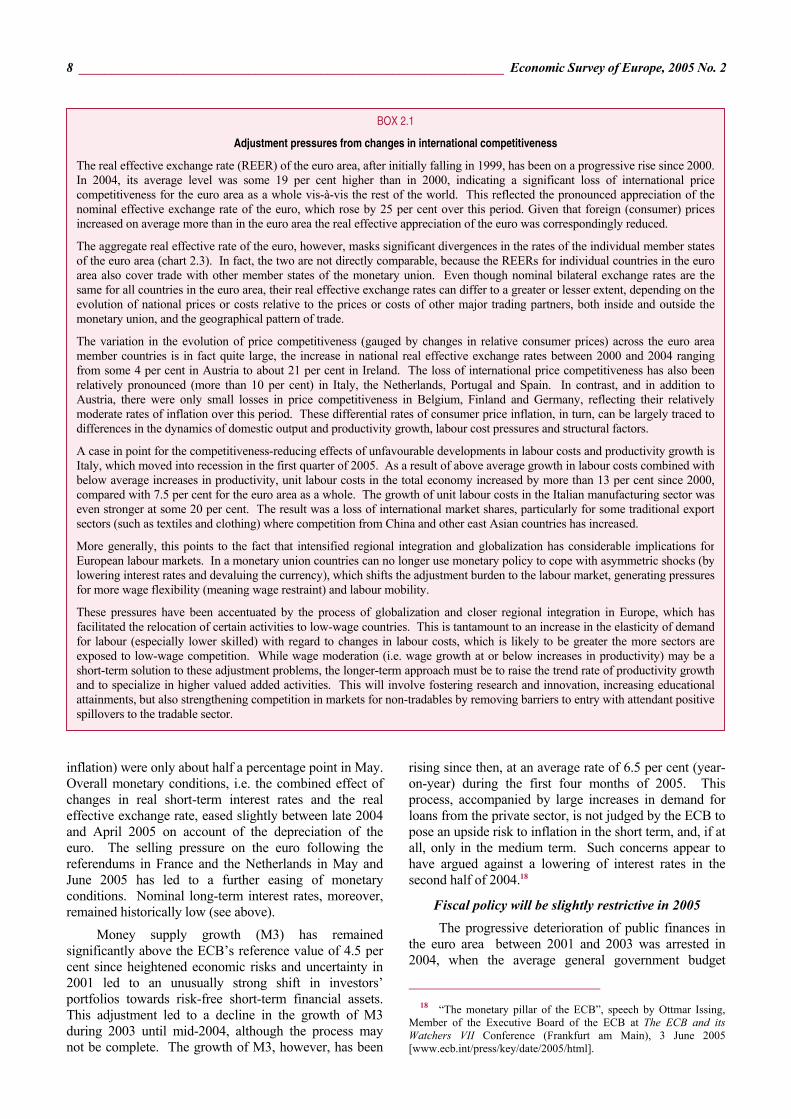
The aggregate real effective rate of the euro, however, masks significant divergences in the rates of the individual member statesof the euro area (chart 2.3). In fact, the two are not directly comparable, because the REERs for individual countries in the euroarea also cover trade with other member states of the monetary union. Even though nominal bilateral exchange rates are thesame for all countries in the euro area, their real effective exchange rates can differ to a greater or lesser extent, depending on theevolution of national prices or costs relative to the prices or costs of other major trading partners, both inside and outside themonetary union, and the geographical pattern of trade.
The variation in the evolution of price competitiveness (gauged by changes in relative consumer prices) across the euro areamember countries is in fact quite large, the increase in national real effective exchange rates between 2000 and 2004 rangingfrom some 4 per cent in Austria to about 21 per cent in Ireland. The loss of international price competitiveness has also beenrelatively pronounced (more than 10 per cent) in Italy, the Netherlands, Portugal and Spain. In contrast, and in addition toAustria, there were only small losses in price competitiveness in Belgium, Finland and Germany, reflecting their relativelymoderate rates of inflation over this period. These differential rates of consumer price inflation, in turn, can be largely traced todifferences in the dynamics of domestic output and productivity growth, labour cost pressures and structural factors.
A case in point for the competitiveness-reducing effects of unfavourable developments in labour costs and productivity growth isItaly, which moved into recession in the first quarter of 2005. As a result of above average growth in labour costs combined withbelow average increases in productivity, unit labour costs in the total economy increased by more than 13 per cent since 2000,compared with 7.5 per cent for the euro area as a whole. The growth of unit labour costs in the Italian manufacturing sector waseven stronger at some 20 per cent. The result was a loss of international market shares, particularly for some traditional exportsectors (such as textiles and clothing) where competition from China and other east Asian countries has increased.
More generally, this points to the fact that intensified regional integration and globalization has considerable implications forEuropean labour markets. In a monetary union countries can no longer use monetary policy to cope with asymmetric shocks (bylowering interest rates and devaluing the currency), which shifts the adjustment burden to the labour market, generating pressuresfor more wage flexibility (meaning wage restraint) and labour mobility.
These pressures have been accentuated by the process of globalization and closer regional integration in Europe, which hasfacilitated the relocation of certain activities to low-wage countries. This is tantamount to an increase in the elasticity of demandfor labour (especially lower skilled) with regard to changes in labour costs, which is likely to be greater the more sectors areexposed to low-wage competition. While wage moderation (i.e. wage growth at or below increases in productivity) may be ashort-term solution to these adjustment problems, the longer-term approach must be to raise the trend rate of productivity growthand to specialize in higher valued added activities. This will involve fostering research and innovation, increasing educationalattainments, but also strengthening competition in markets for non-tradables by removing barriers to entry with attendant positivespillovers to the tradable sector.
The Economic Situation in the ECE Region in Mid-2005 _________________________________________________ 9
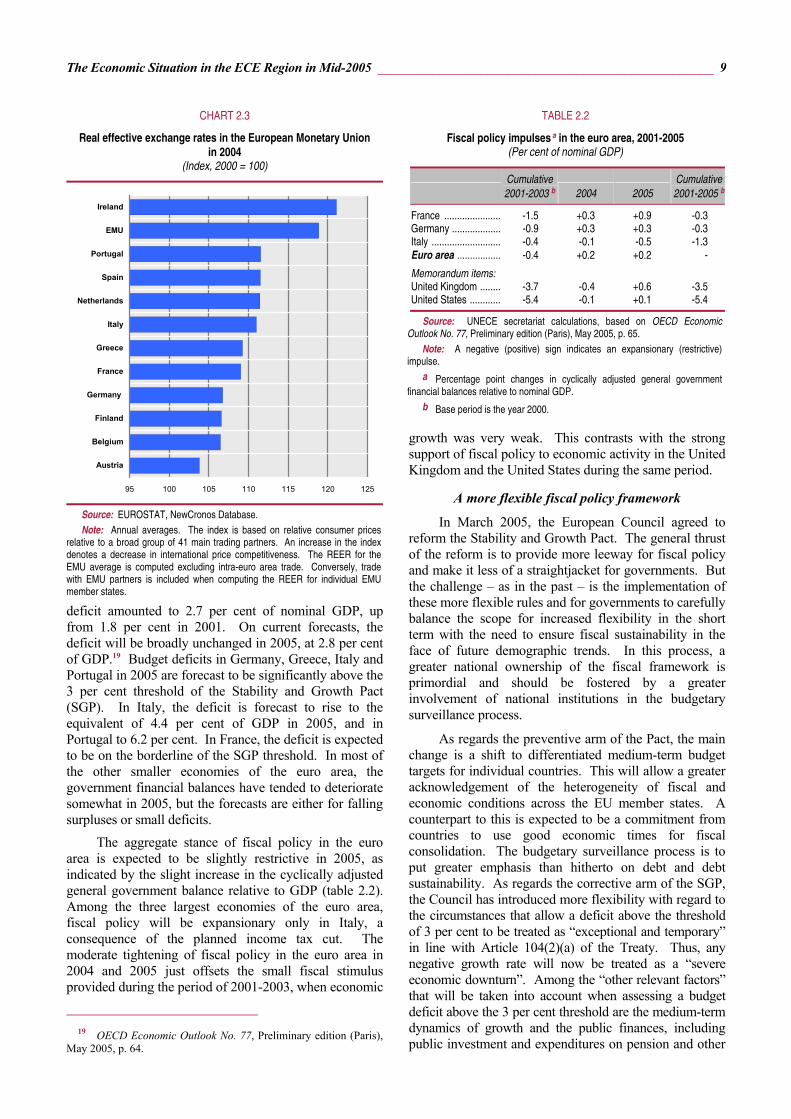
deficit amounted to 2.7 per cent of nominal GDP, up from 1.8 per cent in 2001. On current forecasts, the deficit will be broadly unchanged in 2005, at 2.8 per cent of GDP.19 Budget deficits in Germany, Greece, Italy and Portugal in 2005 are forecast to be significantly above the 3 per cent threshold of the Stability and Growth Pact (SGP). In Italy, the deficit is forecast to rise to the equivalent of 4.4 per cent of GDP in 2005, and in Portugal to 6.2 per cent. In France, the deficit is expected to be on the borderline of the SGP threshold. In most of the other smaller economies of the euro area, the government financial balances have tended to deteriorate somewhat in 2005, but the forecasts are either for falling surpluses or small deficits.
The aggregate stance of fiscal policy in the euro area is expected to be slightly restrictive in 2005, as indicated by the slight increase in the cyclically adjusted general government balance relative to GDP (table 2.2). Among the three largest economies of the euro area, fiscal policy will be expansionary only in Italy, a consequence of the planned income tax cut. The moderate tightening of fiscal policy in the euro area in 2004 and 2005 just offsets the small fiscal stimulus provided during the period of 2001-2003, when economic
19 OECD Economic Outlook No. 77, Preliminary edition (Paris),
May 2005, p. 64.
growth was very weak. This contrasts with the strong support of fiscal policy to economic activity in the United Kingdom and the United States during the same period.
A more flexible fiscal policy framework
In March 2005, the European Council agreed to reform the Stability and Growth Pact. The general thrust of the reform is to provide more leeway for fiscal policy and make it less of a straightjacket for governments. But the challenge – as in the past – is the implementation of these more flexible rules and for governments to carefully balance the scope for increased flexibility in the short term with the need to ensure fiscal sustainability in the face of future demographic trends. In this process, a greater national ownership of the fiscal framework is primordial and should be fostered by a greater involvement of national institutions in the budgetary surveillance process.
As regards the preventive arm of the Pact, the main change is a shift to differentiated medium-term budget targets for individual countries. This will allow a greater acknowledgement of the heterogeneity of fiscal and economic conditions across the EU member states. A counterpart to this is expected to be a commitment from countries to use good economic times for fiscal consolidation. The budgetary surveillance process is to put greater emphasis than hitherto on debt and debt sustainability. As regards the corrective arm of the SGP, the Council has introduced more flexibility with regard to the circumstances that allow a deficit above the threshold of 3 per cent to be treated as “exceptional and temporary” in line with Article 104(2)(a) of the Treaty. Thus, any negative growth rate will now be treated as a “severe economic downturn”. Among the “other relevant factors” that will be taken into account when assessing a budget deficit above the 3 per cent threshold are the medium-term dynamics of growth and the public finances, including public investment and expenditures on pension and other
CHART 2.3
Real effective exchange rates in the European Monetary Union in 2004
(Index, 2000 = 100)
95 100 105 110 115 120 125
Austria
Belgium
Finland
Germany
France
Greece
Italy
Netherlands
Spain
Portugal
EMU
Ireland
Source: EUROSTAT, NewCronos Database. Note: Annual averages. The index is based on relative consumer prices
relative to a broad group of 41 main trading partners. An increase in the index denotes a decrease in international price competitiveness. The REER for the EMU average is computed excluding intra-euro area trade. Conversely, trade with EMU partners is included when computing the REER for individual EMU member states.
TABLE 2.2
Fiscal policy impulses a in the euro area, 2001-2005 (Per cent of nominal GDP)
Cumulative2001-2003 b 2004 2005
Cumulative2001-2005 b
France ...................... -1.5 +0.3 +0.9 -0.3 Germany ................... -0.9 +0.3 +0.3 -0.3 Italy ........................... -0.4 -0.1 -0.5 -1.3 Euro area ................. -0.4 +0.2 +0.2 -
Memorandum items: United Kingdom ........ -3.7 -0.4 +0.6 -3.5 United States ............ -5.4 -0.1 +0.1 -5.4
Source: UNECE secretariat calculations, based on OECD Economic Outlook No. 77, Preliminary edition (Paris), May 2005, p. 65.
Note: A negative (positive) sign indicates an expansionary (restrictive) impulse.
a Percentage point changes in cyclically adjusted general government financial balances relative to nominal GDP.
b Base period is the year 2000.
10 ________________________________________________________________ Economic Survey of Europe, 2005 No. 2
structural reforms. Financial contributions designed to foster international solidarity and European policy goals (including German unification) will also be considered in the fiscal assessment.
The economy shows signs of slowing in the United Kingdom…
The economy of the United Kingdom showed signs of slowing down in the first quarter of 2005. The growth of real GDP was only 0.5 per cent compared with 0.7 per cent in the final quarter of 2004. Against the background of decelerating increases in house prices, private consumption has been weak since the last quarter of 2004. Fixed investment stagnated in the first quarter. Viewed from the supply side, falling output in the production industries in the first quarter of 2005 was more than offset by the continued strong expansion of the services sector, which remains the major source of growth. The Bank of England had raised its key policy rate by a full percentage point to 4.75 per cent between January and August of 2004 amid concerns about large increases in house prices and high levels of consumer indebtedness. Against the backdrop of moderating cyclical momentum and a cooling of the housing market, monetary policy has since been on hold. The stance of fiscal policy is somewhat restrictive in 2005, following four years when it was expansionary and especially so during 2002 and 2003.
…and elsewhere in western Europe
Elsewhere in western Europe, growth weakened in the first quarter of 2005 with the exception of oil-exporting Norway. Private consumption growth was generally lower while investment also suffered in most countries. Sweden’s unexpectedly weak economic performance combined with inflation projected to be well below the central bank’s 2 per cent target in the years ahead prompted a sharp lowering of official interest rates in June 2005.
(ii) The new EU member states Strong economic performance during the first year of
EU membership The solid economic performance of the new member
states (EU-10) during the first year of membership in the European Union provided evidence of their ability to cope with the full pressure of competition within the single market of 457 million residents (of which 383 million live in the EU-15 countries). The EU-10 achieved strong economic growth and, in most cases, low inflation as well as improved labour market outcomes. The eight former transition countries from central Europe and the Baltic region have continued to outperform the EU-15 region by a wide margin, proving themselves to be functioning market economies.20 These new member states have been competing so successfully for foreign direct investment and
20 In contrast to post-communist countries from east-central
Europe, the other new member states, Cyprus and Malta, were normal market economies long before their EU entry.
jobs on the basis of significant labour cost and corporate tax advantages that enlargement has caused some friction with some of the old EU members,21 the majority of which have also imposed temporary restrictions on labour mobility.22
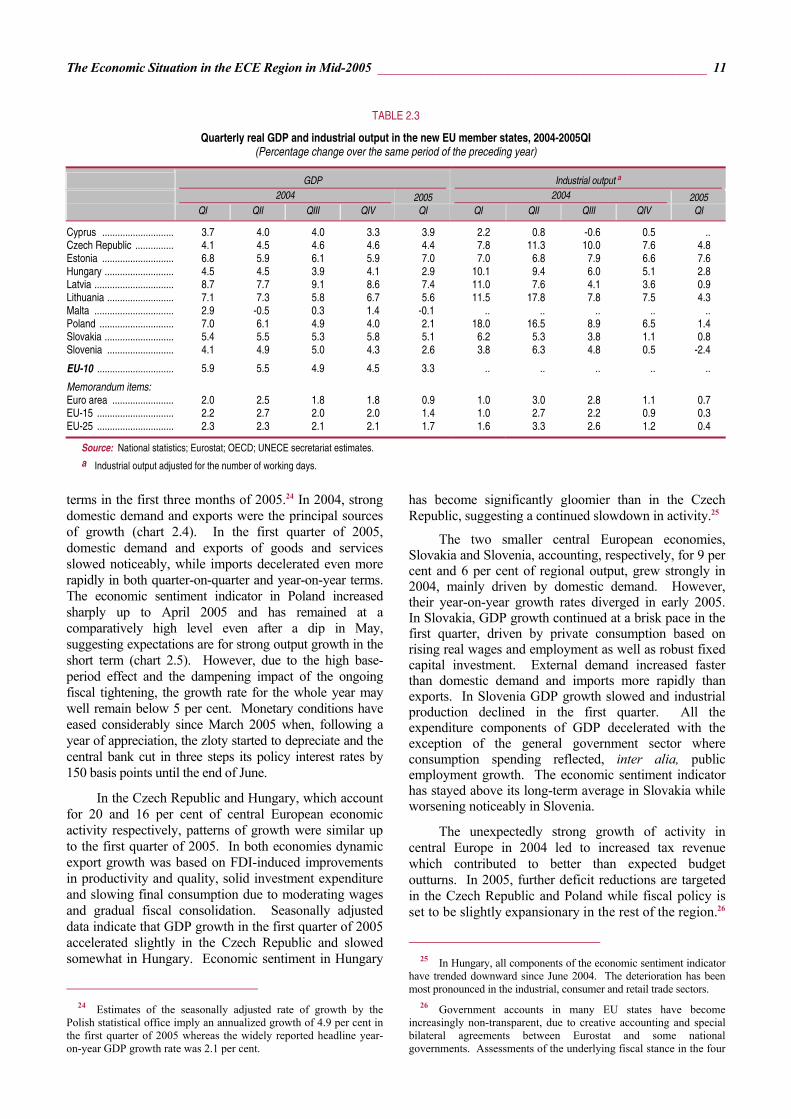
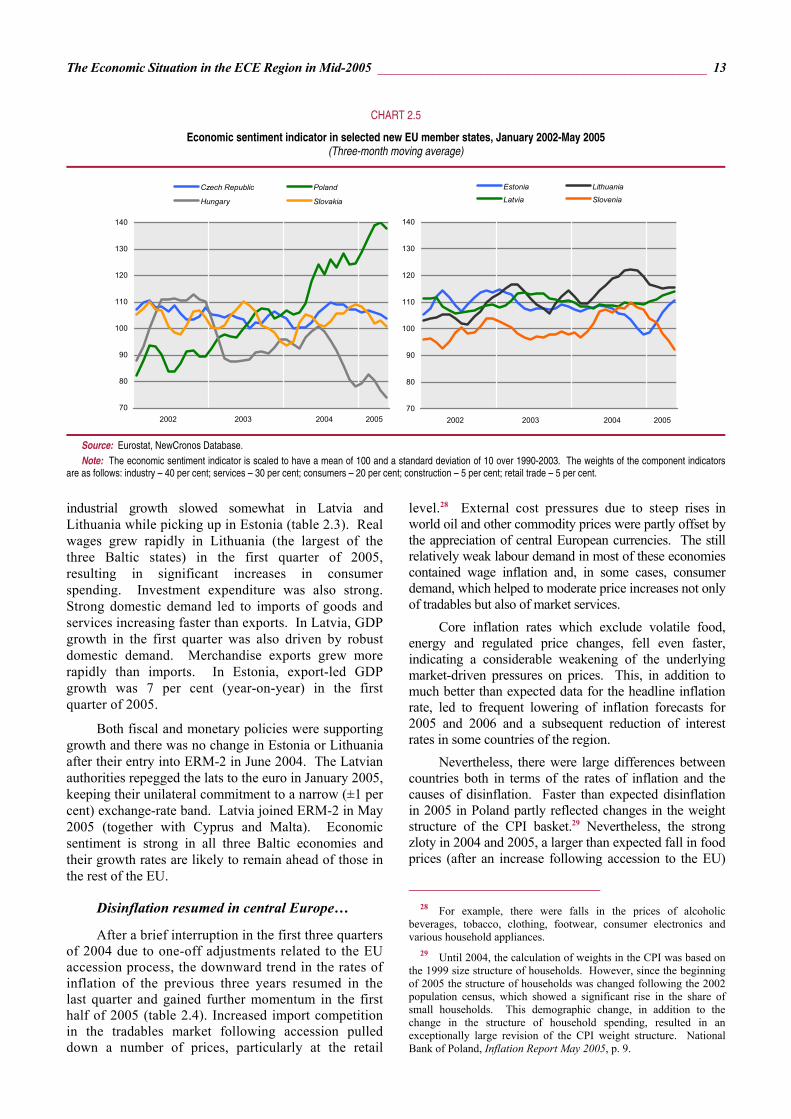
Output growth in the new EU states exceeded expectations in 2004, helping the process of catch-up with the still considerably higher average real per capita incomes in the EU-15. Export performance has improved in most of the new EU economies.23 Following the exceptionally rapid pace of economic expansion in the first half of 2004, reflecting transitory leap year and pre-accession effects, the pace of regional growth slowed but remained significantly higher than in the EU-15 area. Industrial output also decelerated in the new EU states with the exception of Estonia where it picked up (table 2.3). Indicators of economic sentiment point to steady growth in the short term in the EU-10 area as a whole, with the possible exceptions of Hungary and Slovenia. In the short and medium term, the noticeable pick-up of FDI inflows and the accelerating pace of economic integration in the post-accession period should support solid GDP growth based on steady supply-side restructuring and the improving export performance of the foreign-controlled business sector.
Economic growth continues to support income catch-up in central Europe…
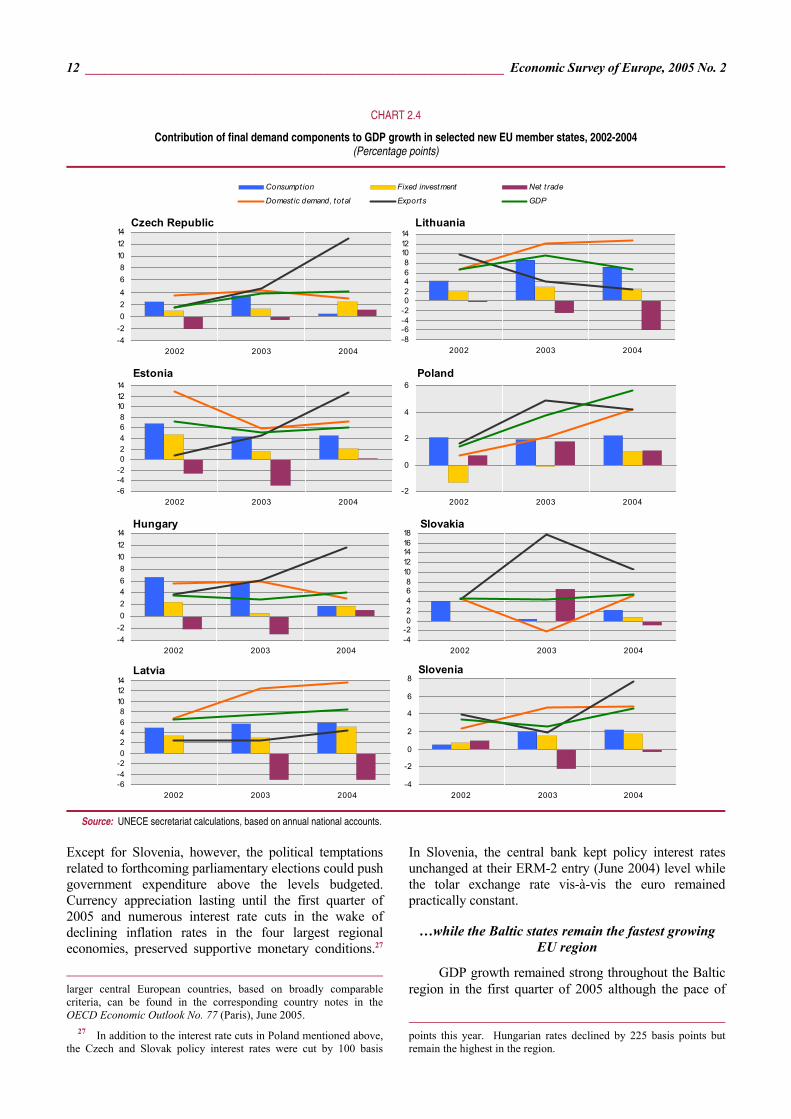
Poland is the largest economy among the five new member states from central Europe, accounting for almost one half of regional output. Following an unusually robust expansion in the first quarter of 2004 due to one-off effects, Polish GDP growth slowed in year-on-year terms while picking up in quarter-on-quarter
21 The relatively more liberal tax regimes in some of the new
member states are considered a competitive threat by some of the EU-15. A proposal to consider a reduction of structural funds as a penalty for tax competition was advocated openly by some French and German officials.
22 Only three EU-15 countries have not imposed any restrictions on labour mobility (Ireland, Sweden and the United Kingdom); none of the three has experienced any noticeable labour market dislocation due to increased labour supply from east-central Europe. For instance, an estimated 176,000 workers moved to the United Kingdom from the eight new member states from central Europe and the Baltic region in the first 11 months of their EU membership. According to a statement by the British Minister of Immigration, “these workers are contributing to our economy, paying tax and national insurance and filling key jobs in areas where there are gaps.” BBC News, 26 May 2005 [news.bbc.co.uk/2/hi/uk_news/4582667.stm].
23 Based on a comparison with 35 industrial countries (including all EU members except Luxembourg, non-EU OECD members, Bulgaria, Romania and China), export performance (calculated as the ratio of a country’s exports of goods and services to its partners’ market growth) improved remarkably in 2004 in the Czech Republic, Estonia and Hungary while gains were more modest in Poland, Slovakia and Slovenia, and there was a slight deterioration in Latvia and Lithuania. Improving terms of trade contributed noticeably to output growth in the Czech Republic and Lithuania and less strongly in Estonia and Latvia. The terms of trade deteriorated somewhat in the remaining four new EU states from east-central Europe. European Commission, DG ECFIN, Annual macro-economic database (AMECO), 4 April 2005.
The Economic Situation in the ECE Region in Mid-2005 ________________________________________________ 11
terms in the first three months of 2005.24 In 2004, strong domestic demand and exports were the principal sources of growth (chart 2.4). In the first quarter of 2005, domestic demand and exports of goods and services slowed noticeably, while imports decelerated even more rapidly in both quarter-on-quarter and year-on-year terms. The economic sentiment indicator in Poland increased sharply up to April 2005 and has remained at a comparatively high level even after a dip in May, suggesting expectations are for strong output growth in the short term (chart 2.5). However, due to the high base-period effect and the dampening impact of the ongoing fiscal tightening, the growth rate for the whole year may well remain below 5 per cent. Monetary conditions have eased considerably since March 2005 when, following a year of appreciation, the zloty started to depreciate and the central bank cut in three steps its policy interest rates by 150 basis points until the end of June.
In the Czech Republic and Hungary, which account for 20 and 16 per cent of central European economic activity respectively, patterns of growth were similar up to the first quarter of 2005. In both economies dynamic export growth was based on FDI-induced improvements in productivity and quality, solid investment expenditure and slowing final consumption due to moderating wages and gradual fiscal consolidation. Seasonally adjusted data indicate that GDP growth in the first quarter of 2005 accelerated slightly in the Czech Republic and slowed somewhat in Hungary. Economic sentiment in Hungary
24 Estimates of the seasonally adjusted rate of growth by the
Polish statistical office imply an annualized growth of 4.9 per cent in the first quarter of 2005 whereas the widely reported headline year-on-year GDP growth rate was 2.1 per cent.
has become significantly gloomier than in the Czech Republic, suggesting a continued slowdown in activity.25
The two smaller central European economies, Slovakia and Slovenia, accounting, respectively, for 9 per cent and 6 per cent of regional output, grew strongly in 2004, mainly driven by domestic demand. However, their year-on-year growth rates diverged in early 2005. In Slovakia, GDP growth continued at a brisk pace in the first quarter, driven by private consumption based on rising real wages and employment as well as robust fixed capital investment. External demand increased faster than domestic demand and imports more rapidly than exports. In Slovenia GDP growth slowed and industrial production declined in the first quarter. All the expenditure components of GDP decelerated with the exception of the general government sector where consumption spending reflected, inter alia, public employment growth. The economic sentiment indicator has stayed above its long-term average in Slovakia while worsening noticeably in Slovenia.
The unexpectedly strong growth of activity in central Europe in 2004 led to increased tax revenue which contributed to better than expected budget outturns. In 2005, further deficit reductions are targeted in the Czech Republic and Poland while fiscal policy is set to be slightly expansionary in the rest of the region.26
25 In Hungary, all components of the economic sentiment indicator
have trended downward since June 2004. The deterioration has been most pronounced in the industrial, consumer and retail trade sectors.
26 Government accounts in many EU states have become increasingly non-transparent, due to creative accounting and special bilateral agreements between Eurostat and some national governments. Assessments of the underlying fiscal stance in the four
TABLE 2.3
Quarterly real GDP and industrial output in the new EU member states, 2004-2005QI (Percentage change over the same period of the preceding year)
GDP Industrial output a
2004 2005 2004 2005 QI QII QIII QIV QI QI QII QIII QIV QI
Cyprus ............................. 3.7 4.0 4.0 3.3 3.9 2.2 0.8 -0.6 0.5 .. Czech Republic ................ 4.1 4.5 4.6 4.6 4.4 7.8 11.3 10.0 7.6 4.8 Estonia ............................. 6.8 5.9 6.1 5.9 7.0 7.0 6.8 7.9 6.6 7.6 Hungary ............................ 4.5 4.5 3.9 4.1 2.9 10.1 9.4 6.0 5.1 2.8 Latvia ................................ 8.7 7.7 9.1 8.6 7.4 11.0 7.6 4.1 3.6 0.9 Lithuania ........................... 7.1 7.3 5.8 6.7 5.6 11.5 17.8 7.8 7.5 4.3 Malta ................................ 2.9 -0.5 0.3 1.4 -0.1 .. .. .. .. .. Poland .............................. 7.0 6.1 4.9 4.0 2.1 18.0 16.5 8.9 6.5 1.4 Slovakia ............................ 5.4 5.5 5.3 5.8 5.1 6.2 5.3 3.8 1.1 0.8 Slovenia ........................... 4.1 4.9 5.0 4.3 2.6 3.8 6.3 4.8 0.5 -2.4
EU-10 ............................... 5.9 5.5 4.9 4.5 3.3 .. .. .. .. ..
Memorandum items: Euro area ......................... 2.0 2.5 1.8 1.8 0.9 1.0 3.0 2.8 1.1 0.7 EU-15 ............................... 2.2 2.7 2.0 2.0 1.4 1.0 2.7 2.2 0.9 0.3 EU-25 ............................... 2.3 2.3 2.1 2.1 1.7 1.6 3.3 2.6 1.2 0.4
Source: National statistics; Eurostat; OECD; UNECE secretariat estimates. a Industrial output adjusted for the number of working days.
12 ________________________________________________________________ Economic Survey of Europe, 2005 No. 2
Except for Slovenia, however, the political temptations related to forthcoming parliamentary elections could push government expenditure above the levels budgeted. Currency appreciation lasting until the first quarter of 2005 and numerous interest rate cuts in the wake of declining inflation rates in the four largest regional economies, preserved supportive monetary conditions.27
larger central European countries, based on broadly comparable criteria, can be found in the corresponding country notes in the OECD Economic Outlook No. 77 (Paris), June 2005.
27 In addition to the interest rate cuts in Poland mentioned above, the Czech and Slovak policy interest rates were cut by 100 basis
In Slovenia, the central bank kept policy interest rates unchanged at their ERM-2 entry (June 2004) level while the tolar exchange rate vis-à-vis the euro remained practically constant.
…while the Baltic states remain the fastest growing EU region
GDP growth remained strong throughout the Baltic region in the first quarter of 2005 although the pace of
points this year. Hungarian rates declined by 225 basis points but remain the highest in the region.
CHART 2.4
Contribution of final demand components to GDP growth in selected new EU member states, 2002-2004 (Percentage points)
-10-8-6-4-202468
101214
2002 2003 2004
Consumpt ion Fixed investment Net trade
Domestic demand, total Exports GDP
Czech Republic
-4-202468
101214
2002 2003 2004
Estonia
-6-4-202468
101214
2002 2003 2004
Hungary
-4-202468
101214
2002 2003 2004
Latvia
-6-4-202468
101214
2002 2003 2004
Lithuania
-8-6-4-202468
101214
2002 2003 2004
Poland
-2
0
2
4
6
2002 2003 2004
Slovakia
-4-202468
1012141618
2002 2003 2004
Slovenia
-4
-2
0
2
4
6
8
2002 2003 2004
Source: UNECE secretariat calculations, based on annual national accounts.
The Economic Situation in the ECE Region in Mid-2005 ________________________________________________ 13
industrial growth slowed somewhat in Latvia and Lithuania while picking up in Estonia (table 2.3). Real wages grew rapidly in Lithuania (the largest of the three Baltic states) in the first quarter of 2005, resulting in significant increases in consumer spending. Investment expenditure was also strong. Strong domestic demand led to imports of goods and services increasing faster than exports. In Latvia, GDP growth in the first quarter was also driven by robust domestic demand. Merchandise exports grew more rapidly than imports. In Estonia, export-led GDP growth was 7 per cent (year-on-year) in the first quarter of 2005.
Both fiscal and monetary policies were supporting growth and there was no change in Estonia or Lithuania after their entry into ERM-2 in June 2004. The Latvian authorities repegged the lats to the euro in January 2005, keeping their unilateral commitment to a narrow (±1 per cent) exchange-rate band. Latvia joined ERM-2 in May 2005 (together with Cyprus and Malta). Economic sentiment is strong in all three Baltic economies and their growth rates are likely to remain ahead of those in the rest of the EU.
Disinflation resumed in central Europe…
After a brief interruption in the first three quarters of 2004 due to one-off adjustments related to the EU accession process, the downward trend in the rates of inflation of the previous three years resumed in the last quarter and gained further momentum in the first half of 2005 (table 2.4). Increased import competition in the tradables market following accession pulled down a number of prices, particularly at the retail
level.28 External cost pressures due to steep rises in world oil and other commodity prices were partly offset by the appreciation of central European currencies. The still relatively weak labour demand in most of these economies contained wage inflation and, in some cases, consumer demand, which helped to moderate price increases not only of tradables but also of market services.
Core inflation rates which exclude volatile food, energy and regulated price changes, fell even faster, indicating a considerable weakening of the underlying market-driven pressures on prices. This, in addition to much better than expected data for the headline inflation rate, led to frequent lowering of inflation forecasts for 2005 and 2006 and a subsequent reduction of interest rates in some countries of the region.
Nevertheless, there were large differences between countries both in terms of the rates of inflation and the causes of disinflation. Faster than expected disinflation in 2005 in Poland partly reflected changes in the weight structure of the CPI basket.29 Nevertheless, the strong zloty in 2004 and 2005, a larger than expected fall in food prices (after an increase following accession to the EU)
28 For example, there were falls in the prices of alcoholic
beverages, tobacco, clothing, footwear, consumer electronics and various household appliances.
29 Until 2004, the calculation of weights in the CPI was based on the 1999 size structure of households. However, since the beginning of 2005 the structure of households was changed following the 2002 population census, which showed a significant rise in the share of small households. This demographic change, in addition to the change in the structure of household spending, resulted in an exceptionally large revision of the CPI weight structure. National Bank of Poland, Inflation Report May 2005, p. 9.
CHART 2.5
Economic sentiment indicator in selected new EU member states, January 2002-May 2005 (Three-month moving average)
70
80
90
100
110
120
130
140
2002 2003 2004 2005
Czech Republic Poland
Hungary Slovakia
70
80
90
100
110
120
130
140
2002 2003 2004 2005
Estonia LithuaniaLatvia Slovenia
Source: Eurostat, NewCronos Database. Note: The economic sentiment indicator is scaled to have a mean of 100 and a standard deviation of 10 over 1990-2003. The weights of the component indicators
are as follows: industry – 40 per cent; services – 30 per cent; consumers – 20 per cent; construction – 5 per cent; retail trade – 5 per cent.
14 ________________________________________________________________ Economic Survey of Europe, 2005 No. 2
and a weakening of private consumption demand, reflecting continued moderation in wage growth and a still very high unemployment rate, all sustained the downward trend in inflation despite the stagnant productivity.
In the Czech Republic, after peaking in October 2004, the year-on-year rate of change in the CPI fell below the lower boundary of the central bank’s target band in the first half of 2005. The strong koruna, a sharp fall in transport costs and agricultural producer prices, and weak household consumption were the major factors behind this downward trend, in spite of continued real wage growth and a slow recovery in labour demand.
In Hungary inflation started to fall rapidly in mid-2004 and continued to do so in the first half of 2005. Recently, the disinflation has spread more widely, affecting product groups covered by the core rate, including services. Subdued labour demand both in the corporate and government sectors led to much slower wage growth. Furthermore, the forint appreciated until mid-March 2005 and dampened the external price pressures.
Headline inflation in Slovakia fell sharply (to 1.1 per cent year-on-year in February 2005) partly due to the strong appreciation of the koruna and the diminishing impact of the increase in the standard VAT rate at the beginning of 2004. Furthermore, falling agricultural producer prices offset large increases in housing, utilities and transport prices.
In Slovenia a relatively tight monetary policy together with continued wage moderation in the public and private sectors helped to reduce inflationary
pressures in 2004 and by year-end the rate of inflation had fallen to 3.2 per cent, below the lower bound of the official target band. In the early months of 2005 food and service prices accelerated and the modest turnaround in the labour demand continued.
…while strong inflationary pressures re-emerged in the Baltic states
In the three Baltic states rising real wages and a rapid expansion of credit, combined with a gradual improvement in labour market conditions, fuelled private consumption and inflationary pressures, which had emerged in 2004, intensified in the first half of 2005. In Lithuania a strong appreciation of the litas in nominal effective terms partly dampened the surge in import prices. Nevertheless, the rate of change in producer prices, a measure of the overall pressure originating on the supply side, reached nearly 12 per cent in April 2005. This mainly reflects a double-digit rate of wage inflation combined with a sharp slowdown in the growth of labour productivity. In Latvia, in addition to similar supply-side pressures, the depreciation of the lats in nominal effective terms increased imported inflation which added to the growth of domestic, particularly producer, prices. In Estonia, fiscal austerity and the sustained strength of the kroon helped to contain the overheating of the economy and the increase in prices.
Rising levels of employment in the new EU member states
Employment in the new EU member states has generally been rising faster than in the rest of the Union, although there was a marked deceleration in
TABLE 2.4
Inflation, industrial a wages and unit labour costs in the new EU member states, 2004-2005 (Percentage change over the same period of the preceding year)
Consumer prices Industrial
producer prices Nominal gross
wages Real product
wages b Labour
productivity c Unit labour
costs d Real unit labour
costs e
2004 2005 f 2005 g 2004 2005 f 2004 2005 f 2004 2005 f 2004 2005 f 2004 2005 f 2004 2005 f
Cyprus .................. 2.3 2.9 2.4 5.9 7.2 .. .. .. .. .. .. .. .. .. .. Czech Republic .... 2.8 1.6 1.4 5.7 6.8 7.3 3.7 1.5 -3.0 11.1 3.8 -3.5 -0.1 -8.7 -6.5 Estonia ................. 3.1 4.4 2.6 2.7 3.2 7.5 9.9 4.7 6.4 0.2 8.4 7.3 1.3 4.4 -1.9 Hungary ................ 6.8 3.7 3.8 3.6 1.9 10.0 6.6 6.2 4.6 12.2 4.2 -1.9 2.3 -5.4 0.4 Latvia .................... 6.3 6.6 6.2 8.5 10.5 9.2 10.0 0.7 -0.4 3.7 3.5 5.3 6.2 -2.9 -3.8 Lithuania ............... 1.1 3.1 2.0 6.1 9.1 5.7 10.8 -0.4 1.6 14.2 4.2 -7.5 6.3 -12.8 -2.5 Malta .................... 2.8 2.9 3.5 .. .. .. .. .. .. .. .. Poland .................. 3.5 3.9 2.5 7.1 3.5 4.5 2.1 -2.5 -1.4 12.8 -0.3 -7.3 2.4 -13.5 -1.0 Slovakia ................ 7.5 2.7 2.2 3.4 2.5 10.1 12.2 6.5 9.5 4.0 -2.5 5.9 15.1 2.4 12.3 Slovenia ............... 3.7 2.7 2.1 4.3 4.4 7.1 5.0 2.7 0.6 6.0 1.5 1.1 3.5 -3.1 -0.9
Source: UNECE secretariat estimates, based on national statistics and direct communications from national statistical offices. a Industry = mining + manufacturing + utilities. b Nominal wages deflated by producer price index. c Gross industrial output deflated by industrial employment. d Nominal wages deflated by productivity. e Real product wages deflated by productivity. f First quarter. g May.
The Economic Situation in the ECE Region in Mid-2005 ________________________________________________ 15
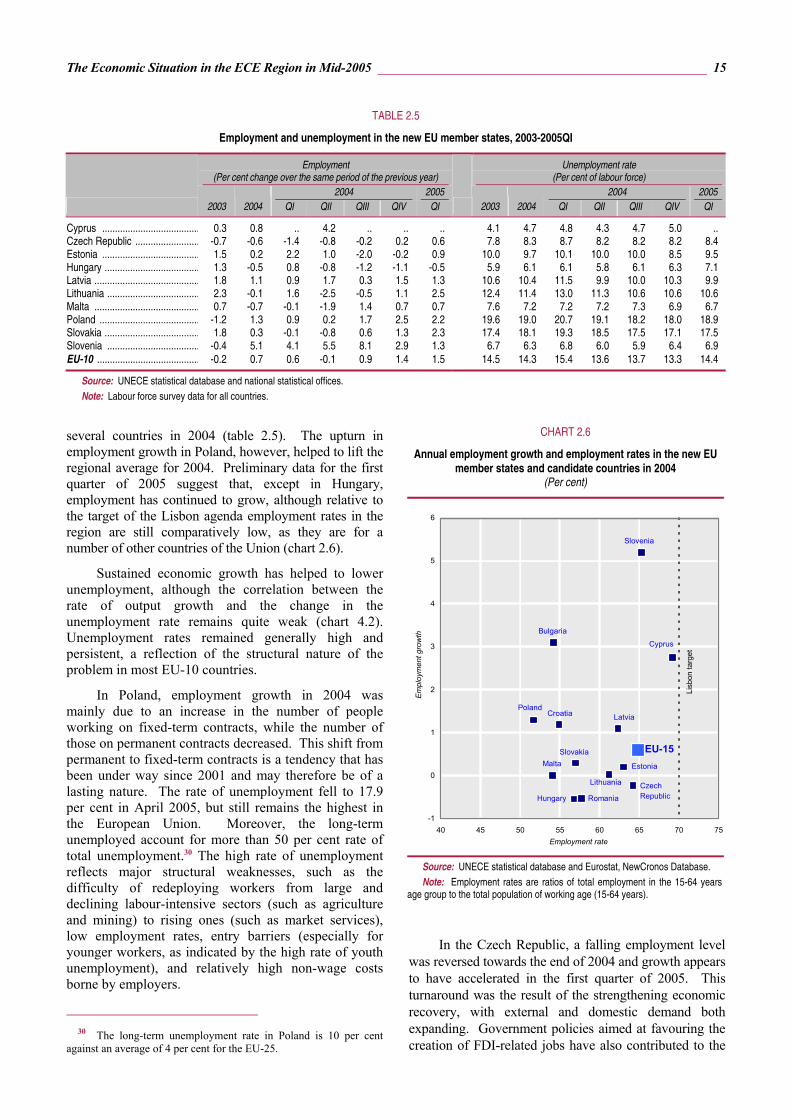
several countries in 2004 (table 2.5). The upturn in employment growth in Poland, however, helped to lift the regional average for 2004. Preliminary data for the first quarter of 2005 suggest that, except in Hungary, employment has continued to grow, although relative to the target of the Lisbon agenda employment rates in the region are still comparatively low, as they are for a number of other countries of the Union (chart 2.6).
Sustained economic growth has helped to lower unemployment, although the correlation between the rate of output growth and the change in the unemployment rate remains quite weak (chart 4.2). Unemployment rates remained generally high and persistent, a reflection of the structural nature of the problem in most EU-10 countries.
In Poland, employment growth in 2004 was mainly due to an increase in the number of people working on fixed-term contracts, while the number of those on permanent contracts decreased. This shift from permanent to fixed-term contracts is a tendency that has been under way since 2001 and may therefore be of a lasting nature. The rate of unemployment fell to 17.9 per cent in April 2005, but still remains the highest in the European Union. Moreover, the long-term unemployed account for more than 50 per cent rate of total unemployment.30 The high rate of unemployment reflects major structural weaknesses, such as the difficulty of redeploying workers from large and declining labour-intensive sectors (such as agriculture and mining) to rising ones (such as market services), low employment rates, entry barriers (especially for younger workers, as indicated by the high rate of youth unemployment), and relatively high non-wage costs borne by employers.
30 The long-term unemployment rate in Poland is 10 per cent
against an average of 4 per cent for the EU-25.
In the Czech Republic, a falling employment level was reversed towards the end of 2004 and growth appears to have accelerated in the first quarter of 2005. This turnaround was the result of the strengthening economic recovery, with external and domestic demand both expanding. Government policies aimed at favouring the creation of FDI-related jobs have also contributed to the
TABLE 2.5
Employment and unemployment in the new EU member states, 2003-2005QI
Employment (Per cent change over the same period of the previous year)
Unemployment rate (Per cent of labour force)
2004 2005 2004 2005
2003 2004 QI QII QIII QIV QI 2003 2004 QI QII QIII QIV QI
Cyprus ...................................... 0.3 0.8 .. 4.2 .. .. .. 4.1 4.7 4.8 4.3 4.7 5.0 .. Czech Republic ......................... -0.7 -0.6 -1.4 -0.8 -0.2 0.2 0.6 7.8 8.3 8.7 8.2 8.2 8.2 8.4 Estonia ...................................... 1.5 0.2 2.2 1.0 -2.0 -0.2 0.9 10.0 9.7 10.1 10.0 10.0 8.5 9.5 Hungary ..................................... 1.3 -0.5 0.8 -0.8 -1.2 -1.1 -0.5 5.9 6.1 6.1 5.8 6.1 6.3 7.1 Latvia ......................................... 1.8 1.1 0.9 1.7 0.3 1.5 1.3 10.6 10.4 11.5 9.9 10.0 10.3 9.9 Lithuania .................................... 2.3 -0.1 1.6 -2.5 -0.5 1.1 2.5 12.4 11.4 13.0 11.3 10.6 10.6 10.6 Malta ......................................... 0.7 -0.7 -0.1 -1.9 1.4 0.7 0.7 7.6 7.2 7.2 7.2 7.3 6.9 6.7 Poland ....................................... -1.2 1.3 0.9 0.2 1.7 2.5 2.2 19.6 19.0 20.7 19.1 18.2 18.0 18.9 Slovakia ..................................... 1.8 0.3 -0.1 -0.8 0.6 1.3 2.3 17.4 18.1 19.3 18.5 17.5 17.1 17.5 Slovenia .................................... -0.4 5.1 4.1 5.5 8.1 2.9 1.3 6.7 6.3 6.8 6.0 5.9 6.4 6.9 EU-10 ........................................ -0.2 0.7 0.6 -0.1 0.9 1.4 1.5 14.5 14.3 15.4 13.6 13.7 13.3 14.4
Source: UNECE statistical database and national statistical offices. Note: Labour force survey data for all countries.
CHART 2.6
Annual employment growth and employment rates in the new EU member states and candidate countries in 2004
(Per cent)
Hungary
Slovenia
Poland
Lithuania CzechRepublic
Malta
Latvia
Estonia
Cyprus
Slovakia
Romania
Croatia
Bulgaria
EU-15
-1
0
1
2
3
4
5
6
40 45 50 55 60 65 70 75Employment rate
Empl
oym
ent g
row
th
Lisb
on ta
rget
Source: UNECE statistical database and Eurostat, NewCronos Database. Note: Employment rates are ratios of total employment in the 15-64 years
age group to the total population of working age (15-64 years).
16 ________________________________________________________________ Economic Survey of Europe, 2005 No. 2
improvement in employment. There were, however, no clear signs of a fall in the unemployment rate.31
In Hungary the falling level of employment in 2004 and the first quarter of 2005 was partly due to cyclical factors. Weaker external demand in the second half of 2004 led to reduced labour demand in the private sector. Industry, especially manufacturing, was most affected, with employment falling by 2 per cent in 2004.32 Employment in the services continued to grow, albeit by a moderate 0.7 per cent, despite layoffs in the government sector.
In Slovakia, the increase in total employment reflects the growth of industry which has also absorbed labour from agriculture, while the services sector, which contributed significantly to job creation in 2003, added little in 2004. In Slovenia employment in both the public and private sectors has increased strongly although preliminary data for the first quarter of 2005 show a fall of employment in industry.
Among the Baltic countries, Latvia was the only one with employment growth above 1 per cent in 2004, mainly thanks to industry (although the growth of industrial employment in 2004 was less than in 2003). Payroll statistics indicate that industrial employment in the first quarter of 2005 was 3.3 per cent lower than a year earlier. In Estonia and Lithuania, total employment growth has been very weak. Weaker labour demand in the service sector (in Estonia) and a massive loss of jobs in agriculture (in Lithuania) were the main factors pulling down the average levels. At the same time, in Estonia employment grew significantly in manufacturing and especially in construction, where a dynamic real estate market and the start of new construction projects have boosted output. In spite of practically unchanged levels of employment, the average unemployment rates fell in both countries, especially in Lithuania, partly reflecting a fall in the economically active population (especially of young workers).
3. South-east Europe In recent years, the south-east European subregion
has split into two distinct parts, both in terms of systemic transformation and economic performance. The four EU accession and candidate countries (Bulgaria, Croatia, Romania and Turkey) form a dynamic core where the
31 One of the obstacles to reducing unemployment in the country
is the system of social benefits. Generous unemployment, welfare and disability benefits (which, in relative terms, are higher than in most other EU countries) discourage workers from actively seeking employment. The effect is stronger for low-skilled workers, who would otherwise occupy lower-paid posts, and hence have an incentive to register as unemployed while performing some activities in the hidden economy.
32 Part of the decline in industry may be explained by the attempts of firms to substitute capital for labour following the increase in unit labour costs in recent years.
reform agenda and the accompanying policy process are largely shaped by the preparation for EU accession. The rest of the subregion seemingly lacks both coherence in the reform process and vigour in economic performance.
With the signing of the Accession Treaty to the European Union in April, Bulgaria and Romania are set to become full EU members in January 2007. The enlargement process, however, is not without its difficulties and setbacks. Thus in March the European Union foreign ministers decided to postpone the scheduled launch of accession negotiations with Croatia, citing Croatia’s failure to carry out some of its international commitments. The two negative popular votes (in France and the Netherlands) on the European Union constitutional treaty may also have negative implications for the speed of the future EU enlargement. Despite these difficulties, however, the enlargement process is set to continue.
The realistic prospect for EU membership – as revealed in the progress towards accession – acts as a powerful anchor that shapes the expectations of both investors and consumers in the accession and candidate countries in south-east Europe. At present these countries are benefiting from a large inflow of capital, including FDI, which has been an important factor for the revitalization of these economies. While this was not something new for countries such as Bulgaria, Croatia and Romania, there was a surge of capital flows into Turkey in the early months of 2005, reflecting both the improvement in its macroeconomic fundamentals and its new status as a candidate country with a mutually agreed date for the opening of accession negotiations with the EU (October 2005).
Rapid growth continues
Economic activity in south-east Europe remained vibrant in the opening months of 2005. During the first quarter, aggregate output in most economies continued to grow at relatively high rates, driven mainly by strong domestic demand and underpinned by continued economic restructuring. However, the unusually high rates of GDP growth in some countries (Romania, Serbia and Montenegro, and Turkey) in 2004 are unlikely to be repeated in 2005.
Output growth in Bulgaria and Romania was robust and broad-based, a sign of the new dynamism of these economies (table 3.1). The upturn in the Bulgarian manufacturing industry is continuing for a third consecutive year (chart 3.1), with new production capacity coming on stream as a result of several years of solid investment. As reflected in the recent growth of Bulgarian merchandise exports, a significant part of this new capacity is oriented towards external markets. A similar process of FDI-led restructuring has been under way in the Romanian manufacturing sector, with the automotive industry leading the process. In both countries, there has been steady output growth in other

The Economic Situation in the ECE Region in Mid-2005 ________________________________________________ 17
sectors such as construction and market services (especially financial services, tourism and, more recently, software development and other computer-related services). Domestic demand has remained buoyant, providing solid support to economic activity.33 In the first quarter of 2005, GDP in Turkey grew by 4.8 per cent, year-on-year, which was below the rates in 2004. Compared with the final quarter of 2004, there was a renewed upturn in industrial production, thanks to sectors such as the automotive and the food industries.34 The notable improvement in the macroeconomic environment, in particular, the continuing disinflation accompanied by falling interest rates – a result of a major policy effort to restore macroeconomic and financial stability35 – has been beneficial for economic activity. Stringent macroeconomic policies, accompanied by structural reforms, have created an environment which has led to a sharp rise in business investment and productivity. The pace of economic expansion was lower in Croatia, partly as a result of a tight fiscal policy – the government has been struggling for some time to reduce the chronically large budget deficit – but also reflecting subdued activity in the manufacturing sector.36 However, with the arrival of summer, the booming tourism industry is expected to offset, at least partly, these negative tendencies.
33 In the first quarter of 2005 the volume of retail sales increased
by 12.8 per cent year-on-year in Bulgaria and by 18.6 per cent in Romania.
34 In year-on-year terms, total industrial output in the first quarter grew by 8.2 per cent, compared with 4.4 per cent in the fourth quarter of 2004.
35 For details see UNECE, “Economic turnaround in Turkey: can the momentum be sustained?”, Economic Survey of Europe, 2005 No. 1, pp. 46-47, box 4.1.1.
36 Year-on-year, industrial output was virtually stagnant in the first quarter of 2005.
Total output continued also to grow in the rest of south-east Europe but the absence, or delays in reporting, of quarterly national accounts data prevent any detailed assessment of recent developments in these countries. The available, incomplete statistics for the first few months of 2005 suggest that growth in the western Balkan countries was mostly driven by domestic demand. Manufacturing output (especially of semi-processed goods) in some of these economies was adversely affected by weak demand in their key export markets. In Serbia and Montenegro there was a slowdown in rates of economic growth, partly reflecting the high base level of the previous year (in 2004 GDP grew by 8 per cent). Industrial output actually fell in the first quarter (by 3.4 per cent) but recovery is expected in the course of the year. Activity was more vibrant in other sectors, such as services, for which there was strong domestic demand. Manufacturing output in Bosnia and Herzegovina as a whole was rather uneven in the first quarter, after a very strong recovery in 2004. Whereas industrial output barely rose in the Bosnian-Croat Federation (1.6 per cent, year-on-year, in the first quarter), growth was much stronger (9 per cent) in Republika Srpska. However, there has been considerable volatility in the level of output in the early months of 2005 and it is not clear what direction the trend will take during the rest of the year. In Albania, the large agricultural sector continues to make a major contribution to the growth of aggregate output, particularly as a result of sizeable new investment in greenhouses. The gradual lowering of policy interest rates by the Bank of Albania continued during the opening months of the year, following the notable macroeconomic stabilization of the economy, and this has continued to benefit domestic economic activity. The former Yugoslav Republic of Macedonia is slowly coming out of the slump of 2003 and 2004. With the completion of major reconstruction works in mid-2004,
TABLE 3.1
Changes in real GDP in south-east Europe, 2003-2005QI (Percentage change over the same period of the preceding year)
2003 2004 2005
2003 2004 QI QII QIII QIV QI QII QIII QIV QI
South-east Europe ............. 5.2 8.0 6.3 4.0 5.1 5.4 9.1 10.9 6.4 6.6 5.0* Albania .................................. 6.0 5.9 .. .. .. .. .. .. .. .. .. Bosnia and Herzegovina ....... 3.2 4.0 .. .. .. .. .. .. .. .. .. Bulgaria ................................. 4.5 5.6 3.6 4.6 3.8 5.7 4.5 5.5 5.8 6.2 6.0 Croatia ................................... 4.3 3.8 4.9 5.0 3.9 3.3 4.2 3.8 3.6 3.6 1.8 Romania ................................ 5.2 8.3 4.4 4.3 5.4 4.6 6.1 7.0 10.2 8.7 5.9 Serbia and Montenegro ....... 2.1 8.0 .. .. .. .. .. .. .. .. 5.2a The former Yugoslav Republic of Macedonia ....... 2.8 2.9 1.8 3.0 5.4 1.2 2.4 3.7 3.4 2.1 .. Turkey ................................... 5.8 8.9 8.1 3.9 5.5 6.1 11.8 14.4 5.3 6.3 4.8
Memorandum item: South-east Europe excluding Turkey ............... 4.5 6.9 3.9 4.1 4.5 4.4 5.4 6.1 7.9 7.1 5.3*
Source: National statistical offices. Note: The aggregates are computed by the UNECE secretariat using weights based on purchasing power parities. In those cases where countries do not report
quarterly national accounts data, their annual GDP growth rates were used to compute the quarterly regional aggregates. a Serbia only.

18 ________________________________________________________________ Economic Survey of Europe, 2005 No. 2
industrial output started to recover and continued to grow in the first quarter of 2005, led by a surge in the metal processing and chemical industries. However, the monetary policy remains excessively tight, resulting in high real interest rates that continue to depress economic activity.37
Policy efforts to contain current account deficits
With domestic demand outpacing aggregate output throughout south-east Europe, the external imbalances of many countries are escalating.38 While external imbalances are not unusual for fast-growing, catching-up economies (reflecting the fact that they tend to absorb more resources than they generate internally), large current account deficits are risky for immature market economies that are susceptible to external shocks. Policy makers in south-east Europe have been trying to address this problem for some time, and in the opening months of 2005 there were renewed efforts to curb the growth of (and eventually, reduce) the large deficits. Various policy instruments are being used for this purpose, targeting the underlying forces behind the deficits and reflecting the specificities of the macroeconomic environment in each country.
In Romania and Turkey, the increase in current account deficits is largely due to widening trade deficits, which are partly induced by the real appreciation of their currencies. The mirror image of such deficits has been a recent surge in capital inflows.39 In both countries, this
37 The average real interest rate on short-term credits in 2004 was
over 13 per cent, by far the highest in south-east Europe. 38 For details on the levels and changes in current account
deficits see section 5. 39 In Romania, this was related to expectations of a currency
appreciation following the liberalization, in April 2005, of access to
prompted the monetary authorities to lower further their policy interest rates during the first half of 2005 and to intervene massively in the foreign exchange markets to prevent an excessive appreciation of their exchange rates. In Bulgaria, buoyant domestic demand (both consumer and investment spending) has continued to be underpinned by a rapid expansion of credit and, worried that this credit boom is fuelling the external imbalance, the monetary authorities have been trying to check it. In the absence of policy instruments for market intervention (the currency board arrangement in Bulgaria precludes their use), the monetary authorities tightened the banks’ mandatory reserve requirements in 2004 but this did not have the expected effect. In March 2005 the central bank introduced strict administrative controls, such as credit ceilings and extremely tight capital adequacy regulations (linked to credit exposure), on the credit activity of commercial banks.40
In Croatia, the persistent current account deficit has been partly driven by the chronic fiscal deficit (a “twin deficit” problem). Despite some efforts by the Croatian government to reduce public spending – many analysts have been urging fiscal consolidation for a number of years – progress in reducing the fiscal deficit has been limited.41 In addition, extensive borrowing in foreign
leu accounts by foreigners, in line with the policy of gradual capital account liberalization. The National Bank of Romania has announced that it plans to switch from a monetary policy regime based on a managed float to a regime of inflation targeting in the second half of 2005. In Turkey, there has been a surge in speculative short-term capital inflows attracted by the still large, albeit decreasing, interest rate differentials within an environment of increasing macroeconomic stability.
40 By June, there were first signs of a deceleration in the growth of commercial credit in Bulgaria.
41 In 2004, the consolidated general government deficit was close to 5 per cent of GDP.
CHART 3.1
Industrial output in selected south-east European economies, January 2002-March 2005 (Indices of 12-month output, corresponding period of the preceding year=100)
80
90
100
110
120
2002 2003 2004 2005
Bulgaria RomaniaCroatia Turkey
80
90
100
110
120
2002 2003 2004 2005
Bosnia and Herzegovina The FYR of MacedoniaSerbia and Montenegro
Source: UNECE secretariat calculations, based on annual national accounts.
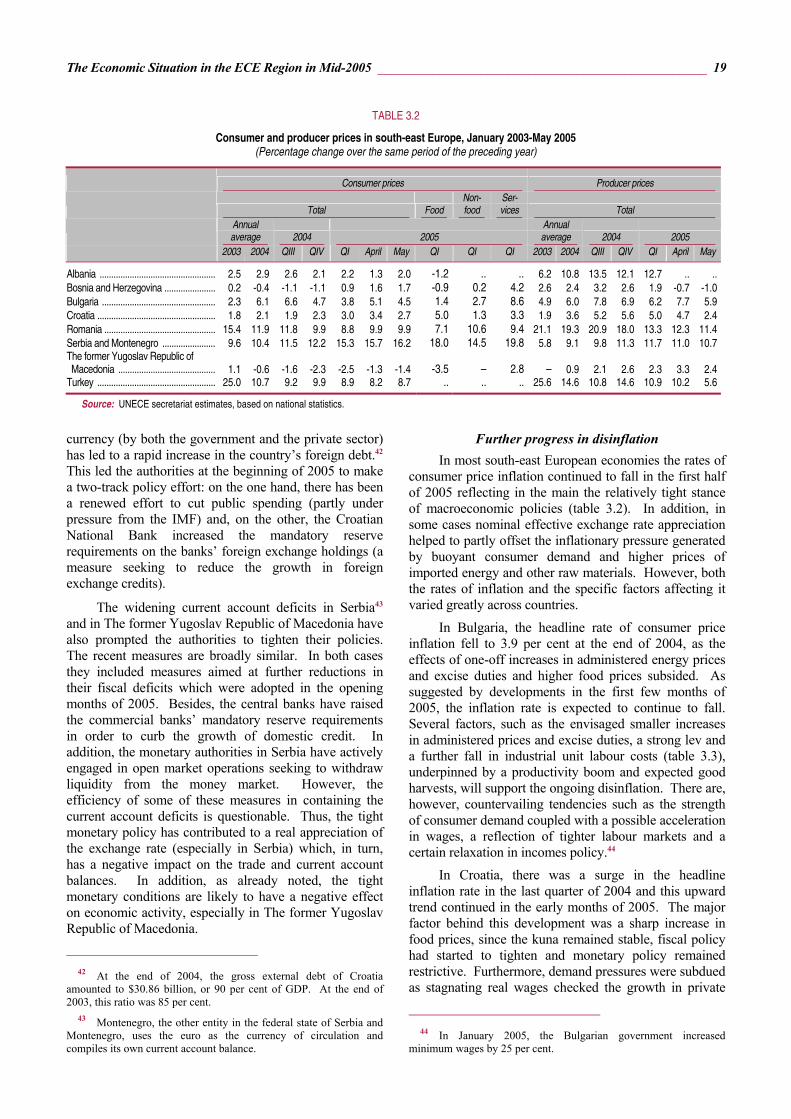
The Economic Situation in the ECE Region in Mid-2005 ________________________________________________ 19
currency (by both the government and the private sector) has led to a rapid increase in the country’s foreign debt.42 This led the authorities at the beginning of 2005 to make a two-track policy effort: on the one hand, there has been a renewed effort to cut public spending (partly under pressure from the IMF) and, on the other, the Croatian National Bank increased the mandatory reserve requirements on the banks’ foreign exchange holdings (a measure seeking to reduce the growth in foreign exchange credits).
The widening current account deficits in Serbia43 and in The former Yugoslav Republic of Macedonia have also prompted the authorities to tighten their policies. The recent measures are broadly similar. In both cases they included measures aimed at further reductions in their fiscal deficits which were adopted in the opening months of 2005. Besides, the central banks have raised the commercial banks’ mandatory reserve requirements in order to curb the growth of domestic credit. In addition, the monetary authorities in Serbia have actively engaged in open market operations seeking to withdraw liquidity from the money market. However, the efficiency of some of these measures in containing the current account deficits is questionable. Thus, the tight monetary policy has contributed to a real appreciation of the exchange rate (especially in Serbia) which, in turn, has a negative impact on the trade and current account balances. In addition, as already noted, the tight monetary conditions are likely to have a negative effect on economic activity, especially in The former Yugoslav Republic of Macedonia.
42 At the end of 2004, the gross external debt of Croatia
amounted to $30.86 billion, or 90 per cent of GDP. At the end of 2003, this ratio was 85 per cent.
43 Montenegro, the other entity in the federal state of Serbia and Montenegro, uses the euro as the currency of circulation and compiles its own current account balance.
Further progress in disinflation In most south-east European economies the rates of
consumer price inflation continued to fall in the first half of 2005 reflecting in the main the relatively tight stance of macroeconomic policies (table 3.2). In addition, in some cases nominal effective exchange rate appreciation helped to partly offset the inflationary pressure generated by buoyant consumer demand and higher prices of imported energy and other raw materials. However, both the rates of inflation and the specific factors affecting it varied greatly across countries.
In Bulgaria, the headline rate of consumer price inflation fell to 3.9 per cent at the end of 2004, as the effects of one-off increases in administered energy prices and excise duties and higher food prices subsided. As suggested by developments in the first few months of 2005, the inflation rate is expected to continue to fall. Several factors, such as the envisaged smaller increases in administered prices and excise duties, a strong lev and a further fall in industrial unit labour costs (table 3.3), underpinned by a productivity boom and expected good harvests, will support the ongoing disinflation. There are, however, countervailing tendencies such as the strength of consumer demand coupled with a possible acceleration in wages, a reflection of tighter labour markets and a certain relaxation in incomes policy.44
In Croatia, there was a surge in the headline inflation rate in the last quarter of 2004 and this upward trend continued in the early months of 2005. The major factor behind this development was a sharp increase in food prices, since the kuna remained stable, fiscal policy had started to tighten and monetary policy remained restrictive. Furthermore, demand pressures were subdued as stagnating real wages checked the growth in private
44 In January 2005, the Bulgarian government increased
minimum wages by 25 per cent.
TABLE 3.2
Consumer and producer prices in south-east Europe, January 2003-May 2005 (Percentage change over the same period of the preceding year)
Consumer prices Producer prices
Total Food Non-food
Ser-vices Total
Annual average 2004
2005
Annual average 2004 2005
2003 2004 QIII QIV QI April May QI QI QI 2003 2004 QIII QIV QI April May
Albania ................................................... 2.5 2.9 2.6 2.1 2.2 1.3 2.0 -1.2 .. .. 6.2 10.8 13.5 12.1 12.7 .. ..Bosnia and Herzegovina ....................... 0.2 -0.4 -1.1 -1.1 0.9 1.6 1.7 -0.9 0.2 4.2 2.6 2.4 3.2 2.6 1.9 -0.7 -1.0Bulgaria .................................................. 2.3 6.1 6.6 4.7 3.8 5.1 4.5 1.4 2.7 8.6 4.9 6.0 7.8 6.9 6.2 7.7 5.9Croatia .................................................... 1.8 2.1 1.9 2.3 3.0 3.4 2.7 5.0 1.3 3.3 1.9 3.6 5.2 5.6 5.0 4.7 2.4Romania ................................................. 15.4 11.9 11.8 9.9 8.8 9.9 9.9 7.1 10.6 9.4 21.1 19.3 20.9 18.0 13.3 12.3 11.4Serbia and Montenegro ........................ 9.6 10.4 11.5 12.2 15.3 15.7 16.2 18.0 14.5 19.8 5.8 9.1 9.8 11.3 11.7 11.0 10.7The former Yugoslav Republic of Macedonia ........................................... 1.1 -0.6 -1.6 -2.3 -2.5 -1.3 -1.4 -3.5 – 2.8 – 0.9 2.1 2.6 2.3 3.3 2.4Turkey .................................................... 25.0 10.7 9.2 9.9 8.9 8.2 8.7 .. .. .. 25.6 14.6 10.8 14.6 10.9 10.2 5.6
Source: UNECE secretariat estimates, based on national statistics.

20 ________________________________________________________________ Economic Survey of Europe, 2005 No. 2
consumption in spite of an improvement in the labour markets. Although still rising faster than the consumer prices, industrial producer prices continued to decelerate over the same period, partly reflecting falling real product wages which appear to have offset the cost-push effect of the slowdown in labour productivity.
In Romania, for the first time since the start of economic transformation, the annual inflation rate fell to single digits in 2004. This downward trend continued also in the first quarter of 2005. However, factors such as the large increase in household consumption, fuelled by rising real wages and employment, strong inflows of remittances from abroad and an ongoing credit expansion have started to exert pressure on consumer prices in the second quarter. Nevertheless, the monetary authorities are committed to meeting the official year-end target for 2005, which is set at 7 per cent.
In Turkey, consumer price inflation fell to 9.1 per cent, year-on-year, in December 2004, nearly 3 percentage points below the official target. The so-called “credibility gap” between the consensus expectations of inflation and the official target turned negative for the first time in mid-2004 reflecting rising confidence in the central bank’s commitment to achieve and maintain price stability. Disinflation continued in the first quarter of 2005 but there was an upturn in the year-on-year rate of consumer prices in April and May, largely due to a significant rise in fuel costs and seasonal adjustments to the prices of clothes. Consumer demand remained buoyant in the first half of 2005 but its inflationary potential was largely offset by weak cost pressures thanks to further productivity gains and relatively modest wage growth.
In Albania, the annual rate of inflation in 2004 remained within the range of 2-4 per cent set by the central bank (the year-on-year rate was 2 per cent in May
2005). A notable appreciation of the lek dampened external price pressures while the rise in private consumption appears to have remained modest in spite of large remittance inflows and some recovery in employment. In Bosnia and Herzegovina, consumer prices were falling during most of 2004 (table 3.2), but in the early months of 2005 inflation started to pick up mainly because of higher import prices. Nevertheless, the cumulative rate of CPI inflation in the first five months was only at 1.7 per cent. Furthermore, producer prices of industrial goods fell by more than 7 per cent over the same period.
Serbia and Montenegro was an exception to this general pattern of disinflation in south-east Europe. Inflation accelerated sharply in 2004 and continued to do so in the first few months of 2005, mainly because of higher domestic energy prices and relatively strong wage growth which fuelled private consumption. In contrast, consumer prices in The former Yugoslav Republic of Macedonia continued to fall in the opening months of 2005, and at a faster rate than in 2004. This reflected a tight macroeconomic policy stance (both of fiscal and, especially, monetary policy). Large falls in public sector employment, in addition to an already very high and persistent rate of unemployment, probably offset the positive effect of the large inflow of remittances on household incomes.
Unemployment persists despite some gains in employment
A certain duality has emerged in the recent development of employment and unemployment in south-east Europe. On the one hand, changes in employment, while significantly different across countries, generally reflect the cyclical position and momentum of each economy, differences in the sectoral composition of
TABLE 3.3
Wages and unit labour costs in industry a in south-east Europe, 2004-2005QI (Percentage change over the same period of the preceding year)
Nominal gross
wages Real product wages b Labour productivity c Unit labour costs d Real unit labour
costs e 2004 2005 f 2004 2005 f 2004 2005 f 2004 2005 f 2004 2005 f
Albania ...................................................... .. .. .. .. -18.9 .. .. .. .. .. Bosnia and Herzegovina ......................... 1.8 3.6 -0.6 1.7 15.3 .. -11.7 .. -13.7 .. Bulgaria ..................................................... 5.9 7.0 -0.1 0.7 15.5 8.9 -8.3 -1.8 -13.4 -7.5 Croatia ....................................................... 4.9 4.4 1.3 -0.6 3.4 1.0 1.5 3.3 -2.0 -1.6 Romania ................................................... 23.0 15.5 3.1 1.9 2.9 2.9 19.5 12.2 0.1 -1.0 Serbia and Montenegro ........................... .. .. .. .. 7.3 .. .. .. .. .. The former Yugoslav Republic of Macedonia .............................................. 4.0 2.9 3.1 0.6 2.6 .. 1.3 .. 0.4 .. Turkey ....................................................... 12.1 8.0 -2.1 -2.6 7.6 1.5 4.2 6.4 -9.1 -4.1
Source: UNECE secretariat estimates, based on national statistics and direct communications from national statistical offices. a Industry = mining + manufacturing + utilities. b Nominal wages deflated by producer price index. c Gross industrial output deflated by industrial employment. d Nominal wages deflated by productivity. e Real product wages deflated by productivity. f First quarter.
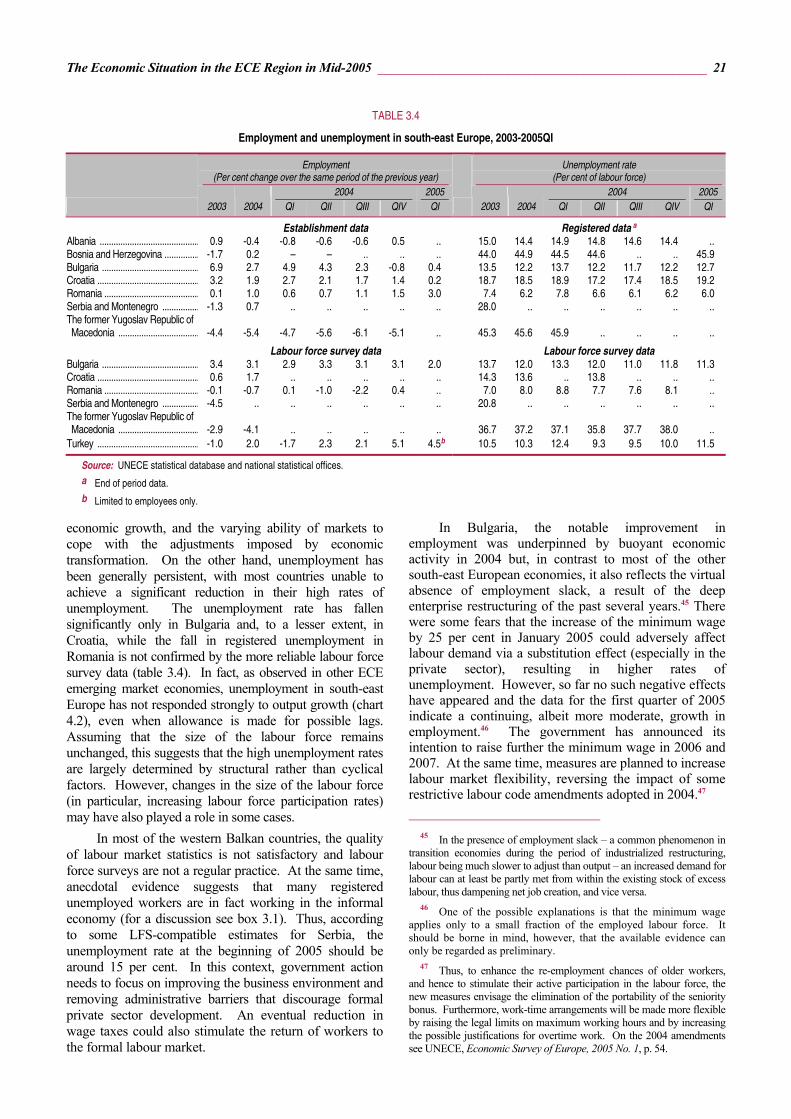
The Economic Situation in the ECE Region in Mid-2005 ________________________________________________ 21
economic growth, and the varying ability of markets to cope with the adjustments imposed by economic transformation. On the other hand, unemployment has been generally persistent, with most countries unable to achieve a significant reduction in their high rates of unemployment. The unemployment rate has fallen significantly only in Bulgaria and, to a lesser extent, in Croatia, while the fall in registered unemployment in Romania is not confirmed by the more reliable labour force survey data (table 3.4). In fact, as observed in other ECE emerging market economies, unemployment in south-east Europe has not responded strongly to output growth (chart 4.2), even when allowance is made for possible lags. Assuming that the size of the labour force remains unchanged, this suggests that the high unemployment rates are largely determined by structural rather than cyclical factors. However, changes in the size of the labour force (in particular, increasing labour force participation rates) may have also played a role in some cases.
In most of the western Balkan countries, the quality of labour market statistics is not satisfactory and labour force surveys are not a regular practice. At the same time, anecdotal evidence suggests that many registered unemployed workers are in fact working in the informal economy (for a discussion see box 3.1). Thus, according to some LFS-compatible estimates for Serbia, the unemployment rate at the beginning of 2005 should be around 15 per cent. In this context, government action needs to focus on improving the business environment and removing administrative barriers that discourage formal private sector development. An eventual reduction in wage taxes could also stimulate the return of workers to the formal labour market.
In Bulgaria, the notable improvement in employment was underpinned by buoyant economic activity in 2004 but, in contrast to most of the other south-east European economies, it also reflects the virtual absence of employment slack, a result of the deep enterprise restructuring of the past several years.45 There were some fears that the increase of the minimum wage by 25 per cent in January 2005 could adversely affect labour demand via a substitution effect (especially in the private sector), resulting in higher rates of unemployment. However, so far no such negative effects have appeared and the data for the first quarter of 2005 indicate a continuing, albeit more moderate, growth in employment.46 The government has announced its intention to raise further the minimum wage in 2006 and 2007. At the same time, measures are planned to increase labour market flexibility, reversing the impact of some restrictive labour code amendments adopted in 2004.47
45 In the presence of employment slack – a common phenomenon in
transition economies during the period of industrialized restructuring, labour being much slower to adjust than output – an increased demand for labour can at least be partly met from within the existing stock of excess labour, thus dampening net job creation, and vice versa.
46 One of the possible explanations is that the minimum wage applies only to a small fraction of the employed labour force. It should be borne in mind, however, that the available evidence can only be regarded as preliminary.
47 Thus, to enhance the re-employment chances of older workers, and hence to stimulate their active participation in the labour force, the new measures envisage the elimination of the portability of the seniority bonus. Furthermore, work-time arrangements will be made more flexible by raising the legal limits on maximum working hours and by increasing the possible justifications for overtime work. On the 2004 amendments see UNECE, Economic Survey of Europe, 2005 No. 1, p. 54.
TABLE 3.4
Employment and unemployment in south-east Europe, 2003-2005QI
Employment (Per cent change over the same period of the previous year)
Unemployment rate (Per cent of labour force)
2004 2005 2004 2005
2003 2004 QI QII QIII QIV QI 2003 2004 QI QII QIII QIV QI
Establishment data Registered data a Albania ........................................... 0.9 -0.4 -0.8 -0.6 -0.6 0.5 .. 15.0 14.4 14.9 14.8 14.6 14.4 .. Bosnia and Herzegovina ............... -1.7 0.2 – – .. .. .. 44.0 44.9 44.5 44.6 .. .. 45.9 Bulgaria .......................................... 6.9 2.7 4.9 4.3 2.3 -0.8 0.4 13.5 12.2 13.7 12.2 11.7 12.2 12.7 Croatia ............................................ 3.2 1.9 2.7 2.1 1.7 1.4 0.2 18.7 18.5 18.9 17.2 17.4 18.5 19.2 Romania ......................................... 0.1 1.0 0.6 0.7 1.1 1.5 3.0 7.4 6.2 7.8 6.6 6.1 6.2 6.0 Serbia and Montenegro ................ -1.3 0.7 .. .. .. .. .. 28.0 .. .. .. .. .. .. The former Yugoslav Republic of Macedonia ................................... -4.4 -5.4 -4.7 -5.6 -6.1 -5.1 .. 45.3 45.6 45.9 .. .. .. ..
Labour force survey data Labour force survey data Bulgaria .......................................... 3.4 3.1 2.9 3.3 3.1 3.1 2.0 13.7 12.0 13.3 12.0 11.0 11.8 11.3 Croatia ............................................ 0.6 1.7 .. .. .. .. .. 14.3 13.6 .. 13.8 .. .. .. Romania ......................................... -0.1 -0.7 0.1 -1.0 -2.2 0.4 .. 7.0 8.0 8.8 7.7 7.6 8.1 .. Serbia and Montenegro ................ -4.5 .. .. .. .. .. .. 20.8 .. .. .. .. .. .. The former Yugoslav Republic of Macedonia ................................... -2.9 -4.1 .. .. .. .. .. 36.7 37.2 37.1 35.8 37.7 38.0 .. Turkey ............................................ -1.0 2.0 -1.7 2.3 2.1 5.1 4.5b 10.5 10.3 12.4 9.3 9.5 10.0 11.5
Source: UNECE statistical database and national statistical offices. a End of period data. b Limited to employees only.

22 ________________________________________________________________ Economic Survey of Europe, 2005 No. 2
Box 3.1
The size of the informal economy in the south-east European and CIS countries
The existence of a business sector outside the official economic system is a phenomenon that is present in all types ofeconomies. At the same time, the notion of informal (also referred to as unofficial, hidden, shadow, unobserved, etc.)economic activity is very broad. In fact, several different concepts and definitions related to this type of business activityhave been suggested on the basis of a survey of national statistical practices of measuring the size of the informal economy.1The broadest concept is that of the “non-observed economy”, which refers to all productive activities that are not captured inthe source data used for the compilation of national accounts. The non-observed economy is assumed to comprise three maincomponents: “underground production” (activities that are legal by their nature but are concealed for tax evasion purposes);“informal activities” (legal production activities characterized by a low level of organization, typically based on unofficialrelationships); and “illegal activities” (those banned by law or illegal when performed by unauthorized persons). In this note,the term “informal economy” is in fact used in the broadest sense, and is equivalent to what is defined above as the “non-observed economy”.
There is abundant evidence that both the size and the types of informal economic activities increased significantly ineconomies undergoing the process of transition from plan to market. While, generally speaking, the most widelyacknowledged reason for the emergence of the informal economy is tax evasion as well as deficiencies in the tax system, thecauses of its growth in the transition economies are more complex, and some of them relate to the specificities of thetransition process. The deep and prolonged transformational recession during the early years of transition was accompaniedby massive job losses. Real household incomes collapsed as a result of declining real wages and shrinking employment.Given the inability of the economy to generate a sufficient number of jobs in the formal sector, and in the absence of adequatesocial safety nets, switching to informal economic activity was a survival strategy for many individuals. The inadequateinstitutional environment and the inability of governments to provide adequate services also contributed to the growth of theinformal sector.2 Overall, despite some decline in recent years, the informal sector still makes an important contribution tototal production and employment in south-east Europe and the CIS.
Estimating the size of informal production and undeclared employment is in principle difficult as neither the entities nor theindividuals that engage in informal activities have incentives to provide accurate information (on the contrary, they usuallyhave strong incentives to conceal such information). Nevertheless, there have been a number of attempts to estimate the sizeof the informal sector, based on different methods and approaches.3 Most national statistical offices make their own estimatesof its size and include these in the reported values of gross domestic product of their respective economies in order to ensurethe exhaustiveness of its coverage.
There is no commonly accepted “best practice” to estimate the size of the informal economy. Every approach has its ownstrengths and weaknesses and yields results that can differ widely from those based on other methods. Table 3.5 shows somerecent estimates based on two versions of the so-called “indirect” approach.4 Given the difficulties and problemssurrounding such estimates, the reported numbers should rather be interpreted as indicating the possible orders of magnitudeof this phenomenon.
The estimates suggest considerable intercountry differences in the size of the informal sector and a closer look at thesereveals some interesting features. Both sets of estimates suggest that most of the south-east European and CIS economieshave much larger informal sectors than central European economies such as the Czech Republic, Hungary, Poland andSlovakia. The latter group of countries are among the most advanced in implementing systemic and market reforms and,on average, their real per capita incomes are considerably higher than those in the south-east European and CISeconomies, partly reflecting the fact that they have achieved much higher rates of economic growth during the past 15years.5 Nevertheless, all the former centrally planned economies still have larger informal sectors than the developedmarket economies (as reflected in the OECD average, excluding Turkey). This suggests that the informal sector of theeconomy in the former centrally planned economies is likely to diminish as reforms progress and real per capita incomesincrease. Indeed, well-functioning product, labour and capital markets are likely to support more job creation in theformal sector of the economy. The strengthening of the institutional environment and the provision of good publicservices, together with reforms that reduce the corporate tax burden, should improve the incentives for businesses to paytaxes. In turn, these changes should also support sustained economic growth, which is the key factor for both net jobcreation and a rise in real per capita incomes.
Although income from informal activities can help to cushion some segments of the population from the strains oftransition and cope with poverty in the short term, reliance on such activities cannot be regarded as a sustainable longer-termsolution. Besides, the informal economy has significant costs in terms of foregone tax revenues, which increases the risks oftriggering a vicious circle of even higher tax rates. It also breeds unfair competition that distorts product and labour markets,which, in turn, undermine the benefits of structural reform for private sector development.
The Economic Situation in the ECE Region in Mid-2005 ________________________________________________ 23
In Croatia, the new Labour Code adopted in 2003 seeks to increase labour market flexibility.48 The recent trends in employment have been generally positive, both in terms of total employment and also for older workers (who enjoyed significant protection under the previous regime and hence might have suffered most from the reform). Labour force survey data also show a slight decline in total unemployment, suggesting that overall the reform has not resulted in net job destruction.49
There has been some modest growth of employment in Turkey since 2004.50 However, the rate of unemployment has remained high, with a significant proportion of persons in long-term unemployment.51 Moreover, some workers have left the labour force altogether resulting in lower participation rates. All this
48 The reforms envisage easing the restrictions on the termination
of employment contracts, a new system of employment intermediation through the Croatian Employment Service (CES), and an increase in the level and duration of unemployment benefits together with a tightening of the eligibility rules.
49 Some uncertainty about the new system led to an initial fall in the number of unemployed registered with the CES in the first quarter of 2004. Subsequently, registered unemployment grew, as was to be expected given the increase in unemployment benefits.
50 Employment in Turkey was slow to respond to the recovery that followed the crisis of 2000-2001. To some extent this was due to the strong increase in labour productivity in the post-crisis years.
51 Long-term unemployment accounts for around 40 per cent of total unemployment in Turkey.
points to the existence of structural problems in the labour market.52 Against this background, reforms to relate wage differences to productivity and to lower the cost of labour for employers might raise employment. Specific measures are needed to address the extremely low rate of female participation.
In Romania, employment growth in 2004 differed widely across sectors. While employment in agriculture declined, there was a significant net job creation in industry and services, reversing falls in 2003. The economies of Bosnia and Herzegovina and Serbia and Montenegro (as well as other western Balkan economies) have remained trapped in a situation of high registered unemployment. In fact, it is likely that a significant share of the labour force is working in the hidden economy while registering as unemployed in order to obtain the associated benefits. In The former Yugoslav Republic of Macedonia, falling employment and high and rising unemployment reflect a combination of increasing labour force participation rates and net job destruction in the economy. The process of enterprise restructuring has continued while output growth has been mainly concentrated in capital-intensive sectors. Furthermore, fiscal consolidation has led to sharp cuts in public
52 Thus, the shift from labour-intensive to more capital-intensive
production has uncovered skill mismatches that hamper employment opportunities, particularly for young workers. Furthermore, high and non-differentiated minimum wages create a barrier to the employment of low-skilled workers.
Box 3.1 (concluded)
The way towards reducing informal activities in south-east Europe and the CIS is to eliminate or at least reduce theirunderlying causes, in particular those that are related to the unfinished transition from plan to market, as outlined above.Acceleration of systemic, structural and institutional reforms and improvements in the protection of property rights shouldcontribute to further progress in establishing well-functioning markets. More transparent and equitable tax systems shouldreduce the incentives for tax evasion. This could encourage business investment (including FDI), possibly setting off avirtuous cycle of higher rates of growth, rising real incomes and a diminishing informal sector.
1 UNECE, Non-Observed Economy in National Accounts. Survey of National Practices (United Nations publication, Sales No.
E.03.II.E56), 2003. 2 For example, in the absence of adequate protection of property rights firm managers may prefer not to rely on the courts for contract
enforcement (and hence pay taxes to the state for this public service) but to pay private agents for this purpose. S. Johnson, D. Kaufmannand A. Shleifer , “The unofficial economy in transition”, Brookings Papers on Economic Activity, 2 (Washington, D.C.), 1997, pp. 159-221.
3 For an overview see F. Schneider and D. Enste, “Shadow economies: size, causes, and consequences”, Journal of Economic Literature,Vol. 38, No. 1, March 2000, pp. 77-114.
4 The “direct” approach is based on sample surveys which, given the nature of the problem, are likely to underestimate the size of theinformal economy. The “indirect” approach takes as a starting point existing discrepancies in the reported statistics on some observableeconomic variable for which there is no plausible economic interpretation. Examples of such discrepancies are those between the growthrates of official output and electricity consumption (physical input approach), between various monetary aggregates (cash transactions,currency demand, cash deposit ratio, etc.) as well as national accounting discrepancies. These discrepancies are assumed to be partly areflection of non-observed economic activities, and various statistical techniques are then applied to derive an estimate of the size of theinformal economy. For example, the so-called DYMIMIC model is an econometric model that produces such estimates (see table 3.5).
5 In 2004, the aggregate GDP of the five central European economies (the Czech Republic, Hungary, Poland, Slovakia and Slovenia) was 29per cent higher than it was in 1989 whereas the aggregate GDP of south-east Europe and the CIS was still 16 per cent below its 1989 level.

24 ________________________________________________________________ Economic Survey of Europe, 2005 No. 2
employment that have not been offset by an increase in job opportunities in the private sector. In Albania, there was a slight improvement in labour market conditions in the last quarter of 2004, mostly driven by employment gains in construction and transport.
4. The Commonwealth of Independent States During the first quarter of 2005 there was some
deceleration in the rate of output growth in the CIS, after two years of very rapid expansion. This was mainly due to the two largest CIS economies, Russia and Ukraine, where growth was adversely affected by both external and domestic factors. While most world commodity prices, especially for crude oil, remained generally high,
there was some weakening in the global demand for various primary products exported by the CIS. Among the domestic factors, supply constraints emerged in the Russian oil sector which, together with other structural problems, had a negative effect on Russia’s economic growth. It is not yet clear whether this slowdown is just a short-term problem, or is likely to be of a more lasting nature.
Domestic demand throughout the CIS has remained buoyant reflecting strong growth in private consumption that has been driven by rising incomes and improving consumer confidence. This, together with generally accommodative macroeconomic policies, has continued to support domestic economic activity. However, inflationary pressures have re-emerged in a number of CIS countries, partly as a result of a recent loosening in macroeconomic policies.
(i) Russia and other European CIS countries
Growth moderates in Russia… A deceleration in the growth of the Russian
economy was already apparent in late 2004, but it became more pronounced in early 2005 (table 4.1).53 Industrial output slowed down in the first quarter of 2005 (chart 4.1), reflecting sluggish performance in the oil sector. Oil exports have also weakened, which is likely a reflection of emerging supply constraints, as demand conditions remained favourable.54 Growth in most manufacturing industries was subdued except for machinery and equipment.55 Rising costs and the real appreciation of the rouble appear to be eroding profit margins and the ability of domestic producers to respond to domestic demand. Capacity constraints may also be emerging in some industries due to underinvestment in previous years.
Business surveys and a strong credit expansion, however, suggest that the Russian economy may have picked up some momentum in the second quarter of 2005.56 Despite a slowdown in real income growth, private consumption (as partially reflected in the
53 The deceleration in the first months of 2005 is discernible even
after adjustments are made for seasonal effects and annual differences in the number of working days. Ministry of Economy of the Russian Federation, O tekushchei situatsii v ekonomike Rossiiskoi Federatsii v yanvare-aprele 2005 g. i otsenkakh do kontsa goda (Moscow), 2005.
54 The volume of total exports grew by only 2.7 per cent year-on-year in the first quarter of 2005, down from 10.3 per cent in the same period in 2004. Oil exports increased by only 0.6 per cent over the same period. Ministry of Economy of the Russian Federation, op. cit.
55 While total manufacturing output expanded by 5.7 per cent year-on-year in the first four months of 2005, that of machinery and equipment soared by 17.4 per cent, thus maintaining its rapid output growth in recent years.
56 According to Moscow Narodny Bank surveys of business conditions in the manufacturing and service sectors of Russia (PMI) [www.mosnar.com].
TABLE 3.5
Size of the informal economy in south-east Europe and the CIS, 2000-2004
(Per cent of GDP)
National accounts
discrepancy method
Currency demand and DYMIMIC
method a
(2002-2003)
South-east Europe Albania (2002) .................................. 28 35 Bosnia and Herzegovina (2003) ..... 53 37 Bulgaria (2003) ................................. 22 38 Croatia (2000) .................................. 7 35 Romania (2000) ............................... 21 37 Serbia and Montenegro (2004) ....... 35 39 The former Yugoslav Republic of Macedonia (1999) .......................... 14 36
CIS Armenia (1999) ................................ 29 49 Azerbaijan (2003) ............................. 20 61 Belarus (2002) .................................. 11 50 Georgia (2001) ................................. 34 68 Kazakhstan (2003) ........................... 22 45 Kyrgyzstan (2003) ............................ 50 41 Republic of Moldova (2000) ............ 31 49 Russian Federation (2003) .............. 23 49 Tajikistan (2003) ............................... 15 .. Ukraine ............................................. .. 55 Uzbekistan ........................................ .. 37
Memorandum items: Czech Republic (2000) ............... 9 20 Hungary (2000) ........................... 18 26 Poland (2003) ............................. 14 29 Slovakia (2000) ........................... 15 20 OECD b ....................................... .. 16
Source: National statistics; UNECE, Non-observed Economy in National Accounts, Survey of National Practices (Geneva), 2003; F. Schneider, The Size of the Shadow Economies of 145 Countries All Over The World: First Results Over the Period 1999 to 2003, IZA Discussion Paper Series No. 1431 (Linz), December 2004.
a The DYMIMIC (dynamic multiple-indicators multiple-causes) model consists of two parts: (1) the measurement model linking the unobserved variables to observed indicators (monetary transactions, participation rates, official working hours, observed output growth rates, etc.); (2) the structural equations model specifying causal relationships between the size of the unobserved economy and the causes (burden of taxation, degree of regulation, “tax morality” of the citizens, etc.). F. Schnider, op. cit., pp. 51-52.
b Unweighted average excluding Turkey.
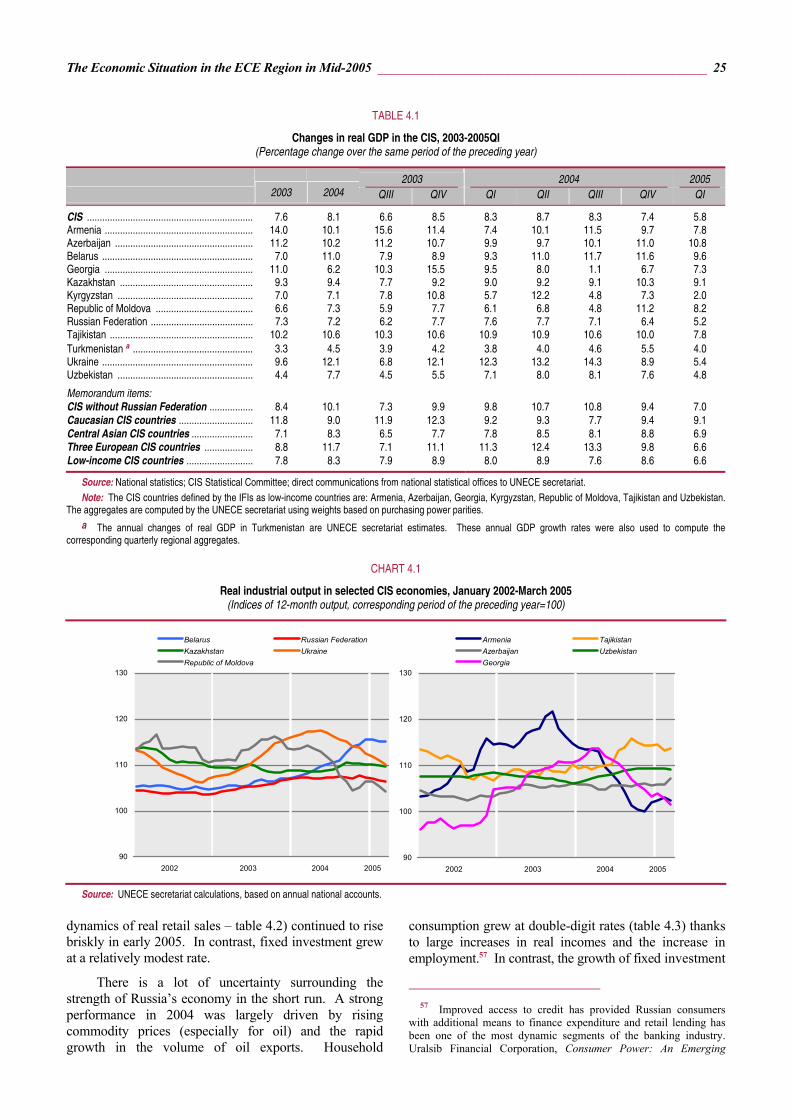
The Economic Situation in the ECE Region in Mid-2005 ________________________________________________ 25
dynamics of real retail sales – table 4.2) continued to rise briskly in early 2005. In contrast, fixed investment grew at a relatively modest rate.
There is a lot of uncertainty surrounding the strength of Russia’s economy in the short run. A strong performance in 2004 was largely driven by rising commodity prices (especially for oil) and the rapid growth in the volume of oil exports. Household
consumption grew at double-digit rates (table 4.3) thanks to large increases in real incomes and the increase in employment.57 In contrast, the growth of fixed investment
57 Improved access to credit has provided Russian consumers
with additional means to finance expenditure and retail lending has been one of the most dynamic segments of the banking industry. Uralsib Financial Corporation, Consumer Power: An Emerging
TABLE 4.1
Changes in real GDP in the CIS, 2003-2005QI (Percentage change over the same period of the preceding year)
2003 2004 2005 2003 2004 QIII QIV QI QII QIII QIV QI
CIS ................................................................. 7.6 8.1 6.6 8.5 8.3 8.7 8.3 7.4 5.8 Armenia .......................................................... 14.0 10.1 15.6 11.4 7.4 10.1 11.5 9.7 7.8 Azerbaijan ...................................................... 11.2 10.2 11.2 10.7 9.9 9.7 10.1 11.0 10.8 Belarus ........................................................... 7.0 11.0 7.9 8.9 9.3 11.0 11.7 11.6 9.6 Georgia .......................................................... 11.0 6.2 10.3 15.5 9.5 8.0 1.1 6.7 7.3 Kazakhstan .................................................... 9.3 9.4 7.7 9.2 9.0 9.2 9.1 10.3 9.1 Kyrgyzstan ..................................................... 7.0 7.1 7.8 10.8 5.7 12.2 4.8 7.3 2.0 Republic of Moldova ...................................... 6.6 7.3 5.9 7.7 6.1 6.8 4.8 11.2 8.2 Russian Federation ........................................ 7.3 7.2 6.2 7.7 7.6 7.7 7.1 6.4 5.2 Tajikistan ........................................................ 10.2 10.6 10.3 10.6 10.9 10.9 10.6 10.0 7.8 Turkmenistan a ............................................... 3.3 4.5 3.9 4.2 3.8 4.0 4.6 5.5 4.0 Ukraine ........................................................... 9.6 12.1 6.8 12.1 12.3 13.2 14.3 8.9 5.4 Uzbekistan ..................................................... 4.4 7.7 4.5 5.5 7.1 8.0 8.1 7.6 4.8
Memorandum items: CIS without Russian Federation ................. 8.4 10.1 7.3 9.9 9.8 10.7 10.8 9.4 7.0 Caucasian CIS countries ............................. 11.8 9.0 11.9 12.3 9.2 9.3 7.7 9.4 9.1 Central Asian CIS countries ........................ 7.1 8.3 6.5 7.7 7.8 8.5 8.1 8.8 6.9 Three European CIS countries ................... 8.8 11.7 7.1 11.1 11.3 12.4 13.3 9.8 6.6 Low-income CIS countries .......................... 7.8 8.3 7.9 8.9 8.0 8.9 7.6 8.6 6.6
Source: National statistics; CIS Statistical Committee; direct communications from national statistical offices to UNECE secretariat. Note: The CIS countries defined by the IFIs as low-income countries are: Armenia, Azerbaijan, Georgia, Kyrgyzstan, Republic of Moldova, Tajikistan and Uzbekistan.
The aggregates are computed by the UNECE secretariat using weights based on purchasing power parities. a The annual changes of real GDP in Turkmenistan are UNECE secretariat estimates. These annual GDP growth rates were also used to compute the
corresponding quarterly regional aggregates.
CHART 4.1
Real industrial output in selected CIS economies, January 2002-March 2005 (Indices of 12-month output, corresponding period of the preceding year=100)
90
100
110
120
130
2002 2003 2004 2005
Belarus Russian FederationKazakhstan Ukraine Republic of Moldova
90
100
110
120
130
2002 2003 2004 2005
Armenia Tajikistan Azerbaijan Uzbekistan Georgia
Source: UNECE secretariat calculations, based on annual national accounts.

26 ________________________________________________________________ Economic Survey of Europe, 2005 No. 2
decelerated through the year, possibly due to turmoil in the banking sector and worsening perceptions of the business climate.58 Stockbuilding made a large contribution to GDP growth in 2004, and the unwinding of these stocks could weaken output expansion in 2005.
The growth of exports accelerated in 2004, based on rising volumes of oil and other commodities. However,
Growth Driver (Moscow), April 2005. The degree of leverage of Russian households is yet very limited but the stock of personal loans doubled in 2004 in a context of declining interest rates.
58 In 2004, the central bank withdrew the licences of several banks (due to irregularities in their operation or to solvency problems).
the contribution of net external demand to GDP growth was significantly negative as a result of booming imports. The ability of local enterprises to benefit from strong domestic demand appears to have declined. Shifting consumer preferences for imports reflect rising real incomes but also losses of domestic competitiveness due to the real appreciation of the exchange rate. Trade and communications were the most vibrant sectors in 2004. Growth in construction was also strong but the problems in the banking sector may have contributed to some deceleration. These developments point to the importance of consumer demand in driving the current expansion and of the structural shift towards a larger share of services in GDP.
TABLE 4.2
Volume of retail trade and real investment outlays in selected CIS economies, 2002-2005QI (Percentage change over the same period of the preceding year)
Volume of retail trade Real investment outlays
2002 2003 2004 2005 a 2002 2003 2004 2005 a
Armenia ................................................. 15.6 14.5 10.5 3.5 45.0 41.0 17.0 22.3 Azerbaijan ............................................. 9.6 10.9 13.0 12.0 84.2 73.5 36.0 -1.8 Belarus .................................................. 11.5 9.9 12.1 19.7 6.0 21.0 20.0 21.9 Georgia ................................................. 3.7 8.7 7.4 4.3 18.3 91.3 .. .. Kazakhstan ........................................... 8.2 9.8 10.9 10.6 10.6 16.6 10.6 47.0 Kyrgyzstan ............................................ 8.2 13.5 22.4 14.3 -9.6 -6.6 2.8 -2.0 Republic of Moldova ............................. 34.2 18.0 11.0 -7.0 11.0 7.0 8.0 28.0 Russian Federation .............................. 9.2 8.4 12.1 10.0 2.6 12.5 10.9 7.6 Tajikistan ............................................... 17.5 24.6 22.4 19.8 .. .. .. 36.5 Ukraine .................................................. 16.2 21.0 18.9 17.5 8.9 31.3 28.0 4.5 Uzbekistan ............................................ 1.7 5.1 4.7 .. 3.8 4.5 5.2 ..
Source: National statistics; CIS Statistical Committee; direct communications from national statistical offices to UNECE secretariat. Note: Retail trade covers mainly goods in Kazakhstan and the Russian Federation; it comprises goods and catering in other CIS countries. The coverage in 2005,
based on current monthly statistics, may differ from the coverage of annual statistics. Investment outlays mainly refer to expenditure on construction and installation works, machinery and equipment. Gross fixed capital formation is usually estimated by adding the following components to “capital investment”: net changes in productive livestock, computer software, original art, the cost of mineral exploration and the value of major renovations and enlargements of buildings and machinery and equipment (which increase productive capacity or extend the service life of existing fixed assets).
a January-March.
TABLE 4.3
Components of real final demand in selected CIS economies, 2002-2004 (Percentage change over the same period of the preceding year)
Private consumption expenditure a
Government consumption expenditure b
Gross fixed capital formation
Exports of goods and services
Imports of goods and services
2002 2003 2004 2002 2003 2004 2002 2003 2004 2002 2003 2004 2002 2003 2004
CIS ................................... 8.8 8.5 .. 1.0 4.2 .. 5.4 14.8 .. 10.5 11.5 .. 10.7 15.8 .. Armenia ............................ 8.9 6.9 10.2 2.2 14.1 16.2 33.1 27.5 12.4 35.8 29.1 -4.7 18.9 26.5 -5.0 Azerbaijan ........................ 8.0 9.7 .. 14.5 22.1 .. 84.0 61.5 .. -6.3 19.6 .. 16.4 57.6 .. Belarus ............................. 10.9 7.2 12.9 0.4 0.3 – 6.7 22.0 18.9 10.1 9.3 .. 9.1 10.9 .. Kazakhstan ...................... 12.2 10.9 11.5 -4.3 7.5 18.4 10.2 8.9 12.4 22.6 5.5 9.6 4.3 -4.1 14.7 Kyrgyzstan ....................... 4.7 24.0 10.9 -0.2 1.2 3.7 -7.4 -6.4 -3.0 8.1 5.3 .. 13.1 16.0 .. Republic of Moldova ......... 6.3 18.6 6.9 30.3 2.2 -18.8 5.7 18.6 7.6 19.0 19.2 4.7 15.7 28.7 -1.7 Russian Federation .......... 8.3 7.4 11.0 2.6 2.2 2.3 3.1 12.8 10.8 10.3 12.5 13.1 14.6 17.7 23.9 Ukraine ............................. 9.0 12.1 .. -6.7 14.8 .. 3.4 15.8 .. 7.4 10.3 .. 3.3 16.4 ..
Source: National statistics; CIS Statistical Committee; direct communications from national statistical offices to UNECE secretariat. Note: The aggregates are computed by the UNECE secretariat using weights based on purchasing power parities. a Expenditures incurred by households and non-profit institutions serving households. b Expenditures incurred by the general government on both individual consumption of goods and services and collective consumption of services.
The Economic Situation in the ECE Region in Mid-2005 ________________________________________________ 27
…and slows down sharply in Ukraine… Economic growth slowed down sharply in Ukraine
in the first quarter of 2005, the year-on-year increase in GDP being less than half its rate in the same period of 2004 (table 4.1). Performance varied widely across the various sectors of the economy: output fell in construction but growth remained very strong in some service sectors, especially transport and communications.59 The weakening of industrial production in late 2004 became more pronounced in early 2005 (chart 4.1). Metallurgy, the largest manufacturing branch, which played a crucial role in boosting exports in 2004, was virtually stagnant as a result of weaker external demand.60 After two years of very strong expansion, fixed investment slowed sharply in the first quarter of 2005 (table 4.2). The announced but still undefined programme of revisions to past privatizations (including the possible renationalization of firms in the event that rampant irregularities are established) has created uncertainty, adding to the effects of the political and financial instability of late 2004.61 Retail trade data suggest that consumer spending remains strong and is likely to be the main source of economic growth in 2005.
The recent deceleration in output growth follows an exceptionally strong performance in 2004, when Ukraine’s economy grew more rapidly than any other in the CIS (table 4.1). Growth was then driven by a combination of buoyant external demand (exports being boosted by a competitive currency and favourable conditions for its key products, in particular steel) and robust private consumption. The strength of consumer demand, which drove the expansion of services, reflected soaring real incomes, boosted by the strong growth of manufacturing industry and by increased pensions. The significant loosening of fiscal policy in the run-up to the presidential elections gave a further boost to economic activity.
…but remains strong in Belarus Following a very strong economic upturn in 2004,
aggregate output in Belarus continued to grow rapidly in the first quarter of 2005. This reflected the continuing strength of manufacturing industry, where output of key
59 Gross added value in construction fell by 5.8 per cent year-on-
year in the first quarter of 2005 and was one of the main factors behind the slower rate of GDP growth.
60 Metallurgy output shrank by 0.3 per cent year-on-year, in the first five months of 2005. The stronger performance of other sectors, however, lifted the overall rate of industrial output growth to 6.2 per cent.
61 The decision to cancel the existing 24 special economic zones, a response to the misuse of the favourable tax and customs regime, has also contributed to this sense of uncertainty. Institute for Economic Research and Policy Consulting, Macroeconomic Forecast Ukraine, No. 1 (Kiev), May 2005. Tax changes and the fight against corruption may have a positive impact on medium-term growth prospects and the public finances, by eventually defining a more transparent framework for private activity. However, in the short term there may be disruptive side effects before the new framework is established and expectations stabilize. Recent credit upgrades reflect the confidence of the rating agencies that a better policy environment will emerge from the changes, despite the current deterioration in economic performance.
sectors such as fuels, metallurgy, metal processing, engineering and food processing were growing at double-digit (year-on-year) rates. Manufacturing has benefited from the strong import demand of Russia (Belarus’ main external market) but also from buoyant domestic demand. As suggested by retail sales data (table 4.2), household consumption was still rising at a fast pace in the first quarter of 2005, boosted by the continuing growth in real wages.
However, the current expansion in Belarus is based on somewhat shaky fundamentals. The main source of the present upturn seems to have been an increased demand for goods produced in the unrestructured and subsidized industrial sector, a demand that has been met by increased capacity utilization.62 This is not sustainable in the longer run: in the absence of adequate investment, utilization of the existing equipment cannot be increased indefinitely while the continued subsidization of inefficient state-owned firms is a drain on public funds. Sooner or later the government will be faced with the challenge of restructuring these firms, including a change of ownership. The relatively good current state of the economy creates an opportunity for the authorities to initiate some of the long delayed structural and systemic reforms.
In recent years GDP growth in the Republic of Moldova has been mostly driven by increased private consumption, fuelled to a large degree by remittances from Moldovans working abroad (for more details see box 4.1).63 In 2004, GDP was also boosted by a bumper harvest in the important agricultural sector and the related food processing industry. However, since mid-2004 there has been a notable slowdown in the growth of industrial output (chart 4.1), partly due to a weakening of exports that became more pronounced in the first quarter of 2005. After the parliamentary elections in March 2005, the new government announced a programme of economic modernization and its ambition to establish closer ties with the European Union. An important test of the commitment of the government to accelerate the reform process will be the outcome of the ongoing negotiations on a much needed funding agreement with the IMF.
62 In contrast to most transition economies that have made
considerable progress, albeit to varying degrees, in privatizing and restructuring their industrial sectors (including the closure of many unviable firms), Belarus has kept most of its state-owned industrial enterprises as going concerns, despite a significant fall in their output, through various direct and indirect subsidies. This explains the existence of spare capacity in the manufacturing sector. During the last decade and a half, industrial enterprises – which are still for the most part state dominated – have undergone only very limited restructuring and by and large, are inefficient. A significant proportion of the state subsidies appears to be used to cover current losses, rather than financing new investment. As a result, the industrial sector as a whole is locked into a suboptimal performance.
63 Final consumption in the Republic of Moldova grew faster than GDP throughout the period 2000-2004. According to different estimates, annual remittances amount to between one quarter and one third of the country’s GDP (for more details see section 5).
28 ________________________________________________________________ Economic Survey of Europe, 2005 No. 2
Box 4.1
From consumption-driven growth towards socially inclusive and environmentally sustainable development in the Republic of Moldova
During the 1990s, the Republic of Moldova was in a deep and protracted economic decline and despite recent growth it remainsone of the poorest countries in the ECE region with an average gross monthly wage of $90 at the current exchange rate ($375 atthe PPP rate). The path of economic transformation has been uneven and slowed down in the late 1990s; important systemic andstructural reforms have been delayed.1
With the deterioration of the economic situation during the transition, and especially after the regional crisis of 1998, there was alarge exodus of jobseekers, 60 per cent of them going to Russia and almost 30 per cent to western Europe. The rapid increase ofinflows of remittances (the highest in per capita terms in the ECE region) provided a key impulse to recovery in the short run: by2004 real GDP was one third higher than its record low level in 1999.2 The exodus has also helped to ease somewhat thesituation in the domestic labour market.3 Extreme poverty has declined, while the share of private household consumption inGDP has increased from 74 per cent in 1999 to almost 90 per cent in recent years.4
However, the sustainability of this pattern of development in the longer term is questionable. Growth has been driven mainly byprivate consumption, fuelled by large increases in real wages, remittances and pensions. Both private and public fixedinvestment has remained subdued and key infrastructures are in a poor state. Another constraint on long-run growth is theemigration of labour, which has led to a major reduction in the effective labour force. Employment has been falling in recentyears, resulting in one of the lowest employment rates in the ECE region.5
To overcome the capital and labour constraints on development, while assuring its sustainability, the authorities have launched anational Economic Growth and Poverty Reduction Strategy (EGPRS) with the aim of raising the trend rate of growth.6 Thespecific targets of the Strategy are linked to the government’s medium-term public expenditure framework and the nationalMillennium Development Goals (MDGs). The key objectives are to achieve a sustainable socially oriented development (interms of equitable growth, the reduction of poverty and inequality, and a better development of human resources) and movetowards European integration.
Two scenarios for medium-term growth are presented in the EGPRS paper. The government’s baseline scenario assumes anaverage GDP growth rate of 5⅓ per cent a year from 2004 to 2006, while the optimistic scenario projects a rate in the range of 8-10 per cent. The most recent data and assessment of prospects suggest that the baseline scenario may well be too cautious: GDPgrew 7.3 per cent in 2004 as a whole and 8.2 per cent, year-on-year, in the first quarter of 2005. Between 1999 and 2004aggregate output growth averaged 6 per cent per annum, below the CIS average of 7 per cent and below the country’s estimatedpotential growth rate of about 10 per cent a year.7 Thus the government’s optimistic scenario appears to be well within theeconomy’s potential.
The authorities estimate that sustained output growth of at least 5 per cent a year is required to meet the principal objectives ofthe Strategy. While this rate seems to be easily attainable in the short and medium term, providing that the government and thecentral bank continue to pursue responsible macroeconomic management, long-term growth prospects hinge upon the successfulimplementation of comprehensive reforms of the poorly functioning product and labour markets, the inefficient governmentsector, and the weak legal system.
The Strategy paper addresses in more detail some specific targets related to the national MDGs. The EGPRS process started in1999 when the nation’s GDP bottomed out and poverty peaked. In a context of widespread poverty, it is not surprising that thethree top priority sectors chosen by policy makers are education, healthcare and social protection. This is reflected in the settingup of corresponding output-oriented budget programmes with assured long-term financing.
So far, the responsiveness of domestic supply to rising domestic demand has been rather poor, contributing to a rapid growth ofimports which has far exceeded that of exports. Remittances from Moldovans abroad have helped to finance the rising tradedeficit but inflows of FDI have been relatively modest. This pattern could change if the domestic environment becomes moreconducive to doing business. Well-established Moldovan communities abroad can also become a source of businessinvestment.8 This is important because with time the strong attachment of emigrants to their home country (and thus the flow ofremittances to their relatives) may weaken if more of them settle permanently in their more prosperous host countries.
Another serious imbalance has developed in the social security system, the result of the combination of declining pensioncontributions with rapidly rising benefits. The underlying weakness of the current pay-as-you-go system arises from the lowretirement age – the government stopped increasing the statutory retirement age in 2001 when it reached 57 years for women and62 years for men – steadily declining levels of employment, and the presence of the large informal economy, which is estimatedto account for at least one third of both total employment and GDP (see also box 3.1). Informal employment is stimulated byhigh non-wage labour costs (social security contributions paid by employers amount to 26.5 per cent of wages) as well as labourmarket rigidities.
Social assistance (consisting of cash benefits and services in kind) appear to be poorly targeted,9 as are tax expenditures in theform of zero-rated VAT on the consumption of selected goods, energy and water services, that benefit well-to-do householdsmore than the poor. The most efficient route to the social inclusion of the low skilled and the disabled is through gainful employment.
The Economic Situation in the ECE Region in Mid-2005 ________________________________________________ 29
Box 4.1 (concluded)
However, the government’s plan to cut further the already low rates of income tax is unlikely to stimulate much employment oflow-skilled jobseekers. A more promising solution might be to finance the public healthcare system from general tax revenuewhile reducing payroll taxes. Fiscal sustainability could also be strengthened by resuming efforts to reform the pension system(put on hold since 2001) and strictly enforcing the mandatory indexation of benefits to an average of consumer price and wageincreases (rather than reviving the practice of populist ad hoc increases in benefits).10 Introducing income supplements for low-wage earners may also help to mobilize the unemployed by increasing demand for low-skilled labour in the formal sector.
In addition to economic growth and poverty reduction, environmental sustainability is the third pillar of the EGPRS architecture.MDGs pertaining to the natural environment are transposed into specific EGPRS targets to improve performance in four criticalareas: water supply, sewage treatment, forestation and natural reserves. However, the financing of the related activities appearsto be largely unsecured. For example, only one fifth of the expenditure necessary to achieve the intermediate objectives forwater supply and sanitation in 2006 was budgeted in the government’s medium-term expenditure framework. Meanwhile waterpollution has intensified with negative consequences for health, especially in rural areas.
Structural reforms (such as the strengthening of the judicial system, improvement of the regulatory framework, more effectivecompetition policy, modernization of the public expenditure system, and so on), as outlined in the Strategy, could produce asignificant “environmental dividend” through the elimination of non-viable activities in the state-controlled sector (less waste and less environmental degradation) and by strengthening the rule of law (stricter observance of ecological regulations). They shouldalso lead to increased private investment as well as larger inflows of grants and preferential finance, which should help thecountry to reach its national MDGs by 2015, including those concerning environmentally sustainable development.
In conclusion, massive labour migration and subsequent large inflows of remittances have helped the country to cope better with theconstraints of external financing and poverty. At the same time, this approach to dealing with the profound economic and socialcrisis of the late 1990s slowed considerably the momentum for systemic and structural reforms, with negative effects on privatebusiness investment and key public infrastructure investments. The resulting reliance of growth on consumption has led to areduction in poverty, but its longer-run sustainability is questionable due to low productivity and a reduced labour supply.Environmental sustainability is also problematic due to chronic underinvestment in the critical water supply and sewerage sector. Ifthe country is to switch from a consumption-driven growth path to one which is job rich and sustainable, it will have to acceleratethe reforms that will help to reverse these negative trends. The national EGPRS is a good start but the process of adopting thenecessary legislation needs to be accelerated and greater effort is needed to implement it efficiently, and enforce it. The authoritieswill also need to pay special attention to economic diversification through the establishment of an appropriate institutionalframework that will foster entrepreneurship in the development of new products and areas of comparative advantage.11
1 According to EBRD’s average index of “progress in transition” (a composite indicator of the progress in market reforms), by 2004
Moldova had slipped to the sixth position within the group of 12 CIS countries (from being second in 1995 and 1996), and fell significantlybehind the leading transition economies in central and south-east Europe. EBRD, Transition Report 2004 (London).
2 The bulk of the remittances are used to finance the growing consumption of households, but some are invested in real estate oreducation. Other types of investment appear to be discouraged by the inadequate business environment.
3 In 2004, involuntary unemployment averaged 8.1 per cent of the labour force. 4 The final consumption of households and general government exceeded GDP every year since 2000, hardly a pattern of balanced development. 5 The employment rate of the working-age population (15-64 years) was only 50 per cent in 2004. The underlying factors include large
employment losses in agriculture and massive labour emigration. According to the 2004 census, 367,000 persons (15 per cent of theworking-age population) left the country to work abroad. Other official sources indicate a migrant population of 571,000, while another120,000 Moldovans are estimated to be ready to depart in the near future. IMF Country Report No. 05/54, Republic of Moldova: SelectedIssues (Washington, D.C.), February 2005, pp. 29-50.
6 The EGPRS process started in late 1999, resulting in a gradual elaboration of a blueprint for equitable and sustainable development thatwas adopted by Parliament in late 2004. Government of the Republic of Moldova, Economic Growth and Poverty Reduction Strategy Paper2004-2006 (Chisinau), 2004.
7 Labour productivity in the Republic of Moldova remains comparatively low, reflecting the large and backward agricultural sector thataccounts for two fifths of employment and less than half as much of GDP. A simple productivity catch-up model with conservativeassumptions implies potential labour productivity growth of 13 per cent a year during the current decade. The LFS data for the last fiveyears indicate that the labour force has declined by about 3 per cent a year. Based on these trends, the potential growth rate estimated by theUNECE secretariat is close to 10 per cent.
8 Broadly speaking, migrants reduce the information costs incurred in developing economic relations between different countries, thusstimulating trade and FDI inflows. A. Mody, “Is FDI integrating the world economy?”, The World Economy, Vol. 27, No. 8, 2004.
9 According to the EGPRS paper, the top income quintile of the population receives almost one half of social assistance benefits, whilethe bottom quintile receives less than one tenth.
10 The pension reform of the late 1990s envisaged a formula-based indexation plus an increase in the mandatory retirement age to 65years for both men and women. Further measures might be necessary in the long run to sustain the viability of the pension system.
11 UNECE, “The policy challenge of economic diversification in the CIS”, Economic Survey of Europe, 2005 No. 1, pp. 9-12.
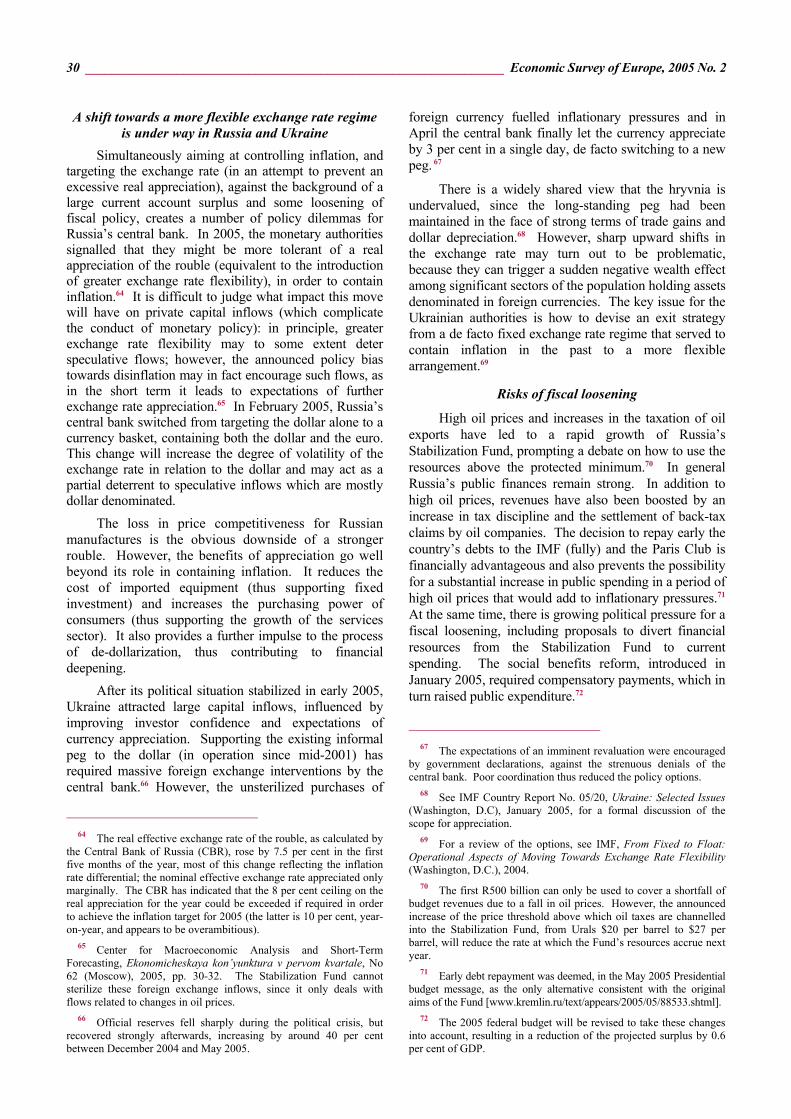
30 ________________________________________________________________ Economic Survey of Europe, 2005 No. 2
A shift towards a more flexible exchange rate regime is under way in Russia and Ukraine
Simultaneously aiming at controlling inflation, and targeting the exchange rate (in an attempt to prevent an excessive real appreciation), against the background of a large current account surplus and some loosening of fiscal policy, creates a number of policy dilemmas for Russia’s central bank. In 2005, the monetary authorities signalled that they might be more tolerant of a real appreciation of the rouble (equivalent to the introduction of greater exchange rate flexibility), in order to contain inflation.64 It is difficult to judge what impact this move will have on private capital inflows (which complicate the conduct of monetary policy): in principle, greater exchange rate flexibility may to some extent deter speculative flows; however, the announced policy bias towards disinflation may in fact encourage such flows, as in the short term it leads to expectations of further exchange rate appreciation.65 In February 2005, Russia’s central bank switched from targeting the dollar alone to a currency basket, containing both the dollar and the euro. This change will increase the degree of volatility of the exchange rate in relation to the dollar and may act as a partial deterrent to speculative inflows which are mostly dollar denominated.
The loss in price competitiveness for Russian manufactures is the obvious downside of a stronger rouble. However, the benefits of appreciation go well beyond its role in containing inflation. It reduces the cost of imported equipment (thus supporting fixed investment) and increases the purchasing power of consumers (thus supporting the growth of the services sector). It also provides a further impulse to the process of de-dollarization, thus contributing to financial deepening.
After its political situation stabilized in early 2005, Ukraine attracted large capital inflows, influenced by improving investor confidence and expectations of currency appreciation. Supporting the existing informal peg to the dollar (in operation since mid-2001) has required massive foreign exchange interventions by the central bank.66 However, the unsterilized purchases of
64 The real effective exchange rate of the rouble, as calculated by
the Central Bank of Russia (CBR), rose by 7.5 per cent in the first five months of the year, most of this change reflecting the inflation rate differential; the nominal effective exchange rate appreciated only marginally. The CBR has indicated that the 8 per cent ceiling on the real appreciation for the year could be exceeded if required in order to achieve the inflation target for 2005 (the latter is 10 per cent, year-on-year, and appears to be overambitious).
65 Center for Macroeconomic Analysis and Short-Term Forecasting, Ekonomicheskaya kon’yunktura v pervom kvartale, No 62 (Moscow), 2005, pp. 30-32. The Stabilization Fund cannot sterilize these foreign exchange inflows, since it only deals with flows related to changes in oil prices.
66 Official reserves fell sharply during the political crisis, but recovered strongly afterwards, increasing by around 40 per cent between December 2004 and May 2005.
foreign currency fuelled inflationary pressures and in April the central bank finally let the currency appreciate by 3 per cent in a single day, de facto switching to a new peg. 67
There is a widely shared view that the hryvnia is undervalued, since the long-standing peg had been maintained in the face of strong terms of trade gains and dollar depreciation.68 However, sharp upward shifts in the exchange rate may turn out to be problematic, because they can trigger a sudden negative wealth effect among significant sectors of the population holding assets denominated in foreign currencies. The key issue for the Ukrainian authorities is how to devise an exit strategy from a de facto fixed exchange rate regime that served to contain inflation in the past to a more flexible arrangement.69
Risks of fiscal loosening
High oil prices and increases in the taxation of oil exports have led to a rapid growth of Russia’s Stabilization Fund, prompting a debate on how to use the resources above the protected minimum.70 In general Russia’s public finances remain strong. In addition to high oil prices, revenues have also been boosted by an increase in tax discipline and the settlement of back-tax claims by oil companies. The decision to repay early the country’s debts to the IMF (fully) and the Paris Club is financially advantageous and also prevents the possibility for a substantial increase in public spending in a period of high oil prices that would add to inflationary pressures.71 At the same time, there is growing political pressure for a fiscal loosening, including proposals to divert financial resources from the Stabilization Fund to current spending. The social benefits reform, introduced in January 2005, required compensatory payments, which in turn raised public expenditure.72
67 The expectations of an imminent revaluation were encouraged
by government declarations, against the strenuous denials of the central bank. Poor coordination thus reduced the policy options.
68 See IMF Country Report No. 05/20, Ukraine: Selected Issues (Washington, D.C), January 2005, for a formal discussion of the scope for appreciation.
69 For a review of the options, see IMF, From Fixed to Float: Operational Aspects of Moving Towards Exchange Rate Flexibility (Washington, D.C.), 2004.
70 The first R500 billion can only be used to cover a shortfall of budget revenues due to a fall in oil prices. However, the announced increase of the price threshold above which oil taxes are channelled into the Stabilization Fund, from Urals $20 per barrel to $27 per barrel, will reduce the rate at which the Fund’s resources accrue next year.
71 Early debt repayment was deemed, in the May 2005 Presidential budget message, as the only alternative consistent with the original aims of the Fund [www.kremlin.ru/text/appears/2005/05/88533.shtml].
72 The 2005 federal budget will be revised to take these changes into account, resulting in a reduction of the projected surplus by 0.6 per cent of GDP.
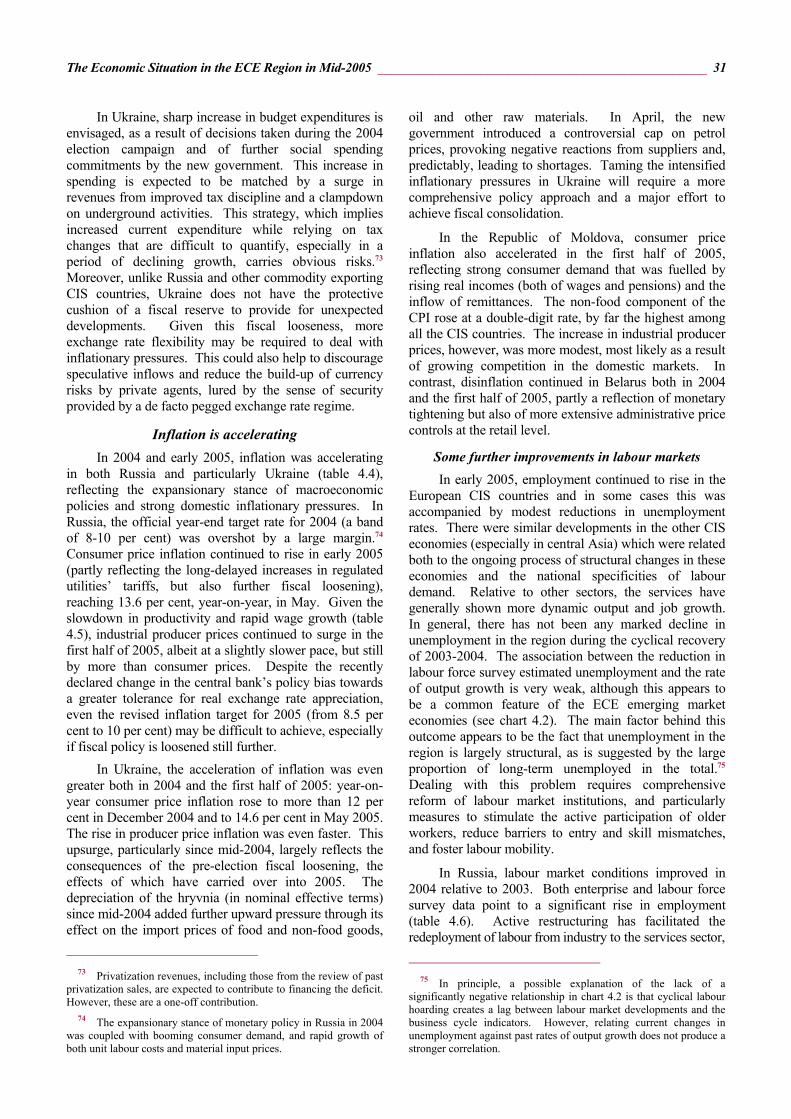
The Economic Situation in the ECE Region in Mid-2005 ________________________________________________ 31
In Ukraine, sharp increase in budget expenditures is envisaged, as a result of decisions taken during the 2004 election campaign and of further social spending commitments by the new government. This increase in spending is expected to be matched by a surge in revenues from improved tax discipline and a clampdown on underground activities. This strategy, which implies increased current expenditure while relying on tax changes that are difficult to quantify, especially in a period of declining growth, carries obvious risks.73 Moreover, unlike Russia and other commodity exporting CIS countries, Ukraine does not have the protective cushion of a fiscal reserve to provide for unexpected developments. Given this fiscal looseness, more exchange rate flexibility may be required to deal with inflationary pressures. This could also help to discourage speculative inflows and reduce the build-up of currency risks by private agents, lured by the sense of security provided by a de facto pegged exchange rate regime.
Inflation is accelerating In 2004 and early 2005, inflation was accelerating
in both Russia and particularly Ukraine (table 4.4), reflecting the expansionary stance of macroeconomic policies and strong domestic inflationary pressures. In Russia, the official year-end target rate for 2004 (a band of 8-10 per cent) was overshot by a large margin.74 Consumer price inflation continued to rise in early 2005 (partly reflecting the long-delayed increases in regulated utilities’ tariffs, but also further fiscal loosening), reaching 13.6 per cent, year-on-year, in May. Given the slowdown in productivity and rapid wage growth (table 4.5), industrial producer prices continued to surge in the first half of 2005, albeit at a slightly slower pace, but still by more than consumer prices. Despite the recently declared change in the central bank’s policy bias towards a greater tolerance for real exchange rate appreciation, even the revised inflation target for 2005 (from 8.5 per cent to 10 per cent) may be difficult to achieve, especially if fiscal policy is loosened still further.
In Ukraine, the acceleration of inflation was even greater both in 2004 and the first half of 2005: year-on-year consumer price inflation rose to more than 12 per cent in December 2004 and to 14.6 per cent in May 2005. The rise in producer price inflation was even faster. This upsurge, particularly since mid-2004, largely reflects the consequences of the pre-election fiscal loosening, the effects of which have carried over into 2005. The depreciation of the hryvnia (in nominal effective terms) since mid-2004 added further upward pressure through its effect on the import prices of food and non-food goods,
73 Privatization revenues, including those from the review of past
privatization sales, are expected to contribute to financing the deficit. However, these are a one-off contribution.
74 The expansionary stance of monetary policy in Russia in 2004 was coupled with booming consumer demand, and rapid growth of both unit labour costs and material input prices.
oil and other raw materials. In April, the new government introduced a controversial cap on petrol prices, provoking negative reactions from suppliers and, predictably, leading to shortages. Taming the intensified inflationary pressures in Ukraine will require a more comprehensive policy approach and a major effort to achieve fiscal consolidation.
In the Republic of Moldova, consumer price inflation also accelerated in the first half of 2005, reflecting strong consumer demand that was fuelled by rising real incomes (both of wages and pensions) and the inflow of remittances. The non-food component of the CPI rose at a double-digit rate, by far the highest among all the CIS countries. The increase in industrial producer prices, however, was more modest, most likely as a result of growing competition in the domestic markets. In contrast, disinflation continued in Belarus both in 2004 and the first half of 2005, partly a reflection of monetary tightening but also of more extensive administrative price controls at the retail level.
Some further improvements in labour markets In early 2005, employment continued to rise in the
European CIS countries and in some cases this was accompanied by modest reductions in unemployment rates. There were similar developments in the other CIS economies (especially in central Asia) which were related both to the ongoing process of structural changes in these economies and the national specificities of labour demand. Relative to other sectors, the services have generally shown more dynamic output and job growth. In general, there has not been any marked decline in unemployment in the region during the cyclical recovery of 2003-2004. The association between the reduction in labour force survey estimated unemployment and the rate of output growth is very weak, although this appears to be a common feature of the ECE emerging market economies (see chart 4.2). The main factor behind this outcome appears to be the fact that unemployment in the region is largely structural, as is suggested by the large proportion of long-term unemployed in the total.75 Dealing with this problem requires comprehensive reform of labour market institutions, and particularly measures to stimulate the active participation of older workers, reduce barriers to entry and skill mismatches, and foster labour mobility.
In Russia, labour market conditions improved in 2004 relative to 2003. Both enterprise and labour force survey data point to a significant rise in employment (table 4.6). Active restructuring has facilitated the redeployment of labour from industry to the services sector,
75 In principle, a possible explanation of the lack of a
significantly negative relationship in chart 4.2 is that cyclical labour hoarding creates a lag between labour market developments and the business cycle indicators. However, relating current changes in unemployment against past rates of output growth does not produce a stronger correlation.
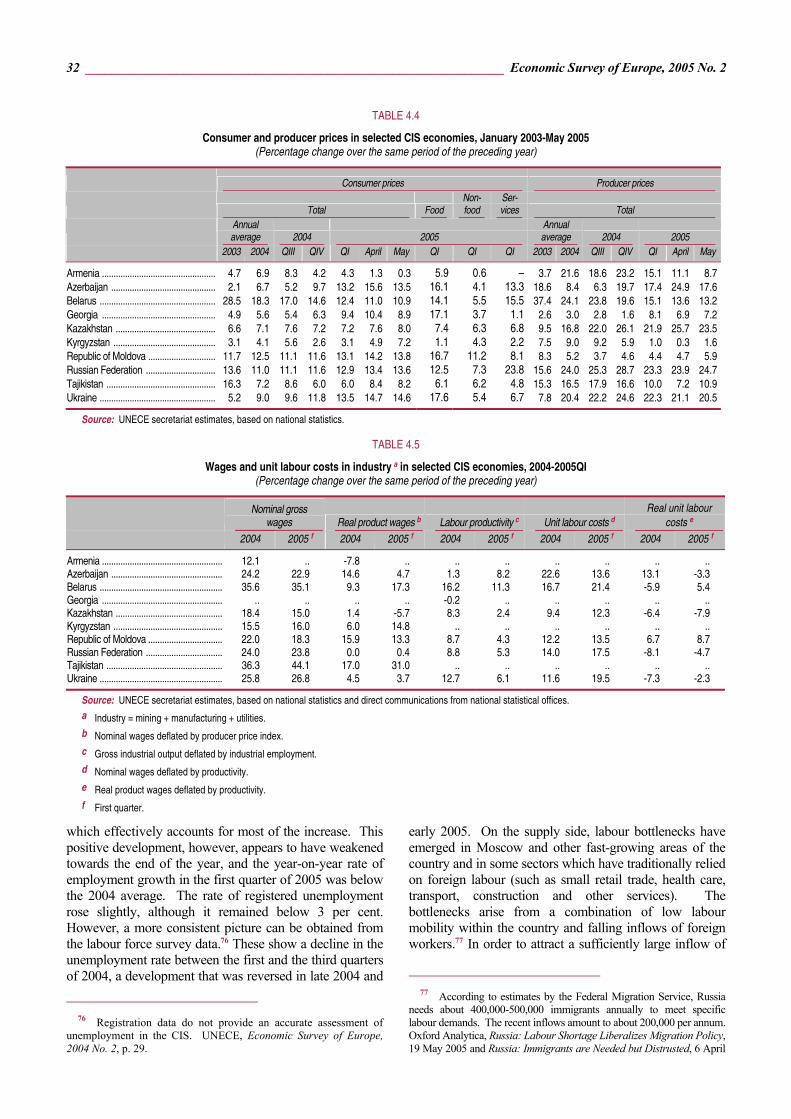
32 ________________________________________________________________ Economic Survey of Europe, 2005 No. 2
which effectively accounts for most of the increase. This positive development, however, appears to have weakened towards the end of the year, and the year-on-year rate of employment growth in the first quarter of 2005 was below the 2004 average. The rate of registered unemployment rose slightly, although it remained below 3 per cent. However, a more consistent picture can be obtained from the labour force survey data.76 These show a decline in the unemployment rate between the first and the third quarters of 2004, a development that was reversed in late 2004 and
76 Registration data do not provide an accurate assessment of
unemployment in the CIS. UNECE, Economic Survey of Europe, 2004 No. 2, p. 29.
early 2005. On the supply side, labour bottlenecks have emerged in Moscow and other fast-growing areas of the country and in some sectors which have traditionally relied on foreign labour (such as small retail trade, health care, transport, construction and other services). The bottlenecks arise from a combination of low labour mobility within the country and falling inflows of foreign workers.77 In order to attract a sufficiently large inflow of
77 According to estimates by the Federal Migration Service, Russia
needs about 400,000-500,000 immigrants annually to meet specific labour demands. The recent inflows amount to about 200,000 per annum. Oxford Analytica, Russia: Labour Shortage Liberalizes Migration Policy, 19 May 2005 and Russia: Immigrants are Needed but Distrusted, 6 April
TABLE 4.4
Consumer and producer prices in selected CIS economies, January 2003-May 2005 (Percentage change over the same period of the preceding year)
Consumer prices Producer prices
Total Food Non-food
Ser-vices Total
Annual average 2004
2005
Annual average 2004 2005
2003 2004 QIII QIV QI April May QI QI QI 2003 2004 QIII QIV QI April May
Armenia .................................................. 4.7 6.9 8.3 4.2 4.3 1.3 0.3 5.9 0.6 – 3.7 21.6 18.6 23.2 15.1 11.1 8.7Azerbaijan .............................................. 2.1 6.7 5.2 9.7 13.2 15.6 13.5 16.1 4.1 13.3 18.6 8.4 6.3 19.7 17.4 24.9 17.6Belarus ................................................... 28.5 18.3 17.0 14.6 12.4 11.0 10.9 14.1 5.5 15.5 37.4 24.1 23.8 19.6 15.1 13.6 13.2Georgia .................................................. 4.9 5.6 5.4 6.3 9.4 10.4 8.9 17.1 3.7 1.1 2.6 3.0 2.8 1.6 8.1 6.9 7.2Kazakhstan ............................................ 6.6 7.1 7.6 7.2 7.2 7.6 8.0 7.4 6.3 6.8 9.5 16.8 22.0 26.1 21.9 25.7 23.5Kyrgyzstan ............................................. 3.1 4.1 5.6 2.6 3.1 4.9 7.2 1.1 4.3 2.2 7.5 9.0 9.2 5.9 1.0 0.3 1.6Republic of Moldova .............................. 11.7 12.5 11.1 11.6 13.1 14.2 13.8 16.7 11.2 8.1 8.3 5.2 3.7 4.6 4.4 4.7 5.9Russian Federation ............................... 13.6 11.0 11.1 11.6 12.9 13.4 13.6 12.5 7.3 23.8 15.6 24.0 25.3 28.7 23.3 23.9 24.7Tajikistan ................................................ 16.3 7.2 8.6 6.0 6.0 8.4 8.2 6.1 6.2 4.8 15.3 16.5 17.9 16.6 10.0 7.2 10.9Ukraine ................................................... 5.2 9.0 9.6 11.8 13.5 14.7 14.6 17.6 5.4 6.7 7.8 20.4 22.2 24.6 22.3 21.1 20.5
Source: UNECE secretariat estimates, based on national statistics.
TABLE 4.5
Wages and unit labour costs in industry a in selected CIS economies, 2004-2005QI (Percentage change over the same period of the preceding year)
Nominal gross
wages Real product wages b Labour productivity c Unit labour costs d Real unit labour
costs e 2004 2005 f 2004 2005 f 2004 2005 f 2004 2005 f 2004 2005 f
Armenia .................................................... 12.1 .. -7.8 .. .. .. .. .. .. .. Azerbaijan ................................................ 24.2 22.9 14.6 4.7 1.3 8.2 22.6 13.6 13.1 -3.3 Belarus ..................................................... 35.6 35.1 9.3 17.3 16.2 11.3 16.7 21.4 -5.9 5.4 Georgia .................................................... .. .. .. .. -0.2 .. .. .. .. .. Kazakhstan .............................................. 18.4 15.0 1.4 -5.7 8.3 2.4 9.4 12.3 -6.4 -7.9 Kyrgyzstan ............................................... 15.5 16.0 6.0 14.8 .. .. .. .. .. .. Republic of Moldova ................................ 22.0 18.3 15.9 13.3 8.7 4.3 12.2 13.5 6.7 8.7 Russian Federation ................................. 24.0 23.8 0.0 0.4 8.8 5.3 14.0 17.5 -8.1 -4.7 Tajikistan .................................................. 36.3 44.1 17.0 31.0 .. .. .. .. .. .. Ukraine ..................................................... 25.8 26.8 4.5 3.7 12.7 6.1 11.6 19.5 -7.3 -2.3
Source: UNECE secretariat estimates, based on national statistics and direct communications from national statistical offices. a Industry = mining + manufacturing + utilities. b Nominal wages deflated by producer price index. c Gross industrial output deflated by industrial employment. d Nominal wages deflated by productivity. e Real product wages deflated by productivity. f First quarter.
The Economic Situation in the ECE Region in Mid-2005 ________________________________________________ 33
foreign workers while fighting illegal immigration and employment, the government is preparing a new set of immigration policies that should come into force towards the end of 2005.
Establishment data suggest mildly negative employment growth in 2004 as a whole for the other European countries in the CIS (table 4.6). However, labour force survey data for Ukraine point to a recovery in employment, particularly in the third quarter of 2004, together with a moderate fall in the unemployment rate. These positive trends were associated with the cyclical upturn in the export-oriented sectors. The expected slowdown in these sectors in 2005-2006 is therefore likely to have a negative effect on the labour market. In the Republic of Moldova there were signs of recovery in employment towards the end of 2004, although LFS data showed that unemployment remained high. In Belarus, payroll employment has also been rising since mid-2004 but the absence of LFS data makes it difficult to assess the situation in the labour market with any great confidence.
(ii) The Caucasian rim Growth moderates but remains strong in Armenia and
Georgia External factors, particularly those affecting the oil
and gas sectors (Azerbaijan and Georgia) but also workers’ remittances and construction programmes (Armenia), have
2005. The economically active population is projected to fall from 2006, which will aggravate the problem further.
continued to exert an important influence on the small economies of the Caucasus. In Armenia, economic growth slowed down in 2004 (table 4.1), largely as a result of a lower level of externally-financed construction. Disruptions in the diamond industry (which is mostly focussed on outward processing) depressed exports but the fall in imports was even larger, possibly as a result of the destocking of raw materials. Net exports thus made a positive contribution to GDP growth, reversing the situation in 2003. Robust consumption (table 4.3) has been fuelled by strong wage growth and large inflows of remittances from abroad. The deceleration in growth is expected to continue in 2005, after four years at exceptionally high rates: retail trade figures point to some moderation of consumption (table 4.2) in the first quarter of 2005, which is consistent with a lower rate of wage growth, but investment picked up strongly. The good harvest of 2004 should be reflected in the output of food processing, the largest industrial sector, in 2005.
In Georgia, the poor performance of the agricultural sector, which accounts for around one fifth of total gross value added, subtracted almost two percentage points from GDP growth in 2004, and was thus a major factor behind the economic slowdown (table 4.1).78 Spillover effects from the construction of oil and gas pipelines (originating in neighbouring Azerbaijan) have supported the expansion of services. Both industrial output and GDP showed a strong recovery in late 2004 and early 2005 (chart 4.1, table 4.1), with services, especially trade, driving the overall expansion.
Azerbaijan is expecting an oil boom
The development of the hydrocarbons sector has continued to fuel growth in Azerbaijan. The main driving force of GDP growth in recent years has been a combination of considerable investment in the oil and gas sectors and strong domestic consumption underpinned by the large wage increases. The direct contribution of the extractive industries to overall economic growth is set to rise dramatically as oil has started to enter the Baku-Ceyhan-Tbilisi pipeline, which is expected to be fully operational by the last quarter of 2005 and to lead to a sharp increase in exports.79 After years of very rapid growth (and atypically high levels of fixed investment), the weakening of business investment in 2005 reflects the completion of key infrastructure projects (although work on the Shah-Deniz gas field and its pipeline continues). In real terms investment outlays fell by 1.8 per cent in the first quarter of 2005 (table 4.2). Consumption, however, remains buoyant, as suggested by the strong growth of retail sales. The non-oil sector, particularly construction, has benefited from spillovers from oil-related activities. As the basic new oil infrastructure nears completion and export revenues start to expand, the nature of these spillovers will also change.
78 Successful efforts to regularize part of the informal economy
complicate the interpretation of the reported GDP figures for 2004. 79 Oil output has been accelerating through the year, its year-on-year
rate of growth reaching 20 per cent in the first five months of 2005.
CHART 4.2
Output growth and changes in unemployment in selected emerging market economies, 2003-2004
Ukraine
Russian Federation Republic of
Moldova
Armenia
Kazakhstan
Turkey
The FYR of Macedonia
Bulgaria
Croatia
Romania
Slovakia
Cyprus
Estonia
Latvia
Malta
Czech Republic
Lithuania
Poland
SloveniaHungary
0
2
4
6
8
10
12
14
-2.0 -1.5 -1.0 -0.5 0.0 0.5 1.0 1.5Changes in LFS unemployment
Rat
e of
GD
P gr
owth
Source: UNECE statistical database and national statistical offices.

34 ________________________________________________________________ Economic Survey of Europe, 2005 No. 2
Managing large foreign exchange flows remains a key policy challenge
The coming oil boom will make more acute the existing dilemmas faced by the monetary authorities in Azerbaijan in trying to contain inflation while avoiding excessive appreciation of the national currency. As inflation moved into double digits, the National Bank of Azerbaijan raised the benchmark discount interest rate from 7 per cent to 7.5 per cent in late May 2005. However, the refinancing rate remains negative in real terms and the overall impact of this measure is in any case going to be limited, given the underdeveloped state of the country’s financial markets. The issuance of bonds to absorb liquidity has been stepped up but it will not be sufficient to contain the surge in liquidity (and the resultant inflationary pressure) stemming from the central bank’s intervention on the foreign exchange market. A combination of sterilization through the State Oil Fund and exchange rate appreciation may be the right approach to avoid stoking inflation. At the same time, deeper restructuring is needed in the non-oil sectors of the economy to preserve their competitiveness.80
80 A recent study identifies a number of sectors that are or could be
competitive, as well as the specific factors that hamper their development. Center for Economic Reforms, Ministry of Economic
Georgia is also set to benefit from the development of the hydrocarbons sector in Azerbaijan. However, transit fees, although substantial, are not significant enough to merit a specific institution (such as the stabilization funds in the major oil exporting countries) to manage them.81 In Armenia, remittances constitute a substantial foreign exchange inflow that exerts a similar upward pressure on the currency and complicates the conduct of monetary policy. The monetary authorities have tried to neutralize their effect through sterilization operations but, as already noted, the effectiveness of this policy is limited in the face of sustained and large inflows. Some fiscal tightening may therefore be needed to offset their impact on the domestic economy.82
Mixed inflation and labour market outcomes
In the first half of 2005, year-on-year inflation rates slowed down only in Armenia reflecting a relatively tight
Development of Azerbaijan, Study of Azerbaijan’s Current and Potential Comparative Advantage (Baku), 2004.
81 In addition, transit revenues are less volatile than oil prices. IMF, Georgia’s Oil and Gas Transit Revenues, IMF Working Paper No. 04/209 (Washington D.C.), November 2004.
82 IMF Country Report No. 05/178, Republic of Armenia: Request for a Three-Year Arrangement Under the Poverty Reduction and Growth Facility (Washington, D.C.), June 2005.
TABLE 4.6
Employment and unemployment in the CIS, 2003-2005QI
Employment (Per cent change over the same period of the previous year)
Unemployment rate (Per cent of labour force)
2004 2005 2004 2005
2003 2004 QI QII QIII QIV QI 2003 2004 QI QII QIII QIV QI
Establishment data Registered data a Armenia ..................................... 0.1 0.3 0.7 -1.6 -1.2 .. .. 10.1 9.0 9.8 9.3 9.1 9.0 8.9 Azerbaijan ................................. 0.6 1.7 0.3 0.3 0.1 0.7 2.0 1.4 1.4 1.4 1.4 1.5 1.4 1.4 Belarus ...................................... -0.9 -0.1 -1.2 -0.6 0.1 0.4 0.5 3.1 1.9 3.0 2.4 2.2 1.9 1.9 Georgia ..................................... -7.5 .. -10.5 -6.6 -12.3 .. .. 2.5 .. .. .. .. .. .. Kazakhstan ............................... 0.9 4.8 1.9 3.2 3.3 3.8 3.8 1.8 1.5 1.9 1.9 1.6 1.5 1.5 Kyrgyzstan ................................ 1.7 3.4 1.0 1.0 .. .. .. 2.9 2.9 3.0 2.9 2.9 2.9 3.0 Republic of Moldova .................. 0.4 -0.4 -0.3 – -0.7 -0.4 .. 1.2 1.4 2.0 1.5 1.6 1.4 2.0 Russian Federation b ................ 0.1 2.0 2.5 3.3 1.9 0.1 0.1 2.2 2.6 2.3 2.1 2.2 2.6 2.8 Tajikistan ................................... 1.5 -0.2d 2.0 2.2 .. .. .. 2.3 2.0 2.2 2.2 2.1 2.0 2.1 Turkmenistan ............................ 2.2 .. .. .. .. .. .. .. .. .. .. .. .. .. Ukraine ...................................... 0.3 -0.2 -4.3 -1.2 .. .. .. 3.6 3.5 3.8 3.4 3.2 3.5 3.6 Uzbekistan ................................ 2.8 3.4 9.1 3.4 3.9 2.6 -1.6 0.3 .. .. .. .. .. ..
Labour force survey data Labour force survey data Armenia ..................................... .. .. .. .. .. .. .. 31.2 31.6 .. .. .. .. .. Azerbaijan c ............................... .. .. .. .. .. .. .. 10.7 .. .. .. .. .. .. Georgia ..................................... -1.3 -1.7 3.9 0.2 -4.1 -6.2 .. 11.5 12.6 13.0 11.9 13.1 12.5 .. Kazakhstan ............................... 4.1 2.8 7.0 1.8 1.1 1.8 1.4 8.8 8.4 8.9 8.3 8.0 8.4 8.5 Kyrgyzstan ................................ .. .. .. .. .. .. .. 9.9 .. .. .. .. .. .. Republic of Moldova .................. -9.9 -3.0 -6.8 -3.8 -2.7 1.4 3.8 7.9 8.1 11.3 7.2 6.3 8.0 9.6 Russian Federation ................... -0.6 2.4 2.2 3.6 2.8 1.0 1.5 7.9 7.8 9.1 7.2 6.9 7.9 8.3 Ukraine ...................................... 0.4 0.7 – – 2.7 -0.1 .. 9.1 8.6 9.3 8.3 8.1 8.7
Source: UNECE statistical database and national statistical offices. a End of period data. b Enterprise survey data from OECD, Main Economic Indicators. c Sample household survey, conducted between 7 May and 6 June 2003. d Estimate.

The Economic Situation in the ECE Region in Mid-2005 ________________________________________________ 35
monetary policy,83 the effects of slower wage growth on consumer demand, and the favourable effect of last year’s good harvest on food prices. Industrial producer prices also decelerated significantly, but nevertheless they still rose more than consumer prices (as they did in most of the other CIS economies). In contrast, inflation accelerated in the first half of 2005 in Georgia and particularly in Azerbaijan. In Azerbaijan this reflected the impact of significant, and largely unsterilized, capital inflows combined with higher prices for utilities and food. Surging real wages and rising employment in the oil and oil-related sectors also led to increased household demand for market services, and their prices also accelerated in 2005. In Georgia, despite the efforts of the monetary authorities and the appreciation of lari in nominal effective terms, inflation accelerated in the second half of 2004 and early 2005, largely due to higher food and energy prices. The year-on-year rate of change of the CPI rose to two digits in April 2005. Producer prices accelerated also albeit at a slower pace but it is uncertain how they are likely to develop over the rest of the year.
Strong output growth has had only a limited effect on labour market developments. This is in line with the generally weak relationship, shown in chart 4.2 and discussed above, between the rate of unemployment and the recovery of output in the ECE emerging market economies. In Azerbaijan employment increased in 2004, but the unemployment rate remained practically unchanged. In Armenia, the annual data suggest little change in employment in 2004, while the rate of unemployment, especially according to LFS data, remained very high. The government recently launched a new programme to subsidize the employment of vulnerable workers (such as the disabled, the long-term unemployed, refugees, orphans and former convicts) in an attempt to prevent them from leaving the labour force and possibly joining the hidden economy. In Georgia, the labour market situation deteriorated considerably in the second half of 2004, with a large fall in the level of employment and the unemployment rate rising above its average in 2003.
(iii) The central Asian CIS economies
Differences in growth performance have emerged
Very strong growth continued in Kazakhstan in early 2005, with GDP growing by 9.1 per cent year-on-year in the first quarter, in line with the previous year’s rate of expansion (table 4.1). The construction sector is booming, reflecting both the large-scale public housing programmes that are under way and intensive private
83 In order to achieve its 3 per cent year-end target rate of
consumer price inflation, the central bank let the dram appreciate with a view to easing external price pressures, which were mainly due to soaring energy costs.
construction.84 While still relatively strong, the growth of industrial output moderated somewhat due to slower growth in manufacturing.85 Output in the oil and gas sectors grew by 11.6 per cent year-on-year in the first five months of 2005, but the production of copper, the second largest export item after oil, fell by 2.1 per cent. Structural change is reflected in the fall of agriculture’s share in GDP and the rise of the service sectors; nevertheless, after a dismal performance of agricultural output in 2004, matters improved in early 2005. In the first quarter domestic demand continued to underpin economic growth: investment accelerated sharply and retail trade was also gathering momentum as consumers benefited from the persistent rise in real incomes and easier access to bank credit (table 4.2).86 Rising employment in recent years has also contributed to the surge in private consumption through its effect on aggregate income.
In Kyrgyzstan, GDP grew strongly in 2004, but increased by just 2 per cent, year-on-year, in the first quarter of 2005. Output of gold (the main export commodity) started to fall in the second half of 2004 and continued to do so into 2005, the principal factor behind the fall in industrial production. Performance was also poor in other sectors, partly as a consequence of the political turmoil in late February 2005. The recovery of investment in 2004, after three years of decline, was modest and appears to have been short-lived, as it fell again in the first quarter of 2005 (table 4.2). The need for diversification of the Kyrgyz economy is pressing, but this requires a stabilization of the political situation and an improvement of the business environment.
Tajikistan’s economy continued to grow strongly but lost some momentum in early 2005: this partly reflects a statistical base effect after years of rapid expansion but lower prices for cotton, one of its key exports, was also a factor. GDP growth slowed down markedly in Uzbekistan, despite the fact that industrial growth has remained robust: a weakening of domestic demand has had a negative effect on activity in the service sector. In Turkmenistan, disruptions to gas exports, due to commercial disputes with both Russia and Ukraine, and falling output in oil refining have contributed to a weak growth rate of GDP in early 2005.
84 Gross value added in the construction sector rose by 27.7 per
cent year-on-year in the first quarter of 2005, contributing almost one percentage point to the overall rate of GDP growth.
85 The slowdown in metallurgy was partly due to disruption in some productive facilities.
86 Investment in the extractive industries accounts for almost half of the total but the factors behind the increase are to be found in manufacturing and services, particularly in real estate, trade and transport. Consumer credit has recently become the second fastest growing category of credit, after housing loans. It rose by 134 per cent in the year to the end of the first quarter of 2005, increasing its share of total credit by almost three percentage points.
36 ________________________________________________________________ Economic Survey of Europe, 2005 No. 2
Fiscal loosening adds to the risks of overheating in Kazakhstan
Buoyant oil exports and strong growth continue to boost fiscal revenues in Kazakhstan. However, the political cycle seems to favour a relaxation of fiscal discipline, with presidential elections scheduled for 2006. A recent amendment of the 2005 budget envisages an increase in average public sector wages by 32 per cent as of 1 July 2005 and a further 30 per cent increase in 2006. The additional spending (an increase of around 9 per cent in 2005) is to be met by higher than initially projected revenues, resulting from a revision of the forecast of the oil price.
The looser fiscal policy, which will boost an already robust domestic demand, contrasts with the decision of the National Bank of Kazakhstan (NBK) to tighten monetary policy, increasing its benchmark refinancing rate from 7 per cent to 7.5 per cent in February 2005.87 Restrictions on foreign currency operations by residents have recently been lifted in the expectation that investments abroad will partly offset the large inflows of foreign exchange due to the development of the hydrocarbons sector. It should also relieve some of the appreciation pressures on the tenge and thus the need for intervention by the NBK.88 Large-scale foreign borrowing by the commercial banks has become another important source of capital inflows.89 The authorities are contemplating broader reserve requirements for banks to discourage such borrowing abroad.
Taming the resurgent inflation is proving difficult
Inflationary pressures intensified in Kazakhstan in 2004 and early 2005 as the efforts of the monetary authorities to counter the inflationary effect of the large foreign currency inflows were weakened by an expansionary fiscal policy. Real household incomes continued to rise in early 2005 as a result of accelerating wage growth and a continued recovery in employment, the consequence being further pressure on consumer prices. The steep rises in labour and material costs have led to large increases of industrial producer prices: in April 2005, they were nearly 26 per cent higher than a year earlier, the highest rate of increase in the CIS.
87 The NBK refrained from raising its policy interest rates in late
2004, despite strong indications to the contrary, but the persistence of inflationary pressures finally persuaded it to tighten monetary policy.
88 The NBK envisages the full liberalization of currency operations from 1 January 2007. Ob osnovnykh napravleniyakh denezhno-kreditnoi politiki na 2005-2007 gody i tekushchei situatsii na finansovom rynke (Almaty), 2 February 2005 [www.nationalbank.kz].
89 This is partly due to insufficient domestic sources of long-term funding. However, the worsening of the net external position of the banking sector, coupled with a rather lumpy repayment schedule, have increased the vulnerability of the economy to external shocks. Fitch Ratings, Kazakhstan: Rising External Borrowing by Banks and Sovereign Rating Implications, 15 April 2005 [www.fitchratings.com].
In Kyrgyzstan, the year-on-year rate of inflation accelerated in the first half of 2005 partly because of disruptions to the supply of consumer goods which were due to looting and border closures in March. Given the moderate rise in producer prices, however, CPI inflation is likely to remain manageable in the short term.
In Tajikistan, the central bank tightened monetary policy in early 2004 and the rate of inflation fell sharply to single digits in the second half of the year. However, the rise in domestic utility tariffs and domestic fuel prices, in addition to increases in public sector wages, pensions and the minimum wage, have started to raise the overall consumer price level after the first quarter of 2005. Producer price inflation continued to moderate in the early months of 2005 suggesting that if the monetary policy remains tight, the year end inflation rate may be in single digits.
In Uzbekistan, a very tight monetary policy, which had been in place since 2003 as part of the effort to introduce currency convertibility, was reversed in the second half of 2004. While this relaxation provided support to economic activity (the primary goal of the authorities), it also resulted in an upsurge of inflation.90 In June 2005, the central bank signalled its intention to return to a tighter policy stance.
In Turkmenistan the government maintains extensive price controls and subsidies on basic goods as well as providing certain household items free of charge. Open inflation, therefore, is likely to remain low in 2005.
Signs of further improvement in the labour markets
Labour market developments in the central Asian economies have been generally positive, at least as far as employment is concerned. In Kazakhstan, the improvement, especially in the first half of 2004, was essentially due to the expansion of the services sector. Long-term unemployment, however, still accounts for a large share of total unemployment, and is thus a major obstacle to a significant reduction in the high unemployment rate. Moreover, as the workforce is projected to increase in coming years, the rate of job creation will necessarily have to rise in order to maintain momentum in the growth of employment.
Establishment data for 2004 suggest employment rose in Kyrgyzstan and Uzbekistan, but the available evidence for Tajikistan indicates that the improvements of the first six months of 2004 came to a halt in the second half of the year. The most recent improvements
90 The authorities in Uzbekistan discontinued the regular
publication of official price statistics in 2001 and since then no reliable statistics on inflation are available. The official estimate of average annual consumer price inflation in 2004 is 3.7 per cent, while the IMF estimates it was 15.5 per cent. IMF, “IMF Executive Board concludes 2005 Article IV Consultation with Republic of Uzbekistan”, Public Information Notice No. 05/73 (Washington, D.C.), 10 June 2005.
The Economic Situation in the ECE Region in Mid-2005 ________________________________________________ 37
in employment largely reflect net job creation in the services sector. Agriculture still remains the largest source of employment in the central Asian economies, but the trends in agricultural employment differ across countries: in some of them the reverse shift of labour from manufacturing to agriculture, a movement that occurred during the 1990s as a result of the downsizing in manufacturing industry, is still going on while in others it seems to be coming to an end.
5. Foreign trade and payments in eastern Europe and the CIS
(i) Balance of payments and external financial flows
With solid domestic economic growth, historically high commodity prices and a favourable world economy, balance of payments trends in the ECE emerging market economies (EME) were generally favourable during 2004. A few countries, however, continue to have current account deficits which are unsustainable and external debt levels that may become problematic. All of the non-resource-abundant EME continue to rely partially on capital inflows for financing their development; FDI inflows for the region as a whole appear to have stabilized at around 3 per cent of GDP.91 Investor confidence in emerging markets, including the EME, appears to be declining after a mild sell-off in the spring of 2005 and these countries may face increasing risk premiums over the coming year. The EU-10, south-east Europe, and especially the CIS continue to accumulate international reserve assets but, in the former two regions, these fell as a percentage of GDP during 2004.
The counterpart to the current account deficits are the surpluses in the capital accounts. As the EME continue to liberalize their capital accounts it is worth recalling the fact that the empirical evidence for a relationship between financial integration and economic growth is very weak. The benefits of capital openness are restricted to those countries with quality financial institutions, good public governance, fiscal discipline and macroeconomic stability.92 Thus the ability of these countries to benefit from external finance will depend more on their continued efforts towards institutional reform and not only on the size of their capital inflows. Excessive reliance on such inflows, even if they consist
91 The balance of payments analysis (table 5.1) uses variables
expressed as percentages of GDP unless stated otherwise; this allows for a more meaningful comparison across countries and also eliminates much of the distortion created by the relatively large fluctuations in the dollar and euro exchange rates. The dollar value of the current account balances and FDI inflows can be found in appendix tables B.16 and B.17, respectively.
92 E. Prasad, K. Rogoff, S.-J. Wei and A. Kose, Financial Globalization, Growth and Volatility in Developing Countries, NBER Working Paper No. 10942 (Cambridge, MA), December 2004.
of FDI,93 needs to be avoided since the probability of a financial crisis, based upon past trends for a given emerging market middle-income economy in a given year, is 8 per cent while the economic costs of an average crisis is 9 per cent of GDP94 and appears to lower permanently an economy’s income level from its long-run trend.95
Stable trends but significant deficits in the new member states
The collective current account of the new EU member states (EU-10) was in deficit to 4.3 per cent of GDP during 2004, similar to its level in the previous three years. Behind this overall stability, however, there is a wide variation amongst the countries of the region both in their deficits for 2004 and their trends over the last several years. The stable current account balance for the region also masks an underlying trend where the size (as a per cent of GDP) of the merchandise trade deficit has been in progressive decline, falling to 4 per cent of GDP in 2004, while the surplus in the service account (which existed for all but one of the EU-10)96 increased slightly to 1.5 per cent; the deficit in the factor income and transfers account has been increasing due to dividend outflows and interest on loans and was 1.9 per cent of GDP in 2004.
The current account deficits of the Baltic countries remain quite large (and in the case of Latvia have increased substantially) and are primarily due to large merchandise trade deficits. FDI inflows of 8.4 per cent of GDP in Estonia partially financed its current account deficit, while in Latvia there was greater reliance upon short-term inflows of currency and deposits. Cyprus and Malta have also been running very large trade deficits (26.2 and 13.2 per cent of GDP respectively) but, with large surpluses on their services accounts (transport, tourism and a variety of business services for Cyprus, and tourism for Malta), have maintained moderately sized current account deficits. The Czech Republic and Hungary also had large current account deficits in 2004 (5.2 per cent and 8.8 per cent of GDP, respectively) due mostly to deficits in their investment income accounts. A significant proportion of the latter consists of reinvested earnings and as such does not represent a current demand for foreign exchange. The moderate aggregate current account position for the new member states mainly reflected the small deficits of Poland (1.5 per cent of GDP) and Slovenia (0.4 per cent of GDP).
93 Although FDI is generally preferable to other types of capital
inflows, it does not increase a country’s ability to earn foreign exchange if it is largely due to privatizations in the non-traded sectors; see the discussion on financial vulnerability in the EME in UNECE, Economic Survey of Europe, 2005 No. 1, chap. 1.2(iv).
94 B. Eichengreen, “Financial instability”, a paper written for the Copenhagen Consensus and presented in Copenhagen May 2004.
95 V. Cerra and S. Saxena, “Did output recover from the Asian crisis?”, IMF Staff Papers, Vol. 52, No. 1, April 2005, pp.1-23.
96 The exception is Hungary where the services account was in deficit by an insignificant $12 million.
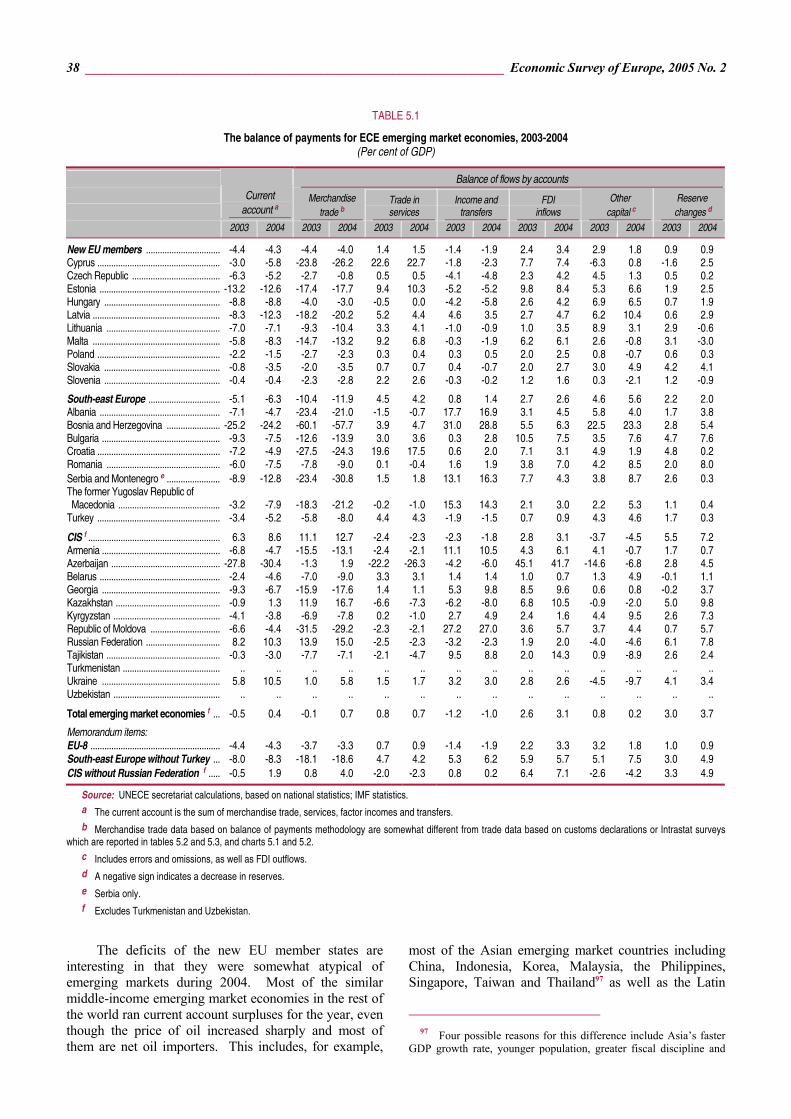
38 ________________________________________________________________ Economic Survey of Europe, 2005 No. 2
The deficits of the new EU member states are interesting in that they were somewhat atypical of emerging markets during 2004. Most of the similar middle-income emerging market economies in the rest of the world ran current account surpluses for the year, even though the price of oil increased sharply and most of them are net oil importers. This includes, for example,
most of the Asian emerging market countries including China, Indonesia, Korea, Malaysia, the Philippines, Singapore, Taiwan and Thailand97 as well as the Latin
97 Four possible reasons for this difference include Asia’s faster
GDP growth rate, younger population, greater fiscal discipline and
TABLE 5.1
The balance of payments for ECE emerging market economies, 2003-2004 (Per cent of GDP)
Balance of flows by accounts
Current
account a Merchandise
trade b Trade in services
Income and transfers
FDI inflows
Other capital c
Reserve changes d
2003 2004 2003 2004 2003 2004 2003 2004 2003 2004 2003 2004 2003 2004
New EU members ................................ -4.4 -4.3 -4.4 -4.0 1.4 1.5 -1.4 -1.9 2.4 3.4 2.9 1.8 0.9 0.9 Cyprus ..................................................... -3.0 -5.8 -23.8 -26.2 22.6 22.7 -1.8 -2.3 7.7 7.4 -6.3 0.8 -1.6 2.5 Czech Republic ...................................... -6.3 -5.2 -2.7 -0.8 0.5 0.5 -4.1 -4.8 2.3 4.2 4.5 1.3 0.5 0.2 Estonia .................................................... -13.2 -12.6 -17.4 -17.7 9.4 10.3 -5.2 -5.2 9.8 8.4 5.3 6.6 1.9 2.5 Hungary .................................................. -8.8 -8.8 -4.0 -3.0 -0.5 0.0 -4.2 -5.8 2.6 4.2 6.9 6.5 0.7 1.9 Latvia ....................................................... -8.3 -12.3 -18.2 -20.2 5.2 4.4 4.6 3.5 2.7 4.7 6.2 10.4 0.6 2.9 Lithuania ................................................. -7.0 -7.1 -9.3 -10.4 3.3 4.1 -1.0 -0.9 1.0 3.5 8.9 3.1 2.9 -0.6 Malta ....................................................... -5.8 -8.3 -14.7 -13.2 9.2 6.8 -0.3 -1.9 6.2 6.1 2.6 -0.8 3.1 -3.0 Poland ..................................................... -2.2 -1.5 -2.7 -2.3 0.3 0.4 0.3 0.5 2.0 2.5 0.8 -0.7 0.6 0.3 Slovakia .................................................. -0.8 -3.5 -2.0 -3.5 0.7 0.7 0.4 -0.7 2.0 2.7 3.0 4.9 4.2 4.1 Slovenia .................................................. -0.4 -0.4 -2.3 -2.8 2.2 2.6 -0.3 -0.2 1.2 1.6 0.3 -2.1 1.2 -0.9
South-east Europe ............................... -5.1 -6.3 -10.4 -11.9 4.5 4.2 0.8 1.4 2.7 2.6 4.6 5.6 2.2 2.0 Albania .................................................... -7.1 -4.7 -23.4 -21.0 -1.5 -0.7 17.7 16.9 3.1 4.5 5.8 4.0 1.7 3.8 Bosnia and Herzegovina ....................... -25.2 -24.2 -60.1 -57.7 3.9 4.7 31.0 28.8 5.5 6.3 22.5 23.3 2.8 5.4 Bulgaria ................................................... -9.3 -7.5 -12.6 -13.9 3.0 3.6 0.3 2.8 10.5 7.5 3.5 7.6 4.7 7.6 Croatia ..................................................... -7.2 -4.9 -27.5 -24.3 19.6 17.5 0.6 2.0 7.1 3.1 4.9 1.9 4.8 0.2 Romania ................................................. -6.0 -7.5 -7.8 -9.0 0.1 -0.4 1.6 1.9 3.8 7.0 4.2 8.5 2.0 8.0 Serbia and Montenegro e ....................... -8.9 -12.8 -23.4 -30.8 1.5 1.8 13.1 16.3 7.7 4.3 3.8 8.7 2.6 0.3 The former Yugoslav Republic of Macedonia ............................................ -3.2 -7.9 -18.3 -21.2 -0.2 -1.0 15.3 14.3 2.1 3.0 2.2 5.3 1.1 0.4 Turkey ..................................................... -3.4 -5.2 -5.8 -8.0 4.4 4.3 -1.9 -1.5 0.7 0.9 4.3 4.6 1.7 0.3
CIS f ......................................................... 6.3 8.6 11.1 12.7 -2.4 -2.3 -2.3 -1.8 2.8 3.1 -3.7 -4.5 5.5 7.2 Armenia ................................................... -6.8 -4.7 -15.5 -13.1 -2.4 -2.1 11.1 10.5 4.3 6.1 4.1 -0.7 1.7 0.7 Azerbaijan ............................................... -27.8 -30.4 -1.3 1.9 -22.2 -26.3 -4.2 -6.0 45.1 41.7 -14.6 -6.8 2.8 4.5 Belarus .................................................... -2.4 -4.6 -7.0 -9.0 3.3 3.1 1.4 1.4 1.0 0.7 1.3 4.9 -0.1 1.1 Georgia ................................................... -9.3 -6.7 -15.9 -17.6 1.4 1.1 5.3 9.8 8.5 9.6 0.6 0.8 -0.2 3.7 Kazakhstan ............................................. -0.9 1.3 11.9 16.7 -6.6 -7.3 -6.2 -8.0 6.8 10.5 -0.9 -2.0 5.0 9.8 Kyrgyzstan .............................................. -4.1 -3.8 -6.9 -7.8 0.2 -1.0 2.7 4.9 2.4 1.6 4.4 9.5 2.6 7.3 Republic of Moldova .............................. -6.6 -4.4 -31.5 -29.2 -2.3 -2.1 27.2 27.0 3.6 5.7 3.7 4.4 0.7 5.7 Russian Federation ................................ 8.2 10.3 13.9 15.0 -2.5 -2.3 -3.2 -2.3 1.9 2.0 -4.0 -4.6 6.1 7.8 Tajikistan ................................................. -0.3 -3.0 -7.7 -7.1 -2.1 -4.7 9.5 8.8 2.0 14.3 0.9 -8.9 2.6 2.4 Turkmenistan .......................................... .. .. .. .. .. .. .. .. .. .. .. .. .. .. Ukraine ................................................... 5.8 10.5 1.0 5.8 1.5 1.7 3.2 3.0 2.8 2.6 -4.5 -9.7 4.1 3.4 Uzbekistan .............................................. .. .. .. .. .. .. .. .. .. .. .. .. .. ..
Total emerging market economies f ... -0.5 0.4 -0.1 0.7 0.8 0.7 -1.2 -1.0 2.6 3.1 0.8 0.2 3.0 3.7
Memorandum items: EU-8 ........................................................ -4.4 -4.3 -3.7 -3.3 0.7 0.9 -1.4 -1.9 2.2 3.3 3.2 1.8 1.0 0.9 South-east Europe without Turkey ... -8.0 -8.3 -18.1 -18.6 4.7 4.2 5.3 6.2 5.9 5.7 5.1 7.5 3.0 4.9 CIS without Russian Federation f ..... -0.5 1.9 0.8 4.0 -2.0 -2.3 0.8 0.2 6.4 7.1 -2.6 -4.2 3.3 4.9
Source: UNECE secretariat calculations, based on national statistics; IMF statistics. a The current account is the sum of merchandise trade, services, factor incomes and transfers. b Merchandise trade data based on balance of payments methodology are somewhat different from trade data based on customs declarations or Intrastat surveys
which are reported in tables 5.2 and 5.3, and charts 5.1 and 5.2. c Includes errors and omissions, as well as FDI outflows. d A negative sign indicates a decrease in reserves. e Serbia only. f Excludes Turkmenistan and Uzbekistan.

The Economic Situation in the ECE Region in Mid-2005 ________________________________________________ 39
American economies of Argentina, Brazil and Chile. Many of these countries benefited from strong non-oil commodity prices and robust export growth.
The current account deficits of the EU-10 were financed largely by foreign direct investment, although there were increasing and sizeable inflows of portfolio investment and borrowing (especially for Hungary). With increasing interest rates in the United States, investors’ tolerance for the risks associated with emerging markets may be declining and this portfolio investment could reverse quickly if concerns about economic stability or a sizeable depreciation arose.
Fiscal budget deficits are widely regarded as an important factor explaining current account deficits, i.e. the twin deficits proposition. This, however, is a ceteris paribus relationship; empirically it need not be the case that countries with larger fiscal deficits actually have larger current account deficits. The current economic situation in the new member states demonstrates this point, as the two variables were negatively correlated (but not statistically significant) in 2004, i.e. the smaller the fiscal deficit the larger the current account deficit. The two countries with exceptionally large current accounts deficits, Estonia and Latvia, have the two best fiscal positions in the EU-10; Estonia even had a budget surplus in 2004. Despite this observation, fiscal consolidation for a given country is believed likely to improve the current account.98 To the degree that the new member states will need to reduce their fiscal deficits in order to satisfy the Maastricht criteria and will receive income transfers from the EU, it is likely that their current account deficits will decline over the next few years. In many emerging markets there has been a trend towards issuing more of its government debt in domestic currency because it appeals to foreign investors due to its higher interest rates. However, Hungary has been shifting the financing of its fiscal deficit from the domestic market to foreign currency issues where interest rates are lower.99
The dependence of these countries on external sources of finance is also due to their national savings and investment balance; more savings, ceteris paribus,
greater recognition of the vulnerabilities of depending on capital inflows. B. Eichengreen and O. Choudhry, “Managing capital inflows: eastern Europe in an Asian mirror”, a paper prepared for the Turkish Central Bank/Center for European Integration Studies conference on Macroeconomic Policies for EU Accession (Ankara), 6-7 May 2005.
98 The relationship between a fiscal deficit and a current account deficit depends to an extent on the degree to which the former affects private savings. It has been argued by some (i.e. Ricardian equivalence) that a fiscal deficit causes agents to increase current private savings to deal with their future tax liabilities, and therefore an increased fiscal deficit need not result in an increased current account deficit.
99 Financial firms often give higher bond ratings to domestic currency debt since the probability of a default is likely to be lower since governments can print money to pay them off.
would lower their current account deficits.100 Although their national savings rates are similar to the EU-15 average in nominal values, it has been suggested that savings in the EU-8 are considerably lower than the EU-15 where the comparison is based on international prices.101 This is because the prices of capital goods in the EU-8 are close to world levels but those of consumer goods are significantly lower. Thus savings for the EU-8 are 19 per cent of GDP at domestic prices but only 12.6 per cent at international prices. Thus the principal reasons for the current account deficits of the new member states are their fiscal budget deficits and low private savings combined with favourable investment opportunities provided by EU accession.
FDI in the EU-10 increased from 2.4 per cent of GDP in 2003 to 3.4 per cent in 2004; however, these inflows (as a percentage of GDP) remain significantly below their levels of several years earlier when the majority of the privatizations were being undertaken. The largest inflows were in Estonia (8.4 per cent of GDP), Cyprus (7.4 per cent) and Malta (6.1 per cent). For many of these countries, a significant portion of their FDI is not new equity investment but reinvested earnings. For example, in Estonia over one half of its FDI was reinvested earnings. The EU remains the largest source of FDI in the region with Russia and the United States providing additional investments. Hungary’s outward FDI is also concentrated in the region; during the first quarter of 2005 it was the largest investor in Slovakia.
The new member states have reached the level of per capita income at which domestic enterprises begin to undertake significant FDI abroad. However, other than Hungary, such outflows are not yet sizeable. In Hungary, only 15 firms account for 80 per cent of the total FDI outflow.102 Given that research suggests that investment abroad may be beneficial for economic development by improving integration into the world economy, government assistance in promoting outward investment may be desirable; many of the developed economies such as Germany, Japan, the United Kingdom and the United States have such programmes. The Czech Republic’s Export Import Bank, Hungary’s Export Credit Guarantee Corporation and Slovenia’s Export Corporation provide various types of investment guarantee or political risk
100 It must be remembered that this is a ceteris paribus
relationship; thus, for example, Poland has a very low rate of national savings but a quite small current account deficit. A detailed analysis of savings and investment in the EME is contained in R. Dobrinsky, Domestic Savings and the Driving Forces of Investment in the ECE Emerging Market Economies, UNECE, Occasional Paper No. 4 (United Nations publication, Sales No. E.05.II.E.12), 2005.
101 W. Orlowski, “Accelerate change: higher saving is the key to higher growth for new EU members”, Finance and Development (Washington, D.C.), June 2004, pp. 34-35.
102 GKI Gazdaságkutató, “Direct investment flows in central and eastern Europe”, Economic Trends and Research Summaries, No. 4 (Budapest), 2004.
40 ________________________________________________________________ Economic Survey of Europe, 2005 No. 2
insurance for such outflows. The remaining countries in the region may find it worthwhile to consider such policies.103 The more developed EME outside the EU can encourage outward FDI by further capital account liberalization and by pursuing bilateral investment and tax treaties favourable towards outward FDI.
Portfolio capital inflows are increasing into the EU-10 concurrently (causality runs both ways) with the rapid increase in stock prices in these countries. These stock markets have provided some of the best returns in the world over the last several years. During 2004 the Slovak SAX rose by over 80 per cent, the Czech PX50 and the Hungarian BUX by almost 60 per cent, the Baltic BALTIX by 40 per cent, and the Polish WIG by 20 per cent. EU membership has reduced the perceived risk and improved the transparency of investing in these markets and opened them to a number of participants, such as foreign pension funds, that had previously been subject to restrictions on investing in these countries. Portfolio inflows into Slovakia increased almost eight-fold in 2004, while they almost quadrupled in Poland, and more than tripled in the Czech Republic and Hungary. A sizeable portion of these portfolio capital inflows, however, are used to purchase bonds rather than equities.
A number of the EU-10 central banks continue to maintain a delicate balance in keeping their interest, inflation and exchange rates within the desired targets. There have been appreciation pressures on several currencies, such as the Czech and Slovak koruna, which interventions were unable to limit and had to be addressed with lower interest rates. These, however, may ultimately prove to be inflationary although they may provide some stimulus to additional employment. Six of the EU-10 have now joined the ERM-2; still waiting to join are the Czech Republic, Hungary, Poland and Slovakia.
A development that may require increased policy attention is the significant amount of foreign currency denominated loans (as well as deposits) by the private sector in a number of the EU-10 as well as in many of the south-east European and CIS economies.104 Although their volume has fluctuated through the years depending on economic circumstances, within the EU-10 they currently appear to be significant in the Baltic countries, Hungary and Poland, but less so in the Czech Republic, Slovakia and Slovenia. For example, in Hungary 60 per cent of long-term (over five years) corporate loans and 14 per cent of household loans are in
103 K. Kalotay, “Outward FDI from central and eastern European
countries”, Economics of Planning, Vol. 37, Issue 2, 2004, pp. 141-172. 104 Foreign currency holdings as a per cent of the broad money
supply are also large in many countries, especially in south-east Europe and the CIS. For example in 2004, this share was approximately 58 per cent in Croatia, 53 per cent in Serbia, 46 per cent in The former Yugoslav Republic of Macedonia, 41 per cent in Belarus, 39 per cent in Turkey and 36 per cent in Romania and Bosnia and Herzegovina.
foreign currencies.105 Foreign currency denominated loans can contribute to economic development by creating a market for long-term debt that does not exist in domestic currency; this is especially critical for business investment and residential home loans. However, financial systems with a large percentage of foreign denominated debt are generally considered more vulnerable to shocks; how the increased capital market openness, which is occurring throughout the region, might compound these risks is less clear.106 The prevalence of this type of loan within a country is due to a number of institutional factors including the exchange rate regime, subsidies or tax schemes legally restricted to domestic currencies, and the extent of foreign-owned banks. However, the major motivation is the belief that there is less risk or a better return (or lower interest rates for borrowers) on foreign currency loans; generally, borrowers have had to pay lower interest rates on euro, dollar or Swiss franc loans than on domestic currency loans. Given the likelihood that these nations will adopt the euro over the medium term, it is perhaps surprising that there has recently been a decline in the proportion of euro-denominated loans (although they remain dominant) in several countries in favour of other currencies such as the Swiss franc; this might be due to the recent appreciation of the euro or the lower interest rates on Swiss franc loans. The risk that these foreign currency loans might precipitate a crisis of some sort is less clear; what is clear, however, is that if there were a crisis or significant exchange rate depreciation, debt in domestic currency would increase. Since households and some businesses do not normally cover their exchange rate risks, the viability of these loans may be put in question and this could translate into an issue of the banking system’s own solvency. From a macroeconomic perspective, this gives a depreciation a strong deflationary impact and would complicate the task of policy-making in a crisis.
Large deficits financed by FDI in south-east Europe
The current account deficits in the south-east European countries besides Turkey deteriorated slightly by an additional 0.3 percentage points to 8.3 per cent of GDP in 2004. These were financed largely by FDI inflows which amounted on average to 5.7 per cent of GDP. These fairly large deficits in 2004 are the result of sizeable double-digit trade deficits for all the
105 International Center for Economic Growth – European Center,
“The rise of foreign currency denominated lending in central European NMS”, Quarterly Report on the New Member States (Budapest), 2005/1.
106 G. Nicolo, P. Honohan and A. Ize, Dollarization of the Banking System, World Bank Policy Research Working Paper, No. 3116 (Washington, D.C.), 2003; and P. Honohan and A. Shi, Deposit Dollarization and the Financial Sector in Emerging Markets, World Bank Policy Research Working Paper, No. 2748 (Washington, D.C.), December 2001.
The Economic Situation in the ECE Region in Mid-2005 ________________________________________________ 41
countries (except Romania at 9 per cent of GDP)107 and averaged 18.6 per cent of GDP; trade deficits were over 20 per cent of GDP for Albania, Croatia, Serbia and The former Yugoslav Republic of Macedonia, and over 50 per cent for Bosnia and Herzegovina. The current accounts of Albania and Bosnia and Herzegovina benefited significantly from worker remittances and other private transfers. These large current account deficits are increasing the external debt levels for a number of countries to levels where they may raise concern. Croatia’s total foreign debt (private and public) reached the government’s ceiling of 80 per cent of GDP ($30.2 billion) in December 2004 and prompted the central bank to discourage local banks from further foreign borrowing by raising the mandatory reserve ratio on these loans from 24 to 30 per cent.
During 2004, Bulgaria and Romania attracted 69 per cent of the FDI into the south-east European countries (excluding Turkey). FDI in Romania more than doubled from its 2003 level as a percentage of GDP, and since 2002 has more then quadrupled in value. A significant portion of the 2004 inflow for these countries resulted from large privatizations including utility privatizations in Bulgaria. Despite these recent large FDI inflows, the cumulative value of FDI per capita in the two accession countries is less than half the level in the EU-8. Despite the treaties signed in January 2005 by Bulgaria and Romania to join the EU, and despite the soaring stock markets in both countries (from February 2004 to February 2005 Bulgaria’s SOFIX index climbed 78 per cent and Romania’s BET10 Index more than doubled) foreign portfolio inflows into these two countries during 2004 were insignificant. This is partially due to restrictions on capital inflows which are gradually being removed as part of their EU obligations; in Romania, foreigners can now open leu deposits and will be able to buy leu-denominated debt, such as treasury bills and money market instruments, by 1 September 2006.108 Currency interventions by these two countries to maintain exchange rates resulted in large increases in their international reserves; Romania’s increased by 8 per cent of GDP and Bulgaria’s by 7.6 per cent of GDP in 2004. FDI in The former Yugoslav Republic of Macedonia remains low at 3 per cent of GDP, with most of it concentrated on privatizations with little greenfield investment and little investment in the manufacturing sector.
Turkey’s current account, which was in surplus in 2001 following its currency crisis, has returned to a deficit of 5.2 per cent of GDP in 2004. FDI in Turkey
107 In addition, Romania’s trade deficit is less problematic in that
over half of all its imports are capital goods; its IMF target for the current account deficit in 2005 is 6.9 per cent of GDP.
108 Restrictions on capital account transactions remain in a number of the other south-east European countries; for example, foreigners cannot currently invest in short-term dinar securities in Serbia, and Serbians are restricted in their foreign investment options.
remains quite low, at less than 1 per cent of GDP, and much of that is real estate purchases by foreign households; legislative reform to make the country a more desirable location for FDI achieved only limited success in 2004. According to J.P. Morgan, Turkey is expected to issue more debt overseas during 2005 than any other emerging market economy in the world. With a relatively high level of external debt, much of it short term, and a rapidly increasing current account deficit, Turkey is particularly vulnerable to rising global interest rates, an increasing market sentiment for safety, and a possible negative investor reaction to the defeat of the referendums on the EU constitution in France and the Netherlands. Turkey has an IMF agreement which commits it to tight targets for inflation and its external accounts. The beginning of EU accession negotiations with Croatia and Turkey is expected to increase FDI in both these markets in the coming years.
Diverging prospects in the CIS
Current account developments in the CIS region109 differ substantially according to their production and export structures. In Russia and Ukraine, current account surpluses increased to over 10 per cent of GDP in 2004. In both economies there were sizeable merchandise trade surpluses due to favourable prices for oil and natural gas for Russia and steel for Ukraine. Ukraine also had surpluses in its services and transfers accounts due to transit payments received from Russian energy exporters and workers’ remittances. Kazakhstan had the largest merchandise trade surplus (16.7 per cent of GDP) of any EME but, due to deficits on the services and income accounts, its current account surplus was only 1.3 per cent of GDP. Although Azerbaijan had a small trade surplus of 1.9 per cent of GDP, it had the largest current account deficit of any EME due to large payments to foreign firms to construct and manage their energy infrastructure and for payments for capital services (much of which were reinvested). The remaining countries of the CIS had both merchandise and current account deficits. A number of the CIS economies are vulnerable to external shocks due to falling export prices since exports (in 2004) accounted for over half of the GDP of Belarus, Kazakhstan, Tajikistan and Ukraine; Armenia and Georgia are the only CIS economies where exports are less than 30 per cent of GDP.
Remittances are providing a stable source of foreign exchange
Increasingly wage income earned abroad is becoming a sizeable component in the balance of payments of the EME; this is especially true of the south-east European and CIS countries. Income earned abroad by seasonal or short-term workers (residents for less than
109 Recent and reliable balance of payments data are not available
for Turkmenistan and Uzbekistan; therefore the discussion of this section and the data on CIS aggregates excludes these two countries.

42 ________________________________________________________________ Economic Survey of Europe, 2005 No. 2
a year) appear in the balance of payments as workers’ compensation under the income account while income earned abroad by migrants (foreign residence for over a year) appear as workers’ remittances under the current transfers account.110 The importance of these transfers is nowhere more important than for the Republic of Moldova where they amounted to 27 per cent of its GDP in 2004; 111 they also amount to almost 15 per cent of GDP for Albania, Bosnia and Herzegovina and Serbia, over 5 per cent for Armenia, Georgia and Kyrgyzstan, and under 5 per cent, but still significant, for most of the remaining EME.112 As a source of foreign exchange this foreign earned income is equivalent to over 70 per cent of Moldova’s exports and is over four and a half times the amount of FDI it receives. When transfers are of this size, they imply migration levels which have significant implications for the labour market; estimates are that at least 25 per cent of Moldova’s economically active population has emigrated and the reduced supply of workers has increased wages within the country (box 4.1).113 Central and east European workers have tended to migrate to western Europe while CIS workers tend to go to Russia, which is the source of the largest amount of remittances of any EME ($4.5 billion including workers’ compensation in 2004, of which $3.3 billion went to the CIS) followed by Kazakhstan ($1.2 billion). Empirical studies have found that the volatility of remittances is lower than for either private or official capital inflows; thus these income flows appear to provide a relatively stable source of income.114 Some empirical analysis has found that remittances from family members actually increase when domestic households experience a negative income shock and therefore act as a type of
110 Repatriation of financial assets when migrant workers return
appear as capital transfers. Unreported remittances, which may be sizeable, that pass through the banking system end up in the errors and omissions category; thus the current accounts of countries with large unreported remittances may be more favourable than reported.
111 For countries with large net factor income from residents abroad, gross national income is significantly larger than gross domestic product. For countries that have received a lot of foreign investment, GDP overstates the income of domestic residents, but when remittances are large, GDP understates the income of domestic residents.
112 In dollar value terms, Poland receives the largest amount of remittances. Reported remittances to Turkey have been in steep decline since 2000 but much of this reflects a methodological change by the central bank in how they are calculated. For instance, money spent by Turkish citizens residing abroad who visit Turkey as well as their conversions from their foreign exchange accounts to lira are now classified as tourism revenues instead of workers’ remittances.
113 A detailed analysis of the significance of workers’ remittances for Moldova can be found in IMF Country Report No. 05/54, Republic of Moldova: Selected Issues (Washington, D.C.), February 2005.
114 C. Buch and A. Kuckulenz, Worker Remittances and Capital Flows to Developing Countries, ZEW Discussion Paper No. 04-31 (Mannheim), April 2004.
insurance.115 Thus when there are aggregate shocks which affect an entire country, remittances might be expected to increase significantly; however, this was not the case for Turkey during its crisis in 2000-2001.116 As foreign residents abroad can attract even more emigration through networking effects, these large remittances are likely to persist or at least until such time as the domestic employment situation in these countries improves significantly. Remittances, like capital inflows, can lead to an appreciation of a currency and complicate monetary policy.
FDI in the CIS continued its slowly increasing trend, accounting for 3.1 per cent of GDP during 2004. In value, the CIS attracted more FDI (almost $23 billion) during 2004 than either the EU-10 or south-east Europe. However, FDI remains relatively low in Belarus, Kyrgyzstan and Russia. Although the estimated dollar value of cumulative FDI is much larger in the EU-10 than the CIS, as a percentage of GDP in the CIS without Russia it is at a similar level of 31 per cent. Over the years the merits of FDI in the transition economies have been debated extensively, and recent research on Ukraine continues to support the view that it can be quite beneficial.117 Financial analysts had expressed some concern about a possible negative reaction to the Yukos affair, but FDI in Russia amounted to 2 per cent of GDP in 2004, double its share in 2002. A number of major corporations have recently announced their intention to move into Russia. For example, both Toyota and DaimlerChrysler have announced plans to build car plants around St. Petersburg. These proposed investments were influenced by Russia’s proposed reduction in the import tariff on automobile parts from 12 per cent to zero; however, the country currently requires foreign firms to acquire at least 50 per cent of car parts from local suppliers. China has also recently been investing in construction, timber and agricultural projects. There was an increase in Russia’s sizeable non-FDI capital outflows during 2004, while its FDI abroad remained large at a level similar to that in 2003.
115 R. Chami, C. Fullenkamp and S. Jahjah, “Are immigrant
remittance flows a source of capital for development?”, IMF Staff Papers, Vol. 52, No. 1, April 2005, pp. 55-81; and D. Yang and H. Choi, “Are remittances insurance? Evidence from rainfall shocks in the Philippines”, University of Michigan, Research Seminar in International Economics, Discussion Paper No. 535 (Ann Arbor, Michigan), April 2005.
116 However, a longer-run analysis of Turkish remittances over the 1979-1993 period did find them to be consumption smoothing over this period, i.e. negatively related to domestic income; see O. Aydas, B. Neyapti, and K. Metin-Ozcan, “Determinants of workers remittances: the case of Turkey”, Bilkent University, Department of Economics, 2004, mimeo.
117 A recent study examining FDI in Ukraine finds that it increases labour productivity and exports, S. Lutz and O. Talavera, “Do Ukrainian firms benefit from FDI?”, Economics of Planning, Vol. 37, Issue 2, 2004, pp.77-98.
The Economic Situation in the ECE Region in Mid-2005 ________________________________________________ 43
FDI inflows into Azerbaijan, Georgia, Kazakhstan and Tajikistan in support of their natural resource sectors (pipeline construction in Azerbaijan and Georgia including the recently completed Baku-Tbilisi-Ceyhan oil pipeline) remain quite high. In Azerbaijan, FDI amounted to 42 per cent of GDP in 2004, one of the highest ratios in the world; over 97 per cent of this went into the energy sector. In Armenia, FDI increased substantially to 6.1 per cent of GDP and was distributed across a number of industries but concentrated in communications, mining and food.
The controversy surrounding the Ukrainian election in the fall of 2004 resulted in a minor financial crisis as depositors attempted to withdraw their money from the banking system. The central bank used over a billion dollars of its international currency reserves before it was forced to temporarily limit withdrawals. Short-run capital outflows for the year were almost $10 billion; as a percentage of GDP, non-FDI net capital outflows were the largest for any EME. Nevertheless, due to its strong current account balance, Ukraine’s international currency reserves for the year as a whole increased by $2.2 billion. Ukraine, which has maintained tight restrictions on foreign exchange transactions since the time of the Russian financial crisis, has begun to liberalize this market. As of 1 April 2005, it eliminated a requirement that exporters must sell at least half their foreign currency earnings to the interbank market.118 Increased flexibility for commercial banks is also likely; currently they are limited to conducting foreign currency trading only under clients’ orders and are restricted to either buying or selling (but not both) foreign currency during any one day. The new Ukrainian government’s announced intention to review previous privatizations could increase uncertainty which might limit capital inflows (especially from their largest investor, Russia) in the near future, although FDI is nevertheless expected to increase in the longer run in the wake of a more aggressive reform agenda.
The extraordinary increase in export oil revenues during 2004 presented several CIS central banks with a number of difficult policy dilemmas, especially since many of them have only a limited ability to sterilize their foreign exchange operations. In order to smooth its consumption through time and limit the appreciation of the rouble, Russia has been using its substantial current account surpluses of over 10 per cent of GDP to accumulate foreign exchange reserves (which, including gold, exceeded $137 billion by April of 2005), some of which has gone into its Stabilization Fund (discussed in section 4) and some to repay its foreign debt ahead of schedule. In January 2005 Russia settled its outstanding
118 Similar requirements remain in some other CIS countries, e.g.
Uzbekistan.
debt with the IMF and repaid at par value some of its Soviet-era Paris Club debt ahead of schedule; Russia’s public external debt as of 1 April 2005 was $110 billion (19 per cent of GDP) with $40 billion owed to the Paris Club (approximately half to Germany) and the latter is expected to be reduced to $25 billion by the end of 2005. Russia’s total foreign debt, including private sector liabilities, was 36 per cent of GDP at the end of 2004, down from 62 per cent as recently as 2000.
Several of the poorer countries in south-east Europe and the CIS do not have access to foreign private capital markets and have generally avoided external borrowing (like Belarus) or have continued to rely on net official assistance. The south-east European countries (except for the accession countries), the Caucasus and the central Asian CIS (except Kazakhstan) are eligible for Official Development Assistance. Much of the debt of countries such as Armenia or Serbia is owed to international financial organizations or foreign governments.119 In early 2005, Kyrgyzstan negotiated with the Paris Club for a restructuring and a partial write-off of its debt, and the IMF approved Georgia’s 2005 economic programme which should allow it to get another $21 million for its programme of poverty reduction (PRGF). Azerbaijan has considered not borrowing its last tranche of credit from the IMF for its PRGF given that it has sufficient currency reserves. Bosnia and Herzegovina has so far not come to terms with the IMF on conditions for its standby loan of $50 million.
(ii) The trade of eastern Europe and the CIS
Merchandise trade growth continues unabated in the new EU member countries…
The 2004 upturn in the global economy and their accession to the EU seem to have provided a substantial impetus to the trade of the new EU members. For the year as a whole, the volume of their merchandise exports and imports increased by 16 to 17 per cent. Even allowing for certain one-off accession effects and data uncertainties,120 this was considerably faster than the 9 per cent growth in the volume of world trade in 2004 and the 6 per cent growth of total EU trade.121 The dollar value of exports increased by 34 per cent and imports by 30 per cent (table 5.2).
Preliminary estimates suggest that in the first quarter of 2005 the export volume of the new EU members
119 There is a discussion of the debt situation in the low-income
CIS countries in UNECE, Economic Survey of Europe, 2005 No. 1, pp. 88-89.
120 For more details see section 6.2 in UNECE, Economic Survey of Europe, 2005 No. 1.
121 WTO, World Trade 2004, Prospects for 2005, Press/401, 14 April 2005 [www.wto.org/english/news_e/pres05_e/pr401_e.htm] and UNECE secretariat estimates.
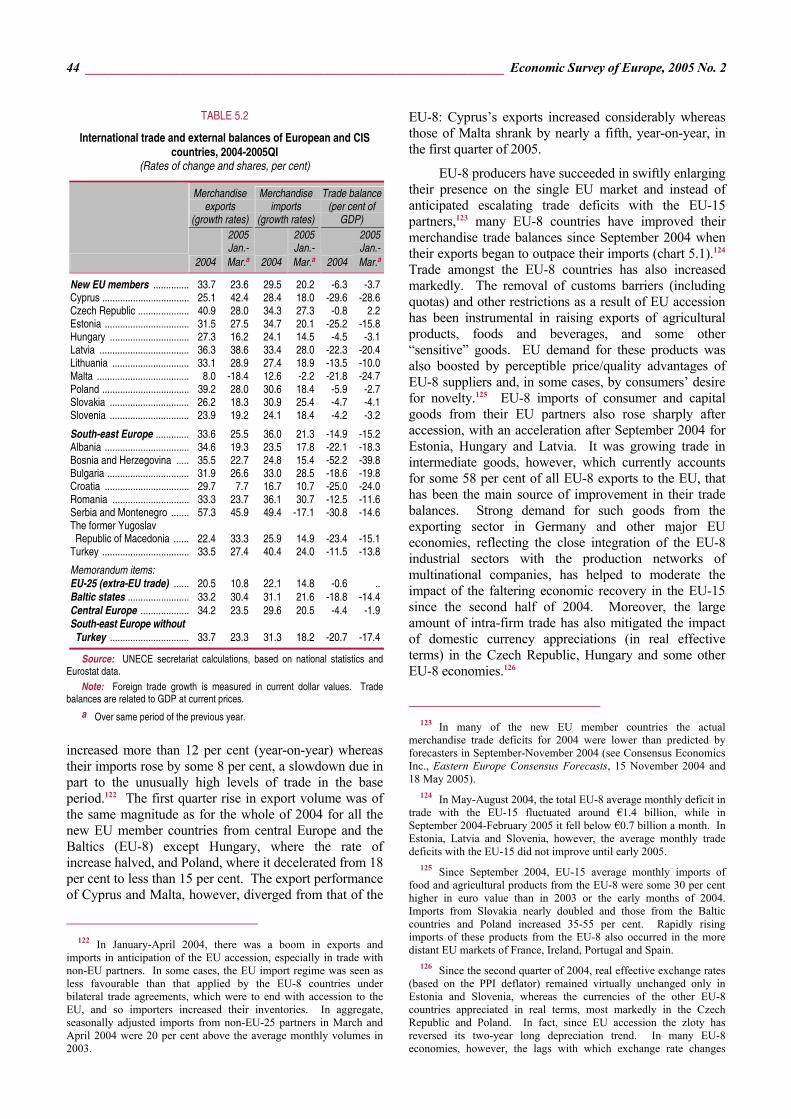
44 ________________________________________________________________ Economic Survey of Europe, 2005 No. 2
increased more than 12 per cent (year-on-year) whereas their imports rose by some 8 per cent, a slowdown due in part to the unusually high levels of trade in the base period.122 The first quarter rise in export volume was of the same magnitude as for the whole of 2004 for all the new EU member countries from central Europe and the Baltics (EU-8) except Hungary, where the rate of increase halved, and Poland, where it decelerated from 18 per cent to less than 15 per cent. The export performance of Cyprus and Malta, however, diverged from that of the
122 In January-April 2004, there was a boom in exports and
imports in anticipation of the EU accession, especially in trade with non-EU partners. In some cases, the EU import regime was seen as less favourable than that applied by the EU-8 countries under bilateral trade agreements, which were to end with accession to the EU, and so importers increased their inventories. In aggregate, seasonally adjusted imports from non-EU-25 partners in March and April 2004 were 20 per cent above the average monthly volumes in 2003.
EU-8: Cyprus’s exports increased considerably whereas those of Malta shrank by nearly a fifth, year-on-year, in the first quarter of 2005.
EU-8 producers have succeeded in swiftly enlarging their presence on the single EU market and instead of anticipated escalating trade deficits with the EU-15 partners,123 many EU-8 countries have improved their merchandise trade balances since September 2004 when their exports began to outpace their imports (chart 5.1).124 Trade amongst the EU-8 countries has also increased markedly. The removal of customs barriers (including quotas) and other restrictions as a result of EU accession has been instrumental in raising exports of agricultural products, foods and beverages, and some other “sensitive” goods. EU demand for these products was also boosted by perceptible price/quality advantages of EU-8 suppliers and, in some cases, by consumers’ desire for novelty.125 EU-8 imports of consumer and capital goods from their EU partners also rose sharply after accession, with an acceleration after September 2004 for Estonia, Hungary and Latvia. It was growing trade in intermediate goods, however, which currently accounts for some 58 per cent of all EU-8 exports to the EU, that has been the main source of improvement in their trade balances. Strong demand for such goods from the exporting sector in Germany and other major EU economies, reflecting the close integration of the EU-8 industrial sectors with the production networks of multinational companies, has helped to moderate the impact of the faltering economic recovery in the EU-15 since the second half of 2004. Moreover, the large amount of intra-firm trade has also mitigated the impact of domestic currency appreciations (in real effective terms) in the Czech Republic, Hungary and some other EU-8 economies.126
123 In many of the new EU member countries the actual
merchandise trade deficits for 2004 were lower than predicted by forecasters in September-November 2004 (see Consensus Economics Inc., Eastern Europe Consensus Forecasts, 15 November 2004 and 18 May 2005).
124 In May-August 2004, the total EU-8 average monthly deficit in trade with the EU-15 fluctuated around €1.4 billion, while in September 2004-February 2005 it fell below €0.7 billion a month. In Estonia, Latvia and Slovenia, however, the average monthly trade deficits with the EU-15 did not improve until early 2005.
125 Since September 2004, EU-15 average monthly imports of food and agricultural products from the EU-8 were some 30 per cent higher in euro value than in 2003 or the early months of 2004. Imports from Slovakia nearly doubled and those from the Baltic countries and Poland increased 35-55 per cent. Rapidly rising imports of these products from the EU-8 also occurred in the more distant EU markets of France, Ireland, Portugal and Spain.
126 Since the second quarter of 2004, real effective exchange rates (based on the PPI deflator) remained virtually unchanged only in Estonia and Slovenia, whereas the currencies of the other EU-8 countries appreciated in real terms, most markedly in the Czech Republic and Poland. In fact, since EU accession the zloty has reversed its two-year long depreciation trend. In many EU-8 economies, however, the lags with which exchange rate changes
TABLE 5.2
International trade and external balances of European and CIS countries, 2004-2005QI
(Rates of change and shares, per cent)
Merchandise exports
(growth rates)
Merchandise imports
(growth rates)
Trade balance (per cent of
GDP)
2004
2005 Jan.-Mar.a 2004
2005 Jan.-Mar.a 2004
2005 Jan.-Mar.a
New EU members .............. 33.7 23.6 29.5 20.2 -6.3 -3.7Cyprus .................................. 25.1 42.4 28.4 18.0 -29.6 -28.6Czech Republic .................... 40.9 28.0 34.3 27.3 -0.8 2.2Estonia ................................. 31.5 27.5 34.7 20.1 -25.2 -15.8Hungary ............................... 27.3 16.2 24.1 14.5 -4.5 -3.1Latvia ................................... 36.3 38.6 33.4 28.0 -22.3 -20.4Lithuania .............................. 33.1 28.9 27.4 18.9 -13.5 -10.0Malta .................................... 8.0 -18.4 12.6 -2.2 -21.8 -24.7Poland .................................. 39.2 28.0 30.6 18.4 -5.9 -2.7Slovakia ............................... 26.2 18.3 30.9 25.4 -4.7 -4.1Slovenia ............................... 23.9 19.2 24.1 18.4 -4.2 -3.2
South-east Europe ............. 33.6 25.5 36.0 21.3 -14.9 -15.2Albania ................................. 34.6 19.3 23.5 17.8 -22.1 -18.3Bosnia and Herzegovina ..... 35.5 22.7 24.8 15.4 -52.2 -39.8Bulgaria ................................ 31.9 26.6 33.0 28.5 -18.6 -19.8Croatia ................................. 29.7 7.7 16.7 10.7 -25.0 -24.0Romania .............................. 33.3 23.7 36.1 30.7 -12.5 -11.6Serbia and Montenegro ....... 57.3 45.9 49.4 -17.1 -30.8 -14.6The former Yugoslav Republic of Macedonia ...... 22.4 33.3 25.9 14.9 -23.4 -15.1Turkey .................................. 33.5 27.4 40.4 24.0 -11.5 -13.8
Memorandum items: EU-25 (extra-EU trade) ...... 20.5 10.8 22.1 14.8 -0.6 ..Baltic states ........................ 33.2 30.4 31.1 21.6 -18.8 -14.4Central Europe ................... 34.2 23.5 29.6 20.5 -4.4 -1.9South-east Europe without Turkey ............................... 33.7 23.3 31.3 18.2 -20.7 -17.4
Source: UNECE secretariat calculations, based on national statistics and Eurostat data.
Note: Foreign trade growth is measured in current dollar values. Trade balances are related to GDP at current prices.
a Over same period of the previous year.

The Economic Situation in the ECE Region in Mid-2005 ________________________________________________ 45
The extension to the new EU members of the established EU commercial framework with third countries and the EU export support facilities, including subsidies for the agricultural sector, contributed to the increase of exports to non-EU countries. The fact that demand outside the EU was also much stronger also contributed to this development. Indeed, in January-March 2005, Czech, Estonian, Latvian and Polish exports to Russia doubled in dollar value (year-on-year), and those from the other four east European EU countries increased by 40 to 80 per cent.127 On average, the seasonally adjusted monthly EU-8 exports to non-EU
affect the overall trade balance appear to be rather long; according to some estimates they vary between 15 and 28 months in the Czech Republic, Hungary and Slovakia (Revue Elargissement, No. 77, 6 June 2005), and the impact itself is rather small since most of these economies – in general, small and highly specialized – are more vulnerable to corporate strategies and global sectoral dynamics (the IT sector for Estonia and Hungary, the automobile sector for the Czech Republic and Slovakia, etc.). However, this does not imply that in the short run the impact of real effective currency appreciation might not be detrimental for competitiveness in certain exporting sectors.
127 The extension of the Russia-EU “Partnership and Cooperation Agreement” to the 10 new EU member countries came into effect in November 2004, providing for less restricted access to Russia’s market for several of them. For example, import tariffs for Estonian goods halved on average.
partners were a third higher in dollar value during May 2004-March 2005 than in the equivalent period of 2003-2004. Only in Slovakia, and more recently Lithuania, have exports to non-EU partners declined. In Slovakia this was almost entirely due to a fall in automobile industry exports,128 while in Lithuania it largely reflected changes in the Mazeikiai oil refinery’s sales strategy.129
EU-8 imports from outside the EU declined by 10 to 30 per cent (year-on-year monthly volumes) in late 2004 and in the first months of 2005, except in Latvia (where there was a large rise in imports of intermediate goods). This was due largely to the accumulation of inventories prior to enlargement and, to some extent, to the impact of new trade rules including standards.130 Imports of intermediate goods from non-EU sources also increased somewhat in Estonia, Lithuania, Poland and Slovenia, but this was not enough to offset the 20-30 per cent declines in imports of capital and consumer goods. The depreciation of the dollar against the euro, as well as against the currencies of the new EU members, moderated the impact of rising dollar prices for fuel imports and further dampened the prices of intermediate goods from China and other Asian countries with currencies linked to the dollar. The EU-8’s terms of trade with non-EU countries either remained virtually unchanged or slightly deteriorated.
The merchandise exports of the EU-8 countries are expected to continue to grow rapidly in 2005, partly owing to the increasing opportunities for a broader spectrum of businesses to trade within the internal EU market, and also due to the FDI-led increase in productive capacities. These developments may mitigate the dampening effect of weaker growth in the major EU economies. However, the setback that EU-8 textile exporters experienced in the wake of the influx of cheap Chinese products, following the ending of the international textile quota system on 31 December 2004, could be further aggravated if the real effective exchange rate appreciation of the EU-8 currencies is not checked (see further below).
128 There were certain supply-side constraints due to the
restructuring of the production facilities in the Slovak automobile sector in the first quarter of 2005. However, the decline in these exports was already considerable in the second part of 2004, particularly in trade with Canada, Russia and Turkey.
129 This was a reversal of the Mazeikiai Refinery’s strategy in 2003 and early 2004, when between 55 and 65 per cent of Lithuania’s exports of oil products were allocated to Switzerland, placing this country among its top three trade partners. After May 2004, these exports were redirected mainly to the EU (France, Spain, Netherlands) and the United States; as a result, Switzerland was not even among Lithuania’s top 20 trading partners in January-March 2005.
130 The decline of major imports such as nuclear reactors, fuel elements and boilers (down by a fifth in euro values), automatic data processing machines (down by 45 per cent on average) and parts and accessories (down by a third) are prominent examples. In 2003, these three commodity groups accounted together for about 11 per cent of total non-EU imports into the EU-8 countries.
CHART 5.1
Merchandise trade in eight new EU member countries, January 2001-March 2005
(Trade balance in billion euros, percentage change of export and import values over the same month of the previous year)
-35
-28
-21
-14
-7
0
7
14
21
28
35
-50
-40
-30
-20
-10
0
10
20
30
40
50
2001 2002 2003 2004 2005
Trade balance EU Trade balance outside EUExports EU Exports outside EUImports EU Imports outside EU
Source: UNECE secretariat calculations, based on Eurostat data onseasonally and working days adjusted trade values.
Note: Merchandise trade balances at the end of the month, cumulated over12 months.
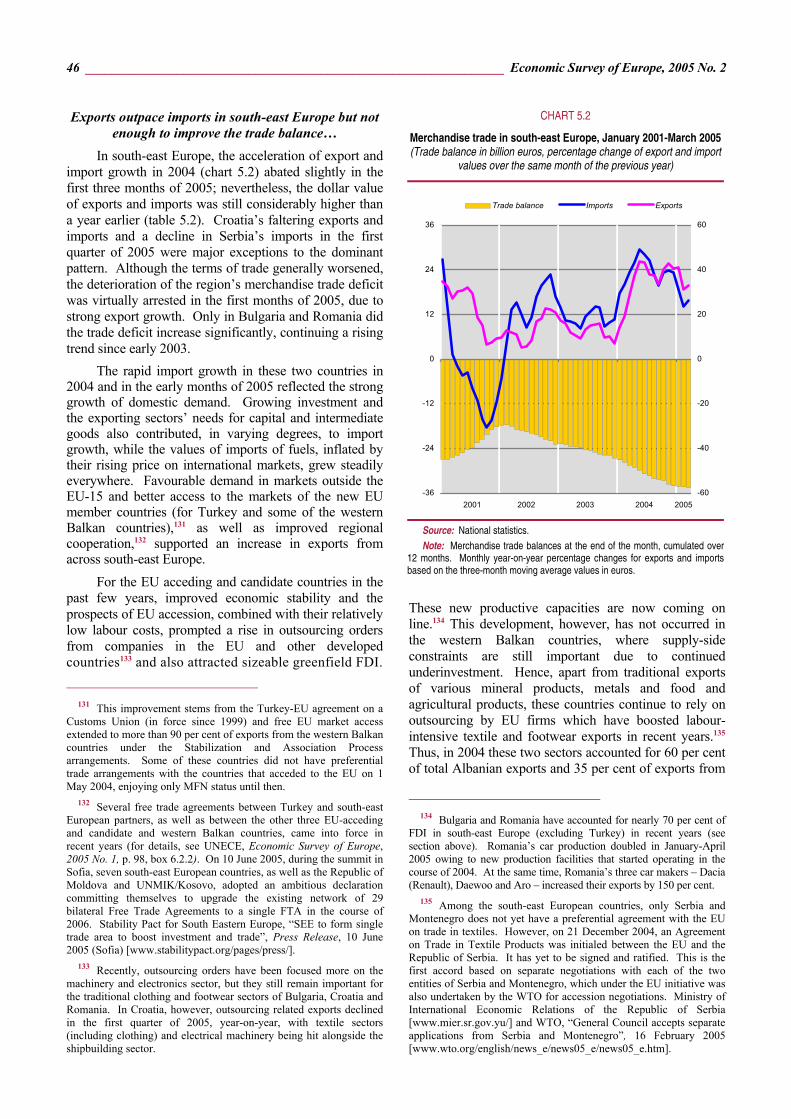
46 ________________________________________________________________ Economic Survey of Europe, 2005 No. 2
Exports outpace imports in south-east Europe but not enough to improve the trade balance…
In south-east Europe, the acceleration of export and import growth in 2004 (chart 5.2) abated slightly in the first three months of 2005; nevertheless, the dollar value of exports and imports was still considerably higher than a year earlier (table 5.2). Croatia’s faltering exports and imports and a decline in Serbia’s imports in the first quarter of 2005 were major exceptions to the dominant pattern. Although the terms of trade generally worsened, the deterioration of the region’s merchandise trade deficit was virtually arrested in the first months of 2005, due to strong export growth. Only in Bulgaria and Romania did the trade deficit increase significantly, continuing a rising trend since early 2003.
The rapid import growth in these two countries in 2004 and in the early months of 2005 reflected the strong growth of domestic demand. Growing investment and the exporting sectors’ needs for capital and intermediate goods also contributed, in varying degrees, to import growth, while the values of imports of fuels, inflated by their rising price on international markets, grew steadily everywhere. Favourable demand in markets outside the EU-15 and better access to the markets of the new EU member countries (for Turkey and some of the western Balkan countries),131 as well as improved regional cooperation,132 supported an increase in exports from across south-east Europe.
For the EU acceding and candidate countries in the past few years, improved economic stability and the prospects of EU accession, combined with their relatively low labour costs, prompted a rise in outsourcing orders from companies in the EU and other developed countries133 and also attracted sizeable greenfield FDI.
131 This improvement stems from the Turkey-EU agreement on a
Customs Union (in force since 1999) and free EU market access extended to more than 90 per cent of exports from the western Balkan countries under the Stabilization and Association Process arrangements. Some of these countries did not have preferential trade arrangements with the countries that acceded to the EU on 1 May 2004, enjoying only MFN status until then.
132 Several free trade agreements between Turkey and south-east European partners, as well as between the other three EU-acceding and candidate and western Balkan countries, came into force in recent years (for details, see UNECE, Economic Survey of Europe, 2005 No. 1, p. 98, box 6.2.2). On 10 June 2005, during the summit in Sofia, seven south-east European countries, as well as the Republic of Moldova and UNMIK/Kosovo, adopted an ambitious declaration committing themselves to upgrade the existing network of 29 bilateral Free Trade Agreements to a single FTA in the course of 2006. Stability Pact for South Eastern Europe, “SEE to form single trade area to boost investment and trade”, Press Release, 10 June 2005 (Sofia) [www.stabilitypact.org/pages/press/].
133 Recently, outsourcing orders have been focused more on the machinery and electronics sector, but they still remain important for the traditional clothing and footwear sectors of Bulgaria, Croatia and Romania. In Croatia, however, outsourcing related exports declined in the first quarter of 2005, year-on-year, with textile sectors (including clothing) and electrical machinery being hit alongside the shipbuilding sector.
These new productive capacities are now coming on line.134 This development, however, has not occurred in the western Balkan countries, where supply-side constraints are still important due to continued underinvestment. Hence, apart from traditional exports of various mineral products, metals and food and agricultural products, these countries continue to rely on outsourcing by EU firms which have boosted labour-intensive textile and footwear exports in recent years.135 Thus, in 2004 these two sectors accounted for 60 per cent of total Albanian exports and 35 per cent of exports from
134 Bulgaria and Romania have accounted for nearly 70 per cent of
FDI in south-east Europe (excluding Turkey) in recent years (see section above). Romania’s car production doubled in January-April 2005 owing to new production facilities that started operating in the course of 2004. At the same time, Romania’s three car makers – Dacia (Renault), Daewoo and Aro – increased their exports by 150 per cent.
135 Among the south-east European countries, only Serbia and Montenegro does not yet have a preferential agreement with the EU on trade in textiles. However, on 21 December 2004, an Agreement on Trade in Textile Products was initialed between the EU and the Republic of Serbia. It has yet to be signed and ratified. This is the first accord based on separate negotiations with each of the two entities of Serbia and Montenegro, which under the EU initiative was also undertaken by the WTO for accession negotiations. Ministry of International Economic Relations of the Republic of Serbia [www.mier.sr.gov.yu/] and WTO, “General Council accepts separate applications from Serbia and Montenegro”, 16 February 2005 [www.wto.org/english/news_e/news05_e/news05_e.htm].
CHART 5.2
Merchandise trade in south-east Europe, January 2001-March 2005(Trade balance in billion euros, percentage change of export and import
values over the same month of the previous year)
-36
-24
-12
0
12
24
36
2001 2002 2003 2004 2005-60
-40
-20
0
20
40
60
Trade balance Imports Exports
Source: National statistics. Note: Merchandise trade balances at the end of the month, cumulated over
12 months. Monthly year-on-year percentage changes for exports and imports based on the three-month moving average values in euros.
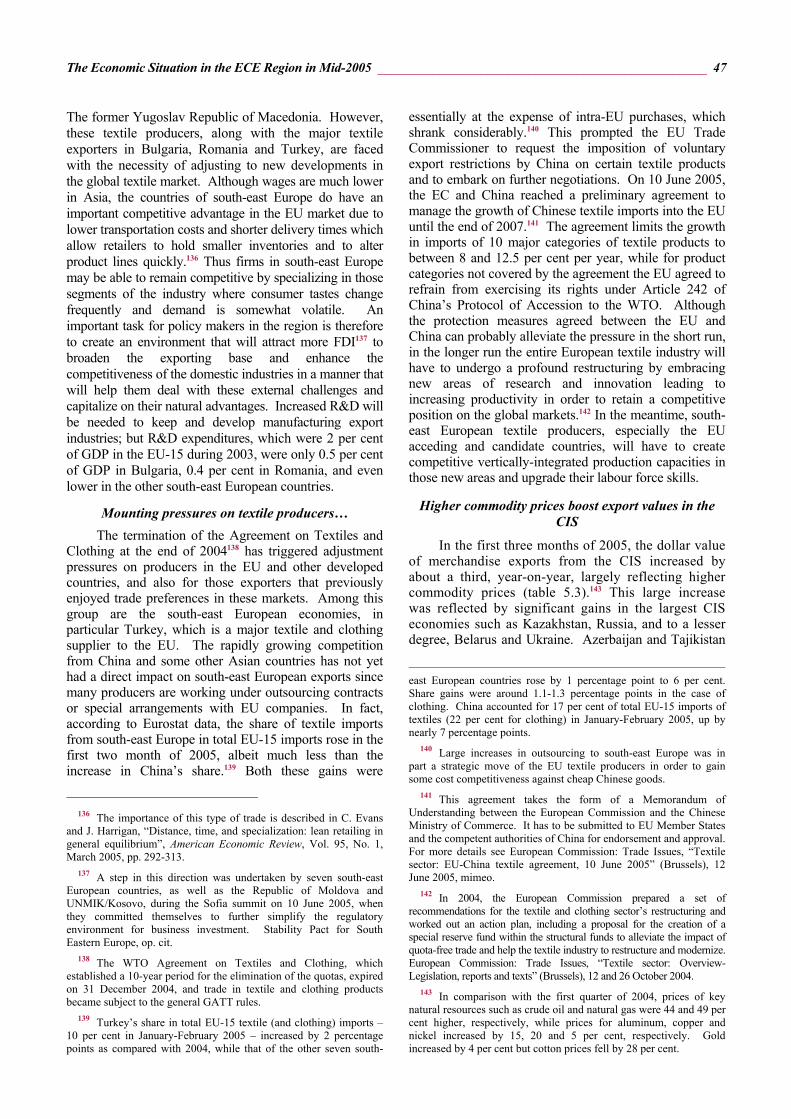
The Economic Situation in the ECE Region in Mid-2005 ________________________________________________ 47
The former Yugoslav Republic of Macedonia. However, these textile producers, along with the major textile exporters in Bulgaria, Romania and Turkey, are faced with the necessity of adjusting to new developments in the global textile market. Although wages are much lower in Asia, the countries of south-east Europe do have an important competitive advantage in the EU market due to lower transportation costs and shorter delivery times which allow retailers to hold smaller inventories and to alter product lines quickly.136 Thus firms in south-east Europe may be able to remain competitive by specializing in those segments of the industry where consumer tastes change frequently and demand is somewhat volatile. An important task for policy makers in the region is therefore to create an environment that will attract more FDI137 to broaden the exporting base and enhance the competitiveness of the domestic industries in a manner that will help them deal with these external challenges and capitalize on their natural advantages. Increased R&D will be needed to keep and develop manufacturing export industries; but R&D expenditures, which were 2 per cent of GDP in the EU-15 during 2003, were only 0.5 per cent of GDP in Bulgaria, 0.4 per cent in Romania, and even lower in the other south-east European countries.
Mounting pressures on textile producers… The termination of the Agreement on Textiles and
Clothing at the end of 2004138 has triggered adjustment pressures on producers in the EU and other developed countries, and also for those exporters that previously enjoyed trade preferences in these markets. Among this group are the south-east European economies, in particular Turkey, which is a major textile and clothing supplier to the EU. The rapidly growing competition from China and some other Asian countries has not yet had a direct impact on south-east European exports since many producers are working under outsourcing contracts or special arrangements with EU companies. In fact, according to Eurostat data, the share of textile imports from south-east Europe in total EU-15 imports rose in the first two month of 2005, albeit much less than the increase in China’s share.139 Both these gains were
136 The importance of this type of trade is described in C. Evans
and J. Harrigan, “Distance, time, and specialization: lean retailing in general equilibrium”, American Economic Review, Vol. 95, No. 1, March 2005, pp. 292-313.
137 A step in this direction was undertaken by seven south-east European countries, as well as the Republic of Moldova and UNMIK/Kosovo, during the Sofia summit on 10 June 2005, when they committed themselves to further simplify the regulatory environment for business investment. Stability Pact for South Eastern Europe, op. cit.
138 The WTO Agreement on Textiles and Clothing, which established a 10-year period for the elimination of the quotas, expired on 31 December 2004, and trade in textile and clothing products became subject to the general GATT rules.
139 Turkey’s share in total EU-15 textile (and clothing) imports – 10 per cent in January-February 2005 – increased by 2 percentage points as compared with 2004, while that of the other seven south-
essentially at the expense of intra-EU purchases, which shrank considerably.140 This prompted the EU Trade Commissioner to request the imposition of voluntary export restrictions by China on certain textile products and to embark on further negotiations. On 10 June 2005, the EC and China reached a preliminary agreement to manage the growth of Chinese textile imports into the EU until the end of 2007.141 The agreement limits the growth in imports of 10 major categories of textile products to between 8 and 12.5 per cent per year, while for product categories not covered by the agreement the EU agreed to refrain from exercising its rights under Article 242 of China’s Protocol of Accession to the WTO. Although the protection measures agreed between the EU and China can probably alleviate the pressure in the short run, in the longer run the entire European textile industry will have to undergo a profound restructuring by embracing new areas of research and innovation leading to increasing productivity in order to retain a competitive position on the global markets.142 In the meantime, south-east European textile producers, especially the EU acceding and candidate countries, will have to create competitive vertically-integrated production capacities in those new areas and upgrade their labour force skills.
Higher commodity prices boost export values in the CIS
In the first three months of 2005, the dollar value of merchandise exports from the CIS increased by about a third, year-on-year, largely reflecting higher commodity prices (table 5.3).143 This large increase was reflected by significant gains in the largest CIS economies such as Kazakhstan, Russia, and to a lesser degree, Belarus and Ukraine. Azerbaijan and Tajikistan
east European countries rose by 1 percentage point to 6 per cent. Share gains were around 1.1-1.3 percentage points in the case of clothing. China accounted for 17 per cent of total EU-15 imports of textiles (22 per cent for clothing) in January-February 2005, up by nearly 7 percentage points.
140 Large increases in outsourcing to south-east Europe was in part a strategic move of the EU textile producers in order to gain some cost competitiveness against cheap Chinese goods.
141 This agreement takes the form of a Memorandum of Understanding between the European Commission and the Chinese Ministry of Commerce. It has to be submitted to EU Member States and the competent authorities of China for endorsement and approval. For more details see European Commission: Trade Issues, “Textile sector: EU-China textile agreement, 10 June 2005” (Brussels), 12 June 2005, mimeo.
142 In 2004, the European Commission prepared a set of recommendations for the textile and clothing sector’s restructuring and worked out an action plan, including a proposal for the creation of a special reserve fund within the structural funds to alleviate the impact of quota-free trade and help the textile industry to restructure and modernize. European Commission: Trade Issues, “Textile sector: Overview-Legislation, reports and texts” (Brussels), 12 and 26 October 2004.
143 In comparison with the first quarter of 2004, prices of key natural resources such as crude oil and natural gas were 44 and 49 per cent higher, respectively, while prices for aluminum, copper and nickel increased by 15, 20 and 5 per cent, respectively. Gold increased by 4 per cent but cotton prices fell by 28 per cent.
48 ________________________________________________________________ Economic Survey of Europe, 2005 No. 2
were the only countries where there were relatively large falls in the value of exports. The continuing economic recovery in the CIS – driven by strong demand for consumer and investment goods, as well as by significant exchange rate appreciations in real terms against the dollar and euro throughout the region (except in Tajikistan) – gave a strong boost to imports from non-CIS countries.144
144 Domestic CIS currencies appreciated in real terms against the
dollar by some 5-17 per cent and by up to 13 per cent against the
Increased intra-CIS regional trade – up by about 10 per cent in value – also contributed to the higher dollar value of total imports (table 5.3).
In the three largest European CIS economies, Belarus, Russia and Ukraine, favourable commodity price movements were accompanied, in many cases, by increased export volumes. For example, in January-February, Russian oil producers boosted their export revenues by increasing the volume of crude oil and natural gas by 2 per cent (year-on-year). In the same period, the exports of oil products rose 12 per cent in volume, year-on-year, with a significant redirection of exports away from the CIS towards non-CIS countries. The value of Russia’s machinery and equipment exports fell by a fifth despite rapid economic growth in the region. In Ukraine, continued strong growth in the dollar value of exports reflected strong foreign demand for steel products and chemicals. The steel and chemicals sectors account for close to half of Ukrainian export earnings. In the first four months of 2005, export revenues from steel and steel products increased by over one third in value.145 While the EU has yet to assign market economy status to Ukraine, a decision that would provide greater security against import restrictions, more than two thirds of ferrous metal exports go to countries outside the EU thus providing some diversification against the risk of protectionist import barriers and anti-dumping procedures.146 In addition to greater exports of steel and chemicals, the value of exports of machinery and equipment from Ukraine has continued to rise in response to strong Russian import demand. In Kazakhstan, despite considerably higher domestic output of crude oil (up by 15 per cent) and oil products (up by 9 per cent), export volumes fell 17-20 per cent in January 2005. The volumes of metal exports were mixed: copper rose by 10 per cent while aluminium and zinc fell by 18 and 30 per cent, respectively. However, the dollar value of exports of minerals and metals increased by 57 and 14 per cent, respectively. In the first quarter of 2005, these two commodity groups accounted for 89 per cent of the total exports of Kazakhstan (up by three percentage points relative to the first quarter of 2004).
In Belarus, the value of exports in the first quarter of 2005 increased by over a fifth (year-on-year). The expansion was driven by a 50 per cent rise in the value of exports to non-CIS markets while those to the CIS fell. As in the past, oil products played the leading role. Higher prices for refined products, coupled with
euro. This may have increased their demand for goods traded in these currencies. The value of aggregate CIS trade expressed in euros was slightly lower: exports increased by a quarter and imports by 18 per cent.
145 However, Ukraine’s steel exports for the first half of 2005 are expected to be significantly affected by expanding production capacity in China and increased competition in the Asian market.
146 In order to protect its steel makers, Ukraine introduced export duties on scrap metal early in 2005.
TABLE 5.3
CIS countries’ trade with CIS and non-CIS countries, 2003-2005 (Value in million dollars, growth rates in per cent)
Export growth Import growth Trade balances
2004 2005 a 2004 2005 a 2003 2004 2005 a
Armenia ....................... 4.2 28.4 5.6 28.0 - 593 - 636 - 177CIS ........................... - 3.9 17.5 10.0 33.0 - 152 - 185 - 50Non-CIS ................... 6.1 30.8 4.4 26.6 - 441 - 451 - 126
Azerbaijan ................... 39.4 - 30.5 33.4 67.0 - 34 110 - 650CIS ........................... 83.8 11.3 41.0 15.6 - 517 - 586 - 205Non-CIS ................... 32.9 - 36.4 29.8 99.0 483 696 - 444
Belarus ........................ 38.3 21.9 41.4 0.5 -1 612 -2 593 467CIS ........................... 34.2 - 3.1 46.7 - 6.1 -2 614 -4 510 - 595Non-CIS ................... 43.1 49.3 29.4 17.9 1 002 1 917 1 062
Georgia ....................... 39.6 70.6 61.9 38.0 - 676 -1 198 - 289CIS ........................... 43.7 55.6 77.8 46.6 - 141 - 329 - 123Non-CIS ................... 35.6 79.8 54.2 32.9 - 535 - 869 - 166
Kazakhstan ................. 55.5 41.3 52.0 37.9 4 518 7 315 2 302CIS ........................... 37.4 13.8 55.6 28.4 - 951 -2 021 - 533Non-CIS ................... 60.9 49.3 48.8 47.1 5 469 9 336 2 835
Kyrgyzstan .................. 23.5 4.2 31.2 22.6 - 135 - 222 - 77CIS ........................... 36.6 19.2 41.6 21.5 - 209 - 306 - 79Non-CIS ................... 16.6 - 4.0 17.3 24.2 74 84 3
Republic of Moldova ..... 24.8 6.9 26.4 28.9 - 613 - 788 - 186CIS ........................... 18.4 3.1 29.3 24.1 - 170 - 266 - 67Non-CIS ................... 32.2 10.7 24.4 32.7 - 443 - 522 - 120
Tajikistan ..................... 14.8 - 9.8 56.1 7.4 - 84 - 460 - 66CIS ........................... 15.2 - 19.9 59.9 - 14.7 - 461 - 799 - 128Non-CIS ................... 14.7 - 8.0 47.9 61.4 377 339 62
Turkmenistan .............. 6.6 14.3 32.2 25.2 1 120 550 496CIS ........................... 2.6 30.5 - 9.0 24.8 434 587 340Non-CIS ................... 9.9 1.3 71.5 25.5 686 - 37 156
Ukraine ........................ 41.6 16.8 26.0 18.5 47 3 676 859CIS ........................... 41.6 33.8 29.2 5.2 -5 463 -6 315 -1 552Non-CIS ................... 41.7 11.8 22.7 35.7 5 510 9 991 2 412
Uzbekistan .................. .. .. .. .. .. .. .. CIS ........................... .. .. .. .. .. .. .. Non-CIS ................... .. .. .. .. .. .. ..
Total above ................ 40.6 21.2 34.9 21.3 1 938 5 754 2 681CIS ........................... 34.6 16.8 38.0 7.5 -10 244 -14 730 -2 993Non-CIS ................... 43.3 23.1 31.6 38.8 12 182 20 484 5 673
Russian Federation ....... 35.8 34.5 31.8 26.9 76 310 105 942 30 784CIS ........................... 43.3 11.6 35.0 16.1 7 359 11 642 2 472Non-CIS ................... 34.5 38.8 30.9 30.2 68 951 94 300 28 313
CIS total ...................... 37.2 30.4 33.3 24.1 78 248 111 696 33 465CIS ........................... 39.3 14.0 37.0 10.0 -2 885 -3 088 - 521Non-CIS ................... 36.7 34.5 31.1 33.3 81 133 114 784 33 986
Source: CIS Statistical Committee (Moscow). a January-March, year-on-year.
The Economic Situation in the ECE Region in Mid-2005 ________________________________________________ 49
increasing volume (up by a quarter year-on-year in the first two months of 2005), were behind the rise in the value of Belarus’ exports.147 Belarus’ exports to CIS markets were affected by an agreement to begin charging the value added tax on the basis of the country of destination principle as of 2005. Partly as a result of this change, Belarussian exports to Russia – which account for about half of their total value – fell by 12 per cent. The fall is likely to be temporary and Belarus will continue to benefit from being closely tied to the largest economy in the region. In the Republic of Moldova, the value of exports in the first quarter of 2005 rose by 7 per cent, year-on-year. The country’s exports continue to rely on CIS markets – Russia in particular – and are concentrated in food and agricultural products. In February 2005, Russia threatened to impose wide-ranging economic sanctions against the Republic of Moldova; in April, it closed its borders to Moldovan meat products citing potential health hazards; and in May announced a ban on imports of fruit and vegetables. The Moldovan authorities fear that these restrictions will be extended to include wine and alcohol exports, of which virtually all are sold to Russia.148
In the Caucasian region of the CIS, Armenian exports of processed precious stones and metals to Belgium and Israel typically account for most of its export growth. In the first three months of 2005, however, exports of metals appear to have considerably increased their share of the total value of exports. Favourable commodity prices together with recent investments in modernizing existing plants have boosted the share of metal exports in Armenia from 9 per cent in 2002 to 19 per cent in 2004. The value of Georgia’s exports rose by 70 per cent as a result of higher prices for the country’s traditional shipments of metals such as copper and steel to Turkey and wine and beverages to Russia. This large increase also reflects a better registration of international transactions and reduced smuggling. The value of Azerbaijan’s exports – about 80 per cent of which are crude oil and oil products – was down by a third in the first quarter of 2005, year-on-year. While a good harvest helped to boost exports of processed foods and high commodity prices increased the value of metal sales, a one-off sale of a floating rig (valued at over $100 million) in 2004 distorts the year-on-year comparison. Crude oil production was up by 16 per cent, but scheduled maintenance on one of the two refineries reduced the output of oil products. The newly constructed Baku-Tbilisi-Ceyhan pipeline began filling up in early May and is diverting oil from being exported.
147 In contrast, the volume of exports of the other key non-CIS
exportable product – fertilizer – declined slightly in the first quarter of 2005.
148 Sales of food and wine as well as of fruit and vegetable products account for over half of the Republic of Moldova’s exports. Textiles – the second largest export group, largely destined to the EU – are also significant.
As this process is expected to take up to six months, it will undoubtedly affect Azerbaijan’s export revenues in the short term.
In central Asia, the geographical distribution of exports from Kyrgyzstan continued to shift towards CIS markets due to lower gold sales to non-CIS markets and increased exports of electricity and agricultural products which have traditionally been shipped to the CIS. The value of exports to non-CIS markets fell by 4 per cent while those to the CIS rose by 19 per cent in the first quarter. In Tajikistan, higher prices for aluminium almost offset a decline in volume while the value of textile exports (including cotton fibre) fell by a third, these two products accounting for close to 90 per cent of the country’s total exports. Exports of electricity, the third most important export, halved in the first quarter of 2005. In Turkmenistan, the total value of exports increased by 14 per cent most likely due to an increase in the value of natural gas exports, primarily destined to Russia and Ukraine.149 The value of exports to non-CIS countries was flat. Four fifths of exports from Turkmenistan go to just four countries: Iran, Italy, Turkey and Ukraine.
Rapid economic growth in the region raises imports The dollar value of total CIS merchandise imports
increased by a quarter in the first three months of 2005, year-on-year, on the strength of the continuing output growth in the region. For most CIS countries imports grew very strongly, from 19 per cent in Ukraine to 67 per cent in Azerbaijan. Russian imports – particularly from non-CIS markets – continued to expand rapidly driven by domestic investment and consumption. In the first three months of 2005, imports of machinery and equipment were up by almost a third and capital goods are expected to continue to be the most important category of Russian imports. Elsewhere, the continued modernization of the capital stock and investment in new productive capacity also led to increased imports. In Azerbaijan imports rose by two thirds due to continued expenditures related to the pipeline infrastructure and exploration and development of the country’s oil and natural gas fields. As noted above, in Georgia the increased value of recorded imports is partly a reflection of government efforts to reduce smuggling. In those countries where energy makes up a significant proportion of overall imports, the increased dollar value of imports was related to higher prices for crude oil and natural gas.
WTO accession nears Only four of the CIS countries are currently
members of the WTO: Kyrgyzstan which joined in 1998, Georgia in 2000, the Republic of Moldova in 2001 and Armenia in 2003. Turkmenistan has not yet submitted an application for membership, but the other seven CIS
149 The volume of natural gas exports were reportedly down by
over 5 per cent in the first quarter of 2005 due to a stoppage of sales to Russia and reduced deliveries to Ukraine.
50 ________________________________________________________________ Economic Survey of Europe, 2005 No. 2
countries are at different stages in the accession process. In February 2003, Tajikistan was the latest among them to submit the “Memorandum on the foreign trade regime”, which forms the basis of meetings of the Working Party. At the same time as the Working Parties’ work progresses at different speeds, the seven CIS countries, except Azerbaijan and Uzbekistan that have yet to submit an initial offer, are also engaged in bilateral negotiations with existing WTO members on market access for goods and services.
Kazakhstan, Russian and Ukraine are currently at a relatively more advanced stage in their negotiations. Those with Russia might be concluded by the time of the WTO Ministerial meeting in Hong Kong in December 2005, depending on progress in the bilaterals. Ukraine’s accession is also advancing well, after the release of a second version of the draft report in March 2005, while the Working Party on Kazakhstan has taken an important step forward with the release of the first draft report in June 2005.
At the bilateral level, in December 2004 the EU and Ukraine signed a bilateral agreement on trade in textiles and clothing which lifts the remaining restrictions on trade in these products, including import and export licensing requirements, and sets common tariff levels for these products. In addition, the EU has opened the possibility of a free trade agreement; after the latest enlargement the EU is now Ukraine’s largest trading partner.
6. The short-term outlook
A balancing act – global recovery continues…
In June 2005, the consensus of forecasters is for continued robust global economic expansion in 2005, albeit at a somewhat lower rate than in 2004. World output is expected to increase by 4 per cent, and world trade to regain momentum following the temporary weakness early in the year. The continued expansion will be supported by favourable financing conditions, with long-term interest rates expected to rise only slightly. The difference between growth in the United States and in the other major industrialized economies, however, will widen in 2005. Economic growth should remain strong, although moderating somewhat, in Asia (with the major exception of Japan), Latin America and also Africa. Modest growth prospects in western Europe continue to contrast with the persistent economic dynamism of eastern Europe and the CIS.
In the United States, real GDP is forecast to increase on average by 3.5 per cent in 2005, about a percentage point less than in 2004. With the United States continuing to act as a “locomotive” for the world economy (given weak domestic demand in the other major advanced economies), the large current account deficit is set to deteriorate further. The expansion remains very dependent on household consumption
spending, which will be supported by rising real incomes, a stronger demand for labour, and increased net wealth resulting from the surge in house prices. Business investment should continue to respond to favourable financing conditions and expectations of strong profit growth. Changes in real net exports, however, will remain a drag on the overall rate of economic growth. The Federal Reserve is expected to continue its gradual tightening of monetary policy towards a neutral stance. The expansion is currently expected to continue at a rate close to trend in 2006 as well.
In China, buoyant growth is forecast to continue, although the extremely high investment ratio points to the risk of a build-up of massive excess capacity that may not generate the expected positive rates of return. In Japan, growth is forecast to be moderately positive in 2005.
…but important global downside risks have not diminished
The pattern of downside risks to this overall favourable global outlook has, however, changed for the worse during the first half of 2005 in comparison with the assessment made at the beginning of the year.150 These risks centre around the developments in the oil markets; the further widening of global external imbalances; a sudden and sharp reversal of the rise in house prices in many countries, where they have reached levels regarded as out of line with “fundamentals”; and a stronger than anticipated rise in long-term interest rates from their current unusually low levels.
In the oil markets, prices reached some $60 per barrel in June 2005 (a nominal record) and a further increase to $65 per barrel in the short term is not excluded.151 Although oil prices measured in real terms152 are still somewhat below their previous peak in 1979-1980, and the adverse economic impact of the higher prices has so far been relatively small, the large cumulative increase over the past two years must inevitably bring them closer to a point at which the economic pain for households and end-users in industry will be increasingly felt. In any case, further rises in oil prices will increase the risk of dampening and even choking off economic growth in the oil importing countries.
A persistent challenge remains the orderly reversal of the unprecedented global imbalances, with rising current account deficits in the United States mirrored in rising surpluses in the rest of the world, notably Asia.153 There is still a risk that a change in financial market
150 UNECE, Economic Survey of Europe, 2005 No. 1, pp. 4-5. 151 “Prospect of oil at $65 a barrel is looming large”, Financial
Times, 25 June 2005. 152 Calculated by deflating the nominal oil price by the unit value
index of manufacturing exports of developed market economies. 153 UNECE, Economic Survey of Europe, 2005 No. 1, pp. 5-8
The Economic Situation in the ECE Region in Mid-2005 ________________________________________________ 51
sentiment could suddenly trigger a sharp and sustained decline of the dollar, with concomitant upward pressures on inflation and interest rates in the United States and adverse spillover effects on other asset markets and regions in the global economy. The strength of the dollar from the second quarter of 2005 means that exchange rates are moving in the opposite direction required for dealing with the global imbalances, which means that the risk of a sharp adjustment at a later stage could be increasing.
A correction of the United States current account deficit is also important for reducing the risks of mounting protectionist pressures in the face of significant job losses in a lacklustre United States manufacturing sector. This points to the important responsibility of surplus countries to strengthen their domestic demand and to the need for more flexible exchange rates in Asia.
Euro area: the lean years In the euro area, growth forecasts have again been
lowered. Real GDP is now expected to increase by only 1.3 per cent in 2005. (In January of this year the consensus was for a growth rate of 1.7 per cent, which was still below the estimated trend rate of some 2 per cent.). Since 2000, when real GDP rose by 3.5 per cent, the euro area has grown at an anaemic 1.3 per cent a year. The continued rise of oil prices in 2005 has curbed the purchasing power of private households, at a time when consumer confidence was already low due to uncertainties about employment and the impact of intensified international competition. Exports have been held back by the lagged effects of the strong euro and the slower growth of global demand. The recent weakening of the euro has only partially offset the large appreciation against the dollar since early 2002 and, if not reversed, will have a positive effect on economic activity. Business fixed investment is unlikely to increase very much given that manufacturing activity was close to stagnation in the spring. Unemployment will remain high and broadly unchanged from its level in 2004. The persistent sluggishness of aggregate domestic demand, which now has spread to all three major economies, remains the key problem of the euro area. On current forecasts, economic activity might gain slightly more momentum in 2006, but this will depend on the development of the global economy and on the price of oil.
Growth rates are set to continue to diverge significantly among the 12 economies in 2005, with the average for the euro area being pulled down by the weakness of the three major economies. Real GDP is forecast to stagnate in Italy and to increase only moderately in Germany (0.9 per cent) and France (1.6 per cent). Among the smaller economies, sluggish activity in the Netherlands and Portugal contrasts with continued solid growth in most of the other countries.
What can be done? There are no simple or mechanical solutions to the
persistent sluggishness of economic activity in the euro
area.154 The dynamism of many of the smaller economies of the euro area, as well as in the old and new EU member states outside the euro area, demonstrate that there is no such phenomenon as a pan-European “economic sickness”. There are, instead, a few weak national economies in the euro area, which include the larger ones, namely France, Germany and Italy, each of which has its own specific set of problems.
In the face of a bleak economic outlook, the question is what economic policy can do to stimulate economic activity. There has been progress in structural reforms in recent years and much more will undoubtedly have to be done – but it is in the very nature of these reforms that their growth effects will generally appear only with a relatively long lag, while the adjustment costs emerge more or less immediately. At the EU-wide level, key areas of reform are the deregulation of the services sector and the completion of the single market. It remains to be seen to what extent the reformed Lisbon Agenda can live up to the still high expectations of policy makers. There are also considerable adjustment costs involved in the process of globalization and the intensification of regional integration in Europe. It is right to emphasize the overall net economic benefits that will eventually emerge from these processes for the economies of Europe. But it is also important to acknowledge their short-term adverse effects, especially for certain sectors that face a sudden surge in competitive imports. This points to the need for a coherent scheme of transfer payments to help workers to better absorb these shocks in the short run and for training and education to improve occupational mobility in the longer run. But without stronger growth of domestic demand in the euro area this will be “pushing on string”. It is well known that structural reforms are more difficult to implement in a context of weak domestic economic activity. The experience of European economies shows that structural change occurs more rapidly in a growing than in a stagnating economy.
Finding the appropriate policy mix The immediate concern is to what extent
macroeconomic policy can stimulate economic activity. The room for manoeuvre of fiscal policy appears to have been largely exhausted (even under the more flexible rules of the SGP), given the large structural deficits and high levels of public debt. The persistent sluggishness of economic activity in the euro area, in combination with a widening output gap and persistently high rates of unemployment point to the need for a cut in the ECB’s main official interest rate, which has been at 2 per cent since June 2003 when it was reduced by half a percentage point. Part of the stimulus from that cut, however, was offset by the real effective appreciation of the euro. On current forecasts, moreover, inflation will fall below the ECB’s 2 per cent ceiling in 2005 and 2006. But the euro
154 O. Blanchard, J.-P. Pisani-Ferry, C. Wyplosz, L’Europe
déclassée? (Paris, Flammarion, 2005).
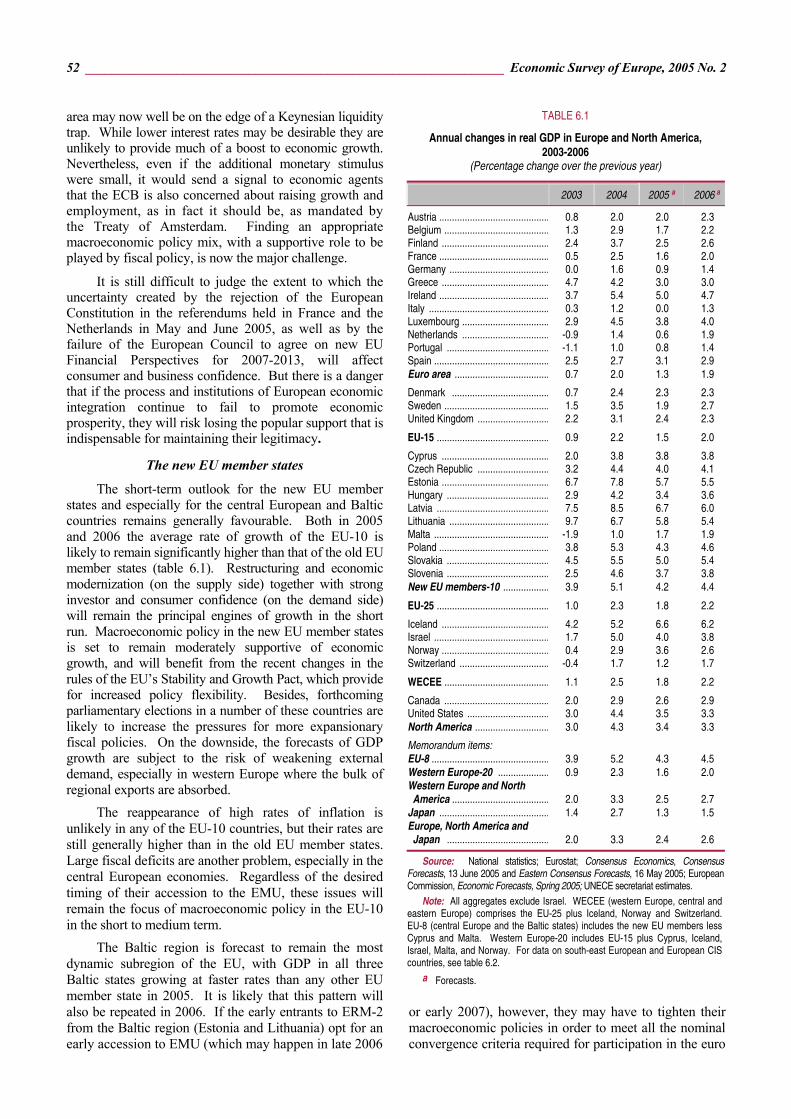
52 ________________________________________________________________ Economic Survey of Europe, 2005 No. 2
area may now well be on the edge of a Keynesian liquidity trap. While lower interest rates may be desirable they are unlikely to provide much of a boost to economic growth. Nevertheless, even if the additional monetary stimulus were small, it would send a signal to economic agents that the ECB is also concerned about raising growth and employment, as in fact it should be, as mandated by the Treaty of Amsterdam. Finding an appropriate macroeconomic policy mix, with a supportive role to be played by fiscal policy, is now the major challenge.
It is still difficult to judge the extent to which the uncertainty created by the rejection of the European Constitution in the referendums held in France and the Netherlands in May and June 2005, as well as by the failure of the European Council to agree on new EU Financial Perspectives for 2007-2013, will affect consumer and business confidence. But there is a danger that if the process and institutions of European economic integration continue to fail to promote economic prosperity, they will risk losing the popular support that is indispensable for maintaining their legitimacy.
The new EU member states
The short-term outlook for the new EU member states and especially for the central European and Baltic countries remains generally favourable. Both in 2005 and 2006 the average rate of growth of the EU-10 is likely to remain significantly higher than that of the old EU member states (table 6.1). Restructuring and economic modernization (on the supply side) together with strong investor and consumer confidence (on the demand side) will remain the principal engines of growth in the short run. Macroeconomic policy in the new EU member states is set to remain moderately supportive of economic growth, and will benefit from the recent changes in the rules of the EU’s Stability and Growth Pact, which provide for increased policy flexibility. Besides, forthcoming parliamentary elections in a number of these countries are likely to increase the pressures for more expansionary fiscal policies. On the downside, the forecasts of GDP growth are subject to the risk of weakening external demand, especially in western Europe where the bulk of regional exports are absorbed.
The reappearance of high rates of inflation is unlikely in any of the EU-10 countries, but their rates are still generally higher than in the old EU member states. Large fiscal deficits are another problem, especially in the central European economies. Regardless of the desired timing of their accession to the EMU, these issues will remain the focus of macroeconomic policy in the EU-10 in the short to medium term.
The Baltic region is forecast to remain the most dynamic subregion of the EU, with GDP in all three Baltic states growing at faster rates than any other EU member state in 2005. It is likely that this pattern will also be repeated in 2006. If the early entrants to ERM-2 from the Baltic region (Estonia and Lithuania) opt for an early accession to EMU (which may happen in late 2006
or early 2007), however, they may have to tighten their macroeconomic policies in order to meet all the nominal convergence criteria required for participation in the euro
TABLE 6.1
Annual changes in real GDP in Europe and North America, 2003-2006
(Percentage change over the previous year)
2003 2004 2005 a 2006 a
Austria ........................................... 0.8 2.0 2.0 2.3 Belgium ......................................... 1.3 2.9 1.7 2.2 Finland .......................................... 2.4 3.7 2.5 2.6 France ........................................... 0.5 2.5 1.6 2.0 Germany ....................................... 0.0 1.6 0.9 1.4 Greece .......................................... 4.7 4.2 3.0 3.0 Ireland ........................................... 3.7 5.4 5.0 4.7 Italy ............................................... 0.3 1.2 0.0 1.3 Luxembourg .................................. 2.9 4.5 3.8 4.0 Netherlands .................................. -0.9 1.4 0.6 1.9 Portugal ........................................ -1.1 1.0 0.8 1.4 Spain ............................................. 2.5 2.7 3.1 2.9 Euro area ..................................... 0.7 2.0 1.3 1.9
Denmark ...................................... 0.7 2.4 2.3 2.3 Sweden ......................................... 1.5 3.5 1.9 2.7 United Kingdom ............................ 2.2 3.1 2.4 2.3
EU-15 ............................................ 0.9 2.2 1.5 2.0
Cyprus .......................................... 2.0 3.8 3.8 3.8 Czech Republic ............................ 3.2 4.4 4.0 4.1 Estonia .......................................... 6.7 7.8 5.7 5.5 Hungary ........................................ 2.9 4.2 3.4 3.6 Latvia ............................................ 7.5 8.5 6.7 6.0 Lithuania ....................................... 9.7 6.7 5.8 5.4 Malta ............................................. -1.9 1.0 1.7 1.9 Poland ........................................... 3.8 5.3 4.3 4.6 Slovakia ........................................ 4.5 5.5 5.0 5.4 Slovenia ........................................ 2.5 4.6 3.7 3.8 New EU members-10 .................. 3.9 5.1 4.2 4.4
EU-25 ............................................ 1.0 2.3 1.8 2.2
Iceland .......................................... 4.2 5.2 6.6 6.2 Israel ............................................. 1.7 5.0 4.0 3.8 Norway .......................................... 0.4 2.9 3.6 2.6 Switzerland ................................... -0.4 1.7 1.2 1.7
WECEE ......................................... 1.1 2.5 1.8 2.2
Canada ......................................... 2.0 2.9 2.6 2.9 United States ................................ 3.0 4.4 3.5 3.3 North America ............................. 3.0 4.3 3.4 3.3
Memorandum items: EU-8 .............................................. 3.9 5.2 4.3 4.5 Western Europe-20 .................... 0.9 2.3 1.6 2.0 Western Europe and North America ...................................... 2.0 3.3 2.5 2.7 Japan ........................................... 1.4 2.7 1.3 1.5 Europe, North America and Japan ........................................ 2.0 3.3 2.4 2.6
Source: National statistics; Eurostat; Consensus Economics, Consensus Forecasts, 13 June 2005 and Eastern Consensus Forecasts, 16 May 2005; European Commission, Economic Forecasts, Spring 2005; UNECE secretariat estimates.
Note: All aggregates exclude Israel. WECEE (western Europe, central and eastern Europe) comprises the EU-25 plus Iceland, Norway and Switzerland. EU-8 (central Europe and the Baltic states) includes the new EU members less Cyprus and Malta. Western Europe-20 includes EU-15 plus Cyprus, Iceland, Israel, Malta, and Norway. For data on south-east European and European CIS countries, see table 6.2.
a Forecasts.
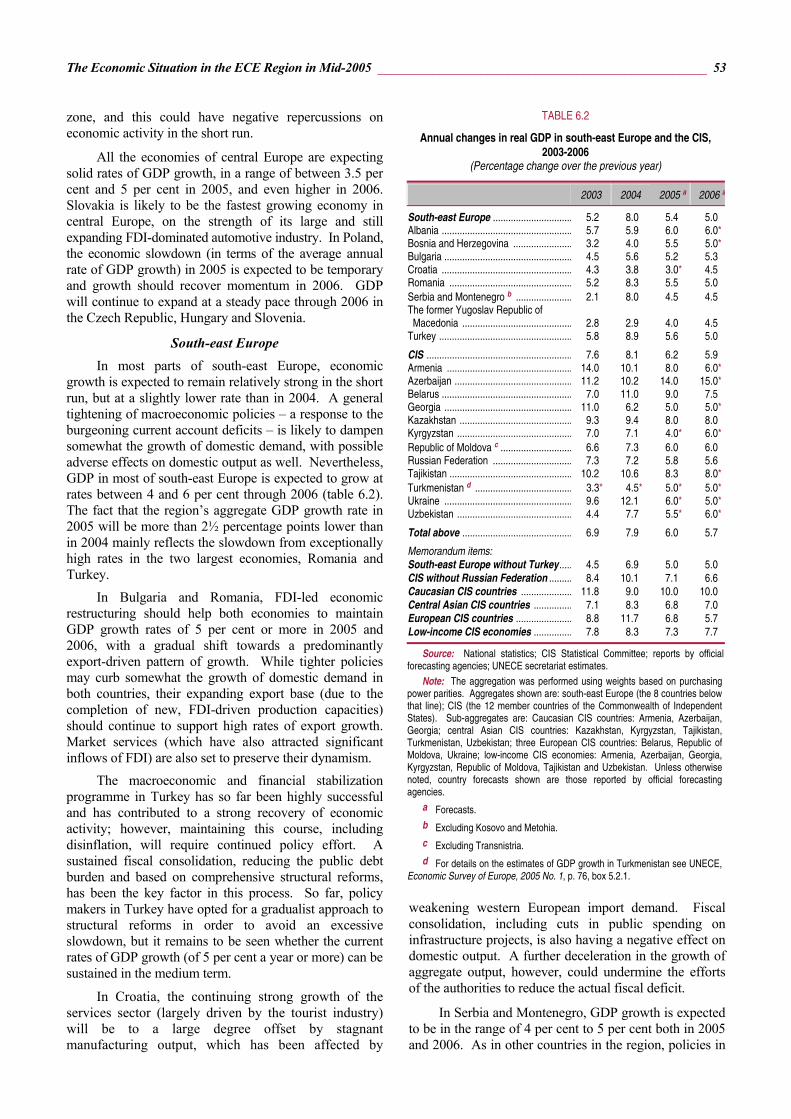
The Economic Situation in the ECE Region in Mid-2005 ________________________________________________ 53
zone, and this could have negative repercussions on economic activity in the short run.
All the economies of central Europe are expecting solid rates of GDP growth, in a range of between 3.5 per cent and 5 per cent in 2005, and even higher in 2006. Slovakia is likely to be the fastest growing economy in central Europe, on the strength of its large and still expanding FDI-dominated automotive industry. In Poland, the economic slowdown (in terms of the average annual rate of GDP growth) in 2005 is expected to be temporary and growth should recover momentum in 2006. GDP will continue to expand at a steady pace through 2006 in the Czech Republic, Hungary and Slovenia.
South-east Europe In most parts of south-east Europe, economic
growth is expected to remain relatively strong in the short run, but at a slightly lower rate than in 2004. A general tightening of macroeconomic policies – a response to the burgeoning current account deficits – is likely to dampen somewhat the growth of domestic demand, with possible adverse effects on domestic output as well. Nevertheless, GDP in most of south-east Europe is expected to grow at rates between 4 and 6 per cent through 2006 (table 6.2). The fact that the region’s aggregate GDP growth rate in 2005 will be more than 2½ percentage points lower than in 2004 mainly reflects the slowdown from exceptionally high rates in the two largest economies, Romania and Turkey.
In Bulgaria and Romania, FDI-led economic restructuring should help both economies to maintain GDP growth rates of 5 per cent or more in 2005 and 2006, with a gradual shift towards a predominantly export-driven pattern of growth. While tighter policies may curb somewhat the growth of domestic demand in both countries, their expanding export base (due to the completion of new, FDI-driven production capacities) should continue to support high rates of export growth. Market services (which have also attracted significant inflows of FDI) are also set to preserve their dynamism.
The macroeconomic and financial stabilization programme in Turkey has so far been highly successful and has contributed to a strong recovery of economic activity; however, maintaining this course, including disinflation, will require continued policy effort. A sustained fiscal consolidation, reducing the public debt burden and based on comprehensive structural reforms, has been the key factor in this process. So far, policy makers in Turkey have opted for a gradualist approach to structural reforms in order to avoid an excessive slowdown, but it remains to be seen whether the current rates of GDP growth (of 5 per cent a year or more) can be sustained in the medium term.
In Croatia, the continuing strong growth of the services sector (largely driven by the tourist industry) will be to a large degree offset by stagnant manufacturing output, which has been affected by
weakening western European import demand. Fiscal consolidation, including cuts in public spending on infrastructure projects, is also having a negative effect on domestic output. A further deceleration in the growth of aggregate output, however, could undermine the efforts of the authorities to reduce the actual fiscal deficit.
In Serbia and Montenegro, GDP growth is expected to be in the range of 4 per cent to 5 per cent both in 2005 and 2006. As in other countries in the region, policies in
TABLE 6.2
Annual changes in real GDP in south-east Europe and the CIS, 2003-2006
(Percentage change over the previous year)
2003 2004 2005 a 2006 a
South-east Europe ............................... 5.2 8.0 5.4 5.0 Albania ................................................... 5.7 5.9 6.0 6.0*Bosnia and Herzegovina ....................... 3.2 4.0 5.5 5.0*Bulgaria .................................................. 4.5 5.6 5.2 5.3 Croatia ................................................... 4.3 3.8 3.0* 4.5 Romania ................................................ 5.2 8.3 5.5 5.0 Serbia and Montenegro b ...................... 2.1 8.0 4.5 4.5 The former Yugoslav Republic of Macedonia ........................................... 2.8 2.9 4.0 4.5 Turkey .................................................... 5.8 8.9 5.6 5.0
CIS ......................................................... 7.6 8.1 6.2 5.9 Armenia ................................................. 14.0 10.1 8.0 6.0*Azerbaijan .............................................. 11.2 10.2 14.0 15.0*Belarus ................................................... 7.0 11.0 9.0 7.5 Georgia .................................................. 11.0 6.2 5.0 5.0*Kazakhstan ............................................ 9.3 9.4 8.0 8.0 Kyrgyzstan ............................................. 7.0 7.1 4.0* 6.0*Republic of Moldova c ............................ 6.6 7.3 6.0 6.0 Russian Federation ............................... 7.3 7.2 5.8 5.6 Tajikistan ................................................ 10.2 10.6 8.3 8.0*Turkmenistan d ...................................... 3.3* 4.5* 5.0* 5.0*Ukraine .................................................. 9.6 12.1 6.0* 5.0*Uzbekistan ............................................. 4.4 7.7 5.5* 6.0*
Total above ........................................... 6.9 7.9 6.0 5.7
Memorandum items: South-east Europe without Turkey..... 4.5 6.9 5.0 5.0 CIS without Russian Federation ......... 8.4 10.1 7.1 6.6 Caucasian CIS countries .................... 11.8 9.0 10.0 10.0 Central Asian CIS countries ............... 7.1 8.3 6.8 7.0 European CIS countries ...................... 8.8 11.7 6.8 5.7 Low-income CIS economies ............... 7.8 8.3 7.3 7.7
Source: National statistics; CIS Statistical Committee; reports by official forecasting agencies; UNECE secretariat estimates.
Note: The aggregation was performed using weights based on purchasing power parities. Aggregates shown are: south-east Europe (the 8 countries below that line); CIS (the 12 member countries of the Commonwealth of Independent States). Sub-aggregates are: Caucasian CIS countries: Armenia, Azerbaijan, Georgia; central Asian CIS countries: Kazakhstan, Kyrgyzstan, Tajikistan, Turkmenistan, Uzbekistan; three European CIS countries: Belarus, Republic of Moldova, Ukraine; low-income CIS economies: Armenia, Azerbaijan, Georgia, Kyrgyzstan, Republic of Moldova, Tajikistan and Uzbekistan. Unless otherwise noted, country forecasts shown are those reported by official forecasting agencies.
a Forecasts. b Excluding Kosovo and Metohia. c Excluding Transnistria. d For details on the estimates of GDP growth in Turkmenistan see UNECE,
Economic Survey of Europe, 2005 No. 1, p. 76, box 5.2.1.
54 ________________________________________________________________ Economic Survey of Europe, 2005 No. 2
Serbia have been tightened in response to a large current account deficit and these may have negative repercussions on the economy. The government has increased its efforts to speed up the privatization process in Serbia and this is expected attract inward FDI. It will take time, however, before this process has a perceptible effect on aggregate economic performance.
The recovery in The former Yugoslav Republic of Macedonia is expected to strengthen in the course of 2005 but GDP growth is unlikely to match the rates in the fastest growing economies in the region. The signs of economic revival are becoming more apparent in Bosnia and Herzegovina but policy makers still have to find a way of establishing a viable, self-sustained economy, without relying on official foreign assistance. Aggregate output in Albania should continue to grow steadily in both 2005 and 2006.
The CIS Despite some slowdown, economic growth in the
CIS region is generally set to remain relatively strong in 2005 (table 6.2). Commodity exporters (especially those specialized in hydrocarbons) will continue to benefit from high world market prices and strong demand in some of their main markets. Current trends suggest a continuing rise in real disposable incomes, which are underpinning buoyant domestic demand. Macroeconomic policies are generally set to remain expansionary, providing further support to the growth of the output and real incomes. This, however, is also a source of downside risk, as the loosening of macroeconomic policy (which in some cases has been under way for several years) is not sustainable and has already led to rising inflationary pressures in a number of countries. At some point policy makers will have to address this issue and the question is not if, but when they will do this. Despite the generally favourable outlook, the short-terms prospects of individual countries differ significantly.
The outlook for the Russian economy hinges on the balance of divergent trends in some key industries. Thus, while rapid growth continues in some sectors of the economy, particularly in market services (underpinned by strong consumer spending), other industries, such as manufacturing, have slowed down considerably. An important factor behind the general sluggishness in the manufacturing sector are the losses in competitiveness due to the persistent appreciation of the rouble’s real exchange rate. The growth of oil output, which has played a significant role in driving economic expansion in recent years, has also decelerated markedly and is expected to be significantly lower for the year as a whole.155 This deceleration partly reflects base period effects after many years of rapid expansion but it is also due to temporary disruptions associated with disputes
155 Oil output rose by 9 per cent in 2004 but most forecasts are for
expansion in 2005 at less than half this rate. “Russian May output seen up but below record”, Reuters News, 31 May 2005.
about past tax liabilities in the sector. Oil prices remain strong but increased oil export duties in 2005 have reduced their impact on the profitability of companies.156
Macroeconomic policy in Russia remains beset with consistency problems: the monetary authorities in fact face a trilemma, as they are not only struggling to balance the mutually exclusive goals of targeting both the exchange rate and the inflation rate under the pressure of sizeable inflows of foreign exchange, but at the same time they are having to cope with the inflationary consequences of a continuing fiscal loosening. As to domestic demand, Russian consumers appear unambiguously as the mainstay of the economic expansion, whereas investment activity has weakened markedly. Apart from the negative implications for long-term growth, this pattern of domestic demand increases the short run vulnerability of the economy to a possible weakening in the growth of real incomes. Overall, the annual rate of GDP growth in Russia is likely to be some 1-1.5 percentage points below its rate in 2004,157 while the year-on-year rate of consumer price inflation is set to remain above 10 per cent despite the recent shift in the focus of monetary policy on the disinflation effort.
The marked slowdown in Ukraine’s economy in the early months of 2005 will affect the average performance for the year as a whole. The official GDP growth target of 8.2 per cent in 2005, which was reaffirmed by the government in March, appears to be unattainable, given the continuing deceleration in output growth.158 The continued strength of consumer demand, coupled with some loss of domestic competitiveness due to the real appreciation of the hryvnia, will fuel imports. As the demand for Ukraine’s exports is likely to deteriorate further (especially for steel), this implies that net exports will have a diminishing influence on output growth. This shift in the sources of economic growth is expected to lead to a further deceleration in the rate of output growth for the year as a whole. As a result of the drastic deterioration in the government’s financial balance, which was associated with the 2004 presidential election campaign and has led to a resurgence of inflation, Ukraine now faces the need for a major effort at fiscal consolidation. With parliamentary elections scheduled for the spring of 2006, however, the fiscal tightening
156 For a discussion of oil and gas taxation see United Financial
Group, Russian Oil and Gas Taxes: All for One (or One for All?) (Moscow), 28 April 2005. In principle, a slower pace of expansion in the oil sector and an increase in its relative tax burden is consistent with the aim of diversifying the economy. However, addressing this important policy challenge also requires a conducive environment for the development of the non-oil sectors.
157 In May the Russian Economy Development Ministry revised downwards its forecast for the rate of GDP growth in 2005 from 6.5 per cent to 5.8 per cent.
158 According to preliminary estimates, aggregate output both in April and in May grew by 3.6 per cent year-on-year, bringing the year-on-year rate for January-May to 4.7 per cent.

The Economic Situation in the ECE Region in Mid-2005 ________________________________________________ 55
required to correct previous excesses is likely be postponed. In fact, the macroeconomic policy stance is set to remain expansionary, providing further support to the growth of household incomes in the short run, but complicating still further the necessary task of adjustment.
In contrast, economic growth is likely to maintain its momentum in the two other large CIS economies, Belarus and Kazakhstan. In Kazakhstan, strong domestic demand should continue to provide the main impetus for economic activity and GDP is forecast to grow by some 8 per cent in 2005. Given the current trends in the world market prices for fuels, the external conditions should remain favourable as well. At the same time, the diversification effort is unlikely to yield perceptible results in the short term and could add to the demand for foreign goods. One of the downside risks arises from the pre-election fiscal loosening (reflected in a sizeable increase in social spending), which may lead to higher inflation and prompt a tightening of monetary policy. Rapid economic growth is also expected to continue in Belarus, with GDP forecast to grow by close to 10 per cent in 2005. Accommodative monetary policies and strong import demand in its main export market, Russia, should continue to support activity, at least in the short run. In the not too distant future, however, this external influence may weaken as a number of privileged trade
arrangements between the two countries may be discontinued when Russia gets close to joining the WTO.
In the Caucasian rim, economic growth should remain strong in Armenia and, especially, in Azerbaijan, where the new Baku-Ceyhan-Tbilisi pipeline should start operating at full capacity before the end of 2005; in contrast, Georgia’s economic performance is likely to lose some momentum. A rapid economic recovery is expected to continue in Tajikistan, but some moderation of output growth is expected in the other central Asian CIS economies. Lower cotton prices will have a dampening effect on Uzbekistan’s economy in the short run. The downside risks to the economic outlook in Kyrgyzstan have increased considerably since the beginning of 2005 due to the political turmoil in the country and newly emerging problems with gold production. The forecast of 4 per cent GDP growth in 2005 implies a reversal of these negative trends in the second half of the year; but, unless this materializes, the economy may well slide into a recession.
A gradual economic slowdown is likely to continue in 2006 in the CIS as a whole, as well as in some of the largest economies. While total output in the region will continue to grow at relatively high rates, sustaining these in the medium and longer run will require an acceleration in the process of systemic and structural reform.