The Economic Return on New Immigrants’ Human … Working Paper no. 21... · The Economic Return...
47
Canadian Labour Market and Skills Researcher Network Working Paper No. 21 CLSRN is supported by Human Resources and Social Development Canada (HRSDC) and the Social Sciences and Humanities Research Council of Canada (SSHRC). All opinions are those of the authors and do not reflect the views of HRSDC or the SSHRC. The Economic Return on New Immigrants’ Human Capital: the Impact of Occupational Matching Gustave Goldmann Statistics Canada Arthur Sweetman Queen’s University Casey Warman Queen’s University April 2009
Transcript of The Economic Return on New Immigrants’ Human … Working Paper no. 21... · The Economic Return...

Canadian Labour Market and Skills Researcher
Network
Working Paper No. 21
CLSRN is supported by Human Resources and Social Development Canada (HRSDC) and the Social Sciences and Humanities Research Council of Canada (SSHRC). All opinions are those of the authors and do not reflect the views of HRSDC or the
SSHRC.
The Economic Return on New Immigrants’ Human Capital: the Impact of Occupational
Matching
Gustave Goldmann Statistics Canada
Arthur Sweetman
Queen’s University
Casey Warman Queen’s University
April 2009

2
The Economic Return on New Immigrants’ Human Capital:
the Impact of Occupational Matching*
Gustave Goldmann Statistics Canada
Arthur Sweetman
School of Policy Studies, Queen’s University
Casey Warman
Department of Economics, Queen’s University
© Copyright 2009 Gustave Goldmann, Arthur Sweetman and Casey Warman
April 2009 Abstract: Using a data set that provides information on source country employment, we examine the effect of source and host country occupational matching on earnings and the economic rate of return to the foreign human capital of immigrants in Canada. Examining occupational distributions we find that immigrants converge very quickly to the skill distribution of the Canadian population in terms of the main job worked, although four years after landing they are still below the source country distribution. We also find that for a large proportion of immigrants, their intended occupation differs from their source country occupation. Although immigrants who are able to match their source and host country occupations obtain higher earnings, successful occupational matching does not have any impact on the return to foreign potential work experience. However, immigrants who match their source and host country occupations do have a higher return to schooling, particularly for females. JEL Code: J24, J31, J61 Keywords: Immigrants, Occupational Matching, Human Capital, Canada
* We thank the Canadian Labour Market and Skills Researcher Network for funding this research and its reviewers for helpful comments. We would also like to thank seminar participants at the CLSRN 2007 Workshop on Immigration in Canada for their helpful comments. While the research and analysis are based on data from Statistics Canada, the opinions expressed do not represent the views of Statistics Canada.

3
Executive Summary Worsening outcomes of recent immigrant arrival cohorts in Canada has focused interest on determining the causes of these poorer outcomes.. The lack of portability of human capital acquired prior to immigrating has received both research and policy attention. Using longitudinal data that follow new immigrants after landing in Canada, we examine the relationship between source and host country occupational matching, earning outcomes, and the return of foreign acquired human capital. We find that 97 percent of males and 80 percent of females had some pre-Canadian work experience. Exploring the occupational distributions, we find that immigrants move very quickly toward the skill distribution of the Canadian population in terms of the main job worked, although four years after landing they are still below the host country average skill level. Around 87 and 78 percent of males and females who had worked in the source country did so in a high-skilled occupation. Four years after landing, 60 and 42 percent of male and female immigrants were in a high-skill occupation, compared to 65 and 55 for the male and female Canadian populations. When we take into account demographic differences, such as educational attainment, the gap between immigrants and the Canadian population widens. Having pre-Canadian work experience was a strong determinant of employment outcomes in Canada, particularly for females. More than 60 percent of the female immigrants who had never worked prior to immigrating were unemployed four years after landing, compared to a little less than a third of female immigrants who had worked prior to immigrating. Immigrants with pre-Canadian work experience had difficulty matching their Canadian and source country occupations; although when both pre-Canadian and intended post-immigration occupations are reported, the two frequently differ. A little less than 30 percent of males who had pre-Canadian work experience were able to match the main job worked with their source country occupation by 4 years after landing. For females, this was even lower, with only 18 percent obtaining a successful match. Immigrants who successfully match their source and host country occupations obtain much higher earnings. Four years after landing, even after controlling for observable characteristics, relative to non-matchers, successful matchers experience a 38 and 47 percent earnings advantage for males and females respectively. However, successful occupational matching does not have any impact on the return on years of foreign potential work experience. Regardless of whether an immigrant successfully matches their source country and Canadian occupation, they obtain no returns to years of foreign potential work experience. Conversely, immigrants who match their source and host country occupations do have a higher return to schooling, particularly for females. In some specifications, immigrants who do not successfully match occupations obtain no returns to their schooling.

4
Using additional information available only for skilled worker principal applicants on the intended occupation, we examine various combinations of source, intended and host country occupational matches. Almost 40 percent want to switch away from their source country occupation. However, workers who intended to switch were very likely to end up working in their source country occupation rather than their intended occupation. Regardless of whether they match either their source and host country occupations, or their intended and host country occupations, they obtain similar returns to a match in terms of weekly earnings.

5
1. Introduction
As in the United States (e.g., Borjas 1985, 1995; Lubotsky 2007), evidence in
Canada clearly shows that entry earnings of recent immigrant cohorts have fallen
appreciably relative to both the native born and previous cohorts of immigrants (Baker
and Benjamin, 1994; Bloom, Grenier and Gunderson, 1995; Warman and Worswick,
2004; Frenette and Morissette, 2005; Picot, Hou and Coulombe, 2007). The limited
portability of human capital acquired prior to immigrating has been a focus of both
research and policy initiatives. Pre-Canadian labour market experience is one measure of
human capital associated with a large portion of the reduction with the average economic
rate of return to such prior experience having declined massively (e.g., Green and
Worswick, 2004; Aydemir and Skuterud, 2005). Using longitudinal data that follows new
immigrants after landing in Canada, we examine the relationship between source and host
country occupational matching, earning outcomes, and the return to foreign human
capital with a focus on pre-Canadian labour market experience.
Immigration research is beginning to look at explanations for the considerable
decline in the economic labour market outcomes of recent immigrants with the portability
of foreign human capital being an important focus.1
1 For example, Friedberg (2000) finds that in Israel the lower returns to foreign acquired human capital of immigrants can explain the earning differential with native-born workers.
If immigrants are unable to transfer
skills acquired prior to immigrating, their chances for success in the host country are
likely reduced. While there appears not to have been a large decline in the returns to
foreign education over time, Schaafsma and Sweetman (2001), and Ferrer, Green, and
Riddell (2006) find that immigrants, on average, receive lower returns to pre-Canadian
years of schooling than do both immigrants and the Canadian born to schooling obtained

6
in Canada.2
A key issue that is plausibly relevant in considering the economic return to pre-
Canadian human capital, especially labour market experience, after immigration is the
transferability of such skills and knowledge across jobs in general. For some reason this
is not much discussed in immigration research. In contrast, in the domestic (usually US,
but sometimes Canadian or other country) context there is a substantial body of research
that explores not only the return to general labour market experience, but also the
economic return to firm-specific (e.g., Topel, 1991; Altonji and Williams, 1998),
industrial (Neal, 1995; and Parent, 2000), and occupational (e.g., Shaw 1984, 1987;
Kambourov and Manovskii, 2009) experience, as well as the value of
In contrast, empirical evidence regarding immigrants’ foreign work
experience by Green and Worswick (2004), Aydemir and Skuterud (2005), Schaafsma
and Sweetman (2001), and Ferrer and Riddell (2008) show not only that its economic
return has declined over time, but that it is discounted to the point where it is sometimes
seen to receive a zero rate of return.
A related issue is the effect of language knowledge and literacy skills. These have
a direct effect on labour market outcomes, but also may have an indirect effect by
mediating the use of foreign human capital in the Canadian context. Ferrer, Green, and
Riddell (2006) examine English or French literacy skills and find that immigrants receive
returns similar to those of the Canadian born, but have lowered measured literacy. Of
particular relevance, they observe that the gap in the return to education for immigrants
and the Canadian born is closed once controls for literacy are introduced. However, they
do not find any impact from controlling for literacy skills on the returns to experience.
2 Ferrer and Riddell (2008) find that once years of schooling are controlled for, immigrants actually receive higher returns for their educational credentials (although they receive lower returns to years of foreign schooling).

7
experience/seniority in, for example, union compared to non-union contexts (Kuhn and
Sweetman, 1999).
Most of this domestic literature is devoted to understanding the role of selection
bias, and the relative importance of the various forms of experience. At the risk of
oversimplifying, the general conclusion is that sample selection bias is appreciable in
measuring the return to firm-specific experience (sometimes called seniority or tenure).
On average, people with long tenure appear to have higher levels of both observed and
unobserved characteristics that are valued in the labour market compared to those with
shorter seniority. The value of firm-specific experience is not zero, but it is less than a
naïve estimate would suggest. Of particular relevance to this study, the magnitude of the
return to industry, and even more so occupational, seniority appears to be very
substantial. In fact, Kambourov and Manovskii (2009) build on the existing literature and
extensively investigate what appears to be the best data to date. They find that the return
to occupational experience is much larger than that for industrial experience, and that,
consistent with much of the previous literature, once one controls for these, firm-specific
experience is of minimal value. This implies that involuntarily switching occupations is
associated with substantial earnings losses for workers with appreciable occupational
experience.
Plausibly, the economic and technological process regarding the value and
transferability of human capital found in this domestic research has implications for
interpreting the immigration literature. Although, in the immigration context there are
additional complexities regarding differences in the nature of occupations and industries
across countries, and, as mentioned, language proficiency issues that might mediate the
effective use of skills in the Canadian labour market. We do not have data that allow us to

8
explore issues related to differences across countries in what constitute occupational
skills and knowledge (e.g., differences in technology usage, procedural norms and the
legal environment) and how this might affect the portability of experience, but we do
attempt to look at the mediating effect of language.
Relatively little is known about these issues for immigrants. McDonald and
Worswick (1998) find that Canadian job tenure has a large impact on immigrants’
earnings suggesting a “catch-up” on this dimension, but they do not look at occupational
or industrial experience.3
Using the Longitudinal Survey of Immigrants to Canada (LSIC), which has pre-
immigration information, we can examine immigrants’ success in obtaining employment
in the occupation in which they last worked prior to immigrating, as well as their success
in obtaining employment in their intended occupation. We add to both the literature on
immigrant earning outcomes, as well as that on specific human capital by examining
Green (1999) examines host country occupational outcomes of
Canadian immigrants relative to the native born using mainly Census data and finds
occupational integration with time in the country as immigrants move into employment
and into higher skilled jobs. Recently, Pescarus and Bouaissa (2007) attempt to match
occupations based on high and low skilled criteria. However, in general, it is not known
what impact source country occupational tenure has on the return to foreign human
capital, or how important matching source and host country occupations are for labour
market success in either the short or long run. Nevertheless, it is likely that human capital
acquired prior to immigration will be of much lower value if an immigrant is unable to
secure employment in the same or a related occupation in the host county.
3 Using Canadian matched employer-employee data, Aydemir and Skuterud (2008) find that for males the within-establishment wage differential is less important than sorting, while for females the opposite is true.

9
whether a mismatch between source and host country occupations can account for low
returns to the human capital that immigrants bring with them.
Comparing occupational outcomes of immigrants in the LSIC to the general
Canadian population using the Labour Force Survey (LFS), we find that immigrants are
more highly concentrated in less-skilled occupations when they first immigrate to
Canada. However, they converge quickly toward the Canadian average in broad
occupational distributions, and by the last cycle (four years after landing), they have
similar occupational skill level distributions to the Canadian population. As with previous
studies, we find that immigrants do not receive any returns to their years of potential
work experience, although they do obtain modest returns to their years of foreign
schooling. While we do find that immigrants who are able to match their pre-immigration
occupation with their Canadian one have higher earnings, we do not find any evidence
that a successful match increases the returns to foreign work experience. However,
immigrants who successfully obtain an occupational match do obtain higher returns to
their years of foreign schooling. It appears that a successful occupational match enables
immigrants to transfer a higher fraction of their foreign acquired formal training.
The paper is organized as follows. In the next section, we discuss the data and
methodology used. In the third section we look at occupational outcomes, and in the
fourth section we look at the impact of occupational matching on immigrant outcomes.
The final section comprises the conclusion.
2. Data and Methodology
The LSIC contains a sample of immigrants who applied through a Canadian
Mission abroad, were age 15 or older at the time of landing, and immigrated between

10
October 1st, 2000 and September 30th, 2001. They are then interviewed six months, two
years and four years after landing. The response rate at the first interview was just over
60%, and of those who responded at the first interview, about 65% continued through to
the third wave. In addition to the usual reasons for non-response, return and/or onward
migration are issues for the sample in question since the survey is restricted to those
residing in Canada. Aydemir and Robinson (2008) suggest that almost 25% of all new
immigrants leave the country within five years with over 80% of those departing doing so
in the first year after landing. Moreover, these numbers are likely to underestimate
departures relevant to the survey since the Economic Class must apply through a Mission
abroad and is more likely to depart, whereas refugee claimants may land within the
country and are more likely to stay. Statistics Canada (2007) reports that for the “Wave 3
sample, the population of interest consists of all immigrants in the LSIC who are still in
Canada four years after their arrival. Consequently, the post-stratification adjustment for
this sample ensures consistency between the sum of the weights and the demographic
estimate associated with this period for each combination of age, sex, place of birth
(aggregated by region of the world) and class of immigrant.”
We restrict our sample for analysis to those age 25 to 59 at the time of the first
cycle. Further, those who had previously either worked in Canada as temporary foreign
workers or who had been former international students are removed in order to obtain a
cleaner measure of foreign work experience and schooling. The natural logarithm of
weekly earnings is the focus of much of our analysis, and it is converted into real terms
using the Consumer Price Index (CPI). 4 Although not presented, we also undertook the
entire analysis using the log of hourly wages as the dependent variable and found broadly

11
similar results. We prefer weekly earnings, which we interpret as a better measure of
aggregate labour force outcomes since they are a function of both hourly wages and
weekly hours. In general, we are interested in using a broad sample and broad measures
since the immigration policy questions we are interested involve all immigrants in all
labour force situations. Hence we do not, to consider a sample we might have selected,
restrict our sample to full-time full-year workers, which would be appropriate for a
different set of policy questions.
The LSIC contains a rich amount of information on occupations. We use
information provided on the 1991 Standard Occupational Classification (SOC) to
construct various levels of two and three digit occupation classification aggregations.5
Unlike other surveys used to analyse economic outcomes of immigrants, there is not only
information on occupations in Canada, but also on both the last source country
occupation and the intended occupation post-immigration.6
4 Given the survey design, we use a moving average of the monthly CPI over the reference period for each immigrant to better control for differences in the price level. For example, for an immigrant interviewed at cycle 1, we take an average of the CPI over his/her six month reference period. 5 We look at 10, 25, 47 and 139 occupation groupings. We adjust the SOC to make it comparable to the NOC-S codes in the LFS.
While occupational coding is
often associated with measurement error, given that many of the questions about sending
country, intended, and initial host country, occupation are asked and coded as part of the
same survey, the possibility of matching errors should be reduced. However, the source
and host country occupational classifications are based on three questions, whereas the
intended occupation is based on only one; therefore the main intended occupation
question is not as reliable. The variable could not be coded for about 11 percent of the
males and 7 percent of the females. Another 17 percent of males, and 35 percent of
females, did not declare an intended occupation because either they did not plan on

12
working or did not have a particular target occupation (and the data does not distinguish
between these two options). An additional measure of intended occupation, which derives
from the administrative data and is available for all Skilled Worker Principal Applicants,
is discussed later in the paper. In contrast to the domestic literature where it is often
difficult to accurately identify job switchers given that job changes may be promotions
(see Neal 1999), we know that all workers in our sample are switching jobs.
The LFS, which describes the occupational distribution of the general Canadian
population, is used for comparison. It is a monthly survey with a six month rotating
panel. We restrict our estimations to the first month for each respondent.
After exploring the data using simple descriptive statistics, a set of ordinary least
squares specifications similar to equation (1), but using varying regressors, are estimated.
(1) ln yi = β1Xi + δ1Matchi + δ2Occi + δ2EXPi + δ4EXPi*Matchi
+ ϕ1Schooli + ϕ2Schooli*Matchi + ei
The dependent variable, ln yi, is the natural logarithm of earnings for individual i. We
estimate the regressions separately for each of the three cycles and restrict the sample to
people who had worked prior to immigration. Given room constraints, we present the
results for the last cycle but note any important trends or differences that the other two
cycles illustrate.7 The matrix Xi contains variables controlling for months since migration,
age, region of origin, region of residence, language ability, marital status and number of
children.8
6 We drop a small number of observations for people who had an occupation in the sending country that could not be coded, or for people who refused to answer the question on source country occupation. 7 The results for cycle 1 and 2 are available from the authors. 8 See the Appendix for a description of the variables.
Source country occupational dummies (Occi) are included in most
specifications as are the years of foreign schooling (Schooli). We estimate the years of
potential foreign work experience (EXPi) as Age at immigration – Years of school at

13
immigration – 6.9
While we are not able to measure actual pre-immigration work experience, we
have information on whether the immigrant had ever worked prior to landing, which can
help provide some sense of how well our measure of experience captures true work
experience. We expected that immigrants who report never having worked prior to
immigrating would have much lower potential experience. Surprisingly, we find that the
number of years of potential work experience is almost identical for males who did and
did not report ever working prior to immigrating to Canada (15.0 and 14.4 years
respectively) and is actually higher for females (14.2 and 20.3 years respectively). While
only three percent of males report having never worked prior to immigration, 20 percent
of females make this report. Given that we are interested in the match between source
and host country occupations, we drop workers who had never worked before
immigrating from most specifications. As well, we try different specifications, and rerun
Although potential work experience is commonly used as a proxy for
actual work experience (for example: McDonald and Worswick 1998; Aydemir and
Skuterud 2005), it is likely that there is measurement error, especially for females. Using
the Survey of Labour and Income Dynamics (SLID), Hum and Simpson (2004) find that
the simple correlation for male immigrants between actual and potential experience is 82
percent, compared to 90 percent for Canadian-born males. For female immigrants the
measurement error appears to be much larger with the correlation between actual and
potential experience at only 39 percent, compared to 51 percent for Canadian-born
females. We allow the sample to vary across waves according to employment status, but
also estimate the full set of regressions with a consistent sample and get consistent
results. The sample is allowed to vary to maximize its size.
9 We originally estimated the results including a square term for experience but found that the returns to experience were linear in almost every specification.

14
all the regressions restricting the sample to immigrants who should have had stable
employment to examine the sensitivity of the interpretation of potential work experience.
We examine the impact of successfully matching the source country occupation
and the main occupation in Canada with a dummy variable (Matchi ) that equals one if
there is a successful match and zero otherwise. However, it is likely that matching is non-
random. Plausibly it is more likely to occur for workers with higher ability. Therefore, the
coefficient on Matchi is likely biased upwards. As well, it is possible that the coefficients
on the interaction between Matchi and EXPi and the interaction between Matchi and
Schooli are biased upwards if workers with higher quality work experience or higher
quality schooling are more likely to obtain a successful match.
While we are able to determine whether there is a successful match, unfortunately
we do not know the duration of the job in the sending country. Possibly, failure to match
source country and Canadian occupations is due to lack of experience in the source
country occupation. Further, we do not have any data regarding the similarity of
occupational requirements in the source and host country. For example, the use of
information technology may differ across countries.10
We first examine differences between the distribution of the occupational skill
levels of immigrants and the Canadian population. By restricting the Canadian population
sample from the LFS to people aged 25 to 59 initially, and allowing it to age at the same
rate as the LSIC population, we minimize the impact of ageing on occupational
3. Occupational Outcomes
10 In an earlier version, we examined the role of the potential quality of the human capital by controlling for source country GDP. We found that for males, coming from a country with higher GDP per capita has a positive effect on earnings, regardless of successful matching. Conversely, for females, only workers with a match obtain a positive relationship between source country GDP and earnings, and only in cycles 1 and 2.

15
distributions. We define high-skilled jobs as occupations in Skill Levels A, B or O, and
less-skilled jobs as occupations in Skill Levels C and D, based on the national
occupational classification matrix. For the LSIC sample, we look at the main occupation
performed by the respondent in the given cycle, and for the LFS, we take an average of
the months covered by the reference period for the given LSIC cycle.
Results in the top half of Table 1a echo Green’s (1999) findings. Looking at the
three right hand side columns of the top half of Table 1a, which show what proportion of
those employed during the reference period were in high-skilled occupations, the
occupational distribution of immigrants is seen to change very rapidly. In the first six
months, around 41 percent of working male immigrants are in high-skilled jobs; by the
third cycle (approximately 4 years after landing), 61 percent are in high-skilled jobs,
which is very close to the Canadian male average of 65 percent.
Like the Canadian population, a lower proportion of the female sample from the
LSIC is in high-skilled occupations. As with male immigrants, the Table shows that the
occupational distribution of female immigrants converges very rapidly to that of the
Canadian population. Although not shown here, for both male and female immigrants, we
find that rapid convergence is also the case when using 10 occupational categories. The
comparison with the Canadian population also allows us to get a sense of whether the
change in the occupational distribution of immigrants is due to ageing and/or the growth
in high-skilled occupational sectors in Canada, or because of occupational integration.
Although there is a slight upward trend in the proportion of the Canadian sample in high-
skilled occupations, the growth is much larger for the immigrant population.
While immigrants converge toward the high-skill occupational distribution of the
Canadian population, a much higher proportion of recently landed immigrants have a

16
university degree, suggesting that immigrants may still be underrepresented in high-
skilled occupations. Looking at the source country occupational skill distribution of
immigrants who had ever worked prior to immigrating (column 1 of Table 1a), those in
the high skilled group are over 20 percentage points higher than that of the Canadian
population. Four years after landing, the proportion of immigrants working in a high-
skilled occupation is around 27 and 36 percentage points lower than that found for the
source country occupations for males and females respectively.
Table 1a: Proportion of Workers in High Skilled Occupation
Unadjusted Means Source
Country Intended Occupation in Canada Occupation Occupationi 6 months 2 years 4 years Males LSIC – Sample 86.9 86.9 40.7 50.4 60.1 LFS Sample ---- ---- 63.5 63.9 64.7 Females LSIC Sample 77.5 74.0 28.2 33.0 42.0 LFS Sample ---- ---- 53.8 54.1 55.3 Predicted Probabilitiesii Occupation in Canada 6 months 2 years 4 years Males LSIC Sample 34.4 51.1 64.8 LFS Sample 82.8 82.7 81.7 Females LSIC Sample 24.0 36.0 48.7 LFS Sample 79.2 78.4 78.5
Notes: High Skill is defined as A, B or O level based on the national occupational classification matrix. LFS sample is from the incoming rotation. For the LFS unadjusted means, a monthly average was taken based on the reference period of the LSIC. i. Intended Occupation had around 13 percent of occupations that could not be coded. ii. Predicted probabilities calculated using probit regressions for people aged 40, living in Toronto, whose highest degree is a Bachelor, who are married or common law and have one child.
Intended occupation is also shown in Table 1a (column 2). This question was
asked of immigrants who knew what type of job they wanted and around 13 percent of

17
the sample could not be coded for intended occupation.11
The high-skilled distribution of
the intended and the source country occupations are very similar. While the proportion
that did work, and intended to work, in a high-skilled occupation is similar, this may be
misleading since some plan to switch occupations after landing. A cross-tabulation using
10 occupation groupings (not shown) shows that 34% percent of females, and 29% of
males, intend to switch occupations.
The results in the top half of Table 1a do not take into account that recent
immigrants and the Canadian born have very different distributions of observable
characteristics, such as level of education and region of residence. Using probit
regressions, in the bottom half of Table 1a we present predictions of being in a high-
skilled occupation. Given that we are using different data sources for the immigrant and
Canadian-born samples, we utilize variables that are the same, or at least very similar, in
each data set and that are important in determining earnings. The predictions are for 40
year olds who are married/common law with one child, whose highest degree is at the
Bachelor’s level, and who live in Toronto (see equation 2).
The predicted values show the initial gap between the Canadian population and the
immigrant sample to be much larger. Again, however, the gap is quickly reduced, and by
the third cycle has shrunk to 17 and 30, from 48 and 55, percentage points for males and
females respectively.
Next, in Figures 1a and 1b, we investigate the possible occupation outcome paths
of the immigrants. Even though immigrants moved from less to more skilled occupations
11 We also estimate all the LSIC results from Table 1 restricting the sample to people who had an intended occupation that could be coded and found that the skill distributions of both the sending country and host
childrenmaritalregionEduAgeAgeY 65432
210ˆˆˆˆˆˆˆˆ)2( βββββββ ++++++=

18
over time, unless the occupations that immigrants are moving into are related to what
they did prior to coming to Canada, it is unlikely that they are able to fully apply their
pre-immigration human capital.
Employment paths are presented separately for those with and without work
experience prior to immigrating. For the immigrants without work experience we
examine their transition into employment, while for immigrants who had worked prior to
immigrating we examine three outcomes: not employed at the time of the interview,12
The employment paths of immigrants who had work experience prior to
immigrating are shown in the bottom half of Figures 1a and 1b. Looking at males in
Figure 1a, around 40 percent were not employed at the time of the first interview. This is
slightly lower than that found for the sample who had never worked prior to immigrating.
The employment rates of the male immigrants with and without pre-immigration work
experience converge over the four-year period and the gap decreases from 12 percentage
points six months after landing to six percentage points four years after landing. Only a
employed but in an occupation other than the one performed in the source country, and
matching the source and host country main occupation. The results displayed are for 25
occupation groupings; groupings of 10, 47, and 139 had similar results, although as the
grouping becomes more precise there is a lower proportion of occupational matches.
For males, only 3 percent of the sample reported having never worked prior to
immigrating, in contrast to about 20 percent for females. By six months after landing
around half of the males, and 20 percent of the females, were employed. By four years
after landing, almost 77 percent of the males were employed. For females, this was much
lower, at 40 percent.
country occupations are very similar to those presented.

19
small proportion of the males were employed in their source country occupation. This
increases from 18 percent six months after landing to 27 percent four years after landing.
However, looking only at the employed workers, the proportion stays roughly constant
with a little over 30 percent of employed workers successfully matching.
Figure 1a: Sequential Path of Occupational Outcomes of Males
A higher proportion of females, seen in Figure 1b, than males who had worked
prior to landing were not employed at the time of the first interview. Again, however,
females with pre-immigration work experience were more likely to be employed than
those who had no such experience. The proportion not employed decreased steadily and
by the third cycle, only 32 percent of the females with pre-immigration work experience
were not employed, around half that of females without pre-immigration work
experience. Females also had a harder time finding employment in the occupation that
12 Besides being unemployed, the people who were not employed at the time of the interview may be in

20
they had last worked in prior to immigrating; only 10 percent were employed in their
former occupation six months after immigration, and by the third cycle, this had only
increased to 18 percent. Several explanations are possible for the higher proportion of
females not employed and their lower success in matching their pre-and post-immigration
occupations. Perhaps other family commitments, such as caring for children, reduce the
time or effort that females have to find appropriate employment. Baker and Benjamin
(1997) posit that a new immigrant family investment strategy may explain some of this
difference. Further, there may be a larger gap between the end of their last job in the
source country and the time of immigration. Since we do not know when the employment
in the source country occupation occurred, it is not possible to investigate this.
Figure 1b: Sequential Path of Occupational Outcomes of Females
school or in language training.

21
While immigrants have difficulty obtaining returns to their foreign work
experience, one possibility that has received little attention and that might explain some
of this could be that immigrants may be choosing to switch occupations upon
immigrating. In Table 1b, the proportion of people whose source country occupation does
not match their intended occupation by high- and low-skill level groupings is displayed
for immigrants who had a codeable intended occupation variable. A sizeable proportion
of workers wanted to switch occupations when they immigrated, and a large proportion
of the switchers wanted to move to an occupation in a different skill level. For males who
performed a high-skilled occupation before immigration, 30 percent wanted to switch
occupations when they came to Canada. Of this group, only 75 percent wanted to move to
another high-skilled occupation. Thirty-three percent of females whose last job was a
high-skilled occupation wanted to switch, and 39 percent of these switchers wanted to
move to a low-skilled occupation. For both males and females, a much higher proportion
of low-skilled workers desired to switch occupations when they came to Canada (55 and
49 percent respectively), and most of these switchers wanted to move to a high-skilled
occupation. All together, this suggests that intended occupation is not necessarily a
sufficient statistic for Canadian occupational skills.
Table 1b: Match between source country and intended occupation Males Females Source Country Occupation No Match Switch to
High Skill No Match Switch to
High Skill High Skill 30 75 33 61 Low Skill 55 73 49 64 Notes: Calculated for workers who responded to and had a codeable intended occupation.
While it would be useful to examine the occupational match transitions shown in
Figures 1a and 1b to include the information on intended occupation, as previously
discussed, 28 percent of males and 42 percent of females, for various reasons, have

22
missing information on intended occupation and this variable is less well coded.
Therefore, for finer comparisons, measurement error becomes a more serious concern.
However, there is a separate question that was answered by all Skilled Worker Principal
Applicants regarding their intended occupation in the Citizenship and Immigration
Canada (CIC) administrative records. Figure 2, therefore, presents information for Skilled
Worker Principal Applicants, all of whom must have worked previously. Unfortunately,
the female sample is too small to be presented. This analysis allows the key group that is
selected specifically on economic criteria to be examined.
A very large proportion, 38 percent, of the male Skilled Worker Principal
Applicants indicated they wanted to switch occupations when they came to Canada.
Given the wording of the question, this may actually under-count the number of people
who wanted to switch. A very similar proportion of switchers and non-switchers are not
employed at the time of the interview in each of the three cycles.
Surprisingly, immigrants who indicated they wanted to switch occupations were
more likely to match their main occupation post-immigration with their source country
occupation. At four years after landing, almost half those who indicated a desire to switch
occupations were employed not in their intended occupation, but in their final source
country occupation. This compares to only 39 percent of those who indicated they did not
want to change occupations when they came to Canada. Another intriguing result is that
only a very small percentage of workers who indicated an aspiration to switch
occupations at the time of landing ended up working in their intended occupation. After
the first six months since landing, a little less than 10 percent were working in their
intended occupation, and by the third cycle this had increased to just a little less than 20

23
percent. Intended occupation at the time of immigration does not appear to provide much
information regarding the occupational outcomes in the host country.
Figure 2: Sequential Path of Occupational Outcomes of Male Skilled Worker Principal Applicants
4. Regression Analysis
4.1 Returns to Having any Source Country Work Experience
Prior to examining the earning differential between workers who do, and do not,
match their source and host country occupations, we examine that gap as a function of
having ever had any pre-immigration employment experience. A large amount of
research finds that for recent cohorts, immigrants receive no, or even negative, economic
return to their years of foreign work experience (see Schaafsma and Sweetman 2001;
Aydemir and Skuterud 2005; and Warman 2007b), but it is not known what relationship

24
having any prior foreign work experience has on earnings. We examine this and estimate
the following least squares equation:
(3) ln yi = β1Xi + β2Everworkedi + ei
where Everworkedi is equal to one if immigrants indicated they worked prior to
immigrating.13
Another very interesting finding is that language ability had a very strong
influence on employment outcomes for both males and females, but only a limited impact
on earnings. This may occur since immigrants with strong language ability find
employment and those with weaker language ability do not; therefore, the variance in
language ability is less in the earnings sample than in the employment one. In other
regressions that are not shown, we find that the interaction between age and having ever
The matrix Xi contains the same variables as in equation (1), in addition to
controls for years of schooling and immigrant class. Unlike the sample for the other
regressions, here we include immigrants who had never worked prior to immigration in
the analysis. However, we do not include Skilled Worker Principal Applicants for this
part of the analysis since under the point system they are required to have a full year of
paid work, and we drop Business and Provincial Nominee Principal Applicants for
similar reasons. Using a probit regression, we also estimate similar regressions looking at
the effect of having ever worked on the probability of employment.
As seen in Table 2a, for males there is no statistically significant difference in
earnings or employment rates between immigrants according to their having worked prior
to immigrating. Conversely, Table 3b shows females with prior employment having a
higher probability of employment and enjoying higher earnings.
13 We present the results for cycle 3, but the results for cycle 1 and 2 are available from the authors.
25
worked is statistically significant and negative for the earning regressions for females, but
not for males.
4.2 Returns to Foreign Human Capital and Occupational Match
In the preliminary regressions presented in columns (1) and (2) of Tables 3a and
3b, we examine the returns to schooling and potential foreign work experience for those
who had worked prior to immigrating and find the same empirical regularity that has
been observed previously. Source country work experience does not benefit immigrants
of either sex. In fact, in our sample, which is unique in being comprised exclusively of
new immigrants, earnings decrease with years of potential foreign work experience.14
14 Warman (2007b) found similar negative returns to experience for potential foreign work experience for recently landed male immigrants using the 1991, 1996 and 2001 Canadian Census Data.
Possibly, the lack of return to source-country work experience may be due to
measurement error, or other issues, associated with the potential experience variable
previously discussed and potentially more prevalent for some groups than others. We
investigate this further by running the same models as in Tables 4a and 4b, but for
various sub-samples. We looked at several (sometimes endogenous) sub-samples,
including: university educated, Skilled Worker Principal Applicants, high-skilled
occupation in the source country, worked in all 3 cycles, living only in Montreal, Toronto
and Vancouver, matched source and intended occupation, Business or Management
occupation in the sending country, Western source countries, Asian source countries,
aged 25 to 40 at the time of immigration, and strong English language ability. Only the
sample of male immigrants from Western countries provides some evidence of positive
returns to potential foreign work experience; otherwise we find negative returns or no
returns.

26
Looking at another measure of human capital, there is a positive relationship
between years of schooling and earnings. However, in contrast to much of the domestic
research literature, the returns are greater for males than females. When we add further
controls in column 2, the impact of schooling is greatly reduced, and is no longer
statistically significant for females. The variable driving this result is language ability,
which, consistent with previous findings, is a strong determinant of earnings.15 When
language ability controls are removed, the coefficient on schooling is similar to those in
column 1. The return to schooling is modest and lower than that found for the 1995-1999
cohort by Aydemir and Skuterud (2005) who, in looking at all immigrants using the
census, find that the returns to foreign schooling are around six and seven percent for
males and females respectively.16
We next look to see whether matching the source country occupation with the
main one in Canada has any relationship to earnings. For both males and females,
obtaining employment in a job related to the immigrant’s previous work experience has a
large positive impact on earnings. In columns (3) and (4) of Tables 3a and 3b, 24 source-
country-occupation dummy variables (with one omitted group) are included. We also
look at 10, 47, and 139 occupation groupings and find that the coefficient on the match
variable becomes slightly larger as the occupation grouping narrows.
One possible explanation for the lower returns to
schooling found here is that studies using census data use year of immigration to identify
foreign schooling so those measures of foreign schooling contain some domestic
schooling, whereas we have a direct measure for foreign schooling.
17
15 For example, see Dustmann and van Soest (2002) and Chiswick and Miller (1995). See Warman (2007a) for a discussion of the acquisition of host country language ability. 16 We also reran the results including an interaction term between years of schooling and experience but do not find any relationship.
17 This coefficient may be biased downward in the later cycles if workers obtain a match in an earlier cycle and then progress to another occupation. We re-estimated results of columns (3) and (4) of Tables 3a and
27
While a successful match appears to have a large impact on earnings, it is
probable that matching is non-random since immigrants with more valuable unobserved
ability are likely more successful in matching their source country occupation with their
Canadian one. If this is true, the coefficient on the match indicator is biased upwards.
Even after controlling for language ability, we still find a large positive impact of a
successful match on earnings.
Potentially, the failure of recent immigrants to obtain any return to their years of
foreign work experience may be due to an inability to find similar work in the host
country. We investigate this by interacting the match dummy with years of potential
foreign work experience (see columns (5) and (6) of Tables 3a and 3b). Surprisingly, a
successful match does not appear to have any impact on the return to potential foreign
work experience in most of the specifications for either males or females.18
3b looking at whether the immigrant had ever matched and find that the “ever match” indicator is similar in magnitude to what is presented in Tables 3a and 3b. 18 We do find some evidence that the return to foreign work experience is higher for successful matchers when we look at narrower occupational coding. However, rather than obtaining negative returns, zero returns are obtained.
As previously
mentioned, we do not know the tenure of the job in the source country, so it is possible
that the last job performed prior to immigrating was of short duration. Further, potential
foreign experience may give a poor measure of actual foreign experience. However, we
would also expect the coefficient on the match and experience interaction to be biased
upwards since immigrants with higher quality work experience might well be better able
to match their source and host country occupations. Therefore, the finding of no return to
potential foreign work experience for those who match is somewhat surprising, but
provides further evidence that years of foreign work experience do not provide any
benefit for recent immigrants.

28
Crucially, when we include an interaction term between the match indicator and
the foreign schooling variable, immigrants who obtain a match between the source and
host country occupations have larger returns to foreign schooling for both males and
females (see columns (5) and (6) of Tables 3a and 3b). In some specifications, only
immigrants who successfully match obtain any return to schooling at all. Matching
appears to enable workers to transfer their pre-Canadian educational training, which is
consistent with the idea that source country educational training is related to source
country occupation.
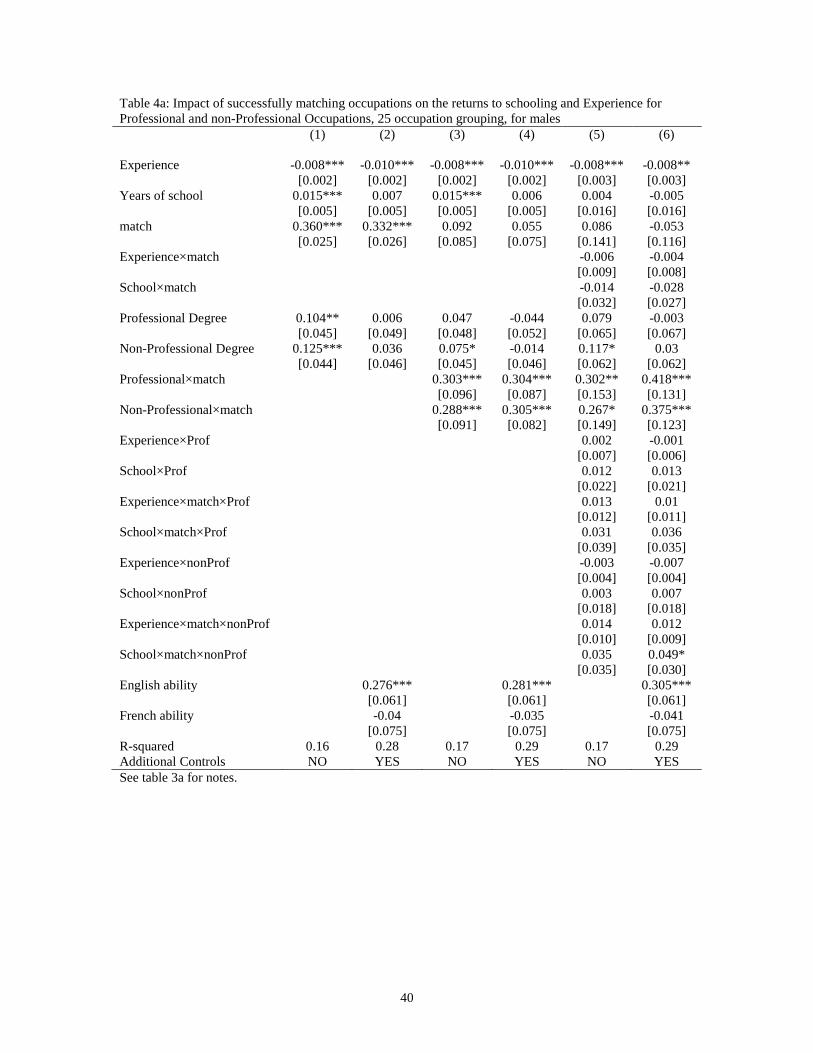
We next investigate how the return to obtaining a successful match is affected by
the type of training the worker has. We look at three groups, those with a professional
degree, those with a non-professional degree and those with no post secondary degree
(default group).19 First, looking at the returns to the different degrees, in the third cycle
(see columns (1) and (2) of Table 4a for males and 4b for females) workers with a non-
professional degree or a professional degree have higher earnings than workers with no
post secondary degree.20
In columns (3) and (4) of Tables 4a and 4b, the professional and non-professional
dummies are interacted with the match indicator. Post-secondary degree holders in
professional and non-professional occupations receive a higher return to a match than
workers without such qualifications. For males, the return to a match is very similar for
professional and non-professional degree holders, and we cannot reject the equality of the
returns using an F-test. For females, professional degree holders obtain a higher return to
However, once additional variables are controlled for, this
earnings differential disappears.
19 We specify a professional degree as those with an engineering degree or a degree in a health professions, science and technologies. 20 Using an F-test, the equality of the professional and non-professional coefficients is rejected at the 10 percent level (p =.09) for females, but we cannot reject the equality for males.

29
a successful match than do workers with a non-professional degree and the equality of the
coefficients is rejected at either the one- or five-percent level. In columns (5) and (6) of
Tables 4a and 4b, the experience and years of schooling variables are fully interacted
with the match and professional and non-professional dummies. Again, we find a higher
return for a match for workers who hold a professional or non-professional degree. For
females, a successful occupational match matters for the return to schooling for workers
with either a professional degree or a non-professional degree.
4.3 Regulated versus Non-Regulated Occupations
Plausibly, immigrants who have their work experience in occupations that are
regulated or licensed in Canada are likely to experience more difficulty transferring their
foreign acquired human capital. We take two approaches to examining this issue. First,
we look at the return to a match for workers who indicated they have a professional or
technical credential earned outside Canada for a job that requires licensing. Secondly, we
look at these workers’ jobs in the source country to see if that occupation is regulated or
licensed in Canada using information from a list of regulated occupations.21
Possibly, immigrants upon first arriving may not have accurate information on
which occupations are regulated in Canada.22 We therefore use Canadian federal
administrative information on whether their final source country occupation is regulated.
Perhaps surprisingly, using the first approach we find that successfully matching
source and host country occupations does not provide any additional earnings benefit (see
columns (1) and (2) of Table 5 for males and columns (5) and (6) for females). When we
interact the license and match indicators with the experience and schooling variables, we
do not find much effect either (see columns (3), (4), (7) and (8) of Table 5).

30
Additionally, for males we also identify workers in Red Seal occupations or trades for
which Canadian provinces have established a set of criteria for employment access.23
To this point our paper examines the return to a match between the source country
occupation and the main occupation performed in Canada. As shown in Figure 2 and
Table 1b, a large proportion of immigrants do not wish to work in the same occupation as
they did in the source country. We use the additional information available on all Skilled
For
females, there are too few observations in the Red Seal occupations for meaningful
analysis, so we do not identify them separately from non-regulated occupations.
In columns (1) and (2) of Tables 6a and 6b, we include the Regulated indicator
variable, and in the models for males, a Red Seal indicator (RED). For the most part,
workers in Regulated or RED occupations have lower earnings or the coefficients are not
statistically significant. When we interact the match dummy with the regulated and RED
dummies (see columns (3) and (4) of Tables 6a and 6b), we find a successful match is
very important for workers in regulated occupations, especially for females. For the male
workers in RED occupations, the return to a match is actually lower in the first six
months after landing (results not shown), while after that, there is no statistically
significant difference. When we fully interact the match and regulated (and RED for
males) dummies with the experience and schooling variables, there is little effect (see
columns (5) and (6) of Tables 6a and 6b). However, we do find that the return to
experience is higher for males in RED occupations (although instead of having negative
returns to experience, the returns are zero, and only for non-matchers).
4.4 Source, Intended and Host Country Occupational Matches for Male Skilled Worker Principal Applicants
21 We classify the occupation as regulated if it is regulated in any province in Canada. 22 The question is asked in the first interview (around six months after landing).

31
Worker Principal Applicants regarding intended occupation. In all previous regressions
we examine only the match between the source country occupation and main one in
Canada, regardless of the (usually unknown) intended occupation. Here, in equation (5)
we define five exhaustive and mutually exclusive matches between occupations in the
source country (S), intended (I), and main (M) job in Canada. First, we have the match
between the source country occupation and the main occupation in Canada and no match
between the intended and either the source country or main occupation (MatchSM). Next
we have a match between the source country and intended (MatchSI), the intended and
main (MatchIM), and a match between source country, intended and main occupations
(MatchSIM). The default group is workers who intended to switch but did not match
either their intended or source country occupations with their main occupation. Given the
small number of female Skilled Worker Principal Applicants, we restrict the analysis
presented to males.
As seen in columns (1) and (2) of Table 7, any type of successful match yields a high
return. If the worker wanted to switch occupations and ended up in the source country
occupation (MatchSM), or if the worker wanted to switch occupations and ended up in
their intended occupation (MatchIM), or if the worker wanted to stay in their source
country occupation and was successful in matching (MatchSIM), they have similar
returns to a match. Using an F-test, we cannot reject the equality of the MatchSM and
MatchSIM and MatchSIM coefficients.24
23 Examples of Red Seal occupations include: carpenters, cooks, roofers and welders.
If an immigrant wanted to work in the same
occupation as in the source country, but was unsuccessful in obtaining a match
iii
iiiii
MatchSIMMatchIM
MatchSIMatchSMSchoolExpY
εββ
ββββ
++
++++=
76
5431
)5(

32
(MatchSI), then on average he has lower earnings than if he wanted to switch occupations
and did not end up working in either his source country occupation or his intended
occupation.
We next investigate, focussing on experience and education, how the return to
human capital varies as a function of the match. First, we look at the return to schooling
(see columns (3) and (4) of Table 7). Overall, results are mixed. Workers who intended to
work in the same occupation as in the source country but fail to match, have a large
negative return to schooling in the first six months (results not shown). However, this
negative return disappears after six months, likely because they are able to move into
occupations that better line up with their formal training. There is some evidence that
workers who match their intended and main occupations have a higher return to
schooling, regardless of whether they switched occupations from what they had done in
the source country. Workers who successfully switch into their intended occupation have
large positive returns in cycles 1 and 2 (not shown), but no additional returns in cycle 3,
while workers who did not intend to switch and successfully matched have higher returns
in cycles 1 and 3. Second, we interact the match indicators with the experience variables,
but find no return to experience regardless of the type of match.25
However, they strongly
suggest that obtaining an occupational match does not increase the rate of return to
foreign experience, or, at least, does not increase it sufficiently for observation in this size
sample. Therefore, the maximum size of any increase is quite modest.
24 We find very similar results for females.

33
Conclusion
Immigrant labour market outcomes have declined and many are undesirably low
in many immigrant-receiving countries, and the limited portability of foreign human
capital acquired prior to immigration is one of the main contributing factors to these poor
earning outcomes. Using information provided in a unique Canadian data set that
identifies source country occupations of immigrants, we expand on previous literature by
examining the implications of a successful match of source and host country occupations.
Employment earnings are the key focus, and we look at how a successful match affects
the returns to foreign acquired schooling and potential foreign work experience.
First estimating a standard earnings equation, consistent with previous research
we find that recent immigrants do not obtain any return to their years of potential foreign
work experience. This is true even after we rerun the results for several different groups
that should have more stable and higher quality foreign work experience. Surprisingly,
even immigrants who obtain a successful match between their source country and host
country occupations do not obtain any return to those years of experience.
We do find that immigrants obtain a moderate return to their years of foreign
schooling. Successful matchers receive a large return to foreign schooling, and, in some
specifications, only immigrants who successfully match their source and host country
occupations obtain any return to their foreign schooling.
Regardless of the specification, we find that immigrants who successfully match
their source and host country occupations obtain much higher earnings. Further, we find
that English language ability has a very large positive influence on earning outcomes for
almost every specification.
25 We do find positive returns to experience for those that match their intended and main host country occupation.

34
Using additional information on the intended occupation from government
records that all Skilled Worker Principal Applicants answered, we examine various
combinations of source, intended and host country occupational matches. Looking at
who matches, we find that male Skilled Worker Principal Applicants who wanted to
switch occupations when they immigrated were very unlikely to end up in their intended
occupation. Rather, they were much more likely to work in the same occupation as in the
source country, and were even more likely to match the source and host country
occupations than those who indicated they did not want to switch occupations. Regardless
if they match their source and host country occupation, or their intended and host country
occupation, they obtain similar returns to a match.

35
References: Altonji, Joseph and Nicolas Williams (1998) “The Effects of Labor Market Experience, Job Seniority, and Job Mobility on Wage Growth.” Research in Labor Economics 17. Aydemir, Adburrahman and Christopher Robinson (2008) “Return and Onward Migration among Working Age Men.” Canadian Journal of Economics 41:4, 1285-1311. Aydemir, Adburrahman and Mikal Skuterud (2005) “Explaining the Deteriorating Entry Earnings of Canada’s Immigrant Cohorts: 1966-2000.” Canadian Journal of Economics 38:2, 641-671. Aydemir, Adburrahman and Mikal Skuterud (2008) “The Immigrant Wage Differential Within and Across Establishments.” Industrial and Labor Relations Review 41:4, 1285-1311. Baker, Michael and Dwayne Benjamin (1997) “The Role of the Family in Immigrants' Labor Market Activity: An Evaluation of Alternative Explanations.” American Economic Review 87, 705–727. Baker, Michael, and Dwayne Benjamin (1994) “The Performance of Immigrants in the Canadian Labour Market.” Journal of Labor Economics 12, 369-405. Bloom, D.E., G. Grenier, and M. Gunderson (1995) “The Changing Labour Market Position of Canadian Immigrants.” Canadian Journal of Economics 28, 987-1005. Borjas, George J. (1985) “Assimilation, Change in Cohort Quality, and the Earnings of Immigrants.” Journal of Labor Economics 3, 463-89. Borjas, George J. (1995) “Assimilation and Changes in Cohort Quality Revisited: What Happened to Immigrant Earnings in the 1980s?” Journal of Labor Economics 13:2, 201-45. Chiswick, B. and W. Miller (1995) “The Endogeneity Between Language and Earnings: International Analyses.” Journal of Labor Economics 13:2, 246-87. De Silva, Arnold (1997) “Immigration Participation in Unemployment Insurance System.” Canadian Public Policy 23, 375-397. Dustmann, C. and A. van Soest (2002) “Language and the Earnings of Immigrants.” Industrial and Labor Relations Review 55:3, 473-92. Ferrer, Ana and Craig Riddell (2008) “Education, Credentials and Immigrant Earnings.” Canadian Journal of Economics 41:1, 186-216. Ferrer, Ana, David A. Green and W.Craig Riddell (2006) “The Effect of Literacy on Immigrant Earnings.” Journal of Human Resources 41:2, 380–410.

36
Frenette, Marc and Rene Morissette (2005) “Will They Ever Converge? Earnings of Immigrant and Canadian-Born Workers over the Last Two Decades.” International Migration Review 39(1): 228-257. Friedberg, Rachel M. (2000) “You Can’t Take it with You? Immigrant Assimilation and the Portability of Human Capital.” Journal of Labor Economics 18:2, 221–51. Grant, Mary L. (1999) “Evidence of New Immigrant Assimilation in Canada.” Canadian Journal of Economics 32:4, 930-955. Green, David A. (1999) “Immigrant Occupational Attainment: Assimilation and Mobility over Time.” Journal of Labor Economics 17:1, 49-79. Green, David A. and Christopher Worswick (2004) “Immigrant Earnings Profiles in the Presence of Human Capital Investment: Measuring Cohort and Macro Effects.” Mimeo. Hotchkiss, Lawrence (1993) “Effects of Training, Occupation, and Training-Occupation Match on Wage.” Journal of Human Resources 28:3, 482-96. Hum, Derek and Wayne Simpson (2004) “Reinterpreting the Performance of Immigrant Wages from Panel Data.” Empirical Economics 29, 129-147. Kambourov, Gueorgui and Manovskii, Iourii (2009) “Occupational Specificity of Human Capital.” International Economic Review 50:1, 63-115. Kuhn Peter J. and Arthur Sweetman (1999) “Vulnerable Seniors: Unions, Tenure and Wages Following Permanent Job Loss.” Journal of Labor Economics 17, 671-93. Lubotsky, Darren (2007) “Chutes or Ladders? A Longitudinal Analysis of Immigrant Earnings” Journal of Political Economy 115:5, 820-867. McCall, Brian “Occupational Matching: A Test of Sorts.” Journal of Political Economy 98:1, 45-69. McDonald, James Ted and Christopher Worswick (1998) “The Earnings of Immigrant Men in Canada: Job Tenure, Cohort, and Macroeconomic Conditions.” Industrial and Labor Relations Review 51, 465-482. Parent, Daniel (2000) “Industry-Specific Capital and the Wage Profile: Evidence from the National Longitudinal Survey of Youth and the Panel Study of Income Dynamics.” Journal of Labor Economics 18(2), 306-23. Pescarus, Cristiana and Mohsen Bouaissa (2007) “Is immigrants human capital under utilized on the Canadian labour market.” Presented at the First Annual CLSRN Conference June 14-15 2007.

37
Picot, Garnett, Feng Hou and Simon Coulombe (2007) “Chronic Low Income and Low-income Dynamics Among Recent Immigrants.” Statistics Canada, Analytical Studies Research Paper No. 294. Shaw, K (1984) “A Formulation of the Earnings Function using the Concept of Occupation Investment.” Journal of Human Resources 14, 319-40. ----- (1987) “Occupational Change, Employer Change, and the Transferability of Skills.” Southern Economic Journal 53, 702-19. Schaafsma, Joseph and Arthur Sweetman (2001) “Immigrant Earnings: Age at Immigration Matters.” Canadian Journal of Economics 34, 1066-99 Statistics Canada (2007) “Microdata User Guide Longitudinal Survey of Immigrants to Canada” http://www.statcan.ca/english/sdds/document/4422_D1_T1_V3_E.pdf Topel R. H. (1991) “Specific Capital, Mobility, and Wages: Wages Rise with Job Seniority.” Journal of Political Economy 99:1, 145-76. Warman, Casey and Christopher Worswick (2004) “Immigrant Earnings Performance in Canadian Cities: 1981 Through 2001.” Canadian Journal of Urban Research 13:1, 62-84. Warman, Casey (2007a) “Ethnic Enclaves and Immigrant Earnings Growth.” Canadian Journal of Economics
Warman, Casey (2007b) “You Can Take it with You! The Returns to Foreign Human
40:2, 401-422.
Capital of Male Temporary Foreign Workers.” Queen’s Economics Department Working Paper No. 1125. Weiss, Y., R. Sauer and M. Gotlibovski (2003) “Immigration, Search and Loss of Skill.” Journal of Labor Economics, 21:3, 557-91.

38
Table 2a: Relationship between ever working prior to immigrating and weekly earnings and employment at the time of the survey, for males four years after landing (1) (2) (3) (4) Years of school 0.011* 0.006 0.004 -0.000 [0.007] [0.006] [0.004] [0.004] Age -0.015 -0.029 0.021 0.024* [0.020] [0.020] [0.014] [0.014] Age squared 0.003 0.019 -0.033** -0.037** [0.025] [0.025] [0.017] [0.017] Ever worked 0.048 0.024 0.063 0.052 [0.084] [0.082] [0.061] [0.057] English ability 0.106 0.229*** [0.086] [0.058] French ability -0.237* 0.102 [0.125] [0.086] R-squared 0.12 0.24 0.05 0.14 Additional Controls NO YES NO YES Notes: Sample age 25-59 at six months after landing and has positive earnings in the survey period. Sample excludes Skilled Worker Principal Applicants, Business Immigrant Principal Applicants and Provincial Nominee Principal Applicants. All regressions also control for months since migration and class of immigration. In addition, for columns 2 and 4 there are controls for region of origin dummies (US/Western Europe/Australia/NZ (default), Central/South America, Eastern Europe, Southern Europe, Africa, Middle East, East Asia, South/East Asia, South Asia), region of residence dummies (Atlantic provinces, Quebec, Montreal, Ontario, Toronto (default), Western province, BC, Vancouver), English and French language ability, marital status dummies (single previously married (default), married/common law, single never married) and number of children aged less than 18 years in household. Robust standard errors in brackets. * significant at 10%; ** significant at 5%; *** significant at 1% Table 2b: Relationship between ever working prior to immigrating and weekly earnings and employment at the time of the survey, for females four years after landing (1) (2) (3) (4) Years of school 0.013** 0.000 0.009*** -0.008** [0.006] [0.006] [0.003] [0.004] Age -0.043** -0.023 0.031** 0.049*** [0.019] [0.020] [0.013] [0.014] Age squared 0.046* 0.017 -0.044*** -0.071*** [0.024] [0.025] [0.016] [0.018] Ever worked 0.227*** 0.237*** 0.210*** 0.126*** [0.048] [0.057] [0.028] [0.032] English ability 0.280*** 0.478*** [0.089] [0.062] French ability 0.299** 0.290*** [0.131] [0.092] R-squared 0.07 0.12 0.06 0.14 Additional Controls NO YES NO YES See Table 2 for notes.

39
Table 3a: Impact of successfully matching occupations on the returns to schooling and Experience, 25 occupation grouping, for males (1) (2) (3) (4) (5) (6) Experience -0.011*** -0.011*** -0.009*** -0.010*** -0.010*** -0.011*** [0.002] [0.002] [0.002] [0.002] [0.002] [0.002] Years of school 0.024*** 0.012** 0.022*** 0.008* 0.015*** 0.000 [0.005] [0.005] [0.004] [0.005] [0.005] [0.006] match 0.362*** 0.332*** 0.322*** 0.291*** [0.025] [0.026] [0.029] [0.030] Experience×match 0.003 0.004 [0.004] [0.004] School×match 0.025*** 0.026*** [0.009] [0.009] English ability 0.397*** 0.280*** 0.291*** [0.062] [0.060] [0.060] French ability -0.041 -0.038 -0.032 [0.079] [0.074] [0.074] R-squared 0.07 0.18 0.16 0.28 0.16 0.28 Additional Controls NO YES NO YES NO YES Notes: Sample age 25-59 at six months after landing. Sample restricted to people who had worked prior to immigrating to Canada. All regressions also control for months since migration and class of immigration. In addition, for columns 2 and 4 there are controls for region of origin dummies (US/Western Europe/Australia/NZ (default), Central/South America, Eastern Europe, Southern Europe, Africa, Middle East, East Asia, South/East Asia, South Asia), region of residence dummies (Atlantic provinces, Quebec, Montreal, Ontario, Toronto (default), Western province, BC, Vancouver), English and French language ability, marital status dummies (single previously married (default), married/common law, single never married) and number of children aged less than 18 years in household. Robust standard errors in brackets. * significant at 10%; ** significant at 5%; *** significant at 1% Table 3b: Impact of successfully matching occupations on the returns to schooling and Experience, 25 occupation grouping, for females (1) (2) (3) (4) (5) (6) Experience -0.009*** -0.008*** -0.008*** -0.008*** -0.009*** -0.010*** [0.003] [0.003] [0.002] [0.002] [0.003] [0.003] Years of school 0.028*** 0.013 0.025*** 0.004 0.016** -0.008 [0.008] [0.008] [0.007] [0.008] [0.008] [0.008] match 0.411*** 0.380*** 0.383*** 0.335*** [0.042] [0.045] [0.041] [0.044] Experience×match 0.006 0.007 [0.006] [0.006] School×match 0.032** 0.044*** [0.016] [0.015] English ability 0.556*** 0.499*** 0.509*** [0.090] [0.088] [0.087] French ability 0.263** 0.370*** 0.375*** [0.114] [0.104] [0.104] R-squared 0.04 0.11 0.11 0.22 0.12 0.22 Additional Controls NO YES NO YES NO YES See Table 3a for notes.
40
Table 4a: Impact of successfully matching occupations on the returns to schooling and Experience for Professional and non-Professional Occupations, 25 occupation grouping, for males (1) (2) (3) (4) (5) (6) Experience -0.008*** -0.010*** -0.008*** -0.010*** -0.008*** -0.008** [0.002] [0.002] [0.002] [0.002] [0.003] [0.003] Years of school 0.015*** 0.007 0.015*** 0.006 0.004 -0.005 [0.005] [0.005] [0.005] [0.005] [0.016] [0.016] match 0.360*** 0.332*** 0.092 0.055 0.086 -0.053 [0.025] [0.026] [0.085] [0.075] [0.141] [0.116] Experience×match -0.006 -0.004 [0.009] [0.008] School×match -0.014 -0.028 [0.032] [0.027] Professional Degree 0.104** 0.006 0.047 -0.044 0.079 -0.003 [0.045] [0.049] [0.048] [0.052] [0.065] [0.067] Non-Professional Degree 0.125*** 0.036 0.075* -0.014 0.117* 0.03 [0.044] [0.046] [0.045] [0.046] [0.062] [0.062] Professional×match 0.303*** 0.304*** 0.302** 0.418*** [0.096] [0.087] [0.153] [0.131] Non-Professional×match 0.288*** 0.305*** 0.267* 0.375*** [0.091] [0.082] [0.149] [0.123] Experience×Prof 0.002 -0.001 [0.007] [0.006] School×Prof 0.012 0.013 [0.022] [0.021] Experience×match×Prof 0.013 0.01 [0.012] [0.011] School×match×Prof 0.031 0.036 [0.039] [0.035] Experience×nonProf -0.003 -0.007 [0.004] [0.004] School×nonProf 0.003 0.007 [0.018] [0.018] Experience×match×nonProf 0.014 0.012 [0.010] [0.009] School×match×nonProf 0.035 0.049* [0.035] [0.030] English ability 0.276*** 0.281*** 0.305*** [0.061] [0.061] [0.061] French ability -0.04 -0.035 -0.041 [0.075] [0.075] [0.075] R-squared 0.16 0.28 0.17 0.29 0.17 0.29 Additional Controls NO YES NO YES NO YES See table 3a for notes.

41
Table 4b: Impact of successfully matching occupations on the returns to schooling and Experience for Professional and non-Professional Occupations, 25 occupation grouping, for females (1) (2) (3) (4) (5) (6) Experience -0.008*** -0.008*** -0.008*** -0.008*** -0.001 -0.008 [0.002] [0.002] [0.002] [0.002] [0.005] [0.005] Years of school 0.017* 0.002 0.015* 0.000 0.060*** 0.017 [0.009] [0.009] [0.009] [0.009] [0.019] [0.022] match 0.402*** 0.379*** 0.110 0.076 -0.385*** -0.358*** [0.043] [0.045] [0.076] [0.079] [0.114] [0.121] Experience×match -0.006 -0.004 [0.008] [0.008] School×match -0.118*** -0.102*** [0.028] [0.030] Professional Degree 0.174** 0.071 0.063 -0.043 -0.013 -0.022 [0.069] [0.073] [0.076] [0.080] [0.087] [0.092] Non-Professional Degree 0.095* 0.038 0.057 0.006 -0.053 -0.041 [0.057] [0.058] [0.057] [0.058] [0.069] [0.070] Professional×match 0.478*** 0.506*** 0.950*** 0.851*** [0.112] [0.113] [0.152] [0.157] Non-Professional×match 0.267*** 0.271*** 0.666*** 0.591*** [0.095] [0.095] [0.132] [0.137] Experience×Prof -0.009 -0.002 [0.009] [0.009] School×Prof -0.067** -0.058* [0.031] [0.034] Experience×match×Prof 0.014 0.017 [0.019] [0.017] School×match×Prof 0.142*** 0.162*** [0.051] [0.050] Experience×nonProf -0.009* 0.000 [0.006] [0.006] School×nonProf -0.055** -0.026 [0.022] [0.024] Experience×match×nonProf 0.011 0.008 [0.011] [0.011] School×match×nonProf 0.179*** 0.169*** [0.037] [0.038] English ability 0.497*** 0.505*** 0.525*** [0.088] [0.088] [0.088] French ability 0.370*** 0.375*** 0.382*** [0.104] [0.104] [0.104] R-squared 0.12 0.22 0.12 0.23 0.14 0.24 Additional Controls NO YES NO YES NO YES See table 3a for notes.

42
Table 5: Impact of successfully matching occupations on the returns to schooling and Experience for licensed and non-licensed Occupations, 25 occupation grouping (1) (2) (3) (4) (5) (6) (7) (8) Males Females Experience -0.009** -0.010*** -0.011*** -0.013*** -0.008*** -0.008*** -0.009*** -0.009*** [0.003] [0.003] [0.004] [0.004] [0.002] [0.002] [0.002] [0.003] Years of school 0.022*** 0.008 0.011 -0.003 0.024*** 0.003 0.007 -0.015* [0.004] [0.005] [0.007] [0.007] [0.008] [0.008] [0.009] [0.009] Match 0.365*** 0.339*** 0.327*** 0.305*** 0.445*** 0.420*** 0.415*** 0.377*** [0.043] [0.039] [0.041] [0.034] [0.058] [0.053] [0.058] [0.056] Experience×match 0.006 0.006 0.007 0.009 [0.005] [0.006] [0.008] [0.007] School × match 0.029** 0.026** 0.040** 0.051*** [0.011] [0.011] [0.020] [0.019] License 0.019 0.035 -0.005 0.021 0.171*** 0.181*** 0.102* 0.122** [0.042] [0.032] [0.046] [0.032] [0.040] [0.043] [0.061] [0.051] License × match25 -0.016 -0.033 -0.043 -0.123* -0.151 -0.179* -0.255 -0.291* [0.054] [0.042] [0.086] [0.064] [0.116] [0.103] [0.165] [0.150] Experience × license 0.008** 0.008* -0.003 -0.006 [0.004] [0.004] [0.006] [0.005] school × license 0.020* 0.014 0.045** 0.033* [0.011] [0.010] [0.022] [0.019] Experience×license×match -0.015 -0.014 -0.019 -0.022 [0.010] [0.009] [0.016] [0.016] school×license×match -0.012 0.016 -0.026 -0.03 [0.030] [0.022] [0.040] [0.036] English ability 0.277*** 0.295*** 0.488*** 0.498*** [0.062] [0.063] [0.091] [0.089] French ability -0.038 -0.035 0.361*** 0.354** [0.099] [0.096] [0.136] [0.137] R-squared 0.16 0.28 0.17 0.29 0.12 0.23 0.14 0.24 Additional Controls NO YES NO YES NO YES NO YES See table 3a for notes.

43
Table 6a: Regulated dummies fully interacted with experience and years of school variables, Males (1) (2) (3) (4) (5) (6) Experience -0.009*** -0.010*** -0.009*** -0.010*** -0.011*** -0.013*** [0.002] [0.002] [0.002] [0.002] [0.002] [0.003] Years of school 0.022*** 0.008* 0.022*** 0.009* 0.014** -0.001 [0.005] [0.005] [0.005] [0.005] [0.006] [0.007] Match 0.365*** 0.329*** 0.319*** 0.264*** 0.287*** 0.236*** [0.026] [0.026] [0.035] [0.036] [0.040] [0.040] Experience×match 0.003 0.005 [0.005] [0.005] School×match 0.019 0.020* [0.012] [0.011] Regulated -0.019 -0.080*** -0.073** -0.158*** -0.056 -0.157*** [0.027] [0.031] [0.034] [0.041] [0.042] [0.047] RED -0.048 0.005 -0.001 0.046 -0.010 0.031 [0.041] [0.054] [0.050] [0.065] [0.055] [0.065] Match×Regulated 0.148*** 0.186*** 0.138* 0.161** [0.054] [0.053] [0.074] [0.073] Match×RED -0.119 -0.092 -0.079 -0.055 [0.082] [0.077] [0.089] [0.079] Experience×Regulated 0.004 0.003 [0.005] [0.005] School×Regulated -0.002 0.005 [0.016] [0.016] Exp×match×Regulated 0.002 0.000 [0.009] [0.008] School×match×Regulated 0.006 0.009 [0.024] [0.022] Experience×RED 0.010 0.013** [0.006] [0.006] School×RED 0.021 0.021 [0.021] [0.023] exp×match×RED -0.005 -0.013 [0.012] [0.009] school×match×RED -0.013 -0.010 [0.029] [0.028] English Ability 0.282*** 0.284*** 0.301*** [0.060] [0.060] [0.061] French ability -0.046 -0.030 -0.026 [0.074] [0.074] [0.074] R-squared 0.16 0.28 0.17 0.29 0.18 0.29 Additional Controls NO YES NO YES NO YES See table 3a for notes.

44
Table 6b: Regulated dummies fully interacted with experience and years of school variables, Females (1) (2) (3) (4) (5) (6) Experience -0.008*** -0.008*** -0.008*** -0.008*** -0.012*** -0.011*** [0.002] [0.002] [0.002] [0.002] [0.003] [0.003] Years of school 0.023*** 0.004 0.022*** 0.003 0.020** -0.001 [0.007] [0.008] [0.008] [0.008] [0.009] [0.009] Match 0.401*** 0.380*** 0.262*** 0.233*** 0.257*** 0.209*** [0.043] [0.045] [0.059] [0.059] [0.055] [0.056] Experience×match 0.010 0.011 [0.008] [0.007] School×match 0.027 0.043** [0.022] [0.020] Regulated 0.090** -0.004 -0.003 -0.109* 0.053 -0.039 [0.038] [0.053] [0.043] [0.057] [0.042] [0.059] Match×Regulated 0.342*** 0.358*** 0.330*** 0.345*** [0.084] [0.082] [0.091] [0.089] Experience×Regulated 0.009 0.007 [0.006] [0.006] School×Regulated -0.022 -0.026 [0.020] [0.020] Exp×match×Regulated -0.011 -0.011 [0.012] [0.011] School×match×Regulated -0.011 -0.015 [0.036] [0.033] English Ability 0.500*** 0.513*** 0.511*** [0.089] [0.089] [0.088] French ability 0.370*** 0.365*** 0.378*** [0.104] [0.103] [0.103] R-squared 0.12 0.22 0.13 0.23 0.14 0.24 Additional Controls NO YES NO YES NO YES See table 3a for notes.

45
Table 7: Male Skilled Worker Principal Applicants, Combination between matches of source country, intended occupations and main occupation in host country interacted with years of schooling, 25 Occupation grouping
Notes: Sample restricted to Skilled Worker Principal Applicants who had worked prior to immigrating to Canada. See table 3a for additional notes.
(1) (2) (3) (4) Experience -0.007** -0.010*** -0.008* -0.012** [0.003] [0.003] [0.005] [0.005] Years of school 0.014** 0.005 0.010 0.002 [0.007] [0.007] [0.010] [0.011] matchSM 0.322*** 0.268*** 0.335*** 0.264*** [0.038] [0.038] [0.056] [0.054] matchSI -0.089** -0.168*** -0.065 -0.102 [0.044] [0.049] [0.058] [0.063] matchIM 0.342*** 0.318*** 0.373*** 0.303*** [0.055] [0.056] [0.083] [0.090] matchSIM 0.363*** 0.259*** 0.263*** 0.185*** [0.042] [0.048] [0.062] [0.068] experience×matchSM 0.004 0.005 [0.007] [0.007] experience×matchSI -0.004 -0.002 [0.008] [0.008] experience×matchIM 0.01 0.008 [0.010] [0.010] experience×matchSIM 0.008 0.005 [0.008] [0.008] school×matchSM 0.001 0.008 [0.016] [0.015] school×matchSI -0.014 -0.028 [0.022] [0.022] school×matchIM 0.006 0.017 [0.024] [0.025] school×matchSIM 0.048*** 0.035** [0.019] [0.017] R-squared 0.14 0.28 0.14 0.28 Additional Controls NO YES NO YES

46
Appendix Description of the Variables Dependent Variables: Hourly Wage – Hourly wage from main job. Weekly Wage – Weekly wage from main job. Independent Variables: Experience – Years of potential foreign work experience = Age at immigration – years of
foreign work experience – 6. Years of Foreign School – Number of years of successfully completed foreign school
prior to immigrating (excluding kindergarten). Months since Migration – Number of months between migration and the interview date. Region of Birth – WEuro/US/Australia/NZ (Western Europe, United States, Australia
and New Zealand); SEAsia (Southeast Asia); EAsia (East Asia); SAsia (Southern Asia);
Region of Residence – Atlantic Provinces, Quebec (excluding Montreal), Montreal,
Ontario (excluding Toronto), Toronto (default group), Western provinces (Manitoba, Saskatchewan and Alberta), British Columbia (excluding Vancouver), Vancouver.
Age – Age at immigration. Language Ability – English and French language ability variables. Number of Children – The number of children living in the household aged less than 18. Marital Status Indicators – Three categories, Married/Common law, Single and
never married, and Single previously married (includes divorced, widowed, separated; omitted category).
Match – Successful match between last source country occupation and the main
occupation worked in Canada. matchSM – Match between source and main occupation worked in host country for
workers who intend to switch occupations when they immigrate. matchSI – Match between source and intended occupation, but no match with main
occupation worked in host country.

47
matchIM – Match between intended and main occupation worked in host country for workers who intend to switch occupations when they come to Canada.
matchSIM – Match between source, intended and main occupation worked in host
country. Professional Degree – Major field of study outside Canada was an engineering, health
professions or science and technologies degree. non-Professional Degree – Major field of study outside Canada was a mathematics and
physical sciences, educational, recreational and counselling services, fine and applied arts humanities, social sciences, commerce, management and business administration or agricultural and biological sciences and technologies degree.
License – Has a professional/technical credentials from outside Canada that a license is
required to practice the occupation. Regulated – Occupation regulated in at least one province. RED – Red seal trades have standards for entry into the occupation across Canada.