The Economic Research Guardian - Aviral Kumar...
14
The Economic Research Guardian (EcRG) is published by Weissberg SRL Semi-annual Online Journal, ISSN: 2247-8531, ISSN-L: 2247-8531 The Economic Research Guardian Volume 2, Number 1 Year 2012 www.ecrg.ro
Transcript of The Economic Research Guardian - Aviral Kumar...

The Economic Research Guardian (EcRG) is published by Weissberg SRL
Semi-annual Online Journal, ISSN: 2247-8531, ISSN-L: 2247-8531
The Economic Research Guardian
Volume 2, Number 1 Year 2012
www.ecrg.ro

Semi-annual Online Journal, www.ecrg.ro ISSN: 2247-8531 ISSN-L: 2247-8531
SCOPE
Economic Research Guardian (EcRG) is a blind-reviewed online semi-annual journal, which publishes high quality economic scientific articles. Contributions covering Eastern Europe are more than welcome. The journal encourages the submission of theoretical and empirical research papers in these areas of economics:
* Mathematical and Quantitative Methods for Economics; * Public Economics;
* Health, Education, and Welfare; * Labor and Demographic Economics;
* Economic Development, Technological Change, and Growth; * Cultural Economics; Economic Sociology; Economic Anthropology.
The aim of Economic Research Guardian is to integrate ideas and opinions of the economist and researchers in the field, all over the world, providing a veritable environment of scientific debate.
The Economic Research Guardian strongly promotes interdisciplinary studies over the issues of theoretical and practical importance, especially regarding the relationships between economics and political sciences,
sociology, psychology etc.
EDITORS Mihai Mutascu
Anne-Marie Fleischer
ASSOCIATE EDITORS Claudiu Albulescu Nicholas Apergis Dimitrios Asteriou
Maria Francesca Cesaroni Domenico Consoli Fernando Estrada Stefano Fachin Suresh K.G.
Francesco Magris Yossi Nehushtan Damiano Silipo
Aviral Kumar Tiwari
EDITORIAL ASSISTANTS Ovidiu Mura
Deepak Kumar Bora
Editorial e-mails: [email protected]
Address: The Economic Research Guardian
Nucului Street 2A-D-6 307160 Dumbravita, Timis
Romania
2012, Weissberg SRL - Romania
TThhee EEccoonnoommiicc RReesseeaarrcchh GGuuaarrddiiaann –– VVooll.. 22((11))22001122 SSeemmii--aannnnuuaall OOnnlliinnee JJoouurrnnaall,, wwwwww..eeccrrgg..rroo
IISSSSNN:: 22224477--88553311,, IISSSSNN--LL:: 22224477--88553311 Econ Res Guard 2(1)
EEccoonn RReess GGuuaarrdd 22001122
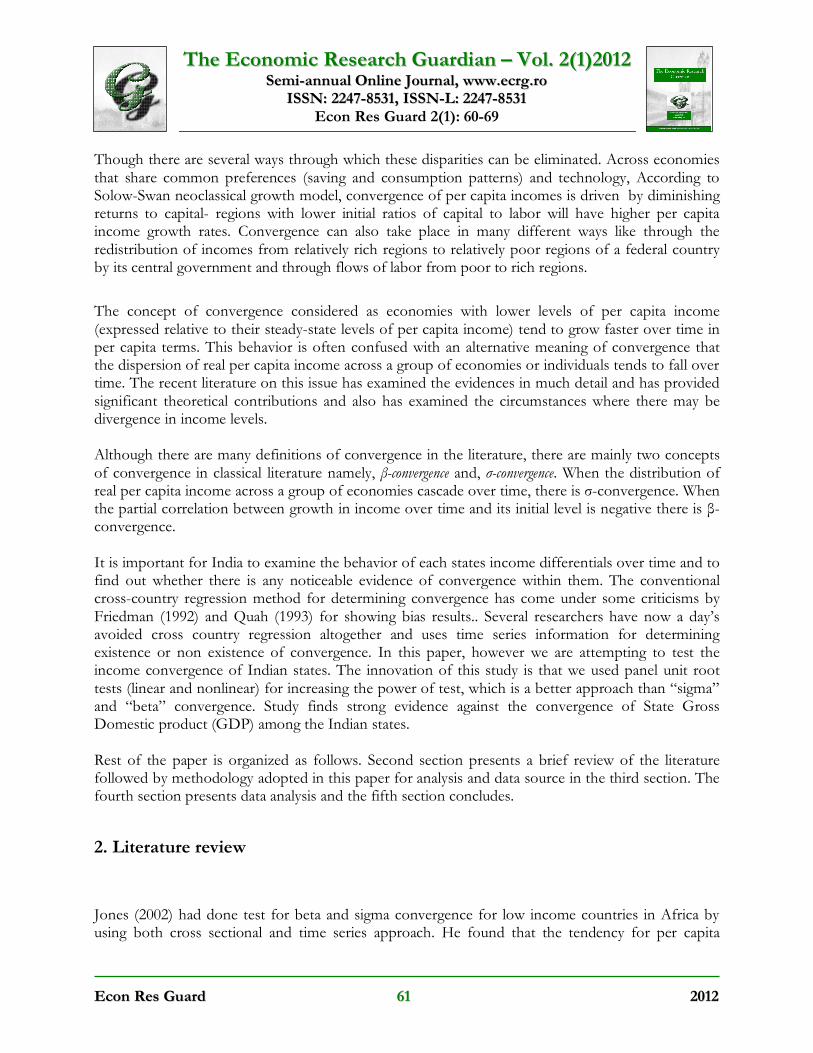
CCoonntteennttss Manuel Alfonso Garzón Castrillon, André Luiz Fischer, Lina Eiko Nakata - Organizational Learning in Latin America: A Descriptive Study in Brazil and Colombia (2-26) Şebnem Er - Women Indicators of Economic Growth: A Panel Data Approach (27-42) Arshia Amiri, Ulf-G Gerdtham - Granger Causality Between Exports, Imports and GDP in France: Evidance from Using Geostatistical Models (43-59) Mamoni Kalita, Aviral Kumar Tiwari - Testing Income Convergence: Evidence from Indian States Using Panel Linear and Nonlinear Unit Root Tests (60-69) Hisham Mohamed Hassan Ali - Cointegration Growth, Poverty and Inequality in Sudan (70-98) Alexander Libman - Democracy and Growth: Is The Effect Non-Linear? (99-120) Fatih Macit - Labor Market Institutions and Labor Productivity Growth (121-128) Annageldy Arazmuradov - Foreign Aid, Foreign Direct Investment, and Domestic Investment Nexus in Landlocked Economies of Central Asia (129-151)
TThhee EEccoonnoommiicc RReesseeaarrcchh GGuuaarrddiiaann –– VVooll.. 22((11))22001122 SSeemmii--aannnnuuaall OOnnlliinnee JJoouurrnnaall,, wwwwww..eeccrrgg..rroo
IISSSSNN:: 22224477--88553311,, IISSSSNN--LL:: 22224477--88553311 Econ Res Guard 2(1): 60-69
EEccoonn RReess GGuuaarrdd 6600 22001122
TESTING INCOME CONVERGENCE: EVIDENCE FROM INDIAN STATES USING PANEL LINEAR AND NONLINEAR UNIT ROOT TESTS
Mamoni Kalita
Faculty of Management, ICFAI University Tripura, India Email: [email protected]
Aviral Kumar Tiwari Faculty of Management, ICFAI University Tripura, India Email: [email protected]
Abstract The present study attempted to test income convergence of the Indian states. For the analysis, the study utilized panel linear and recently developed panel nonlinear unit root tests for the period 1980-1981 to 2007-2008. Use of recently developed panel nonlinear unit root test was the innovation of the study over the conventional studies based on “sigma” and “beta” convergence for testing convergence of SGDP in Indian sates. Study found strong evidence against the convergence of the State Gross Domestic product (GDP) among the Indian states.
Keywords: Convergence, Indian states, Nonlinear panel unit root test
JEL classification: O40, O47, C33
1. Introduction
Since 1947 the Indian economy has been characterized by low level of per capita income comparing with most of the Asian countries. During the period of 1940’s the India was bestowed with diversifying resource base, vast pool of skilled manpower and well established entrepreneurs and firm political system. The important issue in front of the policy makers is weather the economies with low initial per capita income grows much faster and catch up with the economies which started the development process much before. Considering these facts these differentials in income is not only apparent in across the countries but regional disparities can also be very huge. India has always been concerning about the existing regional inequalities in the context of national economic development.
TThhee EEccoonnoommiicc RReesseeaarrcchh GGuuaarrddiiaann –– VVooll.. 22((11))22001122 SSeemmii--aannnnuuaall OOnnlliinnee JJoouurrnnaall,, wwwwww..eeccrrgg..rroo
IISSSSNN:: 22224477--88553311,, IISSSSNN--LL:: 22224477--88553311 Econ Res Guard 2(1): 60-69
EEccoonn RReess GGuuaarrdd 6611 22001122
Though there are several ways through which these disparities can be eliminated. Across economies that share common preferences (saving and consumption patterns) and technology, According to Solow-Swan neoclassical growth model, convergence of per capita incomes is driven by diminishing returns to capital- regions with lower initial ratios of capital to labor will have higher per capita income growth rates. Convergence can also take place in many different ways like through the redistribution of incomes from relatively rich regions to relatively poor regions of a federal country by its central government and through flows of labor from poor to rich regions.
The concept of convergence considered as economies with lower levels of per capita income (expressed relative to their steady-state levels of per capita income) tend to grow faster over time in per capita terms. This behavior is often confused with an alternative meaning of convergence that the dispersion of real per capita income across a group of economies or individuals tends to fall over time. The recent literature on this issue has examined the evidences in much detail and has provided significant theoretical contributions and also has examined the circumstances where there may be divergence in income levels. Although there are many definitions of convergence in the literature, there are mainly two concepts of convergence in classical literature namely, β-convergence and, σ-convergence. When the distribution of real per capita income across a group of economies cascade over time, there is σ-convergence. When the partial correlation between growth in income over time and its initial level is negative there is β-convergence. It is important for India to examine the behavior of each states income differentials over time and to find out whether there is any noticeable evidence of convergence within them. The conventional cross-country regression method for determining convergence has come under some criticisms by Friedman (1992) and Quah (1993) for showing bias results.. Several researchers have now a day’s avoided cross country regression altogether and uses time series information for determining existence or non existence of convergence. In this paper, however we are attempting to test the income convergence of Indian states. The innovation of this study is that we used panel unit root tests (linear and nonlinear) for increasing the power of test, which is a better approach than “sigma” and “beta” convergence. Study finds strong evidence against the convergence of State Gross Domestic product (GDP) among the Indian states. Rest of the paper is organized as follows. Second section presents a brief review of the literature followed by methodology adopted in this paper for analysis and data source in the third section. The fourth section presents data analysis and the fifth section concludes.
2. Literature review
Jones (2002) had done test for beta and sigma convergence for low income countries in Africa by using both cross sectional and time series approach. He found that the tendency for per capita
TThhee EEccoonnoommiicc RReesseeaarrcchh GGuuaarrddiiaann –– VVooll.. 22((11))22001122 SSeemmii--aannnnuuaall OOnnlliinnee JJoouurrnnaall,, wwwwww..eeccrrgg..rroo
IISSSSNN:: 22224477--88553311,, IISSSSNN--LL:: 22224477--88553311 Econ Res Guard 2(1): 60-69
EEccoonn RReess GGuuaarrdd 6622 22001122
income to convergence and a diminution of the standard deviation of per capita income over time. It is to be noted that while the two approaches are used to measured convergence, they showed fundamentally different properties of the data under question. Cross section test required that the first difference of cross economy output possesses non zero means, where as time series test require the same to possess a zero mean (Bernaud and Durlauf,1996). Cashin and sahay (1995) has taken into account the sectoral composition of the 20 states, and found about 1.5 percent of the gap between real per capita incomes in rich and poor states was closed each year during 1961-91. That is it would take about 45 years to close half the gap between any state’s initial per capita income and the states common long-run level of per capita income. However, in an industrial country, it would take only about 35 years. The author also found that that over 1961-91, there was a widening of the dispersion of real per capita Net Domestic Product (NDP) for the Indian states. Subramanayam and Rao (2000) examined data on per capita net state domestic product of major 17 states for the period of 1965-66 to 1996-97 to test the premise that neo-classical theory of growth predicts convergence of per capita incomes across the region in the face of equal accessibility to technology and identical saving rate in the Indian context. The authors also tried to find out whether agriculture led growth is more equitable or industry led growth. However, there was no evidence of convergence of per capita incomes across Indian States in either period. Tseliost (2009) examined whether growth and convergence are determined by the average values in income distribution and/or by its upper and lower bounds, and the nature and contribution of income distribution to growth and convergence. By using spatial econometric techniques, the author tried to resolve the issue of (un)conditional convergence in the whole income distribution in the European regional context. For this purpose data from the European Community Household Panel for 102 regions over the period 1995-2000 was used and the analysis was conducted using cross-sectional and panel data growth models with spatial interaction effects. The study found the presence of a conditional convergence in income per capita after controlling for educational attainment, unemployment, sectoral composition, spatially lagged growth of income per capita, and regional fixed effects, and that of unconditional convergence in income inequality. Apergis et.al (2010) used new panel convergence methodology developed by Phillips and Sul (2007) to find the convergence of real per capita output across the European Union (EU) countries, and behaviour of the factors that may be responsible for any convergence or divergence pattern, and used in a production function growth accounting approach by using data from the (Total Economy Database and the Total Economy Growth Accounting Database). The study suggested that the EU countries form two distinct convergent clubs, exhibiting considerable heterogeneity in the underlying growth factors. Agarwalla and Pangotra (2011) have tried to examine the trends in disparities across the regions in India over a period of 26 years (1980 to 2006) by employing panel data estimation method based on the neo-classical framework. Examining 25 state economies in India they found convergent trend in regional incomes, conditional upon growth rates of inputs, and technological growth rate. They have also found that during the period of 1992 to 2006 the speed of convergence has been faster, because
TThhee EEccoonnoommiicc RReesseeaarrcchh GGuuaarrddiiaann –– VVooll.. 22((11))22001122 SSeemmii--aannnnuuaall OOnnlliinnee JJoouurrnnaall,, wwwwww..eeccrrgg..rroo
IISSSSNN:: 22224477--88553311,, IISSSSNN--LL:: 22224477--88553311 Econ Res Guard 2(1): 60-69
EEccoonn RReess GGuuaarrdd 6633 22001122
during that period Indian economy had gone through structural reforms. Further, evidence showed that incomes of the special category states have experienced convergence at a higher rate Bandyopadhyay (2011) used the distribution dynamics method to identify polarization of incomes across the Indian states and further examined whether there is any evidence of a “neighbouring regions effect”. The author found no evidence of conditional convergence in investigating for a “neighbours effect” that explains the polarization which suggest that regions that have robust engines of growth not connected sufficiently to regional markets which strongly suggests that India being a developing country need to develop the networks across the states to generate spatial interactions. Kalra and Sodsriwiboon (2010) examined the convergence and spillover across the Indian states using non-stationary panel data techniques. The finding suggested the existence of divergence over the entire sample period, convergence during sub-periods corresponding to structural breaks, and club convergence. There was strong evidence of club convergence among the high- and low-income states; the evidence for middle-income states was mixed. Dynamic spillover effects among states were small.
3. Data and methodology
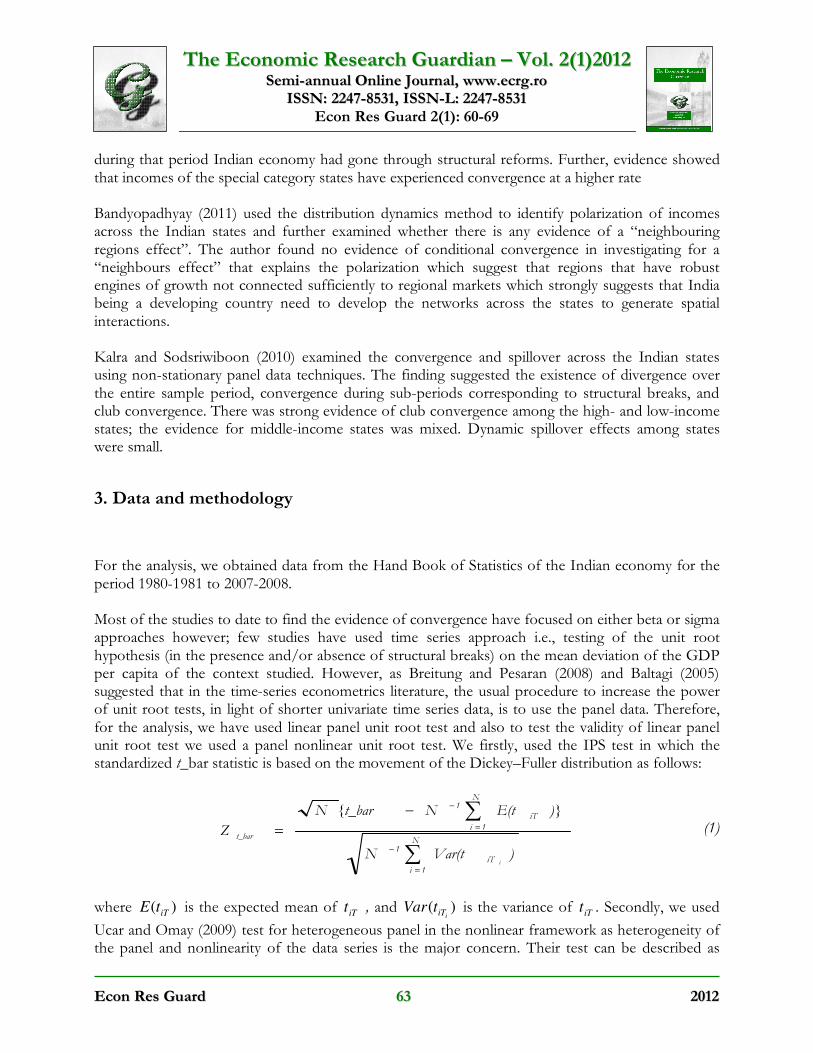
For the analysis, we obtained data from the Hand Book of Statistics of the Indian economy for the period 1980-1981 to 2007-2008. Most of the studies to date to find the evidence of convergence have focused on either beta or sigma approaches however; few studies have used time series approach i.e., testing of the unit root hypothesis (in the presence and/or absence of structural breaks) on the mean deviation of the GDP per capita of the context studied. However, as Breitung and Pesaran (2008) and Baltagi (2005) suggested that in the time-series econometrics literature, the usual procedure to increase the power of unit root tests, in light of shorter univariate time series data, is to use the panel data. Therefore, for the analysis, we have used linear panel unit root test and also to test the validity of linear panel unit root test we used a panel nonlinear unit root test. We firstly, used the IPS test in which the standardized t_bar statistic is based on the movement of the Dickey–Fuller distribution as follows:
∑
∑
=
−
=
−−
=N
1i
iT
1
N
1i
iT
1
t_bar
)Var(tN
)}E(tN{t_barN
Z
i
(1)
where )(iT
tE is the expected mean of iT
t , and )(iiTtVar is the variance of
iTt . Secondly, we used
Ucar and Omay (2009) test for heterogeneous panel in the nonlinear framework as heterogeneity of the panel and nonlinearity of the data series is the major concern. Their test can be described as
TThhee EEccoonnoommiicc RReesseeaarrcchh GGuuaarrddiiaann –– VVooll.. 22((11))22001122 SSeemmii--aannnnuuaall OOnnlliinnee JJoouurrnnaall,, wwwwww..eeccrrgg..rroo
IISSSSNN:: 22224477--88553311,, IISSSSNN--LL:: 22224477--88553311 Econ Res Guard 2(1): 60-69
EEccoonn RReess GGuuaarrdd 6644 22001122
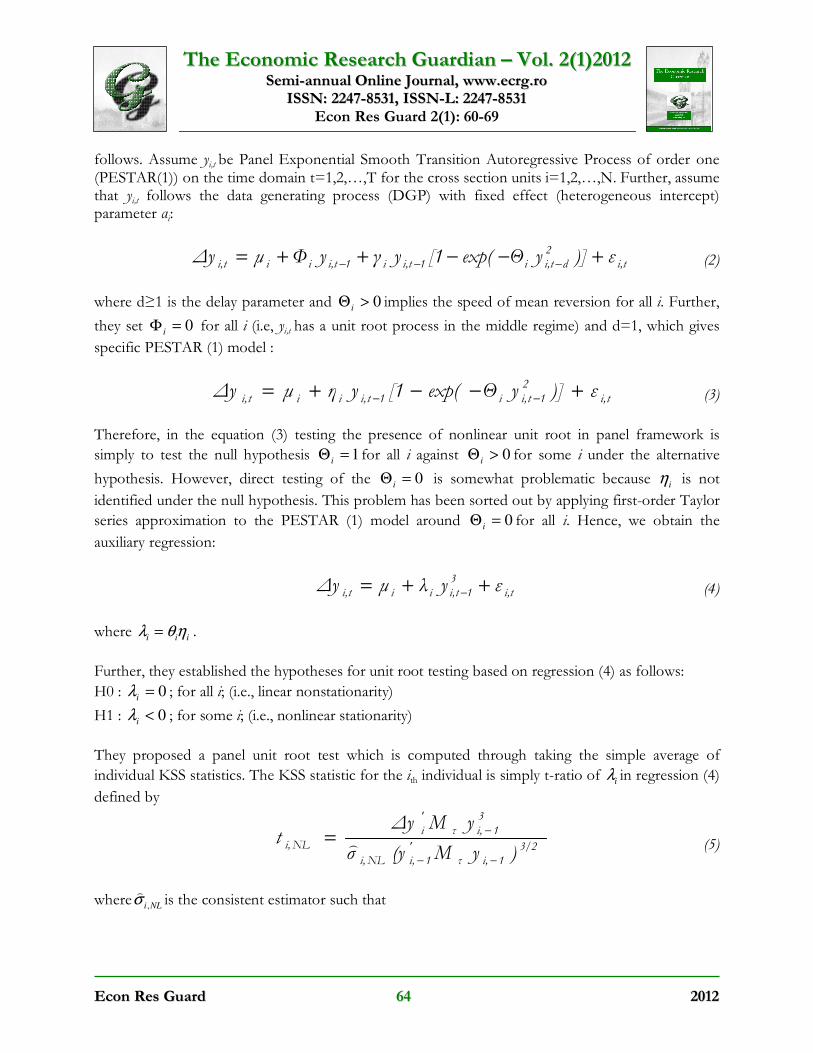
follows. Assume yi,t be Panel Exponential Smooth Transition Autoregressive Process of order one (PESTAR(1)) on the time domain t=1,2,…,T for the cross section units i=1,2,…,N. Further, assume that yi,t follows the data generating process (DGP) with fixed effect (heterogeneous intercept) parameter αi:
ti,2
dti,i1ti,i1ti,iiti, ε)]yΘexp([1yγyΦµ∆y +−−++= −−− (2)
where d≥1 is the delay parameter and 0>Θi
implies the speed of mean reversion for all i. Further,
they set 0=Φi
for all i (i.e, yi,t has a unit root process in the middle regime) and d=1, which gives
specific PESTAR (1) model :
ti,
2
1ti,i1ti,iiti, ε)]yΘexp([1yηµ∆y +−−+= −− (3)
Therefore, in the equation (3) testing the presence of nonlinear unit root in panel framework is
simply to test the null hypothesis 1=Θi
for all i against 0>Θi
for some i under the alternative
hypothesis. However, direct testing of the 0=Θi
is somewhat problematic because i
η is not
identified under the null hypothesis. This problem has been sorted out by applying first-order Taylor
series approximation to the PESTAR (1) model around 0=Θi
for all i. Hence, we obtain the
auxiliary regression:
ti,3
1ti,iiti, εyλµ∆y ++= − (4)
where .iii
ηθλ =
Further, they established the hypotheses for unit root testing based on regression (4) as follows:
H0 : 0=i
λ ; for all i; (i.e., linear nonstationarity)
H1 : 0<i
λ ; for some i; (i.e., nonlinear stationarity)
They proposed a panel unit root test which is computed through taking the simple average of
individual KSS statistics. The KSS statistic for the ith individual is simply t-ratio of i
λ in regression (4)
defined by
3/21i,τ
'1i,NLi,
3
1i,τ
'
i
NLi,)yM(yσ
yM∆yt
−−
−= ) (5)
whereNLi,σ
)is the consistent estimator such that
TThhee EEccoonnoommiicc RReesseeaarrcchh GGuuaarrddiiaann –– VVooll.. 22((11))22001122 SSeemmii--aannnnuuaall OOnnlliinnee JJoouurrnnaall,, wwwwww..eeccrrgg..rroo
IISSSSNN:: 22224477--88553311,, IISSSSNN--LL:: 22224477--88553311 Econ Res Guard 2(1): 60-69
EEccoonn RReess GGuuaarrdd 6655 22001122
2,NLiσ
) = ),1/(' −∆∆ TyMy
ii τ .)( '1'
TTTTTIM τττττ
−−=
Here, ,),...,,( ',2,1, tiiii yyyy ∆∆∆=∆
'3
1,31,
30,
31, ),...,,( −− = Tiiii yyyy
and .)1,...,1,1( '=
Tτ Furthermore, for a fixed T, they defined
∑=
=N
1i
NLi,NL tN
1t (6)
which is invariant average statistic when ti,NL is invariant with respect to initial observations yi,0,
heterogeneous moments σi2 and σi
4 if yi,0=0 for all i=1,2,…,N. The authors show that when the invariance property for ti,NL holds for each i and the existence of moments are satisfied (in other words when the individual statistics ti,NL are i.i.d. random variables with finite means and variances)
the standard normalization of NLt statistic have the limiting standard normal distribution as N→∞
such that:
N(0,1))Var(t
))E(ttN(Z d
NLi,
NLi,Nl
NL →−
= (7)
Therefore, they produced critical values of Z̅NL statistic as well as its truncated version because they may be different from the fractiles of the standard normal distribution, particularly for small N observations, to which they converge as N goes to infinity. The main feature of the time series approach to tests for convergence within a neo-classical, Solow type model, stems from the basic conclusion of that model. In particular, the model produces the property that the long-run behaviour of the economy will be independent of initial conditions. To see this clearly, consider the following equation, which describes a linear approximation to the out of (stationary) steady-state behaviour of log per capita output (in our case states GDP) within an exogenous growth model:
)e(1yy(0)ey βt*βt
t
−− −+= (8)
where t
y is defined as (log) states GDP, )0(y (log) initial states GDP, y* is the stationary steady-
state (log) states GDP and β is the speed of adjustment which depends on various model
parameters. If we consider two countries i and j, and assume a common β due to the fact that the
countries have the same savings, depreciation and population growth rates, we can rewrite equation (8) as:
)e)(1y(y)ey(0)(y(0))y(y βt*j
*i
βt
jijtit
−− −−+−=− (9)
Furthermore, if we assume sufficient time elapses such that catching- up has been completed then
0≡−te
β and equation (9) reduces to
TThhee EEccoonnoommiicc RReesseeaarrcchh GGuuaarrddiiaann –– VVooll.. 22((11))22001122 SSeemmii--aannnnuuaall OOnnlliinnee JJoouurrnnaall,, wwwwww..eeccrrgg..rroo
IISSSSNN:: 22224477--88553311,, IISSSSNN--LL:: 22224477--88553311 Econ Res Guard 2(1): 60-69
EEccoonn RReess GGuuaarrdd 6666 22001122
)y(y)y(y *j
*ijtit −=− (10)
where the difference in log per capita output will be stationary without trend, that is, states i and j will have converged. Notice the absence of any association between initial values and the definition of convergence. When this result is translated into considering output differences between states, the time series tests require that these differences must be stationary with no statistical association with initial values. This is in sharp contrast to the basic cross-sectional tests of convergence, which are based upon a negative association between output differences and initial levels. This particular feature represents the crucial potential incompatibility between cross-sectional and time series tests. As defined above, the statistical tests of long-run convergence hinges, therefore, on the time series
properties of ji yy − . The natural route for such tests involves Dickey–Fuller type tests based on the
bivariate difference in per capita output between pairs of countries, i and j, i.e.,
∑=
−−−− +−++−+=−n
1k
tktj,kti,k1tj,1ti,jtit ε)y∆(yδβt)yα(yµ)y(y (11)
where y indicates the logarithm of states GDP. If the difference between states GDP series contain a unit root, 1=α , states GDP in the two states will diverge. The absence of a unit root, ,1<α ,
indicates either catching up if 0≠β , or long-run convergence if 0=β .
4. Data analysis and findings
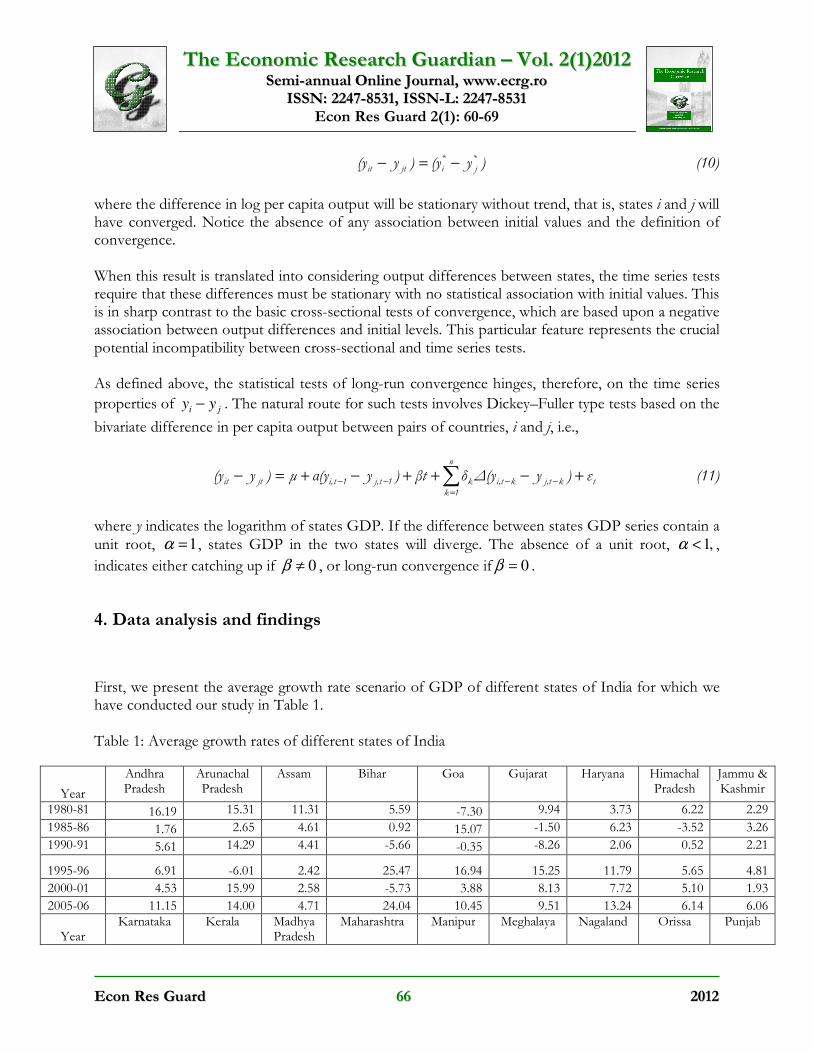
First, we present the average growth rate scenario of GDP of different states of India for which we have conducted our study in Table 1. Table 1: Average growth rates of different states of India
Year
Andhra Pradesh
Arunachal Pradesh
Assam Bihar Goa Gujarat Haryana Himachal Pradesh
Jammu & Kashmir
1980-81 16.19 15.31 11.31 5.59 -7.30 9.94 3.73 6.22 2.29
1985-86 1.76 2.65 4.61 0.92 15.07 -1.50 6.23 -3.52 3.26
1990-91 5.61 14.29 4.41 -5.66 -0.35 -8.26 2.06 0.52 2.21
1995-96 6.91 -6.01 2.42 25.47 16.94 15.25 11.79 5.65 4.81
2000-01 4.53 15.99 2.58 -5.73 3.88 8.13 7.72 5.10 1.93
2005-06 11.15 14.00 4.71 24.04 10.45 9.51 13.24 6.14 6.06
Year Karnataka Kerala Madhya
Pradesh Maharashtra Manipur Meghalaya Nagaland Orissa Punjab
TThhee EEccoonnoommiicc RReesseeaarrcchh GGuuaarrddiiaann –– VVooll.. 22((11))22001122 SSeemmii--aannnnuuaall OOnnlliinnee JJoouurrnnaall,, wwwwww..eeccrrgg..rroo
IISSSSNN:: 22224477--88553311,, IISSSSNN--LL:: 22224477--88553311 Econ Res Guard 2(1): 60-69
EEccoonn RReess GGuuaarrdd 6677 22001122
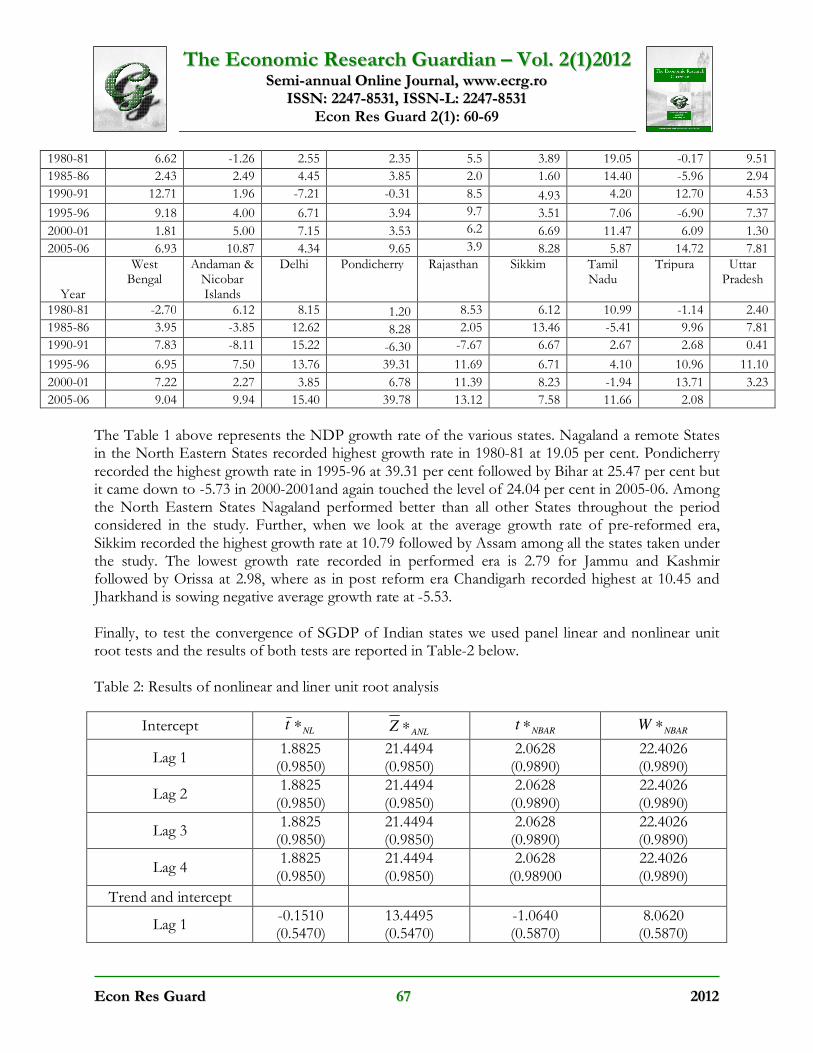
1980-81 6.62 -1.26 2.55 2.35 5.5 3.89 19.05 -0.17 9.51
1985-86 2.43 2.49 4.45 3.85 2.0 1.60 14.40 -5.96 2.94
1990-91 12.71 1.96 -7.21 -0.31 8.5 4.93 4.20 12.70 4.53
1995-96 9.18 4.00 6.71 3.94 9.7 3.51 7.06 -6.90 7.37
2000-01 1.81 5.00 7.15 3.53 6.2 6.69 11.47 6.09 1.30
2005-06 6.93 10.87 4.34 9.65 3.9 8.28 5.87 14.72 7.81
Year
West Bengal
Andaman & Nicobar Islands
Delhi Pondicherry Rajasthan Sikkim Tamil Nadu
Tripura Uttar Pradesh
1980-81 -2.70 6.12 8.15 1.20 8.53 6.12 10.99 -1.14 2.40
1985-86 3.95 -3.85 12.62 8.28 2.05 13.46 -5.41 9.96 7.81
1990-91 7.83 -8.11 15.22 -6.30 -7.67 6.67 2.67 2.68 0.41
1995-96 6.95 7.50 13.76 39.31 11.69 6.71 4.10 10.96 11.10
2000-01 7.22 2.27 3.85 6.78 11.39 8.23 -1.94 13.71 3.23
2005-06 9.04 9.94 15.40 39.78 13.12 7.58 11.66 2.08
The Table 1 above represents the NDP growth rate of the various states. Nagaland a remote States in the North Eastern States recorded highest growth rate in 1980-81 at 19.05 per cent. Pondicherry recorded the highest growth rate in 1995-96 at 39.31 per cent followed by Bihar at 25.47 per cent but it came down to -5.73 in 2000-2001and again touched the level of 24.04 per cent in 2005-06. Among the North Eastern States Nagaland performed better than all other States throughout the period considered in the study. Further, when we look at the average growth rate of pre-reformed era, Sikkim recorded the highest growth rate at 10.79 followed by Assam among all the states taken under the study. The lowest growth rate recorded in performed era is 2.79 for Jammu and Kashmir followed by Orissa at 2.98, where as in post reform era Chandigarh recorded highest at 10.45 and Jharkhand is sowing negative average growth rate at -5.53. Finally, to test the convergence of SGDP of Indian states we used panel linear and nonlinear unit root tests and the results of both tests are reported in Table-2 below. Table 2: Results of nonlinear and liner unit root analysis
Intercept NLt ∗
ANLZ ∗ NBARt ∗
NBARW ∗
Lag 1 1.8825
(0.9850) 21.4494 (0.9850)
2.0628 (0.9890)
22.4026 (0.9890)
Lag 2 1.8825
(0.9850) 21.4494 (0.9850)
2.0628 (0.9890)
22.4026 (0.9890)
Lag 3 1.8825
(0.9850) 21.4494 (0.9850)
2.0628 (0.9890)
22.4026 (0.9890)
Lag 4 1.8825
(0.9850) 21.4494 (0.9850)
2.0628 (0.98900
22.4026 (0.9890)
Trend and intercept
Lag 1 -0.1510 (0.5470)
13.4495 (0.5470)
-1.0640 (0.5870)
8.0620 (0.5870)
TThhee EEccoonnoommiicc RReesseeaarrcchh GGuuaarrddiiaann –– VVooll.. 22((11))22001122 SSeemmii--aannnnuuaall OOnnlliinnee JJoouurrnnaall,, wwwwww..eeccrrgg..rroo
IISSSSNN:: 22224477--88553311,, IISSSSNN--LL:: 22224477--88553311 Econ Res Guard 2(1): 60-69
EEccoonn RReess GGuuaarrdd 6688 22001122
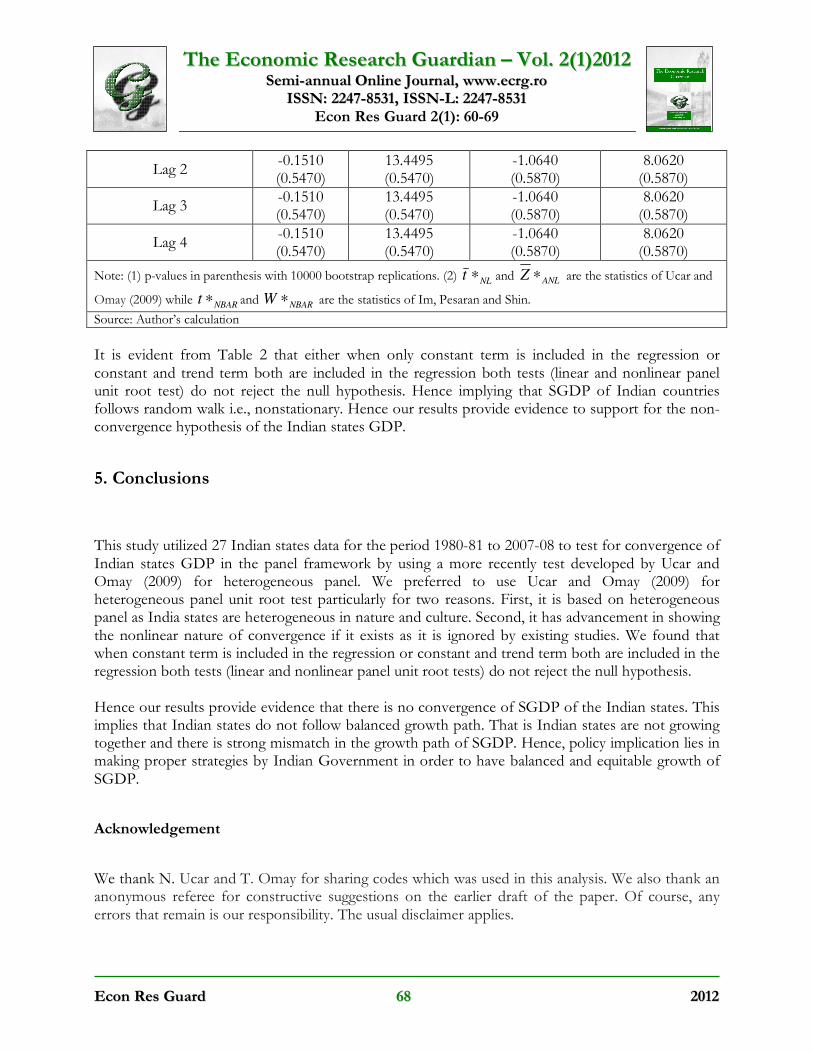
Lag 2 -0.1510 (0.5470)
13.4495 (0.5470)
-1.0640 (0.5870)
8.0620 (0.5870)
Lag 3 -0.1510 (0.5470)
13.4495 (0.5470)
-1.0640 (0.5870)
8.0620 (0.5870)
Lag 4 -0.1510 (0.5470)
13.4495 (0.5470)
-1.0640 (0.5870)
8.0620 (0.5870)
Note: (1) p-values in parenthesis with 10000 bootstrap replications. (2) NL
t ∗ and ANLZ ∗ are the statistics of Ucar and
Omay (2009) while NBAR
t ∗ and NBAR
W ∗ are the statistics of Im, Pesaran and Shin.
Source: Author’s calculation
It is evident from Table 2 that either when only constant term is included in the regression or constant and trend term both are included in the regression both tests (linear and nonlinear panel unit root test) do not reject the null hypothesis. Hence implying that SGDP of Indian countries follows random walk i.e., nonstationary. Hence our results provide evidence to support for the non-convergence hypothesis of the Indian states GDP.
5. Conclusions
This study utilized 27 Indian states data for the period 1980-81 to 2007-08 to test for convergence of Indian states GDP in the panel framework by using a more recently test developed by Ucar and Omay (2009) for heterogeneous panel. We preferred to use Ucar and Omay (2009) for heterogeneous panel unit root test particularly for two reasons. First, it is based on heterogeneous panel as India states are heterogeneous in nature and culture. Second, it has advancement in showing the nonlinear nature of convergence if it exists as it is ignored by existing studies. We found that when constant term is included in the regression or constant and trend term both are included in the regression both tests (linear and nonlinear panel unit root tests) do not reject the null hypothesis. Hence our results provide evidence that there is no convergence of SGDP of the Indian states. This implies that Indian states do not follow balanced growth path. That is Indian states are not growing together and there is strong mismatch in the growth path of SGDP. Hence, policy implication lies in making proper strategies by Indian Government in order to have balanced and equitable growth of SGDP.
Acknowledgement
We thank N. Ucar and T. Omay for sharing codes which was used in this analysis. We also thank an anonymous referee for constructive suggestions on the earlier draft of the paper. Of course, any errors that remain is our responsibility. The usual disclaimer applies.
TThhee EEccoonnoommiicc RReesseeaarrcchh GGuuaarrddiiaann –– VVooll.. 22((11))22001122 SSeemmii--aannnnuuaall OOnnlliinnee JJoouurrnnaall,, wwwwww..eeccrrgg..rroo
IISSSSNN:: 22224477--88553311,, IISSSSNN--LL:: 22224477--88553311 Econ Res Guard 2(1): 60-69
EEccoonn RReess GGuuaarrdd 6699 22001122
Reference
Agarwalla A, Pangotra P (2011). Regional Income Disparities in India and test for Convergence-1980 to 2006. Indian institute of management, Ahmadabad, W.P. No. 2011-01-04. Apergis N, Panopoulou E, Tsoumas C (2010). Old Wine in a New Bottle: Growth Convergence Dynamics in the EU. Atlantic Economic Journal, (38):169-181. Baltagi B (2005). Econometric Analysis of Panel Data. John Wiley & Sons: Oxford. Bandyopadhyay S (2011). Convergence Clubs in Incomes across Indian States: Is There Evidence of a Neighbors Effect? Department of Economics, University of Birmingham and Department of Economics and STICERD, London School of Economics. Breitung J, Pesaran MH (2008). Unit Roots and Cointegration in Panels’, in L. Matyas and P. Sevestre (eds). The Econometrics of Panel Data. Klauwer Academic Publishers: Suffolk. Cashin P, Sahay R (1995). Internal Migration, Center-State Grants and Economic Growth in the States of India. IMF, Working Paper 95/58. Jones B (2002). Economic Integration and Convergence of per capita Income in West Africa. African Development Review. 14(1): 18-42. Kalra S, Sodsriwiboon P (2010). Growth Convergence and Spillovers among Indian States: What Matters? What Does Not? IMF working paper, WP/10/96. Phillips PCB, Sul D (2007). Transition Modelling and Econometric Convergence tests. Econometrica. 75: 1771-1855. Subrahmanyam S, Rajagopala Rao N (2000). Liberalization an Income Convergence Across Indian States. Working paper, The Centre for Economic and social studies. Tselios V (2009). Growth and Convergence in Income Per Capita and Income Inequality in the Regions of the EU. Spatial Economic Analysis. 4(3): 343-370. Ucar N, Omay T (2009). Testing for Unit Root in Nonlinear Heterogeneous Panels. Economics Letters. 104: 5-8.

The Economic Research Guardian (EcRG) is published by Weissberg SRL
Editorial e-mails:
[email protected] [email protected]
Address:
The Economic Research Guardian Weissberg SRL
Nucului Street 2A-D-6 307160 Dumbravita, Timis
Romania
Semi-annual Online Journal, ISSN: 2247-8531, ISSN-L: 2247-8531


![AVIRAL CLASSES ATSE-IX-2020-[CODE-P SET-1] AVIRAL TALENT …](https://static.fdocuments.net/doc/165x107/61bd754051ab81332d731b25/aviral-classes-atse-ix-2020-code-p-set-1-aviral-talent-.jpg)