
The economic impact of the UK Maritime Services Sector ... · The Economic Impact of the Maritime...
28
The economic impact of the UK Maritime Services Sector: Shipping May 2015
Transcript of The economic impact of the UK Maritime Services Sector ... · The Economic Impact of the Maritime...

The economic impact of the UK
Maritime Services Sector: Shipping
May 2015
Contents
1 Executive summary ......................................................................... 2
2 Introduction ..................................................................................... 5
2.1 The channels of economic impact ............................................................. 5
2.2 Report structure ......................................................................................... 5
3 Direct impacts .................................................................................. 6
3.1 Direct contribution to employment ............................................................. 6
3.2 Direct contribution to GDP ......................................................................... 8
3.3 Direct contribution to the Exchequer ........................................................ 10
4 Multiplier effects – indirect and induced impacts ....................... 12
4.1 Indirect and induced impact on employment ........................................... 12
4.2 Indirect and induced impact on GDP contribution ................................... 13
4.3 Indirect and induced contribution to the Exchequer ................................. 13
5 Regional impact of the Shipping sector ...................................... 15
5.1 Direct impact on regional employment ..................................................... 15
5.2 Direct impact on regional GDP ................................................................ 16
5.3 Multiplier impacts on the UK regions ....................................................... 17
6 The impact of the tonnage tax ...................................................... 20
6.1 The impact of the tonnage tax on GDP.................................................... 21
6.2 The impact of the tonnage tax on employment ........................................ 22
6.3 The impact of the tonnage tax on tax revenue ........................................ 23
6.4 The total impact of tonnage tax ................................................................ 23
7 Conclusion ..................................................................................... 24


The Economic Impact of the Maritime Services Sector: Shipping
2
1 Executive summary
UK shipping industry’s economic impact
Direct employment contribution
In 2013, the UK shipping industry employed 133,900 people. Of these, 20% are UK officers or
ratings, 6% UK shore based jobs and the remainder foreign nationals working as both
officers and ratings on UK-registered vessels.
The employment of UK nationals within the industry has decreased by 26% since 2011, while
the number of foreign nationals working as officers and ratings has increased by 1%,
leading to a total reduction of 8% of the total workforce.
The employment it creates is greater than the air transport and the support activities for land
and water transport and nearly as large as the warehousing and storage industry.
Direct contribution to UK GDP
The shipping industry contributed £3.0 billion to UK GDP. This equated to 0.2% of GDP and is
equivalent to the GVA produced by construction of roads and railways activities.
This represents a large decline in the output of the sector compared to figures presented in
previous research for 2011, with the gross value added contribution to GDP contribution
falling by 43% from £5.2 billion (in 2013 prices) to £3.0 billion in 2013.
Direct tax contribution
In 2013, the UK shipping industry is estimated to have directly contributed £599 million to the
Exchequer in income tax, National Insurance Contributions, VAT (and other indirect
taxes).
Multiplier impacts
The shipping industry also stimulates the rest of the UK economy through two other types of
expenditure. Its purchases of inputs of goods and services generate economic activity
in its supply chain. Its payment of wages to its staff supports consumer spending. Such
effects are typically referred to as the ‘indirect’ and ‘induced’ impacts, respectively.
In total, the UK shipping industry supported 229,100 jobs and a £7.7 billion gross value added
contribution to UK GDP in 2013. This is equivalent to around 0.7% of UK employment
and 0.5% of UK GDP.
Inclusive of the multiplier impacts, it is estimated that the UK shipping industry and its
employees’ total contribution to tax revenues was £2.0 billion in 2013.
The total economic impact of the shipping industry - in terms of employment, gross value added
contribution to GDP and tax revenue - is summarised by channel of impact in Figure 1.1.

The Economic Impact of the Maritime Services Sector: Shipping
3
Figure 1.1: Summary of the economic contribution of the UK shipping industry in 20131
The impact of the UK shipping industry varies across the regions in the UK
Of the 35,700 UK-nationals employed by the shipping industry in 2013, nearly one-third were
based in Scotland. Four regions in England had over 3,000 UK-nationals employed by
the shipping industry; the North West, North East, South West and South East.
The shipping industry made its largest gross value added contribution to GDP in London at
nearly £500 million in 2013, despite accounting for a relatively low share of direct
employment, as many large shipping companies are headquartered in the region.
When including the wider multiplier impacts, nearly one-quarter of the economic activity
supported by the shipping industry occurred in London. In total, three regions were
responsible for around half of the total impact; London, the South East and Scotland.
1 Figures may not sum due to rounding.
Direct
Indire
ctIn
ducedTota
l Impact
GDP C
ontrib
ution
(£ B
illio
n)
Tax Revenue
(£ Billion)
Em
ployment
(Jobs)
133,90058,200
37,000229,100
3.0
2.9
1.8
7.7
0.8
0.5
2.0
0.6
The Economic Impact of the Maritime Services Sector: Shipping
4
The tonnage tax regime has delivered significant benefits to the UK economy
The UK shipping industry has grown significantly since the introduction of the tonnage tax.
Deadweight tonnage has grown from 7.2 million tonnes before the announcement of the
tonnage tax to 20.6 million tonnes by 2013.
Based on a counterfactual scenario whereby the long-run trend of decline in the size of the UK-
fleet continued post 2000, it is estimated that the shipping industry’s direct contribution
to UK GDP in 2013 would have been approximately £2.3 billion lower than it actually
was, had the tonnage tax not been introduced. In the process, an estimated 28,100
fewer UK jobs would have been supported and tax receipts would have been £472
million lower than currently paid.
When including the wider multiplier impacts on the UK economy, it is estimated that the total
gross value added contribution of the shipping industry to UK GDP would have been
just over a third of the estimated impact in 2013. Furthermore, 78,500 fewer people
would be in employment and the government would be receiving £1.2 billion less tax
revenues.
These impacts may be mitigated if workers found employment over time in other areas of the
economy. However, it should be noted that the shipping industry is an internationally mobile one
and, without tonnage tax, people may have sought jobs abroad leading to a permanent loss for
the UK economy.

The Economic Impact of the Maritime Services Sector: Shipping
5
2 Introduction
The objective of this report is to analyse the contribution the shipping sector makes to the UK
economy in 2013, providing an update on previous research2. For the purposes of this
research, the shipping sector is defined as the transport of passengers (incorporating the
provision of services and entertainment) and freight by sea on UK-owned vessels (wherever
registered) or on ships chartered-in by UK companies – including both bi-lateral and cross-trade
earnings, and the income from chartering-out of vessels. This study was done in conjunction
with economic impact assessments of the ports and maritime business services sectors. The
results from this trio of sectors were then combined, with adjustments made to eliminate the risk
of ‘double counting’, in order to generate an estimate of the economic impact of the combined
UK maritime services sector.
2.1 The channels of economic impact
The shipping sector supports employment, gross value added and tax revenues in the UK
through three distinct channels. These channels are:
Direct – the employment, output and taxed paid by the UK shipping industry itself, including
passenger, freight and charter services.
Indirect – the economic activity supported by the shipping industry’s expenditure on inputs of
goods and services from its UK-based supply chain.
Induced – the shipping sector and the firms in its direct supply chain pay their staff wages. A
proportion of this income will be spent in retail and leisure outlets. This stimulates
economic activity both in the outlets and their domestic supply chains.
2.2 Report structure
This report is structured as follows:
Chapter 3 explores the sector’s direct economic contribution to the UK economy, covering the
impact on employment, gross value added contribution to GDP and tax revenues
generated for the Exchequer.
Chapter 4 analyses the wider multiplier impacts of the shipping industry on the UK economy
(‘indirect’ and ‘induced’ impacts).
Chapter 5 focuses on the regional breakdown of the main metrics.
Chapter 6 examines the results of a scenario analysis on the impact of tonnage tax.
Chapter 7 concludes.
2 Oxford Economics, (2013), ‘The economic impact of the UK Maritime Services Sector: Shipping’, February.

The Economic Impact of the Maritime Services Sector: Shipping
6
3 Direct impacts
This chapter analyses the employment, gross value added contribution to GDP and tax receipts
generated by the UK shipping industry.
KEY POINTS
In 2013, the UK shipping industry employed 133,900 people, with a quarter being UK
officers or ratings and 8,700 being based on-shore. Excluding foreign seafarers, the
shipping industry employed 35,700 UK nationals, a fall of 26% since 2011.
The shipping industry made a £3.0 billion gross value added contribution to UK GDP.
This is equivalent to 0.2% of the UK’s economic output. This represents a 43% decline
on the estimates made for 2011 in the previous report.
In 2013, the shipping industry generated some £599 million in tax receipts.
3.1 Direct contribution to employment
Data on employment in the UK shipping industry are available in the UK Chamber of Shipping’s
manpower survey for 2013. This survey covers all employees in UK shipping companies that
are members of the UK Chamber of Shipping3. In order to estimate employment in UK-based
shipping companies that are not members we have applied a grossing factor based on that
used by the Office for National Statistics (ONS) when grossing up turnover data from UK
Chamber of Shipping members. The UK Chamber of Shipping’s manpower survey also
requests data on the number of UK shore-based employees suggesting that, after up-scaling
the figure by the ONS grossing factor, there are currently over 8,700 shore-based employees in
the UK. Here onshore employees refer to those individuals involved in the administration and
management of UK-based shipping companies, such as Fleet Directors, Technical Supervisors
and other Secretarial and Accounts employees.
It is estimated that the shipping sector employed 133,900 people in 2013. Of these,
approximately 98,200 were foreign nationals and 35,700 UK nationals4.
In terms of the composition of these jobs in 2013, nearly 94% were on board ships while the
remaining 6% were based onshore in the UK. Of those based on board, 27,100 were UK
nationals, of whom 11,800 were officers and the remaining 15,200 were ratings. In comparison,
26,100 of the foreign nationals were officers and 72,200 were ratings (Chart 3.1).
3 The survey does not include the same companies every year.
4 It is assumed that the shore-based employees are UK nationals.
The Economic Impact of the Maritime Services Sector: Shipping
7
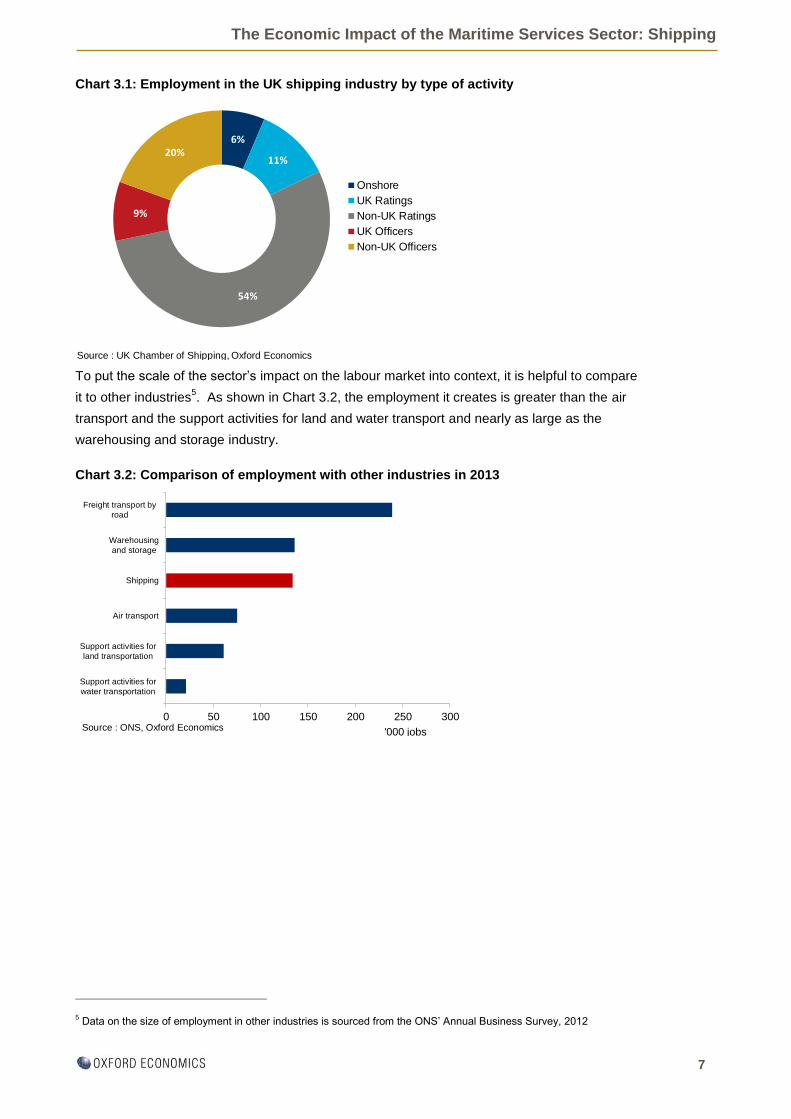
Chart 3.1: Employment in the UK shipping industry by type of activity
To put the scale of the sector’s impact on the labour market into context, it is helpful to compare
it to other industries5. As shown in Chart 3.2, the employment it creates is greater than the air
transport and the support activities for land and water transport and nearly as large as the
warehousing and storage industry.
Chart 3.2: Comparison of employment with other industries in 2013
5 Data on the size of employment in other industries is sourced from the ONS’ Annual Business Survey, 2012
6%
11%
54%
9%
20%
Onshore
UK Ratings
Non-UK Ratings
UK Officers
Non-UK Officers
Source : UK Chamber of Shipping, Oxford Economics
0 50 100 150 200 250 300
Support activities for
water transportation
Support activities for
land transportation
Air transport
Shipping
Warehousing
and storage
Freight transport by
road
'000 jobsSource : ONS, Oxford Economics

The Economic Impact of the Maritime Services Sector: Shipping
8
3.2 Direct contribution to GDP
The contribution that any business or industry makes to a country’s economic output is
measured by its gross value added contribution to Gross Domestic Product (GDP). GDP is the
main ‘summary indicator’ of economic activity and is used by economists to determine the rate
of growth of the economy and when it enters recession. Gross value added is commonly
calculated as the value of the output created by a sector less the cost of purchased inputs used
up in its production (known as the ‘output approach’ to national accounting). By summing the
gross value added of all firms in the economy, one derives an estimate for the economy’s GDP.6
To calculate the gross value added created by the shipping industry, the analysis draws on the
Chamber of Shipping’s Annual Sea Inquiry7. This shows the UK shipping industry’s turnover in
2013 was £10.6 billion. This is some 20% below its level in 20118 in real terms (Chart 3.3).
Chart 3.3: Direct contribution of the UK shipping industry
Further analysis of the Annual Sea Inquiry indicates that 68% of shipping revenue came from
freight (including freight transported by passenger vessels) and 32% from carrying passengers.
In comparison, the split of revenues in 2011 was more in favour of freight services, accounting
for 73% of total revenue, suggesting passenger revenues performed better than freight
revenues in the last two years. A decomposition of freight revenues indicates that container and
other dry cargo provided 41% of total UK shipping revenue, wet cargo 20% and that transported
on passenger ships a further 7%. For passengers, cruises provided 25% of total income and
ferries the remaining 7% (Chart 3.4). Both ferries and cruises have seen their receipts rising
since 2011. However, spend on inputs have increased relatively more, driving gross value
added down.
6 Plus taxes on products minus subsidies on products.
7 The UK Chamber of Shipping surveys all its members annually and the data is uplifted by the ONS to account for UK
sea transport companies who are not members.
8 Figures are compared to those presented in the previous research on the UK shipping industry.
0
2
4
6
8
10
12
14
16
2000 2001 2002 2003 2004 2005 2006 2007 2008 2009 2010 2011 2012 2013
Turnover Value added
£ billion (constant 2013 prices)
Source : UK Chamber of Shipping, Oxford Economics

The Economic Impact of the Maritime Services Sector: Shipping
9
Chart 3.4: Share of total shipping revenues by service type in 2011 and 2013
To calculate the shipping industry’s gross value added contribution to UK GDP, the analysis
uses the Annual Sea Inquiry’s data on turnover and then applied estimates for total bought-in
costs and changes in stocks from ONS National Accounts data. On this basis, it is estimated
that on a turnover of £10.6 billion, the UK shipping industry generates £3.0 billion in gross value
added for the UK economy. This represents a contraction of nearly 43% in real terms in
comparison to the contribution in 2011.
Despite declining over the last three years, the shipping industry’s contribution to economic
output in the UK has enjoyed strong growth over the past decade (Chart 3.3). Between 2000
and 2013, gross value added has grown by 132% in real terms, while the equivalent growth in
turnover amounted to 153% during the same period.
Again, in order to provide context, it is useful to compare the shipping industry’s gross value
added contribution to GDP to that made by other industries9. This indicates that, in 2013, the
shipping industry’s contribution to GDP was larger than water transport and support activities for
water transport (Chart 3.5).
9 Data on the size of other industries contribution to GDP is sourced from the ONS’ Annual Business Survey, 2012
0
10
20
30
40
50
60
70
80
Freight 2011 Freight 2013 Passenger 2011 Passenger 2013
Ro-Ro (incl ferries)
Cruise
Freight carried bypassenger ships
Wet Cargo
Dry Cargo
Source : UK Chamber of Shipping
%

The Economic Impact of the Maritime Services Sector: Shipping
10
Chart 3.5: Comparison of GDP to other industries in 2013
3.3 Direct contribution to the Exchequer
The shipping sector contributes to the public finances through a number of different channels. It
pays employers National Insurance contributions (NICs) on the wages it pays its staff. Its
employees also pay income tax and NICS. To the extent its staff live in the UK they will also pay
indirect taxes like VAT.
In order to calculate the contribution of the UK shipping industry to the Exchequer, it was
necessary to make a number of assumptions, namely:
To estimate the amount of employment taxes (income and employee/employer NICs)
contributed by UK shipping companies, an estimate of gross earnings was sourced from the
ONS’ Annual Survey of Hours and Earnings (ASHE). Ship and hovercraft officers are found to
earn £39,600 in annual gross earnings. This figure was then combined with income tax and
NIC allowances and tax bands for 2013/14, sourced from HMRC.
A number of UK seafarers will not pay income tax as they will be at sea for more than 183 days
a year (through the ‘Seafarers’ Earnings Deduction’). Discussions with the UK Chamber of
Shipping suggest that this might be around half of all UK officers and a much lower (assumed
10%) proportion of UK ratings. In addition, all non-UK nationals are assumed not pay UK tax
while all shore-based staff are assumed to pay UK income tax.
For the NICs of both employees and employers the analysis makes similar assumptions to
those for income tax, but in addition we assume that the proportion of officers and ratings whose
employers are not liable for NICs in the UK is slightly higher than those who will benefit from the
Seafarers’ Earnings Deduction (i.e. 60% for UK officers and 20% for UK ratings).
0 1 2 3 4 5
Taxi Operation
Support activities forwater transportation
Water transport
Shipping
Urban and suburbanpassenger land
transport
Passenger railtransport, interurban
Source : ONS, Oxford Economics
£ billion

The Economic Impact of the Maritime Services Sector: Shipping
11
To the extent its staff undertake expenditure in the UK, they will be liable to pay indirect taxes
(for example, VAT and excise duty). These estimates are based on ONS data on the proportion
of disposable income paid in indirect taxes by UK households in 2012/13 by quintile10
.
The shipping industry contributed £599 million in taxes through income, National Insurance
contributions and indirect taxes.
10 ONS (2014), ‘The Effects of Taxes and Benefits on Household Income, 2012/13’. June
The Economic Impact of the Maritime Services Sector: Shipping
12
4 Multiplier effects – indirect and induced impacts
The UK shipping sector also contributes to UK economy through its procurement of inputs of
goods and services from domestic suppliers. These purchases stimulate economic activity in its
UK supply chain. In addition, the shipping industry and the firms in its direct supply chain pay
their staff wages. A proportion of this income will be spent at retail and leisure outlets,
stimulating further activity in these sectors’ supply chains. This chapter summarises the key
findings focusing on the same three metrics: employment; gross value added contribution to
GDP and tax receipts.
KEY POINTS
It is estimated the shipping industry’s expenditure on inputs of goods and services supports
58,200 people in employment in its UK supply chain. A further 37,000 jobs are supported
by the wage-financed consumer spending of the 192,100 people employed directly and
indirectly by the sector. Therefore, through its own activities, its procurement and payment
of wages the shipping industry supported an estimated 229,100 people in employment in
2013.
The shipping industry’s procurement generated a £2.9 billion gross value added
contribution to GDP in its supply chain, with a further £1.8 billion created by those
employed directly and indirectly spending their wage income. This implies the industry
supported a total contribution to GDP of £7.7 billion in 2013, equivalent to 0.5% of the UK
economy.
It is estimated that in 2013 the industry supported £2.0 billion in tax revenues. This
amount was raised via taxation through the indirect (£841 million) and induced (£534
million) channels.
4.1 Indirect and induced impact on employment
In order to quantify the indirect impact of the UK shipping industry’s procurement of inputs of
goods and services from its domestic supply chain, the analysis uses ONS analytical input-
output (IO) tables11
. These tables can be used to show the impact on other industrial sectors of
the shipping industries spend on inputs. It also enables the derivation of the induced impact of
activity in an industry i.e. the effect of spending by those employed directly and indirectly in the
shipping industry12
. To calculate the size of the indirect effects, the estimate of the gross value
added created by the industry itself is multiplied by the supply chain (or Type I) multiplier for the
11 ONS (2014), ‘Input-Output Analytical Tables, 2014 Edition’ 31 October.
12 Input-output tables are designed to give a snapshot of an economy at a particular time, showing the major spending
flows from ‘final demand’ (i.e. consumer spending, government spending and exports to the rest of the world); intermediate spending patterns (i.e. what each sector buys from every other sector – the supply chain); how much of that spending stays within the economy; and the distribution of income between employment income and other income (mainly profits). In essence an input-output model is a table which shows who buys what from whom in the economy. The latest available domestic use input-output table for the UK, published by the ONS, was for calendar year 2010.

The Economic Impact of the Maritime Services Sector: Shipping
13
Water Transport sector, derived from the IO tables13
. This figure is then divided by data on
average whole economy productivity, in terms of GDP per person employed, sourced from the
ONS (£50,000 per person in 2013), to estimate the corresponding level of employment
supported. Likewise, the induced impact is calculated using the consumption (or Type II)
multiplier, in a similar procedure to that used to calculate the indirect impact14
.
The results suggests that the sector’s expenditure on inputs of goods and services supported
58,200 jobs in its UK supply chain, with an additional 37,000 jobs supported by the wage-
financed spending of both the employees in the sector and those employed in its direct supply-
chain.
Therefore, taking the direct, indirect and induced impacts together, the UK shipping industry
supported 229,100 jobs in 2013, accounting for 0.7% of total UK employment or 1 in every 141
jobs.
4.2 Indirect and induced impact on GDP contribution
The shipping industry’s expenditure on inputs of goods and services is estimated to support a
£2.9 billion gross value added contribution to UK GDP in 2013, with a further £1.8 billion
supported through wage-financed consumption. This implies that the shipping sector supported
a total gross value added contribution to UK GDP of £7.7 billion, equivalent to £1 in every £209
of economic output produced in the UK15
.
4.3 Indirect and induced contribution to the Exchequer
A further benefit of these indirect and induced impacts is that they generate additional tax
revenues for the Government. Using a similar methodology to that employed for the direct tax
impact, it was possible to estimate the corporation, NICs and indirect taxes paid by the shipping
industry’s expenditure on inputs of goods and services and payment of wages. However, for
income tax the analysis uses data on the average gross earnings of employees in the wider UK
economy in 2013, sourced from the ONS’ Annual Survey of Hours and Earnings (ASHE),
combined with income tax and NIC allowances and tax bands for 2013/14, sourced from HMRC.
The indirect contribution to the Exchequer is estimated to have been around £841 million, while
the additional induced impact amounts to £534 million in tax revenues in 2013. Taking the
direct, indirect and induced impacts together, the total impact of the shipping sector amounted
to £2.0 billion in tax revenues in 2013 (Chart 4.2).
13 A Type I multiplier shows the activity generated by the sectors spending on inputs of goods and services. It measures the size
of the direct and indirect effects divided by directs effects.
14 A Type II multiplier shows the activity generated by spending on inputs of goods and services and by the spending of
households. It measures the size of the direct, indirect and induced effects divided by direct effects.
15 This report does not include any comparison to 2011 total effect; this is because the 2011 report was based on the 2005 ONS
Input-Output table, while this study employs the 2010 table (the latest published). This would make comparison inaccurate, as the size of the multipliers is different at this time round due to changes in import penetration and taxation paid.

The Economic Impact of the Maritime Services Sector: Shipping
14
Chart 4.1: Summary of tax revenues generated by the shipping industry in 2013
0
100
200
300
400
500
600
700
800
NICs Indirect Income Corporation
Induced Indirect Direct
£ million
Source : UK Chamber of Shipping, ONS, HMRC, Oxford Economics

The Economic Impact of the Maritime Services Sector: Shipping
15
5 Regional impact of the Shipping sector
This chapter details the contribution of the shipping industry to employment and gross value
added in the UK’s nations and regions. It also presents the findings in terms of the direct,
indirect and induced effects, illustrating how the total impact presented in Chapter 4 is
distributed geographically.
KEY POINTS
In 2013, an estimated 11,200 (or 31%) of the 35,700 UK nationals employed in the
shipping industry were based in Scotland. The North West ranked second, with 4,200
people (or 12% of total) employed in the shipping industry.
In 2013, the shipping industry generated nearly £500 million gross value added
contribution to GDP in London, as many large shipping companies are headquartered in
the region.
When including the wider multiplier effects of the indirect and induced impacts, the
shipping industry supports a £1.5 billion gross value added contribution in the capital (or
24% of the UK total). However, relative to the size of the economy, the shipping industry
is most important to Scotland economy, supporting 0.6% of the country’s GDP.
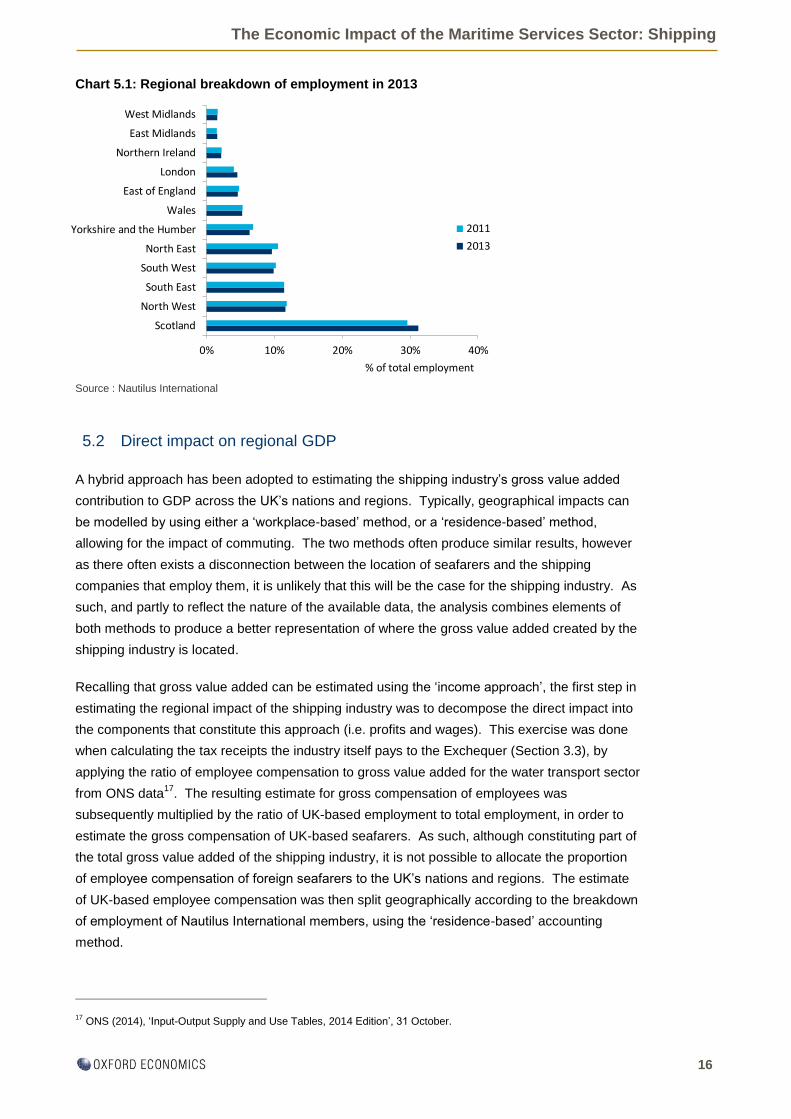
5.1 Direct impact on regional employment
Nautilus International16
kindly provided data on the distribution of their full members in the UK’s
nations and regions. Chart 5.1 illustrates the breakdown, indicating that 31% of active seafarers
were based in Scotland, followed by the North West and then the South East. Combining the
geographic breakdown with the estimate of the total number of UK-based nationals suggests
that the shipping industry directly employed nearly 11,200 people in Scotland in 2013, 4,200 in
the North West and a further 4,100 in the South East.
16 The trade union for maritime professionals at sea and ashore.
The Economic Impact of the Maritime Services Sector: Shipping
16
Chart 5.1: Regional breakdown of employment in 2013
Source : Nautilus International
5.2 Direct impact on regional GDP
A hybrid approach has been adopted to estimating the shipping industry’s gross value added
contribution to GDP across the UK’s nations and regions. Typically, geographical impacts can
be modelled by using either a ‘workplace-based’ method, or a ‘residence-based’ method,
allowing for the impact of commuting. The two methods often produce similar results, however
as there often exists a disconnection between the location of seafarers and the shipping
companies that employ them, it is unlikely that this will be the case for the shipping industry. As
such, and partly to reflect the nature of the available data, the analysis combines elements of
both methods to produce a better representation of where the gross value added created by the
shipping industry is located.
Recalling that gross value added can be estimated using the ‘income approach’, the first step in
estimating the regional impact of the shipping industry was to decompose the direct impact into
the components that constitute this approach (i.e. profits and wages). This exercise was done
when calculating the tax receipts the industry itself pays to the Exchequer (Section 3.3), by
applying the ratio of employee compensation to gross value added for the water transport sector
from ONS data17
. The resulting estimate for gross compensation of employees was
subsequently multiplied by the ratio of UK-based employment to total employment, in order to
estimate the gross compensation of UK-based seafarers. As such, although constituting part of
the total gross value added of the shipping industry, it is not possible to allocate the proportion
of employee compensation of foreign seafarers to the UK’s nations and regions. The estimate
of UK-based employee compensation was then split geographically according to the breakdown
of employment of Nautilus International members, using the ‘residence-based’ accounting
method.
17 ONS (2014), ‘Input-Output Supply and Use Tables, 2014 Edition’, 31 October.
0% 10% 20% 30% 40%
Scotland
North West
South East
South West
North East
Yorkshire and the Humber
Wales
East of England
London
Northern Ireland
East Midlands
West Midlands
2011
2013
% of total employment

The Economic Impact of the Maritime Services Sector: Shipping
17
Gross profits were allocated geographically using the ‘workplace-based’ approach. This was
based on returns to the UK Chamber of Shipping’s balance of payments inquiry 2013, an annual
survey of members which forms part of the ONS’ balance of payments accounts, by allocating
shipping revenues to regions based on the location of respondents’ head offices. The
breakdown of shipping revenues was subsequently applied to the estimate of gross profits to
apportion this component of gross value added to the UK’s nations and regions.
The results suggest that, differently from employment, the shipping sector in London contributed
nearly £500 million in gross value added to the capital in 2013 (or 41% of the UK’s total (Chart
5.2)) 18
. This is in sharp contrast to employment data, which suggests that London only accounts
for 5% of UK-based employment. This is because many shipping companies are
headquartered in London and, as such, will account for a large share of industry profits.
Scotland ranks second with an estimated gross value added contribution of £200 million (17% of
total) and the South East of England third, with the shipping industry their generating an
estimated £150 million contribution to GDP (or 12% of the total).
Chart 5.2: Regional breakdown of the shipping industry’s gross
value added contribution to GDP in 2013
5.3 Multiplier impacts on the UK regions
In addition to the economic activity created by the shipping industry itself, it also impacts on the
UK’s nations and regions through its expenditure on inputs of goods and services and payment
of wages to staff, who subsequently spend their income. The shipping industry based in one
part of the UK, frequently sources inputs from suppliers located in another region.
In order to calculate the geographical composition of the indirect impact, data was sourced from
the ONS’ Annual Business Survey (ABS), which provides a breakdown of gross value added by
broad industrial sector. This was combined with the indirect contribution to GDP, calculated in
18 Based on a total direct GVA impact of £1.3 billion, representing the total contribution to UK GDP that could be allocated on
a regional basis. As such, the remaining £1.7 billion represents amounts that would accrue to foreign seafarers.
North East5%
North West6%
Yorkshire and the Humber
3%East Midlands
1%West Midlands
1%East of England
4%
London41%
South East13%
South West5%
Wales3%
Scotland17%
Northern Ireland1%
Source : UK Chamber of Shipping, ONS, Oxford Economics

The Economic Impact of the Maritime Services Sector: Shipping
18
Section 4.2, which was split into broad industrial sectors according to the breakdown of
intermediate consumption of the industries that comprise the shipping sector as defined by this
report, according to ONS analytical input-output tables19
. The resulting model apportions the
indirect impact of the shipping sector to the different nations and regions for each of the broad
industrial sectors based on the distribution of total UK output for that industry. A similar method
was used to estimate the regional induced impacts, but rather than intermediate consumption,
the distribution of households’ consumer expenditure was used to calculate the induced gross
value added of the shipping sector to the UK’s nations and regions, again sourced from ONS
analytical input-output tables.
The level of employment supported was estimated by dividing the estimates of indirect and
induced contribution to GDP for each region by data on the average whole economy productivity
sourced from the ONS (see Section 4.1). The full breakdown of the impact of the UK shipping
industry by region is presented in Table 5.1 and Chart 5.3, illustrating that, when including the
wider multiplier impacts of the indirect and induced channels of impact, London accounts for
£1,470 million (or 25% of total) of the gross value added supported by the shipping industry. It
is followed by the South East at £850 million (14% of total) and Scotland at £570 million (10% of
total). However, when considered relative to the size of the nation’s or region’s economy, the
shipping industry has the greatest importance in Scotland, where it supports over 0.5% of total
economic output. Its relative importance is also high in the North East of England and Wales,
comprising 0.5% of both areas’ total output.
Table 5.3: Regional impact of the UK shipping industry in 201320
19 ONS (2014), ‘Input-Output Supply and Use Tables, 2014 Edition’, 31 October.
20 Figures may not sum due to rounding
Direct Indirect Induced Total % of GVA Direct Indirect Induced Total% of
Employment
South West 60 220 140 430 0.4% 3,500 4,400 2,800 10,800 0.5%
South East 150 460 240 850 0.4% 4,100 9,100 4,800 18,000 0.5%
London 500 590 390 1,470 0.5% 1,600 11,800 7,700 21,100 0.5%
East of England 50 270 160 470 0.4% 1,600 5,500 3,100 10,200 0.4%
East Midlands 10 190 120 320 0.4% 600 3,800 2,500 6,800 0.4%
West Midlands 10 230 140 380 0.4% 600 4,500 2,900 8,000 0.3%
North West 70 290 190 560 0.4% 4,200 5,900 3,800 13,900 0.5%
Yorkshire and the Humber 40 200 140 380 0.4% 2,300 4,000 2,900 9,100 0.4%
North East 60 80 60 210 0.5% 3,400 1,600 1,300 6,300 0.6%
England 950 2,530 1,580 5,070 0.4% 21,900 50,600 31,800 104,200 0.4%
Wales 40 100 70 210 0.5% 1,900 2,000 1,400 5,300 0.4%
Northern Ireland 10 70 40 120 0.4% 800 1,300 800 2,900 0.4%
Scotland 200 220 150 570 0.5% 11,200 4,300 3,000 18,500 0.8%
United Kingdom 1,210 2,910 1,850 5,970 0.4% 35,700 58,200 37,000 130,900 0.5%
Source: UK Chamber of Shipping, Nautilus International, ONS, Oxford Economics
GVA (£million) Employment

The Economic Impact of the Maritime Services Sector: Shipping
19
Chart 5.4: Summary of the regional GDP contribution of the UK shipping industry in 2013
0.0 0.2 0.4 0.6 0.8 1.0 1.2 1.4 1.6
London
South East
Scotland
North West
East of England
South West
Yorkshire andthe Humber
East Midlands
Wales
North East
Northern Ireland
Direct
Indirect
Induced
£ billion

The Economic Impact of the Maritime Services Sector: Shipping
20
6 The impact of the tonnage tax
This chapter updates the scenario analysis from previous research, which examined the role
tonnage tax has played in enhancing the contribution that the shipping industry makes to the UK
economy. While it is impossible to simulate the counterfactual of what would have happened to
the UK shipping industry if the previous tax arrangements were retained, a scenario based on
the continued trending decline in UK fleet tonnage prior to the introduction of tonnage tax is
presented.
KEY POINTS
It is estimated that the UK shipping industry itself would have generated 28,100 fewer
jobs, contributed £2.3 billion less value added to GDP, and generated £472 million less
for the Exchequer in 2013 if the tonnage tax regime had not been introduced.
When considering the wider multiplier impacts on the UK economy, the counterfactual
scenario would have supported a £4.9 billion smaller value added contribution to GDP,
78,500 fewer jobs and £1.2 billion less in tax receipts if the tonnage tax had not been
implemented.
Tonnage tax was introduced in the UK when the Finance Act 2000 became law in July 2000. It
was introduced to create a more competitive fiscal environment for international shipping
businesses located in the UK, recognising the mobile nature of the industry and bringing the tax
burden in line with other major maritime countries throughout the world. Companies that elect
to join the system are charged corporation tax on a fixed notional profit calculated by reference
to the net tonnage of its ships, instead of the actual profits earned from its shipping activities.
The resulting environment is one of greater transparency and stability for companies choosing
to opt-in to the system. The UK regime also includes a minimum training requirement every
year, designed to foster UK seafarer talent.
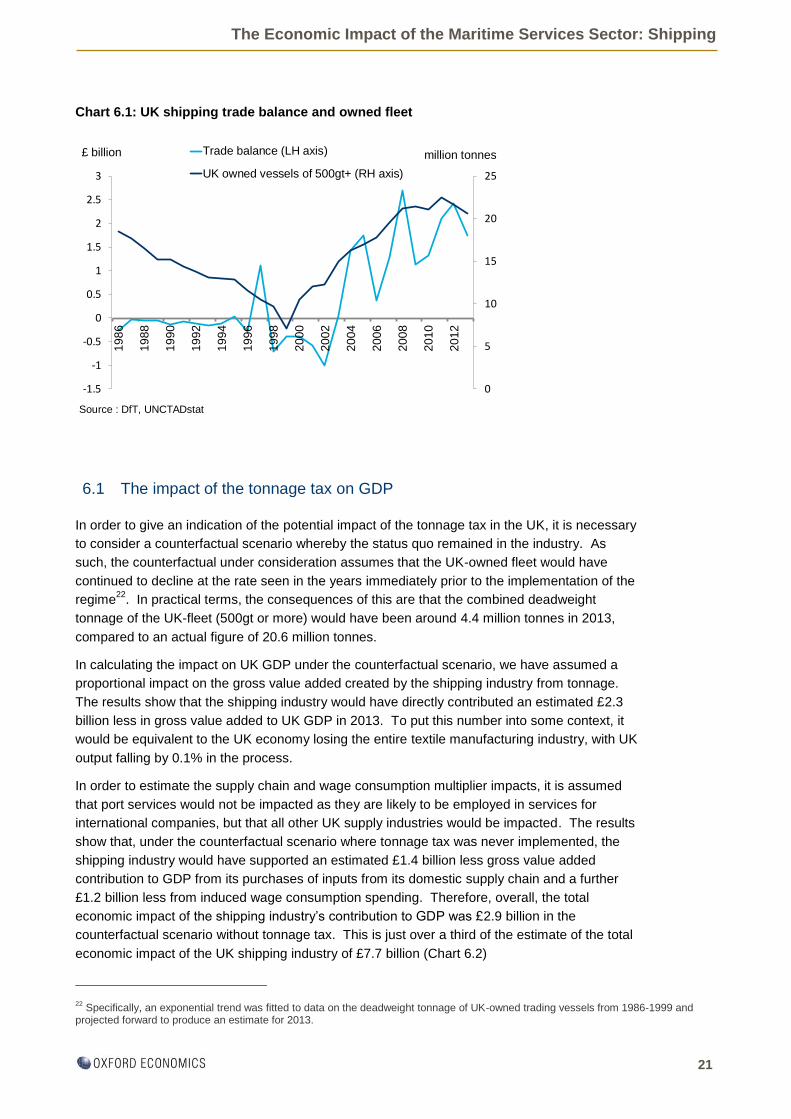
Prior to the introduction of tonnage tax, the number of UK-owned vessels was in steady decline,
with the UK recording annual deficits on shipping services of up to £1 billion. The introduction of
a tonnage tax regime in 2000 is widely believed to have been an important contributing factor in
reversing this long-run trend of decline21
. As Chart 6.1 illustrates, the industry subsequently
experienced rapid growth. Since recording its first significant trade surplus in 2004, the UK has
continued to maintain its position as a strong net exporter of shipping services to the rest of the
world. In terms of the deadweight tonnage, the size of the UK fleet has nearly trebled since
1999.
21 See Department for transport (DfT) and the Inland Revenue (2004), and the House of Commons Transport
Committee (2005)
The Economic Impact of the Maritime Services Sector: Shipping
21
Chart 6.1: UK shipping trade balance and owned fleet
6.1 The impact of the tonnage tax on GDP
In order to give an indication of the potential impact of the tonnage tax in the UK, it is necessary
to consider a counterfactual scenario whereby the status quo remained in the industry. As
such, the counterfactual under consideration assumes that the UK-owned fleet would have
continued to decline at the rate seen in the years immediately prior to the implementation of the
regime22
. In practical terms, the consequences of this are that the combined deadweight
tonnage of the UK-fleet (500gt or more) would have been around 4.4 million tonnes in 2013,
compared to an actual figure of 20.6 million tonnes.
In calculating the impact on UK GDP under the counterfactual scenario, we have assumed a
proportional impact on the gross value added created by the shipping industry from tonnage.
The results show that the shipping industry would have directly contributed an estimated £2.3
billion less in gross value added to UK GDP in 2013. To put this number into some context, it
would be equivalent to the UK economy losing the entire textile manufacturing industry, with UK
output falling by 0.1% in the process.
In order to estimate the supply chain and wage consumption multiplier impacts, it is assumed
that port services would not be impacted as they are likely to be employed in services for
international companies, but that all other UK supply industries would be impacted. The results
show that, under the counterfactual scenario where tonnage tax was never implemented, the
shipping industry would have supported an estimated £1.4 billion less gross value added
contribution to GDP from its purchases of inputs from its domestic supply chain and a further
£1.2 billion less from induced wage consumption spending. Therefore, overall, the total
economic impact of the shipping industry’s contribution to GDP was £2.9 billion in the
counterfactual scenario without tonnage tax. This is just over a third of the estimate of the total
economic impact of the UK shipping industry of £7.7 billion (Chart 6.2)
22 Specifically, an exponential trend was fitted to data on the deadweight tonnage of UK-owned trading vessels from 1986-1999 and
projected forward to produce an estimate for 2013.
0
5
10
15
20
25
-1.5
-1
-0.5
0
0.5
1
1.5
2
2.5
3
19
86
19
88
19
90
19
92
19
94
19
96
19
98
20
00
20
02
20
04
20
06
20
08
20
10
20
12
Trade balance (LH axis)
UK owned vessels of 500gt+ (RH axis)
£ billion million tonnes
Source : DfT, UNCTADstat

The Economic Impact of the Maritime Services Sector: Shipping
22
Chart 6.2: Estimated gross value added supported by the UK shipping
industry with and without tonnage tax in 2013
6.2 The impact of the tonnage tax on employment
To estimate the impact on employment, it is assumed that seafarer productivity is the same in
the counterfactual scenario as it is in the actual environment in 2013 and that shore-based
employees in the shipping industry (administrative and managerial staff at shipping companies)
would be impacted proportionally to the change in GDP. The results show that there would be
over 28,100 fewer UK nationals employed in the shipping industry itself under the counterfactual
scenario where the tonnage tax regime was never implemented. As such, it is estimated that
there would be 7,600 jobs in the shipping industry in the UK, or a fifth of the current estimate of
35,700 jobs.
Furthermore, when considering the wider multiplier impacts on the UK economy, it is estimated
that there would be over 27,100 fewer jobs in the supply chain and 23,200 fewer jobs in retail
and leisure outlets and their supply chains (Chart 6.3). In total, this amounts to a shortfall in
employment of nearly 78,500 jobs in the UK, approximately equal to 0.2% of total UK
employment in 2013.
Chart 6.3: Estimated employment of UK Nationals in the Shipping industry
with and without tonnage tax in 2013
3.0
0.6
2.9
1.6
1.8
0.7
0
1
2
3
4
5
6
7
8
9
With tonnage tax Without tonnage tax
Induced Indirect Direct
£ billion
Source : UK Chamber of Shipping, Oxford Economics
35.7
7.6
58.2
31.1
37.0
13.7
0
20
40
60
80
100
120
140
With tonnage tax Without tonnage tax
Induced Indirect Direct
'000 jobs
Source : UK Chamber of Shipping, Oxford Economics

The Economic Impact of the Maritime Services Sector: Shipping
23
6.3 The impact of the tonnage tax on tax revenue
To calculate the hypothetical amount of tax revenue that would have been generated by the UK
shipping industry under the counterfactual scenario, we have used the same methodology
described in Section 3.3 when we calculated the current contribution – i.e. we use information
on wages, profits and employment along with HMRC tax rates and thresholds. This suggests
that the amount of tax that the shipping industry directly contributes to the Exchequer in 2013
(under the tonnage tax regime) is £472 million higher than it would have been if the fleet had
declined in line with the counterfactual scenario. This is because the larger actual fleet size (and
therefore level of economic activity) generates higher tax receipts, despite tonnage tax making
only a limited contribution. In total, considering the tax revenues the shipping industry
generates in its supply chain and through the consumer spending of its staff, this figure would
have risen to approximately £1.2 billion.
6.4 The total impact of tonnage tax
In total, based on a counterfactual scenario whereby the tonnage tax regime was not
implemented in 2000 and the size of the UK fleet continued to fall, it is estimated that tonnage
tax has assisted in increasing the direct contribution of the UK shipping industry in 2013 by
approximately £2.3 billion, generating an additional 28,100 jobs and raising tax revenues by
£472 million. Furthermore, when considering the wider multiplier effects through the indirect
and induced channels of impact, the total contribution of the UK shipping industry is boosted by
£4.9 billion in GDP, 78,500 jobs (Chart 6.4) and £1.2 billion in tax revenue It should be noted
that the direct, indirect and induced figures for GDP, tax and employment would be mitigated as
workers found employment in other areas of the economy over time. However, the shipping
industry is a very internationally mobile one, and without tonnage tax, people working in the
industry and its supply chain may have sought alternative work abroad. This would mean that
the GDP, tax and employment data calculated here would have been permanently lost to the
UK.
Chart 6.4: The total benefits of tonnage tax as compared to counterfactual
scenario without tonnage tax in 2013
2.3
1.4
1.2
28
27
23
0
10
20
30
40
50
60
70
80
90
0
1
2
3
4
5
6
Contribution to GDP (LHS axis) Employment (RHS axis)
Direct Indirect Induced
£ million
Source : UK Chamber of Shipping, Oxford Economics
'000 jobs

The Economic Impact of the Maritime Services Sector: Shipping
24
7 Conclusion
This report has evaluated the economic impact of the UK shipping industry in 2013, providing an
update on previous research produced by Oxford Economics. Results are presented in terms of
three standard metrics (jobs, GVA and tax contribution to the Exchequer). This study also
updates the scenario analysis first carried out in the 2009 report, indicating the extent to which
the introduction of the tonnage tax in the year 2000 has altered the performance of the UK
shipping industry in the intervening period. The headline results of the study are summarised in
Chart 7.1. In 2013, the UK shipping industry:
supported a £7.7 billion gross value added contribution to UK GDP, equivalent to 0.5%
of the value of all economic activity in the UK in 2013.
supported 229,100 jobs, of which approximately 130,900 were based in the UK (i.e.
excluding foreign seafarers). This is 0.4% of total employment in the UK.
contributed £2.0 billion to the UK Exchequer through a combination of direct and
indirect taxes.
Chart 7.1: Summary of the total economic impact of the UK
shipping industry in 2013
3.0
0.6
2.9
0.8
1.8
0.5
134
58
37
0
50
100
150
200
250
0
1
2
3
4
5
6
7
8
9
Contribution to GDP(LHS axis)
Tax (LHS axis) Employment(RHS axis)
Direct Indirect Induced
£ billion '000 jobs
Source : UK Chamber of Shipping, ONS, HMRC, Oxford Economics

The Economic Impact of the Maritime Services Sector: Shipping
25
This study was financed by Maritime UK

The Economic Impact of the Maritime Services Sector: Shipping
26
OXFORD
Abbey House, 121 St Aldates
Oxford, OX1 1HB, UK
Tel: +44 1865 268900
LONDON
Broadwall House, 21 Broadwall
London, SE1 9PL, UK
Tel: +44 207 803 1400
BELFAST
Lagan House, Sackville Street
Lisburn, BT27 4AB, UK
Tel: +44 28 9266 0669
NEW YORK
5 Hanover Square, 19th Floor
New York, NY 10004, USA
Tel: +1 646 503 3050
PHILADELPHIA
303 Lancaster Avenue, Suite 1b
Wayne PA 19087, USA
Tel: +1 610 995 9600
SINGAPORE
Singapore Land Tower, 37th Floor
50 Raffles Place
Singapore 048623
Tel: +65 6829 7068
PARIS
9 rue Huysmans
75006 Paris, France
Tel: + 33 6 79 900 846
Email: [email protected]
www.oxfordeconomics.com


![Agarval Indian Maritime Sector Presentation.pdf[1]](https://static.fdocuments.net/doc/165x107/577d2f7d1a28ab4e1eb1dae4/agarval-indian-maritime-sector-presentationpdf1.jpg)

