THE ECONOMIC IMPACT OF THE RHODE ISLAND DEFENSE CLUSTER · is strategically important to the...
24
August 2017 THE ECONOMIC IMPACT OF THE RHODE ISLAND DEFENSE CLUSTER
Transcript of THE ECONOMIC IMPACT OF THE RHODE ISLAND DEFENSE CLUSTER · is strategically important to the...

August 2017
THE ECONOMIC IMPACT OF THE RHODE
ISLAND DEFENSE CLUSTER

Executive Summary
Rhode Island Defense Cluster | 1
The Defense Cluster is strategically important to the economy of Rhode Island. It is an innovative and high-tech sector that contributes to economic growth, generates high-paying jobs, and has been resilient despite economic downturns.
The Defense Cluster supported $4.3 billion in economic output in Rhode Island in 2016, which represents 7.6 percent of the state’s Gross Domestic Product. The Defense Cluster is a major source of jobs in Rhode Island.
• The Defense Cluster supported 29,196 jobs in 2016, which represents 6.2 percent of total employment based in Rhode Island.
• The 16,011 Full Time Equivalent (FTE) Defense Cluster employees include: 6,829 workers in the private defense industry.
From 2010 to 2016, employment in the private defense industry increased 18 percent.
4,824 civilian workers employed by the DoD, U.S. Coast Guard, and Rhode Island National Guard. From 2010 to 2016, the number of civilians employed in the military infrastructure increased 7 percent.
4,358 FTE military personnel.
The Defense Cluster is the highest paying sector in Rhode Island.
In 2016, the average annual wage of defense civilian workers was: • $101,400 at the NUWC Division Newport; • $91,700 for all DoD civilian employees; • $70,200 in the private defense industry.
In the Private Defense Industry, the average wage was: • 59 percent higher than the average wage in
non-farm industries ($44,200); • 46 percent higher than the average wage in
manufacturing ($48,100); • 54 percent higher than the average wage in
education and health services ($45,600), and; • Three and a half times the average wage in
leisure and hospitality services ($19,900).
The Military Defense infrastructure employs a highly qualified workforce.
• 77 percent of the civilians working for NUWC Division Newport were classified in STEM occupations (science, technology, engineering, and mathematics).
• 33 percent of all NUWC Division Newport employees held advanced academic degrees (master’s or Ph.D. degrees).
The Defense Cluster created over $2 billion in income for Rhode Island households in 2016.
• Workers employed by the Defense Cluster received $1.35 billion in direct earnings.
• The Defense Cluster supported the creation of an additional $703.5 million in indirect and induced earnings throughout the state.
The Defense Cluster generates significant tax revenues for State and local governments.
The Defense Cluster generated $146.9 million in tax revenues for State and local governments including: • $59.9 million in property taxes; • $37.5 million in sales taxes; • $35.3 million in personal income taxes; • $9.5 million in corporate taxes; • $2 million in motor vehicles registrations, and; • $2.7 million in other taxes and fees collected by
the state and local governments.
Activities in the Private Defense Industry have a strong multiplier effect throughout the state.
• Every 100 jobs created in the Private Defense Industry supports another 119 jobs via the multiplier effect in other industries of the Rhode Island economy.
• Every $100 in labor income in the Private Defense Industry creates an additional $86 in labor income via the multiplier effect throughout the state.

Rhode Island Defense Cluster | 2
Introduction
The Defense Cluster is strategically important to the economy of Rhode Island. It is an
innovative and high-tech cluster that contributes to economic growth, creates high-
paying jobs, and is resilient despite economic downturns.
The term Defense Cluster is used to refer to total defense activities including the Military
Defense Infrastructure and the Private Defense Industry (defense contractors). The Military
Defense Infrastructure includes civilian employees operating under the umbrella of the
Department of Defense, U.S. Coast Guard Personnel, Rhode Island National Guard personnel,

Rhode Island Defense Cluster | 3
and the active duty military in the Army, Navy, Marine Corps, and Air Force. The Private
Defense Industry is comprised of several NAICS (North America Industry Classification System)
sectors that are identified as conducting defense related work. Table 1 summarizes the
definition of the Defense Cluster used in this report.
Table 1: The Rhode Island Defense Cluster Military Defense Infrastructure
Department of Defense - Civilians U.S. Coast Guard Rhode Island National Guard Active Duty Military (Army/Navy/Marine Corps/Air Force)
Private Defense Industry (Defense Contractors) All Other Fabricated Metal (includes small arms & ammunition) (NAICS 33299) Search Detection, Navigational, Guidance, Aeronautical & Nautical System & Instrument Manufacturing (NAICS 334511) Ship Building & Repair (NAICS 336611) Scientific Research (physical, engineering, & life sciences) (NAICS 54171) Engineering and Computer Systems Design Services (Part of NAICS 54151 and 54133)a Other Defense-Related Activities
Defense Cluster = Military Defense Infrastructure + Private Defense Industry a Only defense-related activities in computer, mathematical, architecture, and engineering are considered.
The Naval Undersea Warfare Center Division Newport, (NUWC Division Newport), which is
located on Naval Station Newport, provides unique facilities and capabilities for research,
development, test and evaluation engineering, and fleet support for submarine warfare
systems, and other systems associated with the undersea battlespace and supports the
work of private industry contractors in Rhode Island.
NUWC Division Newport has the largest economic impact of the Rhode Island military
infrastructure. Other activities on Naval Station Newport include the Naval War College,
the Naval Justice School, and the Surface Warfare Officers School. Naval Station Newport
hosts more than 30 Naval Education Programs. As of 2016, the Naval Station Newport had
a population of 10,140 people including 2,663 officers and enlisted military personnel,
4,868 DoD civilian workers, and 2,609 contractors. In addition, the annual student
throughput at Naval Station Newport is estimated at 14,639 with a daily on-board average
of 2,068.

Rhode Island Defense Cluster | 4
The Department of Defense (DoD) has granted significant awards to private contractors
to conduct defense-related work in Rhode Island.1 According to data from
USAspending.gov, a publicly accessible website mandated by the Federal Funding
Accountability and Transparency Act of 2006, as of December 2016, the DoD had over
6,300 prime contracts and 400 sub-awards active in Rhode Island. In 2016 alone, the DoD
awarded over 4,900 prime contracts. NUWC Division Newport alone issued $487 million
in contract awards in 2016, an increase of 16 percent compared to 2012 awards. Rhode
Island companies received 54 percent of these awards in 2016, compared to 48 percent
in 2012 (See Figure 1). This implies that Rhode Island companies (private defense
industry) have leveraged their workforce capabilities, developed expertise, and increased
their technical capability to conduct research and development work for NUWC Division
Newport.
Figure 1: NUWC Annual Contract Awards ($ Millions), 2012 – 2016
Source: Commerce RI compilation using data from NUWC Division Newport.
1 See Appendix A for total contract award estimates.
$421
$386
$442 $4
63 $487
$200
$250 $2
94
$270
$262
2 0 1 2 2 0 1 3 2 0 1 4 2 0 1 5 2 0 1 6
$ M
ILLI
ON
S
Total Contract Awards / Contract Awards to RI Contractors
Rhode Island Defense Cluster | 5
Overview of the Defense Cluster
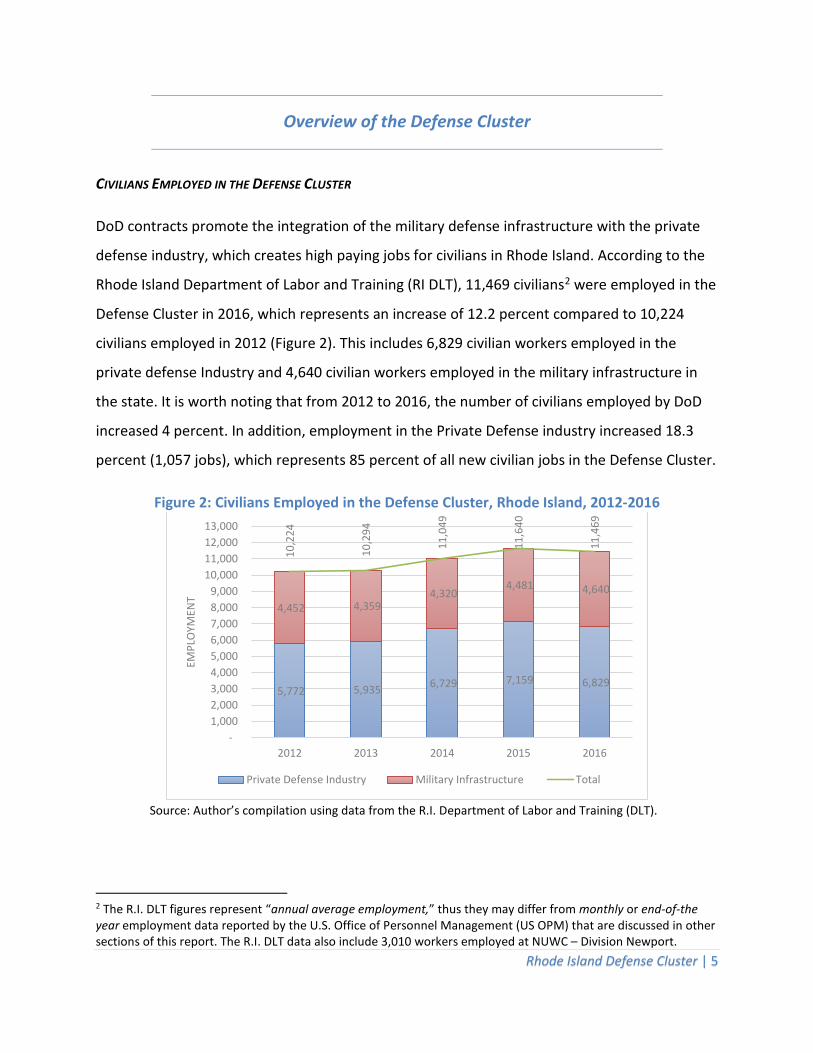
CIVILIANS EMPLOYED IN THE DEFENSE CLUSTER
DoD contracts promote the integration of the military defense infrastructure with the private
defense industry, which creates high paying jobs for civilians in Rhode Island. According to the
Rhode Island Department of Labor and Training (RI DLT), 11,469 civilians2 were employed in the
Defense Cluster in 2016, which represents an increase of 12.2 percent compared to 10,224
civilians employed in 2012 (Figure 2). This includes 6,829 civilian workers employed in the
private defense Industry and 4,640 civilian workers employed in the military infrastructure in
the state. It is worth noting that from 2012 to 2016, the number of civilians employed by DoD
increased 4 percent. In addition, employment in the Private Defense industry increased 18.3
percent (1,057 jobs), which represents 85 percent of all new civilian jobs in the Defense Cluster.
Figure 2: Civilians Employed in the Defense Cluster, Rhode Island, 2012-2016
Source: Author’s compilation using data from the R.I. Department of Labor and Training (DLT).
2 The R.I. DLT figures represent “annual average employment,” thus they may differ from monthly or end-of-the year employment data reported by the U.S. Office of Personnel Management (US OPM) that are discussed in other sections of this report. The R.I. DLT data also include 3,010 workers employed at NUWC – Division Newport.
5,772 5,935 6,729 7,159 6,829
4,452 4,359 4,320
4,481 4,640
10,2
24
10,2
94
11,0
49
11,6
40
11,4
69
- 1,000 2,000 3,000 4,000 5,000 6,000 7,000 8,000 9,000
10,000 11,000 12,000 13,000
2012 2013 2014 2015 2016
EMPL
OYM
ENT
Private Defense Industry Military Infrastructure Total

Rhode Island Defense Cluster | 6
WAGES IN THE DEFENSE CLUSTER
Figure 3 shows that the Defense Cluster is the highest paying sector in Rhode Island, which
through employment and high compensation, contributes significantly to the state’s economy.
In 2016, the average wage of civilian employees working for NUWC Division Newport was
$101,400, compared to an average of $91,700 for all DoD civilian employees and to an average
of $70,200 for private defense workers. Data from the U.S. Office of Personnel Management
show that the DoD civilian workforce in Rhode Island changed its composition over the last 5
years. More precisely, the proportion of civilian employees with 2 years or less of service
increased from 16.6 percent in 2012 to 22.4 percent in 2016. This caused the average length of
service to decrease from 15.4 years to 13.7 years. Entry salary is typically lower than that of
workers with longer tenure. This significant change in the workforce composition and reduction
of the average length of service of the DoD civilian workforce caused the average salary of DoD
civilians to decrease approximately 3 percent in 2016 compared to 2012 salary levels.
Figure 3: Annual Average Wages, Rhode Island, 2016
Source: Author’s compilation using data from the R.I. Department of Labor and Training (RI DLT), U.S. Bureau of Labor Statistics (US BLS), and U.S. Office of Personnel Management (US OPM).
$101.4
$91.7
$70.2
$56.1
$54.0
$48.1
$45.6
$44.2
$35.1
$19.9
- 15 30 45 60 75 90 105
NUWC - Div. Newport
DoD Civilians
Private Defense Industry
Professional & Business Services
Construction
Manufacturing
Education & Health Services
Average non-farm Industry
Trade, Transportation, & Utilities
Leisure and Hospitality
Average Annual Pay ($ 1,000)

Rhode Island Defense Cluster | 7
Notwithstanding, in Rhode Island the average compensation of civilians working in the Defense
Cluster is significantly higher than the average wage for all non-farm3 workers ($44,200) as well
as for workers in traditional industries including professional and business services ($56,100),
construction ($54,000), manufacturing ($48,100), and education and health services ($45,600).
The $70,200 average wage in the Rhode Island private defense industry is 59 percent higher
than the average wage in non-farm industries ($44,200), 46 percent higher than the average
wage in manufacturing ($48,100), 54 percent higher than the average wage in education and
health services ($45,600), and three and half times the average wage in the leisure and
hospitality industry ($19,900).
COMPOSITION OF THE CIVILIAN EMPLOYMENT IN THE DEFENSE CLUSTER
Private Defense Industry
The composition of the Private Defense Industry is subject to debate on which private sectors
should be included or excluded in the calculations. The Rhode Island Department of Labor and
Training (DLT) conducted a standard calculation starting with a list of companies engaged in
defense-related activities in the state. Then it aggregated the figures using major NAICS codes.
This aggregation shows that Ship Building and Repair, the largest private Defense Cluster,
employed 3,820 workers and accounted for 56 percent of the private defense employment in
the state. The second largest defense industry is Search Detection, Navigation, Guidance,
Aeronautical and Nautical System, and Instrument Manufacturing, with 885 workers (13
percent of employment). Scientific Research services employed 631 workers and Other
Fabricated Metal employed 420 workers. Firms engaged in all other defense-related4 activities
employed 1,073 workers in Rhode Island.
3 Non-farm workers is a measure of the number of workers in the economy that excludes farm workers, private household employees, unpaid volunteers, and the unincorporated self-employed. 4 It includes employment for engineering and computer systems design services.
Rhode Island Defense Cluster | 8
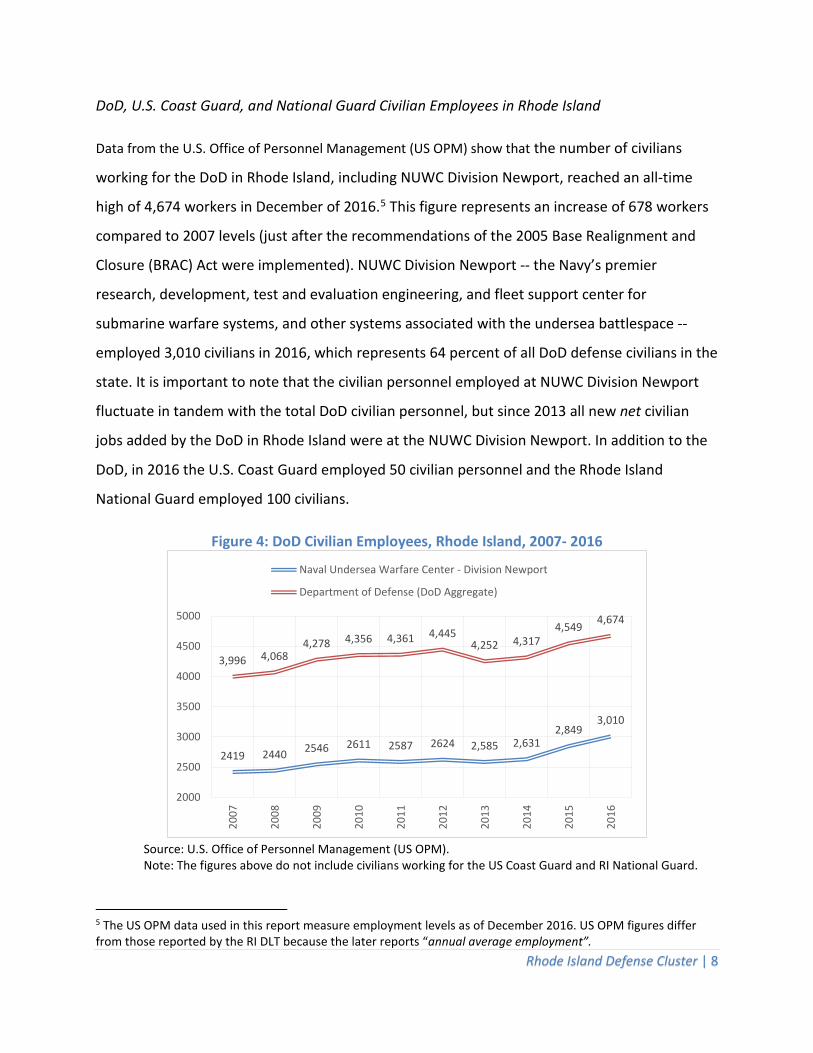
DoD, U.S. Coast Guard, and National Guard Civilian Employees in Rhode Island
Data from the U.S. Office of Personnel Management (US OPM) show that the number of civilians
working for the DoD in Rhode Island, including NUWC Division Newport, reached an all-time
high of 4,674 workers in December of 2016.5 This figure represents an increase of 678 workers
compared to 2007 levels (just after the recommendations of the 2005 Base Realignment and
Closure (BRAC) Act were implemented). NUWC Division Newport -- the Navy’s premier
research, development, test and evaluation engineering, and fleet support center for
submarine warfare systems, and other systems associated with the undersea battlespace --
employed 3,010 civilians in 2016, which represents 64 percent of all DoD defense civilians in the
state. It is important to note that the civilian personnel employed at NUWC Division Newport
fluctuate in tandem with the total DoD civilian personnel, but since 2013 all new net civilian
jobs added by the DoD in Rhode Island were at the NUWC Division Newport. In addition to the
DoD, in 2016 the U.S. Coast Guard employed 50 civilian personnel and the Rhode Island
National Guard employed 100 civilians.
Figure 4: DoD Civilian Employees, Rhode Island, 2007- 2016
Source: U.S. Office of Personnel Management (US OPM). Note: The figures above do not include civilians working for the US Coast Guard and RI National Guard.
5 The US OPM data used in this report measure employment levels as of December 2016. US OPM figures differ from those reported by the RI DLT because the later reports “annual average employment”.
2419 2440 2546 2611 2587 2624 2,585 2,6312,849
3,010
3,996 4,0684,278 4,356 4,361 4,445
4,252 4,3174,549 4,674
2000
2500
3000
3500
4000
4500
5000
2007
2008
2009
2010
2011
2012
2013
2014
2015
2016
Naval Undersea Warfare Center - Division Newport
Department of Defense (DoD Aggregate)

Rhode Island Defense Cluster | 9
Qualifications of DoD Civilian Employees
The civilians employed by DoD are highly qualified. In 2016, 77 percent of the civilians working
for NUWC Division Newport were classified in science, technology, engineering, and
mathematics (STEM) occupations, and 33 percent of all workers held advanced academic
degrees (master’s or Ph.D. degrees). In addition, the total workforce of the Department of
Defense in Rhode Island is comprised of 52.9 percent of STEM occupations, with 70.7 percent of
workers having a bachelor’s or advanced degree (master’s/Ph.D.) and 30.1 percent of workers
with a master’s or Ph.D. degree.
Table 2: Qualification of the DoD Civilian Employees, Rhode Island, 2016 Civilian
Employment STEMa
Occupations Bachelor + Advanced
Degree Master /
Ph.D. Degree Count Count % Count % Count % Navy 4,139 2,422 58.5% 3,132 75.7% 1369 33.1%
NUWC Division Newportc 3,010 2,330 77.4% 2,552 84.8% 1006 33.4% Air Force 216 30 13.9% 23 10.6% 0 0.0% Army 222 18 8.1% 40 18.0% 16 7.2% Others 97 3 3.1% 37 38.1% 21 21.6% Total DoDb 4,674 2,473 52.9% 3,307 70.7% 1,406 30.1% Source: As of December 2016, U.S. Office of Personnel Management. a STEM is an acronym referring to science, technology, engineering, and mathematics. b This figure does not include the R.I. National Guard and U.S. Coast Guard Personnel. c. NUWC Division Newport is part of Navy count. EMPLOYMENT IN THE MILITARY DEFENSE INFRASTRUCTURE
In 2016, the Rhode Island Military Defense Infrastructure employed 6,177 military personnel
stationed in Rhode Island. This figure includes 2,776 active-duty military in the Army, Navy,
Marine Corps, and Air Force, 286 U.S. Coast Guard personnel, and 3,115 Rhode Island National
Guard members. About 73 percent of Rhode Island National Guard members are traditional
Guard personnel who work part-time. Table 3 provides full time equivalent (FTE) personnel
estimates. While many of the active-duty military and Rhode Island National Guard personnel
are deployed overseas, their families spend their compensation on goods and services in Rhode
Island and contribute to sales and employment across all sectors of the state’s economy. They
also pay personal income tax and other taxes in Rhode Island.

Rhode Island Defense Cluster | 10
Table 3: Military Defense Infrastructure Personnel, Rhode Island, 2016 Personnel FTE Personnel
Active Duty Military (Army/Navy/Marine Corps/Air Force) 2,776a 2,776 US Coast Guard 286b 286 Rhode Island National Guard 3,115c 1,296 Total Military Defense Infrastructure 6,177 4,358 Notes: a As of May 2016, Defense Manpower Data Center (Available at www.governing.com). It includes all active -
duty military (Army/Navy/Marine Corps/Air Force).
b As of May 2016, Defense Manpower Data Center (Available at www.governing.com). c Rhode Island National Guard Annual Report. About 73 percent of Rhode Island Guard members are traditional Guard personnel (part-time).
SUMMARY OF EMPLOYMENT IN THE DEFENSE CLUSTER
Table 4 summarizes the impact of the Defense Cluster on employment in Rhode Island. Overall,
the Defense Cluster employs 17,860 (16,011 FTE) military and civilian workers in the state.
Civilian workers account for over two-thirds of total employment in the Defense Cluster.
Table 4: Employment in the Defense Cluster, Rhode Island, 2016 Civilians Military Total FTE Total Department of Defense (DoD) 4,674 2,776 7,450 7,450 US Coast Guard 50 286 336 336 Rhode Island National Guard 100 3,115 3,215 1,396 Private Defense Industry 6,829 - 6,829 6,829 Total Defense Cluster 11,653 6,177 17,830 16,011
INCOME CREATION IN THE DEFENSE CLUSTER
In 2016, the Defense Cluster created over $1.35 billion in earnings in Rhode Island. This figure
includes $479.1 million in income created by the Private Defense Industry and $872.1 million in
income created by the Military Defense Infrastructure. The civilians employed by DoD earned a
total of $428.4 million. Total wages and benefits for active-duty military are estimated at
$150.7 million. The Rhode National Guard added $110.1 million in income and the U.S. Coast
Guard added another $29.8 million in income to the state economy.

Rhode Island Defense Cluster | 11
This report also estimates that retirement and survivor benefits collected by military individuals
or their survivor families generated $153 million in income in Rhode Island. This figure does not
include benefits paid to DoD civilian retirees and survivors. It is important to highlight that 22
states do not tax military pension income and 22 other states plus the District of Columbia
provide some exemption for military pension benefits.6 Military pension income is taxed to the
extent that such income is taxed at the federal level in six states: Rhode Island, Vermont,
California, North Dakota, Nebraska, and Minnesota. Therefore, policy changes that would align
Rhode Island’s tax policy with that of most states across the nation have the potential to attract
and retain military retirees in the state. Of note, many military retirees start second careers
upon their retirement and contribute valuable skillsets to the State’s workforce.
Table 5: Income Creation in the Defense Cluster, Rhode Island, 2016 Organization/Industry $ (1,000)
Private Defense Industrya 479,113.8 Military Defense Infrastructure 872,100.4
Civilians employed by DoDb 428,381.4 US Coast Guard in RIc 29,831.5 Rhode Island National Guardd 110,083.1 Active-Duty Military (Army/Navy/Marine Corps/Air Force)e 150,752.4
Military Retirees & Survivorsf 153,052.0
Defense Cluster - Total 1,351,214.2 Notes: a Rhode Island Department of Labor and Training;
b As of December 2016, U.S. Office of Personnel Management; c The U.S. Coast Guard payroll figure is an estimate calculated as the product of the U.S. Coast Guard operating expenses in the state of Rhode Island ($35.8 million) times the Coast Guard national average share of payroll to total operating expenses (for both military and civilian personnel);
d The R.I. National Guard payroll figure includes both federal and state wages and salaries paid to civilian and military personnel. Source: Rhode Island National Guard Annual Report 2016.
e This is an estimate calculated using the 2016 Basic Pay Scale (average of 14 years of service) and the national distribution of personnel by rank. It also includes the national average allowances for housing and other personnel benefits. This estimate is conservative because the distribution of personnel at the Naval Station Newport is skewed toward mid-career to senior officers.
f DoD Office of the Actuary. This figure does not include benefits paid to DoD civilian retirees and survivors. See appendix B for details and calculation.
6 Source: Newport County Chamber of Commerce (2015). The Economic Impact of Social Security and Pension Income Taxes on Rhode Island’s Economy.

Rhode Island Defense Cluster | 12
The Multiplier Impact of the Defense Cluster
The data presented in Tables 4 and 5 demonstrate that the Defense Cluster contributes
significantly to the state economy through employment and income creation. These figures,
however, only measure the direct benefit of the Defense Cluster in the state.
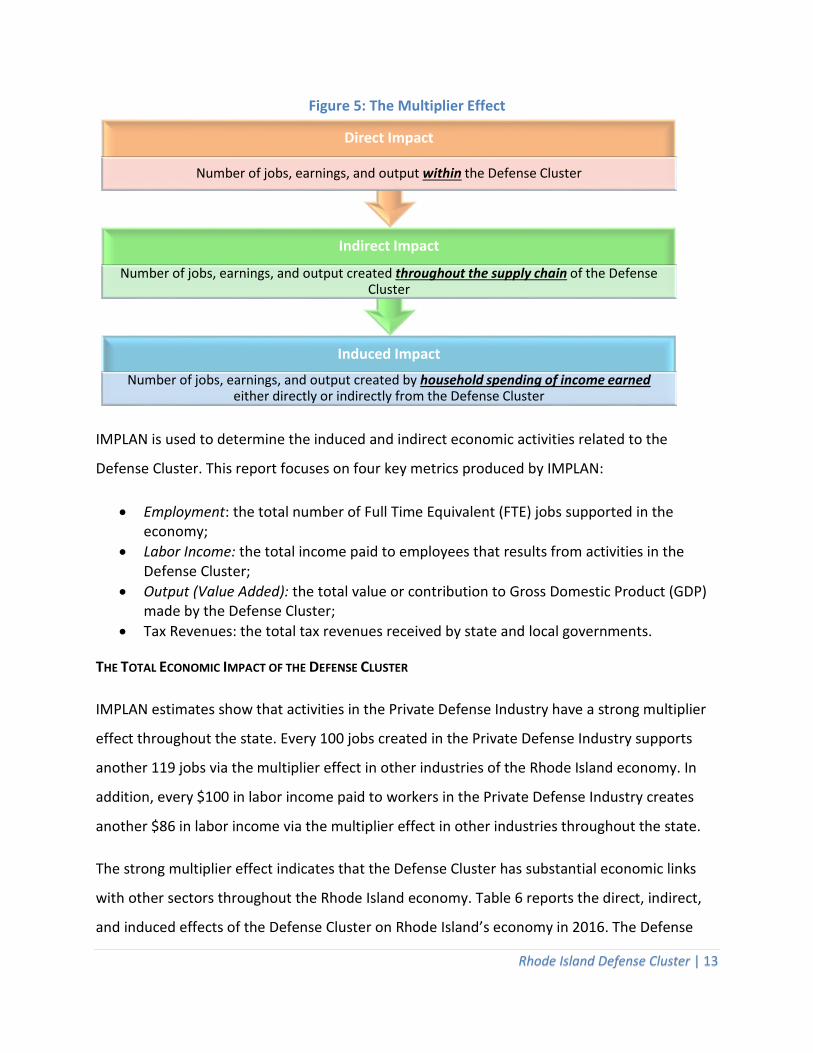
The Defense Cluster contributes to the local economy through three channels (See Figure 5).
First, the Defense Cluster employs military and civilian personnel and purchases goods and
services from local vendors. The employment, income, and spending with local vendors
(construction, etc.) is the direct impact of the Defense Cluster on the state’s economy.
The second channel refers to the inter-industry impacts of the input-output analysis and is
called the indirect impact. Providers of goods and services use the payments from the Defense
Cluster to engage in subsequent rounds of input purchases (employee wages, equipment, rents,
raw materials, etc.), which create additional employment, income, and output in the economy.
The third channel is called the induced effect because it refers to economic activity generated
by the spending of income earned directly from the Defense Cluster as well as the income
earned via the indirect impact on local business and services. This spending further stimulates
the private sector and, thus, induces the creation of additional jobs, income, and output in the
state.
This report uses IMpact analysis for PLANning (IMPLAN ) to account for inter-industry
relationships and to determine how economic activities related to the Defense Cluster affect
the Rhode Island economy. IMPLAN is an economic analysis tool that takes data from multiple
government sources and employs an estimation method based on industry accounts (or Input-
Output Matrix) that allows using multipliers to make estimations of how changes in
income/spending impact the local economy (see Appendix C for more details).
Rhode Island Defense Cluster | 13
Figure 5: The Multiplier Effect
IMPLAN is used to determine the induced and indirect economic activities related to the
Defense Cluster. This report focuses on four key metrics produced by IMPLAN:
• Employment: the total number of Full Time Equivalent (FTE) jobs supported in the economy;
• Labor Income: the total income paid to employees that results from activities in the Defense Cluster;
• Output (Value Added): the total value or contribution to Gross Domestic Product (GDP) made by the Defense Cluster;
• Tax Revenues: the total tax revenues received by state and local governments.
THE TOTAL ECONOMIC IMPACT OF THE DEFENSE CLUSTER
IMPLAN estimates show that activities in the Private Defense Industry have a strong multiplier
effect throughout the state. Every 100 jobs created in the Private Defense Industry supports
another 119 jobs via the multiplier effect in other industries of the Rhode Island economy. In
addition, every $100 in labor income paid to workers in the Private Defense Industry creates
another $86 in labor income via the multiplier effect in other industries throughout the state.
The strong multiplier effect indicates that the Defense Cluster has substantial economic links
with other sectors throughout the Rhode Island economy. Table 6 reports the direct, indirect,
and induced effects of the Defense Cluster on Rhode Island’s economy in 2016. The Defense
Induced Impact
Number of jobs, earnings, and output created by household spending of income earned either directly or indirectly from the Defense Cluster
Indirect Impact
Number of jobs, earnings, and output created throughout the supply chain of the Defense Cluster
Direct Impact
Number of jobs, earnings, and output within the Defense Cluster

Rhode Island Defense Cluster | 14
Cluster added a total of $4.3 billion to the economy, which represents 7.6 percent of the state’s
Gross Domestic Product.
Table 6: Economic Impact: Employment, Income, and Value Added, 2016 Impact Type Employment
(FTE) Labor Income
(Million $) Value Added
(Million $) Direct Effect 16,011 $1,350.2 $3,162.1 * Indirect Effect 3,774 $235.0 $354.7 Induced Effect 9,411 $468.5 $822.7 Total Effect 29,196 $2,053.7 $4,339.5 Share of the Rhode Island Economy 6.2% 8.4% 7.6% Source: Authors’ calculations using IMPLAN.
In addition, the Defense Cluster created $2.05 billion in labor income for households in Rhode
Island, which accounts for 8.4 percent of labor income in the state. Direct earnings (payroll)
totaled $1.35 billion, indirect earnings totaled $235 million, and induced earnings totaled
$468.5 million. In addition, the Defense Cluster supported 29,196 FTE jobs, 6.2 percent of the
jobs based in Rhode Island.
Figure 6 shows that of the 29,196 jobs supported by the Defense Cluster, 12,328 jobs (42
percent) are in the service sector, 9,281 jobs (32 percent) are in the government sector, 5,260
jobs (18 percent) are in manufacturing, 1,788 jobs (6 percent) are in Retail and Wholesale
Trade, 393 jobs are in Transportation, Information7, Power and Utilities (TIPU), and 147 jobs
(0.5 percent) are in other industries.
7 According to the U.S. Bureau of Labor Statistics, the Information sector comprises establishments engaged in the following processes: (a) producing and distributing information and cultural products, (b) providing the means to transmit or distribute these products as well as data or communications, and (c) processing data.

Rhode Island Defense Cluster | 15
Figure 6: Total Employment Impact of the Defense Cluster, by Industry, 2016
Source: Authors’ calculations using IMPLAN. “Total employment impact” includes direct, indirect and induced effects.
From a total of 12,328 service jobs created by the defense industry, 1,704 are direct jobs and
10,624 are indirect and induced jobs. More specifically, the Defense Cluster created 1,704 direct
jobs in Professional and Business services and supported (indirectly and induced) 2,968 jobs in
Professional and Business services, 2,706 jobs in Educational and Health Services, 1,908 jobs in
Leisure and Hospitality, 1,130 jobs in Finance, 618 in Real Estate and Rental services, 259 jobs in
Information, and 1,035 jobs in other service activities. As noted above, most of the service jobs
created by the Defense Cluster are the result of indirect and induced economic effects.
The tax revenue projections presented in this report are estimates of the tax revenues
calculated from the direct, indirect, and induced spending associated with Defense Cluster
operations and assumes current tax laws and policies persist. The figures below are also
adjusted to account for the fact that the private defense industry is exempt from paying sales
taxes for goods and services. In addition, the military infrastructure is exempt from both state
sales taxes as well as local real estate property taxes.
Service, 12,328, 42%
Government, 9,281, 32%
Manufacturing, 5,260, 18%
Trade, 1,788, 6%
TIPU, 393, 1% Other Industries, 147,
1%

Rhode Island Defense Cluster | 16
Figure 7: Total Impact of the Defense Cluster on the Service Sector, 2016
Source: Authors’ calculations using IMPLAN. “Total employment impact” includes direct, indirect, and induced effects.
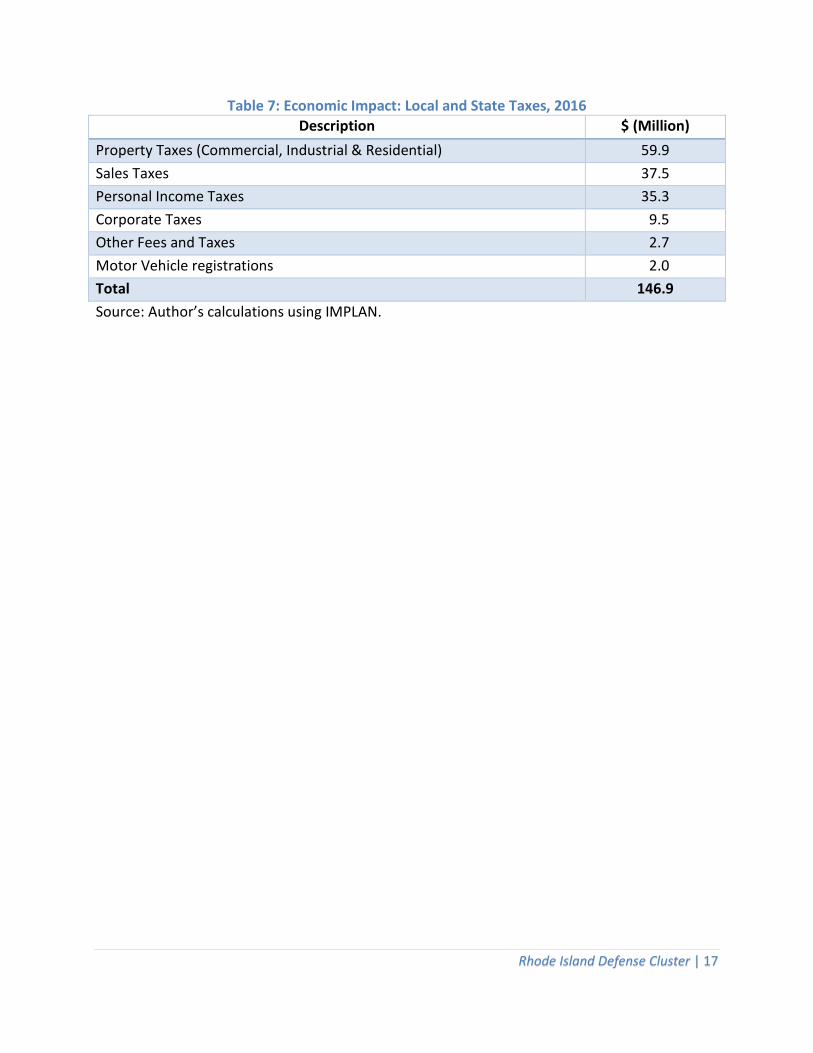
The total impact on tax revenues at the state and local level is summarized below (see Table 7).
These estimates include the taxes generated via direct, indirect, and induced effects.
In 2016, the Defense Cluster generated $146.9 million in tax revenues for local and state
governments. This figure includes $35.3 million in personal income taxes, $37.5 million in sales
taxes, $9.5 million in corporate taxes, $59.9 million in property taxes, $2 million in motor
vehicles registrations, and $2.7 million in other taxes and fees collected by local and state
governments. These estimates imply that the Defense Cluster generates -- directly or via the
multiplier effect -- about $84.6 million in tax revenues for the state government and another
$62.2 million in tax revenues for local cities and towns.8
8 The state government collects personal income taxes, corporate taxes, and sales taxes. Cities and towns collect property taxes. The state government or cities and towns might collect motor vehicle license fees, and other fees and taxes. IMPLAN, however, does not allow measuring the share of these revenues that goes to the state and to local cities and towns. This report allocates 50 percent of these revenues to the state government and 50 percent to local cities and towns.
259
618
1,035
1,130
1,908
2,706
4,672
- 1,000 2,000 3,000 4,000 5,000
Information
Real Estate and Rental Services
Other Services
Finance
Leisure & Hospitality
Education & Health Care
Professional and Business Services
EMPLOYMENT
Rhode Island Defense Cluster | 17
Table 7: Economic Impact: Local and State Taxes, 2016 Description $ (Million)
Property Taxes (Commercial, Industrial & Residential) 59.9 Sales Taxes 37.5 Personal Income Taxes 35.3 Corporate Taxes 9.5 Other Fees and Taxes 2.7 Motor Vehicle registrations 2.0
Total 146.9 Source: Author’s calculations using IMPLAN.
Rhode Island Defense Cluster | 18
Conclusion
Department of Defense spending and associated job
sustainment and creation supports a vibrant and
innovative Rhode Island Defense Cluster, comprised of
the private defense industry, which operates in sync
with the State’s military infrastructure. The ecosystem
supporting NUWC Division Newport, related to
research, development, engineering, and fleet support
for submarine warfare systems that are the hallmark
of the operations at the Naval Station Newport, is a
major economic driver. General Dynamics Electric
Boat and Raytheon are the major economic engines in
the Rhode Island private defense industry.
The Rhode Island Military Defense infrastructure,
specifically NUWC Division Newport, employs a highly
qualified workforce: over 70 percent of its civilian
employees hold bachelor’s or graduate degree and 77
percent are employed in STEM occupations.
The Defense Cluster is the highest paying sector in Rhode Island. In 2016, the average annual
wage of defense civilian workers was $101,400 at the NUWC Division Newport, $91,700 for all
DoD civilian employees, and $70,200 in the private defense industry. These figures compare to an
average of $44,200 for all non-farm employees in Rhode Island.
The Defense Cluster generates significant economic benefits for the state of Rhode Island. This
report determined that in 2016, the Defense Cluster supported the creation of $4.3 billion in
output (7.6 percent of RI GDP), $2 billion in labor income for households living in the state (8.4
percent of RI labor income), and $146.9 million in tax revenues for local and state governments. In
addition, the Defense Sector is a major source of jobs and supports 29,196 jobs in Rhode Island
(6.2 percent of total employment in the state).
Rhode Island Defense Cluster | 19
Appendix A
Department of Defense Contracts
The calculation of the amount of DoD contracts that are actually executed in a particular year in
Rhode Island is subject to major limitations. First, some contracts are executed over several years;
thus the contract face amount does not reflect the actual spending in the state in a particular
year. Second, while the DoD reports contract awards based on “place of performance,”
contractors, however, might execute part of the work in facilities outside the state. Conversely,
contracts recorded in another state might actually be executed in Rhode Island. This issue is
particularly relevant for activities of General Dynamics Electric Boat in Rhode Island that are not
recorded as “Rhode Island awards.”
Chmura Economics & Analytics (Chmura) developed a proprietary methodology to estimate
annualized DoD contract awards by state. Chmura estimates that the DoD awarded just under
$1.5 billion in defense contracts in Rhode Island in 2016. On the other hand, data from
USAspending.gov shows a total of $754.4 million in DoD awards to Rhode Island defense
contractors. These two figures can be interpreted as lower and upper bound estimates of the
DoD awards in Rhode Island.
This report does not rely on contract estimates to produce the economic impact assessment of
the Defense Cluster on the economy of Rhode Island. All estimates are based on employment and
income data provided by the Department of Defense (DoD), the Rhode Island Department of
Labor and Training (RI DLT), the U.S. Office of Personnel Management, (US OPM), and DoD Office
of the Actuary.

Rhode Island Defense Cluster | 20
Appendix B
Military Retirees and Survivors
The Office of the Actuary provides information on the annual payment and number of military
retirees and military survivors for each military branch (Army, Air Force, Navy, Marine Corps, and
Coast Guard) in which a retiree served. However, there is a lag in processing and reporting this
information and, as of August 9, 2017, the most recent available data was for 2015. Table B1
shows that 5,673 people collected $138.9 million in retirement benefits in Rhode Island in 2015.
In addition, 1,191 people collected $14.1 million (annual payment) in military survivor benefits. It
is important to highlight that these figures do not include benefits paid to DoD civilian retirees
and survivors.
Table B1: Military Retirees: Rhode Island, 2015
Branch Number of Retirees Annual Payment ($1,000)
Army 1,822 33,864 Navy 2,280 71,160 Marines 246 6,216 Air Force 1,087 21,852 US Coast Guard 238 5,828 a Total 2015 5,673 138,920 Source: DoD Office of the Actuary.
Table B2: Military Survivors: Rhode Island, 2015
Branch Number of Survivors Annual Payment ($1,000)
Army 384 3,774 Navy 557 7,626 Marines 28 420 Air Force 191 1,944 US Coast Guard 31 368 Total 2015 1,191 14,132 Source: DoD Office of the Actuary.

Rhode Island Defense Cluster | 21
Appendix C IMPLAN
This report uses IMPLAN to account for inter-industry relationships within the state and to
determine how economic activities related to the Defense Cluster impact the Rhode Island
economy. IMPLAN is a widely used economic impact software model. It was designed in 1976 as
an economic impact modeling system under the direction of the Forest Service unit of the United
States Department of Agriculture. IMPLAN is built using classic input-output analysis in
combination with regional Social Accounting Matrices (SAM) and multiplier based-models. The
input-output model accounts for all dollar flows among different sectors of the economy. Using
this information, IMPLAN models the way, for instance, that payroll income from one sector is
spent and re-spent in other sectors of the economy, generating the so-called “economic
multiplier” effects. Additional information about IMPLAN is available at: http://www.implan.com.
A similar study titled “The Economic Impact of The Rhode Island Defense Sector,” released in June
2014 by the Rhode Island Defense Economy Planning Commission and the Newport County
Chamber of Commerce, uses input-output (I-O) multipliers produced by the U.S. Bureau of
Economic Analysis (BEA) to determine the indirect and induced impacts of the Defense Cluster on
the economy of Rhode Island. The 2014 study is, therefore, similar to the present report.
However, this report utilizes the most recent available data and multipliers together with
IMPLAN, a tested software that is built using a precise and technically robust methodology.

Rhode Island Defense Cluster | 22
Appendix D
List of Acronyms and Abbreviations
BRAC Base Realignment and Closure
Commerce RI Rhode Island Commerce Corporation
Department of Defense
Full Time Equivalent
IMpact analysis for PLANning
NUWC Naval Undersea Warfare Center
Rhode Island Department of Labor and Training
Southeastern New England Defense Industry Alliance
STEM Science, technology, engineering, and mathematics
TIPU Transportation, information, power and utilities
United States Office of Personnel Management

Rhode Island Defense Cluster | 23
THE ECONOMIC IMPACT OF THE RHODE ISLAND DEFENSE CLUSTER
Edinaldo Tebaldi, Ph.D., Professor of Economics at Bryant University, prepared this report in consultation with John Riendeau, Director of Business Development at Rhode Island Commerce Corporation (Commerce RI) and Molly Donohue Magee, Executive Director of the Southeastern New England Defense Industry Alliance (SENEDIA).
The author would like to thank John Riendeau, Director of Business Development at Commerce RI, for his insightful feedback and discussions throughout this project. The author also thanks Donna Murray and Kathleen Greenwell, from the Rhode Island Department of Labor and Training, for their help compiling defense data used in this report.
The views and opinions of the author expressed herein do not state or reflect those of Bryant University. The author has exercised due and customary care in conducting this research and report. Every effort has been made to ensure the quality of the analysis. The author assumes no liability for any loss resulting from errors, omissions, or misrepresentations made by others.
The Southeastern New England Defense Industry Alliance commissioned and funded this report.
August 2017