The Economic Impact of Linton Hospital on Emmons County, … · 2017-09-08 · The Economic Impact...
43
The Economic Impact of Linton Hospital on Emmons County, North Dakota Prepared by: National Center for Rural Health Works Oklahoma State University May 2017
Transcript of The Economic Impact of Linton Hospital on Emmons County, … · 2017-09-08 · The Economic Impact...

The Economic Impact of Linton Hospital
on Emmons County, North Dakota
Prepared by:
National Center for Rural Health Works Oklahoma State University
May 2017

The Economic Impact of Linton Hospital on Emmons County, North Dakota
Prepared for:
Linton Hospital Linton, North Dakota
and The Center for Rural Health
The University of North Dakota School of Medicine and Health Sciences
www.ruralhelath.und.edu
Prepared by:
Cheryl F. St. Clair, Associate Director and Associate State Extension Specialist Email: [email protected]
Gerald A. Doeksen, Director and Regents Professor/Extension Economist
Email: [email protected]
Brittany Krehbiel, Student Assistant
National Center for Rural Health Works Oklahoma Cooperative Extension Service
Oklahoma State University (405) 744-9823, 9824, or 9814
May 2017

The Economic Impact of Linton Hospital on Emmons County, North Dakota
Medical facilities have a tremendous medical and economic impact on the county in
which they are located. This is especially true with health care facilities, such as hospitals and
nursing homes. These facilities not only employ a number of people and have a large payroll, but
they also draw into the county a large number of people from rural areas that need medical
services. The overall objective of this study is to measure the economic impact of Linton
Hospital on Emmons County in North Dakota. The specific objectives of this report are to:
1. Discuss the importance of health care services to rural development, including national health trend data;
2. Review demographic and economic data for Emmons County;
3. Summarize the direct economic activities of Linton Hospital from operations in
Emmons County;
4. Present concepts of community economics and multipliers; and
5. Estimate the economic impact of Linton Hospital from operating activities in Emmons County.
No recommendations will be made in this report.
Health Services and Rural Development
The nexus between health care services and rural development is often overlooked. At
least three primary areas of commonality exist. A strong health care system can help attract and
maintain business and industry growth, and attract and retain retirees (Table 1). A strong health
care system can also create jobs in the local area.
1

Table 1 Services that Impact Rural Development
Type of Growth Services Important to Attract Growth
Industrial and Business
Health and Education
Retirees
Health and Safety
Studies have found that quality-of-life (QOL) factors are playing a dramatic role in
business and industry location decisions. Among the most significant of the QOL variables are
health care services, which are important for at least three reasons.
Business and Industry Growth
First, as noted by a member of the Board of Directors of a community economic
development corporation, the presence of good health and education services is imperative to
industrial and business leaders as they select a community for location. Employees and
participating management may offer strong resistance if they are asked to move into a community
with substandard or inconveniently located health services.
Secondly, when a business or industry makes a location decision, it wants to ensure that
the local labor force will be productive and a key factor in productivity is good health. Thus,
investments in health care services can be expected to yield dividends in the form of increased
labor productivity.
The cost of health care services is the third factor that is considered by business and
industry in development decisions. Research shows that corporations take a serious look at health
care costs in determining site locations. Sites that provide health care services at a lower cost are
given higher consideration for new industry than sites with much higher health care costs.
2

Health Services and Attracting Retirees
A strong and convenient health care system is important to retirees, a special group of
residents whose spending and purchasing can be a significant source of income for the local
economy. Many rural areas have environments (e.g., outdoor activities) that enable them to be in
a good position to attract and retain retirees. The amount of spending embodied in this
population, including the purchasing power associated with Social Security, Medicare, and other
transfer payments, is substantial. Additionally, middle and upper income retirees often have
substantial net worth. Although the data are limited, several studies suggest health services may
be a critical variable that influences the location decision of retirees. For example, one study
found that four items were the best predictors of retirement locations: safety, recreational
facilities, dwelling units, and health care. Another study found that nearly 60 percent of potential
retirees said health services were in the “must have” category when considering a retirement
community. Only protective services were mentioned more often than health services as a “must
have” service.
Health Services and Job Growth
A factor important to the success of rural economic development is job creation. The
health care sector is an extremely fast growing sector, and based on the current demographics,
there is every reason to expect this trend to continue. Data in Table 2 provide selected
expenditure and employment data for the United States. Several highlights from the national data
are:
• In 1970, health care services as a share of the national gross domestic product (GDP) were 6.9 percent and increased to 17.8 percent in 2015;
3

Table 2 United States Health Expenditures and Employment Data
1970-2015; Projected for 2016-2025
Total Per Capita Health Health Avg Annual Year Health Health as % Sector Increase in
Expenditures Expenditures of GDP Employment Employment ($Billions) ($) (%) (000) (%)
Historical
1970 $74.6 $355 6.9% 3,052 a 1980 255.3 1,108 8.9% 5,278 a 7.3% 1990 721.4 2,843 12.1% 8,211 a 5.6% 2000 1,369.7 4,857 13.3% 10,858 a 3.2% 2010 2,596.4 8,404 17.4% 13,777 b 2.7%
2011 2,687.9 8,638 17.3%
14,026 b 1.8% 2012 2,795.4 8,915 17.3% 14,282 b 1.8% 2013 2,877.6 9,110 17.2% 14,492 b 1.5% 2014 3,029.3 9,515 17.4% 14,677 b 1.3% 2015 3,205.6 9,990 17.8% 15,080 b 2.7%
Avg Yrly Increase 2000 to 2015 2.6%
Projections
2020 4,198.3 12,490 18.7%
2025 5,631.0 16,032 20.1%
SOURCES: U.S. Department of Labor, Bureau of Labor Statistics (www.bls.gov [January 2017]); U.S. Department of Health and Human Services, Centers for Medicare and Medicaid Services, National Health Expenditures 1960-2015 and National Health Expenditure Projections 2016-2025. (https://www.cms.gov/Research-Statistics-Data-and-Systems/Statistics-Trends-and-Reports/NationalHealthExpendData/NationalHealthAccountsProjected.html [October 2016]). a Based on Standard Industrial Classification (SIC) codes for health sector employment. b Based on North American Industrial Classification System (NAICS) for health sector employment.
4

• Per capita health expenditures increased from $355 in 1970 to $9,990 in 2015;
• Employment in the health sector increased 394.1 percent from 1970 to 2015; and
• Annual average increase in employment from 2000 to 2015 was 2.6 percent.
The U. S. Department of Health and Human Services, Centers for Medicare and Medicaid
Services, projects that health care expenditures will account for 18.7 percent of GDP by 2020 and
increase to 20.1 percent of GDP in 2025. Per capita health care expenditures are projected to
increase to $12,490 in 2020 and to $16,032 in 2025. Total health expenditures are projected to
increase to over $5.6 trillion in 2025.
Figure 1 illustrates 2015 health expenditures by percent of GDP and by type of health
service. Health services represented 17.8 percent of national GDP in 2015. The largest category
of health services was hospital care, representing 32.3 percent of the total and the second largest
category was physician services with 26.2 percent of the total.
National Health Care Expenditures $3.2 Billion
Hospital Care
Physician
Nursing Homes Prescription Drugs
Other Medical
Other – Gov’t & Investment
All Other Services 82.2%
Health Services 17.8%
32.3%
13.2%
5.0% 10.1%
11.2%
15.2%
Figure 1 National Health Expenditures as a Percent of Gross Domestic Product
and by Health Service Type, 2015
SOURCE: U. S. Department of Health and Human Services, Centers for Medicare and Medicaid Services, National Health Expenditures 2015 (http://www.cms.gov/Research-Statistics-Data-and-Systems/Statistics-Trends-and-Reports/NationalHealthExpendData/index.html [January 2017]). 5

Emmons County Demographic and Economic Data
Linton Hospital is located in Linton in Emmons County, North Dakota. The medical
service area is Emmons County, North Dakota. Table 3 illustrates the last two U. S. Census
Bureau populations for Emmons County cities, towns, and surrounding rural area and for
Emmons County and North Dakota. The most current population estimates for 2014 and 2015
are also provided.
The data in Table 3 show Linton, the county seat, had population of 1,321 in 2000 and
1,097 in 2010, which represents a decrease of 17.0 percent. All cities in Emmons County show
decreases in population from 2000 to 2010 as well. This compares to Emmons County decreasing
18.0 percent and North Dakota increasing 4.7 percent. The 2015 estimates show decreasing
population from the 2010 Census to 2015 for all cities/towns and rural area and for Emmons
County. North Dakota increased in population from 2010 to 2015.
Table 3 Population and Percent Change for Linton, Emmons County Cities, Towns
and Rural Area and for Emmons County and the State of North Dakota
2000 2010 2014 2015 %
Change %
Change %
Change Population Population Estimate Estimate '00 to '10 '10 to '14 '10 to '15
Braddock 43 21 9 8 -51.2% -57.1% -61.9% Hague 91 71 64 57 -22.0% -9.9% -19.7% Hazleton 237 235 253 223 -0.8% 7.7% -5.1% Linton* 1,321 1,097 1,114 1,042 -17.0% 1.5% -5.0% Strasburg 549 409 511 439 -25.5% 24.9% 7.3% Rural Area 2,090 1,717 1,540 1,694 -17.8% -10.3% -1.3%
Emmons County 4,331 3,550 3,491 3,463 -18.0% -1.7% -2.5%
North Dakota 642,200 672,591 704,925 721,640 4.7% 4.8% 7.3% SOURCE: U.S. Census Bureau, Census Populations and Population Estimates (www.census.gov [April 2017]). * County Seat
6

The 2010 Census populations and population projections for the county and state are
illustrated in Table 4. The 2010 populations are from the U. S. Census Bureau and the
projections from the North Dakota Housing and Finance Agency, 2012 Statewide Housing Needs
Assessment. The populations are projected to decrease for the county while increase for the state
from 2010 through 2029.
Table 4 2010 Census Population and Population Projections for Emmons County and the State of North Dakota
2010 2019 2024 2029 %
Change %
Change %
Change Census Projection Projection Projection '10 to '19 '10 to '24 '10 to '29
Emmons County 3,550 3,331 3,366 3,413 -6.2% -5.2% -3.9% North Dakota 672,591 813,282 852,615 891,268 20.9% 26.8% 32.5% SOURCE: U.S. Census Bureau (www.census.gov [April 2017]); North Dakota Housing and Finance Agency, Statewide Housing Needs Assessment, Detailed Tables (www.ndhfa.org [April 2017]).
Tables 5a and 5b show the populations for the county and state by age group and gender
for the 2000 and 2010 Census years and the 2015 estimate years. From 2000 to 2010, the younger
age group (0-14 year olds) in Emmons County decreased in total population 30.6 percent. From
2000 to 2010, the age group in the county with the largest increase is the 15-19 year olds with
19.1 percent. North Dakota also showed decreased population in the youngest age group and the
largest increase in the 45-65 year age groups.
The male population for the county decreased 16.7 percent and the female population for
the county decreased 19.4 percent. The state had male population increase of 6.0 percent and
female increase of 3.4 percent. From 2010 to 2015, the county had the largest decrease in
7

Table 5a U.S. Census Bureau Population by Age Groups and Gender
for Emmons County and the State of North Dakota, 2000, 2010, 2015 Estimates Age Groups Gender 0-14 15-19 20-24 25-44 45-64 65+ Totals Male Female 2000 Census
Braddock 2 4 1 3 13 20 43 21 22 Hague 13 3 0 23 13 39 91 42 49 Hazleton 42 14 6 46 58 71 237 118 119 Linton* 236 73 38 266 287 421 1,321 625 696 Strasburg 84 31 14 93 107 220 549 247 302 Rural Area 482 158 35 534 545 336 2,090 1,131 959
Emmons County 859 283 94 965 1,023 1,107 4,331 2,184 2,147 Percent of Total 19.8% 6.5% 2.2% 22.3% 23.6% 25.6% 100.0% 50.4% 49.6%
North Dakota 129,846 53,618 50,503 174,891 138,864 94,478 642,200 320,524 321,676 Percent of Total 20.2% 8.3% 7.9% 27.2% 21.6% 14.7% 100.0% 49.9% 50.1%
2010 Census
Braddock 1 0 0 3 6 11 21 13 8
Hague 7 5 0 13 17 29 71 37 34 Hazleton 52 13 4 43 61 62 235 121 114 Linton* 156 55 25 175 327 359 1,097 521 576 Strasburg 48 17 10 40 109 185 409 189 220 Rural Area 332 139 48 282 591 325 1,717 939 778
Emmons County 596 229 87 556 1,111 971 3,550 1,820 1,730 Percent of Total 16.8% 6.5% 2.5% 15.7% 31.3% 27.4% 100.0% 51.3% 48.7%
North Dakota 124,461 47,474 58,956 165,747 178,476 97,477 672,591 339,864 332,727 Percent of Total 18.5% 7.1% 8.8% 24.6% 26.5% 14.5% 100.0% 50.5% 49.5%
8

Table 5b U.S. Census Bureau Population by Age Groups and Gender
for Emmons County and the State of North Dakota, 2000, 2010, 2015 Estimates Age Groups Gender 0-14 15-19 20-24 25-44 45-64 65+ Totals Male Female 2015 Estimates
Braddock 0 0 0 0 0 8 8 5 3 Hague 6 3 0 7 18 23 57 39 18 Hazleton 54 17 0 46 45 61 223 122 101 Linton* 131 73 54 175 269 340 1,042 458 584 Strasburg 50 22 49 55 94 169 439 221 218 Rural Area 298 164 39 218 646 329 1,694 893 801
Emmons County 539 279 142 501 1,072 930 3,463 1,738 1,725 Percent of Total 15.6% 8.1% 4.1% 14.5% 31.0% 26.9% 100.0% 50.2% 49.8%
North Dakota 147,666 49,444 72,293 197,791 182,452 107,281 756,927 388,853 368,074 Percent of Total 19.5% 6.5% 9.6% 26.1% 24.1% 14.2% 100.0% 51.4% 48.6%
% Change '00 to '10
Emmons County -30.6% 19.1% -7.4% -42.4% 8.6% -12.3% -18.0% -16.7% -19.4%
North Dakota -4.1% 11.5% 16.7% -5.2% 28.5% 3.2% 4.7% 6.0% 3.4% % Change '10 to '15 Emmons County -9.6% 21.8% 63.2% -9.9% -3.5% -4.2% -2.5% -4.5% -0.3% North Dakota 18.6% 4.1% 22.6% 19.3% 2.2% 10.1% 12.5% 14.4% 10.6%
SOURCE: 2000 and 2010 Census Population and 2015 population estimates by age groups, ACS Demographic and Housing Estimates, U.S. Census Bureau (www.census.gov [April 2017]). * County Seat
9

population for the 25-44 age group and the largest increase in the 20-24 age group; the state
increased in all categories with the largest increase in the age 20-24 age group.
Tables 6a and 6b provide the populations of Emmons County and North Dakota by race
groups and Hispanic origin. From 2000 to 2010, Emmons County showed a decrease in the
White race. North Dakota showed an increase in all race groups from 2000 to 2010. From 2000
to 2010, Hispanic origin population decreased in the county (17.1 percent) and increased in the
state (56.7 percent). Hispanic origin continued to decrease in the county and increased in the state
from 2010 to 2015. From 2010 to 2015, Emmons County decreased further in White populations,
while the state continued to increase in all race groups.
Data from County Business Patterns and Bureau of Economic Analysis show trends in the
health services employment and payroll (labor income) over time; the two data sources have
different definitions but the trends show how health services and industries, in general, change
over time.
Data from U.S. Census Bureau, County Business Patterns, are illustrated in Table 7,
showing employment and payroll for health services compared to the total employment and
payroll for the county and the state. The data show that the county health services employment
decreased 5.2 percent from 2004 to 2014 while the total county employment decreased 17.9
percent. County health services employment as a percent of total county employment was 22.3
percent in 2004 and increased to 24.8 percent in 2014; the state health services employment was
19.4 percent of total state employment in 2004 and decreased to 16.5 percent in 2014.
County health services payroll increased from 2004 to 2014 by 45.1 percent, while total
county payroll increased 15.9 percent. County health services payroll as a percent of total county
payroll was 20.0 percent in 2004 and decreased to 23.6 percent in 2014. This compares to the
10

Table 6a U.S. Census Bureau Population by Race and Hispanic Origin
for Emmons County and the State of North Dakota, 2000, 2010 and 2015 Estimates Native Two or More Hispanic White Black American Other Races Totals Origin 2000 Census
Braddock 49 0 0 0 0 49 0 Hague 97 0 0 0 0 97 2 Hazleton 230 0 0 0 0 230 2 Linton* 1,309 0 2 0 0 1,311 10 Strasburg 508 0 2 0 0 510 8 Rural Area 2,123 2 0 5 4 2,134 19
Emmons County 4,316 2 4 5 4 4,331 41 Percent of Total 99.7% 0.0% 0.1% 0.1% 0.1% 100.0% 0.9%
North Dakota 593,181 3,916 31,329 6,376 7,398 642,200 8,595 Percent of Total 92.4% 0.6% 4.9% 1.0% 1.2% 100.0% 1.3%
2010 Census
Braddock 20 0 0 0 1 21 0
Hague 71 0 0 0 0 71 1 Hazleton 229 0 5 0 1 235 4 Linton* 1,077 1 2 3 14 1,097 6 Strasburg 408 0 0 0 1 409 1 Rural Area 1,690 1 7 9 10 1,717 22
Emmons County 3,495 2 14 12 27 3,550 34 Percent of Total 98.5% 0.1% 0.4% 0.3% 0.8% 100.0% 1.0%
North Dakota 605,449 7,960 36,591 10,738 11,853 672,591 13,467 Percent of Total 90.0% 1.2% 5.4% 1.6% 1.8% 100.0% 2.0%
11

Table 6b U.S. Census Bureau Population by Race and Hispanic Origin
for Emmons County and the State of North Dakota, 2000, 2010 and 2015 Estimates Native Two or More Hispanic White Black American Other Races Totals Origin 2015 Estimates
Braddock 8 0 0 0 0 8 0 Hague 57 0 0 0 0 57 0 Hazleton 223 0 0 0 0 223 0 Linton* 1,025 0 0 12 5 1,042 0 Strasburg 428 0 11 0 0 439 0 Rural Area 1,615 0 0 4 75 1,694 4
Emmons County 3,356 0 11 16 80 3,463 4 Percent of Total 96.9% 0.0% 0.3% 0.5% 2.3% 100.0% 0.1%
North Dakota 640,208 11,872 38,286 15,142 16,132 721,640 20,569 Percent of Total 88.7% 1.6% 5.3% 2.1% 2.2% 100.0% 2.9%
% Change '00 to '10
Emmons County -19.0% 0.0% 250.0% 140.0% 575.0% -18.0% -17.1%
North Dakota 2.1% 103.3% 16.8% 68.4% 60.2% 4.7% 56.7% % Change '10 to '15
Emmons County -4.0% 100.0% -21.4% 33.3% 196.3% -2.5% -88.2% North Dakota 5.7% 49.1% 4.6% 41.0% 36.1% 7.3% 52.7%
SOURCE: 2000 and 2010 Census population, 2015 Population Estimates by race and ethnic origin, U.S. Census Bureau (www.census.gov [April 2017]). * County Seat
12

Table 7 Employment and Payroll for Health Services
in Emmons County and North Dakota Employment
Health
Services Total
County Health Services as a % of Total County Employment
Health Services as a % of Total State Employment
2004 193 866 22.3% 19.4% 2005 194 869 22.3% 18.6% 2006 195 872 22.4% 18.4% 2007 203 899 22.6% 17.5% 2008 162 855 18.9% 17.0% 2009 189 465 40.6% 18.0% 2010 195 758 25.7% 18.6% 2011 193 762 25.3% 18.4% 2012 211 807 26.1% 17.4% 2013 225 784 28.7% 17.3% 2014 183 738 24.8% 16.5%
% Chg '04 to '14 -5.2% -17.9% Payroll ($1,000s)
Health
Services Total
County Health Services as a % of
Total County Payroll Health Services as a % of
Total State Payroll 2004 3,589 17,956 20.0% 20.9% 2005 3,640 18,163 20.0% 20.7% 2006 3,750 18,697 20.1% 19.9% 2007 3,809 19,032 20.0% 18.6% 2008 4,801 20,961 22.9% 18.4% 2009 4,908 19,683 24.9% 19.5% 2010 4,987 20,040 24.9% 19.5% 2011 5,076 20,442 24.8% 18.7% 2012 5,787 25,035 23.1% 17.0% 2013 5,453 22,197 24.6% 16.6% 2014 5,208 22,060 23.6% 15.7%
% Chg '04 to '14 45.1% 15.9% SOURCE: U.S. Census Bureau, County Business Patterns; 2004-2014 based on NAICS (www.census.gov [April 2017]). Shaded Cells indicate data were withheld to avoid disclosure of confidential information, estimates are provided.
13
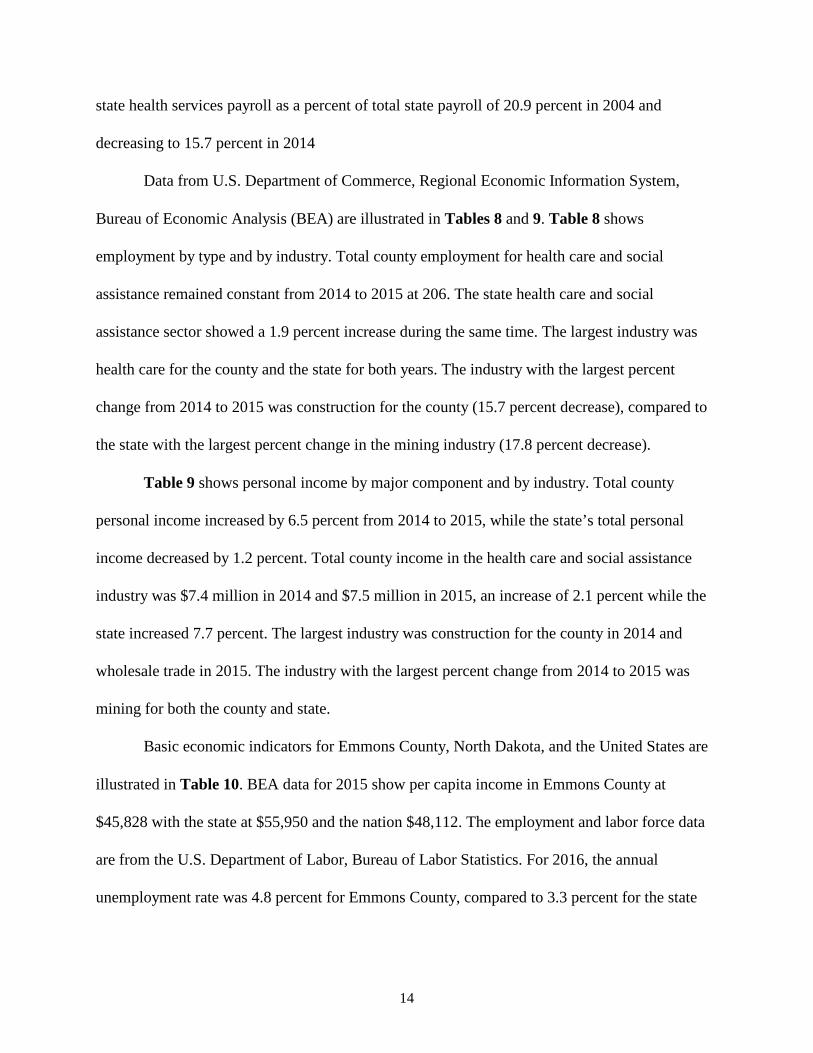
state health services payroll as a percent of total state payroll of 20.9 percent in 2004 and
decreasing to 15.7 percent in 2014
Data from U.S. Department of Commerce, Regional Economic Information System,
Bureau of Economic Analysis (BEA) are illustrated in Tables 8 and 9. Table 8 shows
employment by type and by industry. Total county employment for health care and social
assistance remained constant from 2014 to 2015 at 206. The state health care and social
assistance sector showed a 1.9 percent increase during the same time. The largest industry was
health care for the county and the state for both years. The industry with the largest percent
change from 2014 to 2015 was construction for the county (15.7 percent decrease), compared to
the state with the largest percent change in the mining industry (17.8 percent decrease).
Table 9 shows personal income by major component and by industry. Total county
personal income increased by 6.5 percent from 2014 to 2015, while the state’s total personal
income decreased by 1.2 percent. Total county income in the health care and social assistance
industry was $7.4 million in 2014 and $7.5 million in 2015, an increase of 2.1 percent while the
state increased 7.7 percent. The largest industry was construction for the county in 2014 and
wholesale trade in 2015. The industry with the largest percent change from 2014 to 2015 was
mining for both the county and state.
Basic economic indicators for Emmons County, North Dakota, and the United States are
illustrated in Table 10. BEA data for 2015 show per capita income in Emmons County at
$45,828 with the state at $55,950 and the nation $48,112. The employment and labor force data
are from the U.S. Department of Labor, Bureau of Labor Statistics. For 2016, the annual
unemployment rate was 4.8 percent for Emmons County, compared to 3.3 percent for the state
14

Table 8 Full- and Part-Time Employment by NAICS1 Industry for Emmons County and North Dakota 2014 and 2015
2014 2015 '14-'15 '14-'15
Emmons County State Emmons County State % Chg % Chg
No. of % of % of No. of % of % of Emmons North
Jobs Total Total Jobs Total Total County Dakota Total Employment 2,237 100.0% 100.0% 2,212 100.0% 100.0% -1.1% -1.3% Wage & Salary 1,094 48.9% 79.1% 1,057 47.8% 78.4% -3.4% -2.1% Proprietors' 1,143 51.1% 20.9% 1,155 52.2% 21.6% 1.0% 1.8%
Farm proprietors' 533 46.6% 20.9% 527 45.6% 20.3% -1.1% -1.1%
Nonfarm proprietors'2 610 53.4% 79.1% 628 54.4% 79.7% 3.0% 2.5% By Industry:
Farm employment 619 27.7% 5.6% 588 26.6% 5.2% -5.0% -7.1% Nonfarm employment 1,618 72.3% 94.4% 1,624 73.4% 94.8% 0.4% -0.9%
Private employment 1,348 83.3% 85.0% 1,351 83.2% 84.7% 0.2% -1.3% For, fshng, & related (D) N/A 1.0% (D) N/A 1.0% N/A 0.7% Mining 28 2.1% 7.5% 28 2.1% 6.2% 0.0% -17.8% Utilities (D) N/A 0.8% (D) N/A 0.8% N/A 3.6% Construction 153 11.4% 9.3% 129 9.5% 9.3% -15.7% -1.4% Manufacturing 21 1.6% 5.6% (D) N/A 5.6% N/A -1.6% Wholesale trade 102 7.6% 5.9% 108 8.0% 5.9% 5.9% -1.2% Retail trade 197 14.6% 12.7% 199 14.7% 12.9% 1.0% 0.7% Transp & wrhsng (D) N/A 6.0% (D) N/A 5.7% N/A -6.0% Information (D) N/A 1.6% (D) N/A 1.6% N/A -2.4% Finance & Ins (D) N/A 5.4% (D) N/A 5.6% N/A 0.7% RE/rental/leasing (D) N/A 4.8% (D) N/A 5.0% N/A 2.5% Prof/sci/techn svcs 48 3.6% 4.8% 45 3.3% 5.0% -6.3% 2.1% Mgmt of cos/enterpr 0 0.0% 1.2% 0 0.0% 1.2% 0.0% 1.5% Admin/waste svcs 26 1.9% 4.0% 28 2.1% 4.0% 7.7% -2.0% Educ services 38 2.8% 1.3% 39 2.9% 1.3% 2.6% 5.1% Hlth care/soc assist 206 15.3% 13.0% 206 15.2% 13.4% 0.0% 1.9% Arts/entrtnmnt/rec 27 2.0% 1.6% 25 1.9% 1.6% -7.4% 1.5% Accomm/food svcs 90 6.7% 8.0% 92 6.8% 8.1% 2.2% 0.2% Other not pub adm (D) N/A 5.6% (D) N/A 5.7% N/A 0.5% Sum of (D)s 412 30.6%
452 33.5%
9.7%
Gov't/Gov't entrprses 270 16.7% 15.0% 273 16.8% 15.3% 1.1% 1.4%
SOURCE: U.S. Department of Commerce, Regional Economic Information System, Bureau of Economic Analysis (www.bea.gov [April 2017]). 1 The estimates of employment for 2011 forward are based on the 2012 North American Industry Classification System 2 Excludes Limited Partners (D) Not shown to avoid disclosure of confidential information, totals are shown.
15

Table 9 Personal Income by Major Component and Earnings by
Industry based on NAICS1 for Emmons County and North Dakota, 2014 and 2015 2014 2015 '14-'15 '14-'15
Emmons County State Emmons County State % Chg % Chg
Income % of % of Income % of % of Emmons North
($1,000s) Total Total ($1,000s) Total Total County Dakota Total Personal Income 146,370
155,908
6.5% -1.2%
Earnings by Place of Work 76,975 100.0% 100.0% 84,457 100.0% 100.0% 9.7% -3.3% Wage/Salary/Dsbrsmnts 35,027 45.5% 70.6% 34,441 40.8% 71.3% -1.7% -2.3%
Proprietors' income2 32,254 41.9% 14.5% 40,597 48.1% 13.3% 25.9% -11.2% All other earnings 9,694 12.6% 14.9% 9,419 11.2% 15.4% -2.8% -0.2%
Total by Industry:
Farm employment 16,709 21.7% 3.5% 20,403 24.2% 1.2% 22.1% -67.4%
Nonfarm employment 60,266 78.3% 96.5% 64,054 75.8% 98.8% 6.3% -1.0% Private employment 48,164 79.9% 84.8% 51,567 80.5% 83.9% 7.1% -2.0%
For/fshng/related (D) N/A 0.6% (D) N/A 0.6% N/A 6.0% Mining 580 1.2% 14.3% 344 0.7% 11.3% -40.7% -22.4% Utilities (D) N/A 1.7% (D) N/A 1.9% N/A 8.4% Construction 8,751 18.2% 12.6% 7,330 14.2% 12.7% -16.2% -0.7% Manufacturing 1,578 3.3% 6.3% (D) N/A 6.8% N/A 7.1% Wholesale trade 7,203 15.0% 8.5% 8,462 16.4% 8.5% 17.5% -2.6% Retail trade 5,219 10.8% 7.7% 5,484 10.6% 8.0% 5.1% 2.0% Transp & wrhsng (D) N/A 8.8% (D) N/A 8.4% N/A -5.7% Information (D) N/A 1.8% (D) N/A 1.8% N/A -2.4% Finance & Ins (D) N/A 4.7% (D) N/A 5.2% N/A 7.4% RE/rental/leasing (D) N/A 3.6% (D) N/A 3.5% N/A -5.2% Prof/sci/techn svcs 1,110 2.3% 5.7% 1,075 2.1% 5.9% -3.2% 0.9% Mgmt cos/enterpr 0 N/A 1.7% 0 N/A 1.9% N/A 5.0% Admin/waste svcs 424 0.9% 2.6% 560 1.1% 2.6% 32.1% -1.5% Educ services 852 1.8% 0.5% 843 1.6% 0.5% -1.1% 1.8% Hlth care/soc assist 7,367 15.3% 11.8% 7,519 14.6% 13.0% 2.1% 7.7% Arts/entrtnmnt/rec 163 0.3% 0.4% 194 0.4% 0.4% 19.0% 8.0% Accomm/food svcs 872 1.8% 3.2% 869 1.7% 3.2% -0.3% -2.5% Other not pub adm (D) N/A 3.7% (D) N/A 3.9% N/A 3.7%
Sum (D)s3 14,045 29.2% 18,887 36.6% 34.5% Govt/govt enterpr 12,102 20.1% 15.2% 12,487 19.5% 16.1% 3.2% 4.9%
SOURCE: U.S. Department of Commerce, Regional Economic Information System, Bureau of Economic Analysis (www.bea.gov [April 2017]). 1 The estimates of employment for 2011 forward are based on the 2012 North American Industry Classification System 2 Excludes Limited Partners
16

Table 10 Economic Indicators for Emmons County,
North Dakota and the United States Indicator Emmons County North Dakota United States
Total Personal Income (2015) 155,908,000 42,349,688,000 15,463,981,000,000 Per Capita Income (2015) 45,828 55,950 48,112
Employment (2016) 1,459 414,000 151,436,000 Unemployment (2016) 73 14,000 7,751,000 Unemployment Rate (2016) 4.8% 3.3% 4.9%
Employment (January 2017) 1,377 148,476 152,081,000 Unemployment (January 2017) 106 12,594 7,635,000 Unemployment Rate (January 2017) 7.1% 3.0% 4.8%
% of People in Poverty (2015) 11.30% 11.50% 15.50% % Under 18 in Poverty (2015) 6.3% 13.6% 21.7%
Transfer Receipts (2015) 34,548,000 5,326,398,000 2,678,606,000,000 Transfer Receipts as a % of Total
Personal Income 22.2% 12.6% 17.3%
Transfer Receipts -- Subcategories Medicare (2015) 9,952,000 1,099,469,000 628,220,000,000
% of Total 28.8% 20.6% 23.5%
Medicaid (2015) 6,139,000 965,701,000 551,843,000,000 % of Total 17.8% 18.1% 20.6%
SOURCE: Employment and unemployment data, U.S. Department of Labor, Bureau of Labor Statistics (www.bls.gov [April 2017]); Personal income, per capita income, and transfer receipts, U.S. Department of Commerce, Regional Economic Information System, Bureau of Economic Analysis (www.bea.gov [April 2017]); Poverty data, U.S. Census Bureau (www.census.gov [April 2017]).
17

and 4.9 percent for the U.S. For the preliminary year-to-date January 2017 employment and labor
force data, the unemployment rate for Emmons County was 7.1 percent; this compared to 3.0
percent for the state and 4.8 percent for the U.S.
Based on 2015 U. S. Census poverty data, Emmons County had 6.3 percent of the
population under age 18 below poverty level; this compared to 13.6 percent for the state and 21.7
percent for the U.S. From BEA 2015 data, transfer receipts as a percentage of total personal
income for Emmons County (22.2 percent) were much higher than the state (12.6 percent) and
the nation (17.3 percent). This indicator shows the entity’s percent of total personal income that
comes from federal and state funds.
18

Direct Economic Activities of Linton Hospital
The direct economic activities of Linton Hospital include the hospital and a physician
clinic. Linton Hospital provides many services, in addition to the physician services, including
the following:
General and Acute Services
Acne treatment Allergy, flu & pneumonia shots Ambulance-24/7 ALS ambulance
service Cardiology (visiting provider) Clinic Diabetic Education 24/7 Trauma level 5 Emergency
room services-including eEmergency Hospital (acute care) In-patient and
Out-patient Mole/wart/skin lesion removal Nephrology (visiting provider) Nutrition counseling
OB/GYN (visiting provider) Orthopedics (visiting provider) Pharmacy Podiatry – evaluation and surgery Prenatal care Physicals: annuals, D.O.T., sports &
insurance Pulmonology (visiting provider) Stress Testing Surgical services—biopsies Surgical services—outpatient Swing bed services Urology (visiting provider)
Screening/Therapy Services
Chronic disease management Holter monitoring Laboratory services Lower extremity circulatory
assessment Occupational physicals Occupational therapy
Pediatric services Physical therapy-including sports
preventative and post-injury Respiratory care Sleep studies Social services
Radiology Services
CT scan Digital mammography Echocardiograms EKG General x-ray
Mammograms MRI Ultrasound
19

Laboratory Services Blood types Clot times Chemistry
Hematology Microbiology Urine testing
The direct economic activities of Linton Hospital include the employees and their wages,
salaries, and benefits (labor income) to provide the hospital services and physician services.
From Table 11, the total direct employment of Linton Hospital from hospital operations includes
92 full- and part-time employees with direct labor income of nearly $3.0 million. The direct
employment from the physician services includes 13 full- and part-time employees, with labor
income of $1.0 million.
Table 11 Direct Economic Activities of Linton Hospital
in Emmons County, North Dakota, 2017 DIRECT ACTIVITIES FROM OPERATIONS
Number of Labor Income Categories Employees (Wages, Salaries, and Benefits)
Hospital
92 $2,993,407 Physician Clinic
13 $1,048,530
TOTALS
105 $4,041,937
SOURCE: Local data from Linton Hospital, 2016; Construction ratios and average construction compensation from
IMPLAN Group, LLC.
The economic impact of construction activities can also be measured for employment and
labor income. Linton Hospital had a minimal amount of construction in 2016 of $240,691 and in
2017 of $17,042. This level of construction generated less than two employees with labor income
of $82,195. These activities only occur during the year of construction, while operations occur
each and every year that Linton Hospital continues to operate.
20

The Impact of Linton Hospital
The direct impacts of Linton Hospital, measured by employment and labor income,
are only a portion of the total impact. There are additional economic impacts created as Linton
Hospital and its employees spend money. These are known as secondary impacts and are
measured by multipliers using an input-output model and data from IMPLAN (the model and
data are further discussed in Appendix A). This model is widely used by economists and other
academics across the U. S.
A brief description of the input-output model and the multiplier effect is included and
illustrated in Figure 2. Figure 2 illustrates the major flows of goods, services, and dollars of any
economy. The businesses which sell some or all of their goods and services to buyers outside of
the county are the foundation of a county's economy. Such a business is a basic industry. The
flow of products out of, and dollars into, a county are represented by the two arrows in the upper
right portion of Figure 2. To produce these goods and services for "export" outside of the county,
the basic industry purchases inputs from outside of the county (upper left portion of Figure 2),
labor from the residents or "households" of the county (left side of Figure 2), and inputs from
service industries located within the county (right side of Figure 2). The flow of labor, goods,
and services in the county is completed by households using their earnings to purchase goods and
services from the county's service industries (bottom of Figure 2). It is evident from the
interrelationships shown in Figure 2 that a change in any one segment of a county's economy
will have reverberations throughout the entire economic system of the county.
Consider, for instance, the closing of a hospital. The services sector will no longer pay
employees and the dollars going to households will stop. Likewise, the hospital will not purchase
goods from other businesses, and the dollar flow to other businesses will stop. This decreases
21

Households
IndustryBasic
ServicesGoods &
$
Labor Inputs
Products
Inputs
$ $
$
$
Services
$ $Figure 2
County Economic System
22

income in the "households" segment of the economy. Since earnings would decrease, households
decrease their purchases of goods and services from businesses within the "services" segment of
the economy. This, in turn, decreases these businesses' purchases of labor and inputs. Thus, the
change in the economic base works its way throughout the entire local economy.
The total impact of a change in the economy consists of direct, indirect, and induced
impacts. Direct impacts are the changes in the activities of the impacting industry, such as the
closing of a hospital. The impacting business, such as the hospital, changes its purchases of
inputs as a result of the direct impact. This also produces an indirect impact in the business
sectors. Both the direct and indirect impacts change the flow of dollars to the county's
households. The households alter their consumption accordingly. The effect of this change in
household consumption upon businesses in a county is referred to as an induced impact.
A measure is needed that yields the effects created by an increase or decrease in economic
activity. In economics, this measure is called the multiplier effect. Multipliers are used in this
report. An employment multiplier is defined as:
“…the ratio between direct employment, or that employment used by the industry initially experiencing a change in final demand and the direct, indirect, and induced employment.” An employment multiplier of 3.0 indicates that if one job is created by a new industry, 2.0
jobs are created in other sectors due to business (indirect) and household (induced) spending. The
same concept applies to labor income and output multipliers.
The Impact from Operating Activities
The employment and labor income impacts of Linton Hospital from operating activities
in the hospital and physician clinic are presented in Table 12. Direct employment and labor
23

Table 12 Economic Impacts of Operations
of Linton Hospital on Emmons County, 2017 EMPLOYMENT IMPACT FROM OPERATIONS Secondary Total Direct Employment Employment Employment
Categories Employment Multiplier Impact Impact Hospital 92 1.36 33 125 Physician Clinic 13 1.32 4 17 TOTALS 105 37 142
LABOR INCOME IMPACT FROM OPERATIONS Direct Labor Secondary Total Labor Income Labor Income Labor Income
Categories Income Multiplier Impact Impact Hospital 2,993,407 1.18 538,814 3,532,221 Physician Clinic 1,048,530 1.14 146,794 1,195,324 TOTALS 4,041,937 685,608 4,727,545
IMPACT FROM STATE AND LOCAL AND FEDERAL TAXES State and Local Taxes* 332,171 Federal Taxes* 1,245,449
SOURCE: Direct employment and labor income data provided by Linton Hospital, 2016; multipliers from IMPLAN Group, LLC. * More detailed information on state and local taxes and federal taxes are included in Table 9. Definitions for each tax category are provided in Appendix B.
24

income from operating activities were obtained from Linton Hospital. The multipliers specific to
Emmons County, ND, are derived from IMPLAN data.
The hospital employs 92 employees (Table 12). The hospital employment multiplier is
1.36. This means for every job in the hospital sector, another 0.36 job is created in other sectors
(businesses) in Emmons County. The secondary employment generated in Emmons County from
the hospital sector is estimated to be 33 jobs. The hospital has a total impact of 125 jobs on the
local economy of Emmons County. The physician clinic employs 13 employees. With a
physician employment multiplier of 1.32, the secondary employment impact is four and the total
employment impact is 17. The total employment impact of Linton Hospital includes direct
employment impact of 105 employees, secondary employment impact of 37 and total
employment impact of 142.
Direct labor income for the hospital is $3.0 million (Table 12). Using the hospital labor
income multiplier of 1.18 derived from IMPLAN, Linton Hospital generates secondary labor
income impact of $0.5 million and total labor income impact of $3.5 million. The physician
clinic has direct labor income of $1.0 million. With a 1.14 physician labor income multiplier,
secondary labor income impact is $146,794 and the total labor income impact is $1.2 million.
The hospital and clinic combined results in total direct labor income impact of $4.0 million, total
secondary labor income impact of $0.7 million, and total labor income impact of $4.7 million.
IMPLAN also provides the impact from state and local taxes and federal taxes for Linton
Hospital in Emmons County (Table 12). The impact from state and local taxes total $332,171
and the impact from federal taxes total $1.2 million. Detailed information on the components of
the taxes are included in Tables 13a (state and local) and 13b (federal). Definitions of each tax
component are included in Appendix B.
25

Table 13a Detailed State and Local Tax Impacts from Linton Hospital on Emmons County
Employee Proprietor Tax on Production Description Compensation Income and Imports Households Corporations TOTALS
Dividends
$1,979 $1,979
Social Insurance Tax: Employee Contribution $4,261
$4,261
Employer Contribution $8,610
$8,610
Tax on Production & Imports: Sales Tax
$54,703
$54,703
Property Tax
$66,028
$66,028 Motor Vehicle License
$1,694
$1,694
Severance Tax
$109,281
$109,281 Other Taxes
$3,571
$3,571
State/Local Non Taxes
$1,263
$1,263
Corporate Profits Tax
$10,222 $10,222
Personal Tax: Income Tax
$48,349
$48,349
NonTaxes (Fines/Fees)
$7,544
$7,544 Motor Vehicle License
$7,566
$7,566
Property Taxes
$2,874
$2,874 Other Tax (Fish/Hunt)
$4,226
$4,226
Total State & Local Tax Impacts $12,871 $0 $236,540 $70,559 $12,201 $332,171
Table 13b Detailed Federal Tax Impacts from Linton Hospital on Emmons County
Employee Proprietor Tax on Production Description Compensation Income and Imports Households Corporations TOTALS
Social Insurance Tax: Employee Contribution $380,648 $19,251
$399,899
Employer Contribution $371,578
$371,578
Tax on Production & Imports: Excise Tax
$8,118
$8,118
Custom Duty Tax
$3,056
$3,056 Federal Non Taxes
$496
$496
Corporate Profits Tax
$76,985 $76,985
Personal Tax: Income Tax
$385,317
$385,317
Total Federal Tax Impacts $752,226 $19,251 $11,670 $385,317 $76,985 $1,245,449
26

The Impact from Construction Activities
No construction impacts are shown due to minimal amounts of construction in 2016 and
2017. However, to illustrate the impact of a large amount of construction, Appendix C illustrates
the impact from an example of a two-year construction period with $7.5 million in construction
each year. Appendix C is provided as informational only and is not indicative of any actual
known construction activities of Linton Hospital.
Summary
Both the operating activities and construction activities of a hospital impact the economy
of Emmons County. Often overlooked can be the economic impact created from construction
activities. This report measures the impact that Linton Hospital and its physician clinic have on
the economy due to its normal operating activities; Linton Hospital had minimal construction
activities to report during 2016 and 2017 so no construction impacts were provided. The
operating impact occurs every year; whereas, the construction impact will only occur during the
construction year.
In 2017, Linton Hospital employs 92 full- and part-time employees and generates almost
$3.0 million in labor income (wages, salaries, and benefits); the physician clinic employs 13 with
labor income of $1.0 million. When the secondary impacts are included, the hospital has total
employment impact of 125 jobs and total labor income impact of $3.5 million and the physician
clinic has total employment impact of 17 jobs and total labor income impact of $1.2 million.
When combined, Linton Hospital has total employment impact of 142 jobs and total labor
income impact of $4.7 million. The employment and labor income impacts from operating
activities are annual and will continue each and every year that Linton Hospital and its physician
clinic operate in the future; these are long term economic benefits of Linton Hospital.
27

The impacts generated by Linton Hospital contribute to the local economy of Emmons
County, North Dakota. The hospital employs local residents. The hospital and its employees
spend money in Emmons County and generate a secondary impact. If the hospital increases or
decreases in size, the medical health of Emmons County as well as the economic health of
Emmons County can be affected.
For the attraction of industrial firms, businesses, and retirees, the local area should have
quality hospital and health services. A quality hospital and health sector can contribute to the
overall economic health of Emmons County, as well as the overall medical health of the Emmons
County residents. Given this, not only does Linton Hospital contribute to the health and wellness
of the local residents but Linton Hospital also contributes to the overall economic strength of
Emmons County.
28

References
Alward, G., Sivertz, E., Olson, D., Wagnor, J., Serf, D., and Lindall, S. Micro IMPLAN Software Manual. Stillwater, MN, University of Minnesota Press. 1989.
Chirilos, Thomas N. and Gilbert Nostel (1985). “Further Evidence on the Economic Effects of
Poor Health.” Review of Economics and Statistics. 67(1), 61-69. Doeksen, Gerald A., Tom Johnson, Diane Biard-Holmes and Val Schott (1988). “A Healthy
Health Sector is Crucial for Community Economic Development.” Journal of Rural Health. Vol. 14, No. 1, pp. 66-72.
Doeksen, Gerald A., Johnson, Tom, and Willoughby, Chuck. Measuring the Economic
Importance of the Health Sector on a Local Economy: A Brief Literature Review and Procedures to Measure Local Impacts. Southern Rural Development Center. SRDC Pub. No. 202. 1997.
Lyne, Jack (1988). “Quality-of-Life Factors Dominate Many Facility Location Decision.” Site
Selection Handbook. (33) 868-870. Lyne, Jack (1990). “Health Care and Education: Important QOL Factors, But Who’s Accurately
Measuring Them?” Site Selection Handbook. 35(5), 832-838. McGuire T. (1986). On the Relationship Between Infrastructure and Economic Development.
Stoney Brook: State University of New York. Miernyk, W.H. The Element of Input-Output Analysis. New York, NY; Random House. 1965. Minnesota IMPLAN Group, Inc. User’s Guide, Analysis Guide, Data Guide: IMPLAN
Professional Version 2.0 Social Accounting & Impact Analysis Software, 2nd Edition. June 2000.
Reginer, V. and L.E. Gelwicks (1981). “Preferred Supportive Services for Middle to Higher
Income Retirement Housing.” The Gerontologist. 21(1), 54-58. Scott, Loren C., Lewis H. Smith, and Brian Rungeling (1997). “Labor Force Participation in
Southern Rural Labor Markets.” American Journal of Agricultural Economics. 59(2), 266-274.
Siverts, Eric, Charles Palmer, Ken Walters, and Greg Alward. IMPLAN USER'S GUIDE. U.S.
Department of Agriculture, Forest Service, Systems Application Unit, Land Management Planning, Fort Collins, Colorado. 1983.
Toseland, R., and J. Rasch (1978). “Factors Contributing to Older Persons’ Satisfaction with
Their Communities.” The Gerontologist. 18(4), 395-402.
29

Appendix A
IMPLAN Software and Data from IMPLAN Group, LLC:
Model and Data Used to Derive Multipliers

APPENDIX A IMPLAN Software and Data from IMPLAN Group, LLC:
Model and Data Used to Derive Multipliers A Review of Input-Output Analysis
Input-output (I/O) (Miernyk, 1965) was designed to analyze the transactions among the industries in an economy. These models are largely based on the work of Wassily Leontief (1936). Detailed I/O analysis captures the indirect and induced interrelated circular behavior of the economy. For example, an increase in the demand for health services requires more equipment, more labor, and more supplies, which, in turn, requires more labor to produce the supplies, etc. By simultaneously accounting for structural interaction between sectors and industries, I/O analysis gives expression to the general economic equilibrium system. The analysis utilizes assumptions based on linear and fixed coefficients and limited substitutions among inputs and outputs. The analysis also assumes that average and marginal I/O coefficients are equal. Nonetheless, the framework has been widely accepted and used. I/O analysis is useful when carefully executed and interpreted in defining the structure of an area, the interdependencies among industries, and forecasting economic outcomes. The I/O model coefficients describe the structural interdependence of an economy. From the coefficients, various predictive devices can be computed, which can be useful in analyzing economic changes in a state, an area or a county. Multipliers indicate the relationship between some observed change in the economy and the total change in economic activity created throughout the economy. The basis of IMPLAN was developed by the U. S. Forest Service to construct input/output accounts and models. The complexity of this type of modeling had hindered practitioners from constructing models specific to a community requesting an analysis. The University of Minnesota utilized the U.S. Forest Service model to further develop the methodology and expand the data sources to form the model known as IMPLAN. The founders of IMPLAN, Scott Lindall and Doug Olson, joined the University of Minnesota in 1984 and, as an outgrowth of their work with the University of Minnesota, entered into a technology transfer agreement with the University of Minnesota that allowed them to form Minnesota IMPLAN Group, Inc. (MIG). In 2013 Minnesota IMPLAN Group, Inc. was purchased by IMPLAN Group, LLC and relocated to:
IMPLAN Group, LLC 16740 Birkdale Commons Parkway Suite 206 Huntersville, NC 28078
Support hours are 8 am – 7 pm Eastern time and can be reached by email at [email protected] or by phone at 651-439-4421 or 704-727-4141
A-1

IMPLAN Software and Data
At first, IMPLAN focused on database development and provided data that could be used in the Forest Service version of the software. In 1995, IMPLAN took on the task of writing a new version of the IMPLAN software from scratch that extended the previous Forest Service version by creating an entirely new modeling system – an extension of input-output accounts and resulting Social Accounting Matrices (SAM) multipliers. Version 2 of the new IMPLAN software became available in May of 1999. The latest development of the software is now available, IMPLAN Version 3 Software System, the new economic impact assessment software system. With IMPLAN Version 3 software, the packaging of products has changed. Version 3 utilizes 2007 or later data. When data are ordered, the data cost plus shipping are the only costs. Version 3.0 software and the new IMPLAN appliance are included in the cost of the data. There are no additional fees to upgrade to IMPLAN Version 3.0. Data files are licensed to an individual user. Version 2 is no longer compatible with 2008 and later data sets. Version 3 allows the user to do much more detailed analyses. Users can continue to create detailed economic impact estimates. Version 3.0 takes the analysis further, providing a new method for estimating regional imports and exports is being implemented - a trade model. IMPLAN can construct a model for any state, region, area, county, or zip code area in the United States by using available national, state, county, and zip code level data. Impact analysis can be performed once a regional input/output model is constructed. IMPLAN Multipliers
Five different sets of multipliers are estimated by IMPLAN, corresponding to five measures of regional economic activity. These are: total industry output, personal income, total income, value added, and employment. Two types of multipliers are generated. Type I multipliers measure the impact in terms of direct and indirect effects. Direct impacts are the changes in the activities of the focus industry or firm, such as the closing of a hospital. The focus business changes its purchases of inputs as a result of the direct impacts. This produces indirect impacts in other business sectors. However, the total impact of a change in the economy consists of direct, indirect, and induced changes. Both the direct and indirect impacts change the flow of dollars to the households. Subsequently, the households alter their consumption accordingly. The effect of the changes in household consumption on businesses in a community is referred to as an induced effect. To measure the total impact, a Type II (or Type SAM) multiplier is used. The Type II multiplier compares direct, indirect, and induced effects with the direct effects generated by a change in final demand (the sum of direct, indirect, and induced divided by direct).
A-2

IMPLAN References
Alward, G., Sivertz, E., Olson, D., Wagnor, J., Serf, D., and Lindall, S. Micro IMPLAN Software Manual. Stillwater, MN, University of Minnesota Press. 1989.
Doeksen, Gerald A., Johnson, Tom, and Willoughby, Chuck. Measuring the Economic
Importance of the Health Sector on a Local Economy: A Brief Literature Review and Procedures to Measure Local Impacts. Southern Rural Development Center. SRDC Pub. No. 202. 1997.
Miernyk, W.H. The Element of Input-Output Analysis. New York, NY; Random House. 1965. Minnesota IMPLAN Group, Inc. MIG Inc Version 3.0 User’s Guide. March 2010.
A-3

Appendix B
Definitions of State and Local Tax Impacts
and Federal Tax Impacts

Appendix B – Definitions of State and Local Tax Impacts and Federal Tax Impacts
The following definitions and sources provide a key to the tax impact report, with letters corresponding to the positions in the Tables below.
State and Local Tax Impacts Employee Proprietor Tax on Production
Description Compensation Income and Imports Households Corporations Dividends O
Social Ins Tax - Employee Contribution A C
Social Ins Tax - Employer Contribution B
Tax on Production & Imports: Sales Tax D
Tax on Production & Imports: Property Tax E
Tax on Production & Imports: Motor Vehicle License F
Tax on Production & Imports: Severance Tax G
Tax on Production & Imports: Other Taxes H
Tax on Production & Imports: State/Local Non Taxes I
Corporate Profits Tax P Personal Tax: Income Tax J Personal Tax: NonTaxes
(Fines/Fees) K Personal Tax: Motor
Vehicle License L Personal Tax: Property
Taxes M Personal Tax: Other Tax
(Fish/Hunt) N Total State & Local Tax Impacts
B-1

Federal Tax Impacts Employee Proprietor Tax on Production
Description Compensation Income and Imports Households Corporations Social Ins Tax - Employee
Contribution Q S
Social Ins Tax - Employer Contribution
R Tax on Production &
Imports: Excise Tax T Tax on Production &
Imports: Custom Duty Tax U
Tax on Production & Imports: Federal Non Taxes V
Corporate Profits Tax X Personal Tax: Income
Tax W Total State & Local Tax Impacts
A. Employee-paid portion for State/Local social insurance. This represents retirement plans and temporary disability insurance. The U.S. value comes from the Bureau of Economic Analysis (BEA), National Income and Produce Accounts (NIPA) Table 3.6. This value is distributed to states based on each state’s share of the following items from the Annual Survey of State and Local Government Finances (SLGF): Employee Retirement – Local Employee Contribution; Employee Retirement – State Employee Contribution; Workers Compensation – Other Contributions. This state value is then distributed to the counties based on each county’s proportion of the state’s State/Local Government Non-Education Employee Compensation. The county-level State/Local Employee Compensation figures come from BEA. These are then split into Education vs. Non-Education using various data from the U.S. Census Bureau and the U.S. Department of Education.
B. Employer-paid portion for State/Local social insurance funds. This represents workers’ compensation and temporary disability insurance. The U.S. value comes from NIPA Table 3.6. This value is distributed to states and based on each state’s share of the following items from the SLGF: Employee Retirement – From Local Government; Employee Retirement – From State Government; Unemployment Compensation – Contribution; Workers Compensation – Own Contributions. County distribution is based on county portion of state and local government noneducation employee compensation from IMPLAN.
B-2

C. State/Local social insurance paid by self-employed. Self-employed individuals do not make payments to State/Local government, so this entry will always have a value of $0.
D. Taxes on Production and Imports net of subsidies (TOPI) sales taxes paid to State and Local Governments. The U.S. value comes from NIPA Table 3.5. The U.S. value is distributed to states based on each state’s proportion of Total General Sales Tax from the Annual Survey of State and Local Government Finances (SLGF). State values are then distributed to counties based on total Personal Income from the BEA’s CA05 table.
E. TOPI property taxes paid to State and Local Governments. The U.S. value comes from the BEA’s NIPA Table 3.5. The U.S. value is distributed to states based on each state’s proportion of Total Property Tax from the (SLGF). State values are then distributed to counties based on total Personal Income from the BEA’s CA05 table.
F. TOPI motor vehicle license taxes paid to State and Local Governments. The U.S. value comes from NIPA Table 3.5. The U.S. value is distributed to states based on each state’s proportion of Motor Vehicle Operator’s License Tax and Motor Vehicle License Tax from the SLGF. State values are then distributed to counties based on total Personal Income from the BEA’s CA05 table.
G. TOPI severance taxes paid to State and Local Governments. The U.S. value comes from NIPA Table 3.5. The U.S. value is distributed to states based on each state’s proportion of Severance Tax from the SLGF. State values are then distributed to counties based on total Personal Income from the BEA’s CA05 table.
H. TOPI other taxes paid to State and Local Governments. This item consists largely of business licenses and documentary and stamp taxes. The U.S. value comes from NIPA Table 3.5. The U.S. value is distributed to states based on each state’s proportion of the following tax items from the SLGF: Corporation License; Amusement License; Other License; Documentary & Stock Transfer; Public Utility License; Alcoholic Beverage License; Occupation & Business License, NEC; and NEC. State values are then distributed to counties based on total Personal Income from the BEA’s CA05 table.
I. TOPI non-taxes paid to State and Local Governments. This item includes rents and royalties, special assessments, fines, settlements, and donations. The U.S. value comes from NIPA Table 3.5. The U.S. value is distributed to states based on each state’s proportion of the following tax items from the SLGF: Miscellaneous – Rents; Miscellaneous – Special Assessments; Miscellaneous – Royalties; and Miscellaneous – Donations from Private Sources. State values are then distributed to counties based on total Personal Income from the BEA’s CA05 table.
B-3

J. Personal income tax payments to State and Local Governments. The U.S. value comes from NIPA Table 3.3. The U.S. value is distributed to states based on Individual Income Tax from the SLGF. State values are then distributed to counties based on total Personal Income from the BEA’s CA05 table.
K. Personal non-tax payments to State and Local Governments. This item includes payments for fines and donations. The U.S. value comes from NIPA Table 3.3. The U.S. value is distributed to states based on Motor Vehicle License Tax from the SLGF. State values are then distributed to counties based on total Personal Income from the BEA’s CA05 table.
L. Personal motor vehicle fee payments to State and Local Governments. The U.S. value comes from NIPA Table 3.4. The U.S. value is distributed to states based on Miscellaneous – Fines & Forfeits from the SLGF. State values are then distributed to counties based on total Personal Income from the BEA’s CA05 table.
M. Personal property tax payments to State and Local Governments. The U.S. value comes from NIPA Table 3.4. The U.S. value is distributed to states based on Property Tax from the SLGF. State values are then distributed to counties based on total Personal Income from the BEA’s CA05 table.
N. Personal other tax payments to State and Local Governments. This item consists largely of hunting, fishing, and other personal licenses. The U.S. value comes from NIPA Table 3.4. The U.S. value is distributed to states based on Hunting and Fishing License Tax from the SLGF. State values are then distributed to counties based on total Personal Income from the BEA’s CA05 table.
O. State/Local Government Dividends. This item represents net dividend payments to government by corporations from investments. The U.S. value comes from NIPA Table 3.3. The U.S. value is distributed to states based on the following items from the SLGF: Employee Retirement – Securities – Mortgages; Employee Retirement – Securities – Corporate Stocks; Employee Retirement – Securities – Corporate Bonds; and Employee Retirement – Total Other Securities. State values are distributed to counties is based on their proportion of state Other Property Income (from IMPLAN database).
P. State/Local Government corporate profits tax. The U.S. value comes from NIPA Table 3.3. The U.S. value is distributed to states based on Corporate Net Income Tax from the SLGF. State values are then distributed to counties is based on counties based on their proportion of the state’s Other Property Income (from IMPLAN database).
Q. Employee-paid portion for Federal social insurance. This item includes social security, survivors insurance, disability insurance, hospital insurance, supplemental
B-4

medical insurance, unemployment insurance, veterans’ life insurance, and railroad retirement plans. The U.S. value comes from NIPA Table 3.6. The U.S. value is distributed to states and counties based on Personal Contribution for Social Insurance from the BEA’s CA05 table.
R. Employer-paid portion for Federal social insurance. This item includes social security, survivors insurance, disability insurance, hospital insurance, military medical insurance, unemployment insurance, pension benefit guaranty, veterans’ life insurance, and railroad retirement plans. The U.S. value comes from NIPA Table 3.6. The U.S. value is distributed to states and counties based on Personal Contribution for Social Insurance from the BEA’s CA05 table.
S. Self-Employed contribution to Federal social insurance. This item includes social security, survivors insurance, disability insurance, and hospital insurance. The U.S. value comes from NIPA Table 3.6. The U.S. value is distributed to states and counties based on Personal Contribution for Social Insurance from the BEA’s CA05 table.
T. TOPI Federal Excise Taxes. This item includes federally levied excise taxes on alcohol, tobacco, telephones, coal, fuels, air transportation, vehicles, etc. The U.S. value comes from NIPA Table 3.2. The U.S. value is distributed to states and counties based on IMPLAN estimates of total TOPI for all industries in relationship to U.S. total TOPI.
U. TOPI Federal Custom Duties. These are gross collections less refunds. The U.S. value comes from NIPA Table 3.2. The U.S. value is distributed to states and counties based on IMPLAN estimates of total TOPI for all industries in relationship to US total TOPI.
V. TOPI Federal Non-taxes. This item includes rents and royalties4. The U.S. value comes from NIPA Table 3.2. The U.S. value is distributed to states and counties based on IMPLAN estimates of total TOPI for all industries in relationship to U.S. total TOPI.
W. Personal Income taxes paid to the Federal Government. These are taxes paid through withholding, declarations and final settlement less refunds. The U.S. value comes from NIPA Table 3.2. The same value can also be found in NIPA Table 3.4. The U.S. value is distributed to states based on each state’s value of “Federal government: Individual Income taxes (net of refunds)” from the BEA’s SA50 table. State values are then distributed to counties based on total Personal Income from the BEA’s CA05 table.
X. Federal Corporate profits tax. The U.S. value comes from NIPA Table 3.2. The U.S. value is distributed to states and counties based on their proportion of U.S. Other Property Income (from IMPLAN database).
B-5

Appendix C
Illustration of Hospital Construction Impacts

Appendix C Table EXAMPLE of Economic Impact of a Large Linton Hospital Construction Project
over a Two-Year Construction Period on Emmons County, 2017 CONSTRUCTION COSTS
Year 1 $7,500,000
Year 2 $7,500,000
Total Construction Costs $15,000,000 EMPLOYMENT IMPACT FROM CONSTRUCTION Secondary Total Direct Employment Employment Employment
Categories Employment Multiplier Impact Impact
Year 1 48 1.33 16 64 Year 2 48 1.33 16 64
TOTALS 96 32 128
LABOR INCOME IMPACT FROM CONSTRUCTION Direct Labor Secondary Total Labor Income Labor Income Labor Income
Categories Income Multiplier Impact Impact
Year 1 $2,391,120 1.22 $526,046 $2,917,166 Year 2 $2,391,120 1.22 $526,046 $2,917,166
TOTALS $4,782,240 $1,052,092 $5,834,332
SOURCE: Example only; multipliers from IMPLAN Group, LLC.