National, Provincial, and Territorial Economic Impacts of ...
Upload
trankhuongCategory
view
216download
0
The Economic Impact of Canada’s National, Provincial & Territorial
Parks in 2009
Grand Beach Provincial Park, Manitoba


Parks Canada Photo
A Technical Report prepared by The Outspan Group Inc.
Amherst Island, Stella, Ontario
for the Canadian Parks Council
April, 2011
For further information please contact:
John Good Executive Director
Canadian Parks Council [email protected]
(705) 652-9752

v
Foreword and acknowledgements Canadians benefit in so many ways from our national, provincial and territorial parks. For many years, park agencies have been working together to define, measure and report on these benefits.
As a society and individually we benefit from parks. They provide opportunities for families to be together, to learn about nature and to enjoy healthful outdoor recreation. They are places for us to relax and rejuvenate, contributing to our health and well-being. Parks contribute to our sense of identity and place. We value the natural and cultural heritage that they protect and present. Though most of us may only ever visit a few of these places, they fill us with wonder and inspire us and we consider them an important legacy to pass on to future generations.
Parks provide a broad range of ecological services. They produce clean water and air, protect critical habitat for species-at-risk and maintain healthy, diverse and resilient ecosystems upon which our own health depends. Forest areas in parks help stabilize the earth’s climate by reabsorbing carbon and other pollutants from the atmosphere and producing oxygen.
Parks also generate economic activity, supporting tourism, providing sustainable jobs, generating tax revenue to governments and diversifying the economy, particularly in rural and remote areas of Canada. Parks are the focus of much of Canada’s regional, national and international tourism activity. This report examines the economic impact of Canada’s national, provincial and territorial parks and demonstrates that spending by park organizations and by visitors to parks has a substantial and recurring impact on the economy.
Calculating the impact of each park agency and Parks Canada within and outside each province and territory and then rolling all of the data into a national report is a monumental task. This is the second such report prepared by the Canadian Parks Council and the first to include data from every province and territory.
The Economic Impact Model for Parks (EIMP) used to undertake this analysis is a substantial improvement over previous versions. It now reports on direct, indirect and induced impacts and calculates tax impacts by level of government. It has been updated with the latest coefficients from Statistics Canada’s Provincial Input/Output models and is now a web-based and user-friendly application, readily accessible to anyone wishing to use it.
The heads of Canada’s national, provincial and territorial park agencies wish to thank many contributors to the work including those who served on the project steering committee and the three working groups that examined, park organization spending, visitor spending and model functionality, respectively. The Heritage Policy Development Branch of the Department of Canadian Heritage generously provided the coding for a similar web-based model, the Economic Impact Model for Arts and Heritage (EIMAH) and the Arts Policy Branch contributed funding to assist with the updating of coefficients for both EIMP and EIMAH. The Tourism Directorate of Industry Canada also contributed financially to this project. The Industry Accounts Division of Statistics Canada provided updated coefficients and advice regarding the classification of expenditures. The Outspan Group Inc. has worked with the Council from the early days of articulating the benefits of parks to the present and we appreciate its fine work on this project. In addition to the substantial financial contributions of the jurisdictions, each park organization devoted a good deal of time and energy to preparing data for the consultants and we sincerely thank those who undertook this work. A number of jurisdictions needed help with estimating visitor spending using Statistics Canada’s travel survey data and the assistance of Research Resolutions Inc. is acknowledged.
As Chair of the Project Steering Committee, it is my pleasure to submit this report and to gratefully thank all who contributed to its preparation.
Erik Val Director, Yukon Parks

vi
Project Steering Committee: Erik Val, Yukon Parks (Chair) Dan Mulrooney, Parks Canada Barry Bentham, Manitoba, Parks & Natural Areas Harold Carroll, Nova Scotia, Parks & Recreation Terrence LeBlanc and Denisa Georgescu, Industry Canada, Tourism Directorate Michel Dubreuil, Canadian Tourism Commission John Good, Canadian Parks Council Peter Whiting, The Outspan Group Inc. Gilles Gauthier, The Outspan Group Inc. (Secretary)
Working Group on Visitor Spending: Barry Bentham, Manitoba, Parks & Natural Areas (Chair) Michel Dubreuil, Canadian Tourism Commission Peter Masson, Ontario Parks Dan Mulrooney, Parks Canada Harold Carroll, Nova Scotia, Parks & Recreation Sharon Wood, Magfur Rahman, Kathie McFarland & Dwayne Baker, Saskatchewan Parks Service Jared Prins, Alberta Parks Richard Zieba and Irene Vasa, Northwest Territories, Industry Tourism & Investment Gilles Gauthier, The Outspan Group Inc. Peter Whiting, The Outspan Group Inc. (Secretary)
Working Group on Park Organization Spending: Harold Carroll, Nova Scotia, Parks & Recreation (Chair) David Monteith, Nunavut Parks & Special Places Sharon Wood and Dwayne Baker, Saskatchewan Parks Service Alain Hébert, Société des établissements de plein air du Québec Marion Bernard, British Columbia Parks Dan Mulrooney, Parks Canada David Rioux, New Brunswick Tourism & Parks Jackie Hussey, Newfoundland & Labrador, Parks & Natural Areas Peter Whiting, The Outspan Group Inc. Gilles Gauthier, The Outspan Group Inc. (Secretary)
Working Group on Model Functionality: Dan Mulrooney, Parks Canada (Chair) Jared Prins, Alberta Parks Alain Hébert, Société des établissements de plein air du Québec Richard Zieba, Northwest Territories, Tourism & Parks Jamie Coles & Scott Milton, Yukon, Economic Development Tyler Harris and Kim Gauvin, Department of Canadian Heritage Peter Whiting, The Outspan Group Inc. Gilles Gauthier, The Outspan Group Inc. (Secretary)

The Outspan Group Inc. vii
Executive Summary The Economic Impact of Canada’s National, Provincial and
Territorial Parks in 2009 Canada’s national, provincial and territorial parks make a substantial and important economic contribution. Through the spending of park organizations and the visitors to Canada’s parks, a significant and recurring economic impact is felt throughout the country. In fiscal year 2008/09 park organizations spent $0.8 billion and visitors to parks spent $4.4 billion in 2009. The economic impacts to the Canadian economy generated as a result of this $5.2 billion in spending attributed to Canada’s national, provincial and territorial parks are: Gross Domestic Product (GDP) $4.6 billion Labour Income $2.9 billion Employment 64,050 full time equivalents Tax Revenue $0.3 billion The GDP impact of $4.6 billion is a measure of the value added which is retained within the country from the expenditures made by park organizations and park visitors. Income to labour comprised sixty-three percent of this impact - $2.9 billion; and over 64,000 fulltime equivalents of employment were derived from this spending, with many of these jobs in rural and remote regions of Canada. The study also indicates that 44% of the $0.8 billion spent by governments on parks in 2008/09 was returned in tax revenues that exclude income tax. These national impacts are derived almost equally from spending associated with federal parks (Parks Canada) and with provincial/territorial parks:
Park Organization Gross Domestic
Product (billions)
Labour Income (billions)
Employment (FTE)
Tax Revenue (millions)
Provincial/Territorial $2.0 (44.5%) $1.3 (44.3%) 28,989 (45.4%) $165.2 (48.7%) Federal $2.5 (55.5%) $1.6 (55.7%) 35,061 (54.6%) $172.1 (51.3%) TOTAL $4.6 $2.9 64,050 $337.3 Spending on park programs, by the governments of Canada and each of the provinces and territories and spending by the visitors that come to parks has a substantial and recurring impact on the Canadian economy, creating jobs, generating income for local businesses and producing tax revenue for governments, year after year.

viii The Outspan Group Inc.

The Outspan Group Inc. ix
Table of Contents Foreword and acknowledgements ..................................................................................... v Executive Summary.........................................................................................................vii 1. Introduction.................................................................................................................... 1 2. Methodology.................................................................................................................. 5
2.1 Information Development........................................................................................ 5 Park Agency and Visitor Spending Data ................................................................... 7
2.2 The Model and Impact Measures............................................................................. 8 Comparing Impact Studies: An Important Reminder ................................................ 1
3. Expenditures ................................................................................................................ 11
3.1 Park Organization Spending .................................................................................. 11 3.2 Park Visitor Spending............................................................................................ 12 3.3 Total Spending....................................................................................................... 14
4. Economic Impacts........................................................................................................ 17
4.1 Economic Impacts within each Province and Territory......................................... 17 4.2 Economic Impacts in Other Provinces and Territories .......................................... 21 4.3 National Economic Impacts................................................................................... 24
5. Summary and Conclusions .......................................................................................... 29 Appendices....................................................................................................................... 33
1. Brief Overview of the Economic Benefits Framework ........................................... 35 2. A – Data Submission Guidelines developed by Working Groups and.................... 39 2. B – Information on Park Agency Data Submissions ............................................... 39 3. Some Technical Aspects of EIMP Development .................................................... 63 4. Detailed Information by Park Agency ..................................................................... 69 4A – Profile of Parks ................................................................................................ 69 4B – List of Parks in the Study ................................................................................. 69 5. Detailed Expenditures by Park Organization and by Province and Territory ......... 91 6. Detailed Economic Impact Analysis Results by Province and Territory .............. 101

x The Outspan Group Inc.

The Outspan Group Inc. 1
An Economic Impact Analysis of Canada’s National, Provincial and Territorial Parks in 2009
1. Introduction The federal, provincial and territorial governments of Canada maintain extensive systems of parks and protected areas comprising nearly 9.5% of Canada’s land area, as of 2009. The various agencies responsible for managing these parks1 and presenting the associated programs spend substantial amounts of money on wages and salaries as well as on goods and services. In addition, the millions of people who visit these parks make significant expenditures for the use and enjoyment of park sites, facilities and services. As a consequence, the spending associated with parks is acknowledged as providing an important stimulus to the economy locally, regionally and nationally. These economic impacts are recognized as part of a much bigger suite of benefits of parks and the Canadian Parks Council (CPC), and its predecessor organization the Federal-Provincial Parks Council, has undertaken many initiatives over the past 20 years in order to measure and describe the total benefits that parks generate for society2. Economic impacts describe the change in local/regional economic activity (i.e. employment, wages and salaries, output, value-added, taxes) generated by investment spending. In so doing, they provide one type of monetary indicator of the economic importance of parks. However, economic impacts are not the same as economic benefits. While measuring the economic impacts is useful to track and describe the regional economic activity generated by investment spending, it does not describe the value of the benefits generated by these expenditures and, therefore, tends to seriously underestimate the value of parks. The use of economic benefit frameworks3 has been helpful in identifying and accounting for the full range of economic benefits derived from parks. The concept of developing a nationally consistent analysis of the economic impacts associated with Canada’s national, provincial and territorial parks was discussed by the CPC at a meeting in Gananoque, Ontario in October, 2003. At that time, the Council agreed that if all required information were provided and available for analysis, then one measure of the economic significance of the parks managed by the member jurisdictions could be established as an initial ‘order of magnitude’ benchmark. Subsequent to that meeting, a report was prepared that provided the first composite estimate of the economic impact of Canada’s parks. That report, published in 2005, included data from all jurisdictions with the exception of Prince Edward Island and Québec, who were unable to
1 The term ‘park’ is meant as an all-inclusive term that incorporates all the parks and protected areas included in this study. 2 For example, Benefits of Protected Areas, The Outspan Group, for Department of Canadian Heritage, 2000. 3 See Appendix 1 for a brief overview of the economic benefits framework adopted by the CPC.

2 The Outspan Group Inc.
participate in the study. Among the results presented in that 2005 report, the following are some of the highlights: Total spending by park agencies - $554.6 million Total visitor spending - $2,980 million National economic impacts as a result of this spending: Gross Domestic Product $2,456 million Labour Income $1,634 million Employment 59,021 fulltime equivalent jobs Tax Revenue $137 million When these results were presented to the Ministers responsible for parks in 2006 at their annual meeting, the CPC was asked to prepare a similar economic impact report on a more regular basis. This first report on the economic impact of Canada’s national, provincial and territorial parks, however, identified inconsistencies in the way in which information on visitor and park organization spending was collected and reported, as well as differences in the calculations of economic impacts. The lessons learned from the preparation of that first report led directly to a workshop sponsored by the CPC on Valuing the Socio-Economic Impacts of Protected Areas held in Gatineau, Québec, March 2007. The workshop, attended by most of Canada’s park agencies, was designed to examine the changes that were necessary in order to update the 2005 report. A series of recommendations were adopted by participants at the workshop that emphasized the need to examine and develop solutions concerning more consistent methodologies and information on: a) park visitor spending, and b) park organization expenditures. It also produced recommendations concerning the economic impact model for parks and protected areas (EIMPA), and the need to examine up-dated and alternative ways of modeling economic impacts. As a result, a major project was initiated by the CPC with the full collaboration of national, provincial and territorial park agencies to develop more standardized data to determine economic impacts and to develop an enhanced economic impact model that would be readily accessible to park agencies and others, and capable of calculating economic impacts from park-related spending on a variety of scales from local to national. Initially it was envisioned that the project would be accomplished in two major phases: Phase 1 involved upgrading the tools and data standards and Phase 2 focused on using the model and the standardized data to prepare an estimate of the economic impacts of national, provincial and territorial parks. It was recognized that while the production of the second edition of the national economic impact report was to be the primary product of the project, it was largely a project oriented toward the increased compatibility and harmonization of national, provincial and territorial park socio-economic information systems. The ultimate objective of the project was increased cooperation, information exchange and communication between socio-economic researchers and managers in these parks agencies.

The Outspan Group Inc. 3
The reality of the project was that flexibility was required by all participants throughout the study process due to evolving and changing requirements and circumstances. Some of the initial requirements were changed and new partners were brought in who provided expertise and helped fund the project. In particular, the contributions of the Department of Canadian Heritage, Industry Canada, Statistics Canada and the Canadian Tourism Commission added greatly to the successful outcome of the project. This study of the economic impact of Canada’s national, provincial and territorial parks is the second such study in what is hoped may become a regular report to the Ministers responsible for parks. This study is technical and represents a major accomplishment in creating a more consistent set of national economic impact analyses, and this report summarizes the overall impact of national, provincial and territorial parks in Canada. Included in this study are natural parks managed by federal, provincial and territorial park agencies. By design historic parks and sites are NOT included in this study. Nor does the study include protected areas managed by other government agencies, such as national wildlife areas, migratory bird sanctuaries, municipal parks and conservation areas or privately owned protected areas or those managed by non-governmental organizations, such as the Nature Conservancy of Canada. This study reports on all economic impacts within the specified areas from expenditures of all local and non-local park visitors and by Canadian park agencies. More information on the economic values of parks and protected areas can be obtained from the following publications available through the CPC:
Conservation of Ecological Areas: The Economic Bottom Line Dick Stanley, Department of Canadian Heritage. (http://www.parks-parcs.ca/english/pdf/315-e.pdf) Benefits of Protected Areas The Outspan Group, for Department of Canadian Heritage. (http://www.parks-parcs.ca/english/pdf/251-e.pdf) The Economic Benefits of Protected Areas: A Guide for Estimating Personal Benefits The Outspan Group, for Department of Canadian Heritage. (http://www.parks-parcs.ca/english/pdf/510-e.pdf)
These and other documents are available on the CPC website: www.parks-parcs.ca

4 The Outspan Group Inc.

The Outspan Group Inc. 5
2. Methodology The estimation of economic impacts requires information from a variety of sources on expenditures as well as an accurate system of measuring economic impacts. This study required data on expenditures for park operations and development, as well as attributable spending of park visitors. The economic impact model used for the analysis was the newly created web-based Economic Impact Model for Parks (EIMP). The process of developing the information for this study is described, followed by a description of the economic impact model. 2.1 Information Development Developing the information used in this study involved an enormous effort to collect sound data, from each of Canada’s national, provincial and territorial park agencies, that was as consistent and comparable between jurisdictions as possible. Obtaining such data poses no small challenge when there are differing types of parks and park systems, differing management and accounting systems for parks, and differing experiences and priorities in collecting and dealing with such socio-economic data. However, through the umbrella organization of the CPC and the efforts of all parties, these challenges were largely overcome in this project, and resulted in the development of the highest quality data ever assembled for a national study of the economic impact of Canada`s parks. Key to the success of the project were: Newfoundland and Labrador Department of Environment and Conservation Parks and Natural Areas
Prince Edward Island Tourism PEI
Nova Scotia Department of Natural Resources Parks & Recreation
New Brunswick Tourism and Parks
Québec Parcs Québec - Sépaq
Ontario Ministry of Natural Resources Ontario Parks
Manitoba Manitoba Conservation Parks and Natural Areas
Saskatchewan Ministry of Tourism, Parks, Culture & Sport Saskatchewan Parks Service
Alberta Ministry of Tourism, Parks and Recreation Parks and Protected Areas
British Columbia Ministry of Environment BC Parks
Yukon Department of Environment Yukon Parks
Northwest Territories Industry, Tourism & Investment Parks and Tourism
Nunavut Department of Environment Parks & Special Places
Canada Parks Canada Agency

6 The Outspan Group Inc.
An overview of the process included the following:
Creation of a Project Steering Committee – to oversee the project and direct the activities of the consultants and review the results of the working groups identified below. Creation of subject working groups: Visitor spending – to review and make recommendations on visitor data gathering, spending categories and visitor counts; Organizational spending – to review and make recommendations on agency spending categories, clarify the types of parks to include in the study;
Model functionality – to review and make recommendations on improvements to the EIMP.
The steering committee was comprised of working group chairs, financial contributors to the project and the CPC. Working groups were formed with volunteers from all park agencies with a knowledge of, or interest in, the subject area. The consultants were involved in all the working groups by providing expert advice and secretarial duties, and reported to the project steering committee. It was the responsibility of all park agencies to supply data for the study in a manner that most closely fit the requirements developed by the working groups. This meant reviewing their agency spending in detail to be able to categorize spending according to the classifications established, developing visitor spending estimates that reflected the quality requirements expressed, and allowing their data to be reviewed by working group members for quality control. It was on the basis of working group recommendations that the project steering committee accepted the data for use in the economic impact analysis. Over the course of this project there were a number of significant decisions and outcomes; among these are:
• Limiting the economic impact analysis to ‘natural’ parks and excluding historic sites;
• Changing the categories used to classify agency spending to more closely reflect spending patterns and aligning categories with the North American Industry Classification System (NAICS);
• Creating guidelines to help park agencies generate more complete and consistent organizational and visitor spending estimates;
• Changing the economic impact model from a stand-alone software application to a web-based model to facilitate wider application and use;
• Updating the multiplier coefficients in the EIMP to the latest available (2006); • Collaborating with the Department of Canadian Heritage and Industry Canada; • Sharing the detailed input-output runs by Statistics Canada with all participating
organizations; • Resolving some of the functionality issues with the EIMP; and • Initiating a dialogue among park agencies concerning definitions and counting
methods used to generate park statistics such as park visitation numbers.

The Outspan Group Inc. 7
Park Agency and Visitor Spending Data National studies, which are based on data supplied by multiple organizations, face many challenges related to the collection and standardization of data. This short section highlights some of these data issues; information specific to each park agency’s submission is presented in Appendix 2. This appendix also presents the guidelines developed by the working groups for the reporting of these expenditures. Agency Spending On a year over year basis, operations and maintenance costs are relatively stable compared with the more volatile capital costs which typically vary. Given the economic situation in 2008/09 and 2009/10 (a time of international recession and the introduction of significant stimulus spending by governments) there was a concern that there may have been unusually large spending on capital projects within parks, which would present an unrealistic picture of park agency spending. However, as evidenced by the data presented in the next chapter, capital spending represented a modest 18% of total park agency spending so a one year snapshot, such as this study presents, is likely to reflect the capital spending of park agencies in a reasonable manner. Each park agency was responsible for the preparation of its submission to the consultants. This meant that the agency had to review its expenditures in detail and determine which expenditures were legitimate for inclusion in the study (i.e. were not transfers between government agencies and was spending that would actually generate an economic impact), and into which specified category it should be placed in accordance with the expenditure allocation guidelines developed by the working group on organizational spending. There were three areas of interest:
a) that only spending associated with the selected types of parks (natural parks) were included;
b) that certain types of spending were not included consistently (e.g. purchases of land, used vehicles, transfers between agencies, etc.) in the expenditures submitted; and,
c) that the expenditures were placed into the appropriate category used by the EIMP. While the consultants assisted with this process to the extent desired by the park agencies, it was ultimately up to each park agency to submit data in which it had confidence. While not a large issue, it is worth noting that within the data submitted by the fourteen agencies there may be differences in the way in which park agencies treated similar expenditures. Visitor Spending Many park agencies do not collect visitor spending information on a regular or consistent basis. Because of the cost associated with the acquisition of this data, and for other reasons, some park agencies rely on other agencies, such as tourism departments, to generate visitor spending estimates. On the other hand, some park agencies have developed regular visitor data gathering systems that include information on spending. There is an inconsistency in the availability of visitor spending estimates across the country. In this study a variety of sources were used by park agencies to generate estimates of visitor spending. The following is a summary by park agency:

8 The Outspan Group Inc.
Newfoundland and Labrador – TSRC/ITS*
Prince Edward Island – 2007 Tourist Exit Survey
Nova Scotia – TSRC/ITS
New Brunswick – TSRC/ITS
Québec – 2006 study results adjusted to 2009
Ontario – 2009 Park Visitor Surveys
Manitoba – TSRC/ITS Saskatchewan – TSRC/ITS
Alberta – TSRC/ITS British Columbia - 2004 study results adjusted to 2009
Yukon – 2009 Territorial Park camper survey
Northwest Territories – 2006 Tourist Exit Survey
Nunavut – 2008 Tourist Exit Survey Parks Canada – TSRC/ITS & Québec Service Centre
* TSRC/ITS – Travel Survey of Residents of Canada and International Travel Survey undertaken by Statistics Canada in 2008 with a specialized analysis for each jurisdiction by Research Resolutions and Consulting Ltd. Despite the issues that arose as a result of compiling and combining the data from the 14 jurisdictions, the data used for this analysis of economic impact is the most comparable and consistent set of data ever assembled for such an analysis. 2.2 The Model and Impact Measures The CPC has used the Economic Impact Model for Parks and Protected Areas (EIMPA) in the past for much of its economic impact analysis. This model underwent extensive re-development as a part of this project4. Important new features of the model include:
• Changing the economic impact model from a the stand-alone software application to web-based delivery to allow for wider accessibility and ease of updating and use;
• Using a different (and much more up-to-date) programming language; • Updating the multiplier coefficients to 2006 (latest available from Statistics
Canada); • Expanding the economic impacts measured:
o Induced impacts (impacts related to household spending), o Tax impacts by jurisdiction (municipal, provincial/territorial, federal);
• Improving the functionality of the model; • Improving supporting text in English and French; • Changing the names and definitions of some model expenditure categories to more
4 See Appendix 3 for information on some of the technical aspects associated with model redevelopment.

The Outspan Group Inc. 9
accurately and consistently classify expenditures; and, • Changing the name to Economic Impact Model for Parks (EIMP) to distinguish it
from earlier versions. Access to the model can be obtained through the CPC website (www.parks-parcs.ca) or directly through the following web address: http://174.143.205.154/miep-eimpa/ There are many different ways in which to measure economic impacts; different models frequently measure impacts in different ways. The standard measures used in this study (and their definitions) are: Gross Domestic Product - GDP includes labour income and the net income of incorporated
businesses (profits) - it represents the net value of production (or value added) resulting from spending within defined geographical boundaries (e.g. province or territory).
Labour Income - This includes workers wages (amount of wages and salaries paid to
individuals), supplementary labour income and the net income of unincorporated businesses.
Employment - Employment, measured as Full-Time Equivalents: FTEs, are the
equivalent of one year of work for one person. For example, three individuals working for a four-month period would equal one FTE, or five FTEs could represent five individuals holding full-time positions for one year.
Tax Revenue - Taxes on products and on production at three jurisdictional levels are the
tax revenues reported in the model (federal, provincial/territorial and municipal). Taxes include GST, PST, HST, excise tax, property taxes, licences and permits. Income tax is not included.
While the tax revenue impacts are broken down by jurisdiction, the impacts of GDP, labour income and employment are derived as direct, indirect and induced. The definitions of these terms are:
Direct impacts refer to the increased income to businesses and individuals resulting from an increase in demand for goods and services in the impact area stemming from spending by a park or associated with spending by visitors.
Indirect impacts result from the increased production by businesses located in the impact area that supply intermediate products or provide services to industries directly related to the park’s purchases and/or visitor’s purchases.
Induced impacts result from persons who gained income from site related activities re-spending their income into the economy of the impacted area to purchase goods and services and generating further impacts.

10 The Outspan Group Inc.
Comparing Impact Studies: An Important Reminder The impacts calculated by the EIMP and included in this report are derived directly from Statistics Canada ‘value-added’ measures of economic impact and are considered conservative. There are many different ways of defining and measuring economic impact. The components used to estimate total impacts vary from one economic impact model to another, as do the technical means of creating measures. This causes difficulties when attempting comparisons between analyses since the types of impacts used (direct, indirect and/or induced) and the definitions of the measures used (e.g. GDP, gross output, etc.) determine the results. For example, some models used by parks organizations and other resource-based sectors report ‘gross output’ and/or ‘total sales’. These measures of impact reflect the sum of all transactions leading to the final sale of goods and services and thereby tend to be quite large in comparison to the ‘value-added’ methodology that underpins the EIMP. The ‘value-added’ measure eliminates the multiple counting of value from goods and services involved in the production chain and final sale of goods and services which are reflected in cumulative measures such as ‘gross output.’ Other economic impact studies of Canadian parks may have used different components and/or different measures of impact, and, as a consequence, their results may not be comparable to the results of this study.

The Outspan Group Inc. 11
3. Expenditures The expenditures included in this study are those by park agencies and visitors to natural parks and other natural areas under park agencies’ administration. In particular, historic parks, such as national historic sites and provincial historic parks, are not included in this analysis. The spending on historic parks and other natural areas would be in addition to the spending used in this analysis of natural parks. In general, other natural areas (conservation areas, wildlife management areas, etc.) not managed by the reporting park agency are not included in this analysis. The list of parks actually used for this study is included in Appendix 4. This appendix also presents a brief overview of each park system as provided by each park agency. Two primary types of expenditures are included in the analysis of economic impacts:
1. spending by parks organizations, and 2. spending by visitors to parks.
These expenditures by Canada’s park agencies (in fiscal year 2008/09) and their visitors (in 2009) are described in this chapter. Appendix 5 presents the detailed expenditures by category and jurisdiction. 3.1 Park Organization Spending The fourteen participating federal, provincial and territorial parks agencies reported total spending in 2008/09 of over $772 million (Table 1). Of this total, salaries/wages accounted for 45.5% ($351 million); operations 36.3% ($280 million); and capital development 18.1% ($140 million). The summary presented in Table 1 reveals some interesting results. For example, the total spending of Parks Canada exceeded the total provincial and territorial park agency spending by less than $5 million in 2008/09. On a jurisdictional basis, four provinces spent more on their parks than Parks Canada within their province: Quebec, Ontario, Manitoba and Saskatchewan. Spending in Yukon was about equal, with Parks Canada spending approximately $300,000 more. In all but two jurisdictions salary expenditures exceeded the other expenditure categories. Also, in general, operational expenses exceeded capital spending in each jurisdiction. Overall the provinces and territories spent an average of 48% of total spending on wages and salaries while Parks Canada spent an average of 52%.

12 The Outspan Group Inc.
Table 1 Summary of Park Organizational Spending by Province and Jurisdiction, 2008/09
(Thousands of Dollars)
Province Jurisdiction Operations Capital Wages/Salaries Total Province $1,907.2 $644.5 $3,761.7 $6,313.4Newfoundland
and Labrador Federal $5,980.9 $1,361.4 $7,162.3 $14,504.6Province $1,156.9 $935.9 $2,390.8 $4,483.6Prince Edward
Island Federal $3,440.2 $347.5 $3,398.3 $7,186.0Province $1,402.2 $1,883.8 $5,566.0 $8,852.0Nova Scotia Federal $10,178.0 $656.9 $13,913.9 $24,748.7Province $1,937.6 $1,592.2 $4,299.1 $7,829.1New
Brunswick Federal $7,180.8 $186.3 $7,033.3 $14,400.4Province $16,790.0 $11,213.4 $24,110.7 $52,114.1Québec Federal $16,972.6 $308.8 $26,546.0 $43,827.4Province $27,813.5 $21,274.4 $41,210.4 $90,298.3Ontario Federal $13,537.5 $554.3 $27,108.0 $41,199.8Province $7,538.8 $10,075.3 $17,661.2 $35,275.2Manitoba Federal $4,448.1 $2,098.1 $11,864.7 $18,411.0Province $5,340.8 $5,428.2 $9,875.4 $20,644.5Saskatchewan Federal $5,853.9 $300.7 $6,191.9 $12,346.5Province $27,369.6 $41,234.1 $28,120.3 $96,724.0Alberta Federal $66,003.5 $21,324.7 $43,042.5 $130,370.7Province $15,173.3 $10,042.9 $21,595.8 $46,812.0British
Columbia Federal $21,468.3 $2,800.7 $25,978.4 $50,247.4Territory $1,501.9 $771.0 $2,114.4 $4,387.3Yukon Federal $1,676.3 $40.4 $2,985.8 $4,702.5Territory $3,149.2 $2,014.0 $2,702.2 $7,865.4Northwest
Territories Federal $7,836.4 $1,380.1 $7,712.1 $16,928.7Territory $591.3 $566.0 $1,223.5 $2,380.8Nunavut Federal $4,083.6 $1,112.0 $4,041.0 $9,236.5Provinces & Territories $111,672.3 $107,675.7
$164,631.6 $383,979.7CANADA
Federal $168,660.3 $32,471.8 $186,978.1 $388,110.2
OVERALL TOTAL $280,332.6 $140,147.5 $351,609.7 $772,089.9 3.2 Park Visitor Spending Information provided by the fourteen participating agencies on attributable visitor spending is presented in Table 2. Appendix 5 provides more detail spending information for each jurisdiction.

The Outspan Group Inc. 13
Table 2 Summary of Park Visitor Spending by Province and Jurisdiction, 2009
(Millions of Dollars)
Province Jurisdiction Transport Accom. F & B Other Total Province $4.0 $1.8 $4.3 $2.2 $12.3Newfoundland
and Labrador Federal $33.5 $30.8 $50.5 $26.3 $141.1Province $0.8 $2.4 $2.0 $1.8 $7.0Prince Edward
Island Federal $10.5 $5.3 $13.4 $7.7 $36.8Province $19.5 $1.5 $21.9 $10.3 $53.1Nova Scotia Federal $7.9 $6.3 $8.8 $5.8 $28.8Province $14.8 $4.2 $17.5 $9.0 $45.4New
Brunswick Federal $16.4 $17.3 $21.0 $14.4 $69.0Province $38.3 $137.0 $80.7 $206.3 $462.3Québec Federal $56.2 $51.7 $51.0 $41.7 $200.6Province $101.2 n.a. $109.5 $89.2 $299.9Ontario Federal $20.2 $12.3 $22.8 $31.7 $87.0Province $52.4 $21.7 $54.6 $81.5 $210.3Manitoba Federal $8.7 $8.1 $8.4 $7.9 $33.1Province $42.6 $23.3 $34.9 $38.4 $139.1Saskatchewan Federal $7.8 $3.7 $7.1 $9.3 $27.9Province $70.3 $75.0 $97.4 $74.4 $317.0Alberta Federal $366.4 $299.2 $426.6 $381.2 $1,473.5Province $120.7 $14.2 $174.9 $84.0 $393.9British
Columbia Federal $114.0 $59.0 $93.6 $78.7 $345.2Territory $2.5 $0.6 $2.9 $0.3 $6.3Yukon Federal $2.1 $1.0 $1.1 $1.5 $5.6 Territory $0.7 $0.1 $1.0 $1.0 $2.8Northwest
Territories Federal $4.0 $1.5 $1.4 $0.7 $7.6 Territory $3.2 $0.4 $0.5 $0.3 $4.3Nunavut Federal $1.4 $0.6 $0.6 $0.3 $2.9Provinces & Territories $471.0 $282.2 $602.1 $598.7 $1,953.7 CANADA Federal $649.1 $496.8 $706.3 $607.2 $2,459.4
OVERALL TOTAL $1,120.1 $779.0 $1,308.4 $1,205.9 $4,413.4
Transport – all forms of transportation; Accom. – accommodation; F & B – all food and beverage; other – recreation and entertainment, and other spending. n.a. – Not collected. The total visitor spending included in this analysis is just over $4.4 billion ($4,413 million). This total expenditure is made up of $1.95 billion from provincial and territorial park visitors and $2.46 billion from Parks Canada visitors.

14 The Outspan Group Inc.
Total visitor spending was greater at federal parks than provincial/territorial parks, but was reasonably close in the ‘Other Spending’ category. There is no easy or obvious explanation for this one category to be so close in value when the other categories differ in value. Food and beverage expenditures was the largest category of visitor expenditure ($1.3 billion) with ‘other expenditures’ following closely at $1.2 billion. Transportation-related expenses were the third largest category at over $1.1 billion. Only spending on accommodation was under a total of $1 billion. Visitor spending ($4.4 billion) is over five (5.7) times greater than the spending of park organizations ($0.8 billion). 3.3 Total Spending Table 3 provides an overall summary of park agency and visitor spending by jurisdiction that has been used for the calculation of economic impacts in this study. The combined total spending amounts to $5.2 billion in 2008/09, with visitor spending forming 85% of the total at $4.4 billion.

The Outspan Group Inc. 15
Table 3
Summary of Park Organization and Visitor Spending by Province and Jurisdiction, 2008/09
(Millions of Dollars)
Province Jurisdiction Park Agencies Visitors Total Province $6.3 $12.3 $18.6Newfoundland
and Labrador Federal $14.5 $141.1 $155.6Province $4.5 $7.0 $11.5Prince Edward
Island Federal $7.2 $36.8 $44.0Province $8.9 $53.1 $62.0Nova Scotia Federal $24.7 $28.8 $53.5Province $7.8 $45.4 $53.2New
Brunswick Federal $14.4 $69.0 $83.4Province $52.1 $462.3 $514.4Québec Federal $43.8 $200.6 $244.4Province $90.3 $299.9 $390.2Ontario Federal $41.2 $87.0 $128.2Province $35.3 $210.3 $245.6Manitoba Federal $18.4 $33.1 $51.5Province $20.6 $139.1 $159.7Saskatchewan Federal $12.3 $27.9 $40.2Province $96.7 $317.0 $413.7Alberta Federal $130.4 $1,473.5 $1,603.9Province $46.8 $393.9 $440.7British
Columbia Federal $50.2 $345.2 $395.4Territory $4.4 $6.3 $10.7Yukon Federal $4.7 $5.6 $10.3Territory $7.9 $2.8 $10.7Northwest
Territories Federal $16.9 $7.6 $24.5Territory $2.4 $4.3 $6.7Nunavut Federal $9.2 $2.9 $12.1Provinces & Territories $384.0 $1,953.7 $2,337.7CANADA Federal $388.1 $2,459.4 $2,847.5
OVERALL TOTAL $772.1 $4,413.1 $5,185.2
With a combined total of $5.2 billion in attributable spending, parks clearly are important business generators in all provinces and territories. The economic impacts associated with this spending are described in the next chapter.

16 The Outspan Group Inc.

The Outspan Group Inc. 17
4. Economic Impacts This chapter presents the economic impacts at the provincial/territorial and national levels derived from the expenditures of all park agencies described in the previous chapter. The economic impact of the spending within each province, territory and nationally is substantial. Clearly, those provinces or territories having the greater spending within their boundaries will feel the greater economic impact. In each case however, the underlying structure of the economy dictates how much of the impact will be retained within the province or territory and how much will be experienced by other provinces and territories, or outside the country. Appendix 6 contains the detailed printout calculations of economic impacts by province and territory derived from the EIMP. These printouts show the impacts within each jurisdiction by spending source, impacts felt in other provinces and territories and impacts nationally. Three sets of economic impacts are presented in this chapter: 1) those experienced within the province or territory where the expenditure was made, and 2) those experienced in other provinces and territories, outside the province or territory where the expenditure was made, and 3) the total national economic impacts. 4.1 Economic Impacts within each Province and Territory Table 4 summarizes the economic impacts associated with the spending within each province and territory as presented in Chapter 3. The impacts are derived from both park agency spending and visitor spending. Impacts are presented in terms of gross domestic product (GDP), labour income, employment (full-time equivalents) and tax revenues. The spending by both park agencies and park visitors generated substantial economic impacts within individual provinces and territories. Naturally, in those provinces where more attributable spending occurs, the impacts are larger. The province enjoying the largest economic impacts from parks was Alberta: in 2008-09 the value added (GDP) retained in Alberta was $1.4 billion from spending associated with provincial and national parks; over 17,500 fulltime equivalent jobs are generated by this spending. The province with the least economic impact was Prince Edward Island ($30.5 million in GDP) from provincial and national parks spending and Nunavut was the northern territory with the lowest GDP economic impact ($12 million) from territorial and national parks spending. Since labour income is a component of GDP, it will always be a smaller value than GDP impacts. However, it does indicate the amount of dollar impact which is labour-related. Likewise, the employment impacts - full-time equivalents (FTE) - indicate the number of person-years of employment created by the attributable spending. In terms of actual jobs the number could be three to four times as large as the reported FTE since many jobs associated with the tourism service sector are seasonal and short-term by the nature of the industry. For example, the number of jobs related to the reported 4,314 FTEs of

18 The Outspan Group Inc.
employment associated with Ontario Provincial Parks may represent approximately 12,000 temporary or seasonal jobs. The impacts generated from provincial/territorial park agencies and the federal agency are quite similar in total: e.g. both generate over $1 billion in labour income and both generate about the same in tax revenue ($146 million). Somewhat larger differences emerge in terms of GDP and employment impacts. However, with overall spending by provincial/territorial park agencies being $384 million and Parks Canada’s spending being $388 million, it is to be expected that the impacts would be similar.
Table 4 Economic Impacts Associated with Expenditures by Canadian Park Agencies and Visitor
Spending Within Each Province and Territory, 2008/09
Economic Impact
Province/Territory Jurisdiction Gross Domestic Product
(Millions)
Labour Income
(Millions)
Employment (FTE)
Tax Revenue
(Millions) Province $13.3 $10.0 246 $1.3 Newfoundland &
Labrador Federal $79.8 $53.8 1,686 $7.8 Province $41.1 $27.8 789 $4.1 Nova Scotia Federal $41.4 $31.1 708 $5.0 Province $7.5 $5.6 189 $0.9 Prince Edward
Island Federal $23.0 $15.5 465 $2.9 Province $30.1 $20.3 646 $3.2 New Brunswick Federal $43.4 $33.2 861 $5.2 Province $315.8 $204.2 5,104 $28.7 Québec Federal $166.6 $114.3 2,718 $15.7 Province $291.5 $198.3 4,314 $35.0 Ontario Federal $107.5 $77.7 1,470 $10.8 Province $140.2 $99.0 2,524 $14.8 Manitoba Federal $35.6 $27.3 600 $3.4 Province $88.6 $55.8 1,561 $8.3 Saskatchewan Federal $26.4 $17.8 434 $2.7 Province $306.6 $196.0 3,721 $24.3 Alberta Federal $1,118.7 $683.3 13,894 $66.1 Province $278.8 $191.3 4,336 $25.0 British Columbia Federal $259.8 $179.4 4,001 $23.9 Territory $5.7 $4.6 88 $0.3 Yukon Federal $7.0 $5.6 107 $0.4 Territory $3.5 $2.8 42 $0.2 Nunavut Federal $8.5 $7.1 98 $0.5 Territory $6.5 $5.1 62 $0.5 Northwest
Territories Federal $16.4 $13.1 184 $1.2 Provinces & Territories
$1,529.2
$1,020.8
23,622
$146.6 TOTAL
Federal $1,934.1 $1,259.2 27,226 $145.6 OVERALL TOTAL $3,463.3 $2,280.0 50,848 $292.2

The Outspan Group Inc. 19
Table 5 provides a different breakdown of two impact measures shown above (GDP and employment) by source of impact: park agencies and visitor spending for each province and territory.
Table 5 Park Agency and Visitor Spending Impacts on Gross Domestic Product and Employment
Within Each Province and Territory by Impact Source, 2008/09
Park Agency Spending Impacts Visitor Spending Impacts
Province/Territory Jurisdiction GDP (Millions)
Employment (FTE)
GDP (Millions)
Employment (FTE)
Province $7.7 126 $5.6 120Newfoundland & Labrador Federal $13.8 232 $66.0 1,454
Province $10.8 205 $30.3 583Nova Scotia Federal $27.5 440 $13.9 268Province $4.7 128 $2.8 62Prince Edward
Island Federal $6.9 126 $16.0 338Province $8.2 204 $21.8 443New Brunswick Federal $14.5 256 $29.0 606Province $57.0 1,133 $258.9 3,971Québec Federal $54.7 761 $111.8 1,957Province $108.3 1,822 $183.1 2,492Ontario Federal $54.7 689 $52.9 781Province $36.6 562 $103.6 1,962Manitoba Federal $20.8 315 $14.8 285Province $20.8 375 $67.8 1,186Saskatchewan Federal $12.5 189 $13.9 245Province $92.5 1,092 $214.1 2,629Alberta Federal $110.5 1,381 $1,008.2 12,513Province $54.5 892 $224.3 3,444British Columbia Federal $60.4 874 $199.4 3,127Territory $4.0 53 $1.7 35Yukon Federal $5.1 69 $1.9 38Territory $2.1 24 $1.4 19Nunavut Federal $7.5 84 $1.0 15Territory $5.6 48 $0.9 14Northwest
Territories Federal $13.5 152 $2.9 33Provinces & Territories $412.8 6,664 $1,116.3 16, 960TOTAL Federal $402.4 5,568 $1,531.7 21,660
OVERALL TOTAL $815.2 12,232 $2,648.0 38,620 While there are significant variations between provinces and park jurisdictions, overall, visitors contribute significantly more to the economy than does the park agency spending,
20 The Outspan Group Inc.
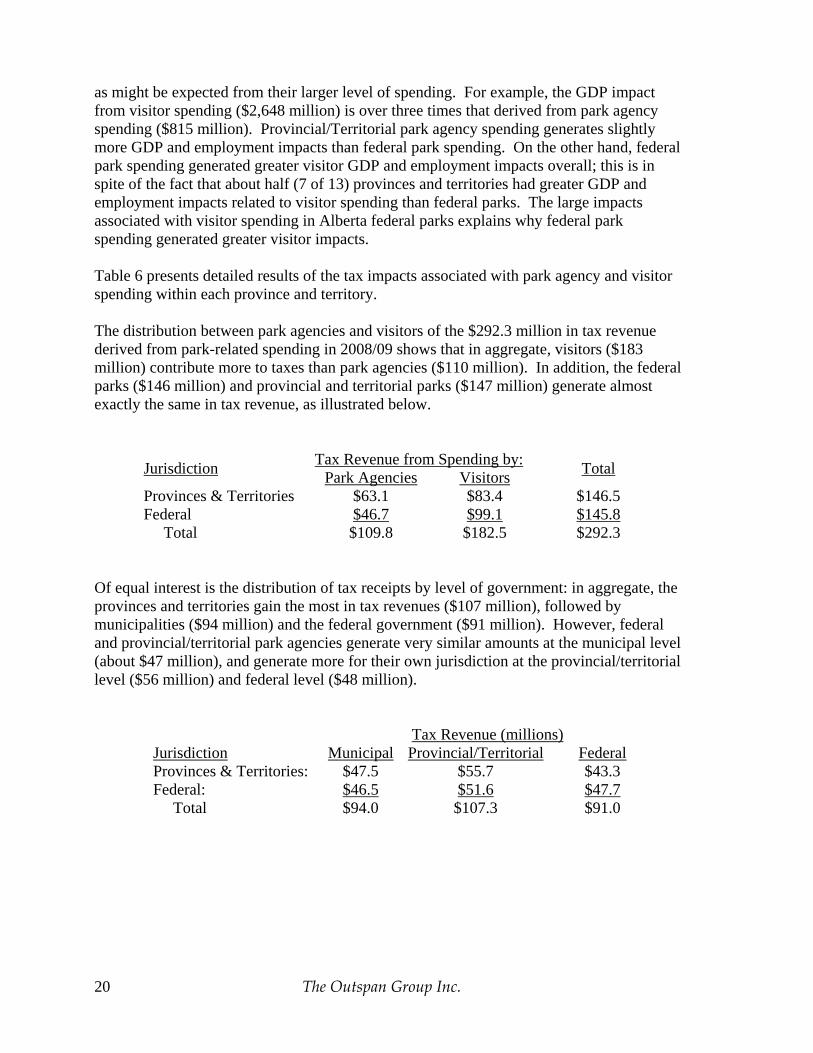
as might be expected from their larger level of spending. For example, the GDP impact from visitor spending ($2,648 million) is over three times that derived from park agency spending ($815 million). Provincial/Territorial park agency spending generates slightly more GDP and employment impacts than federal park spending. On the other hand, federal park spending generated greater visitor GDP and employment impacts overall; this is in spite of the fact that about half (7 of 13) provinces and territories had greater GDP and employment impacts related to visitor spending than federal parks. The large impacts associated with visitor spending in Alberta federal parks explains why federal park spending generated greater visitor impacts. Table 6 presents detailed results of the tax impacts associated with park agency and visitor spending within each province and territory. The distribution between park agencies and visitors of the $292.3 million in tax revenue derived from park-related spending in 2008/09 shows that in aggregate, visitors ($183 million) contribute more to taxes than park agencies ($110 million). In addition, the federal parks ($146 million) and provincial and territorial parks ($147 million) generate almost exactly the same in tax revenue, as illustrated below.
Tax Revenue from Spending by: Jurisdiction Park Agencies Visitors Total
Provinces & Territories $63.1 $83.4 $146.5 Federal $46.7 $99.1 $145.8 Total $109.8 $182.5 $292.3
Of equal interest is the distribution of tax receipts by level of government: in aggregate, the provinces and territories gain the most in tax revenues ($107 million), followed by municipalities ($94 million) and the federal government ($91 million). However, federal and provincial/territorial park agencies generate very similar amounts at the municipal level (about $47 million), and generate more for their own jurisdiction at the provincial/territorial level ($56 million) and federal level ($48 million).
Tax Revenue (millions) Jurisdiction Municipal Provincial/Territorial Federal Provinces & Territories: $47.5 $55.7 $43.3 Federal: $46.5 $51.6 $47.7 Total $94.0 $107.3 $91.0

The Outspan Group Inc. 21
Table 6
Tax Revenue Impacts at the Municipal, Provincial/Territorial and Federal Levels Derived from Expenditures by Canadian Park Agencies and Visitor Spending Within Each Province and Territory,
2008/09 (Thousands)
Tax Revenue Impacts from Park Agency Spending
Tax Revenue Impacts from Visitor Spending Province &
Territory Jurisdiction Municipal Prov/Terr Federal Municipal Prov/Terr Federal
Province $66 $483 $274 $77 $270 $139Newfoundland & Labrador Federal $152 $1,057 $597 $935 $3,334 $1,701
Province $274 $674 $433 $828 $1,193 $669Nova Scotia Federal $779 $1,835 $1,179 $393 $533 $302Province $114 $307 $180 $104 $151 $67Prince Edward
Island Federal $225 $574 $361 $524 $846 $377Province $267 $507 $346 $788 $841 $476New Brunswick Federal $560 $1,070 $734 $1,096 $1,138 $637Province $2,098 $4,263 $2,829 $7,252 $7,415 $4,826Québec Federal $1,539 $3,216 $2,139 $3,030 $3,559 $2,200Province $6,275 $8,081 $5,953 $6,442 $5,030 $3,197Ontario Federal $1,971 $2,476 $1,920 $1,899 $1,590 $987Province $1,298 $2,384 $1,677 $3,303 $3,943 $2,201Manitoba Federal $445 $907 $625 $493 $588 $316Province $591 $1,129 $803 $2,009 $2,364 $1,408Saskatchewan Federal $386 $650 $509 $410 $486 $292Province $3,308 $3,247 $5,961 $4,496 $3,110 $4,134Alberta Federal $2,937 $2,694 $4,917 $20,861 $14,788 $19,930Province $2,034 $3,571 $2,914 $5,626 $6,450 $4,357British
Columbia Federal $2,079 $3,479 $2,958 $5,182 $6,178 $4,037Territory $54 $66 $134 $30 $27 $35Yukon Federal $63 $76 $160 $40 $39 $42Territory $11 $30 $53 $24 $16 $27Nunavut Federal $54 $155 $275 $17 $17 $21Territory $111 $117 $188 $26 $27 $21Northwest
Territories Federal $261 $276 $438 $130 $62 $56Provinces & Territories
$16,501
$24,859
$21,745 $31,005 $30,837 $21,557TOTAL
Federal $11,451 $18,465 $16,812 $35,010 $33,158 $30,898 OVERALL TOTAL $27,952 $43,324 $38,557 $66,015 $63,995 $52,455 Note: income tax is not included in these tax revenues. 4.2 Economic Impacts in Other Provinces and Territories Due to the relatively open nature of the Canadian economy, spending occurring in one province or territory will have an economic impact in the other provinces and territories.

22 The Outspan Group Inc.
Table 7 presents the economic impacts in other provinces and territories from the spending5 within the indicated province or territory.
Table 7 Economic Impacts in Other Provinces and Territories from Park Organization and Visitor
Spending in the Indicated Province/Territory, 2008/09
Economic Impacts in Other Provinces & Territories Province/Territory Where Spending Occurs
Jurisdiction Gross
Domestic Product
(Millions)
Labour Income
(Millions)
Employment (FTE)
Tax Revenue
(Millions)
Province $4.5 $2.7 63 $0.2 Newfoundland & Labrador Federal $48.0 $29.1 709 $2.3
Province $14.4 $7.8 185 $0.6 Nova Scotia Federal $11.3 $6.7 156 $0.5 Province $3.6 $2.1 54 $0.2 Prince Edward
Island Federal $15.6 $8.8 224 $0.7 Province $14.0 $7.7 179 $0.6 New Brunswick Federal $22.6 $12.9 313 $1.0 Province $78.4 $44.7 983 $3.5 Québec Federal $32.7 $17.9 402 $1.5 Province $53.4 $22.2 479 $1.7 Ontario Federal $13.7 $6.4 148 $0.5 Province $72.4 $33.2 662 $2.5 Manitoba Federal $13.3 $6.4 131 $0.5 Province $49.9 $26.5 554 $1.7 Saskatchewan Federal $11.4 $6.2 128 $0.4 Province $87.1 $53.1 1,153 $3.9 Alberta Federal $354.2 $213.6 4,799 $16.0 Province $113.6 $49.3 927 $3.3 British Columbia Federal $75.8 $33.6 630 $2.3 Territory $4.3 $2.2 45 $0.2 Yukon Federal $3.2 $1.9 38 $0.1 Territory $2.6 $1.6 30 $0.1 Nunavut Federal $3.7 $2.4 48 $0.2 Territory $3.9 $2.5 50 $0.2 Northwest
Territories Federal $8.3 $5.2 109 $0.4 Provinces & Territories $502.1 $255.6 5,364 $18.7 TOTAL Federal $613.8 $351.1 7,835 $26.4
OVERALL TOTAL $1,115.9 $606.7 13,199 $45.1 Table 7 illustrates that there are substantial impacts in other areas of Canada from spending within each province and territory associated with Canada’s parks. This table shows that over $1.1 billion is generated in GDP in other provinces and territories from spending by 5 An example of this spending would be visitors buying a lobster dinner in Saskatchewan; the lobster would have come from another province.

The Outspan Group Inc. 23
all parks agencies. This spending generates over $600 million in labour income, over 13,000 fulltime jobs and provides tax revenues of $45 million in other provinces and territories. The park agencies that spend the most and generate the largest visitor spending also generate the largest impacts in other provinces and territories. For example, spending by BC parks and BC parks visitors ($440.7 million) generated $114 million in GDP impacts in other provinces and territories in addition to the $278.8 million within the province of British Columbia (Table 4). Table 8 shows the economic impacts in other provinces and territories by the source of the impact: park agencies and visitors.
Table 8 Park Agency and Visitor Spending Impacts on Gross Domestic Product and Employment In
Other Provinces and Territories, 2008/09 Park Agency Spending
Impacts Visitor Spending Impacts Province/Territory Jurisdiction GDP
(Millions) Employment
(FTE) GDP
(Millions) Employment
(FTE) Province $0.7 9.5 $3.8 54.4Newfoundland &
Labrador Federal $2.3 29.8 $45.7 678.8Province $0.7 8.8 $13.7 176.6Nova Scotia Federal $3.2 43.8 $8.1 112.5Province $0.7 10 $2.9 45.1Prince Edward
Island Federal $1.6 22.3 $14.0 201.4Province $1.0 11.9 $13.0 167.6New Brunswick Federal $2.3 29.8 $20.3 282.9Province $3.7 47.3 $74.7 940.6Québec Federal $2.6 30.4 $30.1 371.4Province $4.1 46.8 $49.3 433.3Ontario Federal $1.5 17.1 $12.2 130.8Province $5.1 68.1 $67.3 601.8Manitoba Federal $2.4 31 $10.9 100.4Province $2.8 34.1 $47.1 522.8Saskatchewan Federal $2.0 22.7 $9.4 105.2Province $19.8 226.5 $67.3 931.6Alberta Federal $40.4 449.3 $313.8 4,349.7Province $4.3 48.4 $109.3 878.6British Columbia Federal $4.5 51.5 $71.3 578.7Territory $0.8 10.7 $3.5 34.3Yukon Federal $0.7 9.7 $2.5 28.9Territory $0.5 6.6 $2.1 23.7Nunavut Federal $2.5 31.9 $1.3 17.1Territory $2.5 32.2 $1.4 18.2Northwest
Territories Federal $4.9 65.2 $3.5 44.5Provinces & Territories $46.7 535 $455.4 4,829TOTAL Federal $70.9 835 $543.1 7,002
OVERALL TOTAL $117.6 1,370 $998.5 11,831

24 The Outspan Group Inc.
In a manner similar to impacts experienced within provinces and territories, overall, park visitor spending generates greater GDP and employment impacts in other provinces and territories than does spending by park agencies. For example, the GDP impacts associated with park visitor spending ($999 million) is over eight times larger than the GDP impacts associated with spending by park agencies ($118 million). Visitor spending impacts on employment in other provinces/territories (11,831 FTE) are also over eight times those of park agencies (1,370 FTE). 4.3 National Economic Impacts Combining the within province/territory impacts with those outside the province/territory provides the total national economic impact associated with the spending attributable to Canada’s national, provincial and territorial parks. Table 9 contains this combined impact data. The economic impacts derived from the spending attributed to Canada’s national, provincial and territorial parks to the Canadian economy using the measures of this study are as follows: Gross Domestic Product $4,579 million Labour Income $2,887 million Employment 64,050 FTE Tax Revenue $337 million All these economic impact measures indicate a substantial and important economic effect upon the Canadian economy. The GDP impact of $4.6 billion is a measure of the value added which is retained within the country from the expenditures made by park organizations and park visitors. Over sixty percent (63%) of this impact is realized as income to labour - $2.9 billion; and just over 64,000 fulltime equivalents of employment are derived from this spending. Clearly, Canada’s national, provincial and territorial parks make an important contribution to the Canadian business economy. The public coffers also benefit from Canada’s parks (Table 10): $337 million in tax revenue is derived from the spending by these organizations and their visitors in 2008/09. Of this amount, visitors generate twice as much tax revenue ($223 million) through their spending than do park agencies ($115 million), and the majority of visitor spending nationally is derived from federal parks ($123 million). On the other hand, spending by provincial and territorial park agencies generates more tax revenue ($65 million) than does spending by the federal park agency ($50 million).
Tax Revenue from Spending by: Jurisdiction Park Agencies Visitors Total
(Taxes in millions) Provinces & Territories $65.4 $99.9 $165.2 Federal $49.7 $122.6 $172.1 Total $115.1 $222.5 $337.3

The Outspan Group Inc. 25
Table 9
National Economic Impacts from Park Organization and Visitor Spending by Province and Territory and by Jurisdiction, 2008/09
Economic Impacts Nationally Province/Territory
Where Spending Occurs
Jurisdiction Gross Domestic Product
(Millions)
Labour Income
(Millions)
Employment (FTE)
Tax Revenue
(Millions) Province $17.8 $12.7 309 $1.5 Newfoundland &
Labrador Federal $127.8 $82.9 2,395 $10.1 Province $55.4 $35.6 974 $4.7 Nova Scotia Federal $52.7 $37.8 864 $5.5 Province $11.1 $7.8 243 $1.1 Prince Edward
Island Federal $38.6 $24.3 689 $3.6 Province $44.0 $28.0 826 $3.8 New Brunswick Federal $66.0 $46.1 1,174 $6.2 Province $394.3 $248.9 6,087 $32.2 Québec Federal $199.3 $132.2 3,120 $17.2 Province $344.9 $220.5 4,793 $36.7 Ontario Federal $121.2 $84.1 1,618 $11.3 Province $212.6 $132.3 3,187 $17.3 Manitoba Federal $48.9 $33.7 731 $3.9 Province $138.6 $82.3 2,115 $10.0 Saskatchewan Federal $37.8 $24.0 562 $3.1 Province $393.7 $249.1 4,874 $28.2 Alberta Federal $1,472.9 $896.9 18,693 $82.1 Province $392.4 $240.7 5,263 $28.2 British Columbia Federal $335.6 $213.0 4,631 $26.2 Territory $10.1 $6.8 133 $0.5 Yukon Federal $10.2 $7.5 145 $0.6 Territory $6.1 $4.4 73 $0.3 Nunavut Federal $12.1 $9.5 146 $0.7 Territory $10.4 $7.6 112 $0.7 Northwest
Territories Federal $24.6 $18.3 293 $1.6 Provinces & Territories $2,031.4 $1,276.7 28,989 $165.2 TOTAL Federal $2,547.7 $1,610.3 35,061 $172.1
OVERALL TOTAL $4,579.1 $2,887.0 64,050 $337.3 Nationally, provincial/territorial ($121 million) and municipal ($119 million) levels of government obtain approximately the same amount of tax revenue, while the federal government retains $97 million, as indicated:

26 The Outspan Group Inc.
Table 10 Tax Receipts by Level of Government from Park Organizations and Visitor Spending by Province and
Territory and by Jurisdiction, 2008/09 (Thousands)
Level of Government Receiving Tax Province/Territory Jurisdiction Municipal Prov / Terr Federal Total
Province $264.8 $818.0 $440.5 $1,523.3Newfoundland & Labrador Federal $2,372.7 $5,089.2 $2,581.8 $10,043.7
Province $1,429.3 $2,048.8 $1,178.2 $4,656.4Nova Scotia Federal $1,475.4 $2,535.9 $1,545.5 $5,556.8Province $320.0 $508.9 $268.4 $1,097.4Prince Edward
Island Federal $1,149.4 $1,629.9 $828.4 $3,607.7Province $1,400.0 $1,522.3 $898.3 $3,820.6New Brunswick Federal $2,259.0 $2,511.4 $1,494.3 $6,264.8Province $11,348.8 $12,766.0 $8,066.8 $32,181.6Québec Federal $5,439.9 $7,228.9 $4,514.1 $17,183.0Province $13,843.2 $13,511.4 $9,347.6 $36,702.1Ontario Federal $4,169.1 $4,197.0 $2,965.5 $11,331.5Province $6,093.6 $7,012.8 $4,190.5 $17,296.8Manitoba Federal $1,218.3 $1,637.5 $1,000.9 $3,856.8Province $3,564.0 $4,009.6 $2,456.9 $10,030.4Saskatchewan Federal $1,031.1 $1,259.6 $861.8 $3,152.5Province $9,887.4 $7,702.0 $10,584.5 $28,174.0Alberta Federal $32,171.6 $23,086.4 $26,872.4 $82,130.4Province $9,711.5 $10,834.8 $7,698.8 $28,245.0British Columbia Federal $8,671.3 $10,266.5 $7,305.6 $26,243.3Territory $176.5 $143.4 $192.6 $512.4Yukon Federal $182.9 $162.7 $221.4 $567.1Territory $96.2 $81.0 $94.3 $271.6Nunavut Federal $178.5 $230.7 $321.1 $730.3Territory $236.1 $197.0 $234.1 $667.2Northwest
Territories Federal $618.9 $464.2 $555.5 $1,638.6Provinces & Territories $58,371.4 $61,156.0 $45,651.5 $165,178.8TOTAL Federal $60,938.1 $60,299.9 $51,068.3 $172,306.5
OVERALL TOTAL $119,309.5 $121,455.9 $96,719.8 $337,485.3
Tax Revenue (millions) Jurisdiction Municipal Provincial/Territorial Federal Provinces & Territories: $58.4 $61.2 $45.6 Federal: $60.9 $60.3 $51.1 Total $119.3 $121.5 $96.7
Spending originating from the provincial/territorial parks generates less municipal and federal tax than spending that originates with Parks Canada. However, nationally, the provincial/territorial parks and Parks Canada contribute approximately equal amounts ($60 million) to provincial/territorial tax revenues.

The Outspan Group Inc. 27
Table 11 shows the GDP and employment impacts nationally broken down by the impact source: park agency spending and visitor spending. This table presents hard evidence of the magnitude of the economic impacts generated by park agencies (just under $1 billion) and their park visitors (over $3.6 billion).
Table 11 Park Agency and Visitor Spending Impacts on Gross Domestic Product and
Employment Nationally, 2008/09
Park Agency Spending Impacts Visitor Spending Impacts Province/Territory Jurisdiction GDP
(Millions) Employment
(FTE) GDP
(Millions) Employment
(FTE) Province $8.4 134 $9.4 175Newfoundland &
Labrador Federal $16.1 262 $111.7 2,133Province $11.4 214 $44.0 760Nova Scotia Federal $30.7 484 $22.0 381Province $5.4 136 $5.7 107Prince Edward
Island Federal $8.5 148 $30.0 539Province $9.2 215 $34.8 611New Brunswick Federal $16.8 286 $49.3 889Province $60.7 1,175 $333.6 4,912Québec Federal $57.3 791 $141.9 2,328Province $112.5 1,868 $232.4 2,925Ontario Federal $56.2 706 $65.1 912Province $41.7 623 $170.9 2,564Manitoba Federal $23.2 346 $25.7 385Province $23.7 406 $114.9 1,709Saskatchewan Federal $14.5 212 $23.3 350Province $112.3 1,313 $281.4 3,561Alberta Federal $150.9 1,830 $1,322.0 16,863Province $58.8 940 $333.6 4,323British Columbia Federal $64.9 926 $270.7 3,706Territory $4.9 64 $5.2 69Yukon Federal $5.8 79 $4.4 67Territory $2.6 30 $3.5 43Nunavut Federal $10.0 116 $2.4 32Territory $8.1 80 $2.3 32Northwest
Territories Federal $18.4 217 $6.4 77Provinces & Territories $459.7 7,200 $1,571.7 21,789TOTAL Federal $473.3 6,403 $2,074.9 28,662
OVERALL TOTAL $933.0 13,603 $3,646.6
50,451

28 The Outspan Group Inc.

The Outspan Group Inc. 29
5. Summary and Conclusions In sum, spending by Canada’s park agencies ($0.8 billion) in 2008-09, coupled with visitor spending of $4.4 billion in 2009, resulted in $5.2 billion in combined spending being attributed to Canada’s national, provincial and territorial natural parks. This spending had a significant effect upon the economies of each jurisdiction and nationally generated a gross domestic product (or value added to the economy) of $4.6 billion. Governments also were the recipients of over $337 million in tax revenues during this period – or 43% of the total amount spent by park agencies. The results of this project undertaken by the Canadian Parks Council provide a clear demonstration of the financial value derived from Canada’s national, provincial and territorial parks. The significant effort that went into the production of consistent and reliable sources of information used for the generation of economic impacts has not only been justified but also illustrates the value that can be attained through cooperation and inter-agency collaboration.

30 The Outspan Group Inc.

The Outspan Group Inc. 31
References Statistics Canada, Canadian Open Input-Output Model, Notes and Excerpts and Personal Communications sent to The Outspan Group, 2009. Ottawa. The Outspan Group Inc. Benefits of Protected Areas, prepared for Parks Canada, Department of Canadian Heritage, 2000. The Outspan Group Inc. The Economic Impact of Canada’s National, Provincial and Territorial Parks in 2000, prepared for Canadian Parks Council, 2005. The Outspan Group Inc. Economic Impact of Parks Canada, prepared for Parks Canada Agency, 2010.

32 The Outspan Group Inc.

The Outspan Group Inc. 33
Appendices
1. Brief Overview of the Economic Benefits Framework
2. A – Data Submission Guidelines developed by Working Groups and B – Information on Park Agency Data Submissions Information on Park Agency Data Submissions
3. Some Technical Aspects of EIMP Development
4. Detailed Information by Park Agency:
A – Profile of Parks B – List of Parks in the Study Information on Each Park System and the List of Parks Included
5. Detailed Expenditures Data by Park Organization and by Province and Territory
6. Detailed Economic Impact Analysis Results by Province and Territory