Common Manure Handling Systems _ Ag 101 _ Agriculture _ US EPA

The Economic Impactof Agriculture and Ag-
Related Industries onthe Commonwealth of
VirginiaDr. R. David Lamie
Dr. R. David Lamie is Assistant Professor,Department of Agricultural and AppliedEconomics, Virginia Tech.


ACKNOWLEDGMENTS
The Virginia Agricultural Economic Study Advisory Group provided counsel and direction for theoriginal study conducted by Johnson and Wade. Some of the members of the Advisory Group no longerhold the positions they did at the time of the original study. However, since the decisions this groupmade shaped the methodology used in the Johnson and Wade study, which served as a significant basisfor the methodology used in this report, the author believed it appropriate to acknowledge them again inthe updated study. The members of the advisory group included
Mr. Robert T. Bass, State Statistician, Virginia Agricultural Statistics Service;
Dr. Joseph D. Coffey, Vice President of Economics and Planning, Southern States Cooperative, Inc.
J. Carlton Courter, III, Commissioner, Virginia Department of Agriculture and Consumer Services;
Dr. Albert E. Essel, Extension Specialist and Agricultural Economist, Virginia State University;
Ms. Evelyn M. Glazier, Director of Research, Virginia Department of Economic Development;
Mr. Robert J. Griffis, Chief Economist, EIS Division, Virginia Employment Commission;
Mr. Alex Hamilton, Public Affairs, Virginia Farm Bureau Federation;
Mr. Herbert H. Hill, Jr., Director, Office of Policy, Planning and Agricultural Development, VirginiaDepartment of Agricultural and Consumer Services;
Dr. Gerald M. Jones, Assistant Director, Agriculture and Natural Resources, Virginia CooperativeExtension, Virginia Tech;
Dr. John L. Knapp, Research Director for Business and Economics, Center for Public Service, Universityof Virginia;
Dr. Wayne D. Purcell, Professor and Coordinator, Rural Economic Analysis Program, Department ofAgricultural and Applied Economics, Virginia Tech;
Mr. William C. Shelton, Director, Center on Rural Development, Virginia Department of Housing andCommunity Development.
The author deeply appreciates the editorial efforts of Karen Mundy.
This project was funded jointly by the Virginia Department of Agriculture and Consumer Services(VDACS) and the Department of Agricultural and Applied Economics, Virginia Tech. VDACS alsoprovided data and published summary reports.

TABLE of CONTENTS
Executive Summary...........................................................................................................................vIntroduction .......................................................................................................................................1The Changing Agricultural System ....................................................................................................1Measuring Economic Contributions ...................................................................................................2
Methodologies Used to Estimate the Significance of Agriculture .................................................2Definition of the Agricultural Sector and Backward Linkages in this Study..................................3Data Sources ...............................................................................................................................4
The Economic Impact of Virginia's Agriculture .................................................................................5Regional Composition of Agriculture.................................................................................................8Conclusions .....................................................................................................................................13References.......................................................................................................................................14Appendix A. Notes on Methods ......................................................................................................15
Definitions ................................................................................................................................15Description of the IMPLAN Model............................................................................................15Avoiding Double Counting........................................................................................................15Data sources ..............................................................................................................................16
Appendix B. IMPLAN Employment and Value-Added Ratios ........................................................17Appendix C. Virginia Agricultural Statistic Districts.......................................................................18Appendix D. Farm Production and Agricultural Processing Employment, by Commodity ...............19

v
EXECUTIVE SUMMARY
During the autumn of 1997, faculty in the Department of Agricultural and Applied Economics at VirginiaTech, in cooperation with the representative from Virginia Department of Agriculture and ConsumerServices, (VDACS) analyzed the size and economic contribution of agriculture in Virginia. In this report,agriculture is described and measured as a four-part system: 1) production of agricultural goods andservices, including farm crops, livestock, horticulture, landscaping, Christmas trees, aquaculture,vineyards, and private woodlots; 2) processing of food, tobacco, wine, and cotton textiles; 3) distribution-related activities, such as transportation and the wholesale and retail sale of agricultural products; and 4)input sectors, that is, activities that supply goods and services for production, processing, and distributionactivities.
With approximately one of every ten jobs in Virginia related to agriculture, agricultural activities aremajor components of the employment base within both rural and urban areas. Agriculture makessignificant contributions to Virginia's employment, Gross State Product (GSP), and overall economicwell-being. In addition, agriculture provides many non-market benefits to the Commonwealth.
The major farm commodities produced in Virginia are cattle and calves (in the northern, western, central,and southwestern districts of the state), poultry (in the northern and western districts), dairy (in thenorthern, central, and southwestern districts), tobacco (in the southern and southwestern districts), andsoybeans (in the eastern and southeastern districts). The major agricultural manufacturing activities in thestate are poultry processing (in the northern district), tobacco processing (in the central district), and meatprocessing (in the southeastern district).
A summary of the economic contributions of these agriculturally related activities shows
R $12.8 billion or 7.4 percent contribution to GSP, up from $11 billion in 1992; R 235,800 jobs (6 percent of state total) directly related to agricultural production, inputs,
processing, and distribution; R An additional $6.7 billion in GSP (3.9 percent) and 152,000 jobs (4 percent) from effects
of agriculture-related income on other sectors; R A total of approximately 11.2 percent of GSP and 10 percent of jobs in Virginia related
in some way to the agricultural economic system.


1
INTRODUCTION
According to the Virginia Agricultural Statistics Service (VASS), as of June 1, 1997 Virginia containedapproximately 47,000 farms and 8.5 million acres of farmland.1 Farming is only a portion of the chain ofeconomic activities that stretches from the producer of farm supplies to the processors and distributorsthat put agricultural products into the hands of consumers. In addition to the state's farms and farmers, theagricultural system includes food, fiber, wine, and tobacco processors that manufacture products for saleacross Virginia and around the world; transportation workers, wholesalers, and retailers who distributeboth processed and unprocessed products to consumers; and producers and suppliers of inputs to farmers,processors, and distributors. This agricultural system, with its many linkages, touches the lives of everyVirginian by contributing to virtually every sector of the state’s economy.
Faculty in the Department of Agricultural and Applied Economics at Virginia Tech, in cooperation withthe Virginia Department of Agriculture and Consumer Services (VDACS) personnel, first conducted astudy in 1993 to determine the size and economic contribution of Virginia's agricultural sector to theVirginia economy (Johnson and Wade, 1994). An advisory committee that included agricultural industryrepresentatives and experts in the analysis of economic impacts guided the 1993 study (seeAcknowledgements). The committee helped define the agricultural system and refine the measurementprocedures. These definitions and measurement procedures were carried over to this study. State-of-the-art methods were used both to measure the linkages between the system's components and to estimateemployment levels.
In 1997, the VDACS personnel requested that the original report be updated to reflect the current statusof agriculture in Virginia. That a more complete picture could be obtained if the study were conductedafter the publication of the 1997 Census of Agriculture was acknowledged. However, VDACSpersonnel maintained that a study conducted prior to the publication of the Census of Agriculture wouldbe of benefit to them. This study documents the significant economic impacts of agriculture on Virginiaand on particular areas of the state, prior to the release of the 1997 Census of Agriculture.
THE CHANGING AGRICULTURAL SYSTEM
Since Colonial times, when the economy of Virginia was almost entirely agricultural, the proportionof the labor force engaged in farming has declined as technology has increased the productivity ofboth farm and non-farm labor. At the same time, the number of jobs in non-farming components ofthe system has steadily increased as farmers have become less self-sufficient and have transferredmany of the responsibilities for producing agricultural inputs, processing its raw inputs, and marketingto other sectors of the economy.
Another change that marks the current agricultural system is agriculture’s increased diversification andlinkages with the nation and the world. Today, Virginia’s agricultural system produces specialized, high-quality products that are marketed in many parts of the world, while other agricultural products areimported and sold through Virginia distribution channels.
To suggest that agriculture is a small sector of the Virginia economy is a mistake. Today, Virginia’sagriculture includes not only traditional field crops, vegetables, livestock, and seafood, but aquaculture,
1 Virginia Agricultural Statistics Service, http://www.nass.usda.gov/va/

2
landscape and nursery products, ornamentals, and premium farm wines as well. Moreover, it hassignificant links to the tourism and forestry industries.
MEASURING ECONOMIC CONTRIBUTIONS
Estimating the significance of an industry is important and useful for many reasons. Chief among them isthat it allows decision-makers to better understand the effects of their decisions on an industry as well ason industry linkages. People derive their income and some sense of worth from their employment. Theypay taxes and make purchases with a portion of their income. These activities affect still more peoplewhose livelihoods depend upon this spending of income.
Acting collectively is costly for small firms. Because most agricultural enterprises in the state are smalland diverse, they can easily be overlooked in the state and local policy-making process. Attracting andnurturing large high-tech industries that promise high wages and increased employment result in highpolitical payoffs. Thus, studies of the overall economic significance of such diffuse and diverse industriesas agriculture are very important for informed political decision making.
The agricultural sector is difficult to measure, especially in terms of employment, because of the diversityand dissimilarity of its components. The most diverse is the farm production component, whichencompasses individuals working by and for themselves, family laborers, unpaid labor, dual-occupationworkers, seasonal labor, contract labor, products consumed at home, and government programs that affectincome. Because the farm component is linked to the other components both through producers’purchases of inputs and through the sale of products for processing and distribution, double counting caneasily occur, which the author worked painstakingly to avoid (Appendix A).
Methodologies Used to Estimate the Significance of Agriculture
The methodologies used to estimate the economic impact of agriculture generally have followed twoapproaches: the final demand approach and the sectoral definition approach.2 The final demand approachbegins by estimating the consumption (final demand) of food and fiber and then works back through thesectors using an input/output table to determine the amount of output from other sectors required toproduce the final demand. This approach is used in the Davies-Goldgerg “Agribusiness” and EconomicResearch Service (ERS) “Food and Fiber System” methodologies. In contrast, the sectoral definitionapproach begins with the value of raw farm material produced. Then, the value of the inputs required toproduce the raw material as well as the value added in the food and fiber processing and distributionsectors are accounted for.
This study generally follows the sectoral definition methodology adopted by Johnson and Wade in their1994 study, The Economic Impact of Agriculture in Virginia. However, a few alterations have been madeto better reflect changes in the structure of Virginia agriculture and to incorporate changes due to theavailability of additional data.
The most significant changes in method were
1) To mitigate swings in yields and prices due to the vagaries of weather and other similarfactors, 1991-96 average levels of value of production were used instead of the mostrecent year (1996) of available price and production data. However, using multi-yearaverages tends to downplay the impact of structural changes in crop mix, for example, theaddition of cotton in a rotation.
2 See Leones, Julie, Gerald Schluter, and George Goldman.

3
2) IMPLAN value-added and employment coefficients for 1994 were used for the agriculturalprocessing sector. The Johnson and Wade study used 1991 IMPLAN coefficients for allsectors. These newer coefficients were thought to capture changes that may have occurred inthe substitution of capital for labor and the proportion of value added in the increasinglyhigh-tech processing sectors.
3) IMPLAN value added and employment coefficients for agricultural production were changedconsiderably between 1991 and 1994 because Micro Implan Group (MIG) changed themethodology for making these estimates. Consequently, the author did not have sufficientconfidence in the newer estimates to warrant their use in this study.
In addition, the magnitude of the distribution, input, and export sectors was estimated using the samecoefficients as in the study by Johnson and Wade. Thus, the impacts grew (declined) proportionally withthe size of the agricultural production and agricultural processing sectors. This approach focuses solelyon current accounts. Therefore, only the current depreciable component of the long-term effects ofcapital spending by the industry is captured. In addition, this analysis does not capture the impacts ofpositive spillover effects (open space, rural character) or negative spillover effects (pesticide and nutrientrun-off, odor, dust, noise) of the industry.
Definition of the Agricultural Sector and Backward Linkages in this Study
The definition of an industry is the most pivotal element in an economic impact study. Groupsinterested in making a particular industry appear large are interested in attributing as much economicactivity to their industry as possible. Some studies only include the direct output of the sectorscomprising the industry. However, input-output analysis allows one to capture the effect ofbackward-linked sectors, those sectors that provide inputs to the industry in question. Economicimpact analyses are very sensitive to the inclusion of additional sectors and backward linkages.Therefore, the importance of clearly identifying the sectors included in the definition of the industryand of making the rationale for selection of particular sectors obvious cannot be over-emphasized.
The definition of the agricultural sector (also referred to as the agricultural economic system) used in thisstudy is as follows:
• farm production which includes all farm crops; livestock, (including horses); agricultural,horticultural, and landscaping services; Christmas trees; aquaculture; vineyards; and privatewoodlots (but excludes commercial forestry and forest products);
• processing of both in-state and out-of-state production which includes food and tobaccoproducts, wineries, and textiles (including natural fiber textiles,3 but excluding all apparel andtextile-based consumer products);
• distribution which includes transportation and wholesale and retail sale of farm andprocessed products (including the basic value of food sold through restaurants but excludingall restaurant markup and restaurant activity itself 4); and
• input activities which include all in-state production of goods and services for the farm andfor the processing and distribution activities described above.
3 Natural fiber textiles are referred to as non-cotton later in the text.4 The agricultural portion of the restaurant sector was difficult to estimate. Therefore, none of the restaurant
sector, neither its sales nor employment, is included in the estimates of the agricultural system. However, itspurchases of food from the Virginia processing sector were estimated from the input-output model.Restaurant purchases of out-of-state food were excluded, and none of its other inputs was included.

4
The definition obviously extends beyond the farm-based definition of agriculture to a systemwidedefinition. A Virginia farm-based definition would include only those products that flow from raw farmmaterials produced in the state to their final consumers. The systemwide definition includes all in-stateactivities that add value to farm products, regardless of origin of the farm production. Therefore, theprocessing sector includes the value added to processed food, tobacco, and fiber products purchasedfrom out-of-state producers as well as from Virginia producers, and the distribution sector includes valueadded to food products produced either in Virginia or out-of-state but distributed to Virginia consumers.In neither case is the value of the out-of-state production included.
As with the Johnson and Wade study, the definition of the agricultural economic system used in thecurrent study excludes all forestry, forest products, and wood products. Consequently, most previousmeasures of Virginia's food and fiber sector are not directly comparable to the estimates in this studyof the agricultural sector in Virginia. Furthermore, the definition used in both studies excludes all theeconomic activity associated with the wood products, non-cotton textiles, and restaurant employees,as well as that portion of the of the distribution sector not handling agricultural commodities.
In general, any level of sectoral sales or final demand for agricultural goods is expected to have,besides its direct effects, additional indirect and induced effects on total industrial output, wageincome, Gross State Product (GSP), and total employment. The indirect effect is the production byother sectors of goods and services used in the production of food and fiber; the induced effect is theimpact of household spending of income earned in direct and indirect production. For example, theincome generated by the sale of cattle that a farmer raises is a direct economic effect. When thefarmer purchases feed for cattle, the feed sale is an indirect effect of the cattle production. Finally, ifthe farmer uses the profit from the cattle sale or feed store employees spend their wages to purchasenew televisions, those purchases produce induced effects through the economic activities associatedwith the sales of the televisions.
In this study, the IMPLAN (Impact Modeling for PLANning) system was used to generate estimatesof the indirect and induced impacts of Virginia agriculture (farming, processing, and distributing) forthe entire state and its agricultural statistic districts. IMPLAN is one of the most widely used input-output models in the nation (Lindall and Olson) and is described in Appendix A.5
Data Sources
The main data sources were Virginia Agricultural Statistics, employment reports prepared by the VirginiaEmployment Commission (VEC), and databases accessible within the IMPLAN model. Because officialsources of employment information, such as Virginia's Covered Employment series, seriouslyunderestimate employment in farming, farm employment was estimated indirectly from typicalemployment/output ratios derived from the IMPLAN model. Inputs were estimated by determining thelinkages from each system component to its suppliers.6
The data used for estimating the farm-level value of production is provided in tables 1 through 3. Thisstudy used the 1991-96 averages in the far right column as the basis for this estimate.7 A few
5 For more information and other definitions of basic economic terms used in this report, see “Definitions,”
Appendix A.6 For more details, see “Data Sources,” Appendix A.7 As noted before, this decision was made to mitigate some of the fluctuations in agricultural prices and
production levels. The Johnson and Wade study used only the 1992 estimates available at the time of theirstudy. The 1992 data provided in tables 1-3 may differ slightly from that used by Johnson and Wade due tosubsequent updates made by VASS.

5
significant ramifications of this decision to use the multi-year average should be noted. Generally, ifthe value of production has been consistently trending upward over this period, the multi-year averagewill be lower than the most recent year’s level (and vice versa). Cotton production provides the moststriking example of this effect with steadily increasing sales from 1991 ($5,614,000) to 1996($57,787,000), but average sales for the period of $24,710,000. At the same time, sheep and lambshave been trending downward in production. Thus, the 1991-96 average is higher than the 1996 sales.
Shifts in production between enterprises will cause changes in the amount of employment and valueadded required. As production shifts from more to less labor-intensive enterprises, the dampening effecton employment levels can be significant. The IMPLAN estimates of full time equivalent jobs (FTEs)per million dollars of sales are found in Appendix Table B1. Of particular note is that high-valuedcrops, such as tobacco, require much less land to produce $1 million of sales than do lower value cropslike corn or wheat. In addition, shifts from one crop to another imply changes in the amount of valueadded. Estimates of the amount of value added per dollar of sales for each crop are also found inAppendix Table B1.
THE ECONOMIC IMPACT of VIRGINIA'S AGRICULTURE
For the period 1991-96, average annual farm-level sales were $2.2 billion dollars. Manufactured food,fiber, and tobacco had sales of $16.4 billion, and the distribution system added another $2.6 billion.Together these three components purchased inputs from in-state suppliers worth over $4.9 billion. Intotal, the system generated over $26.1 billion in sales, affecting virtually every sector of the stateeconomy. The estimated value of product flows in Virginia's agricultural system is shown in Figure 1.
R Over $26 billion in total sales
R Almost $13 billion contribution to Gross State Product (GSP)
R Over one-quarter million jobs
R An additional $6.7 billion in GSP (3.9 percent) and an additional 152,000 jobs(4.0 percent) from induced effects.
R 11.2 percent of GSP and 10.0 percent of jobs in the state are in some way relatedto the agricultural economic system.

Table 1 Cash Receipts from Crops, Virginia, 1991-961991 1992 1993 1994 1995 1996 91-96 Average
-----------------------------------------------------------------------$1,000------------------------------------------------------
Tobacco 197,171 189,667 180,807 168,590 174,906 187,793 183,156
Peanuts 86,938 81,476 53,580 80,075 61,928 58,981 70,496
Soybeans 85,875 79,982 77,506 80,491 79,750 95,600 83,201
Corn, Grain 47,510 66,630 44,920 52,449 66,518 96,338 62,394
Wheat 28,432 45,348 38,863 43,719 65,281 69,253 48,483
Hay 27,898 28,918 29,520 27,205 26,951 30,284 28,463
Rye 390 409 228 342 235 439 341
Barley 7,290 9,561 7,742 6,305 10,525 12,344 8,961
Cotton, Lint & Seed 5,614 7,722 9,365 25,700 42,072 57,787 27,410
Other Field Crops1 1,082 1,506 1,646 1,660 1,567 1,630 1,515
Sweet Potatoes 1,365 761 702 830 895 747 883
Potatoes 21,495 16,799 19,504 19,373 21,362 20,187 19,787
Vegetables 77,328 86,670 65,314 93,480 87,862 52,997 77,275
Fruits 53,515 46,881 43,669 45,129 53,045 52,213 49,075
Greenhouse, Nursery & Christmas Trees 117,551 127,163 134,023 139,387 140,787 155,342 135,709
Greenhouse 40,364 44,387 47,820 51,670 52,287 61,067 49,599
Nursery & Christmas Trees 77,187 82,776 86,203 87,717 88,500 94,275 86,110
Cattle & Calves 387,203 336,371 339,302 292,424 252,371 211,294 303,161
Milk, Wholesale 269,325 291,888 276,500 272,272 266,340 289,980 277,718
Hogs 84,965 74,036 78,838 72,220 63,341 81,410 75,802
Total Poultry and Eggs 496,415 533,773 595,776 641,390 669,625 747,720 614,117
Broilers 305,087 330,145 370,986 397,880 400,828 466,388 378,552
Turkeys 122,934 137,879 157,080 171,864 198,810 204,250 165,470
Chickens, Farm 1,539 2,497 2,273 2,321 1,669 1,716 2,003
Eggs 66,855 63,252 65,437 69,325 68,318 75,366 68,092
Total Sheep, Lambs & Wool 5,549 6,662 6,730 5,718 5,672 5,343 5,946
Sheep & Lambs 5,379 6,407 6,556 5,460 5,357 5,177 5,723
Wool 170 255 174 258 315 166 223
Other Livestock2 106,590 112,276 117,926 125,407 135,502 142,236 123,323
Total 2,729,016 2,812,097 2,858,990 2,980,661 3,042,619 3,278,323 2,952,9881 Other field crops include mushrooms, grain sorghum, canola, sunflower, seed crops, and other field crops.2 Other livestock include turkey eggs, ducks, other poultry, horses, mules, honey, beeswax, aquaculture, mink pelts, and all other livestockSource: Virginia Agricultural Statistics Service, 1997.

7
If only the contribution to Gross State Product (GSP), that is value added by in-state activity, is counted,agricultural economic system 1991-96 average sales accounted for almost $12.8 billion (7.4 percent) ofthe estimated total GSP generated by all industries in Virginia.
The agricultural economic system also supported approximately 236,000 jobs, over 6 percent of the1991-96 average state total for all industries in the state. That figure includes 30,800 on farms; 54,900 inprocessing; 80,900 in the distribution sector; and 69,200 in input sectors. Surprisingly, most of these jobswere in urban areas of the state.
As with other industries, when the income generated by the agricultural economic system for itsemployees, proprietors, and owners is spent, a multiplier effect occurs in other sectors of the economy.On average, for the period 1991-96, these induced effects added an additional $9.74 billion in sales, $6.7billion in GSP (Table 1 and Figure 2), and 152,000 jobs. The percent of total jobs in Virginia (1991-96average) related to agriculture, including those that are accounted for by the four parts of the agriculturaleconomic system and those supported by the induced effects income earned in the agricultural economicsystem is shown in Figure 2.
8 These estimates are based upon 1992 IMPLAN data relationships and 1991-96 average value of production
figures from VASS for the farm sector and 1994 IMPLAN data relationships and 1996 quarter 2 employmentfigures from the VEC.
Figure 1. Average value of product flows (in billion dollars) in Virginia's agricultural system,1991-96.8
Households, Restaurants, andInstitutions
$5.633
Distribution$2.608
Farms$2.196
Inputs$4.915
Processing$16.398
Exports$13.730

8
Proces s ing1 . 4 %
Inputs1 . 8 %
I n d u c e d3 . 9 %
D is t r ibut ion2 . 1 %
F a r m i n g0 . 8 %
Unre l a t ed90 .1%
Figure 2. Components of farm and farm related employment in Virginia
The economic impact of agriculture on Virginia’s economy is summarized in Table 2.
Table 2. The average economic impact of Virginia's agricultural economic system, 1991-96.
Sales($ billion)
Contribution to GSPor Value Added
($ billion)Employment(thousand)
Farm Production 2.196 0.360 30.8Processing 16.398 7.744 54.9Distribution 2.608 2.224 80.9Inputs 4.915 2.452 69.2
Total System 26.117 12.780 235.8Induced Effects 9.735 6.691 152.0
Total Related to Agriculture 35.852 19.473 387.8% of State Total 12.32% 11.21% 9.88%
REGIONAL COMPOSITION of AGRICULTURE
For the 1991-96 period, the top ten farm commodities (in terms of cash receipts) in Virginia were (fromlargest to smallest) broilers, cattle and calves, milk, tobacco, turkeys, greenhouse and nursery products,soybeans, vegetables, hogs, and peanuts. Relatively few changes in Virginia's national rankings occurredin production between 1992 and 1996: tobacco production slipped from 5th to 6th; peanuts from 5th to 6th;sweet corn from 18th to 22nd; sheep from 19th to 20th; hogs from 20th to 21st; and wheat from 21st to 22nd.However, Virginia's national rank in beef production increased from 24th to 20th while turkey productionheld a steady rank of 6th in the nation. On average, for the 1991-96 period, field crops, fruits andvegetables, and nursery products accounted for 36 percent; and meat, diry, and animal productsaccounted for 64 percent of total cash receipts.
Production and processing of most agricultural commodities are concentrated in specific areas of thestate. The corresponding agricultural statistic districts are shown in Figure 3. (Appendix C provides a

9
Ce t a
Eastern
SoutheasternSouthwestern
Northern
Western
Southern
list of the jurisdictions included in each district.) At the farm level, grains are generally grown in the east
grown in the south, while burley tobacco is grown in the southwest; and dairy and livestock production
Virginia—meat packing, poultry processing, prepared fish, confectionery products, fluid milk products,
districts. Poultry processing is the largest food manufacturing industry in the northern and eastern
located predominately in the central district.
Since this study was completed before publication of the 1997 Census of Agriculture, the regional
each commodity using 1992 Census of Agriculture regional production levels. Thus, the assumption
1996 at the 1992 levels, which may not be accurate for all commodities because of regional shifts in
of production. Regional food processing employment levels were derived from VEC employment9
showing the relative importance of various agricultural activities to each agricultural statistic district
The distribution of total direct farm employment is shown in Figure 4, and direct farm-production
Cattle production employs the most people in the northern, western, central, and southwestern districts.
considerable amount of production also in the eastern and central districts. In the southeastern district,
Growth in the hog sector is thought to have contributed most of this change. Total employment in
9 Agricultural processing employment was estimated using VEC quarter 2 employment data for 1996. Officials at
disclosed because too few firms were represented, which could result in disclosure of individual operations.)

10
Figure 4. Farm sector employment numbers by region, 1996.
Estimates of total employment by district for the processing sector are shown in Figure 5, and estimatesof the direct agricultural-processing employment levels by commodity for each district are shown inAppendix D figures 7D through 11D. Poultry processors are major employers in the northern and easterndistricts. Tobacco processing tends to dominate agricultural-processing employment in the central andsouthern districts. Meat processing is the major source of agricultural-processing employment in thesoutheastern district, and textile manufacturing is important to the southern tier of counties.10
Figure 5. Agricultural processing sector employment numbers by region.
10 Data for all individual industries were unavailable due to the disclosure rules imposed by the VEC. Only the
largest sectors were chosen for illustrative purposes.
11,22113,081
16,500
4,412
20,382
5,316
7,933
0
5,000
10,000
15,000
20,000
25,000
Em
ploy
men
t
Centra
l
Southe
aster
n
Northe
rn
Southe
rn
Easter
n
Wes
tern
Southw
ester
n
15,483
11,858 11,557
9,517
7,184
3,037
1,377
0
2,000
4,000
6,000
8,000
10,000
12,000
14,000
16,000
Em
ploy
men
t
Centra
l
Southe
aster
n
Northe
rn
Southe
rn
Easter
n
Wes
tern
Southw
ester
n
11
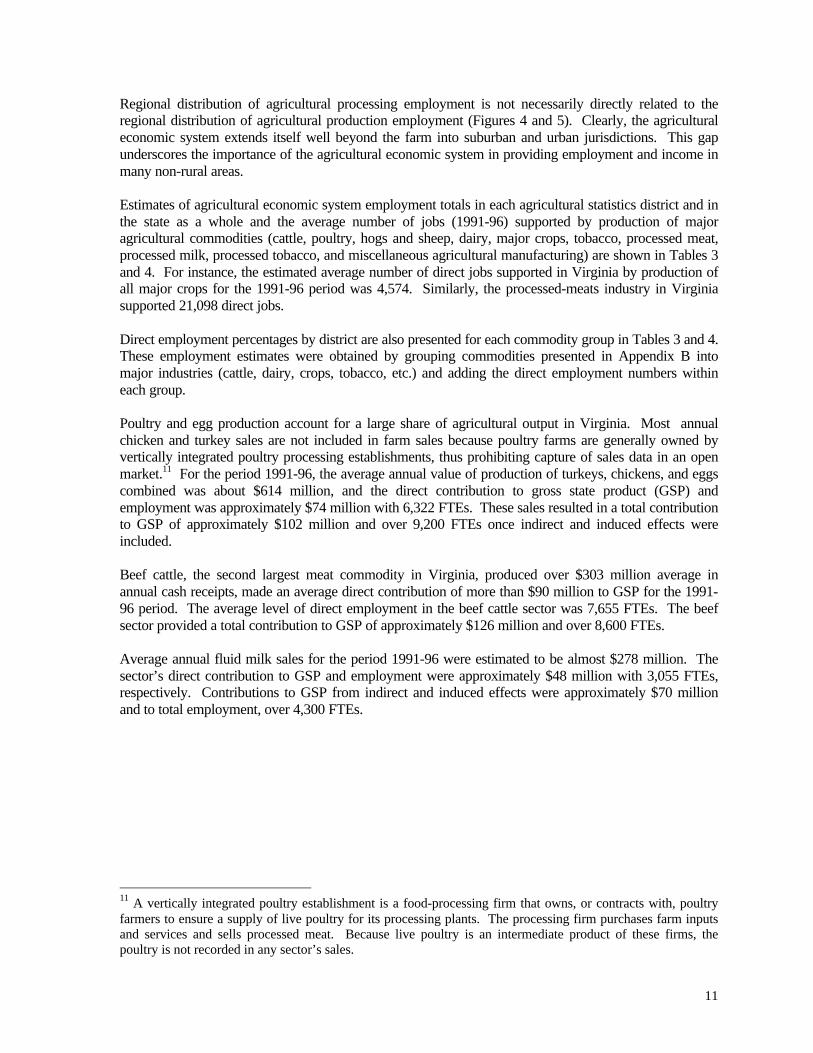
Regional distribution of agricultural processing employment is not necessarily directly related to theregional distribution of agricultural production employment (Figures 4 and 5). Clearly, the agriculturaleconomic system extends itself well beyond the farm into suburban and urban jurisdictions. This gapunderscores the importance of the agricultural economic system in providing employment and income inmany non-rural areas.
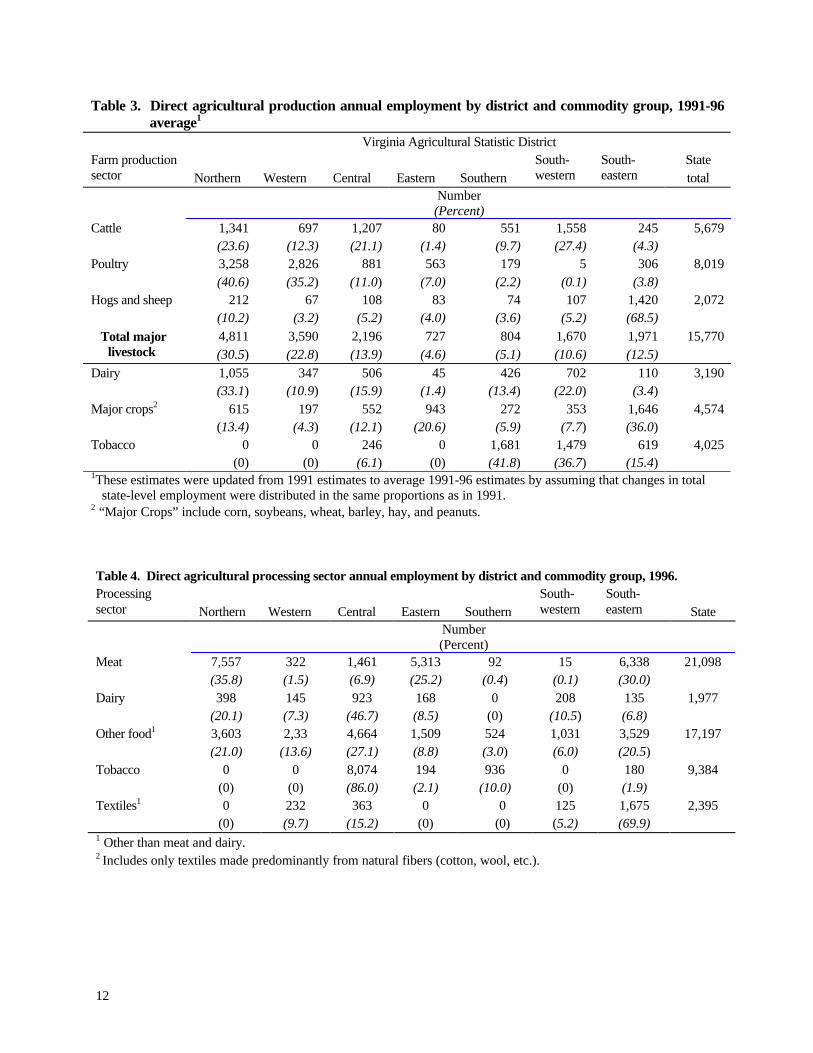
Estimates of agricultural economic system employment totals in each agricultural statistics district and inthe state as a whole and the average number of jobs (1991-96) supported by production of majoragricultural commodities (cattle, poultry, hogs and sheep, dairy, major crops, tobacco, processed meat,processed milk, processed tobacco, and miscellaneous agricultural manufacturing) are shown in Tables 3and 4. For instance, the estimated average number of direct jobs supported in Virginia by production ofall major crops for the 1991-96 period was 4,574. Similarly, the processed-meats industry in Virginiasupported 21,098 direct jobs.
Direct employment percentages by district are also presented for each commodity group in Tables 3 and 4.These employment estimates were obtained by grouping commodities presented in Appendix B intomajor industries (cattle, dairy, crops, tobacco, etc.) and adding the direct employment numbers withineach group.
Poultry and egg production account for a large share of agricultural output in Virginia. Most annualchicken and turkey sales are not included in farm sales because poultry farms are generally owned byvertically integrated poultry processing establishments, thus prohibiting capture of sales data in an openmarket.11 For the period 1991-96, the average annual value of production of turkeys, chickens, and eggscombined was about $614 million, and the direct contribution to gross state product (GSP) andemployment was approximately $74 million with 6,322 FTEs. These sales resulted in a total contributionto GSP of approximately $102 million and over 9,200 FTEs once indirect and induced effects wereincluded.
Beef cattle, the second largest meat commodity in Virginia, produced over $303 million average inannual cash receipts, made an average direct contribution of more than $90 million to GSP for the 1991-96 period. The average level of direct employment in the beef cattle sector was 7,655 FTEs. The beefsector provided a total contribution to GSP of approximately $126 million and over 8,600 FTEs.
Average annual fluid milk sales for the period 1991-96 were estimated to be almost $278 million. Thesector’s direct contribution to GSP and employment were approximately $48 million with 3,055 FTEs,respectively. Contributions to GSP from indirect and induced effects were approximately $70 millionand to total employment, over 4,300 FTEs.
11 A vertically integrated poultry establishment is a food-processing firm that owns, or contracts with, poultryfarmers to ensure a supply of live poultry for its processing plants. The processing firm purchases farm inputsand services and sells processed meat. Because live poultry is an intermediate product of these firms, thepoultry is not recorded in any sector’s sales.
12
Table 3. Direct agricultural production annual employment by district and commodity group, 1991-96average1
Virginia Agricultural Statistic DistrictFarm productionsector Northern Western Central Eastern Southern
South-western
South-eastern
Statetotal
Number(Percent)
Cattle 1,341(23.6)
697(12.3)
1,207(21.1)
80(1.4)
551(9.7)
1,558(27.4)
245(4.3)
5,679
Poultry 3,258(40.6)
2,826(35.2)
881(11.0)
563(7.0)
179(2.2)
5(0.1)
306(3.8)
8,019
Hogs and sheep 212(10.2)
67(3.2)
108(5.2)
83(4.0)
74(3.6)
107(5.2)
1,420(68.5)
2,072
Total majorlivestock
4,811(30.5)
3,590(22.8)
2,196(13.9)
727(4.6)
804(5.1)
1,670(10.6)
1,971(12.5)
15,770
Dairy 1,055(33.1)
347(10.9)
506(15.9)
45(1.4)
426(13.4)
702(22.0)
110(3.4)
3,190
Major crops2 615(13.4)
197(4.3)
552(12.1)
943(20.6)
272(5.9)
353(7.7)
1,646(36.0)
4,574
Tobacco 0(0)
0(0)
246(6.1)
0(0)
1,681(41.8)
1,479(36.7)
619(15.4)
4,025
1These estimates were updated from 1991 estimates to average 1991-96 estimates by assuming that changes in totalstate-level employment were distributed in the same proportions as in 1991.
2 “Major Crops” include corn, soybeans, wheat, barley, hay, and peanuts.
Table 4. Direct agricultural processing sector annual employment by district and commodity group, 1996.Processingsector Northern Western Central Eastern Southern
South-western
South-eastern State
Number(Percent)
Meat 7,557(35.8)
322(1.5)
1,461(6.9)
5,313(25.2)
92(0.4)
15(0.1)
6,338(30.0)
21,098
Dairy 398(20.1)
145(7.3)
923(46.7)
168(8.5)
0(0)
208(10.5)
135(6.8)
1,977
Other food1 3,603(21.0)
2,33(13.6)
4,664(27.1)
1,509(8.8)
524(3.0)
1,031(6.0)
3,529(20.5)
17,197
Tobacco 0(0)
0(0)
8,074(86.0)
194(2.1)
936(10.0)
0(0)
180(1.9)
9,384
Textiles1 0(0)
232(9.7)
363(15.2)
0(0)
0(0)
125(5.2)
1,675(69.9)
2,395
1 Other than meat and dairy.2 Includes only textiles made predominantly from natural fibers (cotton, wool, etc.).

13
CONCLUSIONS
Many people have the mistaken impression that agriculture is only a small part of Virginia’s economy.The truth is that agriculture is a significant industry in the state. Approximately one of every ten jobs inVirginia is related to agriculture. About 10 percent of Virginia's work force is employed in farmproduction, agricultural processing, distribution of agricultural goods, and supply of inputs to production,processing, and distribution. The four components of the agricultural economic system account directlyfor over 7 percent of GSP. When multiplier effects are considered, agriculture-related activities accountfor as much as 11.3 percent of Virginia's economy.
These estimates of agriculture's contribution are significant. Even so, they are conservative for severalreasons. 1) Published estimates of employment in farming fail to account for most unpaid family andoperator labor. 2) The IMPLAN input-output model generates impact estimates that are generallyconsidered to be conservative. 3) Only the current account portion of agricultural investmentexpenditures were included. 4) The value and impact of farm products produced and consumed by farmfamilies were not included. 5) The impacts of government subsidies were excluded. And 6) forestry andwood products were excluded.
Surprisingly, a large portion of the jobs in Virginia’s agricultural system occur in the state’s urban areas.Most agricultural inputs are produced, services are offered, and processing and distribution of productsoccur in cities and their surrounding counties.
Agriculture in Virginia is a vigorous economic sector, closely tied to Virginia’s quality of life by thesector’s history, economic contributions, and importance as a predominant land use. This study indicatesthat Virginians should have a vested interest in a healthy and prosperous agricultural sector.

14
REFERENCES
Johnson, Thomas and Ernest Wade. The Economic Impact of Agriculture in Virginia. VCE Pub. 448-217/REAP R019.1994.
Leones, Julie, Gerald Schlutter, and George Goldman. “Redefining Agriculture in InterindustryAnalysis,” AJAE 76 (December 1994): pp 1123-1129.
Lindall, Scott and Doug Olson. Micro IMPLAN 1990/1985 Database Documentation. MinnesotaIMPLAN Group, 1993.
Majchrowicz, T. Alexander, and Jacqueline Salsgiver. Changes in Farm and Farm-RelatedEmployment, 1975-89. USDA, ERS Rural Dev. Research Rep. No. 85. Washington, D.C., 1993.
Purcell, Wayne. The Economic Position of Virginia Agriculture. REAP Special Report. Va. Tech, 1993.
Virginia Agricultural Statistics Service. Virginia Agricultural Statistics. Richmond, various annualissues and data found at Web page http://www.nass.usda.gov/va/
Virginia Employment Commission. Virginia Employment Statistics Quarterly Bulletin. Richmond,various issues.

15
APPENDIX A. NOTES on METHODS
Definitions
The multiplier effect refers to the following process:
1) A sector creates jobs that provide income to otherwise unemployed and underemployed people or tonew workers.
2) Those people spend much of their income on goods and services bought within the local community.3) This increase in demand for goods and services purchased in the local economy eventually results in
the creation of other new jobs in the region such as retail establishments, service industries, suppliersof raw materials to the new company, producers of new products using the new firm’s output asinput, etc.
4) The cycle continues with more income being spent, creating more demand and more new jobs. Theeffect eventually ends because, at each stage, some of the income of the newly employed will beused to purchase goods and services outside the region. This loss is known as leakage. Once thenew income has leaked out of the county, no more driving force exists behind the multiplier effect,and the cycle ends.
The sum of all activity that has occurred during the cycle is the output multiplier.
Input-output models distinguish between output, income, and Gross State Product. Output, often calledeconomic activity, includes all sales by all firms. Output is the most commonly used measure of impact,but it is not the best measure because it includes a lot of intermediate products produced in other regions.Gross State Product (GSP) is a more meaningful measure of impact because it takes out the part ofoutput not produced locally. Income measures the portion of GSP that becomes the gross income ofindividuals.
Description of the IMPLAN Model
IMPLAN (Impact Model for PLANning), an input-output modeling system developed by the U. S.Forest Service, was used to generate a series of economic multipliers for the Commonwealth of Virginia.Industries within an economy are interdependent in the sense that goods and services are traded amongfirms. An increase in the demand for an existing sector's output, or the location of a new firm in theregion, will result in increased output in many other sectors of the economy. These resulting effects arequantified by calculating input-output multipliers. The IMPLAN system provides the data necessary toconstruct an input-output model of any county, or grouping of counties, in the country. IMPLANprovides multipliers for any of 528 economic sectors, some or all of which may exist in the region understudy. When a new firm is anticipated in a sector for which no current firms exist, the IMPLAN systemcan be adjusted to include the new firm.
Avoiding Double Counting
The monetary flows from farming to processing and distribution (Figure 2 in text) were estimated for thisstudy from coefficients generated by the IMPLAN model. These flows were then used to eliminatedouble counting in the estimates of inputs. For example, of the estimated $2,855 million in farm sales,about $1,106 million was sold to Virginia processors while the rest constituted direct sales to consumersand “exports” to buyers outside the state. The $1,106 million, plus the inputs used by farmers to produceit, constitute indirect inputs of the processing sector. If the inputs of farms are added to the inputs ofprocessors, ($1,106 million plus the sum of the processing sector's inputs) the farm inputs are counted

16
twice. To correct this double counting, $1,106 million in farm sales and the inputs required to producethem were subtracted from the estimate of system inputs. In addition, processors purchased an estimated$1,272 million from the distribution sector which, with the associated inputs, were again subtracted fromtotal inputs to avoid double counting. Many studies have failed to make corrections such as these andthus tend to overestimate the level of inputs used by the system and its contribution to the total economywithin which it operates.
Data Sources
The main data sources were Virginia Agricultural Statistics (published annually by the VASS),employment reports prepared by the VEC, and databases accessible from within the IMPLAN model.
County-level cash receipt data are compiled by the United States Department of Agriculture’s EconomicResearch Service on an annual basis and reproduced in Virginia Agricultural Statistics. County-levelcash receipts data for all farm-level commodities were obtained from the 1996 Virginia AgriculturalStatistics publication.
County-level employment data (that is FTEs in 1996) were acquired from the VEC, at the four-digitStandard Industrial Classification (SIC) level. The county-level farm receipts and farm-relatedmanufacturing employment data were used in the input-output model to assess backward linkage impactsof the agricultural economic system on Virginia's economy. IMPLAN data for 1994 were used for theagricultural-processing sectors.
Cash receipts information from Virginia Agricultural Statistics was used to estimate value added andtotal employment for each farm commodity. Direct contributions to Gross State Product (GSP) at thefarm level were estimated by multiplying cash receipts by the ratios of value added to sales (these ratioswere obtained from the input-output model). Similarly, direct employment by farm commodity wasestimated by multiplying cash receipts by ratios of employment to sales. IMPLAN data for 1991 wereused for the agricultural production sectors since the 1994 IMPLAN data for the agricultural productionsectors had changed substantially from the 1991 IMPLAN data. Sources at MIG, Inc., the producers ofIMPLAN data, substantially changed their methodology for distributing the components of value added(employment earnings, proprietor’s income, and taxes) since the original study was conducted. MIG,Inc. recommended that the researchers use the 1991 data for the farm production sector to facilitatecomparisons between the two periods.
Total sales of processed agricultural commodities were estimated by dividing the VEC employmentfigures by ratios of employment to sales obtained from the input-output model. Direct contributions toGSP attributable to food manufactures were estimated by multiplying total sales per commodity by directvalue-added to sales ratios obtained from IMPLAN.

17
APPENDIX B. IMPLAN EMPLOYMENT AND VALUE-ADDEDRATIOS
Table 1B. 1991 IMPLAN employment and value-added ratios
Sector
Direct jobs
per million dollars of sales
Direct value added
per dollar of sales
Tobacco 1.141 0.0765Peanuts 6.913 0.076Soybeans 6.929 0.078Corn, grain 10.645 0.539Wheat 26.520 0.566Hay 34.210 0.373Rye 26.520 0.566Barley 10.161 0.538Cotton, lint & seed 11.863 0.188Other field crops1 23.192 12.779Sweet potatoes 8.035 0.052Potatoes 8.393 0.052Vegetables 8.373 0.050Fruits 19.893 0.027Cattle & calves 25.252 0.297Milk, wholesale 11.002 0.172Hogs 23.778 0.353Broilers 10.294 0.120Turkeys 10.294 0.120Chickens, farm 10.294 0.120Eggs 10.294 0.120Total sheep, lambs & wool 25.284 0.313
Sheep & lambs 25.284 0.313Wool 25.284 0.313
Other livestock2 10.110 0.035Greenhouse, nursery & Christmas trees 30.316 0.009
Greenhouse 30.316 0.009Nursery & Christmas trees 30.316 0.009
Agricultural services 39.733 0.0471 Other field crops include mushrooms, grain sorghum, canola, sunflower, seed crops, and other field crops.2 Other livestock include turkey eggs, ducks, other poultry, horses, mules, honey, beeswax, aquaculture, mink pelts, and allother livestock

18
APPENDIX C. VIRGINIA AGRICULTURAL STATISTICDISTRICTS
Table C1. Cities and counties located in the seven Virginia agricultural statistic districts.Northern Eastern Western Southern Southwestern Central Southeastern
Alexandria Accomack Alleghany Charlotte Bland Albemarle BrunswickArlington Charles City Augusta Danville Bristol Amelia ChesapeakeClarke Essex Bath Franklin Co. Buchanan Amherst DinwiddieCulpeper Gloucester Botetourt Halifax Carroll Appomattox EmporiaFairfax City Hampton Buena Vista Henry Dickenson Bedford City Franklin CityFairfax Co. James City Clifton Forge Lunenburg Floyd Bedford Co. GreensvilleFalls Church King & Queen Covington Martinsville Galax Buckingham Isle of WightFauquier King George Craig Nottoway Giles Campbell MecklenburgFrederick King William Highland Patrick Grayson Caroline NorfolkHarrisonburg Lancaster Lexington Pittsylvania Lee Charlottesville PortsmouthLoudoun Mathews Roanoke City South Boston Montgomery Chesterfield Prince GeorgeMadison Middlesex Roanoke Co. Norton Col. Heights SouthamptonManassas New Kent Rockbridge Pulaski Cumberland SuffolkManassas Park Newport News Salem Radford Fluvanna SurryPage Northampton Staunton Russell Fredericksburg SussexPrince William Northumberland Waynesboro Scott Goochland Virginia BeachRappahannock Poquoson Smyth GreeneRockingham Richmond Co. Tazewell HanoverShenandoah Westmoreland Washington HenricoStafford Williamsburg Wise HopewellWarren York Wythe LouisaWinchester Lynchburg
NelsonOrangePetersburgPowhatanPrince EdwardRichmond CitySpotsylvania

19
Cattle
Southern9.7%
Eastern1.4%
Western12.3%
Southwestern27.4%
Northern23.6%
Central21.2%
Southeastern4.3%
APPENDIX D. FARM PRODUCTION and AGRICULTURALPROCESSING EMPLOYMENT, by COMMODITY
Figure 1D. Regional share of cattle production employment, 1991-96.
Figure 2D. Regional district share of poultry production employment, 1991-96.
Poultry
Western35.2%
Southern2.2%
Eastern7.0%
Northern40.6%
Southeastern3.8%
Central11.0%
Southwestern0.1%

20
Figure 3D. Regional share of hogs and sheep production employment, 1991-96.
Figure 4D. Regional share of dairy production employment, 1991-96.
Dairy
Northern33.1%
Southeastern3.4%
Central15.9%Southwestern
22.0%
Western10.9%
Eastern1.4%
Southern13.4%
Hogs and Sheep
Northern10.2%
Central5.2%
Southwestern5.2%
Southeastern68.5%
Southern3.6%
Eastern4.0%
Western3.2%

21
Figure 5D. Regional share of tobacco production employment, 1991-96.
Figure 6D. Regional share of major crops production employment, 1991-96.
Tobacco
Southern41.8%
Southeastern15.4%
Central6.1%
Southwestern36.7%
Major Crops
Central12.1%
Southwestern7.7%
Western4.3%
Eastern20.6% Southern
5.9%
Northern13.4%
Southeastern36.0%

22
Figure 7D. Regional share of meat processing employment, 1996
Figure 8D. Regional share of dairy processing employment, 1996
Meat Processing
Western1.5%
Southern0.4%
Southeastern30.0%
Eastern25.2%
Northern35.8%
Southwestern0.1%
Central6.9%
Dairy Processing
Central46.7%
Western7.3%
Northern20.1%
Southwestern10.5%
Eastern8.5%
Southeastern6.8%

23
Figure 9D. Regional share of food processing employment other than dairy and meat, 1996
Figure 10D. Regional share of tobacco processing employment, 1996
Other Food Processing
Southern3.0%
Eastern8.8%
Southeastern20.5%
Southwestern6.0%
Central27.1%
Western13.6%
Northern21.0%
Tobacco Processing
Central86.0%
Eastern2.1%
Southern10.0%
Southeastern1.9%
24
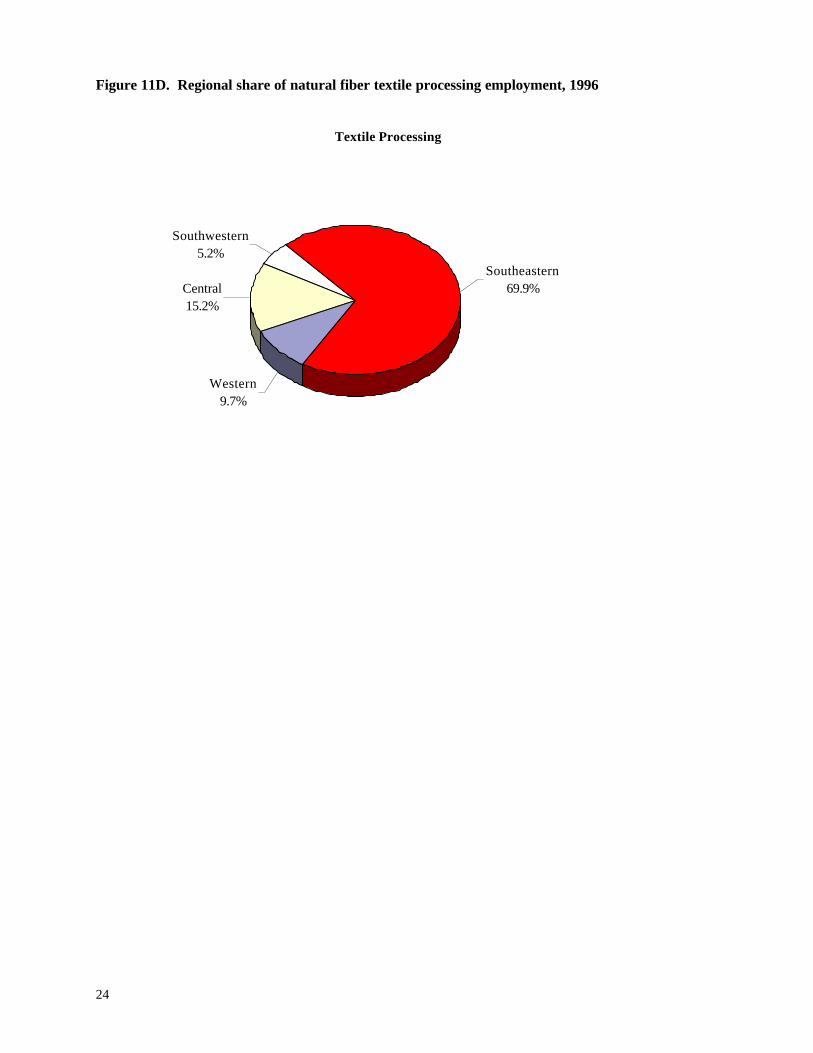
Figure 11D. Regional share of natural fiber textile processing employment, 1996
Textile Processing
Southeastern69.9%
Western9.7%
Central15.2%
Southwestern5.2%