The Economic Effects of California Adopting a Split Roll ... · The Economic Effects of California...
52
The Economic Effects of California Adopting a Split Roll Property Tax José Alberro, Ph.D. William G. Hamm, Ph.D. September 2008
Transcript of The Economic Effects of California Adopting a Split Roll ... · The Economic Effects of California...

The Economic Effects of
California Adopting a Split
Roll Property Tax
José Alberro, Ph.D.
William G. Hamm, Ph.D.
September 2008

About the Authors
The authors are affiliated with LECG, LLC, an international expert services firm
headquartered in California. Charles Gibbons and Nam Nguyen provided invaluable assistance to
the authors in preparing this report.

William G. Hamm, Ph.D.LECG LLCManaging [email protected]
William G. Hamm is an economics consultant with high-level experience in both
business and government. An expert on financial institutions, mortgage finance, and public
finance, Dr. Hamm has been the executive vice-president/chief operating officer of an AAA-
rated $50 billion bank. He has also run a $1.5 billion loan servicing business for an S&P 500
company. Prior to entering the private sector, Dr. Hamm headed the non-partisan Legislative
Analyst’s Office in California, where he earned a nationwide reputation for objectivity, expertise
and credibility on public policy issues ranging from taxation to healthcare. He also spent eight
years in the Executive Office of the President in Washington, D.C., where he headed a division
of the OMB responsible for analyzing the programs and budgets of the Departments of Labor
and Housing and Urban Development, the Veterans Administration, and numerous other federal
agencies.
As a consultant, Dr. Hamm specializes in helping courts, legislative bodies, and the
public develop a better understanding of complex economic and public policy issues. He assists
businesses and public agencies analyze existing and proposed government policies, develop
sound policy alternatives, and communicate the results to decision-makers. He is also recognized
as an effective expert witness who can clarify complex litigation issues for judges and juries.
Dr. Hamm has a B.A. from Dartmouth College and a Ph.D. in Economics from the
University of Michigan. He is a member of the American Economic Association and the
American Law and Economics Association. He is also a Fellow of the National Academy for
Public Administration, a Founding Principal of the Council for Excellence in Government, and a
member of Freedom From Hunger’s Board of Trustees.

iv
José Alberro, Ph.D.LECG [email protected]
José Alberro is an economics consultant with experience in academics, business and
government. For 25 years, he has evaluated the economic impact of industries at the national,
regional and local levels using different models and techniques. Over the last five years, he has
studied the economic importance of different industries in California and has analyzed the
economic impact of propositions and changes in tax measures at both the state and county levels
in California.
Dr. Alberro taught economics at universities in the United States, Mexico and the United
Kingdom for 15 years. He holds a Ph.D. degree in Economics from the University of Chicago, is
a member of the Mexican Academy of Science, and has published extensively in academic
journals, books and the popular media. One of his papers was cited in the 1995 Nobel Prize in
Economics Lecture.
Dr. Alberro was the CEO of a $10 billion natural gas processing, transportation and
distribution company; during his tenure, operating profits increased threefold through aggressive
corporate restructuring and strategic refocusing.
Dr. Alberro also had a distinguished career as a public official in the Mexican
Government: he was Chief of Staff to the Secretary of Commerce and Industrial Policy; Chief
Economic Advisor to the Secretary of the Treasury; Economic Advisor to the to the Secretary of
Budget and Planning; and Chief Economic Advisor to the Under-Secretary of Planning and
Budget.

v
Dr. Alberro is a former consultant to the United Nations: he has consulted for the
International Monetary Fund, the World Bank, the United Nations Development Program, and
the Economic Commission for Latin America and the Caribbean.

TABLE OF CONTENTS
Executive Summary................................................................................................................viiI. Introduction ................................ ...................................................................................... 1I.1. Purpose of the Report................................................................................................ ...... 1I.2. Methodology................................ ..................................................................................... 2I.3. Organization of the Report ................................................................ .............................. 3II. Overview of the Property Tax .......................................................................................... 4II.1. The Property Tax Base................................................................................................ ..... 5II.2. Impact of Proposition 13 on California’s Property Tax.................................................. 5II.3. California’s Other Property Tax....................................................................................... 6III. Taxation of Property in California ................................................................................... 8IV. Split-Roll Proposals ........................................................................................................11V. Economic Effects ............................................................................................................13V.1. Do Taxes Matter? ............................................................................................................13V.2. To What Extent Do Taxes Matter?..................................................................................15V.3. Expected Economic Impact of an Increase in Property Taxes................................ .....16V.3.a. Impact on Land Owners ......................................................................................16V.3.b. Impact on Capital Owners ...................................................................................17V.3.c. Impact on the Economy ......................................................................................17V.4. Empirical Estimates of Decreases in Business Activity...............................................20V.4.a. Dynamic vs. static estimates ..............................................................................21V.4.b. The Dynamic Revenue Analysis Model (DRAM) ................................................22V.4.c. Quantitative Results ................................................................ ............................23V.4.d. Impact on Small and Minority-Owned Businesses............................................25V.4.d.a. Small Businesses in California...........................................................................25V.4.d.b. Minority-Owned Businesses in California..........................................................27VI. Conclusion................................ .......................................................................................29Appendix A................................................................................................ ..............................30Appendix B................................................................................................ ..............................33Appendix C 36Appendix D ................................................................................................ ..............................37Appendix E 42

vii
EXECUTIVE SUMMARY
The California Constitution governs the taxation of property within the State. The
Constitution does not distinguish between residential property (where Californians live) and
commercial property (where Californians work). The same property tax rate applies to both
types of property, and the same rules are used to determine the value of property for tax
purposes. Thus, the current system does not prevent the market from allocating land to its
highest and best use.
From time to time, various individuals and groups have proposed abandoning the
Proposition 13 protections for commercial property and amending the California Constitution so
that commercial property can be taxed more heavily than owner-occupied residential property.
Differential treatment of property in this manner is commonly referred to as a “split-roll.”
Has Proposition 13 shifted the property tax burden from commercial property to owner-
occupied residential property? Many supporters of a split roll claim that it has. The evidence,
however, shows that the reverse has happened. Using data obtained from the California Board of
Equalization, we calculated the disparity between assessed value and market value for two
classes of property: owner-occupied residential, and commercial/industrial. We found that the
assessed-value-to-market-value ratio for owner-occupied residential property in the 2006-2007
roll was 53 percent, while the ratio for commercial and industrial property was nearly 60 percent.
In other words, commercial and industrial property is being assessed for tax purposes at values
that are closer to market values than is the case for owner-occupied residential property.
Clearly, California’s current property tax system has not shifted the
property tax burden from businesses to homeowners.
To determine the economic impact of adopting a split-roll property tax, one must
explicitly take account of how the split roll would affect the behavior of individuals and
businesses who own commercial property. A wealth of economics research has demonstrated
that, when confronted with an increase in state taxes, businesses seek to avoid their exposure to
the higher tax. Taken together, these studies indicate that a 1 percent increase in state taxes will
lead to a 0.25-0.31 percent reduction in the level of economic activity. If the reduction leads to a

viii
corresponding decrease in employment opportunities for Californians, a 1 percent increase in
taxes would result in the loss of about 43,000 jobs.
The economic impact of an increase in the taxation of business property depends on the
extent to which affected businesses can pass-on the tax to their customers (through higher
prices), renters (through higher rents), their employees (through lower wages), or their suppliers.
If a firm cannot pass-on the tax to others, it may change its mode of operations to use less taxable
property (capital goods, for example) or relocate its operations to other states. Either way, much
(but not all) of the burden of higher taxes will be borne by others. Generally speaking, owners of
capital are more likely than landowners to avoid the increased tax burden by shifting their
investments elsewhere. Capital is highly mobile; land is very immobile, and cannot be relocated
to locations with a more benign tax system.
If California voters choose to amend the State Constitution in order to relax or eliminate
the limits on taxation of commercial property established by Proposition 13, widely accepted
economics principles hold that the increase in taxes will have seven primary effects.
1. More development. Owners of undeveloped land will be more likely to develop the
land, since the carrying costs of holding land as open space will go up.
2. Increased fiscal zoning. Localities will have a stronger fiscal incentive to favor the
use of land for commercial purposes, rather than for homeownership opportunities,
because they will be able to derive more revenue from this type of development.
3. Higher rents paid by families and small businesses. A significant portion of the
increase in property taxes will be shifted to renters. In some cases, the shift will
occur automatically, under the terms of “triple net leases.” In other cases, the shift
will be made possible by the fact that rent levels are below market levels, as is the
case for apartments subject to rent controls. In still other cases, the reluctance of
landlords to raise rents because they fear losing good tenants to neighboring
apartment buildings will weaken, since all apartment owners will be subject to the
same increase in costs.
The burden of higher rents will tend to fall most heavily on lower-income
Californians, because they are more likely to occupy rental property. (According to

ix
the U.S. Census Bureau, the median household income of California renters was less
than half the median income of homeowners.) The burden of higher rents will be felt
disproportionately by small businesses, including many minority-owned businesses,
because these businesses tend to rent the space their business occupies. For a small
business that has owned property for many years, the increase in tax liability resulting
from adoption of a split roll could be large enough to cause the business to fail or lose
its property.
4. Reduced investment/fewer jobs. Where it is not possible to fully shift the increased
tax burden to tenants, the split-roll would reduce the after-tax returns from
investment, causing a reduction in the volume of investment in rental housing and
business plant and equipment within California. Less investment means fewer jobs.
In the longer run, capital – and, hence, labor – will look for better opportunities
outside California by migrating.
5. Reduced wages. A shift in the tax burden to firms that continue to conduct business
in California will reduce the after-tax productivity of labor. The after-tax
productivity of labor will be further reduced because workers have less capital. Since
wages are based on labor productivity, wages will fall, and workers’ ability to
maintain purchases of other goods and service, will drop accordingly.
6. Increased consumer prices. Since the prices that businesses charge customers must
cover their costs (including the costs of capital), the increase in property taxes
ultimately will bring about higher consumer prices to the extent the increase is not
passed-on to renters and consumers.
7. Decline in the value of financial assets held by public retirement funds. Where it
is not possible to fully shift the increased tax burden to tenants, employees, and
consumers, the market value of commercial property will decline, and with it, the
value of financial assets, such as common stocks, that are based in part on the value
of real assets.
The decline in asset values is especially important in the case of CalPERS and
CalSTRS – two large public retirement funds that provide retirement benefits to
former government employees and teachers in California. These funds have

x
significant holdings of California real estate. The value of this real estate will be
reduced by the capitalized value of the increased property taxes.
We have quantified some of the effects likely to result from adoption of a split-roll
property tax regime, using a computable model of the California economy. This model,
commonly referred to as the DRAM (for Dynamic Revenue Analysis Model), was developed
jointly by the California Department of Finance and the University of California at Berkeley to
capture the behavioral changes that result from changes in tax policy. Our estimates are based
on several key assumptions:
Adoption of a split-roll property tax regime would raise the assessed value of all
property, other than owner-occupied residential property, to the property’s market
value.
The 1 percent ceiling on the statewide property tax rate established by Proposition
13 would remain in effect.
The net revenue generated by the relaxation of Proposition 13’s limits on assessed
values will reduce the amount that the State borrows to close the structural deficit
in the General Fund.
With these assumptions, the DRAM estimates that adoption of a split roll property tax
regime would result in the loss of 86,000-152,400 jobs.
The DRAM does not permit us to quantify the impact of a split roll on small businesses.
Nevertheless, we can safely predict that this group of businesses will suffer disproportionately
from the increase in property taxes. Small businesses, particularly those owned by minorities,
are especially vulnerable to adverse changes in their economic circumstances. They tend to
serve local, rather than regional or national markets, and are generally less able to escape an
increase in the tax burden by relocating their operations to other states. In addition, many small
businesses have relatively low profit margins that are easily eroded by economic adversity. In
fact, businesses with fewer than 20 employees account for 95 percent of business failures.
Minority-owned businesses are even more vulnerable to economic adversity because
empirical research indicates that these businesses have more difficulty obtaining credit to finance
their operations.
1
I. INTRODUCTION
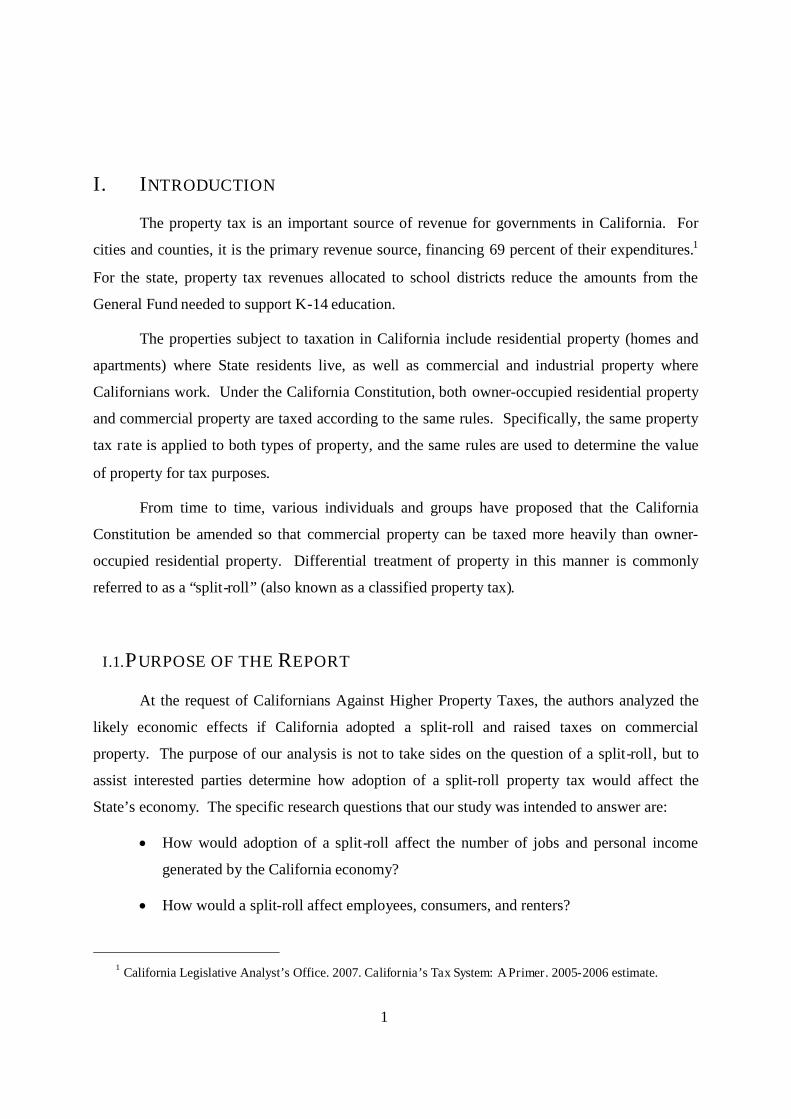
The property tax is an important source of revenue for governments in California. For
cities and counties, it is the primary revenue source, financing 69 percent of their expenditures.1
For the state, property tax revenues allocated to school districts reduce the amounts from the
General Fund needed to support K-14 education.
The properties subject to taxation in California include residential property (homes and
apartments) where State residents live, as well as commercial and industrial property where
Californians work. Under the California Constitution, both owner-occupied residential property
and commercial property are taxed according to the same rules. Specifically, the same property
tax rate is applied to both types of property, and the same rules are used to determine the value
of property for tax purposes.
From time to time, various individuals and groups have proposed that the California
Constitution be amended so that commercial property can be taxed more heavily than owner-
occupied residential property. Differential treatment of property in this manner is commonly
referred to as a “split-roll” (also known as a classified property tax).
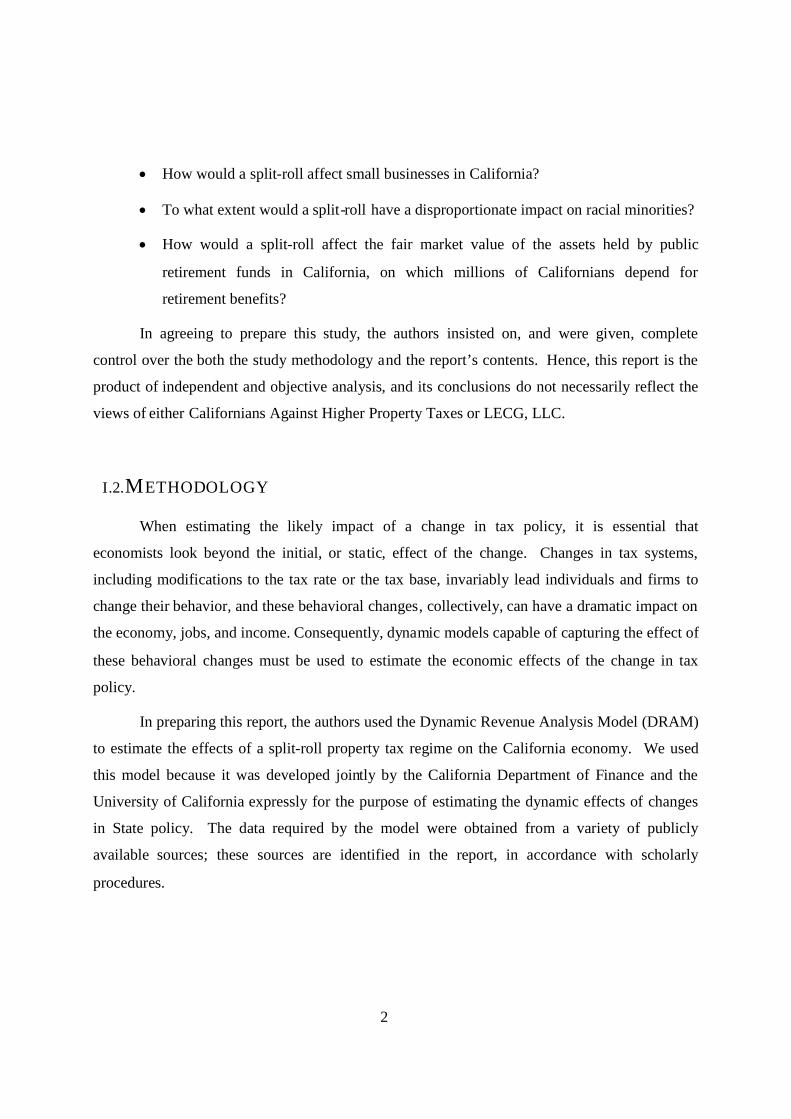
I.1.PURPOSE OF THE REPORT
At the request of Californians Against Higher Property Taxes, the authors analyzed the
likely economic effects if California adopted a split-roll and raised taxes on commercial
property. The purpose of our analysis is not to take sides on the question of a split-roll, but to
assist interested parties determine how adoption of a split-roll property tax would affect the
State’s economy. The specific research questions that our study was intended to answer are:
How would adoption of a split-roll affect the number of jobs and personal income
generated by the California economy?
How would a split-roll affect employees, consumers, and renters?
1 California Legislative Analyst’s Office. 2007. California’s Tax System: A Primer. 2005-2006 estimate.
2
How would a split-roll affect small businesses in California?
To what extent would a split-roll have a disproportionate impact on racial minorities?
How would a split-roll affect the fair market value of the assets held by public
retirement funds in California, on which millions of Californians depend for
retirement benefits?
In agreeing to prepare this study, the authors insisted on, and were given, complete
control over the both the study methodology and the report’s contents. Hence, this report is the
product of independent and objective analysis, and its conclusions do not necessarily reflect the
views of either Californians Against Higher Property Taxes or LECG, LLC.
I.2.METHODOLOGY
When estimating the likely impact of a change in tax policy, it is essential that
economists look beyond the initial, or static, effect of the change. Changes in tax systems,
including modifications to the tax rate or the tax base, invariably lead individuals and firms to
change their behavior, and these behavioral changes, collectively, can have a dramatic impact on
the economy, jobs, and income. Consequently, dynamic models capable of capturing the effect of
these behavioral changes must be used to estimate the economic effects of the change in tax
policy.
In preparing this report, the authors used the Dynamic Revenue Analysis Model (DRAM)
to estimate the effects of a split-roll property tax regime on the California economy. We used
this model because it was developed jointly by the California Department of Finance and the
University of California expressly for the purpose of estimating the dynamic effects of changes
in State policy. The data required by the model were obtained from a variety of publicly
available sources; these sources are identified in the report, in accordance with scholarly
procedures.

3
I.3.ORGANIZATION OF THE REPORT
The balance of this report is divided into six parts, as follows:
Part II describes the California Property Tax system.
Part III shows how the California Property Tax system taxes different categories of
property relative to their estimated market values.
Part IV provides a brief history of attempts to impose a split-roll property tax system in
California, and describes the variant of the split-roll proposal that we have analyzed for
this report.
Part V examines the likely economic effects of adopting a split-roll property tax system,
and provides quantitative estimates of its impact on California’s economy.
Part VI summarizes our findings and conclusions.

4
II. OVERVIEW OF THE PROPERTY TAX
The property tax is the largest source of revenue for California’s local governments. In
2006, it raised $43.2 billion – nearly equal to the combined amount that the state and local
governments raised through sales taxes, use taxes, and fees ($45.1 billion).2
Figure 1 illustrates the tax’s importance in financing programs at the local level.
Figure 1. Local government revenue sources
Local Government Revenues by Major Source
Property Taxes
Utility User's
TransientOcupancy
Business License All other
Local Sales andUse Tax
Source: California's Tax System: A Primer, LAO, 2007
2 California Board of Equalization. 2006-2007 Annual Report.

5
II.1. THE PROPERTY TAX BASE
The property tax is levied on homes, apartment buildings, commercial and industrial
property, agricultural lands, timberland, open space, vacant land, and certain classes of personal
property. The tax is assessed on the value of land, buildings, fixtures, and mineral rights, as well
as on equipment, machinery, and aircrafts. Certain types of property are exempt from the tax,
such as property owned by governments or charities, household personal property, automobiles,3
securities, and business inventories. Most property subject to the tax is assessed locally by
county assessors, although some property, such as certain property owned by railroads and
utilities, is assessed by the State.
As noted in the Introduction, the California property tax does not distinguish between
property used to house owners, apartment buildings rented to tenants, and commercial property
where the most jobs are located. All property is subject to the same rules regarding the
maximum assessed value and the maximum tax rate, regardless of whether the property offers
shelter or employment opportunities.
II.2. IMPACT OF PROPOSITION 13 ON CALIFORNIA’S PROPERTY TAX
Prior to voter approval of Proposition 13 in 1978,4 taxable property in California was
assessed at its market value.5 Tax rates, however, were locally determined and varied from
jurisdiction to jurisdiction.
Proposition 13 amended the California Constitution to make two important changes to the
State’s property tax system.6
First, it limited the percentage increase in the assessed value of taxable property.
As amended, the Constitution limits the maximum annual increase in a property’s
3 Motor vehicles are subject to the Vehicle License Fee, which is a type of property tax.4 Proposition 13 added Article XIIIA to the California Constitution.5 For most other property (locally assessed personal property or state assessed real property), the assessment
practice continues to be based on market value.6 Proposition 13 also amended the State Constitution to require that certain tax increases receive at least a two-
thirds vote before they can take effect.

6
assessed value to two percent, unless the property has changed hands since the last
assessment.7 In effect, Proposition 13 shifted the property tax system from one
based upon current market values to one based on the property’s acquisition price
(i.e., the market value of the property when it was acquired by the current owner).
Second, it limited the maximum property tax rate in all jurisdictions to one percent,
plus an additional 0.25 percentage points to repay voter-approved bonded
indebtedness. For 2005-2006, the average statewide property tax rate was 1.098
percent; the highest rate was 1.159 percent, imposed by the County of Alameda.
In response to voter approval of Proposition 13, the Legislature set the base property tax
rate in all jurisdictions at the Constitutional maximum of one 1 percent. It also specified how
revenues from the property tax are allocated among local agencies, thereby removing from local
governments nearly all discretion regarding the tax. In effect, the property tax was transformed
from a local tax to a state tax, with the proceeds remitted to localities and schools.
II.3. CALIFORNIA’S OTHER PROPERTY TAX
It is important to take note of California’s “other property tax,” to which certain business
property is subject.
The State taxes corporate income through the Corporation Tax (CT) – the General Fund’s
third largest revenue source. This tax generated $11.2 billion in the 2006-07 fiscal year, or 9.1
percent of total state receipts.8 Corporations conducting business in both California and at least
one other state or country are required to apportion their worldwide income between California
and the other taxing jurisdiction(s), based on their relative presence in California. According to
the Franchise Tax Board (FTB), 51,252 corporations doing business in California were required
7 Technically, the two percent annual limit applies in relation to the base year, not to any given year. Forexample, if the county assessor held the assessed value of a property at its original purchase price for 9 years, theassessor could increase the assessed value in the following year by 22 percent (i.e., 1.0210 – 1) without violatingProposition 13.
8 California State Controller’s Office. 2007. State Government Annual Financial Report.

7
to apportion their income to California because they maintained a business presence outside the
State.9 These corporations accounted for 72% of the net income reported by CT filers.
Three factors are used to determine a multi-state corporation’s relative presence: sales in
California as a percentage of the corporation’s total sales; the corporation’s California payroll as
a percentage of its total payroll; and the corporation’s property in California as a percentage of
its total property.10 Because one of the three factors used to apportion a multi-state corporation’s
income to California for tax purposes is “property”, multi-state and multi-national corporations
are, in effect, subject to a second property tax. Other things being equal, as the value of a multi-
state corporation’s property in California increases, its liability under the Corporation Tax
increases – just as its property tax liability increases.11
9 California Franchise Tax Board, Annual Report, 2006.10 In the apportionment formula, the sales factor is assigned a 50 percent weight, while the payroll and property
factors are each give a 25 percent weight.11 Appendix A discusses the interaction of California’s property tax with the Corporation tax, as well as with the
federal corporate income tax.

8
III. TAXATION OF PROPERTY IN CALIFORNIA
The switch to an acquisition value-based property tax system brought about by
Proposition 13 weakened the link between a property’s current market value and its assessed
value. Because properties change ownership at different rates, some properties (i.e., properties
that recently change ownership) are assessed at higher percentages of their market values than
identical properties that have not changed hands. One report estimates that in the fourth quarter
of 2001, the median sales year for all residential property was 1994, while the median sales year
for all commercial property was 1993.12
Some proponents of a split-roll cite this feature of the California property tax system as a
reason to tax business property at a higher effective rate than owner-occupied residential
property. They maintain that, because business property does not turnover as frequently as
owner-occupied property, the gap between the assessed and market values of business properties
is greater than the corresponding gap for owner-occupied residential property. As a result, split-
roll proponents argue that the property tax burden has gradually shifted from businesses to
homeowners.
We tested this hypothesis by calculating the disparity ratio for owner-occupied
residential property and comparing it to the corresponding ratio for commercial and industrial
property. The disparity ratio measures the percent deviation of a property’s assessed value from
its market value.
Data on assessed values can be obtained for certain classes of property from the
California State Board of Equalization (BOE). The BOE publishes data for the following types
of property:
Single-family residential units occupied by owners claiming the homeowners’
exemptions;
Qualifying properties that claim the veterans’ exemption;
12 Gordon, Tracy and Fred Silva. 2003. “Understanding California’s Property Tax Roll: Regions, PropertyTypes, and Sale Years.” Manuscript, Public Policy Institute of California. The data on sales year covers onlyCalifornia’s “urban regions.”

9
Commercial and industrial property; and
Properties that are exempted from the property tax, such as property owned by
non-profits, colleges, and schools.13
Unfortunately, the BOE does not report values for small rental units14 and second homes.
The BOE also reports market values for the state’s commercial and industrial property.15
It does not report market values for any owner-occupied property. To estimate these values, we
multiplied the number of properties claiming the homeowners’ and veterans’ exemptions by the
median housing price reported by the U.S. Census Bureau for 2006 (the most recent year
available).
As expected, the assessed values for both owner-occupied residential property and
commercial/industrial property deviate substantially from their respective market values. The
disparity ratios for these categories are shown in Table 1.
Table 1. Disparity ratios by property type
Property TypeAssessed Valueb
($M)Percent ofAssessed
Value
Market Value($M)
DisparityRatio
Homeowners' exemption $1,559,370 38.3% $2,930,877 53.2%
Veterans' exemption $2,303 0.1% $13,532 17.0%
Non-exempt residential a $858,564 21.1% N/A N/A
Commercial/industrial $1,349,662 33.1% $2,251,541 59.9%
Nonprofit/other exempt $99,532 2.4% N/A N/A
Other $203,654 5.0% N/A N/A
Total $4,073,086a
This category includes rental property and vacation homes.bCalifornia State Board of Equalization. Data obtained via personal communications.
13 Government buildings are wholly exempt; they are not assessed and are not included on the property tax roll.14 Rental properties with more than four units fall into the commercial/industrial category.15 The BOE calculates the market value of commercial properties based upon the increase over assessed value
of properties that are sold in a given year, by county. This ratio is then applied to the assessed values of allcommercial properties in the county and aggregated to the state level.

10
As the table shows, contrary to the contention of split-roll proponents, the assessed values
of commercial and industrial properties are closer to the properties’ market values than is the
case for owner-occupied residential homes. Using our methodology, we find that the disparity
ratio for owner-occupants (residential) other than veterans is 53.2 percent, while the ratio for
commercial and industrial property is nearly 60 percent. Thus, the evidence does not provide
support for the hypothesis that Proposition 13 has caused a shift in the property tax burden.
The disparity ratios shown in Table 1 for owner-occupied residential property almost
certainly exceed the true ratios. In calculating the ratio, we used the median home price to
estimate the market value of property in this category. It is likely, however, that the average
(mean) home price significantly exceeds the median, since the distribution of home prices is
skewed toward the high end of the price range.16 Consequently, Table 1 understates the extent to
which the unified property tax roll has benefited homeowners.
16 For some purposes, it is appropriate to use the median, rather than the mean, in making comparisons anddrawing conclusions. In this case, however, the mean is the value that should be used, because the disparity ratiocalculated for commercial and industrial property, in effect, is based on the mean market value of property in thiscategory.

11
IV. SPLIT-ROLL PROPOSALS
During the past three decades, numerous proposals have been offered to replace
California’s current single- or unified-roll property tax system with a split-roll system. Instead
of treating all properties in the same way for tax purposes, regardless of whether the property is
used for shelter or to provide jobs, split-roll advocates want to tax commercial property more
heavily than owner-occupied residential property. While the details of these proposals differ,
their common feature is that, if enacted, a large share of California property would no longer
benefit from the limitations on the property tax burden established by voters when they approved
Proposition 13.
Among recent proposals to adopt a split-roll regime in California, one – Proposition 167
– made it to the ballot. In 1992, this measure garnered 41 percent of the vote, with 59 percent of
the voters rejecting it.
In 2003, Assemblywoman Lori Hancock, who represents part of Alameda and Contra
Costa counties, offered a split-roll tax proposal that was designated ACA 16 which would have
required county assessors to reassess non-residential, non-agricultural property annually. The
Legislature, however, declined to send the measure to the ballot.
In 2004, the California Teachers’ Association and actor-director Rob Reiner joined forces
to champion a proposal that would have increased the property tax rate on non-residential
property to 1.5%. Though the signature-gathering process for this initiative was completed, the
sponsors abandoned the measure before it could be qualified for the ballot.
During the following year, five split-roll proposals were offered. Sponsors of the so-
called Tax Fairness Act of 2005 argued that the burden of property taxes had shifted from
owners of commercial and industrial property to homeowners,17 and proposed that the assessed
value of non-residential property not used in commercial agricultural production periodically be
brought to the property’s market value. Under the Act, residential property would be defined to
include single-family and multi-family units intended for permanent residence. In addition, the
17 As demonstrated in Part III, this claim is not supported by the evidence.

12
Act would have exempted from taxation the first $500,000 in assessed value, for all taxpayers.
Two other, similar to the Act were considered in 2005 as well.18
Another proposal offered in 2005 sought to increase the tax rate on commercial, non-
residential property by 0.3-0.5 percentage points. Yet another proposal called for increasing the
maximum tax rate for non-residential property to three percent, with the actual rate set by each
county, provided that the rate was not set at a level below 2 percent. Additionally, this proposal
would have eliminated the 1 percent tax rate ceiling for residential property values exceeding $1
million.
All of these 2005 measures were dropped without being presented to the voters.
In this report, we consider the economic effect likely to result from adopting a split-roll
property tax regime with the following features:
The Proposition 13 limits on assessed value would be removed for all property other
than owner-occupied residential property.
Property other than owner-occupied residential would be assessed annually at its
current market value.
The 1 percent limit19 on the statewide tax rate would remain in effect for all property.
18 California Board of Equalization. 2008. Staff Legislative Bill Analysis: AB 2461 (Davis).19 Plus the additional 0.25 percentage points to repay voter-approved bonded indebtedness.

13
V. ECONOMIC EFFECTS
In this part, we discuss the economic consequences of adopting a split-roll property tax
regime instead of California’s current unified roll approach. We begin by drawing on widely
accepted principles of economics to predict the likely effects of establishing a split-roll on
property values, investment, wages and employment, the price of goods and services, and rents.
We then use a computable general equilibrium model to quantify some of these economic
effects.
To understand how the introduction of a split-roll tax regime would affect the California
economy and those who depend on it for employment and income, one must first understand (a)
how taxes influence business decision-making, and (b) how an increase in business property tax
liabilities will affects firms’ and individuals’ behavior.
In brief, adoption of a split-roll regime would make the use of land and capital by
businesses more expensive, while weakening their financial condition. As we shall see, these
consequences manifest themselves in several ways.
V.1. DO TAXES MATTER?
When a business makes a decision to build a new plant, relocate an existing facility, or
expand production at an existing facility, it considers numerous factors. These factors can be
grouped into four categories:
Market factors. The first and most important group of factors that influence business
location decisions pertains to the economics of the business itself. This group of factors
includes, among others, the price and availability of labor, proximity to suppliers,
proximity to customers, access to reliable transportation, the price and availability of
energy, and the cost of business insurance (e.g., workers’ compensation insurance).
Environmental factors. A firm’s ability to attract and retain key executives and other
workers depends, in part, on the relative attractiveness of the environment in which the
employees must live. Housing prices, the quality of elementary and secondary schools,

14
the availability of public services, and even the area’s climate can influence business
location decisions when financial considerations have not pre-determined the outcome.
Intangible factors. A third group of factors that may affect the location of business
facilities is more difficult to quantify because it encompasses intangible considerations.
For example, decision-makers may take into account the “business climate” in an area
where they are considering locating, expanding, or contracting facilities. Among the
factors that influence a decision-maker’s perception of the business climate are the
responsiveness of regulatory bodies to the firm’s need for prompt (and favorable)
decisions and the firm’s vulnerability to what it may consider to be meritless lawsuits.
Tax factors. Businesses seek to maximize their after-tax income, since this is the
income available for distribution to owners. Hence, firms will evaluate the relative
burden of state and local taxes when making decisions about business location.
The fact that all of these factors can influence business decisions does not mean that each
individual factor will be crucial in all – or even most – cases when a firm is deciding where to
locate, expand, or contract its operations. Market conditions will determine where most
investments are made. The favorable tax policies that a state adopts will not, by themselves,
cause a firm to locate a new plant in an area where skilled labor is unavailable, transportation
networks are unsatisfactory, or energy supplies are uncertain.
Often, however, market considerations will not predetermine the location of the firm’s
operations, enabling the decision-maker to compare alternative locations based on other factors.
In these cases, a state’s relative tax burden may be the consideration that determines where the
firm makes its investment or increases its payroll. In sum, the fact that some determinants of
business location are more important than relative tax burdens does not make state tax policies
unimportant in influencing business investment.
In a world where all states had the same property tax regime, a change in either the tax
rate or the tax base would not effect business location decisions within the United States
(although it might cause some firms to relocate offshore). Confronted with such uniformity, a
firm could not reduce its tax bill by shifting operations or new investment from one state to
another. In reality, however, tax rates vary across the country. As a result, differential tax

15
regimes can influence where a firm chooses to expand employment or invest in new plants and
equipment. By shifting all or a part of its operations from a high-tax state to a lower-tax state,
the firm can reduce its total tax liability, thereby increasing its after-tax profits.
If California adopted a split-roll property tax regime, the State would continue to retain
some of the advantages that make it an attractive location for business investment, including
close proximity to a large consumer market, a skilled workforce, world-class universities, and an
attractive climate. Nevertheless, the lower after-tax returns available on investments within the
State as a result of the increase in property taxes would tip the balance for some businesses,
causing them to shift investment away from California. Firms make investments and hiring
decisions at the margin, by comparing the expected benefit of each investment opportunity with
the expected costs. Since adoption of a split-roll would increase costs without increasing
expected benefits,20 some opportunities will no longer be economically attractive and will not be
pursued.
V.2. TO WHAT EXTENT DO TAXES MATTER?
Economists have published numerous econometric studies exploring the relationship
between state taxes and economic development, as measured by investment or employment.
Three economists – Bartik21 and Phillips and Goss22 – analyzed the results of these studies using
Meta-Regression Analysis (“MRA”). These analyses document the emerging consensus among
economists that state tax policies have a significant impact on economic development at the state
and local levels.
Bartik defined the tax elasticity of economic activity as the percentage change in local
business activity caused by a one percent change in state taxes. He estimated this tax elasticity to
have a mean of negative 0.25 percent. Phillips and Goss reported consistent findings; they
20 If the increase in tax burden causes the State to spend more public money of programs important to theeconomic success of an individual business, an increase in taxes may increase expected benefits.
21 Bartik, T. J., “Who Benefits from State and Local Economic Development Policies?” W.E. Upjohn Institutefor Employment Research, Kalamazoo, MI1991.
22 Phillips, Joseph M. and Goss, Ernest P., “The effect of state and local taxes on economic development: Ameta-analysis,” Southern Economic Journal , Oct 1995, 62(2): 320-333.

16
estimated the mean to be negative 0.32 percent. These findings imply that, if the local tax rate is
increased by 1 percent from its current level, and if the reduction in economic activity takes the
form of fewer jobs, employment in the state will fall by 0.25-0.32 percent. (Today, a .25 percent
reduction in California employment would mean the loss of approximately 42,900 new jobs.)
V.3. EXPECTED ECONOMIC IMPACT OF AN INCREASE IN PROPERTY TAXES
A split-roll property tax regime, by design, initially would increase the tax burden on
commercial, industrial and non-owner occupied residential property. Generally, the increase will
affect property owners in two ways that have economic significance:
First, higher property taxes will make the use of land and capital more expensive
for businesses in California.
Second, if the property owner is not able to pass along the increased tax burden to
renters, consumers, and/or employees, the owner’s financial condition will
weaken.
How property owners and investors respond to these changes will determine the long-run
economic impact of a split-roll property tax regime on jobs, income, and investment in
California.
V.3.a. IMPACT ON LAND OWNERS
In a perfectly competitive market, a land owner will not be able to escape the effect of
higher property taxes on his land. Because land is immobile, the owner cannot relocate his
property to a jurisdiction with a more favorable tax regime. Nor can the land owner shift the tax
burden to consumers or labor under most circumstances.23
23 Some land owners will be able to shift the increased tax burden to renters. For example, many leasesrequire the tenant to pay certain costs associated with land ownership, such as maintenance, insurance, and taxes.Tenants subject to these so-called “triple net” leases will bear 100 percent of the increased property tax burden.
Similarly, many landowners keep rents somewhat below the market level, as a means to retain goodtenants. These owners believe that the cost of replacing a tenant with a good payment history would exceed therental income they forego by setting their rents below the market level. Faced with an increase in the property taxburden, however, it is likely that these landowners would be more inclined to raise rents, knowing that all otherlandowners are also subject to the tax increase.

17
To the extent the landowner cannot shift the increased property tax burden to others, the
owner’s net worth will decline. Economists have demonstrated that asset values reflect the net
present value of expected after-tax cash flows. Therefore, an increase in the property tax burden
will be capitalized, and the land’s market value will go down.24
V.3.b. IMPACT ON CAPITAL OWNERS
Property consists not only of land, but also of structures, machinery, and other types of
tangible capital. The price elasticity of capital is much greater than the price elasticity25 of land,
primarily because capital is highly mobile. New investments in capital are highly sensitive to the
expected after-tax return because investments can easily be directed to more favorable tax
jurisdictions. Even capital-in-place can be relocated elsewhere, as cities with rent control
ordinances have learned when landlords unable to obtain a market return on their rental housing
choose to withhold maintenance, thereby gradually withdrawing their capital from the market.
Having analyzed the likely impact of a split-roll property tax regime on land and capital
owners, we can now explore how the split-roll would affect the California economy.26
V.3.c. IMPACT ON THE ECONOMY
If California voters choose to amend the State Constitution in order to relax or eliminate
the limits on taxation of commercial property established by Proposition 13, economics
principles hold that the increase in taxes will have seven primary effects.
1. Increased economic incentives to develop land
By increasing the carrying costs of undeveloped land, the higher property taxes resulting
from adoption of a split-roll would tend to speed-up the rate at which such land is developed. In
effect, the split-roll would make it more expensive to hold undeveloped land as open space,
encouraging more land owners to develop their property.
24 Appendix B discusses the impact of a property tax on land values in more detail.25 As economists use the term, “price elasticity” means the percentage change in the quantity demanded –
acquired- of a good divided by the percentage change in its price.26 Appendix C discusses the impact of a property tax on capital values in more detail.

18
2. Increased local government bias in favor of commercial development
A split-roll would tend to increase the bias that now exists at the local level in favor of
land development for commercial purposes, rather than for owner-occupied housing. Under the
current property tax system, local governments have a fiscal incentive to make land available
(through zoning) for high-revenue retail uses, in order to generate additional sales tax revenue.27
Counties tend to favor hotels, auto malls, big box retailers, and shopping centers over residential
uses. Adoption of a split-roll property tax system would strengthen this bias in favor of
commercial land uses.
3. Increased rents
A significant portion of the increase in property taxes will be shifted to renters. In some
cases, the shift will occur automatically, under the terms of “triple net” leases. In other cases, the
shift will be made possible by the fact that current rent levels are below market levels, as is the
case for apartments subject to rent controls in cities such as Los Angeles and Santa Monica.28 In
still other cases, the reluctance of landlords to raise rents because they fear losing good tenants to
neighboring apartment buildings will weaken, since all apartment owners will be subject to the
same increase in costs.
The burden of higher rents will tend to fall most heavily on lower-income Californians,
because they are more likely to occupy rental housing. The U.S. Census Bureau’s American
Community Survey for 2006 reveals that the median household income of California renters was
$40,248, compared with $83,514 for homeowners. 29 Moreover, only 2 percent of homeowners
receive food stamps, while 12.5 percent of renters receive the subsidy. Clearly, California’s
renters are a significantly poorer population than homeowners. By increasing the tax burden on
renters, the split-roll tax would disproportionately affect lower-income families. Increase rents
would leave tenants with less money to spend on other goods and services, reducing the amount
27 Chapman , Jeffrey I. 1998. Proposition 13: Some Unintended Consequences. San Francisco: Public PolicyInstitute of California.
28 Most rent control ordinances permit affected landlords to petition for rent increases when external factorsreduce their rates of return below minimum levels.
29 These Census data were obtained via the IPUMS database: Ruggles, Steven, Matthew Sobek, TrentAlexander, Catherine A. Fitch, Ronald Goeken, Patricia Kelly Hall, Miriam King, and Chad Ronnander. 2008.

19
they contribute to the expenditure stream. The impact will be felt by those businesses that sell
goods and services to renters.
Businesses – particularly small and minority businesses – will also bear the burden of
higher rents. We discuss the economic consequences of this shift below.
4. Reduced investment and jobs
Where it is not possible to fully shift the increased tax burden to tenants, the split-roll
would reduce the after-tax returns from investment and bring-about a reduction in the volume of
investment in rental housing and business plant and equipment within California. Less
investment means fewer jobs.
In the longer run, capital – and, hence, labor – will look for better opportunities outside
California by migrating to other states. The long-run effects of the tax increase on the factors of
production will depend on their mobility. Since capital is very mobile we should expect returns
to capital to eventually return to their pre-tax levels. Wage rates are likely to remain lower
because labor is not as mobile.
5. Reduced wages
The shift in the tax burden to firms that continue to conduct business in California will
reduce the after-tax productivity of labor. Labor productivity will decline further as higher taxes
on plant and equipment discourages investment, leaving workers with less capital. Since wages
are based on labor productivity, wages would fall, and workers’ ability to maintain purchases of
other goods and service, would drop accordingly.
6. Higher consumer prices
Since the prices that businesses charge their customers must cover costs (including the
cost of capital), the increase in property taxes ultimately will bring about higher consumer prices.
7. Decline in the value of assets held by California retirement funds
Both the California State Teachers’ Retirement System (CalSTRS) and the California
Public Employees’ Retirement System (CalPERS) have large holdings of California real estate.
Integrated Public Use Microdata Series: Version 4.0; http://usa.ipums.org/usa/. Minneapolis, MN: Minnesota

20
Nearly 13% of CalSTRS’ portfolio and 9% of CalPERS’ is invested in real estate.30 Not all of
this property is located in California. CalPERS reports that it has $5.3 billion invested in
California real estate. (CalSTRS does not report its California real estate holdings.) Since the
effects of the higher property taxes brought about by the split roll would be capitalized, the
market price of these real estate holdings will go down. The market value of the two funds’
California equity holdings will also go down if the issuing corporations are not able to pass along
the increased tax burden to renters, employees, and consumers.31 To the extent that the asset
value impairment prevents these funds from satisfying their pension promises to former state
employees and teachers, the California taxpayers will have to step into the breach.
It is possible, but not certain, that the increase in property taxes resulting from adoption
of a split roll would have some effects that would diminish the disincentives to business
investment discussed above. If the net revenues yielded by an increase in property taxes
imposed on business were used to improve the business environment in California (e.g.,
speeding-up regulatory approvals, increasing enrollment in vocational education classes that
address critical labor shortages), some of the adverse effects of the tax increase might be
mitigated. We have not assumed any such increase in spending in this study because the State
has a large structural deficit that it has chosen to cover by borrowing.
V.4. EMPIRICAL ESTIMATES OF DECREASES IN BUSINESSACTIVITY
The preceding section relies on economic theory to determine the economic impact of a
shift to a split property tax roll. In this section, we quantify the likely impact, using a
computable model of the California economy.
In estimating the impact, we make the following assumptions:
Adoption of a split-roll property tax regime will raise the assessed value of all
property, other than owner-occupied residential property, to the property’s current
Population Center.30 Information provided on August 1, 2008 from the Cal PERS (http://www.calpers.ca.gov) and CalSTRS
(http://www.calstrs.com) websites and through contacts with the organizations.31 CalPERS reports that it owns $10.8 billion in California public equities and $1.9 billion in California private
equity. We were not able to obtain CalSTRS’s California holdings.

21
market value. Based on the data in Table 1, we assume that the increase in
assessed value for affected properties will average 66.8 percent reflecting the fact
that the disparity ratio for commercial and industrial property is 60 percent.32
The 1 percent ceiling on the statewide property tax rate established by Proposition
13 will remain in effect.33 If adoption of a split roll was accompanied by
relaxation or elimination of the rate ceiling, the economic consequences of the
policy change would be significantly greater than what is presented in this report.
The net revenue generated by the relaxation of Proposition 13’s limits on assessed
values will reduce the amount that the State borrows to close the structural deficit
in the General Fund. In other words, our estimates of the likely economic
consequences resulting from adoption of a split roll do not assume that
government spending will increase.
V.4.a. DYNAMIC VS. STATIC ESTIMATES
Economists distinguish the dynamic effects of a change in economic policy from the
static effects of such a change. By dynamic effects, economists mean the consequences of
behavioral adjustments made by individuals and corporations in response to changes in economic
incentives. For example, the dynamic effects of an increase in taxes include decreases in
economic activity (e.g., less business investment and fewer jobs) that both theoretical and
empirical research show will occur as the result of such an increase.
A static estimate, in contrast, ignores these behavioral changes.34 Because these
behavioral responses typically run counter to the direction of the tax change, the incremental
revenues produced by a tax increase will be smaller than “static” estimates suggest, as economic
agents seek to avoid the increase or minimize its impact.
32 (1 - .599)/.599 = .66833 Plus the additional 0.25 percentage points to repay voter-approved bonded indebtedness34 For example, a static estimate of the additional revenues expected from adoption of a split-roll property tax
regime would be made by multiplying the change in total assessed value statewide by the (unchanged) property taxrate of 1 percent.

22
V.4.b. THE DYNAMIC REVENUE ANALYSIS MODEL (DRAM)
To estimate the magnitude of economic changes that would result from adoption of a
split-roll, we use the Dynamic Revenue Analysis Model (DRAM). The DRAM was designed to
produce dynamic estimates of the fiscal effects stemming from public policy changes, such as an
increase in State taxes. It takes into account some, but not all, of the behavioral changes
discussed above, and therefore is able to capture part of the decrease in jobs and business
investment that would result from adoption of the split-roll. The model then solves for the new
economic equilibrium that will emerge as a result of these behavioral responses.
The DRAM was developed at the University of California, Berkeley, in cooperation with
the California Department of Finance. The model is available to the public at the Department’s
web site.35 We requested and received from the Department an updated version of the model,
together with updated economic data and calibrated parameter estimates.
The DRAM divides the California economy “into 75 distinct sectors: 28 industrial
sectors, two factor sectors (labor and capital), seven household sectors, one investment sector, 36
government sectors, and one sector that represents the rest of the world.”36
In quantifying the behavioral responses of businesses and consumers to the split-roll tax,
we must consider the elasticity of demand for labor and property in California, relative to the rest
of the world, as well as the elasticity of substitution in production.
A mainstay of economics is the study of changes in the demand for (or supply of) a given
commodity when the price of that commodity changes. The ratio of the percent change in
quantity demanded (supplied) relative to the percentage change in price is called the elasticity of
demand (supply). Elasticity is nothing more than the sensitivity of a relationship. Thus, if the
elasticity of demand for gasoline is estimated to be –0.5, when the price of gasoline increases by
1 percent from its current level (say, from $4.00 per gallon to $4.04 per gallon), consumers will
lower their annual consumption of gasoline by half a percentage point (say, from 1000 gallons
over a given period to 995 gallons). The elasticity of demand is negative since, as price
increases, consumers demand less of a good. In contrast, the elasticity of supply is positive,
35 At www.dof.ca.gov.

23
because producers are willing to supply more of a good at higher prices. In turn, the elasticity of
substitution in production measures the degree to which firms can modify their relative usage of
labor to capital as the relative cost of these factors changes.
Our primary challenge is to model the policy change brought about by adoption of a split-
roll property tax regime, so that the effects on California’s competitive position vis-à-vis other
tax jurisdictions is captured. To accomplish this objective, we use estimates of elasticities that
reflect the ability of economic agents to move factors of production and sales across state
borders. Obviously, the flexibility to locate or relocate economic activity – and therefore the
elasticity of substitution – will vary from one sector of the California economy to another. Thus,
the more detailed the model, the more reliable the estimates of how a split property tax-roll
would affect the state’s economy. While more detail is desirable, computational tractability and
the availability of data on parameter estimates constrain the complexity of modeling. Appendix
D provides information on the elasticity assumptions that we incorporated in DRAM.
Since no data exist to properly identify the value of real estate by industry or household
type, DRAM identifies and treats the overall level of property tax revenue by all local
governments as a per-working-household tax on the one hand, and as an excise tax on business
on the other. The per-household rate is set proportionate to incomes in the base data, and is not
allowed to vary in the model from these levels. The excise tax is distributed by domestic
demand in the model, excluding industries not subject to the property tax. It is important to keep
in mind that DRAM only considers two factors of production: labor and capital (which includes
land).
V.4.c. QUANTITATIVE RESULTS
As discussed earlier in this part, the mobility of capital is a key determinant of how a tax
on capital will affect the economy. Because the DRAM does not distinguish between land
(relatively immobile) on the one hand, and plant and equipment (relatively mobile in the long
run) on the other, we have estimated the economic impact of a split-roll property tax regime
36 Berck, P., E. Golan and B. Smith, “Dynamic Revenue Analysis for California”, Summer, 1996, p.1.

24
using several alternative assumptions that establish a range of outcomes. We believe the likely
economic impact of adopting a split roll falls within this range.
The State Board of Equalization estimates the proportion of total assessed value
attributable to land -as opposed to the proportion attributable to "improvements"- at about 45
percent.37 Thus we assume that 45 percent of capital is immobile – that it cannot leave the State
during the DRAM’s time horizon. The rate of return on capital in the DRAM, therefore, will be
lower than what the rate (the “world” rate) would be if capital were assumed to be perfectly
mobile. (We elaborate on this discussion in Appendix E.) The results yielded by DRAM are
presented in Table 2.
As the table shows, the DRAM estimates that, given these assumptions about the
mobility of capital, adoption of a split-roll property tax would result in the loss of 152,400 jobs.
37 http://www.boe.ca.gov/annual/pdf/2007/table4_07.pdfhttp://www.boe.ca.gov/annual/pdf/2007/table7_07.pdf
Table 2Estimated Impact of the introduction of the Split-roll Tax
On the California EconomyImmobile Capital = 45%
Variable
Jobs Loss 152,400Migration (number of families) (48,700)Change in the Wage Rate (%) -0.4%Return to Capital -0.7%Net Private Investment (billions) (2.0)
Source: DRAM (1999).

25
V.4.d. IMPACT ON SMALL AND MINORITY-OWNED BUSINESSES
Small businesses are a vital source of new jobs in the California economy, as they are in
all states. The U.S. Small Business Association reports that over one-half of all new jobs in the
last decade were created by small businesses.
As a group, small firms are highly vulnerable to changes in the economics of their
business. They achieve lower profit margins than larger firms, have less access to capital, and are
less able to relocate because they tend to serve local markets.38 These attributes make small
businesses particularly susceptible to failure when the burden of government regulation or
taxation increases. Thus, small businesses will be disproportionately affected by the increase in
the tax burden that would result from adoption of a split property tax roll.
V.4.d.a.SMALL BUSINESSES IN CALIFORNIA
The U.S. Census Bureau’s County Business Patterns (CBP)39 provides county-level
statistics on employment by industrial sector. For each county-sector pair, the CBP also reports
the number of firms, by level of employment. Using this data, we are able to determine how
many small businesses exist in the California, by sector.
Consistent with the State’s small business preference program, we define a “small
business” as a firm with fewer than one hundred employees. 40
Table 3 shows the number of both small businesses and all businesses, by macro-industry
(consistent with the two-digit NAICS code industries). As the table indicates, over 97 percent of
all firms in California are small businesses. The table also indicates that small businesses are
heavily concentrated in sectors that tend to serve local markets, such as “Real Estate and Rental
and Leasing,” and “Accommodation and Food Services.” Small businesses in California employ
more than half of the State’s workers. Clearly, the health of these firms is essential to the state’s
economic well-being.
38 There are also likely to be significant relocation fixed costs that small businesses may not be able to afford,compelling them to either accept the tax increase or to close their doors.
39 The most recent CBP available is from 2006. U.S. Bureau of the Census. 2008. County Business Patterns2006; http:// www.census.gov/epcd/cbp/view/cbpview.html. Washington, DC.
40 http://www.pd.dgs.ca.gov/smbus/sbcert.htm#sbelig

26
Table 3. Small businesses and total firms by sector.
Industry Small* Total
Agriculture, Forestry, Fishing and Hunting 1,968 2,010
Mining, Quarrying, and Oil and Gas 837 873
Utilities 1,001 1,120
Construction 76,298 77,785
Manufacturing 41,586 44,474
Wholesale Trade 58,739 59,935
Retail Trade 110,225 113,30
Transportation and Warehousing 20,031 20,776
Information 20,059 20,954
Finance and Insurance 52,961 53,985
Real Estate and Rental and Leasing 50,787 51,094
Professional, Scientific, and Technical 111,290 112,69
Management of Companies and Enterprises 4,046 4,617
Administrative and Support and Waste 40,226 42,546
Educational Services 10,314 10,752
Health Care and Social Assistance 93,044 95,048
Arts, Entertainment, and Recreation 18,998 19,434
Accommodation and Food Services 71,392 72,849
Other Services (except Public 70,080 70,593
Other 3,285 3,285
All products 857,167 878,12
* Firms with less than 100 employees
Recent research indicates that larger firms, with better access to financing, have better
chances of survival. Data from the Office of Advocacy, U.S. Small Business Administration,

27
and the Bureau of the Census clearly indicate that over the period 1989-2005, more than 95% of
all firms that failed had less than 20 employees.41
For a small business that has owned property for many years, the increase in tax liability
resulting from adoption of a split roll could be large enough to cause the business to fail or lose
its property.
V.4.d.b.MINORITY-OWNED BUSINESSES IN CALIFORNIA
We can also determine the number of minority-owned businesses in California, and the
number of jobs offered by these firms. Minority-owned businesses tend to be small businesses,
giving them the added vulnerability to adverse economic changes that comes with relatively
small size.
Every five years, the U.S. Census Bureau conducts the Economic Census, which is a
comprehensive survey of American businesses.42 The latest Economic Census released by the
Census Bureau was for 2002. Among other questions, the census asks whether the owner of the
firm is white, black, American Indian or Alaska Native, Asian, Native Hawaiian or Other Pacific
Islander, and if the firm is publicly-held.43
Table 4 shows the number and employment of both minority-owned firms and all firms.
Approximately 5% of the State’s employment and corporate receipts are generated by minority-
owned businesses. Furthermore, minority owned business are concentrated in service sectors
(health care and social assistance, accommodation and food services among others), sectors in
which survival rates are smaller.44
41 Brian Headd, “Redefining Business Success: Distinguishing Between Closure and Failure”, Small BusinessEconomics, 21: 51-61, 2003.
42 U.S. Bureau of the Census. 2008. Economic Census Survey of Business Owners 2002;http://factfinder.census.gov/servlet/IBQTable?_bm=y&-geo_id=D&-ds_name=SB0200A1&-_lang=en. Washington,DC.
43 It also asks, independently of racial identification, whether the owner is of Hispanic origin. Since there isoverlap in identification of Hispanic origin and race (i.e., an owner could be both black and Hispanic), we do notinclude this category in our analysis. We also ignore the gender of the owner.
44 Bruce D. Phillips and Bruce A. Kirchhoff “Formation, Growth and Survival; Small Firm Dynamics in theU.S. Economy”, Small Business Economics, 1 (1989) 65-74.

28
Recent research indicates that the factor having the greatest impact on a small business’s
viability is its access to financing.45 A firm without access to capital cannot ride-out a period of
economic adversity. Minority owned businesses tend to have a more difficult time accessing
credit – one of the key variables linked to business survival.46
45 Richard Carter and Howard Van Auken, “Small Firm Bankruptcy”, Journal of Small Business Management;October 2006; 44, 4.
46 Ken S. Cavalluzzo and Linda C. Cavalluzzo “Market Structure and Discrimination: The Case of SmallBusinesses”, Journal of Money, Credit and Banking, Vol. 30, No4 (November 1998).

29
VI. CONCLUSION
Adoption of a split-roll property tax in California will reduce the after-tax return on
investment within the State. The lower returns will discourage investment within the State,
causing a loss of jobs and income. Using what we consider reasonable assumptions regarding
the mobility of capital, the Department of Finance’s DRAM estimates that job losses of 152,400.
Small and minority-owned businesses will be disproportionately affected by the increase
in property taxes brought about by the split roll, because their small size and difficulties in
obtaining credit make them much more vulnerable than larger businesses to adverse changes in
their economic circumstances. The incidence of higher property taxes will tend to fall on these
businesses either directly (if they own their place of business) or indirectly (if they rent from
others).
In addition, where market conditions permit, firms and individuals subject to higher
property taxes will attempt to recoup the lost income caused by the property tax increase by
charging higher prices to consumers, by raising rents, and by reducing their operating costs
through wage and benefit cuts.
The increase in rents will disproportionately affect lower-income families, because
renters tend to be poorer than homeowners.

30
APPENDIX A
STATE AND FEDERAL CORPORATE INCOME TAXES AND THESPLIT-ROLL PROPERTY TAX
Establish the following notation:
T is a firm’s total tax burdenTC is a firm’s California Bank and Corporation Tax (BCT) burdentC is California’s BCT rateTP is a firm’s California property tax burdentP is the California property tax rate
TO is a firm’s tax burden in other states (both corporate and property)TF is a firm’s federal corporate income tax burdentF is the federal corporate income tax rate is the firm’s profits gross of all income and property taxesS is the firm’s total sales; a C subscript indicates California salesP is the value of the firm’s total property; a C subscript indicates the value of
California propertyAC is the assessed value of the firm’s California propertyW is the firm’s total wages; a C subscript indicates wages paid in California
The total tax burden is the sum of the state and federal levies:
PFOC TTTTT .
Now consider a firm that operates across state lines. The Corporation Tax (CT) is
calculated using a formula that apportions profits to California as follows47
WW
wPP
wS
Sw C
WC
PC
S .
Property tax payments are deductible from profits when a corporation calculates its CT
liability. Hence, the firm’s CT bill is
CPCC AttT .

31
The property tax, the CT, and taxes paid in other states can be deducted from profits
when calculating the federal corporate income tax. Combining these facts and results and
substituting them into the total tax burden equation, we get
CPOCCPFOCPC AtTTAttTAttT .
Grouping terms and simplifying yields results in the following equation:
OFCPCFFFC TtAttttttT 1111 .
This equation reflects the fact that the introduction of a split-roll property tax (an increase
in CA ) will increase a firm’s tax burden ( 0/ CdAdT ), but the increased burden will be partially
offset by the fact that the property tax is deductible from:
the federal corporate income tax (so a significant proportion of the tax will be exported –
up to 35%); and
from the CT Ct (up to 8.84%).
What is the result of the split-roll tax? The assessed value of commercial property will
increase. The equation for T reveals that this will produce an increase in the firm’s tax burden.
Part IV.1.a describes how commercial properties will fall in value and firms will be prone to
move facilities out-of-state. Hence, the ratio of California property values to total property
values will fall. This implies that the apportionment factor will fall as well. This causes the total
tax burden to go down.48
Thus, the split-roll has three competing effects on the tax burden that a firm faces:
1. The property tax increases directly.
47 For most firms, the weight on California sales is one-half, while the weights on property and wage fractionsare each one-quarter. The BCT rate is 8.84%, the property tax rate is approximately 1.098%, and the federalcorporate income tax rate is between 15 and 35%.
48 This result holds so long as profits gross of taxes are greater than the property tax levy. Since firms cannot getrebates for having low or negative profits, we assume that this assumption holds. Additionally, we assume thatreductions in California property holdings do not affect wages paid, sales, profits, or taxes in other states. Lastly, itshould be noted that the assessed value of property is appropriately conceived as a function of the market value ofthe property.

32
2. The apportionment factor falls as a result of reduced property values and capital
investment.
3. An indirect reduction in the property tax due to disinvestment.
The net effect of these three factors depends upon how willing a firm is to leave the state.
We examine two polar cases. First, consider a firm that is largely based outside the state and
owns only one piece of property in California. Upon the imposition of the split-roll, assume that
the firm sells its lone piece of California property, sending its property tax burden to zero and its
apportionment factor goes down as well. Its total tax burden has fallen.
Now consider the opposing case of a ski resort owned by a multi-state corporation. The
owner may reduce its property holdings in response to the split-roll tax increase, but it cannot
move the resort to another state. This implies that the corporation’s apportionment factor will
not fall very much nor will its holdings. Combined with a significant increase in its property tax
bill, the owner’s overall tax burden increases.

33
APPENDIX B
EFFECT OF THE SPLIT-ROLL TAX ON PROPERTY VALUES
While land in total is supplied inelastically, land allocated for non owner-occupied
residential properties (non-OOR properties) is supplied elastically. If, for example, businesses
are willing to pay more for property than homeowners, more land will be allocated to businesses
and less to homeowners. While the total amount of land does not vary, the supply of land for a
given use depends on the price offered for it.
Imagine that a piece of land has a market value of $100,000 and is purchased by a
business. The value of the land as residential property must be below this amount; if it was not,
the land would have sold for a higher price. In the real world, property can be easily converted
from commercial to residential use. It is more difficult to make the conversion in the opposite
direction because of zoning restrictions, but some conversion is possible. The substitutability of
uses generates elastic supplies for each use separately, despite the inelastic supply for all uses
taken together.
When a tax is imposed only upon non-OOR property, the value of the land to these
owners will fall, because it will be subjected to higher levels of taxation in the future, and thus
cost more to own. Hence, the amount that participants in the market are willing to pay for the
land will fall. The value of the land as OOR property prevents the market price from falling very
far. Indeed, if residential buyers value our hypothetical piece of land at $99,999, the price of the
land will only fall by $1, and its use will change from commercial to OOR. Notice that the price
of land falls for both non-OOR and owner-occupied properties.
Specifically, the value for non-OOR uses will fall by the present value of the tax
increases in the future. To continue our example, assume that the business values the property at
$100,000. Put differently, the property increases the productivity of the business by $100,000 net
of its current costs. Now, we increase taxes, which are simply one type of cost, by $1,000 per
year.

34
A dollar today is not the same as a dollar tomorrow. The value of $1,000 next year in
today’s dollars is the amount of money that we would need to save today in order to have $1,000
next year.49 This is called discounting.
With an interest rate of 8%, the sum of all future tax payments in today’s dollars is 13.5
times $1,000, or $13,500. Now the value of the property to the business is only $86,500.50
Increasing the tax liability lowers the net value of the property for non-OOR uses. Since property
can be used for any purpose, the values of all properties will fall. When the price of a substitute
to a good falls, so does the price of the good itself. This result arises because an individual’s
willingness to pay for a good goes down when an alternative becomes cheaper. Note that, while
the value of the property for non-OOR use has fallen by the full amount of the tax, the actual
market price will not fall by the full amount because the value of the property to owner-
occupants has not changed. It acts as a backstop, preventing a full drop in price. The tax, then, is
borne both by current landowners through lower property values and by non-OOR owners
through higher, tax-inclusive land prices.
Under a split-roll property tax regime, the demand for non-OOR land will fall by
precisely the present value of future tax payments, reducing its market price and quantity.
Because the supply of land in total is inelastic, the supply of OOR land increases, increasing the
quantity of residential land, while lowering its price. The magnitudes of these effects depend
upon the elasticities of demand for each property type.
When there are no zoning restrictions on property use, the result of a split-roll regime on
land values is to lower land prices and bias land-use decisions toward owner-occupied homes
and away from businesses and rental properties. The split-roll induces an inefficient allocation of
land between OOR and non-OOR uses because it places different taxes on each. The prices do
not fall a great deal because sustained owner-occupied residential values act as a backstop to
falling values for other uses. Hence, businesses and landlords will pay a higher tax-inclusive
49 We would need to savetr )1(
1000$
to have $1,000 in t years with an annual interest rate of r.
50 $100,000 - $13,500 = $86,500.

35
price for land and landowners will get lower prices for the land that they currently have; the tax
burden is shared by current and future landowners.
Now let us examine the situation in which zoning laws perfectly restrict land to either
owner-occupied residential use or non-OOR use. As a result of these laws, non-OOR land is now
supplied perfectly inelastically (as is OOR land); a certain amount of land is allocated solely for
that purpose regardless of market conditions. When the tax increases for non-OOR uses, demand
for this land falls by the present value of the stream of future tax payments, just as above. In our
example, the value of the land to the business is now $86,500. In the previous scenario, the
landowner could sell the land to a prospective homeowner for $99,999, but now zoning prevents
this transaction from occurring. Instead, the landowner has no option but to sell to the business
for $86,500. Since the land is supplied inelastically, land prices fall fully by the present value of
future taxes—this is known as capitalization of the tax. Notice here that OOR land prices do not
fall as a result of the tax increase on non-OOR properties because the supply of OOR property is
independent of the supply of commercial properties; the homeowner is not able to buy this
property and benefit from lower prices.
In the presence of perfect zoning segregation of property uses, full capitalization lowers
the price of non-OOR land and the buyers pay the same post-tax price under this scenario and in
the situation of the unified roll. Here, the tax is paid fully by current landowners. This result
arises from the fact that land is supplied inelastically for a specific use as a result of the zoning
laws. Notice that the tax change does not change the allocation of properties, as this is restricted
to zoning, and this mandated allocated is likely inefficient itself.

36
Appendix C
EFFECT OF THE SPLIT-ROLL TAX ON CAPITALThe tax change alters the incentives for investing in new capital in California. Capital can
be used for a variety of purposes. More importantly, capital facilities can be established in other
places. Rather than locate a factory in California, a firm can locate it in Colorado or even
Calcutta. In essence, “capital” is investment funds that can be moved around the world to buy
land, plant, and equipment of any kind with little difficulty. As a result of the mobility of capital,
its supply to California is very elastic: if Californians are not willing to pay the country or world
prevailing rate of return on investment net of taxes, capital will be deployed to other locations.
The increase in property taxes will reduce the value of capital to businesses, lowering
their demand for capital. Since the supply of capital is very elastic, the price of capital cannot fall
very far. Instead, the quantity of capital in California will fall and the tax will be borne by the
owners of businesses that remain within the state’s borders. Consider, too, that rental properties
are one kind of investment and capital will be supplied as elastically to this purpose as any other;
rather than invest in rental units in Los Angeles, the investor may buy stock of General Electric.
Hence this analysis applies equally well to commercial and rental capital.
While the supply of capital can migrate to any state or country, the demand for capital
may be California-specific. A retailer may be able to close its brick-and-mortar storefront and
establish an online presence with an out-of-state warehouse, but a bakery and a beauty shop do
not have this option. The more mobile a factor, the more elastically it will be supplied. If
commercial capital is reluctant to leave California or to be transformed into other types of
capital, then the quantity supplied in the state will not fall that much, but the quantity of mobile
factors in the state will fall more.

37
APPENDIX D
Statistical Estimation of Behavioral Responses of Economic Agents andComputable General Equilibrium Models
Even though Computable General Equilibrium (CGE) models are widely used as a tool
for policy analysis, they are often criticized for fragile functional underpinnings, particularly
with respect to parameters that capture how consumers and firms react to relative prices in four
core decision processes:
1. How much more (or less) work individuals will supply to the market when wage rates go
up (or down);
2. How migrants flow into or out of California as wages and spending on education varies;
3. How aggressively firms, both California-based and “foreign,” change their sales patterns
when prices in California weaken; and
4. How willing firms are to modify their investment behavior and location choices when
profitability changes.
While statistical research has tried to estimate these behavioral coefficients, there are
ranges of acceptable values for many variables used in CGE models. Even sophisticated micro-
econometric studies have difficulty capturing the complex behavior of agents at the
disaggregated level. Parameter estimation from statistical studies frequently runs into difficulties,
due to problems both with data sources and conceptual difficulties in determining the specific
methods and procedures needed for obtaining reliable estimates. The precision of statistical
analysis is directly related to the number of observations: the more observations, the narrower
the estimated parameter range. One way to increase the size of the database, and thus the
accuracy of the procedure, is to use data for several years. As several leading scholars have
observed, however, the sectors being analyzed, as well as the economy as a whole, often have
“undergone structural changes during this period, which may or may not be appropriately
reflected in the estimation procedure.”51
51 Arndt, Channing, Sherman Robinson, & Finn Tarp. 2002. "Parameter estimation for a computable generalequilibrium model: a maximum entropy approach," Economic Modelling, Elsevier, vol. 19(3), pages 375-398.

38
By necessity, statistical estimation imposes constraints and assumptions on the theoretical
model of the economy and uses different mathematical and statistical tools to see if the data
reject these hypotheses. A CGE model is much more disaggregated than a standard econometric
model, which generally estimates aggregate behavior using what is referred to as "reduced form"
equations. According to Arndt, Channing, and Tarp, “while the estimated parameters might
provide a highly plausible description of historical production and consumption data sets, the
estimated values will not be fully compatible with the general equilibrium system they are
designed to represent.”52
CGE models are commonly used to analyze changes that are expected to occur over the
medium or long term–say three-to-five years. There is a mismatch between estimation that uses
annual data for broad categories and the requirements of a CGE model; standard econometric
models estimate parameters that measure the reactions of economic agents to changes in
important variables using short-run (i.e., annual) data. These measures are called short-run
elasticities. The CGE model attempts to estimate changes over a longer timeframe, however. As
a result of this mismatch, the coefficients in the model “are likely to understate the response
capacity of agents over the longer time frame”.53
The problem is even greater in the case of one-period models, such as the DRAM.
Economic agents adjust to different policy measures in a cumulative fashion over time. In the
DRAM, for example, the capital stock is expected to last 15 to 20 years. Most econometric
estimates cannot accommodate these long-term effects due to the paucity of data. Thus, changes
in investment that occur “today” as a result of a policy change will have implications for nearly
two decades. However, the parameters estimated by the usual econometric techniques identify
short-run responses.
For the DRAM model to accurately reflect the likely cumulative effects a policy change,
elasticities have to be larger than the short run elasticities estimated with standard econometric
techniques (that is, responses used in these models are larger than those that reduced-form
econometric techniques suggest). To compensate for this bias, we incorporated the following
52 Ibid.
53 Ibid.

39
elasticities in the DRAM for purposes of estimating the economic impact of a shift to a split-roll
property tax.54
A. TRADE
a. ETAE(I)*, THE EXPORT ELASTICITIES WITH RESPECT TO
DOMESTIC PRICE
In the low elasticities scenario, set to –3.5 for all sectors with the exception of sectors that
may be thought to have a domestic bias for which it is set to –1.5: wholesale [WHOLE], retail
[RETAI], Health Services [HEALT], Entertainment [ENTER], and Other Services [OSERV].
b. ETAM(I)*, THE IMPORT ELASTICITIES WITH RESPECT TO
DOMESTIC PRICE
Set to 1.5 for all sectors with the exception of domestically oriented sectors mentioned in
1. above for which it is set to 0.5
B. MIGRATION
a. ETAED(H), THE SENSIVITIY OF MIGRATION TO PUBLIC
EDUCATION SPENDING
0.1 to 0.5
b. ETAYD(H)*, THE RESPONSIVENESS OF INward bound MIGRATION
TO AFTER TAX EARNINGS
Ranges from 1.0 to 6.0 in the low elasticities scenario.
c. ETAU(H)*, THE RESPONSIVENESS OF INward bound MIGRATION TO
UNEMPLOYMENT
Ranges from -0.2 to -0.8 as in the DOF version.
54 The entire set of parameters is contained in pages 185-220 of the DRAM 1995 document on the DOF web

40
The immigration parameters MI0 (H) and MO0 (H) were set at 0.09 as in the DOF
version to reflect the fact that net migration has been negative since 2004-2005 contrary to the
significant net inflow during the period 1999-2003.
C. ELASTICITIES OF SUBSITUTION IN PRODUCTION
The DRAM does not consider land as a separate factor of production and subsumes it as
part of “capital”. While there is some econometric evidence that the elasticity of substitution
between labor and capital may be equal to .8 or .9, as discussed in section V, the supply of land
is inelastic and it is therefore likely that the elasticity of substitution between labor and land is
much smaller than those values. Furthermore, as can be seen in the following graph almost half
of the industries considered have very small capital-labor ratios (smaller than .3) suggesting
again that the elasticity of substitution in production between labor and land/capital is likely to
be smaller than .8 or .9.

41
Capital-Labor Ratios in DRAM
-
0.50
1.00
1.50
2.00
2.50
MOTOR APPAR MFRCO INSUR PETRO FOODS BANKS RETAI HEALT ENMIN BSERV ENTER REALE UTILI
Thus we have set the elasticity of substitution in production to .5 for the following 13 sectors:
1. Food Manufacturing2. Apparel3. Construction Oriented Manufacturing4. Paper Printng; Publishing5. Chemicals/Rubber/Plastics6. Petroleum7. Electronic Techonology8. Aerospace9. Motor Vehicles10. Other Manufacturing11. Transportation12. Banks and other credit institutions13. Insurance

42
APPENDIX E
Land Immobility and the return to Capital in the DRAM model
Assume that the “world” rate of return –net of taxes- is R
Given that the average property tax rate in California is 1.098 and that it is deductible for
Federal Income Tax purposes, the gross rate in California has to be
R + (1.098*2/3) %
The split-roll tax amounts to a 66.8% increase in the differential
1.098 *1.66 = 1.83
Thus the new gross rate in California has to be
R + (1.82*2/3) %
If 100% of capital was mobile, it would leave the State until the California rate of rate
reached that level (R + (1.83*2/3) %) thus equalizing it with the “world” rate of return net of
taxes. If however a certain proportion p of capital cannot migrate even over the horizon of the
DRAM model (because it is land), the net of taxes rate of return for the sum of land and capital
will be lower than the “world” rate of return net of taxes.
The new gross rate in California would be
10% + (1.83*2/3)*(1-p) %
We model this in DRAM under two assumptions: p =25% and p =33%