The economic cost of arthritis in New Zealand in 2010 · 2.4 Pathology and ... The total financial...
83
The economic cost of arthritis in New Zealand in 2010 13 April 2010 Report by Access Economics Pty Limited for: Arthritis New Zealand
Transcript of The economic cost of arthritis in New Zealand in 2010 · 2.4 Pathology and ... The total financial...

The economic cost of arthritis in New Zealand in 2010
13 April 2010
Report by Access Economics Pty Limited for:Arthritis New Zealand

The economic cost of arthritis in New Zealand
Contents
List of acronyms ..............................................................................................................................i
Acknowledgements and background..............................................................................................i
Executive Summary ........................................................................................................................ii
1 Prevalence........................................................................................................................... 5 1.1 Prevalence rates .................................................................................................................... 6 1.2 Baseline prevalence 2010 to 2020......................................................................................... 9 1.3 Risk factors for arthritis........................................................................................................ 14
2 Health sector costs............................................................................................................ 17 2.1 Hospital costs....................................................................................................................... 17 2.2 General practice costs.......................................................................................................... 25 2.3 Pharmaceutical costs ........................................................................................................... 28 2.4 Pathology and diagnostic imaging costs .............................................................................. 31 2.5 Research costs ..................................................................................................................... 33 2.6 Other costs from survey data .............................................................................................. 35 2.7 Summary of health system costs ......................................................................................... 37
3 Indirect costs..................................................................................................................... 40 3.1 Productivity losses ............................................................................................................... 40 3.2 Informal and formal community care.................................................................................. 44 3.3 Other indirect costs ............................................................................................................. 46 3.4 Summary of the financial costs of arthritis .......................................................................... 47
4 Burden of disease ............................................................................................................. 50 4.1 Suffering and premature death methodology..................................................................... 50 4.2 Estimating the burden of disease for arthritis in 2005 ........................................................ 53 4.3 Valuing the burden of disease ............................................................................................. 55
References................................................................................................................................... 57
Appendix A: NZHS prevalence data............................................................................................. 62
Appendix B: Survey questions from the NZHS ............................................................................ 63
Appendix C: – RNZCGPRU pharmaceutical and pathology data ................................................. 64
Appendix D: – Health data surveys ............................................................................................. 72
Tables
Table 1.1 : Arthritis prevalence rates – meta analysis .................................................................. 6
Table 1.2 : Baseline prevalence projections 2010 and 2020....................................................... 10
Table 1.3 : Population and arthritis shares, Mäori and non‐Mäori............................................. 11
Table 1.4 : Prevalence by age, gender, ethnicity and type of arthritis, 2010 ............................. 12
Table 1.5 : Prevalence by age, gender, ethnicity and type of arthritis, 2020 ............................. 13

Table 2.1 : Classification of arthritis, ICD‐10 codes..................................................................... 19
Table 2.2 : Arthritis public inpatient costs by ICD‐10 code, 2003‐04.......................................... 20
Table 2.3 : Arthritis public inpatient costs by age and gender, $m, 2010................................... 23
Table 2.4 : Public inpatient costs by ethnicity and facility, $m, 2010 ......................................... 23
Table 2.5 : Triangulation of inpatient data.................................................................................. 24
Table 2.6 : Consultations for arthritis, by other problems managed, 2003................................ 26
Table 2.7 Most commonly prescribed arthritis drugs funded by PHARMAC (2009) .................. 28
Table 2.8 Most commonly prescribed arthritis drugs funded by PHARMAC (2009) .................. 30
Table 2.9 : Top 20 laboratory referrals, arthritis relative to total, 2003..................................... 32
Table 2.10 : HRC Research projects relating to arthritis, 2001‐2004, $ ...................................... 34
Table 2.11 : Summary of health costs of arthritis, New Zealand, 2010 ...................................... 38
Table 3.1 : Cost of reduced employment, New Zealand, 2005 and 2010................................... 42
Table 3.2 : Cost of forgone taxation, New Zealand, 2010........................................................... 44
Table 3.3 : Effect of physical health on daily activities, New Zealand, 2003 .............................. 45
Table 3.4 : Value of care provided to people with arthritis, New Zealand, 2005, 2010 ............. 46
Table 3.5 : Arthritis, financial cost summary, 2010, $m.............................................................. 48
Table 4.1 : Burden of disease, DALYs by type of arthritis, New Zealand, 2010 .......................... 54
Table A.1 : NZ prevalence of all arthritis, OA and RA, by age & gender, 2006‐07 ...................... 62
Table A.2 : NZ prevalence of all arthritis, OA and RA, by gender & race, 2006‐07..................... 62
Table C.1 : Prescriptions, arthritis consultations vs total population ......................................... 64
Table C.2 : Laboratory referrals, arthritis consultations vs total population .............................. 69
Figures
Figure 1.1 : Age‐specific prevalence rates, arthritis, New Zealand, 2006‐07................................ 7
Figure 1.2 : Arthritis in adults, by ethnic group & gender (age‐standardised rate ratio) ............. 7
Figure 1.3 : Raw prevalence rates (%) by type of arthritis, New Zealand 2010 ............................ 8
Figure 1.4 : Age‐specific prevalence rates, all arthritis, by ethnicity, New Zealand, 2010 ........... 9
Figure 1.5 : Age‐specific prevalence rates, Mäori, by gender, New Zealand, 2010...................... 9
Figure 1.6 : Prevalence (no. of people) by age & gender, New Zealand, 2010........................... 10
Figure 1.7 : Projected prevalence 2010 to 2050 ......................................................................... 11
Figure 1.8 : Obesity prevalence by gender, 1977 to 2003 .......................................................... 14
Figure 1.9 : Obesity and arthritis prevalence, South Australia ................................................... 15
Figure 2.1 : Public inpatient costs by type of arthritis, 2010 (share of $99.9m)......................... 22
Figure 2.2 : Arthritis public inpatient costs by age and gender, $m, 2005 ................................. 22
The economic cost of arthritis in New Zealand
Figure 2.3 : Hospital costs arthritis, NZ, 2010 ($m and % total of $237.3m) .............................. 25
Figure 2.4 : Cost of last visit to general practitioner, by gender................................................. 27
Figure 2.5 : HRC research projects relating to arthritis, 2001‐2004, $m .................................... 35
Figure 2.6 : Summary of health costs of arthritis, New Zealand, 2010....................................... 38
Figure 2.7 : Share of health costs by type of cost, NZ & Australia, 2005 (% total) ..................... 39
Figure 2.8 : Per capita health costs by type of cost, NZ & Australia (NZ$, 2005)........................ 39
Figure 3.1 : Employment rates by age, New Zealand, 2003........................................................ 41
Figure 3.2 : Age‐standardised employment rate, NZ, 2003 ........................................................ 42
Figure 3.3 : Arthritis, financial cost summary, 2010, % total ...................................................... 48
Figure 4.1 : Burden of disease by type of arthritis, NZ, 2010 (% 21,491 DALYs)......................... 54
Figure 4.2 : Burden of disease by gender and ethnicity, NZ, 2010 (% 21,491 DALYs) ................ 55
Figure 4.3 : Comparison of burden of disease, New Zealand, 1996 ........................................... 55
While every effort has been made to ensure the accuracy of this document and any attachments, the uncertain nature of economic data, forecasting and analysis means that Access Economics Pty Limited is unable to make any warranties in relation to the information contained herein. Access Economics Pty Limited, its employees and agents disclaim liability for any loss or damage which may arise as a consequence of any person relying on the information contained in this document and any attachments.

The economic cost of arthritis in New Zealand
List of acronyms
AF attributable fraction AIHW Australian Institute of Health and Welfare bn billion COX‐2 Cyclo‐oxygenase‐2 DALY disability adjusted life year DHBs district health boards GDP gross domestic product GP general practitioner/practice HRC Health Research Council (of New Zealand) ICD‐10 International Classification of Disease Tenth Revision m million MOH Ministry of Health MRI magnetic resonance imaging NSAIDs non‐steroidal anti‐inflammatory drugs NZ New Zealand NZHIS New Zealand Health Information Service NZHS New Zealand Health Survey OA osteoarthritis OECD Organization for Economic Cooperation and Development OR odds ratio PPP purchasing power parity QALY quality adjusted life year RA rheumatoid arthritis RNZCGPRU Royal New Zealand College of General Practitioners Research Unit SLE systemic lupus erythematosus SNZ Statistics New Zealand TNF tumour necrosis factor VLY value of a life year VSL value of a statistical life YLD years of healthy life lost due to disability YLL years of life lost due to premature mortality

The economic cost of arthritis in New Zealand
i
Acknowledgements and background
This report was prepared by Access Economics for Arthritis New Zealand. Access Economics acknowledges with appreciation the comments, prior research and expert input by:
Dr Barry Borman Manager Health & Disability Intelligence, Health and Disability Systems Strategy, Ministry of Health Andrew Harrison President, New Zealand Rheumatology Association Sandra Kirby Chief Executive, Arthritis New Zealand Geraldine MacGibbon Therapeutic Group Manager, Musculo Skeletal Conditions, PHARMAC Kim Miles Chief Executive, New Zealand Orthopaedic Association Dr Natalia Valentino Service Development Manager, Arthritis New Zealand Sheryl Williams Senior Product Manager, Abbott Laboratories
Access Economics was commissioned by Arthritis New Zealand in late 2009 to update our 2005 report ‘The Economic Cost of Arthritis in New Zealand’ (Access Economics, 2005a) to estimate prevalence and costs of arthritis in New Zealand 2010. Using the 2005 report as the baseline, this updated report utilises:
■ new population data from Statistics New Zealand (SNZ), and new prevalence data on arthritis from the 2006‐07 New Zealand Health Survey (NZHS);
■ updated health system costs with the latest hospital data from the New Zealand Health Information Service (NZHIS) and updated other health cost elements including the cost of new pharmaceuticals, notably the introduction of biological medications since 2005 (not included in the 2005 report);
■ re‐estimation of all the indirect costs, remodelled for 2010 based on wage and price inflation and other cost indices;
■ remodelled burden of disease (using the new prevalence estimates) and a revised Value of a Statistical Life Year (VSLY) for NZ in light of the new literature on this topic in recent years.
Unlike the previous report, this one does not provide different scenarios for obesity. All monetary figures quoted are in New Zealand dollars unless noted otherwise.

ii
Executive Summary
In 2010, over 530,000 New Zealanders aged 15 or over are living with at least one type of arthritis. This equates to 15.2% of the total population aged 15 or over, or nearly 1 in 6 people.
■ Over half are female (57.8%) and over half (54%) are of working age (15‐64 years).
■ 9.4% of people with arthritis are of Mäori descent, much lower than their population share (15.2%), largely because of the younger Mäori age distribution.
In younger age groups, arthritis is more common in Mäori people; in older age groups prevalence rates are similar due to the influence of osteoarthritis.
■ Prevalence is expected to grow to over 650,000 people by 2020 (16.9% of the population aged 15 or over), largely due to demographic ageing.
The total financial costs of arthritis in New Zealand in 2010 are estimated to be $3.2 billion or 1.7% of GDP. Financial costs comprise health sector costs and indirect costs.
■ In addition, the burden of disease – the years of healthy life lost because of arthritis – is estimated as 21,491 Disability Adjusted Life Years (DALYs) in 2010.
Converting this to financial terms using the value of a statistical life year of $177,683 for New Zealand in 2010, equates to some $3.8billion in suffering and premature death for those with arthritis this year.
Health sector costs of arthritis are estimated to be $695m in 2010, 22% of total financial costs.
■ Hospital costs represent around one third of health sector costs ($237m).
Public inpatient costs are 42% of hospital costs ($99.9m), and are dominated by osteoarthritic knee and hip surgeries.
Private inpatient costs are estimated as $82.4m (35% of hospital costs) while outpatient services are estimated as $55.0m (23%).
■ Pathology and imaging together are estimated to be 12% of health sector costs ($63.7m), quite a high share compared with other countries.
■ Out of hospital specialist services (mainly for rheumatologists and orthopaedic surgeons) are also relatively high at $30.9m (4.4% of health sector costs).
■ In contrast, general practice (GP) and pharmaceutical health sector cost shares are relatively low – 3% ($22.8m) and 6% ($41.8m) respectively.
■ Allied health and aged care are each around 12% of health sector costs ($81m and $87m respectively).
■ Research is estimated as 2% of health sector costs ($12.4m).
■ The remaining health costs comprise capital expenditures, expenditure on community health, public health programmes, health administration and health aids and appliances, which together are estimated as $97.3m (14% of health sector costs) in 2010 for arthritis.
The indirect costs of arthritis ($2.50bn) outweigh health costs around 3.6 to 1.

The economic cost of arthritis in New Zealand
iii
■ People with arthritis are 5% less likely to be employed than those without arthritis, based on New Zealand Health Survey data.
Over 25,000 New Zealanders will not work in 2010 due to arthritis, costing around $1.48 billion in lost productivity in 2010.
In addition, temporary absences from work due to arthritis also impose costs of some $25m in 2005.
Together lost production is the largest cost of arthritis, representing nearly half (47%) of the total financial costs in 2010.
■ Informal care is the second largest cost at 23% of total financial costs ($752m), measured on a conservative opportunity cost basis.
The replacement value of this informal care is very large at $5.0bn, for activities of daily living only (excluding assistance with household tasks).
Formal sector community care for people with arthritis costs $55m per annum.
■ Aids, modifications and travel for people with arthritis are estimated to cost $66m in 2010 (2% of total financial costs).
■ Deadweight costs arising due to the distortionary and administrative impacts of raising additional taxation and making additional welfare payments are estimated as $130m per annum (4%).
Arthritis is a highly prevalent and costly disease, necessarily a national health priority area due to the extent of its prevalence and socioeconomic impacts. Cost‐effective interventions can include those targeted at reducing obesity, continued investment in research and development to delay the onset of osteoarthritis, and self‐management education. Such options offer potential for substantial reductions in the future projected costs of the disease, and pathways to enhanced wellbeing for New Zealanders in the future.
Access Economics April 2010

The economic cost of arthritis in New Zealand
5
1 Prevalence
The best method of measuring community prevalence is through well‐designed clinical studies of populations, preferably longitudinal and prospective. However, there do not appear to be such studies in relation to arthritis in New Zealand. This is recommended; as such studies are very useful to inform policy makers in relation to risk factors, impacts and the cost‐effectiveness of interventions and preventive activities.
In the absence of detailed New Zealand epidemiological studies, the best estimate of community arthritis prevalence obtainable is from well‐designed self‐report surveys, as these tend to capture some undiagnosed arthritis as well as almost all diagnosed arthritis. Self‐reported data have occasionally been criticised due to the allegation that people:
■ do not have sufficient information to know whether or not they have a particular condition (differential self‐diagnosis);
■ may have recall problems; or
■ may be ‘led’ in the survey or due to other incentives to misrepresent or misclassify their condition.
While this may be true in some instances, in general anonymous non‐coercive self‐reported data for current long term conditions that are not mental illnesses have tended to support prevalence estimates based on clinical studies, with no significant bias towards under or over‐reporting (e.g. Benitez‐Silva et al, 2000). Moreover, more recent survey verification techniques are utilised (such as cross‐checks with other household members or aged care facility staff, detailed questioning regarding the condition etc) in order to minimise any such potential bias.
The Ministry of Health (MOH) New Zealand Health Survey (NZHS) provides such data. The most recent NZHS was conducted between October 2006 and November 2007 and had over 12,000 adults and nearly 5,000 children aged from birth to 14 years, including Mäori, Pacific peoples and Asian people. Appendix A contains prevalence rates by age, gender and ethnicity for arthritic conditions, as reported in the 2006‐07 NZHS. Detailed splits by age and ethnicity were calculated base on Access Economics (2006).
Appendix B provides the Survey questions from the NZHS on arthritis. A key point to note in relation to the questions is that prevalence is based on a ‘Yes’ answer to the question (Q1.28) ‘Have you ever been told by a doctor you have arthritis?’ so the estimate is of diagnosed arthritis. The follow‐up question differentiates type of arthritis (that affects the person the most) – rheumatoid, osteoarthritis, other known type (specified) and ‘don’t know’. The questions thus under‐report different types of arthritis – since if a person has two kinds, only one is reported. Also, because some people do not know the type they have, rheumatoid, osteoarthritis and ‘other’ will sum to less than the ‘total’. This is the reverse of the Australian National Health Survey, where significant comorbidity of different types of arthritis means that the sum of the components is greater than the total.

6
1.1 Prevalence rates
Prevalence rates of various arthritic and related conditions, from various sources across the New Zealand population as a whole, are summarised in Table 1.1. As would be expected, self‐reported prevalence from the 2003 NZHS is considerably higher than surveys of prevalence within the primary care system for the same year, such as Taylor et al (2004)1. Such surveys only identify those people with arthritis who also seek medical attention for their condition within a certain period, and the methods typically search on keywords that may omit certain types of arthritis. However, results from the NZHS are very similar to Access Economics’ estimates of prevalence in Australia, based on the Australian Bureau of Statistics’ (2002) National Health Survey.
Table 1.1: Arthritis prevalence rates – meta analysis
NZHS Taylor et al (2004)
Colmar Brunton
Access Economics
Type of study NZ community based
NZ primary care based
NZ community based
Australia community
based
Data reference year 2003 2003 2003 2005
Osteoarthritis 7.7% 1.44% na 7.8%
Rheumatoid arthritis 3.2% 0.79% na 2.5%
All forms of arthritis 15.7% 3.75% na 16.7%
All forms of musculoskeletal disorder
32.7% 20.4% 24.6% 32.8%
Age‐specific prevalence rates for both men and women derived from the 2006‐07 NZHS are shown in Figure 1.1. The graph shows that the age‐gender distribution of self‐reported prevalence rates in New Zealand is broadly similar to those reported in other community‐based surveys (Access Economics, 2005; Access Economics, 2007). Arthritis is more prevalent in older age groups, and is generally more prevalent in women than men.
1 Taylor et al (2004) estimated the burden of rheumatic (musculoskeletal) disorders in the New Zealand population by calculating GP consultation rates—as well as the influence of age, gender, ethnicity, and small‐area deprivation on these consultation rates. Cases were identified from the Royal New Zealand College of General Practitioners database using search‐strings of typical words used in consultation notes (for each of 10 rheumatic disorders). Rates were calculated from a denominator of the number of people attending at least once over a 12‐month period to any of 22 contributing GPs. The independent effect of age, sex, ethnicity, and small‐area deprivation was modelled using multiple logistic regression. Of 29,152 people attending their GP, 20.4% consulted with a rheumatic disorder. Older people, males, people who lived in more deprived areas, and Europeans were more likely to consult with a rheumatic disorder. With all rheumatic disorders, age was a significant influence upon consultation—especially osteoarthritis, gout, osteoporosis, and joint surgery. Mäori were more likely than Europeans to consult with gout, but they were slightly less likely to consult with back pain or regional pain disorders. Small‐area deprivation had small influences upon people consulting with gout, regional pain, and back pain. Taylor et al (2004) noted that rheumatic (musculoskeletal) disorders form a significant part of the workload of GPs and this is significantly influenced by local demographic factors. Most of these conditions seen by GPs are non‐inflammatory and non‐surgical. Taylor et al (2004) concluded, as we do, that if a community‐needs approach were taken, it is likely that the workload and associated costs estimated would be even greater.

The economic cost of arthritis in New Zealand
7
Figure 1.1: Age‐specific prevalence rates, arthritis, New Zealand, 2006‐07
0.7 1.6
7.4
15.7
25.0
32.4
37.5
1.6 4.5 4.9
15.7
28.1
46.2
53.7
0
10
20
30
40
50
60
15-24 25-34 35-44 45-54 55-64 65-74 75+
%
Age group
Male Female
As shown in Figure 1.2, there were statistically significant age‐standardised differences between ethnic groups shown in the 2006‐07 NZHS. Mäori men had an increased prevalence of arthritis, after adjusting for age, compared to men overall. Pacific women and Asian men and women had a significantly lower prevalence of arthritis than overall. European/other women had a slightly higher prevalence of arthritis, mostly due to an increased prevalence of osteoarthritis (Ministry of Health, 2008).
Figure 1.2: Arthritis in adults, by ethnic group & gender (age‐standardised rate ratio)
Source: Ministry of Health (2008:165).

8
Raw prevalence rates for osteoarthritis (i.e. across all age groups) are lower in Mäori than non‐Mäori men and women, which drives the same result for all arthritis (Figure 1.3) – this is due to the younger age distribution of Mäori people. Rates for rheumatoid arthritis are broadly similar by gender across ethnic groups, while ‘other’ arthritis is higher in Mäori men but lower in Mäori women relative to non‐Mäori people. This may be due in part to gout, where known risk factors are ethnicity (Mäori2 or Pacific Islander3) and male gender (Smelser, 2002, cited in Duthie et al, 2004).
Figure 1.3: Raw prevalence rates (%) by type of arthritis, New Zealand 2010
4.6
2.1
5.8
12.7
6.9
2.9 3.6
13.3
4.8 4.7
1.1
10.8 11.6
4.3
2.1
18.0
0
2
4
6
8
10
12
14
16
18
20
Osteoarthritis Rheumatoid arthritis Other arthritis All arthritis
Male Mäori Male Non‐Mäori Female Mäori Female Non‐Mäori
The age distribution of arthritis in the Mäori population is quite different from that of the total population (see Figure 1.4). In the older age groups, arthritis prevalence rates in Mäori people are similar, due to the influence of osteoarthritis, while in the younger age groups, prevalence rates in Mäori people are higher, due to the influence of other types of arthritis such as gout, as noted above, where being Mäori increases risk.
2 Partly due to genetic variations affecting elimination of uric acid contributing to gout (Gibson et al, 1984; Klemp et al, 1997) . 3 The Pacific Island population is a sizeable group in New Zealand with relatively high prevalence of gout and obesity, which is a risk factor for osteoarthritis. Separate consideration of the Pacific Islander population was, however, beyond the scope of this report.

The economic cost of arthritis in New Zealand
9
Figure 1.4: Age‐specific prevalence rates, all arthritis, by ethnicity, New Zealand, 2010
1.7
4.2
6.9
22.4
26.2
36.8
46.5
1.0 2.9
6.0
15.1
26.6
39.7
46.8
0
5
10
15
20
25
30
35
40
45
50
15-24 25-34 35-44 45-54 55-64 65-74 75+
%
Age group
Mäori Non-Mäori
Arthritis is more common in middle aged Mäori men (35 to 64 years) than Mäori women of the same age or relative to the general population of the same age. These data should be interpreted with care, however, due to the smaller number of observations.
Figure 1.5: Age‐specific prevalence rates, Mäori, by gender, New Zealand, 2010
1.1 2.2
9.4
32.2
28.4
36.4
30.9
2.4
6.2 4.9
14.5
24.5
37.7
56.9
0
10
20
30
40
50
60
15-24 25-34 35-44 45-54 55-64 65-74 75+
%
Age group
Male Female
1.2 Baseline prevalence 2010 to 2020
Prevalence rates from the 2006‐07 NZHS were combined with demographic projections of New Zealand’s population by age, gender and ethnicity from 2010 to 2020 (Statistics New Zealand website) to estimate the likely prevalence of arthritis in New Zealand in 2010 and 2020. These

10
estimates account for the ageing of the New Zealand population over the next ten years, but do not include any interventions that may delay or reduce the onset of arthritis (e.g. research breakthroughs, improvement in risk factors) nor any other factors that may increase the prevalence rates of arthritis (e.g. worsening of risk factors). Obesity is an important risk factor for arthritis, and the potential impact on these baseline projections of possible changes in obesity rates was considered in Access Economics (2005a).
Baseline projections are summarised in Table 1.2 below. More detailed prevalence projections are contained in Table 1.4 (2010) and Table 1.5 (2020).
Table 1.2: Baseline prevalence projections 2010 and 2020
2010 2020
Total males 223,956 272,137
Total females 306,411 378,196
Total Mäori 49,973 64,378
Total non‐Mäori 480,396 585,955 Total no. of persons 530,369 650,333
% of 15+ population 15.2% 16.9%
Source: Access Economics. Note: Totals may not sum due to rounding.
In 2010, some 530,369 New Zealanders (15.2%) over the age of 15 are living with at least one type of arthritis. Of these people, an estimated 306,411 (57.8%) are female and 223,956 (42.2%) are male. While arthritis is commonly thought of as an older person’s disease, 54.0% (286,645) of New Zealanders with arthritis in 2010 are of working age (15 to 64), as shown in Figure 1.6.
Figure 1.6: Prevalence (no. of people) by age & gender, New Zealand, 2010
-
10,000
20,000
30,000
40,000
50,000
60,000
70,000
80,000
90,000
15-24 25-34 35-44 45-54 55-64 65-74 75+
Age group
MaleFemale
An estimated 9.4% of people with arthritis are of Mäori descent although Mäori people currently form 15.2% of New Zealand’s population. This anomaly is largely explained by the

The economic cost of arthritis in New Zealand
11
relatively high proportion of younger Mäori people. In fact 35% of Mäori people are aged 0‐14 years, compared to 18% of non‐Mäoris. When the people under 15 are excluded, the differential is much smaller – Mäori people make up 12.5% of the population aged 15 and over. The higher prevalence of arthritis in middle‐aged Mäori males means the difference between share of population and share of arthritis cases is a lot smaller in Mäori males (1.1 percentage point) than total male population (5.2 percentage points).
Table 1.3: Population and arthritis shares, Mäori and non‐Mäori
% Population 15+ % Arthritis 15+ Difference
Male Mäori 6.0% 4.9% ‐1.1 percentage point
Male other 42.5% 37.3% ‐5.2 percentage points
Female Mäori 6.5% 4.5% ‐2.0 percentage points
Female other 44.9% 53.2% 8.3 percentage points Total 100% 100%
All males 48.5% 42.2% ‐6.3 percentage points
All females 51.5% 57.8% 6.3 percentage points
Mäori 12.5% 9.4% ‐3.1 percentage points
Other 87.5% 90.6% 3.1 percentage points
Source: Access Economics
Due to the expected demographic ageing of the New Zealand population over the next ten years, the number of people with arthritis will increase further, as more people move into the older age cohorts where arthritis is more prevalent. By 2020 around 650,333 New Zealanders will have arthritis. This is equivalent to 16.9% of the population ‐ an increase of around 1.6 percentage points from the 15.2% in 2010. By 2050, the number of New Zealanders with arthritis will rise to around 780,000 (Figure 1.7).
Figure 1.7: Projected prevalence 2010 to 2050
-
100,000
200,000
300,000
400,000
500,000
600,000
700,000
800,000
900,000
2010 2020 2050
FemaleMale

12
Table 1.4: Prevalence by age, gender, ethnicity and type of arthritis, 2010
Age All ethnicities Mäori Non‐Mäori All Female Male All Female Male All Female Male
Osteoarthritis
15‐24 ‐ ‐ ‐ ‐ ‐ ‐ ‐ ‐ ‐
25‐34 5.7 4.3 1.4 1.4 1.2 0.2 4.3 3.1 1.2
35‐44 11.0 5.1 5.9 1.1 1.1 ‐ 9.9 4.0 5.9
45‐54 50.4 26.5 23.9 7.7 2.6 5.1 42.7 23.9 18.8
55‐64 73.3 46.4 27.0 5.4 2.8 2.6 67.9 43.6 24.3
65‐74 80.9 50.3 30.6 3.5 1.9 1.7 77.4 48.5 28.9
75+ 83.7 60.0 23.7 1.2 1.2 ‐ 82.4 58.8 23.7 Total 305.1 192.6 112.4 20.4 10.8 9.6 284.7 181.8 102.8 Prevalence 15+ (%) 8.8 10.8 6.7 4.7 4.8 4.6 9.4 11.6 6.9
Rheumatoid arthritis
15‐24 5.3 4.0 1.3 1.1 0.8 0.3 4.3 3.2 1.1
25‐34 7.7 6.3 1.4 1.5 1.5 ‐ 6.2 4.9 1.4
35‐44 12.1 7.1 5.0 1.8 0.9 0.9 10.2 6.2 4.1
45‐54 22.7 16.1 6.6 4.2 2.9 1.4 18.4 13.2 5.2
55‐64 28.7 16.7 12.1 4.1 3.0 1.1 24.6 13.7 10.9
65‐74 25.4 15.2 10.2 1.7 1.3 0.4 23.7 13.9 9.8
75+ 23.6 13.3 10.2 0.7 0.4 0.4 22.8 13.0 9.9 Total 125.4 78.7 46.7 15.1 10.8 4.4 110.3 68.0 42.3 Prevalence 15+ (%) 3.6 4.4 2.8 3.5 4.7 2.1 3.6 4.3 2.9
Other arthritis*
15‐24 1.9 0.9 1.0 0.4 0.2 0.2 1.5 0.7 0.8
25‐34 3.9 2.3 1.6 0.6 0.4 0.2 3.3 1.9 1.4
35‐44 14.4 3.5 10.9 2.6 0.5 2.1 11.9 3.1 8.8
45‐54 23.4 6.9 16.5 6.0 ‐ 6.0 17.4 6.9 10.5
55‐64 26.0 5.9 20.1 2.2 ‐ 2.2 23.8 5.9 17.9
65‐74 17.6 9.2 8.3 1.8 0.7 1.1 15.8 8.5 7.3
75+ 12.7 6.2 6.5 0.9 0.7 0.2 11.7 5.5 6.2 Total 99.9 35.0 64.8 14.4 2.4 12.0 85.4 32.6 52.8 Prevalence 15+ (%) 2.9 2.0 3.8 3.3 1.1 5.8 2.8 2.1 3.6
Arthritis ‐ all forms
15‐24 7.3 5.0 2.3 1.4 1.0 0.4 5.8 4.0 1.8
25‐34 17.3 12.9 4.4 3.4 3.0 0.4 13.9 9.9 3.9
35‐44 37.5 15.8 21.7 5.5 2.5 3.0 32.0 13.2 18.8
45‐54 96.5 49.5 47.0 17.9 5.5 12.4 78.6 44.0 34.6
55‐64 128.1 68.9 59.1 11.8 5.8 6.0 116.3 63.1 53.1
65‐74 123.8 74.8 49.1 7.0 3.9 3.1 116.9 70.9 46.0
75+ 119.9 79.5 40.4 2.9 2.3 0.6 117.0 77.2 39.8 Total 530.4 306.4 224.0 50.0 24.0 26.0 480.4 282.4 198.0 Prevalence 15+ (%) 15.2 17.1 13.3 11.7 10.8 12.7 15.8 18.0 13.3
* ‘Other arthritis’ is derived as a residual. Components may not sum exactly to totals due to rounding.

The economic cost of arthritis in New Zealand
13
Table 1.5: Prevalence by age, gender, ethnicity and type of arthritis, 2020
Age All ethnicities Mäori Non‐Mäori All Female Male All Female Male All Female Male
Osteoarthritis
15‐24 ‐ ‐ ‐ ‐ ‐ ‐ ‐ ‐ ‐
25‐34 6.6 4.9 1.7 1.7 1.4 0.3 4.9 3.5 1.4
35‐44 10.6 4.9 5.7 1.1 1.1 ‐ 9.5 3.8 5.7
45‐54 50.0 26.8 23.2 8.2 2.9 5.4 41.7 23.9 17.8
55‐64 90.0 57.6 32.5 8.2 4.4 3.9 81.8 53.2 28.6
65‐74 115.3 71.8 43.5 5.6 3.0 2.6 109.6 68.7 40.9
75+ 110.1 76.7 33.4 2.3 2.3 ‐ 107.7 74.4 33.4 Total 382.5 242.5 139.9 27.1 15.0 12.1 355.3 227.5 127.8 Prevalence 15+ (%) 9.9 12.3 7.5 5.4 5.8 5.0 10.6 13.3 7.8
Rheumatoid arthritis
15‐24 5.1 3.9 1.2 1.0 0.8 0.3 4.1 3.1 1.0
25‐34 8.8 7.2 1.7 1.8 1.8 ‐ 7.1 5.4 1.7
35‐44 11.6 6.7 4.9 1.7 0.9 0.9 9.8 5.8 4.0
45‐54 22.6 16.2 6.4 4.6 3.2 1.4 18.0 13.1 5.0
55‐64 35.2 20.7 14.5 6.3 4.7 1.6 28.9 16.0 12.9
65‐74 36.1 21.7 14.4 2.7 2.1 0.6 33.4 19.6 13.8
75+ 31.4 17.0 14.4 1.4 0.7 0.7 30.1 16.4 13.7 Total 150.9 93.4 57.5 19.5 14.1 5.5 131.4 79.4 52.1 Prevalence 15+ (%) 3.9 4.7 3.1 3.9 5.4 2.3 3.9 4.6 3.2
Other arthritis*
15‐24 1.8 0.9 0.9 0.4 0.2 0.2 1.5 0.7 0.7
25‐34 4.6 2.6 2.0 0.7 0.4 0.3 3.9 2.2 1.7
35‐44 14.0 3.3 10.6 2.4 0.5 2.0 11.5 2.9 8.7
45‐54 23.0 7.0 15.9 6.3 ‐ 6.3 16.7 7.0 9.7
55‐64 31.5 7.3 24.2 3.3 ‐ 3.3 28.2 7.3 20.9
65‐74 25.0 13.2 11.8 2.8 1.1 1.7 22.2 12.0 10.2
75+ 17.1 8.0 9.1 1.8 1.3 0.4 15.3 6.6 8.7 Total 116.9 42.3 74.7 17.7 3.5 14.2 99.2 38.7 60.5 Prevalence 15+ (%) 3.0 2.1 4.0 3.5 1.4 5.9 3.0 2.3 3.7
Arthritis ‐ all forms
15‐24 7.0 4.8 2.2 1.4 1.0 0.4 5.6 3.8 1.7
25‐34 20.0 14.6 5.4 4.2 3.6 0.6 15.8 11.1 4.8
35‐44 36.1 14.9 21.3 5.2 2.4 2.8 30.9 12.5 18.4
45‐54 95.6 50.0 45.5 19.1 6.0 13.0 76.5 44.0 32.5
55‐64 156.8 85.6 71.2 17.9 9.1 8.8 138.9 76.5 62.4
65‐74 176.4 106.6 69.8 11.2 6.2 4.9 165.2 100.3 64.9
75+ 158.6 101.7 56.8 5.4 4.3 1.1 153.1 97.4 55.7 Total 650.3 378.2 272.1 64.4 32.6 31.8 586.0 345.69 240.4 Prevalence 15+ (%) 16.9 19.2 14.5 12.9 12.6 13.2 17.5 20.2 14.7
* ‘Other arthritis’ is derived as a residual. Components may not sum exactly to totals due to rounding.

14
1.3 Risk factors for arthritis
1.3.1 Obesity
The prevalence projections estimate the number of New Zealanders with arthritis in the future, assuming that prevalence rates remain constant for each age‐gender cohort. While these projections account for expected demographic ageing of the New Zealand population, they do not take into account the effect of any intervention that may delay or reduce the incidence of arthritis. Possible increases in future prevalence rates due to an increased presence of known risk factors are also not taken into account. One known risk factor is obesity.
Like many developed countries, the average body mass index (BMI) of the New Zealand population has grown in recent decades, together with the proportion of the population classified as overweight or obese. The Ministry of Health (2004b) provides an analysis of obesity trends in New Zealand from 1977 to 2003, based on results from four nationally representative health or nutrition surveys undertaken in 1977, 1989, 1997 and 2003.
Figure 1.8 shows that the percentage of the population classified as obese has risen from each survey to the next. In 1977 around 9.4% of men and 10.8% of women were obese, but this doubled to 19.9% of men and 22.1% of women in 2003.
Figure 1.8: Obesity prevalence by gender, 1977 to 2003
9.4 9.8
15
19.9
10.8
12.5
19.4
22.1
0
5
10
15
20
25
1977 1989 1997 2003
% o
bese
Male Female
Source: Ministry of Health (2004b)
The literature shows a quantitative link between obesity and arthritis.
■ The odds ratio of osteoarthritis associated with obesity is in the range of 2 to 4 depending on the site of arthritis. The population‐attributable risk suggests that up to 24% of knee arthritis could be attributed to obesity (Vermont Department of Health, 1999), for example.
■ An Oregon study found that 27% of adults with arthritis are obese whereas among adults without arthritis, only 18% are obese (Oregon Department of Human Services, 2004).

The economic cost of arthritis in New Zealand
15
■ A South Australian study (Gill et al, 2003) also found significant differences between arthritis prevalence in obese and non‐obese populations, utilising annual data from the Health Omnibus Study, 1991‐1998, 2001. The results are shown in Figure 1.9 below; in 2001 the difference was around 12 percentage points.
Figure 1.9: Obesity and arthritis prevalence, South Australia
***
*
05
10152025303540
1993 1994 1995 1996 1997 1998 1999 2000 2001
Year
Prev
elan
ce o
f art
hriti
s (%
)
BMI < 30BMI >= 30
Source: Gill et al (2003).
Access Economics (2005b) estimated that 18.1% of arthritis in males and 17.8% of arthritis in females is attributable to obesity. These percentages are known as the ‘attributable fraction’ for males and females – i.e. the proportion of arthritis due to obesity.
1.3.2 Other risk factors
Other known risk factors for arthritis include age, female gender, lower education and income, physical inactivity, overweight and obesity; other possible risk factors, such as smoking and being divorced, are less well established (Fontaine, 2002). There are also other and sometimes contradictory risk factors for different types of arthritis – for example, rheumatoid arthritis may be associated with being underweight, rather than overweight (Access Economics, 2001). Possibly related is the reduction in overall prevalence of RA reported in Duthie et al (2004) citing Silman (2002), Doran et al (2002) and Collings and Highton (2002). The decline in the incidence of RA over the past 40 years may also be suggestive of a change in exposure to an environmental factor contributing to the aetiology of RA.
Duthie et al (2004) also note evidence for increasing prevalence of gout in New Zealand, which as well as genetic factors mentioned earlier (recall footnote 2) could, at least in part, be explained by demographic ageing and an increase in being overweight.
Gout was significantly more common in Mäori (6.4%) than Europeans (2.9%) and in Mäori men (13.9%) than in European men (5.8%). Comparison with previous studies shows that the prevalence of gout has increased in both Mäori and Europeans, particularly in men. In Mäori men the prevalence of gout has risen from 4.5‐10.4% previously to 13.9%, and in European men from 0.7%‐2.0% previously to 5.8%. Clinical differences included a stronger family history, earlier age at onset, and a higher frequency of tophi and polyarticular gout in Mäori than Europeans. Treatment of gout was inadequate in most cases. Of concern is that

16
the prevalence of gout appears to be on the increase, not only in Mäori but also in Europeans in New Zealand (Klemp et al, 1997).
Higher education and income over time may act to reduce age‐specific prevalence rates to some extent. However, other factors over the longer term are more speculative. For example, new research discoveries may reduce age‐specific incidence rates or delay the onset of arthritis while changes in technology (e.g. pharmacological, surgical) may improve treatments and ameliorate symptoms or even ‘cure’ arthritis. While these possibilities are noted, the high levels of variability surrounding them precludes their impacts from being estimated.

The economic cost of arthritis in New Zealand
17
2 Health sector costs
There are two main methods for estimating direct health system costs.
■ ‘Top‐down’ disease cost data can be derived from central data collection agencies.
■ ‘Bottom‐up’ cost estimates use surveys, diaries and other cross‐sectional or data‐gathering tools to accumulate information from either a single study or multiple sources.
The advantage of the top‐down methodology is that cost estimates for various diseases will be consistent, enhancing comparisons and ensuring that the sum of the parts (health system costs of each disease) does not exceed the whole (total expenditures on health care in New Zealand). The advantage of the bottom‐up methodology is that it can provide greater detail in relation to specific cost elements and the same study can be extended to capture information about indirect cost elements as well as direct cost elements.
In this study, Access Economics has been limited by the lack of comprehensive data of either type in New Zealand.
■ In New Zealand there is not the extensive collection of top‐down disease cost data that is compiled, for example, in Australia by the Australian Institute of Health and Welfare (AIHW) from services utilisation and public and private expenditure such as hospital morbidity data, case mix data, Bettering the Evaluation and Care of Health data, the Australian National Health Survey and other sources (AIHW, 2005).
■ It was not possible to source an existing comprehensive bottom‐up study of cost elements of arthritis in New Zealand, although a variety of different sources exist in relation to certain elements.
Access Economics therefore utilised a process of data‐gathering supplemented by targeted surveying for specific cost items. In the following sections, the sources and methodology in relation to measurement of each cost element are described in detail.
2.1 Hospital costs
In New Zealand, only public inpatient data are collected by the New Zealand Health Information Service (NZHIS). Access Economics thus used a four‐step process to estimate total hospital costs.
1. Through a consultation process with specialist experts in 2005, conditions deemed to be arthritis were identified by category from the International Classification of Disease Tenth Revision (ICD‐10) codes.
2. Public inpatient data were requested from NZHIS for these codes for the year 2003‐04, with costs thus estimated and extrapolated to 2010 based on arthritis prevalence growth and health inflation.
3. Private inpatient costs were estimated based on the ratio of private to public joint replacement surgeries measured by the National Joint Registry.
4. Outpatient costs were estimated based on survey data cross‐checked against relativities from the Australian ratio of outpatient to inpatient costs.

18
2.1.1 ICD‐10 codes for arthritis and NZHIS data
Osteoarthritis is the most common of over 100 known forms of arthritis (see prevalence estimates in Chapter 1), while rheumatoid arthritis, systemic lupus erythematosus (SLE) and gout are also very common. Other forms include fibromyalgia, juvenile arthritis, ankylosing spondylitis, spondyloarthritis, psoriatic arthritis, scleroderma, bursitis, tendonitis, carpel tunnel syndrome, polymyalgia rheumatica, and dermatomyositis.
In consultation with a group of three specialist expert rheumatologists (two from New Zealand and one from Australia) and the New Zealand Health Information Service (NZHIS), a list of conditions deemed to be arthritis were identified by category from the International Classification of Disease Tenth Revision (ICD‐10) codes. In some cases, proportions of each category were allocated as arthritic, in accordance with the clinical experience of the experts. These codes were then allocated as either ‘osteoarthritis’, ‘rheumatoid arthritis’ or ‘other arthritis’. The agreed categorisation is presented in Table 2.1. Access Economics notes that it would be desirable for a widely agreed list of ICD‐10 arthritic conditions to be endorsed at international level, for which the list agreed in this study might provide a useful starting point.
Public inpatient data were purchased from the NZHIS, which provided details of 25,591 admissions where the agreed arthritic codes were one of 20 diagnoses for admission. To avoid overstating or double counting of arthritic conditions, only the primary diagnosis was used in the costing (11,827 admissions). Access Economics notes that these data are rich in the ability to identify co‐morbid conditions.
Data were used where the discharge date was from 1 July 2003 to 30 June 2004, and Access Economics limited the length of stay to 365 days in order to accurately achieve an annual cost estimate. This entailed scaling down the large raw data cost‐weights for six admissions by the extent they were over 365 days.
■ Average length of stay was 5.2 days after scaling down (5.6 days without).
Other information in the data included patient age, gender, ethnicity, cost‐weight and facility type4, among other variables.
■ Data were provided by year of age, which Access Economics grouped as 0‐14, 15‐24, 25‐34, 35‐44, 45‐54, 55‐64, 65‐74, 75‐84 and 85+.
■ Ethnicity was grouped into Mäori (comprising New Zealand Mäori and Cook Islands Mäori, categories 21 and 32) and non‐Mäori (all other categories).
The cost‐weight for each stay is calculated via a complex algorithm which takes account of length of stay as well as other issues related to cost complexity of admissions (District Health Boards of New Zealand, 2003).
■ The cost‐weight multiplier converts the cost‐weight to a dollar amount; in 2003‐04 the multiplier was $2,728.55 for medical/surgical inpatients.
4 While most public inpatient services are provided in public hospitals, some are provided in private hospitals and a very few in facilities classified as health centres.

The economic cost of arthritis in New Zealand
19
Table 2.1: Classification of arthritis, ICD‐10 codes
Code ICD‐10 Descriptor % Arthritic
Osteo‐arthritis
Rheumatoid arthritis
Other arthritis
M00 Pyogenic arthritis 100% ‐ ‐ 100%
M01 Direct infections of joint in infectious and parasitic diseases classified elsewhere
100% ‐ ‐ 100%
M02 Reactive arthropathies 100% ‐ ‐ 100%
M03 Postinfective and reactive arthropathies in diseases classified elsewhere
100% ‐ ‐ 100%
M05 Seropositive rheumatoid arthritis 100% ‐ 100% ‐
M06 Other rheumatoid arthritis 100% ‐ 100% ‐
M07 Psoriatic and enteropathic arthropathies 100% ‐ ‐ 100%
M08 Juvenile arthritis 100% ‐ 30% 70%
M09 Juvenile arthritis in diseases classified elsewhere
100% ‐ ‐ 100%
M10 Gout 100% ‐ ‐ 100%
M11 Other crystal arthropathies 100% ‐ ‐ 100%
M12 Other specific arthropathies 100% ‐ ‐ 100%
M13 Other arthritis 100% 50% ‐ 50%
M14 Arthropathies in other diseases classified elsewhere
100% ‐ ‐ 100%
M15 Polyarthrosis 100% ‐ 50% 50%
M16 Coxarthrosis [arthrosis of hip] 100% 100% ‐ ‐
M17 Gonarthrosis [arthrosis of knee] 100% 100% ‐ ‐
M18 Arthrosis of first carpometacarpal joint 100% 100% ‐ ‐
M19 Other arthrosis 100% 100% ‐ ‐
M30 Polyarteritis nodosa and related conditions
30% ‐ ‐ 30%
M31 Other necrotizing vasculopathies 30% ‐ ‐ 30%
M32 Systemic lupus erythematosus 100% ‐ ‐ 100%
M34 Systemic sclerosis 7.5% ‐ ‐ 7.5%
M35.0 Sicca syndrome [Sjögren] 20% ‐ ‐ 20%
M35.1 Other overlap syndromes 20% ‐ ‐ 20%
M35.3 Polymyalgia rheumatica 100% ‐ ‐ 100%
M45 Ankylosing spondylitis 100% ‐ ‐ 100%
M46 Other inflammatory spondylopathies 100% ‐ ‐ 100%
M47 Spondylosis 100% 80% ‐ 20%
M48.0 Spinal stenosis 100% 80% ‐ 20%
M48.1 Ankylosing hyperostosis [Forestier] 100% 100% ‐ ‐
M49 Spondylopathies in diseases classified elsewhere
100% ‐ ‐ 100%
M65 Synovitis and tenosynovitis 100% ‐ ‐ 100%
M68 Disorders of synovium and tendon in diseases classified elsewhere
100% ‐ ‐ 100%

20
M70.0 Crepitant synovitis (acute) (chronic) of hand and wrist
100% ‐ ‐ 100%
M71.2 Synovial cyst of popliteal space [Baker] 100% ‐ ‐ 100%
M75.0 Adhesive capsulitis of shoulder 100% ‐ ‐ 100%
M76 Enthesopathies, lower limb, excluding foot 100% ‐ ‐ 100%
M77.2 Periarthritis of wrist 100% ‐ ‐ 100%
M77.3 Calcaneal spur 100% ‐ ‐ 100%
M77.5 Other enthesopathy of foot 100% ‐ ‐ 100%
M77.8 Other enthesopathies, not elsewhere classified
100% ‐ ‐ 100%
M77.9 Enthesopathy, unspecified 100% ‐ ‐ 100%
Source: New Zealand Health Information Service and specialist expert consultation.
2.1.2 Public inpatient costs
Table 2.2 summarises the results from the NZHIS public inpatient data.
Table 2.2: Arthritis public inpatient costs by ICD‐10 code, 2003‐04
Code ICD‐10 Descriptor Osteo. $m
Rheum. $m
Other $m
Total $m
% Total
M16 Coxarthrosis [arthrosis of hip] 29.122 ‐ ‐ 29.122 39.8%
M17 Gonarthrosis [arthrosis of knee] 22.949 ‐ ‐ 22.949 31.3%
M00 Pyogenic arthritis5 ‐ ‐ 3.453 3.453 4.7%
M48.0 Spinal stenosis6 2.360 ‐ 0.590 2.950 4.0%
M06 Other rheumatoid arthritis ‐ 2.560 ‐ 2.560 3.5%
M10 Gout ‐ ‐ 2.488 2.488 3.4%
M19 Other arthrosis 2.063 ‐ ‐ 2.063 2.8%
M13 Other arthritis 0.568 ‐ 0.568 1.136 1.6%
M47 Spondylosis 0.869 ‐ 0.217 1.086 1.5%
M65 Synovitis and tenosynovitis ‐ ‐ 1.047 1.047 1.4%
M46 Other inflammatory spondylopathies ‐ ‐ 0.949 0.949 1.3%
M05 Seropositive rheumatoid arthritis ‐ 0.597 ‐ 0.597 0.8%
M35.3 Polymyalgia rheumatica ‐ ‐ 0.411 0.411 0.6%
M31 Other necrotizing vasculopathies ‐ ‐ 0.355 0.355 0.5%
M08 Juvenile arthritis ‐ 0.097 0.226 0.323 0.4%
5 Pyogenic arthritis, also known as infectious or septic arthritis, is a serious infection of the joints characterized by pain, fever, chills, inflammation and swelling in one or more joints, and loss of function in those joints. It is considered a medical emergency because of the damage it causes to bone as well as cartilage, and its potential for creating septic shock, which is a potentially fatal condition. 6 Spinal stenosis is mostly a complication of degenerative arthritis, with narrowing of spaces in the spine (backbone) that results in pressure on the spinal cord and/or nerve roots. Pressure on the lower part of the spinal cord or on nerve roots branching out from that area may give rise to pain or numbness in the legs. Pressure on the upper part of the spinal cord (that is, the neck area) may produce similar symptoms in the shoulders, or sometimes the legs.

The economic cost of arthritis in New Zealand
21
Code ICD‐10 Descriptor Osteo. $m
Rheum. $m
Other $m
Total $m
% Total
M45 Ankylosing spondylitis ‐ ‐ 0.258 0.258 0.4%
M11 Other crystal arthropathies ‐ ‐ 0.223 0.223 0.3%
M32 Systemic lupus erythematosus ‐ ‐ 0.216 0.216 0.3%
M15 Polyarthrosis ‐ 0.085 0.085 0.169 0.2%
M76 Enthesopathies, lower limb, excluding foot
‐ ‐ 0.161 0.161 0.2%
M71.2 Synovial cyst of popliteal space [Baker] ‐ ‐ 0.115 0.115 0.2%
M18 Arthrosis of first carpometacarpal joint 0.114 ‐ ‐ 0.114 0.2%
M75.0 Adhesive capsulitis of shoulder ‐ ‐ 0.113 0.113 0.2%
M12 Other specific arthropathies ‐ ‐ 0.088 0.088 0.1%
M70.0 Crepitant synovitis (acute) (chronic) of hand and wrist
‐ ‐ 0.071 0.071 0.1%
M30 Polyarteritis nodosa and related conditions
‐ ‐ 0.057 0.057 0.1%
M77.9 Enthesopathy, unspecified ‐ ‐ 0.043 0.043 0.1%
M02 Reactive arthropathies ‐ ‐ 0.037 0.037 0.0%
M77.5 Other enthesopathy of foot ‐ ‐ 0.025 0.025 0.0%
M34 Systemic sclerosis ‐ ‐ 0.021 0.021 0.0%
M35.0 Sicca syndrome [Sjögren] ‐ ‐ 0.016 0.016 0.0%
M77.3 Calcaneal spur ‐ ‐ 0.013 0.013 0.0%
M48.1 Ankylosing hyperostosis [Forestier] 0.004 ‐ ‐ 0.004 0.0%
M77.8 Other enthesopathies, not elsewhere classified
‐ ‐ 0.003 0.003 0.0%
TOTAL $m 58.05 3.34 11.85 73.24 100%
% Total 79.3% 4.6% 16.2% 100%
Source: New Zealand Health Information Service special data purchase.
Total public inpatient costs for arthritis in 2003‐04 were $73.24m.
■ Osteoarthritis was responsible for 79.3% of public inpatient costs, rheumatoid arthritis for 4.6% and other arthritis for 16.2% of costs.
■ Osteoarthritis of the hip and knee alone accounted for over 70% of costs.
To extrapolate the $73.24m estimate to 2010, it is multiplied by two factors, totalling 36.4% over the 6½ years.
■ Health cost inflation, estimated at 2.9% per annum or 18.7% in total between 2003‐04 financial year and calendar year 20107; and
■ Growth in prevalence of arthritis of 14.9% between 2003‐04 and 2010 (based on prevalence rates by age, gender and ethnicity multiplied by the population estimates for
7 Health cost inflation data were not provided by NZHIS. Average health cost inflation of 2.9% per annum was thus based on Access Economics (2005a).

22
the respective years). The implicit assumption is that services expanded in line with prevalence.
■ Public inpatient costs are thus estimated to be $99.9m in 2010. Figure 2.1 depicts the shares by major types of arthritis.
Figure 2.1: Public inpatient costs by type of arthritis, 2010 (share of $99.9m)
40%
31%
8%
5%
5%
3%1%
7%OA of hip
OA of knee
Other OA
RA
Pyogenic
Gout
Synovitis & tenosynovitis
Other arthritis
Source: Access Economics based on NZHIS data.
Figure 2.2: Arthritis public inpatient costs by age and gender, $m, 2005
-
2
4
6
8
10
12
14
0-14 15-24 25-34 35-44 45-54 55-64 65-74 75-84 85+
FemalesMales
Figure 2.2 and Table 2.4 present public inpatient data by age and gender for 2010.
■ 53.5% of inpatient costs are for women and 46.5% for men.
■ Over a third of inpatient costs (34.5%) are for people aged over 75 years and nearly another third (31.4%) are for those aged 65‐74 years.

The economic cost of arthritis in New Zealand
23
Table 2.3: Arthritis public inpatient costs by age and gender, $m, 2010
$m % of total Age group Females Males Persons Females Males Persons
0‐14 0.54 0.80 1.34 1.0% 1.7% 1.3%
15‐24 0.51 0.44 0.95 1.0% 0.9% 1.0%
25‐34 0.80 0.71 1.50 1.5% 1.5% 1.5%
35‐44 1.33 1.73 3.07 2.5% 3.7% 3.1%
45‐54 4.20 4.66 8.86 7.8% 10.1% 8.9%
55‐64 9.45 9.10 18.55 17.6% 19.7% 18.6%
65‐74 16.48 14.80 31.29 30.7% 32.1% 31.3%
75‐84 16.07 12.06 28.13 29.9% 26.1% 28.2%
85+ 4.32 1.86 6.19 8.0% 4.0% 6.2%
Total 53.70 46.18 99.88 53.8% 46.2% 100.0%
Table 2.4 presents the public inpatient data by ethnicity and facility.
■ 9.3% of total inpatient costs were for Mäori people and 90.7% for non‐Mäori people (recalling overall prevalence or arthritis for Mäori people was 9.4% of total arthritis prevalence).
■ 93.3% of public inpatient services were performed in public hospitals and 6.7% in private hospitals.
■ The relative shares in public and private hospitals were not significantly different between Mäori and non‐Mäori people.
Table 2.4: Public inpatient costs by ethnicity and facility, $m, 2010
Facility Non‐Mäori Mäori Total % Total
Public hospital ($m) 84.5 8.6 93.1 93.3%
% total 90.7% 9.3% 100.0%
Private hospital ($m) 6.0 0.8 6.8 6.7%
% total 89.8% 10.2% 100.0%
Total ($m) 90.5 9.4 99.9 100.0% % total 90.7% 9.3% 100.0%
Source: NZHIS data. The proportion of inpatients in health centres was negligible.
2.1.3 Private inpatient costs
Estimates of private inpatient costs were based on the ratio of private to public joint replacements from the National Joint Registry, operated by the New Zealand Orthopaedic Association at Christchurch Hospital, which showed 54.8% of joint replacements were performed in public hospitals and 45.2% in private hospitals (Access Economics, 2005a). This triangulated well against the number of public and private hospital beds available in New Zealand (52.4% public and 47.6% private).
The estimate of private inpatient costs for 2010 is thus $82.4m, with the same age, gender ethnicity and type of arthritis splits estimated as for public inpatient costs.

24
Total inpatient costs (public and private) are $182.3m.
To provide triangulation for reality checking, the inpatient data per person in 2005 was compared to similar data for Australia from Access Economics (2005) in Table 2.5.
■ In 2004, inpatient costs in Australia were estimated as A$932.4m which, across the 3.37m Australians with arthritis, resulting in an estimated A$277 inpatient cost per person with arthritis. Converting to 2005 NZ dollars using Australian health cost inflation, demographic growth and purchasing power parity of NZ$1.071=A$1 (OECD, 2005) this was equivalent to NZ$313 per person with arthritis in 2005.
■ The New Zealand estimate of inpatient costs per person with arthritis of NZ$279 per person in 2005 was about 89% of the Australian estimate. This fits well with data that suggest that average hospital inpatient stays in New Zealand are shorter than in Australia. For example, OECD data showed the average length of stay in New Zealand was 85% of that in Australia.
■ The estimate of inpatient cost of arthritis in New Zealand of $182.3m in 2010 thus appears robust.
Table 2.5: Triangulation of inpatient data
NZ 2003‐04 2005
Costs $m 134.5 145.6
Prevalence (people) 521,969Cost/person NZ$ 279
Australia 2004 2005
Inpatient costs A$m 932.4
Prevalence (people) 3,367 Cost/person A$ 277 292Cost/person NZ$ 313
Source: Access Economics.
2.1.4 Outpatient costs
The fourth and final step in estimating hospital costs is estimating outpatient costs, where a combination of survey and triangulated top‐down data was used.
Survey data for outpatients were sought by contacting all the District Health Boards with a brief questionnaire (see Appendix D) in 2005. The DHBs were asked what outpatient services they provided and, for specialist and allied health services, they were asked how many hours of services were provided to people with arthritis who were not inpatients, for their arthritis, and the average cost of these services.
A problem encountered and expressed by DHBs was that they do not code by disease within non‐admitted patient systems so have no way of separating patients with arthritis from those without, while noting that patients with arthritis access their services, particularly in relation to follow‐up from joint replacement surgery. As such only one DHB was able to respond with data estimates, inadequate for statistical use but the return is summarised below for interest.

The economic cost of arthritis in New Zealand
25
■ Specialist medical services, physiotherapy and occupational therapy services were provided as outpatient services for people with arthritis in 2005 through the DHB.
■ For specialist services, 750 outpatient hours were estimated to be provided to treat arthritis at an average cost of $245 per hour.
■ For allied health services, 1,250 physiotherapy hours and 600 occupational therapy hours were provided at an average cost of $60 per hour.
■ The share of beds in this DHB outpatient facility was 0.7% of the total number of beds in New Zealand, with the total estimated as 49,214 beds for 2005 based on modest actual average annual growth rate of 0.5% over the period 1993‐2002 projected to 2003‐2005.
■ A ballpark estimate from these data would imply $25.8m for outpatient specialist services across New Zealand and $15.6m for outpatient allied health services ‐ $41.4m in all.
Greater confidence in an outpatient cost estimate was deemed to be derived by using the ratio of outpatient to inpatient costs from AIHW data, since clinical practice at the tertiary care level is quite similar in New Zealand and Australia. Outpatient costs were thus estimated as 32.0% of inpatient costs or $46.5m in 2005 (Access Economics, 2005a). The average of this and the ballpark estimate of $41.4m above was then taken as the estimate of outpatient costs in New Zealand i.e. $44.0m. Factoring these relative calculations to 2010 provides an estimate of outpatient costs in 2010 of $55.0m.
Altogether hospital costs for arthritis are thus estimated as $237.3m.
Figure 2.3: Hospital costs arthritis, NZ, 2010 ($m and % total of $237.3m)
$99.9 , 42%
$82.4 , 35%
$55.0 , 23%Public inpatients
Private inpatients
Outpatients
2.2 General practice costs
2.2.1 GP services attributable to arthritis
Data were purchased from the Royal New Zealand College of General Practitioners Research Unit, based at the Department of General Practice, University of Otago, in 2005 to estimate the number of GP consultations for people with arthritis, as well as medications prescribed and referrals, for the year 2003.

26
A total of 323,975 consultations (N) with coded diagnoses (read codes) were recorded for all patients in the database in 2003. These consultations represented 131,343 different individuals (58,455 males, 72,842 females and 46 with gender not recorded).
Of the total coded consultations, 8,551 (2.64%) were identified that included at least one Arthritis read code during 2003 (n). This represented 5,047 different individuals (1,851 males and 3,196 females). A matrix of managed conditions in addition to arthritis is presented in Table 2.6. 36% were for arthritis only, while 25.7% were for arthritis and one other condition, 16.6% were for arthritis and two other conditions, and 21.7% were for arthritis and three or more other conditions.
■ The 3,076 ‘arthritis only’ consultations represented 2,335 individuals (865 males and 1,470 females).
■ 5,113 or 59.8% of the 8,551 consultations were estimated to be attributable to arthritis (3,076+2,199/2+1,422/3+1,854/4) – thus 1.58% (5,113/323,975) of all GP consultations in New Zealand were attributable to arthritis (the ‘attributable fraction’).
Table 2.6: Consultations for arthritis, by other problems managed, 2003
Consultations Number % Total
(a) Arthritis only consultation 3,076 36.0%
(b) Arthritis + 1 additional read code 2,199 25.7%
(c) Arthritis + 2 additional read codes 1,422 16.6%
(d) Arthritis + 3 or more additional read codes 1,854 21.7%
(b) + (c) + (d) No. of Arthritis consults with additional read codes 5,475 64.0%
(a) + (b) + (c) + (d) Total No. of Arthritis consults (n) 8,551 100.0%
Source: RNZCGPRU.
Thus RNZCGPRU data provides surprisingly low estimates relative to similar Australian data from Bettering the Evaluation and Care of Health (BEACH), which are nearly four times higher – suggesting 5% of GP visits are due to arthritis. As such, because of coding inconsistencies related to the RNZCGPRU data8 and the relatively small sample size (less than 2%), Access Economics (2005a) adopted an average of the two as the estimate of the attributable fraction – 3.7%.
The NZHS also found that the mean number of GP visits per annum was 4.0 (95% confidence interval 3.8–4.1) and 8 out of 10 people had visited a GP in the past year.
■ This suggested, based on 2005 population data, that overall there would be 16,383,920 GP visits in New Zealand in 2005.
■ Access Economics notes that this is a much lower rate of visiting GPs overall than in Australia, where average visits per annum per capita exceed 5, although this may relate to relatively tighter funding (Malcolm, 2004).
8 The RNZCGPRU database is comprised of raw data as entered at the time of encounter and thus is subject to error due to incomplete field entries by the provider, as they are not required to code and do it of their own accord. RNZCGPRU note that the discrepancy is likely to relate to doctors not consistently coding all managed problems as well as omitting codes for most (80%) of consultations.

The economic cost of arthritis in New Zealand
27
■ On the basis of the NZHS data, 608,260 GP visits in 2005 in New Zealand were estimated as attributable to arthritis.
2.2.2 GP costs
The New Zealand Health Survey (NZHS) contains data on General Practitioner costs, noting:
Overall, the most common charge for the last GP visit was in the range $31 to $40. One in 10 adults (9.3%; with a 95% confidence interval of 8.3% to 10.3%) was not charged for their last GP visit, while one in 20 adults (5.0%; with a 95% confidence interval of 4.4% to 5.7%) was charged more than $50.
These distributional data were used to identify the mean cost of a GP consultation in 2003 as $27.87 (Figure 2.4).
Figure 2.4: Cost of last visit to general practitioner, by gender
Source Ministry of Health (2004a). Aged 15 and over. Age‐standardised.
Thus the 608,260 visits for arthritis at $29.93 per visits implied total arthritis‐related GP costs in 2010 were $18.2m. Extrapolating this to 2010 based on prevalence growth and health cost inflation suggests that total arthritis‐related GP costs in 2010 are $22.8m.
This is lower than would be expected from Australian data but is explainable in relation to:
■ lower unit costs for GP visits in NZ;
■ fewer visits per person overall in NZ;
■ a lower apparent attributable proportion of GP visits in NZ to arthritis relative to other conditions.
That said, the estimate of GP costs it is likely to be conservative, given the small sample size in the RNZCGPRU data.

28
2.3 Pharmaceutical costs
In 2005, pharmaceutical costs for arthritis in NZ were estimated primarily by utilising price and quantity data purchased from IMS Health to estimate total costs for prescribed and over‐the‐counter drugs for arthritis, with a total estimate of $40.5m. Dosages of different types of pharmaceuticals prescribed using the RNZCGPRU data were also presented for comparison in Access Economics (2005a).
2.3.1 Prescription drugs
For this more recent estimate of pharmaceutical costs, data on prescription drugs were sourced from a special data request to PHARMAC in late 2009, supplemented by data available in the public domain. The most commonly prescribed drugs to treat arthritis that PHARMAC funds are summarised in Table 2.7.
Table 2.7 Most commonly prescribed arthritis drugs funded by PHARMAC (2009)
Chemical name Drug cost ex‐GST Dispensings
adalimumab (Humira) $12,537,343 6,619
leflunomide (Arava*) $2,057,279 22,320
diclofenac sodium (Voltaren*) $1,944,310 640,953
etanercept (Enbrel) $1,633,644 881
ibuprofen (Brufen*) $1,369,086 523,202
hydroxychloroquine sulphate (Plaquenil) $702,463 33,056
naproxen sodium (Synflex*) $635,277 102,782
naproxen (Naprosyn*) $604,152 90,797
tenoxicam (Tilcotil) $416,965 41,900
indomethacin (Arthrexin*) $162,461 22,856
penicillamine (D‐Penamine) $69,491 890
sodium aurothiomalate (Myocrisin) $55,373 1,281
ketoprofen (Oruvail) $40,829 5,472
piroxicam (Piram‐D) $26,046 9,969
sulindac (Daclin) $18,155 3,065
tiaprofenic acid (Surgam) $15,171 2,082
auranofin (Ridaura) $11,424 176 Total $22,299,469
Agents shaded in the table are used solely for arthritis (adalimumab, leflunomide, etanercept, penicillamine, sod aurothiomalate, auranofin). Adalimumab spending is probably overstated due to a risk sharing agreement between the sponsor and PHARMAC, which involves rebates paid by the sponsor once Government spending reaches a certain level.
The remaining agents are non‐steroidal anti‐inflammatory drugs (NSAIDs), except hydroxychloroquine, and are used for numerous indications. The manufacturer of ketoprofen believes the majority of prescriptions are for arthritis (personal communication, January 2010).

The economic cost of arthritis in New Zealand
29
NSAIDs
Indomethacin has been discontinued. The (most frequently prescribed) 25mg and 50mg capsules ran out of stock in February/March 2009. 75mg long‐acting tablet and suppositories stocks have not yet been exhausted.
Ketoprofen, sulindac and tiaprofenic acid are partially funded NSAIDs so PHARMAC expenditure only reflects a proportion of expenditure. Patient co‐payments meet the shortfall between subsidy and manufacturer price plus pharmacist mark up. For partly‐subsidised medicines, the final price consumers pay depends on the difference between the subsidy and the manufacturer’s price, and the size of the mark‐up the dispensing pharmacy charges. The ketoprofen difference (between subsidy and manufacturer) was $14.84 for 100mg and $29.68 for 200mg. According to the manufacturer, sales for each strength are approximately equivalent. For Sulindac, the extra amount is $6.68 for 100mg and $13.28 for 200mg, and the manufacturer advised that: ‘40% of volume sold is the 100mg and 60% the 200mg’. Tiaprofenic acid comes in one strength only, 300mg, where the extra amount is $15.23.
Full funding of other NSAIDs (e.g. naproxen and ibuprofen) enabled patients who were taking a particular NSAID for inflammatory arthritis when it was fully funded (i.e. prior to reference pricing) to continue to have access to the product fully funded after reference pricing was implemented.
Aside from PHARMAC spending, patients pay a $3 co‐payment, pharmacists have a dispensing fee, and pharmacists add a mark up for partially funded drugs which the patient pays.
In total, after adjusting down for NSAIDs being used for other purposes, the adalimumab rebate and the depleted indomethacin stock, and adjusting up for copayments for partly‐funded drugs, mark‐ups/dispensing fees, prevalence growth and health inflation to 2010, the total estimate for the cost of drugs in Table 2.7 was $31.4m of which $8.0m is estimated to be out of pocket this year.
Others drugs used to treat arthritis which are PHARMAC funded but are not in Table 2.7 since they represent a smaller market share include : azathioprine, corticosteroids e.g. prednisone, cyclosporine, methotrexate, sulphasalazine and allopurinol. The cost of the most common of these drugs was estimated based on proportionality from Access Economics (2005a:Table C‐1, repeated in Appendix C of this report) as $2.2m in 2010.
Other prescription products used for arthritis which are not reimbursed include the COX‐2 inhibitors and the biologics.
COX‐2s
Cyclooxygenase 2 inhibitors are not listed on the schedule of pharmaceutical benefits. Rofecoxib (Vioxx) and Lumiracoxib (Prexige) have been discontinued. Currently there are two COX‐2 inhibitors prescribed in NZ, celecoxib (Celebrex) and etoricoxib (Arcoxia). Only the cost associated with Celebrex was able to be provided by manufacturers, so the Arcoxia cost was estimated from the Celebrex cost, for a total of $3.7m.

30
Biologics
Etanercept (Enbrel) was first funded in New Zealand in 2004 for children with juvenile chronic (rheumatoid) arthritis. In October 2005, PHARMAC began funding adalimumab (Humira) for last line treatment of severe and active erosive rheumatoid arthritis.
The other biologics used for arthritis (and other autoimmune disorders) in New Zealand are rituximab (MabThera), infliximab (Remicade) and abatacept (Orencia). Expenditure is currently $5.5 million per year, increasing at $1 million every 6 months – 86% for infliximab. These prescription drugs are not listed on the schedule of pharmaceutical benefits and are funded by District Health Boards (DHBs). The utilisation of these other biologics is not uniform across the DHBs leading to varied patient access across the country. It is not known for what other indications the biologics are used, although manufacturers suggested they are most commonly used for gastrointestinal conditions. Adjusting for use due to other indications, the estimated cost in 2010 was $1.55m.
PHARMAC believes manufacturer negotiations will lead to a 35‐40% reduction in net price of biologics, although the period of this reduction was not precisely specified.
Other prescribed agents
Chloroquine (Nivaquine) and meloxicam (Mobic) are not PHARMAC subsidised. Only the cost of meloxicam was able to be provided by manufacturers, so the Chloroquine cost was estimated from the meloxicam cost, for a total of $1.3m.
To see if this list of prescription drugs is exhaustive, and to check if any newer drugs had come onto the market we compared this with Arthritis Australia prescription list and found that all drugs had been covered. Although the estimates do not cover hospital sales, hospital spending on pharmaceuticals is included in the hospital costs.
OTC
To estimate the cost of over‐the‐counter (OTC) pharmaceuticals, we extrapolated the 2005 data from Access Economics (2005a). These include drugs such as paracetamol and aspirin, but may underestimate drugs sold directly from manufacturers to supermarkets or online sales, due to the way that IMS data are collected. OTC costs were thus estimated as $1.65m in 2010.
2.3.2 Summary of pharmaceutical costs
Overall the estimates of all pharmaceuticals for 2010 are summarised in Table 2.8.
The total cost of pharmaceuticals for arthritis was estimated as $41.8m in 2010.
Table 2.8 Most commonly prescribed arthritis drugs funded by PHARMAC (2009)
Chemical name Drug cost ex‐GST
adalimumab (Humira) 13,246,645
diclofenac sodium (Voltaren*) 5,426,061
ibuprofen (Brufen*) 4,199,468

The economic cost of arthritis in New Zealand
31
Chemical name Drug cost ex‐GST
leflunomide (Arava*) 2,285,550
etanercept (Enbrel) 1,726,165
naproxen sodium (Synflex*) 1,211,006
naproxen (Naprosyn*) 1,115,058
hydroxychloroquine sulphate (Plaquenil) 914,422
tenoxicam (Tilcotil) 660,165
ketoprofen (Oruvail) 171,384
piroxicam (Piram‐D) 79,973
penicillamine (D‐Penamine) 77,919
indomethacin (Arthrexin*) 75,745
sodium aurothiomalate (Myocrisin) 65,101
sulindac (Daclin) 53,498
tiaprofenic acid (Surgam) 49,402
auranofin (Ridaura) 12,039
Sub‐total from Table 2.7 31,369,600
Cox‐2s 3,728,184
azathioprine and corticosteroids 2,216,399
OTC 1,651,302
biologics 1,548,760
chloroquine and meloxicam 1,304,605
Sub‐total outside Table 2.7 $10,449,250 Total 41,818,849
Sources: Pharmac, Access Economics (2005a), consultation with DHBs and manufacturers.
2.4 Pathology and diagnostic imaging costs
2.4.1 Pathology
The RNZCGPRU data provided pathology referrals by type for the arthritis‐related consultations and also for these same referrals in the general 2003 patient population.
Of the 3,076 consultations where arthritis was the only managed condition, 414 (13.5%) resulted in a referral for laboratory tests on the same date. This represented a total of 379 different individuals. A total of 8,616 laboratory tests were undertaken for these consultations, representing 132 different types of laboratory test and in a ratio of 2.8 tests per arthritis consultation.
Table 2.9 shows the top 20 laboratory referrals (40% of all referrals) for the arthritis patients relative to the general population. Appendix C (Table C‐2) gives results for all 132 different laboratory tests for which the arthritis patients were referred.

32
Table 2.9: Top 20 laboratory referrals, arthritis relative to total, 2003
Number % Total Lab test type
% Difference in share Arthritis Total (N‐n) % Arthritis % Total (N‐n)
Glycosylated haemoglobin 4.21 366 196 4.25 0.04
Eosinophil antibodies 3.84 343 679 3.98 0.14
Erythrocyte sedimentation rate 3.07 268 216 3.11 0.04
Rheumatoid Factor 2.15 203 1,016 2.36 0.21
Aspartate Aminotransferase 2.14 184 11 2.14 0
Gamma‐glutamyl transpeptidase
2.11 182 8 2.11 0
C‐Reactive Protein 1.93 227 3,402 2.63 0.7
Anti Nuclear Antibodies 0.95 91 526 1.06 0.11
Urea 0.72 216 8,678 2.51 1.79
Globulin 0.69 168 6,102 1.95 1.26
Ferritin 0.67 82 1,377 0.95 0.28
Anti‐dsDNA antibodies 0.51 51 388 0.59 0.08
Mean corpuscular hemoglobin 0.46 256 12,141 2.97 2.51
Mean corpuscular volume 0.46 256 12,141 2.97 2.51
Antinuclear Antibody Test 0.41 39 174 0.45 0.04
Folate 0.37 41 512 0.48 0.11
Leukocytes 0.24 371 19,693 4.31 4.07
Antibody 0.21 20 80 0.23 0.02
antibody test – RNP 0.21 20 79 0.23 0.02
antibody test ‐ SCL‐70 0.21 20 82 0.23 0.02
Source: RNZCGPRU. (Fasting status was returned in the top 20 but deleted as it is an information code rather than a costed service.)
Using the data from RNZCGPRU for the number of arthritis consultations, it was estimated there were 1,703,760 tests in 2005.
The average price for these top 20 referrals was based on telephone calls to a sample of major New Zealand pathology providers. The estimated average price of the tests was $10.84, giving a total cost in 2005 of $18.5m. This was some 50% higher than expectations, but reasonably so since pathology is provided through multiple funding methods by both the public and private sectors, so there can be incentives that increase relative volumes and costs for pathology in New Zealand (France et al, 2003).
Inflating by prevalence and health inflation, the estimate for pathology costs for arthritis in 2010 is thus $23.2m.
2.4.2 Diagnostic imaging
In the RNZCGPRU database, referrals for X‐rays and diagnostic scans (e.g. magnetic resonance imaging) are listed with laboratory referrals in a patient record. Appendix C (Table C‐2) shows that of the arthritis consultations, only one X‐ray referral and six general radiology referrals were given. No referrals for scans were issued. In the general population, 498 radiology

The economic cost of arthritis in New Zealand
33
referrals were given. This was an unexpectedly low result and a possible explanation from RNZCGPRU is that some doctors may not be using electronic methods to record X‐ray and scan referrals. As such, these data were not utilised in the costing – rather, survey data were sought.
Survey data for diagnostic imaging, as with outpatients, were requested from District Health Boards through a brief questionnaire (see Appendix D). The DHBs were asked how many hours they provided diagnostic imaging services to people with arthritis in relation to their arthritis in the most recent year and the average cost per hour of the services. However, as with outpatients, the sample size was inadequately small to be of use, while noting that, of the data received, indications were that X‐ray costs were approximately equivalent to those of bone scans and MRI.
The method thus used to estimate diagnostic imaging costs was based on the relative ratio of imaging to pathology from Australian data (Access Economics, 2005), where imaging costs were derived as 4.2 times the costs of pathology for people with arthritis adjusting for the high pathology estimate. The 2005 cost of $48.5m was then inflated by prevalence and health inflation to 2010.
The estimate for diagnostic imaging in 2010 is thus $60.6m and the cost for pathology and imaging together is $83.7m.
2.5 Research costs
There were no data available on overall expenditure (private and public sector) on health and medical research by disease/condition in New Zealand. The approach adopted in 2005 was thus to:
1. estimate public sector expenditure from data supplied by the Health Research Council of New Zealand (HRC); and
2. estimate private sector expenditure from OECD estimates of NZ relativities.
HRC undertook a search for research projects that it had sponsored based on the search terms:
■ arthritis;
■ arthritic;
■ arthrosis;
■ arthropathy/ies;
■ ankylosing;
■ spondylosis;
■ spondylopathy/ies;
■ synovitis;
■ tenosynovitis;
■ osteoarthritis;
■ rheumatoid;
■ systemic lupus; and

34
■ gout.
A list of the ICD‐10 codes used to define arthritis assisted with the search. Projects were requested to include applied research as well as 'basic' or 'developmental' level research that would also provide primary benefits to people with arthritis – for example, studies of inflammatory processes, or public health/management studies to educate or assist people in the management of their arthritis. Projects identified for the years 2001‐2004 are summarised in Table 2.10, with a total cost of $10.5m over the four years and an average cost of $2.6m.
Table 2.10: HRC Research projects relating to arthritis, 2001‐2004, $
Year Title $
2004 Comparative mapping in human and mouse to characterise the IDDM6 autoimmune disease locus
$1,558,149
2004 Viral virulence and pathogenicity: Multi‐component manipulation of host physiology
$3,290,558
2003 Genetics of Rheumatoid Arthritis and Gout in New Zealand Mäori $102,550
2003 Development of mesenchymal stem cell therapies in a cartilage repair model
$1,381,308
2002 Oxidants, antioxidants and inflammatory diseases $1,922,000
2002 Biomechanical vulnerability of the joint tissues with respect to maturity and degree of degeneration
$396,253
2002 Identification of a novel obesity gene $758,335
2001 Chromosome 18 and susceptibility to autoimmune disease $1,045,624
Total $10,454,778 Average $2,613,694
The HRC‐sponsored research increased from 2001 to 2005, with trend growth illustrated in Figure 2.5.

The economic cost of arthritis in New Zealand
35
Figure 2.5: HRC research projects relating to arthritis, 2001‐2004, $m
y = 2.0088Ln(x) + 1.0177
-
1
2
3
4
5
6
2001 2002 2003 2004 2005
NZ$
mill
ion
Average
Trend
Forecast
Extrapolating trend growth to 2005 provided our estimate of public‐funded research for 2005. The trend growth curve approximates y = 2Ln(x) + 1; for 2005 the estimated public research spending on arthritis was $4.25m. Inflating this to 2010 based on prevalence and health inflation provides an estimate for public arthritis R&D in 2010 of $5.3m.
The private sector research spend estimate was based on proportionality from a 12‐country comparison by the OECD of health R&D in New Zealand and other member countries (OECD, 2004). This study showed the ratio of private health R&D in NZ as 1.33 times public health R&D, with private arthritis R&D in 2005 estimated as $5.67m. Inflating this to 2010 based on prevalence and health inflation provides an estimate for private arthritis R&D of $7.1m, and for total arthritis R&D of $12.4m in 2010. Arthritis New Zealand’s contribution to private sector research on arthritis in the last three years was $696,171.
2.6 Other costs from survey data
As noted above, survey methods and questions are provided at Appendix D.
2.6.1 Specialist costs
As at October 2003, there were an estimated 251,211 people per rheumatologist in New Zealand, lower than published recommendations, international service provision and lower than the level found in a 1999 New Zealand survey (Harrison, 2004). By 2005, this rate equated to (only) 16.3 full time equivalent rheumatologists in the country.
Seven of the ten rheumatologists surveyed responded to the questionnaire regarding hours worked in the non‐hospital sector (to avoid double‐counting with outpatient costs) and costs per hour. Due to the small sample size, for confidentiality reasons these data were not

36
presented. Extrapolating these data to the population, estimated non‐hospital rheumatology costs in 2005 are only $2.8m.
The Medical Council of New Zealand (2005) estimated that there were 230 orthopaedic surgeons in the New Zealand workforce in 2003. However, the New Zealand Orthopaedic Association provided an estimate of 180 orthopaedic surgeons practising in New Zealand in 2005.
Five of the ten orthopaedic surgeons surveyed responded to the questionnaire regarding hours worked in the non‐hospital sector (again to avoid double‐counting with outpatient costs) and costs per hour. As with rheumatologists, due to the small sample size, for confidentiality reasons these data are not presented. Extrapolating these data to the population, non‐hospital orthopaedic surgery costs in 2005 were estimated to be $21.8m.
While other specialists may treat people with arthritis outside of the hospital system, these costs are likely to be very small and were difficult to ascertain, and thus were excluded. Total medical specialist costs for people with arthritis in New Zealand were thus estimated as $24.7m in 2005. Inflating this to 2010 based on prevalence and health inflation provides an estimate for 2010 for specialists of $30.9m in 2010.
While noting that the sample size of 12 specialists is relatively small, the result is 32% higher than the per capita cost of medical specialists in Australia, suggesting a possibly greater reliance on specialists relative to primary care in New Zealand for treating arthritis compared to Australia, and possibly also higher relative unit costs. Alternatively, since arthritis hospital outpatient costs are estimated to be lower in New Zealand than in Australia per person, there may be a different mix of arthritis specialist services provided through outpatient or private facilities in the two countries.
2.6.2 Allied health costs
Allied health is defined in New Zealand as ‘an area of health, such as pharmacy, physiotherapy and occupational therapy, most often based in the community, that does not include doctors and nurses’ (Health Workforce Advisory Committee, 2003).
Allied health professionals who would treat people with arthritis for their arthritis are likely to mainly comprise physiotherapists and occupational therapists. An allowance of 33% of the total was provided for other allied health workers who may work with people with arthritis for their arthritis‐related issues (e.g. social workers, psychologists). There are an estimated 1,300 registered psychologists (NZ Psychologists Board) and over 8,000 social workers (Aotearoa New Zealand Association of Social Workers).
The Physiotherapy Board of New Zealand (2004) noted that over 2,800 annual certificates to practise were distributed in the year 2003. By 2005 the Physiotherapy Board provided a verbal estimate of 2,900 practising physiotherapists.
The New Zealand Occupational Therapy Board website provides a public register of active occupational therapists, of which there were 3,018 listed in May 20059.
9 See http://www.occupationaltherapyboard.org.nz/therapists.php?letter=A

The economic cost of arthritis in New Zealand
37
Four responses were received from physiotherapists and occupational therapists surveyed regarding hours worked in the non‐hospital sector (to avoid double‐counting with outpatient costs) and costs per hour. Due to the small sample size, for confidentiality reasons these data are not presented. Extrapolating these data to the population, allied health costs in 2005 were estimated as $65.0m. This estimate should be treated with caution due to the small sample size. Inflating this to 2010 based on prevalence and health inflation provides an estimate for allied health costs of $81.4m in 2010.
2.6.3 Aged care costs
Survey responses in relation to aged care were inadequate to estimate the aged care cost element of arthritis. Proportionality from Access Economics (2005) was therefore used to estimate this element. The ratio of aged care costs to all other health costs so derived was 16.8%. Applying this to the sum of cost elements above provides an estimate of the aged care costs for people with arthritis in New Zealand in 2005 of $69.7m. Inflating this to 2010 based on prevalence and health inflation provides an estimate for allied health costs of $87.2m in 2010.
It is noted that this is only an approximation since either differences in the institutionalisation of people with arthritis or in relative cost structures for residential care may cause variation.
2.7 Summary of health system costs
A summary of the health system costs derived from the discussion so far in Chapter 2 is provided in Table 2.11 and Figure 2.6.
■ Total ‘allocated’ costs are estimated to be $597.5m in 2010.
■ However, this excludes around 14% costs that are not allocated in recurrent spending – namely, capital expenditures, expenditure on community health, public health programmes, health administration and health aids and appliances. Allowance is made for the unallocated component by factoring up for these costs in the manner adopted by the AIHW (AIHW, 2005) – the factor, based on Australian data and used in Access Economics (2005a) is 100/(100‐14)=16.3%
■ The ‘unallocated’ component, comprising the administrative and other items detailed above, is estimated as $98.8m in 2010 for arthritis.
Total health costs of arthritis for 2010 are thus estimated to be $695m.
■ Hospital costs represent over one third of total costs (34%)
■ Pathology and imaging is estimated to be 12%, while aged care and allied health are also estimated as around 12% each.

38
Table 2.11: Summary of health costs of arthritis, New Zealand, 2010
Health cost element 2010 $m % total Public inpatients $99.9 14.4% Private inpatients $82.4 11.9% Total inpatients $182.3 26.2% Outpatients $55.0 7.9% Total hospital $237.3 34.1% GPs $22.8 3.3% Pharmaceuticals $41.8 6.0% Pathology & imaging $83.73 12.1% Specialists $30.9 4.4% Research $12.42 1.8% Aged care $87.2 12.6% Allied health $81.4 11.7% Sub‐total allocated $597.5 86.0% Unallocated (administrative, capital, public health etc) $97.3 14.0% Total $694.8 100.0%
Figure 2.6: Summary of health costs of arthritis, New Zealand, 2010
26%
8%
3%6%12%
4%2%
13%
12%
14%
Inpatients
Outpatients
GPs
Pharmaceuticals
Pathology & imaging
Specialists
Research
Aged care
Allied health
Unallocated
Figure 2.7 compares the relative shares of different cost items between New Zealand and Australia in 2005 (no Australian comparisons are available in 2010), highlighting less relative expenditure on hospitals, GPs and pharmaceuticals in New Zealand and higher relative expenditure on pathology and imaging, specialists and allied health. Similar trends are apparent in per capita spending for people with arthritis (Figure 2.8).
Per person with arthritis, total health spending in New Zealand was estimated to be 95% of that in Australia.
■ In 2005 health spending was $1,080 per person with arthritis per annum (compared to NZ$1,137 in Australia). This increased to 1,310 per person with arthritis by 2010.

The economic cost of arthritis in New Zealand
39
■ Health spending on arthritis represented 0.39% of GDP in 2005 compared with 0.42% of GDP in Australia).10 By 2010 this share is estimated to fall to 0.37% of GDP.
Figure 2.7: Share of health costs by type of cost, NZ & Australia, 2005 (% total)
0%
5%
10%
15%
20%
25%
30%
Inpa
tient
s
Out
patie
nts
GP
s
Phar
mac
eutic
als
Path
olog
y an
dim
agin
g
Spe
cial
ists
Res
earc
h
Aged
Car
e
Allie
d H
ealth
Una
lloca
ted
New Zealand
Australia
Figure 2.8: Per capita health costs by type of cost, NZ & Australia (NZ$, 2005)
-
50
100
150
200
250
300
350
Inpa
tient
s
Out
patie
nts
GP
s
Phar
mac
eutic
als
Path
olog
y an
dim
agin
g
Spe
cial
ists
Res
earc
h
Aged
Car
e
Allie
d H
ealth
Una
lloca
ted
New Zealand
Australia
10 GDP estimate for NZ based on http://www.treasury.govt.nz/nzefo/2005/selected.asp . For Australia, Access Economics (2005).

40
3 Indirect costs
The World Health Organization and cost of illness studies in the past have typically classed indirect costs as all those costs that are not direct health system costs, the approach adopted here. More recently, the importance of making the economic distinction between real and transfer costs has been recognised.
■ Real costs use up real resources, such as capital or labour, or reduce the economy’s overall capacity to produce goods and services.
■ Transfer payments involve payments from one economic agent to another that do not use up real resources, for example, a disability support pension, or taxation revenue. These payments impact more on the distribution, rather than total level of wellbeing in society.
Transfer costs are important when adopting a whole‐of‐government approach to policy formulation and budgeting. Measurement of indirect costs remains a matter of some debate and controversy. In this report, we estimate two types of indirect costs of arthritis.
■ Financial costs (this section) include lost production from arthritis‐related morbidity and the associated deadweight taxation losses), and other financial costs e.g. carers, aids and home modifications for those disabled.
■ Non‐financial costs (Section 4) derive from loss of healthy life—the pain, premature death and loss of life quality that result from arthritis. These are more difficult to measure, but can be analysed in terms of the years of healthy life lost, both quantitatively and qualitatively, known as the ‘burden of disease’, with an imputed value of a ‘statistical’ life so as to compare these costs with financial costs of arthritis.
3.1 Productivity losses
Access Economics measures the lost earnings and production due to both illness and premature death using a ‘human capital’ approach. The lower end of such estimates includes only the ‘friction’ period until the worker can be replaced, which would be highly dependent on labour market conditions and un(der)employment levels. In an economy operating at near full capacity, as New Zealand is at present, a better estimate includes costs of temporary work absences plus the discounted stream of lifetime earnings lost due to early retirement from the workforce. In this case, it is likely that, in the absence of illness, people with arthritis would participate in the labour force and obtain employment at the same rate as other New Zealanders, and earn the same average weekly earnings. The implicit and probable economic assumption is that the numbers of such people would not be of sufficient magnitude to substantially influence the overall clearing of the labour market, thus making a net addition to the productive capacity of NZ.
3.1.1 Lower workforce participation
Overall, New Zealanders with arthritis are less likely to be employed than those without arthritis. Figure 3.1 shows that rates of employment among people with arthritis are lower than for people of the same age who do not have arthritis. Moreover, for people aged 45‐64, who account for around 42% of all New Zealanders with arthritis, the rate of employment is

The economic cost of arthritis in New Zealand
41
significantly lower. These years also tend to be when people are at their most productive, receiving higher wages.
Figure 3.1: Employment rates by age, New Zealand, 2003
0%
10%
20%
30%
40%
50%
60%
70%
80%
15-44 45-64 65+0%
10%
20%
30%
40%
50%
60%
70%
80%
Emp NZ average
Emp Arthritis
Source: Access Economics based on a special data request from Ministry of Health NZHS.
Arthritis is known to be more prevalent in female, older people and people of Mäori descent. All these groups also tend to have lower levels of workforce participation and employment than the average New Zealand population. For this reason it is necessary to standardise for the differences in age, gender and ethnic background between the two groups. As Figure 3.2 shows, when these compositional differences are accounted for, the overall rate of employment for people with arthritis is 64.2%. This is 4.9% lower than the rest of the New Zealand population at the same time. Assuming that, in the absence of arthritis, these people would obtain employment at the same rate as other New Zealanders, we can attribute the entire 4.9% difference in employment rates to the disabling effects of arthritis.

42
Figure 3.2: Age‐standardised employment rate, NZ, 2003
69.1%
64.2%
55%
57%
59%
61%
63%
65%
67%
69%
71%
Arthritis NZ
In 2005, if 4.9% of people with arthritis were not working due to their arthritis, this would equate to 25,440 people. It is assumed that if they were employed, these people would, on average, earn the same average weekly earnings as other New Zealanders. In March 2005 the average weekly total earnings for a New Zealander was $794.83 (Statistics New Zealand, 2005a,b), including full‐time and part‐time earnings. As Table 3.1 shows, the total value of these lost earnings was estimated as $1,053.6m in 2005. Inflating this estimate by wage growth over 2005 to 2010 from the New Zealand Income Survey11 and by arthritis prevalence growth over 2005 to 2010 gives an estimate of lost earnings due to lower workforce participation in 2010 of $1.476.4m.
Table 3.1: Cost of reduced employment, New Zealand, 2005 and 2010
2005 2010
People not employed due to arthritis 25,440 Average weekly earnings $794.83 Lost earnings due to lower workforce participation $1,053.6m $1,476.4m Lost earnings due to increased absenteeism $17.9 m $25.1 m Total productivity losses $1,071.6 m $1,501.5 m
3.1.2 Temporary work absences
As well as premature workplace separation, some people with arthritis will take temporary leave from work (e.g. for joint replacement surgery) without exiting the workplace entirely. In New Zealand, no data are collected on the level of excess temporary absenteeism resulting from arthritis. Access Economics has previously estimated, based on Australian data, that the cost of reduced earnings due to arthritis‐related absenteeism is around 1.7% of the cost due to reduced workforce participation (Access Economics, 2005). If a similar ratio holds for New
11 http://search.stats.govt.nz/nav/ct2/workincomespending_income/ct1/workincomespending/0

The economic cost of arthritis in New Zealand
43
Zealand, the cost of absenteeism would be $25.1 million in 2010, and total productivity losses due to arthritis will be over $1.50 billion.
3.1.3 Taxation revenue forgone
People with arthritis who work less or retire early not only forgo income, but also pay less personal income tax. To the extent that people with lower incomes also consume a smaller set of goods and services, indirect taxes levied on consumption will also fall. While these effects would best be calculated in the context of a general equilibrium model of the economy, a partial equilibrium estimate was obtained using average tax rates in Access Economics (2005a) as follows.
Personal income tax forgone is estimated as a product of the average personal income tax rate (22%, from the Access Economics macroeconomic model) and the forgone earnings. With arthritis and lower income, there will be less consumption of goods and services, estimated up to the level of the disability pension ($193.17 per week is used, the average of single and each member of a couple’s maximum adult invalid benefit rate per week, with rates from 1 April 2005 obtained from www.workandincome.govt.nz). Without arthritis, it is conservatively assumed that consumption would comprise 90% of income (the savings rate may well be lower than this). The indirect tax forgone is estimated as a product of the forgone consumption and the average indirect tax rate, proxied as the current rate of GST in New Zealand, 12.5%. This estimate of taxation forgone is conservative since the average tax rate of people with arthritis may be less than the average tax rate of people across Australia, since more of them may work part time and their average incomes (and hence marginal tax rates) may thus be lower.
Table 3.2 shows that the potential tax revenue forgone in 2010, due to people with arthritis working less or leaving the workforce, is $330.3 million. Of this $253.7 million (76.8%) is forgone personal income tax and the remaining $76.6 million (23.2%) is forgone indirect tax.
Lost taxation revenue is not in itself a real economic cost, but a transfer payment. Taxation payments transfer income from individual members of society to the Government who then transfers it again to other members of the community through the welfare system and government services. However, in reality these transfers are not costless to orchestrate. For example, administration of a taxation system has costs. In Australia, a comparison of the total amounts spent and revenue raised in 2000‐01, relative to the Commonwealth department running costs, suggests that administration costs account for 1.25% of each taxation dollar raised (Access Economics, 2005).
Even greater costs are incurred due to the distortionary impact that taxation has on workers’ work and consumption choices. Work by the Australian Productivity Commission (2003, p6.15‐6.16 with rationale) found the efficiency cost (or deadweight loss – DWL) associated with these distortions amounts to 27.5% of each tax dollar. In New Zealand, studies by Diewert and Lawrence (1994, 1995, 1996) found that in 1991 the deadweight loss associated with personal income tax was 18% and for consumption taxes around 14%. They also noted that the DWLs associated with labour taxation increased from 5% to over 18% in the 20 years up to 1991.
In this report, we use the 18% for the estimate of the deadweight losses, noting that that it may be a conservative estimate in view of another study (McKeown and Woodfield, 1995) based on 1988 data that generated estimates ranging from 24.6% to 146.2% of taxes raised. Neither estimate includes possible DWLs from the taxation of income earned on capital

44
(appropriate in this application), or administration and compliance costs (unfortunate in this application). The use of 18% balances the upside risk that the DWLs have continued to increase since 1991 against the downside risk that tax raised from non‐labour sources has lower associated DWLs.
Table 3.2 shows that the DWL associated with the additional taxation required is $77.4m in 2010.
Table 3.2: Cost of forgone taxation, New Zealand, 2010
Average personal income tax rate 22.0%Potential personal income tax lost $330.3mAverage indirect tax rate 12.5%Potential indirect tax lost $99.8mTotal lost tax revenue $430.1mDeadweight loss from additional taxation 18.0%DWL from additional taxation $77.4m
3.2 Informal and formal community care
A significant number of people with arthritis will receive informal care from family and friends as either a substitute for or complement to care provided through the formal health sector. However estimates of the health sector costs set out in the previous chapter include only the resources utilised by the formal sector to provide assistance to New Zealanders for their arthritis. As informal care is unpaid it is sometimes also thought of as free. However, the time devoted by a carer is time they cannot use for other activities such as paid employment or leisure activities.
It is noted that, as with the approach to production losses, this analysis is partial (rather than a general equilibrium approach) and that an implicit principle is that the economy is operating at full capacity (and therefore carer tasks are a net resource cost). In this context, there are several possible methods for valuing the time forgone by caregivers including:
■ opportunity cost: the value of wages forgone;
■ replacement valuation: the cost of buying a similar amount of services from the formal care sector; and
■ self‐valuation: what carers themselves feel they should be paid.
Due to the lack of information about the demographic characteristics of carers of New Zealanders with arthritis, Access Economics has first estimated the replacement valuation and from this derived an estimate of the opportunity cost valuation approach, noting that replacement valuation will always give higher results than the other two methods.
3.2.1 Hours of community care provided
In New Zealand, as in other countries, there are few robust data on the need and use of carers, by people with arthritis for their arthritis. The NZHS asked people whether they had reduced time spent, or had difficulty with regular daily activities as a result of their physical health.

The economic cost of arthritis in New Zealand
45
Daily activities could include work, housekeeping and looking after a child or other person. Responses of people with arthritis are set out in Table 3.3.
Table 3.3: Effect of physical health on daily activities, New Zealand, 2003
Type of arthritis Reduced time spent on activities (%)
Had difficulty performing activities (%)
Rheumatoid arthritis 32.1 46.5 Osteoarthritis 32.2 44.9 Gout 26.1 27.9 Other arthritis 32.7 37.9
All arthritis 29.8 41.3
Source: Special data request from the MoH 2003 NZHS.
A Dutch study of rheumatoid arthritis patients (Brouwer et al, 2004) found approximately 50% of patients received some level of informal care from their partner. These informal care‐givers spent, on average, 27.4 hours per week providing care, comprising around 15 hours per week on household tasks such as shopping, cleaning and other household chores and 12.4 hours per week assisting the patient with the activities of daily living (ADL). Informal care was supplemented with formal assistance with household tasks in 24% of cases (around 13% of all patients) for an average of 4.5 hours per week and for ADL in 3.9% of cases (2.0% of all patients) for an average of 2.5 hours per week. In addition, 6.1% of patients receiving informal care were on a waiting list for formal care.
Using the relative need for assistance for different types of arthritis from the NZHS together with the Dutch study results, it is possible to estimate the value of formal and informal care provided to New Zealanders with arthritis in 2005. To be conservative the estimate of average time spent by informal care‐givers each week is limited to hours spent providing personal care, not household chores. On this basis a total of 1.5m hours of formal care and 113.9m hours of informal care was estimated to be provided to New Zealanders with some form of arthritis in 2005.
3.2.2 Value of care
The hours of care (both formal and informal) are valued at the average hourly cost of employing a person to work as a carer, including a loading for employee on‐costs, administration and capital overheads. Access Economics estimates the hourly cost for a worker in Australia is A$25.01 per hour in June 2005, or NZ$26.78 converting at purchasing power parity (PPP) of 1.0708. This includes allowances for on‐costs such as superannuation, and administrative and capital overheads. A brief internet search appears to suggest that this a similar unit cost applies in New Zealand (see, for example, www.domestic.co.nz). At this unit cost, the total value of care provided was estimated as $3.60 billion in 2005. Inflating this estimate by wage growth over 2005 to 2010 (as per productivity losses) and by arthritis prevalence growth over 2005 to 2010 gives an estimate of $5.04 billion in 2010. Of this, over 98.9% ($4.99 billion) is the replacement value of informal care and the remaining $55 million formal care provision, as set out in Table 3.4.
While it is quite legitimate to use the replacement valuation estimate for formal community costs, for informal costs a (preferable) opportunity cost estimate is made by multiplying the

46
value of care by the average employment rate (in this case the 15% employment rate for those aged over 65). The alternative opportunity cost measure is thus much lower (than $5.04 billion) at $752m in 2010.
Table 3.4: Value of care provided to people with arthritis, New Zealand, 2005, 2010
Rheumatoid arthritis
Osteo-arthritis
Other arthritis
All forms of arthritis,
2005
All forms of arthritis,
2010
Average hours per week Formal 3.5 3.4 2.9 3.1 Informal 12.4 12.0 10.1 11.0
% of people receiving care Formal 2.0 1.9 1.6 1.6 Informal 50.0 48.3 40.8 44.4
Total hours of care per year (million) Formal 0.4 0.9 0.2 1.5 Informal 32.2 80.5 15.9 133.9 Total 32.6 81.4 16.1 134.5
$ value of care Formal 10 24 5 40 Informal 863 2,156 427 3,562 Total (replacement) 872 2,180 431 3,602 5,045Total (opportunity) 536.7 752.1
Note: Components may not sum to totals due to rounding and the existence of people with arthritis of unknown type (see Chapter 1).
3.3 Other indirect costs
3.3.1 Deadweight losses from welfare payments
Duthie et al (2004) highlighted the 2001 New Zealand Disability Survey that collected data on arthritis as a cause of disability (Statistics New Zealand, 2002). This study found that arthritis was the main condition causing disability for 14% of the disabled population. In 2004 the NZ Department of Social Policy provided Invalid Benefits worth $976.1 million and Sickness Benefits worth $469.5 million (Ministry of Social Development, 2004). If arthritis accounts for 14% of these payments, the total welfare support to people due to arthritis was $202.4 million in 2003‐04.
Without further information on the number of people with arthritis that do receive a benefit, the type, their financial and living arrangements and age, it is not possible to accurately project the amount of welfare payments that will be made to them this year. From 1996 to 2002 the number of recipients of invalid benefits whose most serious condition was a musculoskeletal complaint increased 97% or 13.8% per annum from 4,703 in 1996 to 9,274 in 2003. Over the same time the number of recipients of sickness benefit with a musculoskeletal condition increased 53%, although some of this rise may be attributable to coding changes in the mid 1990s (Ministry of Social Development, 2005). To remain conservative, in Access Economics (2005a) we merely inflated the 2003‐04 estimate by 2.8% for expected inflation to June 2005.

The economic cost of arthritis in New Zealand
47
On this basis, the total value of arthritis‐related disability pensions in 2005 was estimated to be $208.1 million.
Recalling that invalid and sickness benefits are transfers, not real costs, they should not be included in the estimation of total costs. As with taxation forgone, welfare payments do, however, have associated real DWLs due to the distortions they impose on production patterns and the need to fund the administration of the welfare system. As in Section 3.1.3, these are estimated as 18% of the value of the transfers, so the total deadweight losses from welfare payments in 2005 was estimated to be $37.4m.
Inflating this estimate by wage growth over 2005 to 2010 (as per productivity losses) and by arthritis prevalence growth over 2005 to 2010 gives an estimate of $52.4m in 2010.
3.3.2 Aids, modifications and travel
There are also the costs of mobility aids, modifications to the homes of people with arthritis, travel to health services and other indirect costs of arthritis. There is a paucity of data on these costs, while noting that there is an allowance for medical aids and equipment in the scale‐up factor for non‐allocated health costs described in Section 2.7.
Walsh and Chappell (1999) conducted a survey on behalf of the Australian Department of Family and Community Services of 409 recipients of disability support pension who had a musculoskeletal impairment. The study estimated the additional expenditure of these people on personal care, home help, and other aids and appliances. Based on these data, Access Economics (2005) estimates the cost of formal (paid) community carers for Australian arthritis sufferers in 2004, and the costs of aids, modifications and travel associated with their condition. The ratio (1.164) of these latter costs to the formal care ($40m from Table 3.4) is used to derive an estimate here of the cost of aids, modifications and travel of $46.8m for New Zealanders with arthritis in 2005.
Inflating this estimate by wage growth over 2005 to 2010 (as per productivity losses) and by arthritis prevalence growth over 2005 to 2010 gives an estimate of $65.6m in 2010.
3.4 Summary of the financial costs of arthritis
The total real financial costs of arthritis are thus estimated to be $3.20bn in 2010, summarised in Table 3.5 and Figure 3.3.
■ Lost earnings are the largest cost item at $1.50bn (47% of the total).
■ Informal sector care (measure on an opportunity cost basis) is second largest at 23% ($752m).
■ Hospitals represent 7% of total costs, while residential age care is 3% and other health costs 12% of total costs.
■ Community care and aids, modifications and travel are each around 2% of total costs at $55m and $66m respectively.
■ The deadweight costs of welfare and taxation transfers comprise the remaining 4% ($130m).
■ Indirect costs outweigh direct health costs around 3.6 to 1.

48
■ Annual costs per person with arthritis are $6,032, $731 for every New Zealander and 1.7% of GDP in total.
Table 3.5: Arthritis, financial cost summary, 2010, $m
Cost element Real cost Transfer payment
Allocated health costs $597.52
Hospitals $237.26
Aged Care $87.24
Other allocated health $273.02
Unallocated health costs $97.27
Total health costs $694.79
Indirect financial costs
Lost earnings (people with arthritis) 1,501.45
Tax forgone (people with arthritis) 77.42 430.10
Opportunity cost of informal carers 752.06
Welfare payments 52.41 291.60
Aids, modifications and travel 65.58
Formal community care 55.49
Sub‐total indirect financial 2,504.40
Total financial costs 3,199.19 721.70
Per person with arthritis $6,032 $1,361
Per capita (population) $731 $165
% GDP 1.69% 0.38%
Figure 3.3: Arthritis, financial cost summary, 2010, % total
7%3%
12%
2%
4%
47%
23%
2%Hospitals
Aged care
Other health costs
Community care
Transfer DWLs
Lost income
Informal care
Aids, modifications and travel
Note: Components may not sum to totals due to rounding.

The economic cost of arthritis in New Zealand
49
Access Economics’ findings regarding New Zealand cost shares for arthritis concord well with the Australian results (Access Economics, 2005), noting that:
■ Only the value of paid carers was included in the Australian study, so overall the estimated cost in New Zealand is higher (1.6% of GDP at that time, compared to 1.4% in Australia), as it also includes a valuation of informal care.

50
4 Burden of disease
The term ‘burden of disease’ refers to the impact of pain, suffering, disability and premature death resulting from disease and injury.
4.1 Suffering and premature death methodology
4.1.1 Valuing life and health
Since Schelling’s (1968) discussion of the economics of life saving, the economic literature has properly focused on willingness to pay (willingness to accept) measures of mortality and morbidity risk. Using evidence of market trade‐offs between risk and money, including numerous labour market and other studies (such as installing smoke detectors, wearing seatbelts or bike helmets etc), economists have developed estimates of the value of a ‘statistical’ life (VSL).
The willingness to pay approach estimates the value of life in terms of the amounts that individuals are prepared to pay to reduce risks to their lives. It uses stated or revealed preferences to ascertain the value people place on reducing risk to life and reflects the value of intangible elements such as quality of life, health and leisure. While it overcomes the theoretical difficulties of the human capital approach, it involves more empirical difficulties in measurement (BTE, 2000, pp20‐21).
Viscusi and Aldy (2002) summarise the extensive literature in this field, most of which has used econometric analysis to value mortality risk and the ‘hedonic wage’ by estimating compensating differentials for on‐the‐job risk exposure in labour markets, in other words, determining what dollar amount would be accepted by an individual to induce him/her to increase the possibility of death or morbidity by x%. They find the VSL ranges between US$4 million and US$9 million with a median of US$7 million (in year 2000 US dollars), similar but marginally higher than the VSL derived from US product and housing markets, and also marginally higher than non‐US studies, although all in the same order of magnitude. They also review a parallel literature on the implicit value of the risk of non‐fatal injuries.
A particular life may be regarded as priceless, yet relatively low implicit values may be assigned to life because of the distinction between identified and anonymous (or ‘statistical’) lives. When a ‘value of life’ estimate is derived, it is not any particular person’s life that is valued, but that of an unknown or statistical individual (Bureau of Transport and Regional Economics, 2002, p19).
Weaknesses in this approach, as with human capital, are that there can be substantial variation between individuals. Extraneous influences in labour markets such as imperfect information, income/wealth or power asymmetries can cause difficulty in correctly perceiving the risk or in negotiating an acceptably higher wage.

The economic cost of arthritis in New Zealand
51
Viscusi and Aldy (2002) do not include any New Zealand studies in their meta‐analysis (if they exist) but do include two Australian studies, notably Kniesner and Leeth (1991) and Miller et al (1997).
In our own review of international VSL studies (Access Economics, 2008), the average VSL from New Zealand studies was A$7 million, with a range of A$1.1‐21.4 million (all in 2006 prices)12. This report uses the mean figure of A$7 million to estimate the value of the loss of wellbeing from dementia in New Zealand. This figure is converted to NZ$ using purchasing power parity between New Zealand and Australia for 2006 (NZ$1.08 = A$1)13 and then inflated to 2010$NZ using New Zealand inflation data (2010 change from 2006 = 12.1%).
Based on this calculation (A2006$7 million × 1.08 × 1.121), the estimated VSL for New Zealand for 2010 is NZ$8.5m. This VSL estimate is in line with that of other eminent researchers (Nordhaus, 1999; Murphy and Topel, 1999; Cutler and Richardson, 1998).14 The estimate is substantially higher than the conservative estimate used in Access Economics (2005a) of NZ$3.9m in 2005 – the low end of the range NZ$3.9 million to NZ$10.1m. Rather it is quite close to the mid‐range estimate of NZ$6.9m from the 2005 study, inflated to 2010 prices. However, while this estimate reflects the New Zealand literature available to this point, due to the small number of New Zealand studies, the uncertainty surrounding this parameter and its large impact on costs, we use a more conservative estimate in the modelling (see Section 4.1.3).
4.1.2 DALYs and QALYs
In an attempt to overcome some of the issues in relation to placing a dollar value on a human life, in the last decade an alternative approach to valuing human life has been derived. The approach is non‐financial, where pain, suffering and premature mortality are measured in terms of Disability Adjusted Life Years (DALYs), with 0 representing a year of perfect health and 1 representing death (the converse of a QALY or ‘quality‐adjusted life year’ where 1 represents perfect health). This approach was developed by the World Health Organization (WHO), the World Bank and Harvard University and provides a comprehensive assessment of mortality and disability from diseases, injuries and risk factors in 1990, projected to 2020 (Murray and Lopez, 1996). Methods and data sources are detailed further in Murray et al (2001).
The DALY approach has been adopted and applied in Australia by the Australian Institute for Health and Welfare (AIHW) with a separate comprehensive application in Victoria. Mathers et al (1999) from the AIHW estimate the burden of disease and injury in 1996, including separate identification of premature mortality (YLL) and morbidity (YLD) components. In any year, the disability weight of a disease (for example, 0.18 for a broken wrist) reflects a relative health state. In this example, 0.18 would represent losing 18% of a year of healthy life because of the inflicted injury.
12 The New Zealand studies are reported in Guria et al (1999); Hansen and Scuffham (1995); Leung and Guria (2006); Miller (2000); and Miller and Guria (1991). 13 OECD, http://www.oecd.org/dataoecd/61/56/39653523.xls (accessed: 10 June 2008) 14 Comparisons are provided in Access Economics (2003).

52
Martin Tobias and the New Zealand Burden of Disease Study (NZBDS) team utilised the global and Australian studies to estimate the burden of disease for New Zealand (Ministry of Health, 2001). Estimates of YLL, YLD and DALYs for over 100 conditions in nine age groups for both genders and two major ethnic groups (Mäori and non‐Mäori) are provided for the year 1996.
The DALY approach has been successful in avoiding the subjectivity of individual valuation and is capable of overcoming the problem of comparability between individuals and between nations, although nations have subsequently adopted variations in weighting systems.
The main problem with the DALY approach is that it is not financial and is thus not directly comparable with most other cost measures. In public policy making, therefore, there is always the temptation to re‐apply a financial measure conversion to ascertain the cost of an injury or fatality or the value of a preventive health intervention. Such financial conversions tend to utilise ‘willingness to pay’ or risk‐based labour market studies described above.
4.1.3 Discount rate
Choosing an appropriate discount rate for present valuations in cost analysis is a subject of some debate, and can vary depending on which future income or cost stream is being considered. There is a substantial body of literature, which often provides conflicting advice, on the appropriate mechanism by which costs should be discounted over time, properly taking into account risks, inflation, positive time preference and expected productivity gains.
The absolute minimum option that one can adopt in discounting future income and costs is to set future values in current day dollar terms on the basis of a risk free assessment about the future (that is, assume the future flows are similar to the near‐certain flows attaching to a long term Government bond).
Wages should be assumed to grow in dollar terms according to best estimates for inflation and productivity growth. In selecting discount rates for New Zealand projects, we have settled upon the following as the preferred approach.
■ Positive time preference: We use the long term nominal bond rate of 6.0% pa (from recent history in trading of NZ Government 10 year bonds) as the parameter for this aspect of the discount rate. (If there were no positive time preference, people would be indifferent between having something now or a long way off in the future, so this applies to all flows of goods and services.)
■ Inflation: The Reserve Bank of New Zealand has an agreement with the New Zealand government to pursue monetary policy that delivers 1% to 3% inflation on average over the medium term. Over the past few years inflation has consistently remained in the top half of this band, and is expected to remain above 2.5% until 2008 (New Zealand Treasury, 2005) and so we use an assumption of 2.2% pa for this variable. (It is important to allow for inflation in order to derive a real, rather than nominal, rate.)
■ Productivity growth: The New Zealand Treasury expects labour productivity growth of around 2% per annum in the year to March 2007, before returning to its long‐term trend of around 1.5% per annum (New Zealand Treasury, 2005). For New Zealand based disease costing, this estimate of 1.5% will be used. By way of comparison, in Australia the Commonwealth Government's Intergenerational report assumed productivity

The economic cost of arthritis in New Zealand
53
growth of 1.7% in the decade to 2010 and 1.75% thereafter. Access Economics uses 1.75% for disease costing in Australia.
There are then two different discount rates that should be applied:
■ To discount income streams of future earnings, the discount rate is:
6.0 ‐ 2.2 ‐ 1.5 = 2.3%.
■ To discount other future streams (healthy life, health services, legal costs, accommodation services and so on) the discount rate is:
6.0 – 2.2 = 3.8%
While there may be sensible debate about whether health services (or other costs with a high labour component in their costs) should also deduct productivity growth from their discount rate, we argue that these costs grow in real terms over time significantly as a result of other factors such as new technologies and improved quality, and we could reasonably expect this to continue in the future.
Annualising the VSL of NZ$8.5 million using the discount rate of 3.8% over an average 40 years expected life span (the average from the meta‐analysis of wage‐risk studies) provides an estimate of the value of a life year (VLY) of $415,569. However, because of the uncertainty of this figure and its large impact on costs, an alternative estimate is provided by converting the ‘official’ Australian estimate the VLY of A$151,000 from 2007 from the Australian Department of Finance and Deregulation15 into 2010 NZ dollars. This provides a lower estimate for the VLY of NZ$177,683 in 2010. The lower estimate is used in the costing to retain conservatism. It is slightly lower than the VLY estimate used in our 2005 report, reflecting the switch to use of a government estimate.
4.2 Estimating the burden of disease for arthritis in 2005
The burden of disease for 2005 was based on the burden estimated by the Ministry of Health (2001) for 1996, inflated on the basis of the growth in arthritis prevalence over the period 1996 to 2005. The Ministry of Health reported selective statistics from the 1996 study, including that:
■ Osteoarthritis has the 6th largest disability burden (YLD) in New Zealand;
■ Musculoskeletal disease has five times the average disability:mortality (YLD:YLL) ratio and represents 3% of total DALYs, of which osteoarthritis accounts for two thirds; and
■ Severe rheumatoid arthritis has the second highest disability weight in the NZBDS – 0.94, equal with severe dementia and just behind terminal phase AIDS (0.95).
YLLs and YLDs were only reported for osteoarthritis (by gender) and for all musculoskeletal disease (by gender and by age). Total DALYs for osteoarthritis, rheumatoid arthritis and all musculoskeletal conditions were reported by gender and by ethnicity (Mäori/non‐Mäori). Unfortunately, it was not possible to obtain from the Ministry for Health a detailed breakdown of YLLs and YLDs by age, gender, ethnicity and type of arthritis.
15 http://www.finance.gov.au/obpr/cost‐benefit‐analysis.html ‐ see Best Practice Regulation Guidance Note: Value of statistical life PDF version.

54
Access Economics (2005), based on input from rheumatologists and the relative prevalence of conditions, estimated that around 51% of the burden of disease from musculoskeletal disease, other than osteoarthritis or rheumatoid arthritis, could be attributed to other forms of arthritis. We apply the same percentage here to estimate the pain and suffering associated with other forms of arthritis. The estimates are factored up to 2010 based on prevalence growth in arthritis between 2005 and 2010.
The total burden of disease for all forms of arthritis in 2010 is estimated as 21,491 DALYs.
Table 4.1: Burden of disease, DALYs by type of arthritis, New Zealand, 2010
DALYs Male Female Mäori Non‐Mäori Persons
Rheumatoid arthritis 958 2,238 357 2,838 3,195
Osteoarthritis 6,004 9,136 1,200 13,939 15,140
Other arthritis 1,143 2,013 315 2,841 3,156
Total arthritis 8,105 13,386 1,873 19,619 21,491
As Table 4.1 and Figure 4.1 show, the majority of the burden of disease (70% or 15,140 DALYs in 2010) is accounted for by osteoarthritis, the most common form of arthritis. Rheumatoid arthritis accounts for another 3,195 DALYs or 15% of total DALYs from arthritis.
Figure 4.1: Burden of disease by type of arthritis, NZ, 2010 (% 21,491 DALYs)
70%
15%
15%
Osteoarthritis
Rheumatoid arthritis
Other arthritis
The majority of the burden of disease (63%, Figure 4.2) is borne by women, as would be expected from the higher prevalence of arthritis amongst females.

The economic cost of arthritis in New Zealand
55
Figure 4.2: Burden of disease by gender and ethnicity, NZ, 2010 (% 21,491 DALYs)
57%
34%
6%3%
Non‐Mäori female
Non‐Mäori male
Mäori female
Mäori male
It is also possible from the NZBDS data, while now quite old, to make comparisons with other disease categories, such as cardiovascular disease, cancer, injury, diabetes, asthma. In 1996 over 13% of the burden of disease in New Zealand was due to ischaemic heart disease. The next largest cause was stroke, responsible for 5.3% of all DALYs lost. Arthritis represents about 2.8% of the total burden of disease, more than breast cancer or dementia (Figure 4.3).
Figure 4.3: Comparison of burden of disease, New Zealand, 1996
0% 1% 2% 3% 4% 5% 6%
StrokeCOPD
DiabetesDepression
AsthmaAll musculoskeletal
Anxiety disordersLung cancer
Road traffic injuryColorectal cancer
All arthritisDementia
Breast CancerSucide/self harm
LRTIOsteoarthritis
Hearing disordersProstate cancerSubstance use
Peripheral vasc.Lymphoma
Rheumatoid arthritis
DALYs as a % of total DALYs
Note: COPD = chronic obstructive pulmonary disease; LRTI = lower respiratory tract infection.
4.3 Valuing the burden of disease
Multiplying the burden of disease in DALYs (21,491) as derived in the preceding section by the value of a life year (VLY) from Section 4.1.3 of $177,683 provides a monetary measure of the

56
disability and premature mortality burden of arthritis. The cost of disability and premature death from arthritis is estimated as $3.8 billion in 2010.
In Access Economics (2005a) it was necessary to net out from this total the costs specific to arthritis that are borne by the individual. However, this time, this step is not required since the plug‐in VLY is already a net estimate.

The economic cost of arthritis in New Zealand
57
References
Access Economics (2008) The health of nations: the value of a statistical life, Report for the Office of the Australian Safety and Compensation Council, Canberra, January.
Access Economics (2007) Painful realities: the economic impact of arthritis in Australia in 2007, Report for Arthritis Australia, Canberra, July.
Access Economics (2005) Arthritis – the bottom line: The economic impact of arthritis in Australia, Report for Arthritis Australia, Canberra, January.
Access Economics (2005a) The economic cost of arthritis in New Zealand, Report for Arthritis New Zealand, Canberra, June.
Access Economics (2003) Exceptional returns: the value of investing in health R&D in Australia, Prepared for the Australian Society for Medical Research, September.
Access Economics (2001) The Prevalence, Cost and Disease Burden of Arthritis in Australia, Report for Arthritis Australia, March 2001.
Australian Bureau of Statistics (2002) National Health Survey 2001, Summary of Results Cat No. 4364.0, Canberra, 25 October.
Australian Institute of Health and Welfare (2005) Health system expenditure on disease and injury in Australia, 2000‐01: second edition, AIHW Cat No HWE 28, Health and Welfare Expenditure Series No. 21, Canberra, April.
Australian Institute for Health and Welfare (2004) Health expenditure Australia 2002‐03, Cat. No HWE 27, Canberra, September.
Benitez‐Silva H, Buchinsky M, Chan HM, Cheidvasser S, Rust R (2000) How Large is the Bias is Self‐Reported Disability? BER Working Paper No. w7526, National Bureau for Economic Research, February.
Brouwer W, van Exel N, et al (2004) ‘Burden of Caregiving: Evidence of Objective Burden, Subjective Burden, and Quality of Life Impacts on Informal Caregivers of Patients with Rheumatoid Arthritis’ Arthritis Care & Research 51(4):p570‐577.
Bureau of Transport and Regional Economics (2002) Rail Accident Costs in Australia, Report 108, Commonwealth of Australia, Canberra.
Bureau of Transport Economics (2000) Road Crash Costs in Australia, Bureau of Transport Economics, Report 102, Canberra.
Collings S and Highton J (2002) ‘Changing patterns of hospital admissions for patients with rheumatic diseases’ New Zealand Medical Journal, 115(1150):131‐132.
Colmar Brunton (2003) Understanding the needs of people with arthritis, Prepared for Arthritis New Zealand, Wellington.

58
Cutler DM and Richardson E (1998) The Value of Health: 1970‐1990, JCPR Working Paper 28, prepared for the AEA session on ‘What we get for health care spending’ downloadable from www.jcpr.org/wpfiles/value.pdf
Department of Health and Ageing (2003) Returns on investment in public health: An epidemiological and economic analysis, Report to the Australian Department of Health and Ageing by Applied Economics.
Diewert WE and DA Lawrence (1996) ‘The Deadweight Costs of Taxation’, Canadian Journal of Economics 29:S658‐S673.
Diewert WE and DA Lawrence (1995) ‘The Excess Burden of Taxation in New Zealand’, Agenda 2(1):27‐34.
Diewert WE and DA Lawrence (1994) The Marginal Costs of Taxation in New Zealand, Report, Report prepared by Swan Consultants (Canberra) Pty Ltd for the New Zealand Business Round Table.
District Health Boards of New Zealand (2003) WIES8C Methodology and Casemix Purchase Unit Allocation recommended for the 2003/2004 Financial Year: Frozen Specification for implementation on NMDS, SFG Cost Weights Project Group, District Health Boards of New Zealand and New Zealand Health Information Service, 12 March 2003, downloaded from www.nzhis.govt.nz/documentation/wies/index.html
Doran MF, Pond GR, Crowson CS, O’Fallon WM, Gabriel SE (2002) ‘Trends in incidence and mortality in rheumatoid arthritis in Rochester, Minnesota, over a 40‐year period’ Arthritis and rheumatism 46(3):625‐31.
Duthie J, Fahmy P, Halstead M, Highton R, Kandath D, Rogers J, Sizemore K (2004) Assessing the burden of arthritis in New Zealand: a feasibility study, Trainee Intern Health Care Evaluation Project, Department of Preventive and Social Medicine, Otago Medical School, January.
Fontaine K (2002) ‘Prevalence of Arthritis: Summary’ Journal of Rheumatology 29: pp1981‐1988.
France NC, Francis GA, Lawrence SR (2003) ‘The costs of New Zealand pathology’ Health Policy May;64(2):131‐41
Gibson T, Waterworth R, Harfield P, et al (1984) ‘Hyperuricaemia, gout and kidney function in New Zealand Maori men.’ Br J Rheumatol 23:276–82.
Gill T, Taylor A, Chittleborough C, Dal Grande E (2003) ‘Is there a relationship between obesity and chronic conditions? Using surveillance data over a 10‐year period’ Population Research and Outcomes Studies Unit, South Australian Department of Human Services, Adelaide, see www.dh.sa.gov.au/pehs/PROS/obesity‐chron‐cond03.ppt
Guria J, Jones–Lee M, Loomes G (1999) The Value of Statistical Life and Injuries: Willingness to Pay/ Accept, Land Transport Safety Authority, Wellington.

The economic cost of arthritis in New Zealand
59
Hansen P, Scuffham PA (1995) ‘The cost‐effectiveness of compulsory bicycle helmets in New Zealand’ Australian Journal of Public Health, 19: 450–454.
Harrison A (2004) ‘Provision of rheumatology services in New Zealand’ The New Zealand Medical Journal 117(1192)
Health Workforce Advisory Committee (2003) The New Zealand Health Workforce Future Directions – Recommendations to the Minister of Health 2003, Wellington, August available on http://www.hwac.govt.nz
Klemp P, Stansfield SA, Castle B, Robertson MC (1997) ‘Gout is on the increase in New Zealand’ Annals of the rheumatic diseases 56:22‐26.
Kniesner TJ and Leeth JD (1991) ‘Compensating wage differentials for fatal injury risk in Australia, Japan and the United States’ Journal of Risk and Uncertainty 4(1), 75‐90.
Leung J, Guria J (2006) ‘Value of statistical life: Adults versus children’ Accident Analysis and Prevention, 38: 1208‐1217.
Malcolm LA (2004) ‘How general practice is funded in New Zealand’ Medical Journal of Australia; 181 (2): 106‐107
Mathers C, Vos T, Stevenson C (1999) The burden of disease and injury in Australia, AIHW, Cat No PHE 17, Canberra.
McKeown PC and Woodfield AE (1995) ‘The welfare cost of taxation in New Zealand following major welfare reforms’ New Zealand Economic Papers Vol 29(1):41‐62.
McNee W (2005) ‘Checks and balances the main priority for Pharmac’ New Zealand Herald, 7 March.
Medical Council of New Zealand (2005) The New Zealand Medical Workforce in 2003, Workforce analysis 17 May, available at http://www.mcnz.org.nz/portals/1/publications/workforce_2003%20.pdf
Miller P, Mulvey C, Norris K (1997) ‘Compensating differentials for risk of death in Australia’ Economic Record 73(223), 363‐372.
Miller TR (2000) ‘Variations between Countries in Values of Statistical Life’ Journal of Transport Economics and Policy, 34:169‐188.
Miller TR, Guria J (1991) The Value of Statistical Life in New Zealand, Market Research on Road Safety. Land Transport Division, Ministry of Transport, Wellington.
Ministry of Health (2008) A Portrait of Health: Key results of the 2006‐07 New Zealand Health Survey, Wellington, June.
Ministry of Health (2004a) A Portrait of Health: Key results of the 2002/03 New Zealand Health Survey, Public Health Intelligence Occasional Bulletin No 21, Wellington, August.

60
Ministry of Health (2004b) Tracking the Obesity Epidemic: New Zealand 1977‐2003, Public Health Intelligence Occasional Bulletin No 24, Wellington, December.
Ministry of Health (2001) The burden of disease and injury in New Zealand, Public Health Occasional Bulletin No 1, Wellington.
Ministry of Social Development (2005) Growth in numbers of Sickness and Invalids Benefit recipients 1993‐2003 – Cohort Analysis Technical Report, May.
Ministry of Social Development (2004) Annual Report 2003‐04, June.
Murphy KM and Topel R (1999) The Economic Value of Medical Research, University of Chicago Business School.
Murray C & Lopez A (1996) The Global Burden of Disease: a comprehensive assessment of mortality & disability from diseases, injuries & risk factors in 1990 & projected to 2020, Volume 1, Global Burden of Disease & Injury Series, Harvard: Harvard School of Public Health.
Murray C, Lopez A, Mathers C, Stein C (2001) The Global Burden of Disease 2000 Project: aims, methods and data sources, Discussion Policy Paper No. 36, WHO, November.
New Zealand Treasury (2005) Budget Economic and Fiscal Update 2005, Wellington, May.
Nordhaus W (1999) The Health of Nations: The Contribution of Improved Health to Living Standards, research papers presented at a conference sponsored by Lasker/Funding First, December, Department of Economics, Yale University, downloaded 2 April 2003 from www.laskerfoundation.org/reports/pdf/healthofnations.pdf
Oregon Department of Human Services (2004) Arthritis in Oregon, 2002 Data Report, DHS Health Services Health Promotion & Chronic Disease Prevention Programme, July, see www.dhs.state.or.us/publichealth/arthritis/rpt2002/rpt2002.pdf
Organization for Economic Cooperation and Development (2005) OECD Factbook 2005: Economic, Environmental and Social Statistics – Prices, downloadable from the ‘Tables: Purchasing Power Parities’ link from http://juno.sourceoecd.org/vl=1147930/cl=37/nw=1/rpsv/factbook/04‐02‐02.htm
Organization for Economic Cooperation and Development (2004) OECD Health Data 2004 3rd edition, September, Online version is downloadable from http://www.oecd.org/document/16/0,2340,en_2649_34629_2085200_1_1_1_1,00.html
Physiotherapy Board of New Zealand (2004) Annual Report 2003, August.
Productivity Commission (2003) ‘Evaluation of the Pharmaceutical Industry Investment Program’ Research Report, AusInfo, Canberra.
Schelling TC (1968) ‘The life you save may be your own’ in SB Chase (ed) Problems in public expenditure and analysis, Brookings Institution, Washington DC, p127‐162.

The economic cost of arthritis in New Zealand
61
Silman AJ (2002) ‘The changing face of rheumatoid arthritis: Why the decline in incidence?’ Arthritis and rheumatism 46(3):579‐81.
Smelser CD, Stoffey RD, Gentili A (2002) ‘Gout’ Emedicine Journal, available from www.emedicine.com/radio/topic313.htm.
Statistics New Zealand (2005a) Quarterly Employment Survey (March 2005 Quarter), Wellington, 6 May.
Statistics New Zealand (2005b) Household Labour Force Survey (March 2005 Quarter), Wellington, 12 May.
Statistics New Zealand (2004a) National Population Estimates (June 2004 quarter), Wellington, 28 July.
Statistics New Zealand (2004b) Mäori Population Estimates (at 30 June 2004), Wellington, see http://www.stats.govt.nz/tables/Mäori‐popn‐est‐tables.htm
Statistics New Zealand (2004c) National Population Projections (2004(base) ‐ 2051), Wellington, 16 December.
Statistics New Zealand (2003) National Mäori Population Projections (2001(base) ‐ 2021), Wellington, 15 May.
Statistics New Zealand (2002) Disability counts, 2001, Wellington.
Taylor W, Smeets L, Hall J, McPherson K (2004) ‘The burden of rheumatic disorders in general practice: consultation rates for rheumatic disease and the relationship to age, ethnicity, and small‐area deprivation’ New Zealand Medical Journal, 117(1203).
Vermont Department of Health (1999) ‘Chronic disease in Vermont: Arthritis’ Disease Control Bulletin, Vol 1:3, available on www.state.vt.us/health/_hs/epidemiology/arthritis/arthritis1.htm
Viscusi and Aldy (2002) ‘The value of a statistical life: a critical review of market estimates throughout the world’ Discussion Paper No. 392, Harvard Law School, Cambridge MA, November, downloadable from www.law.harvard.edu/programs/olin_center/
Viscusi WK (1993) ‘The value of risks to life and health’ Journal of Economic Literature, 13:1912‐46.
Walsh J and Chappell P (1999) Cost of Disability Survey Stages 2 and 3 ‐ Demonstration of Relationship: Severity of Disability v Cost, Department of Family and Community Services, AGPS, Canberra.

62
Appendix A: NZHS prevalence data Table A.1: NZ prevalence of all arthritis, OA and RA, by age & gender, 2006‐07
15-24 25-34 35-44 45-54 55-64 65-74 75+ Total
Men 0.7 (0.2 - 1.6 (0.8 - 7.4 (5.4 - 15.7 (12.4 - 25.0 (21.5 - 32.4 (28.2 - 37.5 (32.9 13.0 (12.2 Women 1.6 (0.6 - 4.5 (2.6 - 4.9 (3.4 - 15.7 (12.9 - 28.1 (25.0 - 46.2 (42.3 - 53.7 (49.1 16.3 (15.4
Total 1.1 (0.6 - 3.1 (2.1 - 6.1 (4.8 - 15.7 (13.4 - 26.6 (24.4 - 39.5 (36.7 - 46.8 (43.2 14.8 (14.2
Men N/A 0.5 (0.1 - 2.0 (1.2 - 8.0 (5.7 - 11.4 (8.5 - 20.2 (16.6 - 22.0 (18.0 6.5 (5.7 - Women 0.0 (0.0 - 1.5 (0.7 - 1.6 (0.9 - 8.4 (6.3 - 18.9 (16.2 - 31.1 (27.0 - 40.5 (36.0 10.1 (9.3 -
Total 0.0 (0.0 - 1.0 (0.5 - 1.8 (1.2 - 8.2 (6.6 - 15.2 (13.3 - 25.8 (23.3 - 32.6 (29.4 8.4 (7.9 -
Men 0.4 (0.0 - 0.5 (0.1 - 1.7 (0.8 - 2.2 (1.1 - 5.1 (3.5 - 6.7 (4.4 - 9.5 (6.7 - 2.7 (2.2 - Women 1.3 (0.5 - 2.2 (1.2 - 2.2 (1.1 - 5.1 (3.4 - 6.8 (4.7 - 9.4 (6.5 - 9.0 (6.5 - 4.3 (3.6 -
Total 0.8 (0.4 - 1.4 (0.8 - 1.9 (1.2 - 3.7 (2.6 - 6.0 (4.5 - 8.1 (6.2 - 9.2 (7.3 - 3.5 (3.1 -
Has ever been diagnosed with rheumatoid arthritis
Has ever been diagnosed with arthritis
Has ever been diagnosed with osteoarthritis
Source: http://www.moh.govt.nz/moh.nsf/pagesmh/7601/$File/arthritis‐ch3.pdf and associated spreadsheets.
Table A.2: NZ prevalence of all arthritis, OA and RA, by gender & race, 2006‐07
Maori Non- Pacific Non- Asian Non-
Men 13.8 (11.1 - 10.7 (9.9 - 9.4 (6.1 - 10.9 (10.1 - 6.3 (4.4 - 11.2 (10.4 - Women 13.6 (11.8 - 13.1 (12.1 - 10.3 (7.8 - 13.3 (12.4 - 10.1 (7.5 - 13.5 (12.5 -
Total 13.7 (12.0 - 11.9 (11.4 - 9.9 (7.9 - 12.1 (11.6 - 8.3 (6.7 - 12.4 (11.8 -
Men 6.4 (3.9 - 5.3 (4.6 - 2.3 (0.9 - 5.4 (4.7 - 1.0 (0.5 - 5.5 (4.9 - Women 6.6 (5.3 - 7.8 (7.1 - 3.9 (2.2 - 7.9 (7.2 - 4.8 (2.8 - 8.0 (7.3 -
Total 6.5 (5.0 - 6.6 (6.2 - 3.2 (1.9 - 6.7 (6.3 - 3.0 (1.9 - 6.8 (6.4 -
Men 2.6 (1.5 - 2.2 (1.8 - 2.5 (1.0 - 2.3 (1.8 - 2.1 (0.9 - 2.3 (1.8 - Women 4.7 (3.4 - 3.6 (3.0 - 3.3 (1.4 - 3.7 (3.1 - 3.4 (1.9 - 3.8 (3.1 -
Total 3.7 (2.8 - 2.9 (2.5 - 2.9 (1.6 - 3.0 (2.6 - 2.8 (1.7 - 3.1 (2.6 -
Has ever been diagnosed with arthritis
Has ever been diagnosed with osteoarthritis
Has ever been diagnosed with rheumatoid arthritis
Source: http://www.moh.govt.nz/moh.nsf/pagesmh/7601/$File/arthritis‐ch3.pdf and associated spreadsheets.

The economic cost of arthritis in New Zealand
63
Appendix B: Survey questions from the NZHS
Source: http://www.moh.govt.nz/moh.nsf/pagesmh/7683/$File/nzhs‐adult‐questionnaire‐may08.pdf. Note the child questionnaire is at: http://www.moh.govt.nz/moh.nsf/pagesmh/7683/$File/nzhs‐child‐questionnaire‐may08.pdf, but does not include questions on arthritis due to low prevalence in children.

64
Appendix C: – RNZCGPRU pharmaceutical and pathology data
Table C.1 presents the number of prescriptions and average daily dose for arthritis consultations and the corresponding number of prescriptions and average daily dose of these drugs in the general population, from the RNZCGPRU data purchase. Table C.2 presents the number of laboratory referrals for arthritis consultations and the corresponding number of referrals for these tests in the general population.
Table C.1: Prescriptions, arthritis consultations vs total population
Number % Total Average daily dose
Drug name Arthritis Total (N‐n) % Arthritis
% Total (N‐n) Arthritis
Total (N‐n)
Acitretin 1 0 0.02 0.00 25mg alendronate 11 535 0.27 0.17 10mg 39mg Alfacalcidol 1 7 0.02 0.00 0.25mg Alginic Acid 3 200 0.07 0.06 3000mg 2250mg Allopurinol 21 1791 0.51 0.58 240mg 208mg Amiloride with Hydrochlorothiazide 13 582 0.32 0.19 5mg 6.6mg amiodarone 4 340 0.10 0.11 200mg 190mg Amitriptyline 66 2234 1.61 0.72 30mg 28mg Amlodipine 1 93 0.02 0.03 8mg Amoxycillin 25 24861 0.61 8.03 1966mg 1652mg Apomorphine 1 21 0.02 0.01 2.25mg aqueous cream 15 1662 0.37 0.54 topical topical Ascorbic Acid 3 85 0.07 0.03 400mg 207mg Aspirin 83 7994 2.03 2.58 336mg 174mg Atenolol 21 2917 0.51 0.94 67mg 65mg Atorvastatin 15 2263 0.37 0.73 27mg 26mg Azatadine Maleate 1 45 0.02 0.01 1mg 1.5mg Azathioprine 5 74 0.12 0.02 95mg 113mg Baclofen 2 50 0.05 0.02 120mg 39mg Beclomethasone Dipropionate 18 3229 0.44 1.04 260mcg 322mcg Bendrofluazide 40 4692 0.98 1.52 3mg 2.7mg Benztropine Mesylate 2 40 0.05 0.01 2.7mg Betahistine 1 54 0.02 0.02 16mg 19mg Betamethasone 14 1474 0.34 0.48 Bezafibrate 13 1535 0.32 0.50 400mg 402mg Bisacodyl 1 196 0.02 0.06 10mg 9.3mg Budesonide 18 3506 0.44 1.13 420mcg 460mcg Bumetanide 1 106 0.02 0.03 1mg 1.2mg Calcipotriol 1 218 0.02 0.07 Calcitriol 28 447 0.68 0.14 0.4mcg 0.5mcg Calcium Carbonate 61 1458 1.49 0.47 1.8g 1.8g Calcium Lactate‐Gluconate 5 229 0.12 0.07 1g 1mg Candesartan 6 770 0.15 0.25 11mg 24mg Capsaicin 1 14 0.02 0.00 Captopril 1 45 0.02 0.01 70.5mg Carbamazepine 4 387 0.10 0.12 400mg 500mg Cefaclor Monohydrate 3 2012 0.07 0.65 1000mg 952mg celecoxib 87 769 2.13 0.25 213mg 222mg Celiprolol 15 887 0.37 0.29 250mg 305mg Cetirizine Hydrochloride 5 1313 0.12 0.42 10mg 10mg Chloramphenicol 5 2839 0.12 0.92 3000mg chlordiazepoxide 2 0.05 0.00 chloroquine 1 7 0.02 0.00 400mg 400mg Chlorpheniramine Maleate 1 1849 0.02 0.60 11mg

The economic cost of arthritis in New Zealand
65
Number % Total Average daily dose
Drug name Arthritis Total (N‐n) % Arthritis
% Total (N‐n) Arthritis
Total (N‐n)
Ciclopiroxolamine 2 251 0.05 0.08 Cilazapril 54 6994 1.32 2.26 4mg 3.3mg Cimetidine 1 3 0.02 0.00 800mg ciprofloxacin 1 117 0.02 0.04 1000mg 1020mg Citalopram 11 1469 0.27 0.47 23mg 25mg Clindamycin Phosphate 1 218 0.02 0.07 Clobetasol 7 871 0.17 0.28 Clonazepam 13 691 0.32 0.22 1.5mg 1.6mg clonidine 5 182 0.12 0.06 133mcg 69mcg clotrimazole 6 1192 0.15 0.38 40mg 231mg codeine 53 1312 1.29 0.42 93mg 98.5mg Colchicine 10 446 0.24 0.14 1.35mg 1145mcg Colecalciferol 4 149 0.10 0.05 1.25mg 1.25mg Co‐Trimoxazole 6 2720 0.15 0.88 2400mg 2500mg Cyclizine Hydrochloride 1 15 0.02 0.00 150mg 144mg Cyclopenthiazide 11 453 0.27 0.15 0.5mg 0.5mg cyclosporin 5 35 0.12 0.01 112mg Cyproheptadine Hydrochloride 1 39 0.02 0.01 8mg 8mg Dexamethasone 7 1995 0.17 0.64 27.5mg Dextropropoxyphene wp* 141 3130 3.44 1.01 420mg 429mg Diazepam 13 1192 0.32 0.38 8mg 8.6mg diclofenac sodium 392 10198 9.58 3.29 139mg 140.5mg Dicloxacillin 1 49 0.02 0.02 2000mg 1548mg diethylpropion 1 91 0.02 0.03 77mg Diflucortolone Valerate 3 165 0.07 0.05 150mg Digoxin 4 1043 0.10 0.34 125mcg 158mcg Dihydrocodeine Tartrate 25 381 0.61 0.12 152mg 150mg Diltiazem 19 1896 0.46 0.61 237mg 195mg Diphenoxylate Hydrochloride wp* 2 119 0.05 0.04 4mg Dipyridamole 4 381 0.10 0.12 300mg 286mg disodium etidronate 1 47 0.02 0.02 400mg 400mg Docusate Sodium 7 840 0.17 0.27 50mg 164mg Domperidone 3 162 0.07 0.05 47mg 32mg donepezil 1 15 0.02 0.00 5mg 9mg Dothiepin Hydrochloride 13 429 0.32 0.14 71mg 63mg Doxazosin Mesylate 11 1472 0.27 0.48 2.25mg 4mg doxepin Hydrochloride 9 749 0.22 0.24 15mg 42mg doxycycline Hydrochloride 10 4751 0.24 1.53 117mg 130mg ear drops 1 120 0.02 0.04 Eformoterol fumarate 6 932 0.15 0.30 24mcg 15.7mcg Emulsifying Ointment BP 1 426 0.02 0.14 enalapril 3 615 0.07 0.20 20mg 12.9mg Erythromycin Ethyl Succinate 2 3568 0.05 1.15 1600mg 1455mg Ethinyloestradiol 11 1692 0.27 0.55 258mcg 37mcg Ethynodiol Diacetate 3 798 0.07 0.26 500mcg 512mcg Etidronate Disodium 37 1049 0.90 0.34 400mg 400mg etofenamate 3 39 0.07 0.01 etoricoxib 36 323 0.88 0.10 82.5mg 92mg eye drops 4 49 0.10 0.02 Famotidine 5 199 0.12 0.06 80mg 41mg Felodipine 28 3265 0.68 1.05 5.3mg 6mg FERROUS sulphate 9 929 0.22 0.30 313mg
Fexofenadine 1 84 0.02 0.03 120mg 117mg
flucloxacillin 8 4592 0.20 1.48 1429mg 3536mg Fluconazole 1 34 0.02 0.01 50mg 135mg
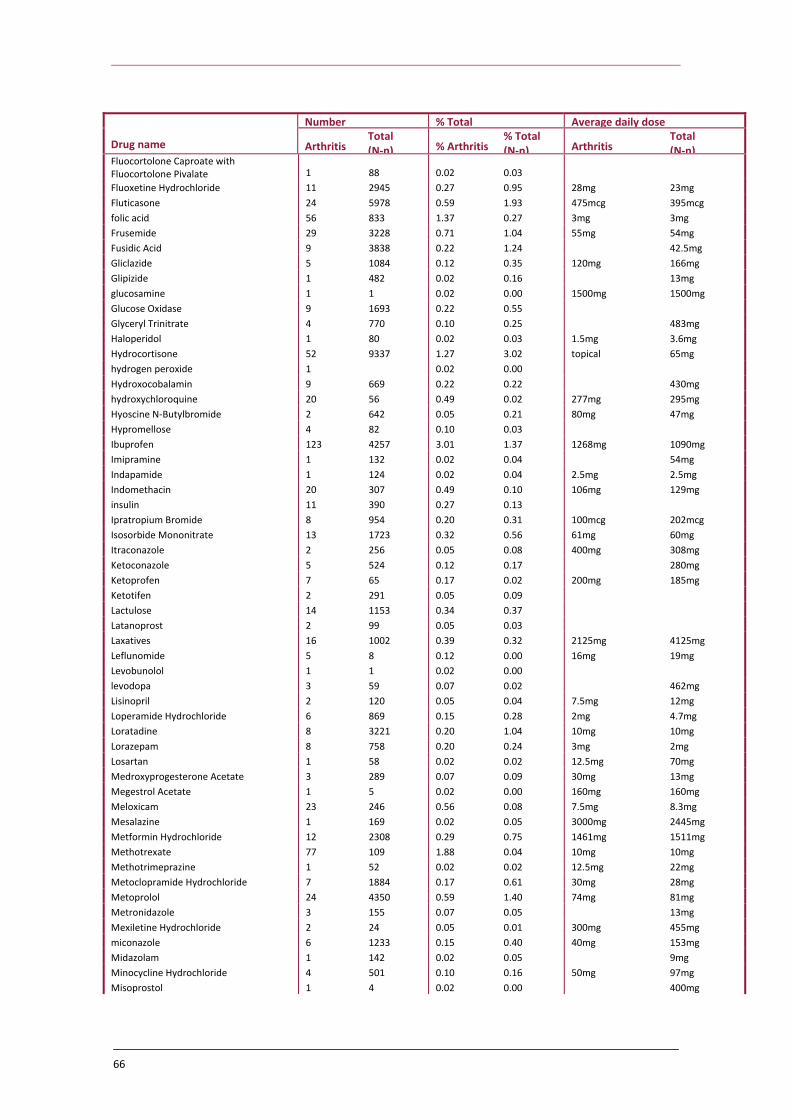
66
Number % Total Average daily dose
Drug name Arthritis Total (N‐n) % Arthritis
% Total (N‐n) Arthritis
Total (N‐n)
Fluocortolone Caproate with Fluocortolone Pivalate 1 88 0.02 0.03 Fluoxetine Hydrochloride 11 2945 0.27 0.95 28mg 23mg Fluticasone 24 5978 0.59 1.93 475mcg 395mcg folic acid 56 833 1.37 0.27 3mg 3mg Frusemide 29 3228 0.71 1.04 55mg 54mg Fusidic Acid 9 3838 0.22 1.24 42.5mg Gliclazide 5 1084 0.12 0.35 120mg 166mg Glipizide 1 482 0.02 0.16 13mg glucosamine 1 1 0.02 0.00 1500mg 1500mg Glucose Oxidase 9 1693 0.22 0.55 Glyceryl Trinitrate 4 770 0.10 0.25 483mg Haloperidol 1 80 0.02 0.03 1.5mg 3.6mg Hydrocortisone 52 9337 1.27 3.02 topical 65mg hydrogen peroxide 1 0.02 0.00 Hydroxocobalamin 9 669 0.22 0.22 430mg hydroxychloroquine 20 56 0.49 0.02 277mg 295mg Hyoscine N‐Butylbromide 2 642 0.05 0.21 80mg 47mg Hypromellose 4 82 0.10 0.03 Ibuprofen 123 4257 3.01 1.37 1268mg 1090mg Imipramine 1 132 0.02 0.04 54mg Indapamide 1 124 0.02 0.04 2.5mg 2.5mg Indomethacin 20 307 0.49 0.10 106mg 129mg insulin 11 390 0.27 0.13 Ipratropium Bromide 8 954 0.20 0.31 100mcg 202mcg Isosorbide Mononitrate 13 1723 0.32 0.56 61mg 60mg Itraconazole 2 256 0.05 0.08 400mg 308mg Ketoconazole 5 524 0.12 0.17 280mg Ketoprofen 7 65 0.17 0.02 200mg 185mg Ketotifen 2 291 0.05 0.09 Lactulose 14 1153 0.34 0.37 Latanoprost 2 99 0.05 0.03 Laxatives 16 1002 0.39 0.32 2125mg 4125mg Leflunomide 5 8 0.12 0.00 16mg 19mg Levobunolol 1 1 0.02 0.00 levodopa 3 59 0.07 0.02 462mg Lisinopril 2 120 0.05 0.04 7.5mg 12mg Loperamide Hydrochloride 6 869 0.15 0.28 2mg 4.7mg Loratadine 8 3221 0.20 1.04 10mg 10mg Lorazepam 8 758 0.20 0.24 3mg 2mg Losartan 1 58 0.02 0.02 12.5mg 70mg Medroxyprogesterone Acetate 3 289 0.07 0.09 30mg 13mg Megestrol Acetate 1 5 0.02 0.00 160mg 160mg Meloxicam 23 246 0.56 0.08 7.5mg 8.3mg Mesalazine 1 169 0.02 0.05 3000mg 2445mg Metformin Hydrochloride 12 2308 0.29 0.75 1461mg 1511mg Methotrexate 77 109 1.88 0.04 10mg 10mg Methotrimeprazine 1 52 0.02 0.02 12.5mg 22mg Metoclopramide Hydrochloride 7 1884 0.17 0.61 30mg 28mg Metoprolol 24 4350 0.59 1.40 74mg 81mg Metronidazole 3 155 0.07 0.05 13mg Mexiletine Hydrochloride 2 24 0.05 0.01 300mg 455mg miconazole 6 1233 0.15 0.40 40mg 153mg Midazolam 1 142 0.02 0.05 9mg Minocycline Hydrochloride 4 501 0.10 0.16 50mg 97mg Misoprostol 1 4 0.02 0.00 400mg

The economic cost of arthritis in New Zealand
67
Number % Total Average daily dose
Drug name Arthritis Total (N‐n) % Arthritis
% Total (N‐n) Arthritis
Total (N‐n)
Moclobemide 1 66 0.02 0.02 300mg 434mg Mometasone Furoate 5 1111 0.12 0.36 Morphine 19 445 0.46 0.14 73mg 55mg
Mucopolysaccharide Polysulphuric Acid Ester 2 130 0.05 0.04 Mupirocin 7 1394 0.17 0.45 Nadolol 1 12 0.02 0.00 60mg Naphazoline 2 66 0.05 0.02 Naproxen 122 2524 2.98 0.82 904mg 992mg nasal spray 10 583 0.24 0.19 Nefopam Hydrochloride 5 114 0.12 0.04 135mg 146mg neocytamen 1 16 0.02 0.01 Nifedipine 2 120 0.05 0.04 34mg Nitrazepam 4 125 0.10 0.04 10mg 8mg Nitroglycerin 1 160 0.02 0.05 Norethisterone 2 217 0.05 0.07 1.25mg 14mg Norfloxacin 5 2106 0.12 0.68 800mg 798mg nortriptyline hydrochloride 3 587 0.07 0.19 34mg Nystatin 3 294 0.07 0.09 30mg Oestradiol 3 339 0.07 0.11 328mcg Oestriol 10 810 0.24 0.26 334mcg 1340mcg Oestrogens 19 826 0.46 0.27 560mcg 656mcg Olsalazine 1 8 0.02 0.00 833mg Omeprazole 156 7282 3.81 2.35 26mg 26mg Orphenadrine 13 775 0.32 0.25 200mg 196mg Oxazepam 8 407 0.20 0.13 10mg 23mg Oxprenolol 2 0.05 0.00 100mg Oxybutynin 10 560 0.24 0.18 7mg 8mg Pantoprazole 37 1753 0.90 0.57 35mg 37mg Paracetamol 271 15937 6.62 5.15 3541mg 3592mg Paracetamol with Codeine 75 3078 1.83 0.99 3723mg + 60mg 2963mg +
Paraffin Liquid 1 10 0.02 0.00 Paroxetine Hydrochloride 10 2851 0.24 0.92 20 23mg penicillin 1 343 0.02 0.11 Pethidine 2 92 0.05 0.03 100mg 125mg Phenoxymethylpenicillin 4 1445 0.10 0.47 1000mg 1558mg Phentermine 2 214 0.05 0.07 30mg 27mg Phenylephrine Hydrochloride 1 28 0.02 0.01 Phenytoin Sodium 3 216 0.07 0.07 230mg 225mg Pholcodine 3 1758 0.07 0.57 Pilocarpine 2 18 0.05 0.01 Pindolol 1 128 0.02 0.04 20mg 12mg Piroxicam 16 286 0.39 0.09 20mg 24mg Pizotifen 2 228 0.05 0.07 0.9mg Polyvinyl Alcohol 3 210 0.07 0.07 Potassium Chloride 12 803 0.29 0.26 1200mg 1541mg Povidone Iodine 4 393 0.10 0.13 Prazosin 1 62 0.02 0.02 5mg Prednisone 103 4654 2.52 1.50 18mg 30mg Primidone 1 13 0.02 0.00 542mg Prochlorperazine 14 1811 0.34 0.58 14mg 14mg Progesterone 1 105 0.02 0.03 60mg Promethazine Hydrochloride 3 1060 0.07 0.34 50mg 28mg Propranolol 4 131 0.10 0.04 63mg Pseudoephedrine 1 937 0.02 0.30 175mg pyridoxine 2 230 0.05 0.07 100mg 98mg

68
Number % Total Average daily dose
Drug name Arthritis Total (N‐n) % Arthritis
% Total (N‐n) Arthritis
Total (N‐n)
Quinapril 46 3890 1.12 1.26 16mg 17mg Quinine 13 816 0.32 0.26 319mg 280mg Ranitidine 19 1536 0.46 0.50 257mg 304mg Rifampicin 1 9 0.02 0.00 563mg rofecoxib 95 776 2.32 0.25 20mg 25mg Roxithromycin 3 463 0.07 0.15 300mg 302mg Salbutamol 42 9558 1.03 3.09 540mcg 486mcg Salmeterol 8 426 0.20 0.14 100mcg 91mcg Selegiline 1 8 0.02 0.00 5mg Senna 1 32 0.02 0.01 sibutramine 2 199 0.05 0.06 10mg 11mg sildenafil 2 424 0.05 0.14 75mg 80mg Simethicone 2 155 0.05 0.05 Simvastatin 65 7360 1.59 2.38 29mg 28mg Sodium Aurothiomalate 5 3 0.12 0.00 Sodium Citro‐Tartrate 1 162 0.02 0.05 Sodium Cromoglycate 3 526 0.07 0.17 Sodium Valproate 3 538 0.07 0.17 933mg 860mg Sotalol 5 466 0.12 0.15 133mg 163mg Spironolactone 10 882 0.24 0.28 25mg 56mg sulfamethoxazole 1 55 0.02 0.02 1920mg 1868mg Sulindac 5 40 0.12 0.01 300mg 295mg Sulphasalazine 27 99 0.66 0.03 1962mg 2011mg Sumatriptan 2 675 0.05 0.22 50mg 77mg Syringe 4 170 0.10 0.05 tadalafil 1 168 0.02 0.05 20mg 20mg Tamoxifen Citrate 3 176 0.07 0.06 15mg 20mg
Tar with Triethanolamine Lauryl Sulphate and Fluor 5 267 0.12 0.09 Temazepam 15 1230 0.37 0.40 14mg 16mg Tenoxicam 67 709 1.64 0.23 20mg 20mg Terazosin Hydrochloride 8 876 0.20 0.28 3mg 4mg Terbinafine 1 409 0.02 0.13 250mg 248mg Terbutaline Sulphate 4 1413 0.10 0.46 250mcg 1035mcg Thyroxine 40 3500 0.98 1.13 94mcg 83mcg Tiaprofenic Acid 6 87 0.15 0.03 1000mg 524mg Timolol 2 101 0.05 0.03 10mg 19mg Tioconazole 1 55 0.02 0.02 Tolterodine 1 96 0.02 0.03 2mg 3mg topical skin 10 473 0.24 0.15 Tramadol 44 948 1.08 0.31 188mg 194mg Tranexamic Acid 1 129 0.02 0.04 3407mg triamcinolone Acetonide 80 877 1.95 0.28 topical 17mg Triamterene 2 45 0.05 0.01 60mg Triazolam 15 706 0.37 0.23 250mcg 214mcg Trifluoperazine Hydrochloride 2 81 0.05 0.03 4mg Trimethoprim 4 2137 0.10 0.69 351mg Urea 10 515 0.24 0.17 Valdecoxib 1 11 0.02 0.00 20mg 31mg Verapamil 5 409 0.12 0.13 80mg 220mg Vitamin B Complex 2 68 0.05 0.02 Vitamins 27 1193 0.66 0.39 warfarin sodium 14 1668 0.34 0.54 4.5mg 3.4mg Xylometazoline Hydrochloride 1 561 0.02 0.18 Zopiclone 43 2822 1.05 0.91 9.5mg 8mg
*wp = with paracetamol

The economic cost of arthritis in New Zealand
69
Table C.2: Laboratory referrals, arthritis consultations vs total population
Number % Total Lab test type Arthritis Total (N‐n) % Arthritis % Total (N‐n) absolute retic count 2 127 0.02 0.03 Alanine Aminotransferase 185 11257 2.15 2.32 Albumin 193 11857 2.24 2.45 Albumin‐to‐Creatinine ratio 16 1330 0.19 0.27 alkaline phosphatase 184 10960 2.14 2.26 Alpha Fetoprotein 1 10 0.01 0.00 Amylase 4 545 0.05 0.11 Anisocytosis 3 112 0.03 0.02 Anti Nuclear Antibodies 91 526 1.06 0.11 antibodies ‐ adrenal gland 1 8 0.01 0.00 Antibody 20 80 0.23 0.02 antibody ‐ parietal cell 13 78 0.15 0.02 antibody ‐ smooth muscle 13 78 0.15 0.02 antibody test – RNP 20 79 0.23 0.02 antibody test ‐ salivary gland 1 8 0.01 0.00 antibody test ‐ SCL‐70 20 82 0.23 0.02 antibody test ‐ SM (anti smith) 20 79 0.23 0.02 antibody test ‐ SS‐A/Ro 20 78 0.23 0.02 antibody test ‐ SS‐B/La 20 78 0.23 0.02 Antibody test ‐ strep A 5 69 0.06 0.01 antideoxyribonuclease B 4 46 0.05 0.01 Anti‐dsDNA antibodies 51 388 0.59 0.08 Anti‐Neutrophilic Cytoplasmic Antibody 4 5 0.05 0.00 anti‐neutrophillic cytoplasmic antibody 2 21 0.02 0.00 Antinuclear Antibody Test 39 174 0.45 0.04 Anti‐Streptokinase 6 61 0.07 0.01 antithyroid peroxidase antibody 1 13 0.01 0.00 arsenic – urine 1 11464 0.01 2.37 Aspartate Aminotransferase 184 11 2.14 0.00 Basophils 331 17783 3.84 3.67 Bilirubin 184 11081 2.14 2.29 Biochemistry 1 34 0.01 0.01 blood group 1 127 0.01 0.03 brucella screen 1 8 0.01 0.00 Calcium 87 4035 1.01 0.83 Chlamydia 2 2197 0.02 0.45 Cholesterol 245 28653 2.84 5.92 Complement Activity 2 8 0.02 0.00 complete blood count 4 65 0.05 0.01 C‐Reactive Protein 227 3402 2.63 0.70 Creatinine 210 13008 2.44 2.69 Cryoglobulin 1 91 0.01 0.02 Cytomegalovirus 2 38 0.02 0.01 D‐dimer 2 16 0.02 0.00 Digoxin 1 15 0.01 0.00 Endomysial Antibodies 2 18231 0.02 3.76 Eosinophil antibodies 343 679 3.98 0.14 epstein‐barr antibody 8 8396 0.09 1.73 Erythrocyte sedimentation rate 268 216 3.11 0.04 extractable nuclear antigens 12 4194 0.14 0.87 fasting status 45 49 0.52 0.01 Fecal Occult Blood Test 1 8319 0.01 1.72 Ferritin 82 1377 0.95 0.28 fluoride glucose 14 4162 0.16 0.86

70
Number % Total Folate 41 512 0.48 0.11 Follicle‐stimulating hormone 3 11109 0.03 2.29 Gamma‐glutamyl transpeptidase 182 8 2.11 0.00 Gastric Parietal Antibodies 1 10 0.01 0.00 gliadin antibody 4 9579 0.05 1.98 Globulin 168 6102 1.95 1.26 Glucose 78 21553 0.91 4.45 glycosylated haemoglobin 366 196 4.25 0.04 Haematology 6 47 0.07 0.01 hepatitis B surface antigen 10 1084 0.12 0.22 Hepatitis C antibody 2 193 0.02 0.04 Human leukocyte antigen 2 6 0.02 0.00 Hypochromic cells 1 29 0.01 0.01 IgA antibody 3 233 0.03 0.05 IgG antibody 3 190 0.03 0.04 Immunoglobulin 15 409 0.17 0.08 INR/Prothrombin 18 2964 0.21 0.61 iron saturation 113 12057 1.31 2.49 iron serum 23 2264 0.27 0.47 Ketones 1 36 0.01 0.01 Lactate dehydrogenase 2 222 0.02 0.05 Large Unstained Cells 1 18 0.01 0.00 Last Menstrual Period 1 30 0.01 0.01 Leukocytes 371 19693 4.31 4.07 liver function test 4 48 0.05 0.01 Luteinizing hormone 3 446 0.03 0.09 Lymphocytes 344 18586 3.99 3.84 Macrocytes 3 65 0.03 0.01 Magnesium 2 162 0.02 0.03 mean cell haemoglobin 81 6067 0.94 1.25 mean cell volume 83 6297 0.96 1.30 Mean corpuscular hemoglobin 256 12141 2.97 2.51 Mean corpuscular hemoglobin concentration 38 2277 0.44 0.47 Mean corpuscular volume 256 12141 2.97 2.51 mean platelet volume 407 22756 4.72 4.70 mitochondrial antibody 17 97 0.20 0.02 Monocytes 344 18575 3.99 3.84 Neutrophils 344 18581 3.99 3.84 Nitrates 1 16 0.01 0.00 Oestradiol 2 136 0.02 0.03 Packed cell volume 339 18406 3.93 3.80 Parathyroid Hormone 1 11 0.01 0.00 paul Bunnell 2 219 0.02 0.05 PCR 1 2 0.01 0.00 pH 1 46 0.01 0.01 Phosphate 15 1388 0.17 0.29 Phosphorus 11 464 0.13 0.10 Potassium 164 10858 1.90 2.24 pregnancy test 1 186 0.01 0.04 Progesterone 2 185 0.02 0.04 Prolactin 2 280 0.02 0.06 Prostate Specific Antigen 35 2098 0.41 0.43 Radiologist 6 498 0.07 0.10 red blood cells ‐ normochromic 1 55 0.01 0.01 Red blood count 118 6330 1.37 1.31 Red cell distribution width 74 3940 0.86 0.81 red cell folate 9 1360 0.10 0.28 renal function 1 23 0.01 0.00

The economic cost of arthritis in New Zealand
71
Number % Total Reticulocyte Count 3 294 0.03 0.06 Rhesus factor 4 143 0.05 0.03 Rheumatoid Factor 203 1016 2.36 0.21 Saturated I.C.P. 8 642 0.09 0.13 Sodium 165 10828 1.92 2.24 specific gravity 1 16 0.01 0.00 target cells 1 24 0.01 0.00 Thyroglobulin antibody 1 13 0.01 0.00 thyroid‐stimulating hormone 92 8570 1.07 1.77 Thyroxine 44 4381 0.51 0.90 Total iron‐binding capacity 34 2607 0.39 0.54 total protein 187 11404 2.17 2.35 Toxoplasma 4 83 0.05 0.02 Transferrin 2 229 0.02 0.05 Triiodothyronine 19 1380 0.22 0.28 Urea 216 8678 2.51 1.79 Urine 2 31 0.02 0.01 VCA antigen 5 735 0.06 0.15 vitamin B12 41 4178 0.48 0.86 Xray 1 0 0.01 0.00
Source: RNZCGPRU.

72
Appendix D: – Health data surveys Arthritis New Zealand supplied contact details for the supplementary health survey data, with the task of ensuring adequate representation in terms of demographic and regional characteristics, as outlined below.
■ Outpatient and imaging services, from the 21 District Health Boards
Bay of Plenty
Canterbury
Central Auckland
Gisborne/Tairawhiti
Hawke’s Bay
Hutt Valley
Manawatu
Nelson Marlborough
Northland
North Shore, Rodney and Waitakere
Otago
Rotorua
South Auckland
South Canterbury
Southland
Taranaki
Waikato
Wairarapa
Wanganui
Wellington
West Coast
■ Aged care facilities – these were selected randomly from an internet search using google.nz, yellowpages.co.nz and the NZS business search (names of facilities are not reported for privacy reasons).
■ Specialists – the New Zealand Rheumatology Association Executive comprised the necessary 10 rheumatologists surveyed, being gender mixed, public and private and geographically diverse. The New Zealand Orthopaedic Association provided contact details for 14 other specialist members.
■ Allied health – 22 physiotherapists were randomly selected from the NZ Society of Physiotherapists website, together with 6 occupational therapists from the NZ Association of Occupational Therapists.
Surveys were designed with professional assistance from Dangar Research. The final survey forms follow (reverse pages are very similar so are not repeated). Surveys were emailed with a

The economic cost of arthritis in New Zealand
73
fortnight turnaround requested. Responses are summarised in the main body of the text relating to each costing.

74
Arthritis New Zealand Survey of Outpatient Services 2005 Definitions: Arthritis includes the conditions listed on the next page. THIS SURVEY EXCLUDES HOSPITAL INPATIENT SERVICES. If you have any concerns or questions about this survey or how to fill out responses to certain questions, please contact Lynne Pezzullo or Annette Lancy: 61-2-6273 1222 Question 1 What outpatient services do you provide for people with arthritis? Please tick as many as apply. 1 specialist medical services 2 physiotherapy 3 occupational therapy 4 counselling 5 other, please specify______________________________________________ FOR THE SPECIALIST MEDICAL SERVICES Question 2 In the most recent year, how many hours would you estimate that your specialists have provided services to people with arthritis who were NOT inpatients, to treat their arthritis?____________________________________non-inpatient hours per year
Question 3 What do you estimate is the average cost per hour of your specialist services? Please provide for the most recent period available:
Specialist medical consultations: $___________________per hour
share paid by the patient or private health insurance fund _____________________%
share paid by other funding sources?_________________________%
FOR THE OTHER (ALLIED HEALTH) SERVICES Question 4 In the most recent year, how many hours would you estimate that your allied health workers have provided services to people with arthritis who were NOT inpatients, to treat their arthritis? ____________________________________non-inpatient hours per year
Question 5 What do you estimate is the average cost per hour of your allied health services? Please provide for the most recent period available:
Allied health services: $___________________per hour
share paid by the patient or private health insurance fund _____________________%
share paid by other funding sources?_________________________%
Questions 6 How many beds are there in your facility? Please exclude closed beds.
__________________________beds

The economic cost of arthritis in New Zealand
75
Arthritic conditions included in this survey, by International Classification of Disease (Tenth Revision) category M00 Pyogenic arthritis M01 Direct infections of joint in infectious and parasitic diseases classified elsewhere M02 Reactive arthropathies M03 Postinfective and reactive arthropathies in diseases classified elsewhere M05 Seropositive rheumatoid arthritis M06 Other rheumatoid arthritis M07 Psoriatic and enteropathic arthropathies M08 Juvenile arthritis M09 Juvenile arthritis in diseases classified elsewhere M10 Gout M11 Other crystal arthropathies M12 Other specific arthropathies M13 Other arthritis M14 Arthropathies in other diseases classified elsewhere M15 Polyarthrosis M16 Coxarthrosis [arthrosis of hip] M17 Gonarthrosis [arthrosis of knee] M18 Arthrosis of first carpometacarpal joint M19 Other arthrosis M30 Polyarteritis nodosa and related conditions M31 Other necrotizing vasculopathies M32 Systemic lupus erythemastosus M34 Systemic sclerosis M35.0 Sicca syndrome [Sjögren] M35.1 Other overlap syndromes M35.3 Polymyalgia rheumatica M45 Ankylosing spondylitis M46 Other inflammatory spondylopathies M47 Spondylosis M48.0 Spinal stenosis M48.1 Ankylosing hyperostosis [Forestier] M49 Spondylopathies in diseases classified elsewhere M65 Synovitis and tenosynovitis M68 Disorders of synovium and tendon in diseases classified elsewhere M70.0 Crepitant synovitis (acute) (chronic) of hand and wrist M71.2 Synovial cyst of popliteal space [Baker] M75.0 Adhesive capsulitis of shoulder M76 Enthesopathies, lower limb, excluding foot M77.2 Periarthritis of wrist M77.3 Calcaneal spur M77.5 Other enthesopathy of foot M77.8 Other enthesopathies, not elsewhere classified M77.9 Enthesopathy, unspecified Many thanks for taking the time to complete this confidential survey. Survey conducted by Access Economics Pty Ltd on behalf of Arthritis New Zealand. Please return this survey either: By email to: [email protected] OR by fax to: 61-2-6273 1223 OR by post to: Lynne Pezzullo, Senior Economist, Access Economics PO Box 6248 Kingston ACT 2604 AUSTRALIA

76
Arthritis New Zealand Survey of Diagnostic Imaging Services 2005 Definitions: Arthritis includes the conditions listed on the next page. If you have any concerns or questions about this survey or how to fill out responses to certain questions, please contact Lynne Pezzullo or Annette Lancy: 61-2-6273 1222 Question 1 In the most recent year, how many hours would you estimate that you have provided diagnostic imaging services to people with arthritis, in relation to their arthritis? ____________________________________ hours per year
Question 2 What do you estimate is the average cost per hour of your diagnostic imaging services? Please provide for the most recent period available:
Diagnostic imaging: $___________________per hour
share paid by the patient or private health insurance fund _____________________%
share paid by other funding sources?_________________________%
Many thanks for taking the time to complete this confidential survey. Survey conducted by Access Economics Pty Ltd on behalf of Arthritis New Zealand. Please return this survey either: By email to: [email protected] OR by fax to: 61-2-6273 1223 OR by post to: Lynne Pezzullo, Senior Economist, Access Economics PO Box 6248 Kingston ACT 2604 AUSTRALIA

The economic cost of arthritis in New Zealand
77
Arthritis New Zealand Survey of Aged Care Facilities 2005 Definitions: Arthritis includes the conditions listed on the next page. THIS SURVEY EXCLUDES HOSPITAL INPATIENT OR OUTPATIENT SERVICES. If you have any concerns or questions about this survey or how to fill out responses to certain questions, please contact Lynne Pezzullo or Annette Lancy: 61-2-6273 1222 Question 1 In the most recent year, what proportion of your facility’s residents do you estimate are in care PRIMARILY because of their arthritis?
__________________________% Question 2 In the most recent year, what proportion of your facility’s residents do you estimate who HAVE arthritis, although they may be in care primarily for other reasons?
__________________________% Question 3 What are the total annual costs of your facility? Note: Costs would equate to the total expenditure or total income side of the balance sheet, whichever is larger. Please provide for the most recent period available:
Aged care services: $___________________per annum
share paid by the patient or private health insurance fund _____________________%
share paid by other funding sources?_________________________%
Question 4 How many beds are there in your facility? Please exclude closed beds.
__________________________beds Many thanks for taking the time to complete this confidential survey. Please return this survey either: By email to: [email protected] OR by fax to: 61-2-6273 1223 OR by post to: Lynne Pezzullo, Senior Economist, Access Economics PO Box 6248 Kingston ACT 2604 AUSTRALIA

78
Arthritis New Zealand Survey of Arthritis Specialist Services 2005 Definitions: Arthritis includes the conditions listed on the next page. THIS SURVEY EXCLUDES HOSPITAL INPATIENT OR OUTPATIENT SERVICES. If you have any concerns or questions about this survey or how to fill out responses to certain questions, please contact Lynne Pezzullo or Annette Lancy: 61-2-6273 1222 Question 1 What is your specialty? Please tick as many as apply. 1 rheumatology 2 orthopaedic surgery 3 other, please specify______________________________________________ Question 2 In the most recent year, how many hours would you estimate that you have provided specialist services to people with arthritis, to treat their arthritis, NOT through a hospital inpatient or outpatient service? ____________________________________non-hospital hours per year
Question 3 What do you estimate is the average cost per hour of your specialist services? Note: Cost would equate to the price charged in private practice or to hourly salary (including on-costs such as superannuation) in other care settings. Please provide for the most recent period available:
specialist medical consultations: $___________________per hour
share paid by the patient or private health insurance fund _____________________%
share paid by other funding sources?_________________________%
Many thanks for taking the time to complete this confidential survey. Please return this survey either: By email to: [email protected] OR by fax to: 61-2-6273 1223 OR by post to: Lynne Pezzullo, Senior Economist, Access Economics PO Box 6248 Kingston ACT 2604 AUSTRALIA

The economic cost of arthritis in New Zealand
79
Arthritis New Zealand Survey of Allied Health Services 2005 Definitions: Arthritis includes the conditions listed on the next page. THIS SURVEY EXCLUDES HOSPITAL INPATIENT OR OUTPATIENT SERVICES. If you have any concerns or questions about this survey or how to fill out responses to certain questions, please contact Lynne Pezzullo or Annette Lancy: 61-2-6273 1222 Question 1 What is your specialty? Please tick as many as apply. 1 physiotherapy 2 occupational therapy 3 other, please specify______________________________________________ Question 2 In the most recent year, how many hours would you estimate that you have provided services to people with arthritis, to treat their arthritis, NOT through a hospital inpatient oroutpatient service? ____________________________________non-hospital hours per year
Question 3 What do you estimate is the average cost per hour of your services? Note: Cost would equate to the price charged in private practice or to hourly salary (including on-costs such as superannuation) in other care settings. Please provide for the most recent period available:
Allied health services: $___________________per hour
share paid by the patient or private health insurance fund _____________________%
share paid by other funding sources?_________________________%
Many thanks for taking the time to complete this confidential survey. Please return this survey either: By email to: [email protected] OR by fax to: 61-2-6273 1223 OR by post to: Lynne Pezzullo, Senior Economist, Access Economics PO Box 6248 Kingston ACT 2604 AUSTRALIA