The Economic Benefits of the Activity Associated with ... Economic Benefits of the Activity...
66
The Economic Benefits of the Activity Associated with Contracts and Expenditures Arising from Business Diversity Programs at Dallas/Fort Worth International Airport THE PERRYMAN GROUP 510 N. Valley Mills Dr., Suite 300 Waco, TX 76710 ph. 254.751.9595, fax 254.751.7855 [email protected] www.perrymangroup.com April 2016
Transcript of The Economic Benefits of the Activity Associated with ... Economic Benefits of the Activity...
The Economic Benefits of the Activity Associated with Contracts and Expenditures Arising from
Business Diversity Programs at Dallas/Fort Worth International Airport
THE PERRYMAN GROUP
510 N. Valley Mills Dr., Suite 300
Waco, TX 76710
ph. 254.751.9595, fax 254.751.7855
www.perrymangroup.com
April 2016

The Economic Benefits of the Activity Associated with Contracts and Expenditures Arising
from Business Diversity Programs at Dallas/Fort Worth International Airport
i | P a g e w w w . p e r r y m a n g r o u p . c o m C o p y r i g h t 2 0 1 6
Contents Introduction .................................................................................................................................... 1
Business Diversity Programs at DFW Airport .................................................................. 2
Business Diversity Program Overview ................................................................................................ 2
Direct Program Effects .......................................................................................................................... 3
Total Economic Benefits of Business Diversity at DFW Airport ............................... 7
2015 Results for Key Measures of Business Activity ....................................................................... 8
2013-2015 Results for Total Expenditures and Employment .......................................................... 9
Conclusion ..................................................................................................................................... 13
APPENDICES ............................................................................................................................... 14
Appendix A: About The Perryman Group .................................................................. 15
Appendix B: Methods Used ................................................................................................ 16
Appendix C: Detailed Sectoral Results ........................................................................ 20
Impact of Construction Expenditures Awarded to Firms Qualifying for the DFW Airport Minority Business Enterprise (MBE)
Program ..................................................................................................................................................................................... 21
The Impact of Construction Expenditures Awarded to Firms Qualifying for the DFW Airport Small Business Enterprise (SBE)
Program ..................................................................................................................................................................................... 25
The Impact of Construction Expenditures Awarded to Firms Qualifying for the Federal Disadvantaged Business Enterprise
(DBE) Program ........................................................................................................................................................................... 29
The Impact of Architectural and Engineering Services Expenditures Awarded to Firms Qualifying for the DFW Airport Minority
and Women Business Enterprise (M/WBE) Program ................................................................................................................ 33
The Impact of Professional and Non-Professional Goods and Services Expenditures Awarded to Firms Qualifying for the DFW
Airport Small Business Enterprise (SBE) Program .................................................................................................................... 37
The Impact of Purchase Order Expenditures Awarded to Firms Qualifying for the DFW Airport Small Business Enterprise
(SBE) and Minority and Women Business Enterprise (M/WBE) Programs ............................................................................... 41
The Impact of Concessions Revenues to Firms Qualifying for the Federal Airport Concessions Disadvantaged Business
Enterprise (ACDBE) Program at DFW Airport ........................................................................................................................... 45
The Impact of Concessions Revenues to Firms Qualifying for the Minority Business Enterprise (MBE) Program at DFW Airport
................................................................................................................................................................................................... 49
The Impact if All Expenditures to Firms Qualifying for the Various Diversity Initiatives (Excluding the Terminal Renewal and
Improvement Program (TRIP)) at DFW Airport .......................................................................................................................... 53
The Impact if Expenditures within the Terminal Renewal and Improvement Program (TRIP) to Firms Qualifying for the Small
Business Enterprise (SBE) and Minority and Women Business Enterprise (M/WBE) Programs at DFW Airport ...................... 57
The Impact of All Expenditures/Revenues to Firms Qualifying for Various Diversity Initiatives (Including the Terminal Renewal
and Improvement Program (TRIP)) at DFW Airport ................................................................................................................... 61

The Economic Benefits of the Activity Associated with Contracts and Expenditures Arising
from Business Diversity Programs at Dallas/Fort Worth International Airport
1 | P a g e w w w . p e r r y m a n g r o u p . c o m C o p y r i g h t 2 0 1 6
Firms of all types benefit from the
opportunities offered by DFW
Airport operations.
Introduction
Dallas/Fort Worth International Airport (DFW Airport) is a major driver of business
activity throughout the surrounding area. In a recent study, The Perryman Group (TPG)
estimated that current DFW Airport operations
and related activities generate 228,000 jobs and
$37.0 billion in annual total expenditures in the
North Central Texas Region when multiplier
effects are considered, with construction projects
leading to billions of dollars in additional gains.
Firms of all types benefit from the opportunities offered by DFW Airport operations. In
addition, the Airport actively engages in a variety of efforts to enhance business
diversity, further enhancing the potential benefits for historically underutilized
businesses, such as those that are small or are owned by minorities or women.
The Perryman Group was recently asked to examine the portion of overall economic
activity linked to DFW Airport operations associated with firms participating in the
Airport’s business diversity programs. This report presents the results of TPG’s analysis.
The Economic Benefits of the Activity Associated with Contracts and Expenditures Arising
from Business Diversity Programs at Dallas/Fort Worth International Airport
2 | P a g e w w w . p e r r y m a n g r o u p . c o m C o p y r i g h t 2 0 1 6
DFW Airport is strongly committed
to business diversity and
development.
Business Diversity Programs at DFW Airport
As noted, DFW Airport is strongly committed to business diversity and development. Its
statement on diversity says DFW Airport “will create and sustain a business
environment that enables disadvantaged, small, minority and women-owned business
enterprises (D/S/M/WBEs) to compete equitably for business opportunities and achieve
economic success, contributing to DFW’s overall mission of expanding economic
benefits.”1
Business Diversity Program Overview
DFW Airport has a number of programs in place to help meet these goals. Federal
programs include the Disadvantaged Business Enterprise (DBE) Program and Airport
Concessions Disadvantaged Business Enterprise (ACDBE)
Program. The DBE program criteria include 51% owned
and controlled by one or more socially and economically
disadvantaged individuals, business size based on Small
Business Administration (SBA) size standards,
economically disadvantaged status, and a personal net
worth threshold. The business areas are construction services and construction-related
professional services. The criteria for the ACDBE program are the same as the DBE
program, but its business focus is on airport concessions.2
Local programs include the Minority Business Enterprise (MBE) Program,
Minority/Women Business Enterprise (M/WBE) Program, and Small Business Enterprise
(SBE) Program.
The criteria for the MBE program include 51% owned and controlled by
one or more minority individuals or by one or more female individuals
and socially disadvantaged. The business focus is construction services
over $1 million. 1 DFW Airport website. https://www.dfwairport.com/bdd/.
2 DFW International Airport FY2015 Diversity & Inclusion Annual Report.
The Economic Benefits of the Activity Associated with Contracts and Expenditures Arising
from Business Diversity Programs at Dallas/Fort Worth International Airport
3 | P a g e w w w . p e r r y m a n g r o u p . c o m C o p y r i g h t 2 0 1 6
Total revenue to firms
participating in DFW Airport
business diversity initiatives
increased from approximately
$349.2 million in 2013 to $383.8
million in 2015.
The M/WBE program has the same criteria as the MBE program, but with
a business focus on architectural and engineering services.
The SBE program criteria are business size (based on SBA size standards)
and economically disadvantaged. The business focus is construction
services (under $1 million), professional services, and non-professional
services.3
Direct Program Effects
Programs are divided into several categories with specific participation goals which DFW
has consistently met or exceeded. The Perryman Group examined information related
to the Construction MBE, Construction SBE, Construction DBE, Architectural &
Engineering M/WBE, Goods and Services SBE, Purchase Orders, Concessions ACDBE, and
Concessions MBE programs, as well as awards
associated with the Terminal Renewal and
Improvement Program (TRIP).
As an initial phase of this analysis, the underlying data
was compiled into estimates of the overall revenue
flowing to historically underutilized businesses,
whether from DFW Airport (for construction and
related projects) or from customers (such as with concessions businesses).
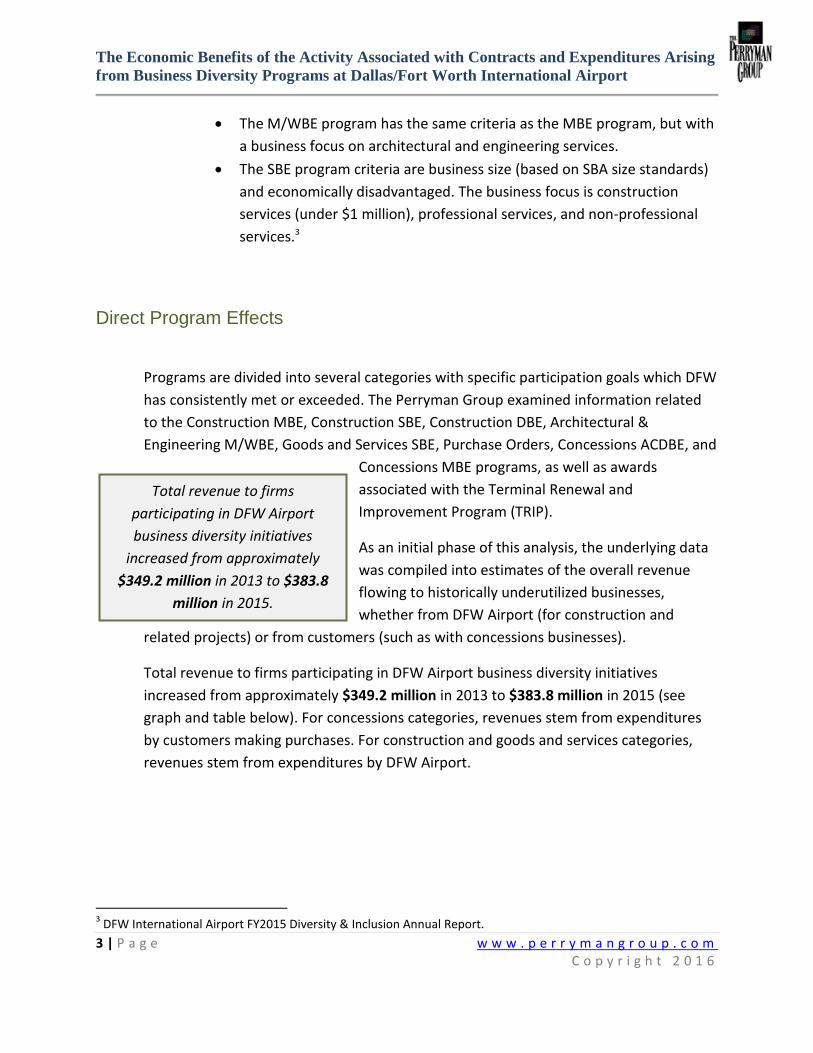
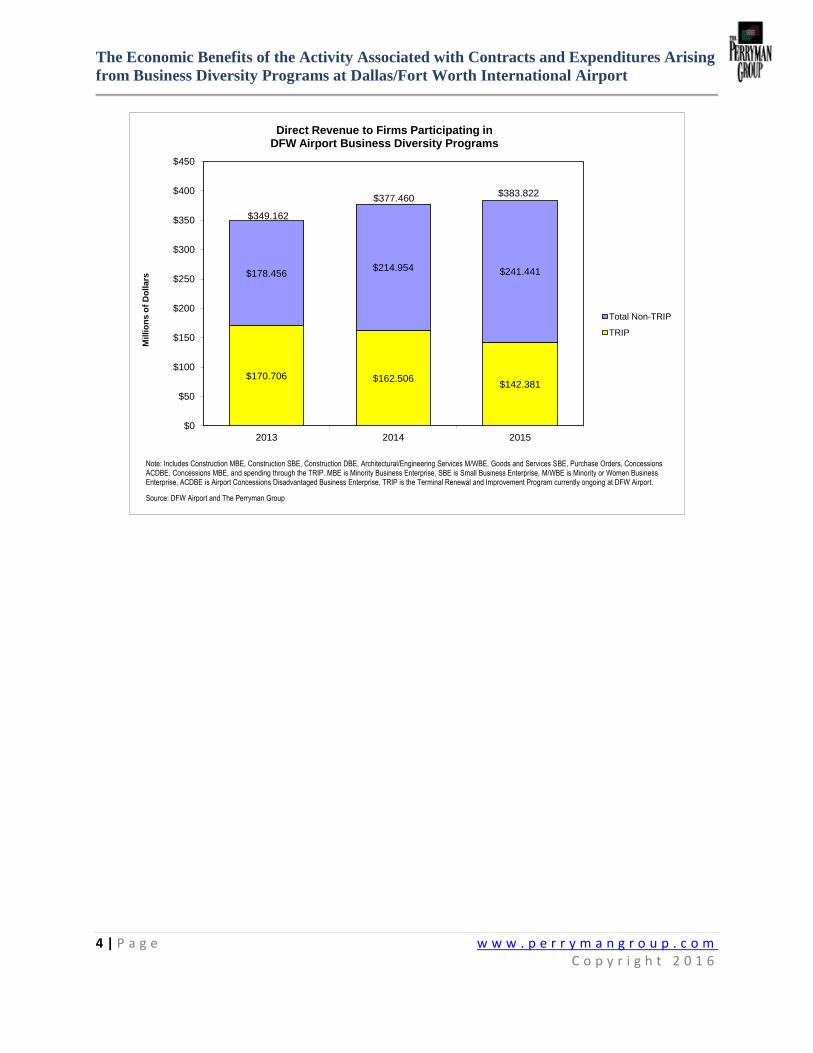
Total revenue to firms participating in DFW Airport business diversity initiatives
increased from approximately $349.2 million in 2013 to $383.8 million in 2015 (see
graph and table below). For concessions categories, revenues stem from expenditures
by customers making purchases. For construction and goods and services categories,
revenues stem from expenditures by DFW Airport.
3 DFW International Airport FY2015 Diversity & Inclusion Annual Report.
The Economic Benefits of the Activity Associated with Contracts and Expenditures Arising
from Business Diversity Programs at Dallas/Fort Worth International Airport
4 | P a g e w w w . p e r r y m a n g r o u p . c o m C o p y r i g h t 2 0 1 6
$170.706 $162.506$142.381
$178.456$214.954 $241.441
$0
$50
$100
$150
$200
$250
$300
$350
$400
$450
2013 2014 2015
Millio
ns o
f D
ollars
Direct Revenue to Firms Participating in DFW Airport Business Diversity Programs
Total Non-TRIP
TRIP
Note: Includes Construction MBE, Construction SBE, Construction DBE, Architectural/Engineering Services M/WBE, Goods and Services SBE, Purchase Orders, Concessions ACDBE, Concessions MBE, and spending through the TRIP. MBE is Minority Business Enterprise, SBE is Small Business Enterprise, M/WBE is Minority or Women Business Enterprise, ACDBE is Airport Concessions Disadvantaged Business Enterprise, TRIP is the Terminal Renewal and Improvement Program currently ongoing at DFW Airport.
Source: DFW Airport and The Perryman Group
$349.162
$377.460$383.822
The Economic Benefits of the Activity Associated with Contracts and Expenditures Arising
from Business Diversity Programs at Dallas/Fort Worth International Airport
5 | P a g e w w w . p e r r y m a n g r o u p . c o m C o p y r i g h t 2 0 1 6
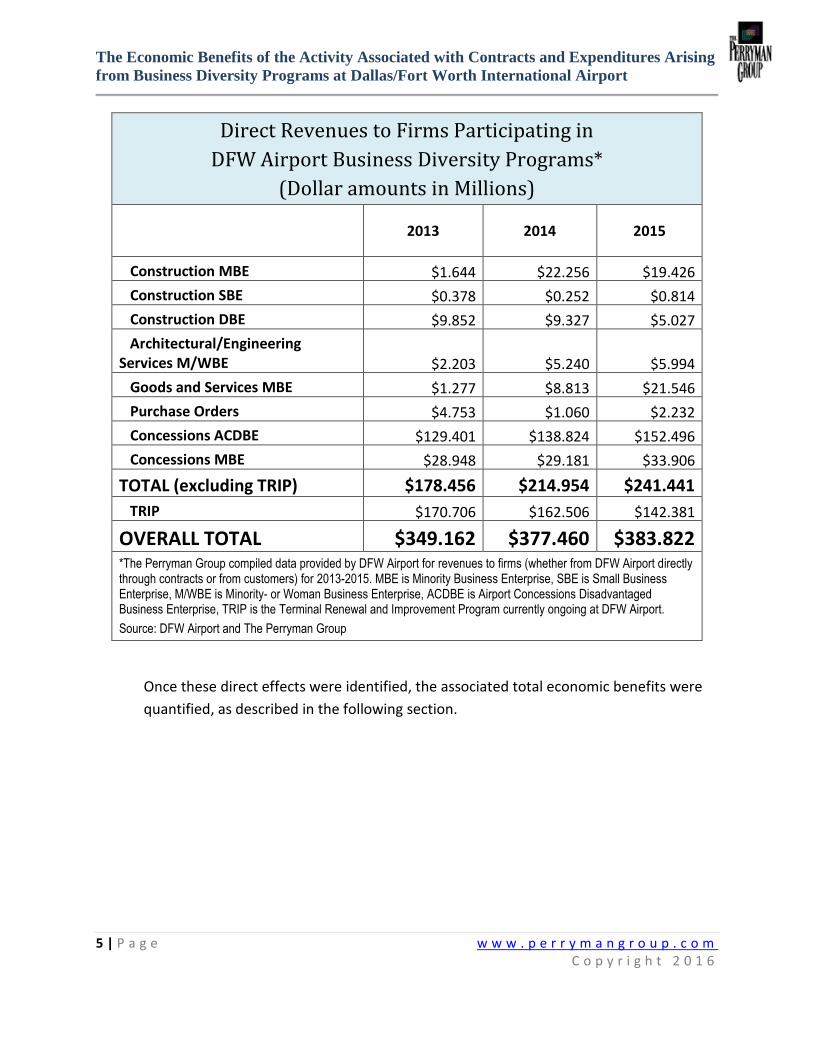
Direct Revenues to Firms Participating in
DFW Airport Business Diversity Programs*
(Dollar amounts in Millions)
2013 2014 2015
Construction MBE $1.644 $22.256 $19.426
Construction SBE $0.378 $0.252 $0.814
Construction DBE $9.852 $9.327 $5.027
Architectural/Engineering Services M/WBE $2.203 $5.240 $5.994
Goods and Services MBE $1.277 $8.813 $21.546
Purchase Orders $4.753 $1.060 $2.232
Concessions ACDBE $129.401 $138.824 $152.496
Concessions MBE $28.948 $29.181 $33.906
TOTAL (excluding TRIP) $178.456 $214.954 $241.441
TRIP $170.706 $162.506 $142.381
OVERALL TOTAL $349.162 $377.460 $383.822 *The Perryman Group compiled data provided by DFW Airport for revenues to firms (whether from DFW Airport directly through contracts or from customers) for 2013-2015. MBE is Minority Business Enterprise, SBE is Small Business Enterprise, M/WBE is Minority- or Woman Business Enterprise, ACDBE is Airport Concessions Disadvantaged Business Enterprise, TRIP is the Terminal Renewal and Improvement Program currently ongoing at DFW Airport.
Source: DFW Airport and The Perryman Group
Once these direct effects were identified, the associated total economic benefits were
quantified, as described in the following section.

The Economic Benefits of the Activity Associated with Contracts and Expenditures Arising
from Business Diversity Programs at Dallas/Fort Worth International Airport
6 | P a g e w w w . p e r r y m a n g r o u p . c o m C o p y r i g h t 2 0 1 6
Measuring Economic Impacts
Any economic stimulus, whether positive or negative, generates multiplier effects throughout the economy. In this
instance, the operations of firms participating in DFW Airport business diversity programs generate economic
activity across a spectrum of industries. These effects ripple through the economy, leading to additional gains.
DFW Airport provided information regarding spending by the Airport through business diversity programs and
revenues to concessionaires participating in business diversity programs.
The associated multiplier effects were measured using The Perryman Group’s input-output assessment model (the
US Multi-Regional Impact Assessment System), which is described in further detail in the Appendices to this report.
The system has been consistently maintained and updated since it was developed by the firm some 30 years ago,
and has been used in hundreds of analyses for clients ranging from major corporations to government agencies. It
uses a variety of data (from surveys, industry information, and other sources) to describe the various goods and
services (known as resources or inputs) required to produce another good/service. This process allows for
estimation of the total economic impact (including multiplier effects) of DFW Airport associated facilities. The
models used in the current analysis reflect the specific industrial composition and characteristics of the North
Central Texas Region. The model is also linked to a system for quantifying the tax effects associated with the gains
in business activity such as increases in retail sales taxes and property taxes.
These total economic effects are quantified for key measures of business activity:
Total expenditures (or total spending) measure the dollars changing hands as a result of the economic
stimulus.
Gross product (or output) is production of goods and services that will come about in each area as a result of
the activity. This measure is parallel to the gross domestic product numbers commonly reported by various
media outlets and is a subset of total expenditures.
Personal income is dollars that end up in the hands of people in the area; the vast majority of this aggregate
derives from the earnings of employees, but payments such as interest and rents are also included.
Job gains are expressed as person-years of employment for transitory construction effects and permanent
jobs for ongoing operational effects. Note that person-years are spread over the construction period and may
reflect varying numbers of workers actually on site. For instance, 3,000 person-years could be 1,000 people
working for three years or 6,000 different people working for a half year each.
Results for total expenditures and jobs are reported in the body of this report, with other measures and industry-
level detail in the Appendices. Monetary values were quantified on a constant (2015) dollar basis. See the
Appendices to this report for additional information regarding the methods and assumptions used in this analysis.

The Economic Benefits of the Activity Associated with Contracts and Expenditures Arising
from Business Diversity Programs at Dallas/Fort Worth International Airport
7 | P a g e w w w . p e r r y m a n g r o u p . c o m C o p y r i g h t 2 0 1 6
The Perryman Group estimates
that when multiplier effects are
considered, the total economic
benefits of expenditures to firms
qualifying for business diversity
programs at DFW Airport
operations totaled $1.150 billion
in total expenditures and
$562.178 million in gross product
per year; about 7,528 jobs.
Total Economic Benefits of Business Diversity
at DFW Airport
The direct expenditures to firms participating in DFW Airport diversity programs
generate multiplier effects through the economy, with gains in business activity across a
spectrum of industries. The Perryman Group measured
these total economic benefits utilizing the firm’s US
Multi-Regional Impact Assessment System (described
elsewhere in this report and in the Appendices).
In addition, The Perryman Group examined the fiscal
benefits to the State of Texas as well as local taxing
entities within the Region. Business operations generate
taxes for local governmental entities including cities,
counties, schools, and special districts in multiple ways.
First, firms pay taxes directly. Second, taxes are
generated through the economic activity associated
with business operations. In addition, the spending of
payroll funds by consumers provides revenues to various governmental entities.
The Economic Benefits of the Activity Associated with Contracts and Expenditures Arising
from Business Diversity Programs at Dallas/Fort Worth International Airport
8 | P a g e w w w . p e r r y m a n g r o u p . c o m C o p y r i g h t 2 0 1 6
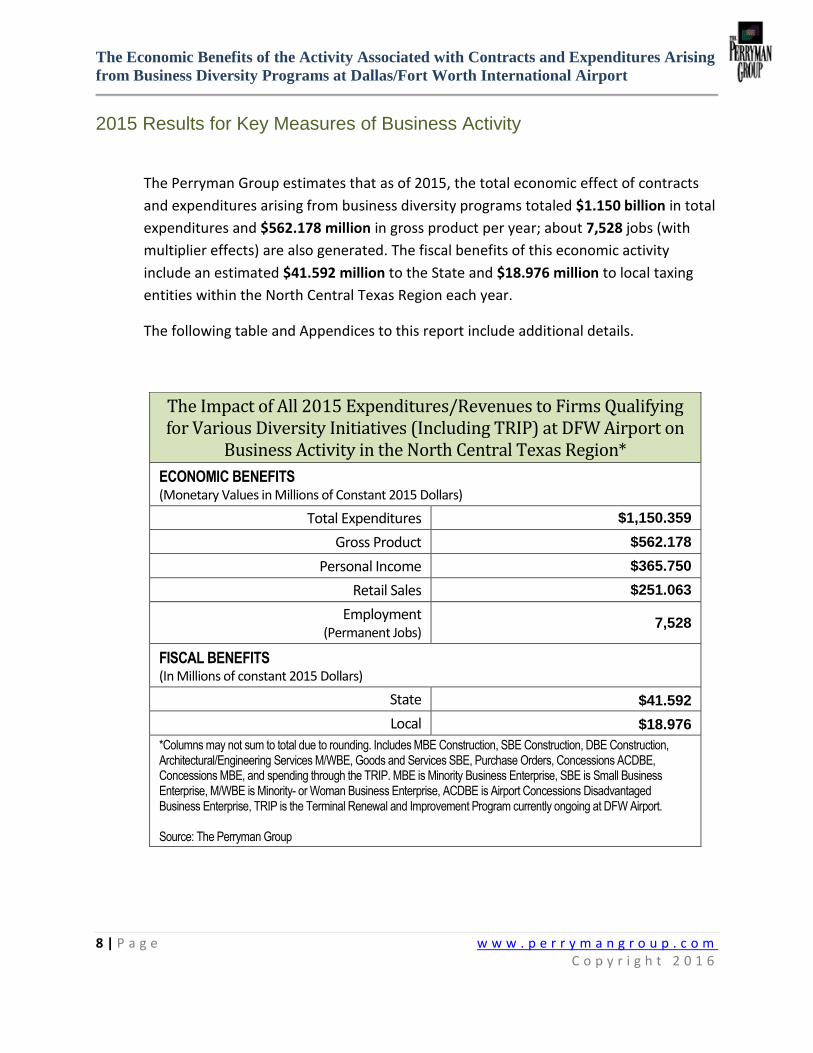
2015 Results for Key Measures of Business Activity
The Perryman Group estimates that as of 2015, the total economic effect of contracts
and expenditures arising from business diversity programs totaled $1.150 billion in total
expenditures and $562.178 million in gross product per year; about 7,528 jobs (with
multiplier effects) are also generated. The fiscal benefits of this economic activity
include an estimated $41.592 million to the State and $18.976 million to local taxing
entities within the North Central Texas Region each year.
The following table and Appendices to this report include additional details.
The Impact of All 2015 Expenditures/Revenues to Firms Qualifying for Various Diversity Initiatives (Including TRIP) at DFW Airport on
Business Activity in the North Central Texas Region*
ECONOMIC BENEFITS (Monetary Values in Millions of Constant 2015 Dollars)
Total Expenditures $1,150.359
Gross Product $562.178
Personal Income $365.750
Retail Sales $251.063
Employment (Permanent Jobs)
7,528
FISCAL BENEFITS (In Millions of constant 2015 Dollars)
State $41.592
Local $18.976
*Columns may not sum to total due to rounding. Includes MBE Construction, SBE Construction, DBE Construction, Architectural/Engineering Services M/WBE, Goods and Services SBE, Purchase Orders, Concessions ACDBE, Concessions MBE, and spending through the TRIP. MBE is Minority Business Enterprise, SBE is Small Business Enterprise, M/WBE is Minority- or Woman Business Enterprise, ACDBE is Airport Concessions Disadvantaged Business Enterprise, TRIP is the Terminal Renewal and Improvement Program currently ongoing at DFW Airport. Source: The Perryman Group

The Economic Benefits of the Activity Associated with Contracts and Expenditures Arising
from Business Diversity Programs at Dallas/Fort Worth International Airport
9 | P a g e w w w . p e r r y m a n g r o u p . c o m C o p y r i g h t 2 0 1 6
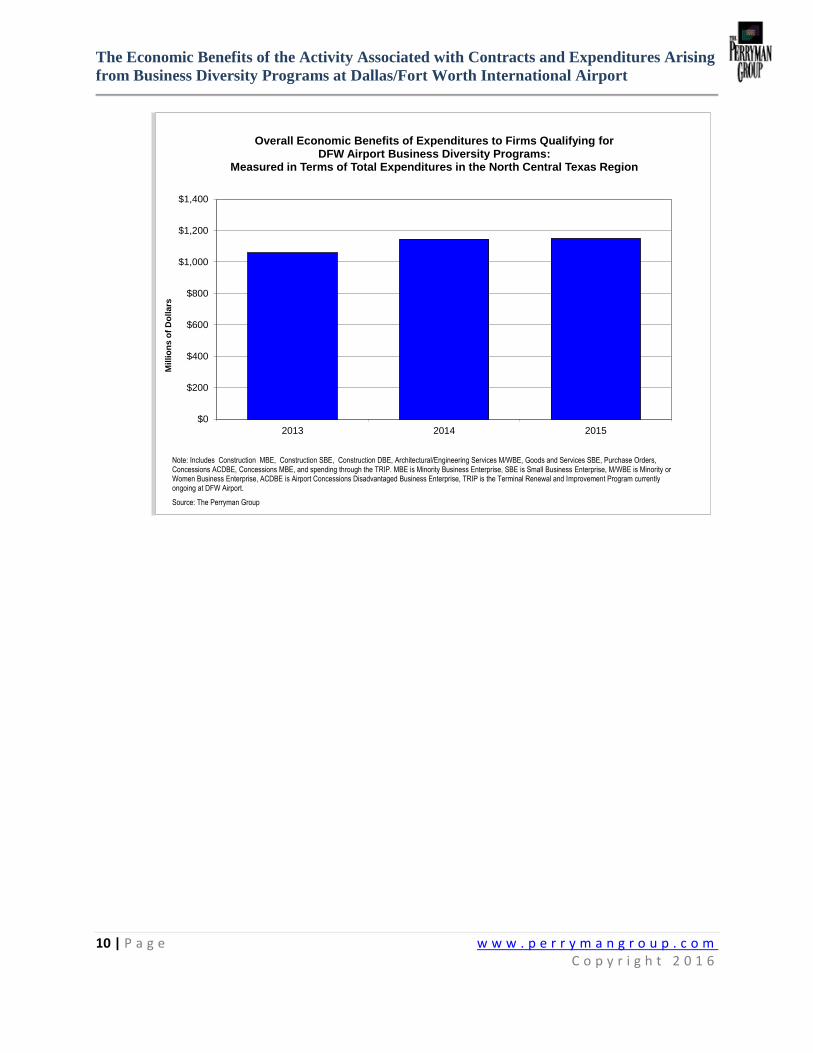
2013-2015 Results for Total Expenditures and Employment
The Perryman Group quantified the overall economic effects by program for 2013
through 2015. Overall benefits of expenditures to firms qualifying for DFW Aiport
business diversity programs have grown significantly over the past several years.
Total expenditures in the North Central Texas Region (including multiplier effects)
associated with firms participating in DFW Airport business diversity programs have
risen from $1.059 billion in 2013 to $1.150 billion in 2015, with the non-TRIP portion of
the effects rising from $493.074 million to $678.692 million over the period.
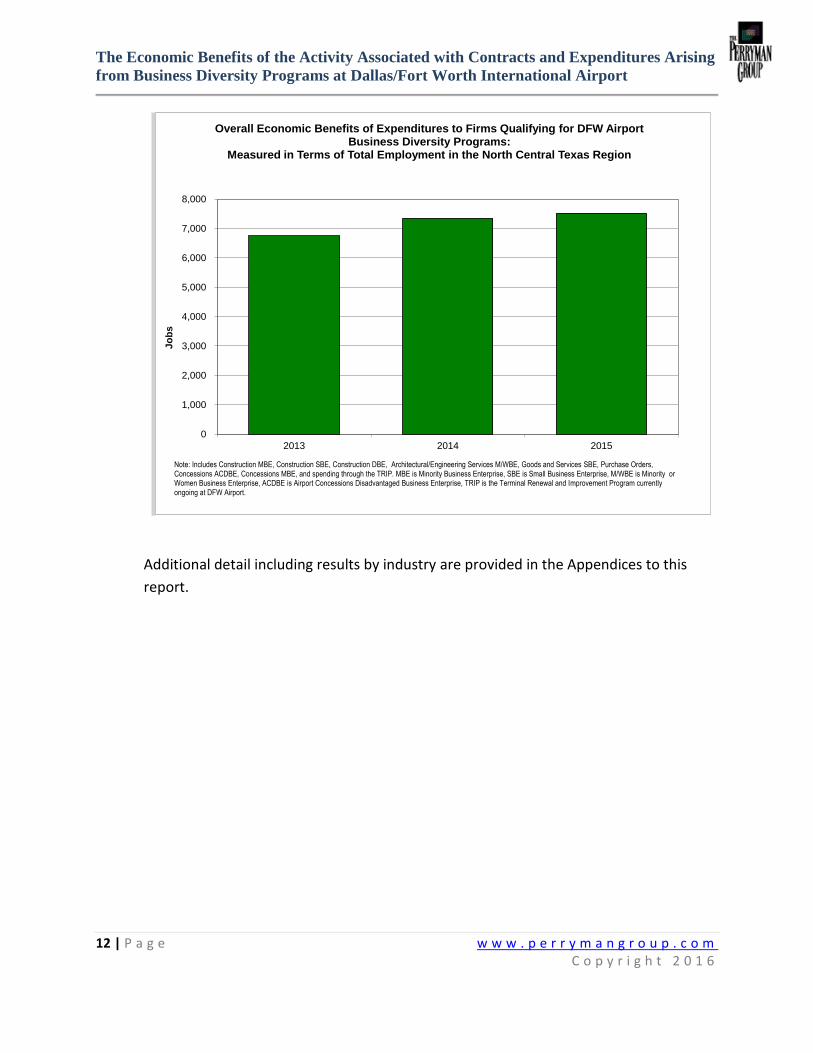
Overall Economic Benefits of Expenditures to Firms Qualifying for
DFW Airport Business Diversity Programs*:
Measured in Terms of Total Expenditures in the North Central Texas Region
(Dollar amounts in Millions of 2015 Dollars) 2013 2014 2015
Construction MBE $5.396 $73.068 $63.776
Construction SBE $1.242 $.827 $2.671
Construction DBE $32.346 $30.622 $16.505
Architectural/Engineering Services M/WBE
$7.490 $17.816 $20.380
Goods and Services SBE $3.764 $25.983 $63.525
Purchase Orders $13.359 $2.981 $6.273
Concessions ACDBE $350.964 $376.522 $413.601
Concessions MBE $78.513 $79.146 $91.960
TOTAL (excluding TRIP) $493.074 $606.965 $678.692
TRIP $565.497 $538.333 $471.667
OVERALL TOTAL $1,058.571 $1,145.298 $1,150.359 *The Perryman Group’s US Multi-Regional Impact Assessment System was utilized to quantify the total economic benefits (including multiplier effects) of all expenditures associated with various business diversity programs at DFW Airport. MBE is Minority Business Enterprise, SBE is Small Business Enterprise, M/WBE is Minority or Women Business Enterprise, ACDBE is Airport Concessions Disadvantaged Business Enterprise, TRIP is the Terminal Renewal and Improvement Program currently ongoing at DFW Airport. Measured in terms of Total Expenditures, which reflects every dollar changing hands in the economy as a result of the economic stimulus. Columns may not sum to totals due to rounding. For additional detail regarding effects on other measures of business activity and results by industrial sector, see the remainder of this report and the Appendices. Source: The Perryman Group
The Economic Benefits of the Activity Associated with Contracts and Expenditures Arising
from Business Diversity Programs at Dallas/Fort Worth International Airport
10 | P a g e w w w . p e r r y m a n g r o u p . c o m C o p y r i g h t 2 0 1 6
$0
$200
$400
$600
$800
$1,000
$1,200
$1,400
2013 2014 2015
Millio
ns o
f D
ollars
Overall Economic Benefits of Expenditures to Firms Qualifying for DFW Airport Business Diversity Programs:
Measured in Terms of Total Expenditures in the North Central Texas Region
Note: Includes Construction MBE, Construction SBE, Construction DBE, Architectural/Engineering Services M/WBE, Goods and Services SBE, Purchase Orders, Concessions ACDBE, Concessions MBE, and spending through the TRIP. MBE is Minority Business Enterprise, SBE is Small Business Enterprise, M/WBE is Minority or Women Business Enterprise, ACDBE is Airport Concessions Disadvantaged Business Enterprise, TRIP is the Terminal Renewal and Improvement Program currently ongoing at DFW Airport.
Source: The Perryman Group
The Economic Benefits of the Activity Associated with Contracts and Expenditures Arising
from Business Diversity Programs at Dallas/Fort Worth International Airport
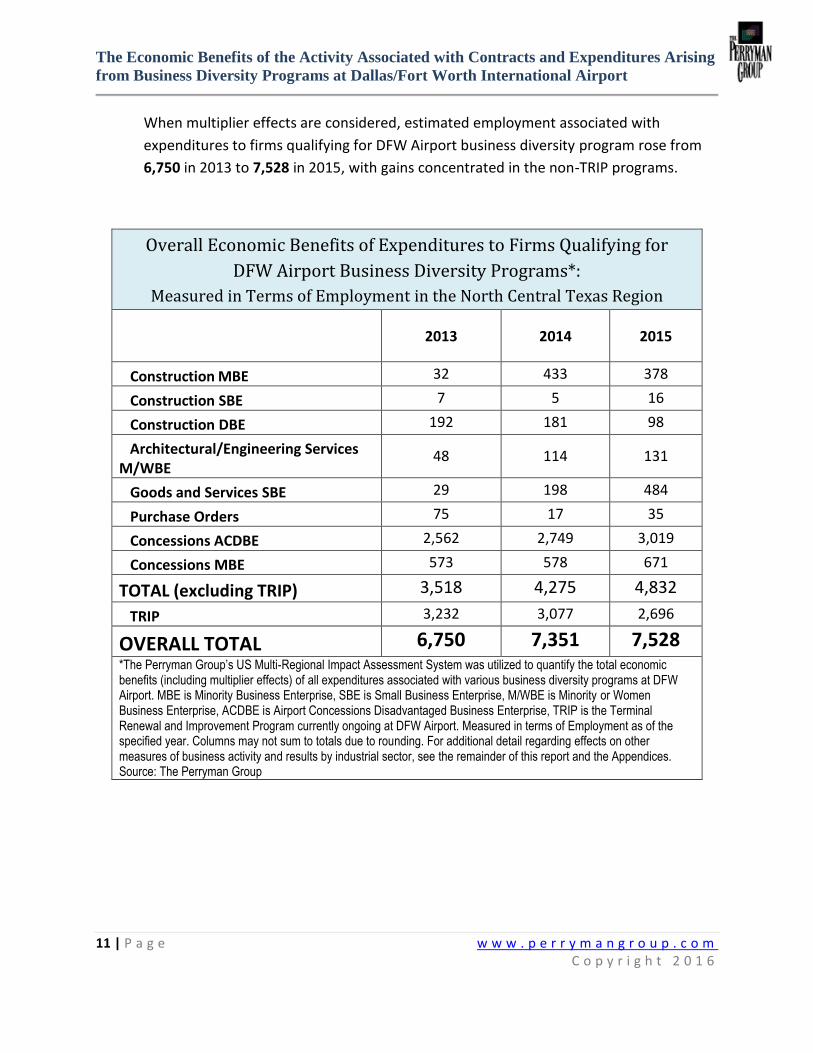
11 | P a g e w w w . p e r r y m a n g r o u p . c o m C o p y r i g h t 2 0 1 6
When multiplier effects are considered, estimated employment associated with
expenditures to firms qualifying for DFW Airport business diversity program rose from
6,750 in 2013 to 7,528 in 2015, with gains concentrated in the non-TRIP programs.
Overall Economic Benefits of Expenditures to Firms Qualifying for
DFW Airport Business Diversity Programs*:
Measured in Terms of Employment in the North Central Texas Region
2013 2014 2015
Construction MBE 32 433 378
Construction SBE 7 5 16
Construction DBE 192 181 98
Architectural/Engineering Services M/WBE
48 114 131
Goods and Services SBE 29 198 484
Purchase Orders 75 17 35
Concessions ACDBE 2,562 2,749 3,019
Concessions MBE 573 578 671
TOTAL (excluding TRIP) 3,518 4,275 4,832
TRIP 3,232 3,077 2,696
OVERALL TOTAL 6,750 7,351 7,528 *The Perryman Group’s US Multi-Regional Impact Assessment System was utilized to quantify the total economic benefits (including multiplier effects) of all expenditures associated with various business diversity programs at DFW Airport. MBE is Minority Business Enterprise, SBE is Small Business Enterprise, M/WBE is Minority or Women Business Enterprise, ACDBE is Airport Concessions Disadvantaged Business Enterprise, TRIP is the Terminal Renewal and Improvement Program currently ongoing at DFW Airport. Measured in terms of Employment as of the specified year. Columns may not sum to totals due to rounding. For additional detail regarding effects on other measures of business activity and results by industrial sector, see the remainder of this report and the Appendices. Source: The Perryman Group
The Economic Benefits of the Activity Associated with Contracts and Expenditures Arising
from Business Diversity Programs at Dallas/Fort Worth International Airport
12 | P a g e w w w . p e r r y m a n g r o u p . c o m C o p y r i g h t 2 0 1 6
Additional detail including results by industry are provided in the Appendices to this
report.
0
1,000
2,000
3,000
4,000
5,000
6,000
7,000
8,000
2013 2014 2015
Jo
bs
Overall Economic Benefits of Expenditures to Firms Qualifying for DFW Airport Business Diversity Programs:
Measured in Terms of Total Employment in the North Central Texas Region
Note: Includes Construction MBE, Construction SBE, Construction DBE, Architectural/Engineering Services M/WBE, Goods and Services SBE, Purchase Orders, Concessions ACDBE, Concessions MBE, and spending through the TRIP. MBE is Minority Business Enterprise, SBE is Small Business Enterprise, M/WBE is Minority or Women Business Enterprise, ACDBE is Airport Concessions Disadvantaged Business Enterprise, TRIP is the Terminal Renewal and Improvement Program currently ongoing at DFW Airport.
The Economic Benefits of the Activity Associated with Contracts and Expenditures Arising
from Business Diversity Programs at Dallas/Fort Worth International Airport
13 | P a g e w w w . p e r r y m a n g r o u p . c o m C o p y r i g h t 2 0 1 6
The Perryman Group estimates
that when multiplier effects are
considered, revenues to firms
qualifying for business diversity
programs at DFW Airport
generate gains in business activity
in the North Central Texas Region
of about $1.150 billion in total
expenditures and $562.178 million
in output (gross product), as well
as 7,528 permanent jobs.
Conclusion
DFW Airport is a crucial aspect of the North Central Texas regional economy. In addition,
it generates opportunities for small businesses as well
as those owned by minorities and women. These
opportunites range from concessions at the Airport to
contracts for construction projects or the procurement
of various goods and services. The revenues to these
historically underutilized businesses have been growing
over time.
The direct spending/revenues to firms qualifying for
various DFW Airport business diversity programs in
2015 totaled $383.822 million. When multiplier effects
are considered, this spending led to gains in business
activity in the North Central Texas Region of $1.150
billion in total expenditures and $562.178 million in output (gross product), as well as
7,528 permanent jobs.
DFW Airport is a large and growing source of opportunity for businesses that are small
or owned by women or minorities. In turn, these businesses generate economic activity
across the economy. The recent trend in the magnitude of diversity program awards
indicates the ongoing success of these initiatives and reflects the continuing
commitment of Dallas/Fort Worth International Airport to the entirety of its constituent
community.
The Economic Benefits of the Activity Associated with Contracts and Expenditures Arising
from Business Diversity Programs at Dallas/Fort Worth International Airport
14 | P a g e w w w . p e r r y m a n g r o u p . c o m C o p y r i g h t 2 0 1 6
APPENDICES
The Economic Benefits of the Activity Associated with Contracts and Expenditures Arising
from Business Diversity Programs at Dallas/Fort Worth International Airport
15 | P a g e w w w . p e r r y m a n g r o u p . c o m C o p y r i g h t 2 0 1 6
Appendix A: About The Perryman Group
The Perryman Group (TPG) is an economic research and analysis firm based in Waco, Texas.
The firm has more than 30 years of experience in assessing the economic impact of corporate
expansions, regulatory changes, real estate developments, public policy initiatives, and myriad
other factors affecting business activity. TPG has conducted hundreds of impact analyses for
local areas, regions, and states throughout the United States. Impact studies have been
performed for hundreds of clients including many of the largest corporations in the world,
governmental entities at all levels, educational institutions, major health care systems, utilities,
and economic development organizations.
Dr. M. Ray Perryman, founder and President of the firm, developed the US Multi-Regional
Impact Assessment System (USMRIAS—used in this study) in the early 1980s and has
consistently maintained, expanded, and updated it since that time. The model has been used in
hundreds of diverse applications and has an excellent reputation for reliability.
The Perryman Group has analyzed the economic and fiscal aspects of a broad range of
corporate locations, infrastructure projects, mixed-use real estate developments, and
regulatory changes. The firm has completed hundreds of economic impact and market studies
for corporations and communities throughout the United States, and is, thus, particularly well
equipped for a study of the gains in business activity stemming from the DFW Airport and
surrounding development.
The firm has analyzed major transportation infrastructure including toll roads, port facilities,
and airports. Projects include Fort Worth Alliance Airport and recent expansions of the Port of
Houston and the Port of Charleston. Major mixed-use real estate developments have also been
analyzed on a number of occasions, including the new ExxonMobil facility in the Houston area
and the surrounding properties. The Perryman Group has also been preparing regular forecasts
and other detailed assessments of economic conditions for the North Central Texas Region as
well as the metropolitan statistical areas located therein and has examined diversity programs
in several regions across the country. Additionally, TPG recently prepared a comprehensive
assessment of the overall economic and fiscal effects of DFW Airport.

The Economic Benefits of the Activity Associated with Contracts and Expenditures Arising
from Business Diversity Programs at Dallas/Fort Worth International Airport
16 | P a g e w w w . p e r r y m a n g r o u p . c o m C o p y r i g h t 2 0 1 6
Appendix B: Methods Used
US Multi-Regional Impact Assessment System (USMRIAS)
The basic modeling technique employed in this study is known as dynamic input-output
analysis. This methodology essentially uses extensive survey data, industry information, and a
variety of corroborative source materials to create a matrix describing the various goods and
services (known as resources or inputs) required to produce one unit (a dollar’s worth) of
output for a given sector. Once the base information is compiled, it can be mathematically
simulated to generate evaluations of the magnitude of successive rounds of activity involved in
the overall production process.
There are two essential steps in conducting an input-output analysis once the system is
operational. The first major endeavor is to accurately define the levels of direct activity to be
evaluated. In this instance, DFW Airport provided data regarding (1) payments to firms
qualifying for various programs and (2) revenues to firms qualifying for concessions programs.
In some categories, allocations were required across multiple industry segments and were
determined based on overall spending patterns in the specific diversity category.
The second major phase of the analysis is the simulation of the input-output system to measure
overall economic effects of the projects facilitated by the sales tax for economic development.
The present study was conducted within the context of the USMRIAS which was developed and
is maintained by The Perryman Group. This model has been used in hundreds of diverse
applications across the country and has an excellent reputation for accuracy and credibility.
The systems used in the current simulations reflect the unique industrial structures and
characteristics of the North Central Texas Region (Collin, Dallas, Denton, Ellis, Erath, Hood,
Hunt, Johnson, Kaufman, Navarro, Palo Pinto, Parker, Rockwall, Somervell, Tarrant, and Wise
counties). A tourism module within the model was utilized to analyze visitor spending.
The USMRIAS is somewhat similar in format to the Input-Output Model of the United States
and the Regional Input-Output Modeling System, both of which are maintained by the US
Department of Commerce. The model developed by TPG, however, incorporates several
important enhancements and refinements. Specifically, the expanded system includes (1)
comprehensive 500-sector coverage for any county, multi-county, or urban region; (2)
calculation of both total expenditures and value-added by industry and region; (3) direct
estimation of expenditures for multiple basic input choices (expenditures, output, income, or

The Economic Benefits of the Activity Associated with Contracts and Expenditures Arising
from Business Diversity Programs at Dallas/Fort Worth International Airport
17 | P a g e w w w . p e r r y m a n g r o u p . c o m C o p y r i g h t 2 0 1 6
employment); (4) extensive parameter localization; (5) price adjustments for real and nominal
assessments by sectors and areas; (6) measurement of the induced impacts associated with
payrolls and consumer spending; (7) embedded modules to estimate multi-sectoral direct
spending effects; (8) estimation of retail spending activity by consumers; and (9)
comprehensive linkage and integration capabilities with a wide variety of econometric, real
estate, occupational, and fiscal impact models. Moreover, the model uses specific local taxing
patterns to estimate the fiscal effects of activity on a detailed sectoral basis. The models used
for the present investigation have been thoroughly tested for reasonableness and historical
reliability.
The impact assessment (input-output) process essentially estimates the amounts of all types of
goods and services required to produce one unit (a dollar’s worth) of a specific type of output.
For purposes of illustrating the nature of the system, it is useful to think of inputs and outputs
in dollar (rather than physical) terms. As an example, the construction of a new building will
require specific dollar amounts of lumber, glass, concrete, hand tools, architectural services,
interior design services, paint, plumbing, and numerous other elements. Each of these suppliers
must, in turn, purchase additional dollar amounts of inputs. This process continues through
multiple rounds of production, thus generating subsequent increments to business activity.
The initial process of building the facility is known as the direct effect. The ensuing transactions
in the output chain constitute the indirect effect.
Another pattern that arises in response to any direct economic activity comes from the payroll
dollars received by employees at each stage of the production cycle. As workers are
compensated, they use some of their income for taxes, savings, and purchases from external
markets. A substantial portion, however, is spent locally on food, clothing, health care services,
utilities, housing, recreation, and other items. Typical purchasing patterns in the relevant areas
are obtained from the ACCRA Cost of Living Index, a privately compiled inter-regional measure
which has been widely used for several decades, and the Consumer Expenditure Survey of the
US Department of Labor. These initial outlays by area residents generate further secondary
activity as local providers acquire inputs to meet this consumer demand. These consumer
spending impacts are known as the induced effect. The USMRIAS is designed to provide
realistic, yet conservative, estimates of these phenomena.
Sources for information used in this process include the Bureau of the Census, the Bureau of
Labor Statistics, the Regional Economic Information System of the US Department of
Commerce, and other public and private sources. The pricing data are compiled from the US

The Economic Benefits of the Activity Associated with Contracts and Expenditures Arising
from Business Diversity Programs at Dallas/Fort Worth International Airport
18 | P a g e w w w . p e r r y m a n g r o u p . c o m C o p y r i g h t 2 0 1 6
Department of Labor and the US Department of Commerce. The verification and testing
procedures make use of extensive public and private sources.
Impacts were measured in constant 2015 dollars to eliminate the effects of inflation and for
consistency with The Perryman Group’s overall analysis of the economic and fiscal effects of
DFW Airport. Note that totals may not add due to rounding.
The USMRIAS generates estimates of the effect on several measures of business activity. The
most comprehensive measure of economic activity used in this study is Total Expenditures. This
measure incorporates every dollar that changes hands in any transaction. For example,
suppose a farmer sells wheat to a miller for $0.50; the miller then sells flour to a baker for
$0.75; the baker, in turn, sells bread to a customer for $1.25. The Total Expenditures recorded
in this instance would be $2.50, that is, $0.50 + $0.75 + $1.25. This measure is quite broad, but
is useful in that (1) it reflects the overall interplay of all industries in the economy, and (2) some
key fiscal variables such as sales taxes are linked to aggregate spending.
A second measure of business activity frequently employed in this analysis is that of Gross
Product. This indicator represents the regional equivalent of Gross Domestic Product, the most
commonly reported statistic regarding national economic performance. In other words, the
Gross Product of Texas is the amount of US output that is produced in that state; it is defined as
the value of all final goods produced in a given region for a specific period of time. Stated
differently, it captures the amount of value-added (gross area product) over intermediate
goods and services at each stage of the production process, that is, it eliminates the double
counting in the Total Expenditures concept. Using the example above, the Gross Product is
$1.25 (the value of the bread) rather than $2.50. Alternatively, it may be viewed as the sum of
the value-added by the farmer, $0.50; the miller, $0.25 ($0.75 - $0.50); and the baker, $0.50
($1.25 - $0.75). The total value-added is, therefore, $1.25, which is equivalent to the final value
of the bread. In many industries, the primary component of value-added is the wage and salary
payments to employees.
The third gauge of economic activity used in this evaluation is Personal Income. As the name
implies, Personal Income is simply the income received by individuals, whether in the form of
wages, salaries, interest, dividends, proprietors’ profits, or other sources. It may thus be viewed
as the segment of overall impacts which flows directly to the citizenry.
The fourth measure, Retail Sales, represents the component of Total Expenditures which
occurs in retail outlets (general merchandise stores, automobile dealers and service stations,

The Economic Benefits of the Activity Associated with Contracts and Expenditures Arising
from Business Diversity Programs at Dallas/Fort Worth International Airport
19 | P a g e w w w . p e r r y m a n g r o u p . c o m C o p y r i g h t 2 0 1 6
building materials stores, food stores, drugstores, restaurants, and so forth). Retail Sales is a
commonly used measure of consumer activity.
The final aggregates used are Permanent Jobs and Person-Years of Employment. The Person-
Years of Employment measure reveals the full-time equivalent jobs generated by an activity. It
should be noted that, unlike the dollar values described above, Permanent Jobs is a “stock”
rather than a “flow.” In other words, if an area produces $1 million in output in 2014 and $1
million in 2015, it is appropriate to say that $2 million was achieved in the 2014-2015 period. If
the same area has 100 people working in 2014 and 100 in 2015, it only has 100 Permanent
Jobs. When a flow of jobs is measured, such as in a construction project or a cumulative
assessment over multiple years, it is appropriate to measure employment in Person-Years (a
person working for a year). This concept is distinct from Permanent Jobs, which anticipates that
the relevant positions will be maintained on a continuing basis.
The USMRIAS is also linked to a fiscal model, which links the tax payments by industry to the
specific rates and structures associated with the relevant State and local governmental
authorities.
The Economic Benefits of the Activity Associated with Contracts and Expenditures Arising
from Business Diversity Programs at Dallas/Fort Worth International Airport
20 | P a g e w w w . p e r r y m a n g r o u p . c o m C o p y r i g h t 2 0 1 6
Appendix C: Detailed Sectoral Results
The Economic Benefits of the Activity Associated with Contracts and Expenditures Arising
from Business Diversity Programs at Dallas/Fort Worth International Airport
21 | P a g e w w w . p e r r y m a n g r o u p . c o m C o p y r i g h t 2 0 1 6
Impact of Construction Expenditures Awarded to Firms Qualifying for the
DFW Airport Minority Business Enterprise (MBE) Program

The Economic Benefits of the Activity Associated with Contracts and Expenditures Arising
from Business Diversity Programs at Dallas/Fort Worth International Airport
22 | P a g e w w w . p e r r y m a n g r o u p . c o m C o p y r i g h t 2 0 1 6
The Impact of 2013 Construction Expenditures Awarded to Firms Qualifying for the DFW Airport Minority Business
Enterprise (MBE) Program on Business Activity in the North Central Texas Region
Sector
Total Expenditures
Gross Product
Personal Income
Employment
(2015 Dollars) (2015 Dollars) (2015 Dollars) (Jobs)
Agriculture $31,517 $8,730 $5,862 0
Mining $48,879 $12,171 $6,604 0
Construction $1,719,260 $849,555 $700,086 10
Nondurable Manufacturing
$366,388 $115,879 $61,339 1
Durable Manufacturing
$511,308 $202,238 $127,733 2
Transportation and Utilities
$324,178 $153,042 $94,032 1
Information $104,721 $64,592 $27,869 0
Wholesale Trade $226,186 $153,070 $88,262 1
Retail Trade $701,028 $529,552 $308,473 10
Finance, Insurance, and Real Estate
$693,283 $169,607 $68,818 1
Business Services
$253,550 $158,556 $129,341 2
Health Services $145,318 $101,805 $86,077 1
Other Services $270,573 $138,616 $110,581 3
TOTAL $5,396,190 $2,657,414 $1,815,078 32
Source: US Multi-Regional Impact Assessment System, The Perryman Group

The Economic Benefits of the Activity Associated with Contracts and Expenditures Arising
from Business Diversity Programs at Dallas/Fort Worth International Airport
23 | P a g e w w w . p e r r y m a n g r o u p . c o m C o p y r i g h t 2 0 1 6
The Impact of 2014 Construction Expenditures Awarded to Firms Qualifying for the DFW Airport Minority Business
Enterprise (MBE) Program on Business Activity in the North Central Texas Region
Sector
Total Expenditures
Gross Product
Personal Income
Employment
(2015 Dollars) (2015 Dollars) (2015 Dollars) (Jobs)
Agriculture $426,761 $118,209 $79,378 1
Mining $661,851 $164,802 $89,418 1
Construction $23,279,964 $11,503,559 $9,479,649 137
Nondurable Manufacturing
$4,961,145 $1,569,084 $830,575 15
Durable Manufacturing
$6,923,465 $2,738,441 $1,729,595 27
Transportation and Utilities
$4,389,592 $2,072,298 $1,273,262 16
Information $1,417,998 $874,626 $377,362 4
Wholesale Trade $3,062,710 $2,072,676 $1,195,124 14
Retail Trade $9,492,405 $7,170,497 $4,176,939 130
Finance, Insurance, and Real Estate
$9,387,526 $2,296,589 $931,846 10
Business Services
$3,433,239 $2,146,963 $1,751,372 22
Health Services $1,967,705 $1,378,505 $1,165,538 20
Other Services $3,663,747 $1,876,957 $1,497,336 36
TOTAL $73,068,110 $35,983,206 $24,577,394 433
Source: US Multi-Regional Impact Assessment System, The Perryman Group

The Economic Benefits of the Activity Associated with Contracts and Expenditures Arising
from Business Diversity Programs at Dallas/Fort Worth International Airport
24 | P a g e w w w . p e r r y m a n g r o u p . c o m C o p y r i g h t 2 0 1 6
The Impact of 2015 Construction Expenditures Awarded to Firms Qualifying for the DFW Airport Minority Business
Enterprise (MBE) Program on Business Activity in the North Central Texas Region
Sector
Total Expenditures
Gross Product
Personal Income
Employment
(2015 Dollars) (2015 Dollars) (2015 Dollars) (Jobs)
Agriculture $372,487 $103,176 $69,283 1
Mining $577,679 $143,843 $78,046 1
Construction $20,319,293 $10,040,573 $8,274,058 120
Nondurable Manufacturing
$4,330,203 $1,369,533 $724,945 13
Durable Manufacturing
$6,042,961 $2,390,175 $1,509,631 24
Transportation and Utilities
$3,831,338 $1,808,750 $1,111,332 14
Information $1,237,661 $763,394 $329,370 3
Wholesale Trade $2,673,205 $1,809,080 $1,043,132 12
Retail Trade $8,285,192 $6,258,576 $3,645,729 114
Finance, Insurance, and Real Estate
$8,193,651 $2,004,516 $813,337 9
Business Services
$2,996,610 $1,873,920 $1,528,638 19
Health Services $1,717,459 $1,203,191 $1,017,309 17
Other Services $3,197,803 $1,638,252 $1,306,910 31
TOTAL $63,775,542 $31,406,977 $21,451,720 378
Source: US Multi-Regional Impact Assessment System, The Perryman Group

The Economic Benefits of the Activity Associated with Contracts and Expenditures Arising
from Business Diversity Programs at Dallas/Fort Worth International Airport
25 | P a g e w w w . p e r r y m a n g r o u p . c o m C o p y r i g h t 2 0 1 6
The Impact of Construction Expenditures Awarded to Firms Qualifying for
the DFW Airport Small Business Enterprise (SBE) Program
The Economic Benefits of the Activity Associated with Contracts and Expenditures Arising
from Business Diversity Programs at Dallas/Fort Worth International Airport
26 | P a g e w w w . p e r r y m a n g r o u p . c o m C o p y r i g h t 2 0 1 6
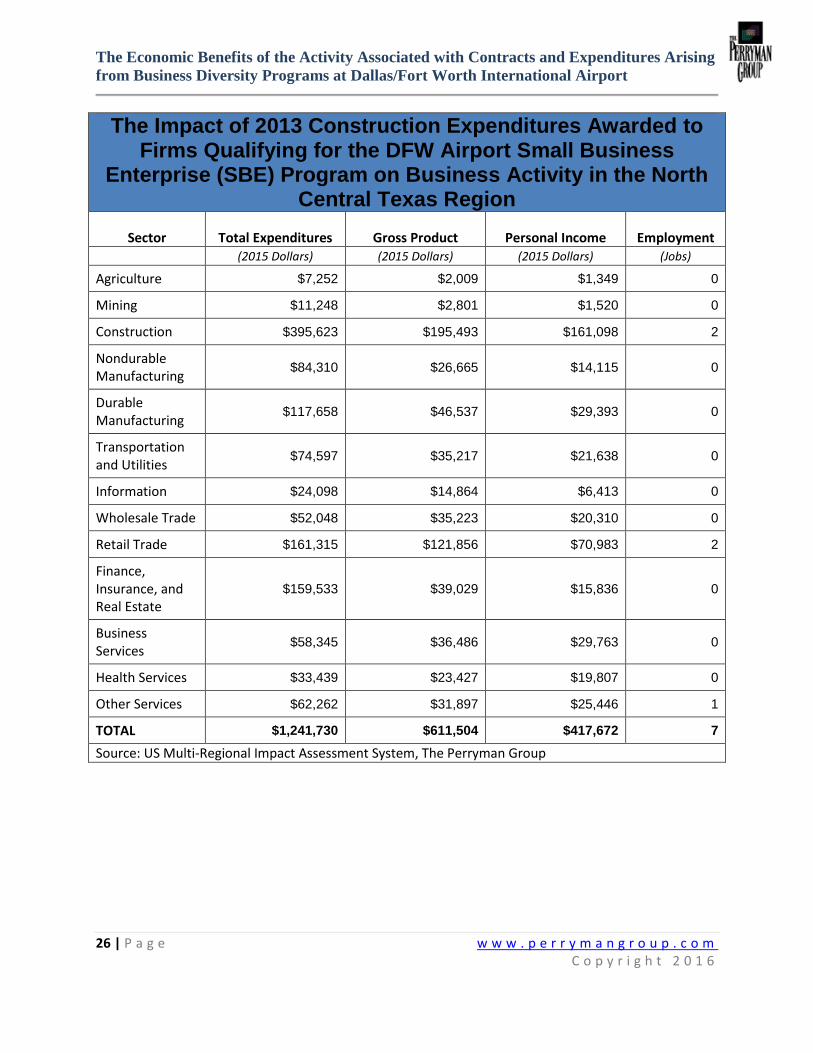
The Impact of 2013 Construction Expenditures Awarded to Firms Qualifying for the DFW Airport Small Business
Enterprise (SBE) Program on Business Activity in the North Central Texas Region
Sector
Total Expenditures
Gross Product
Personal Income
Employment
(2015 Dollars) (2015 Dollars) (2015 Dollars) (Jobs)
Agriculture $7,252 $2,009 $1,349 0
Mining $11,248 $2,801 $1,520 0
Construction $395,623 $195,493 $161,098 2
Nondurable Manufacturing
$84,310 $26,665 $14,115 0
Durable Manufacturing
$117,658 $46,537 $29,393 0
Transportation and Utilities
$74,597 $35,217 $21,638 0
Information $24,098 $14,864 $6,413 0
Wholesale Trade $52,048 $35,223 $20,310 0
Retail Trade $161,315 $121,856 $70,983 2
Finance, Insurance, and Real Estate
$159,533 $39,029 $15,836 0
Business Services
$58,345 $36,486 $29,763 0
Health Services $33,439 $23,427 $19,807 0
Other Services $62,262 $31,897 $25,446 1
TOTAL $1,241,730 $611,504 $417,672 7
Source: US Multi-Regional Impact Assessment System, The Perryman Group

The Economic Benefits of the Activity Associated with Contracts and Expenditures Arising
from Business Diversity Programs at Dallas/Fort Worth International Airport
27 | P a g e w w w . p e r r y m a n g r o u p . c o m C o p y r i g h t 2 0 1 6
The Impact of 2014 Construction Expenditures Awarded to Firms Qualifying for the DFW Airport Small Business
Enterprise (SBE) Program on Business Activity in the North Central Texas Region
Sector
Total Expenditures
Gross Product
Personal Income
Employment
(2015 Dollars) (2015 Dollars) (2015 Dollars) (Jobs)
Agriculture $4,831 $1,338 $899 0
Mining $7,492 $1,865 $1,012 0
Construction $263,516 $130,214 $107,304 2
Nondurable Manufacturing
$56,157 $17,761 $9,402 0
Durable Manufacturing
$78,370 $30,998 $19,578 0
Transportation and Utilities
$49,688 $23,457 $14,413 0
Information $16,051 $9,900 $4,272 0
Wholesale Trade $34,668 $23,462 $13,528 0
Retail Trade $107,449 $81,166 $47,281 1
Finance, Insurance, and Real Estate
$106,262 $25,996 $10,548 0
Business Services
$38,862 $24,302 $19,825 0
Health Services $22,273 $15,604 $13,193 0
Other Services $41,472 $21,246 $16,949 0
TOTAL $827,091 $407,310 $278,203 5
Source: US Multi-Regional Impact Assessment System, The Perryman Group

The Economic Benefits of the Activity Associated with Contracts and Expenditures Arising
from Business Diversity Programs at Dallas/Fort Worth International Airport
28 | P a g e w w w . p e r r y m a n g r o u p . c o m C o p y r i g h t 2 0 1 6
The Impact of 2015 Construction Expenditures Awarded to Firms Qualifying for the DFW Airport Small Business
Enterprise (SBE) Program on Business Activity in the North Central Texas Region
Sector
Total Expenditures
Gross Product
Personal Income
Employment
(2015 Dollars) (2015 Dollars) (2015 Dollars) (Jobs)
Agriculture $15,603 $4,322 $2,902 0
Mining $24,198 $6,025 $3,269 0
Construction $851,130 $420,577 $346,582 5
Nondurable Manufacturing
$181,383 $57,367 $30,366 1
Durable Manufacturing
$253,126 $100,119 $63,235 1
Transportation and Utilities
$160,486 $75,765 $46,551 1
Information $51,843 $31,977 $13,797 0
Wholesale Trade $111,975 $75,778 $43,694 1
Retail Trade $347,048 $262,158 $152,711 5
Finance, Insurance, and Real Estate
$343,214 $83,965 $34,069 0
Business Services
$125,521 $78,494 $64,031 1
Health Services $71,941 $50,399 $42,613 1
Other Services $133,949 $68,623 $54,744 1
TOTAL $2,671,415 $1,315,568 $898,565 16
Source: US Multi-Regional Impact Assessment System, The Perryman Group

The Economic Benefits of the Activity Associated with Contracts and Expenditures Arising
from Business Diversity Programs at Dallas/Fort Worth International Airport
29 | P a g e w w w . p e r r y m a n g r o u p . c o m C o p y r i g h t 2 0 1 6
The Impact of Construction Expenditures Awarded to Firms Qualifying for
the Federal Disadvantaged Business Enterprise (DBE) Program
The Economic Benefits of the Activity Associated with Contracts and Expenditures Arising
from Business Diversity Programs at Dallas/Fort Worth International Airport
30 | P a g e w w w . p e r r y m a n g r o u p . c o m C o p y r i g h t 2 0 1 6
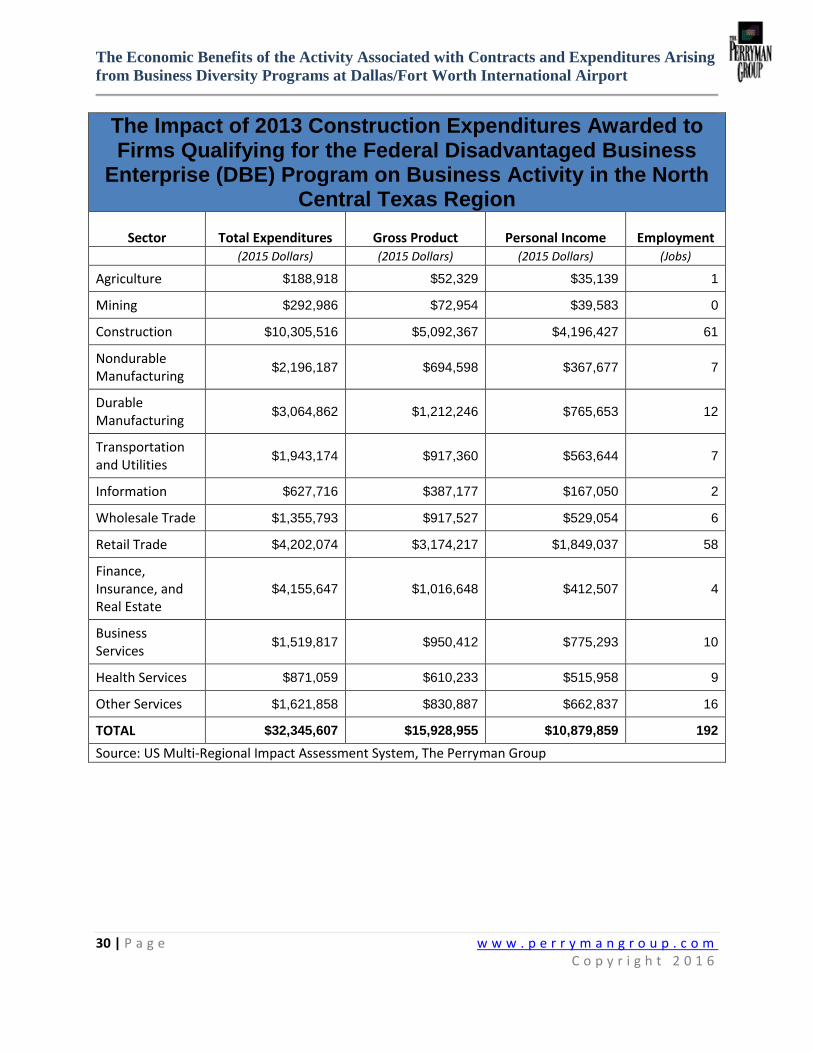
The Impact of 2013 Construction Expenditures Awarded to Firms Qualifying for the Federal Disadvantaged Business
Enterprise (DBE) Program on Business Activity in the North Central Texas Region
Sector
Total Expenditures
Gross Product
Personal Income
Employment
(2015 Dollars) (2015 Dollars) (2015 Dollars) (Jobs)
Agriculture $188,918 $52,329 $35,139 1
Mining $292,986 $72,954 $39,583 0
Construction $10,305,516 $5,092,367 $4,196,427 61
Nondurable Manufacturing
$2,196,187 $694,598 $367,677 7
Durable Manufacturing
$3,064,862 $1,212,246 $765,653 12
Transportation and Utilities
$1,943,174 $917,360 $563,644 7
Information $627,716 $387,177 $167,050 2
Wholesale Trade $1,355,793 $917,527 $529,054 6
Retail Trade $4,202,074 $3,174,217 $1,849,037 58
Finance, Insurance, and Real Estate
$4,155,647 $1,016,648 $412,507 4
Business Services
$1,519,817 $950,412 $775,293 10
Health Services $871,059 $610,233 $515,958 9
Other Services $1,621,858 $830,887 $662,837 16
TOTAL $32,345,607 $15,928,955 $10,879,859 192
Source: US Multi-Regional Impact Assessment System, The Perryman Group

The Economic Benefits of the Activity Associated with Contracts and Expenditures Arising
from Business Diversity Programs at Dallas/Fort Worth International Airport
31 | P a g e w w w . p e r r y m a n g r o u p . c o m C o p y r i g h t 2 0 1 6
The Impact of 2014 Construction Expenditures Awarded to Firms Qualifying for the Federal Disadvantaged Business
Enterprise (DBE) Program on Business Activity in the North Central Texas Region
Sector
Total Expenditures
Gross Product
Personal Income
Employment
(2015 Dollars) (2015 Dollars) (2015 Dollars) (Jobs)
Agriculture $178,852 $49,540 $33,267 1
Mining $277,375 $69,067 $37,474 0
Construction $9,756,406 $4,821,029 $3,972,829 57
Nondurable Manufacturing
$2,079,168 $657,588 $348,086 6
Durable Manufacturing
$2,901,557 $1,147,654 $724,856 11
Transportation and Utilities
$1,839,635 $868,480 $533,612 7
Information $594,269 $366,547 $158,149 2
Wholesale Trade $1,283,552 $868,638 $500,865 6
Retail Trade $3,978,175 $3,005,085 $1,750,514 55
Finance, Insurance, and Real Estate
$3,934,221 $962,478 $390,528 4
Business Services
$1,438,837 $899,771 $733,983 9
Health Services $824,646 $577,718 $488,466 8
Other Services $1,535,441 $786,614 $627,519 15
TOTAL $30,622,132 $15,080,211 $10,300,146 181
Source: US Multi-Regional Impact Assessment System, The Perryman Group

The Economic Benefits of the Activity Associated with Contracts and Expenditures Arising
from Business Diversity Programs at Dallas/Fort Worth International Airport
32 | P a g e w w w . p e r r y m a n g r o u p . c o m C o p y r i g h t 2 0 1 6
The Impact of 2015 Construction Expenditures Awarded to Firms Qualifying for the Federal Disadvantaged Business
Enterprise (DBE) Program on Business Activity in the North Central Texas Region
Sector
Total Expenditures
Gross Product
Personal Income
Employment
(2015 Dollars) (2015 Dollars) (2015 Dollars) (Jobs)
Agriculture $96,402 $26,703 $17,931 0
Mining $149,507 $37,227 $20,199 0
Construction $5,258,757 $2,598,561 $2,141,376 31
Nondurable Manufacturing
$1,120,683 $354,443 $187,620 3
Durable Manufacturing
$1,563,955 $618,592 $390,702 6
Transportation and Utilities
$991,574 $468,115 $287,620 4
Information $320,314 $197,571 $85,243 1
Wholesale Trade $691,842 $468,201 $269,969 3
Retail Trade $2,144,258 $1,619,758 $943,537 29
Finance, Insurance, and Real Estate
$2,120,567 $518,781 $210,497 2
Business Services
$775,541 $484,982 $395,621 5
Health Services $444,489 $311,393 $263,286 4
Other Services $827,611 $423,989 $338,236 8
TOTAL $16,505,498 $8,128,317 $5,551,836 98
Source: US Multi-Regional Impact Assessment System, The Perryman Group

The Economic Benefits of the Activity Associated with Contracts and Expenditures Arising
from Business Diversity Programs at Dallas/Fort Worth International Airport
33 | P a g e w w w . p e r r y m a n g r o u p . c o m C o p y r i g h t 2 0 1 6
The Impact of Architectural and Engineering Services Expenditures
Awarded to Firms Qualifying for the DFW Airport Minority and Women
Business Enterprise (M/WBE) Program
The Economic Benefits of the Activity Associated with Contracts and Expenditures Arising
from Business Diversity Programs at Dallas/Fort Worth International Airport
34 | P a g e w w w . p e r r y m a n g r o u p . c o m C o p y r i g h t 2 0 1 6
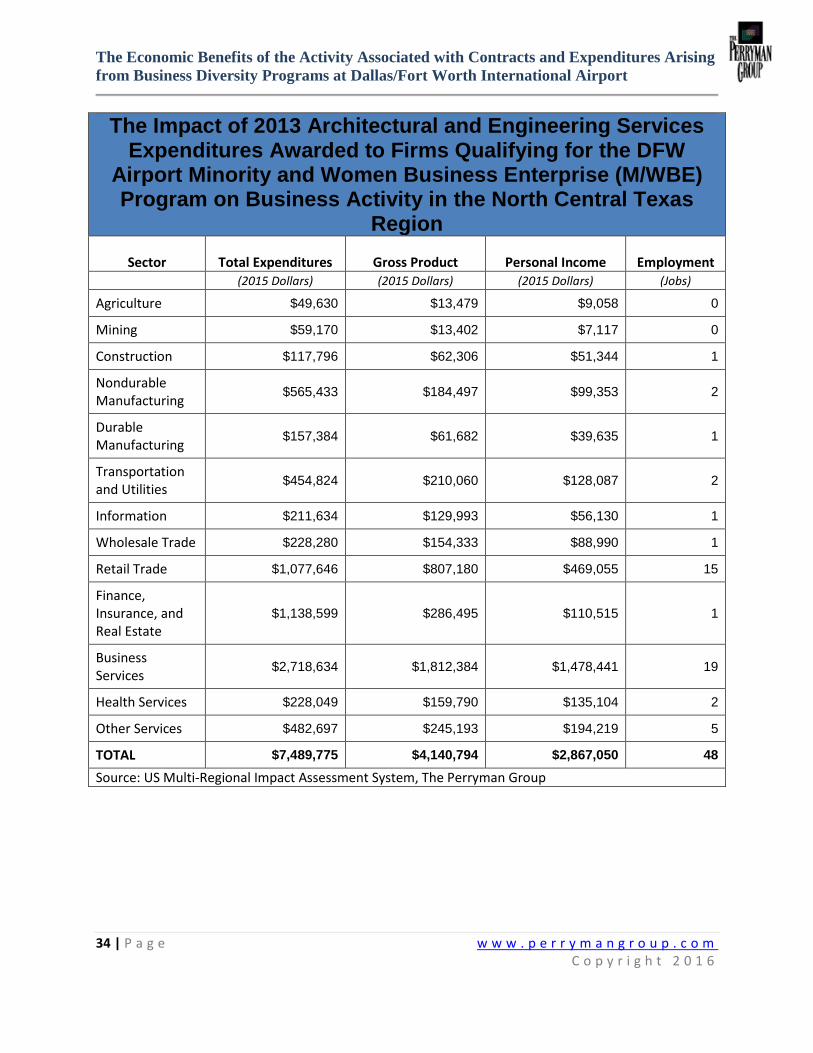
The Impact of 2013 Architectural and Engineering Services Expenditures Awarded to Firms Qualifying for the DFW
Airport Minority and Women Business Enterprise (M/WBE) Program on Business Activity in the North Central Texas
Region
Sector
Total Expenditures
Gross Product
Personal Income
Employment
(2015 Dollars) (2015 Dollars) (2015 Dollars) (Jobs)
Agriculture $49,630 $13,479 $9,058 0
Mining $59,170 $13,402 $7,117 0
Construction $117,796 $62,306 $51,344 1
Nondurable Manufacturing
$565,433 $184,497 $99,353 2
Durable Manufacturing
$157,384 $61,682 $39,635 1
Transportation and Utilities
$454,824 $210,060 $128,087 2
Information $211,634 $129,993 $56,130 1
Wholesale Trade $228,280 $154,333 $88,990 1
Retail Trade $1,077,646 $807,180 $469,055 15
Finance, Insurance, and Real Estate
$1,138,599 $286,495 $110,515 1
Business Services
$2,718,634 $1,812,384 $1,478,441 19
Health Services $228,049 $159,790 $135,104 2
Other Services $482,697 $245,193 $194,219 5
TOTAL $7,489,775 $4,140,794 $2,867,050 48
Source: US Multi-Regional Impact Assessment System, The Perryman Group

The Economic Benefits of the Activity Associated with Contracts and Expenditures Arising
from Business Diversity Programs at Dallas/Fort Worth International Airport
35 | P a g e w w w . p e r r y m a n g r o u p . c o m C o p y r i g h t 2 0 1 6
The Impact of 2014 Architectural and Engineering Services Expenditures Awarded to Firms Qualifying for the DFW
Airport Minority and Women Business Enterprise (M/WBE) Program on Business Activity in the North Central Texas
Region
Sector
Total Expenditures
Gross Product
Personal Income
Employment
(2015 Dollars) (2015 Dollars) (2015 Dollars) (Jobs)
Agriculture $118,055 $32,062 $21,548 0
Mining $140,750 $31,880 $16,930 0
Construction $280,204 $148,210 $122,134 2
Nondurable Manufacturing
$1,345,011 $438,868 $236,334 4
Durable Manufacturing
$374,375 $146,724 $94,280 1
Transportation and Utilities
$1,081,904 $499,676 $304,683 4
Information $503,419 $309,218 $133,519 1
Wholesale Trade $543,017 $367,115 $211,682 2
Retail Trade $2,563,427 $1,920,061 $1,115,755 35
Finance, Insurance, and Real Estate
$2,708,416 $681,494 $262,885 3
Business Services
$6,466,890 $4,311,170 $3,516,810 44
Health Services $542,466 $380,097 $321,376 5
Other Services $1,148,204 $583,248 $461,995 11
TOTAL $17,816,138 $9,849,823 $6,819,932 114
Source: US Multi-Regional Impact Assessment System, The Perryman Group
The Economic Benefits of the Activity Associated with Contracts and Expenditures Arising
from Business Diversity Programs at Dallas/Fort Worth International Airport
36 | P a g e w w w . p e r r y m a n g r o u p . c o m C o p y r i g h t 2 0 1 6
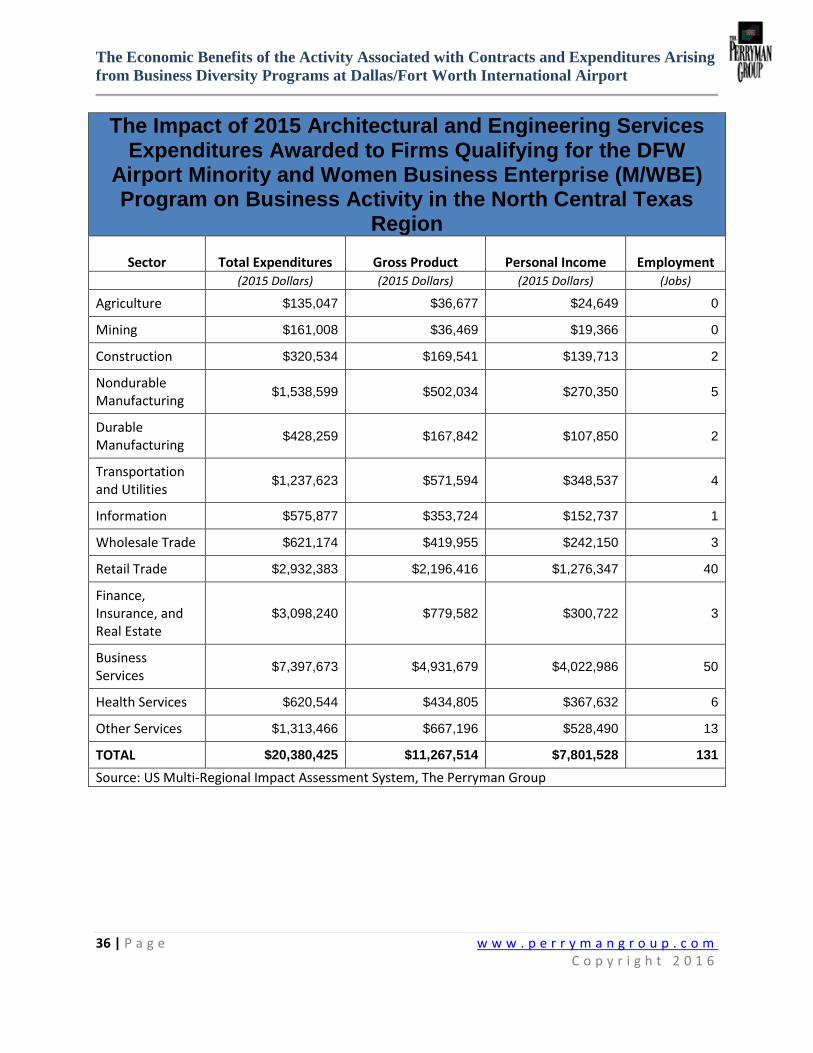
The Impact of 2015 Architectural and Engineering Services Expenditures Awarded to Firms Qualifying for the DFW
Airport Minority and Women Business Enterprise (M/WBE) Program on Business Activity in the North Central Texas
Region
Sector
Total Expenditures
Gross Product
Personal Income
Employment
(2015 Dollars) (2015 Dollars) (2015 Dollars) (Jobs)
Agriculture $135,047 $36,677 $24,649 0
Mining $161,008 $36,469 $19,366 0
Construction $320,534 $169,541 $139,713 2
Nondurable Manufacturing
$1,538,599 $502,034 $270,350 5
Durable Manufacturing
$428,259 $167,842 $107,850 2
Transportation and Utilities
$1,237,623 $571,594 $348,537 4
Information $575,877 $353,724 $152,737 1
Wholesale Trade $621,174 $419,955 $242,150 3
Retail Trade $2,932,383 $2,196,416 $1,276,347 40
Finance, Insurance, and Real Estate
$3,098,240 $779,582 $300,722 3
Business Services
$7,397,673 $4,931,679 $4,022,986 50
Health Services $620,544 $434,805 $367,632 6
Other Services $1,313,466 $667,196 $528,490 13
TOTAL $20,380,425 $11,267,514 $7,801,528 131
Source: US Multi-Regional Impact Assessment System, The Perryman Group

The Economic Benefits of the Activity Associated with Contracts and Expenditures Arising
from Business Diversity Programs at Dallas/Fort Worth International Airport
37 | P a g e w w w . p e r r y m a n g r o u p . c o m C o p y r i g h t 2 0 1 6
The Impact of Professional and Non-Professional Goods and Services
Expenditures Awarded to Firms Qualifying for the DFW Airport Small
Business Enterprise (SBE) Program
The Economic Benefits of the Activity Associated with Contracts and Expenditures Arising
from Business Diversity Programs at Dallas/Fort Worth International Airport
38 | P a g e w w w . p e r r y m a n g r o u p . c o m C o p y r i g h t 2 0 1 6
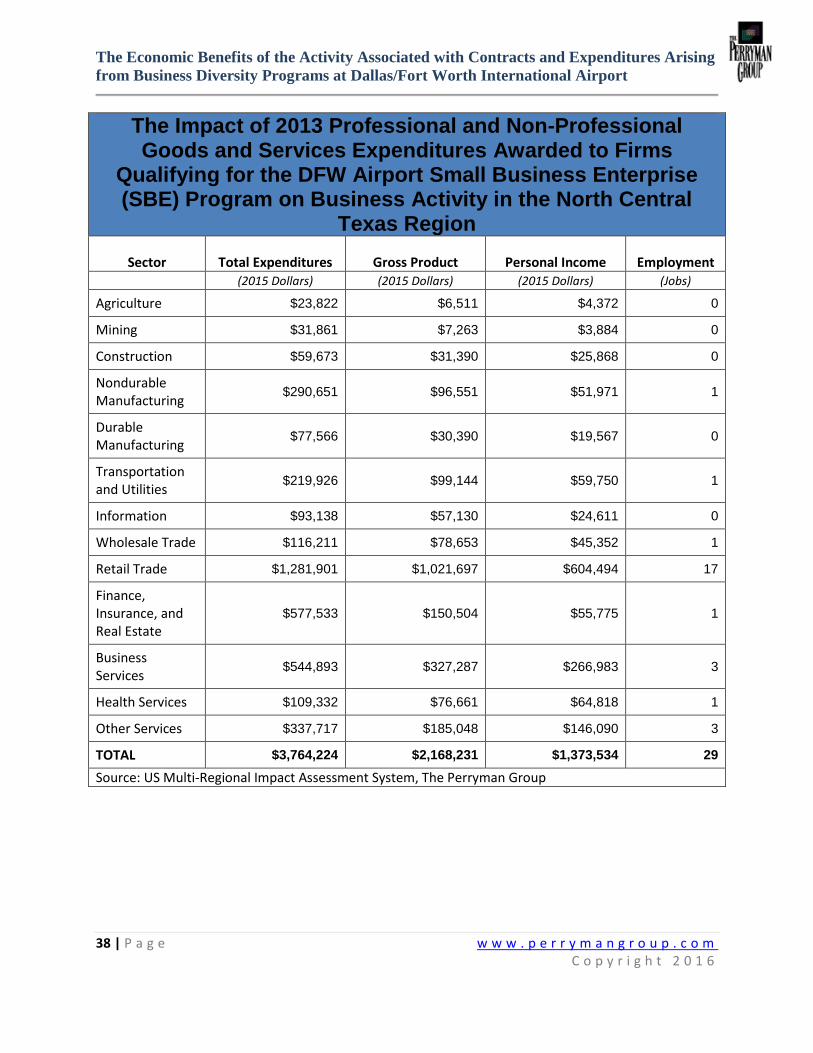
The Impact of 2013 Professional and Non-Professional Goods and Services Expenditures Awarded to Firms
Qualifying for the DFW Airport Small Business Enterprise (SBE) Program on Business Activity in the North Central
Texas Region
Sector
Total Expenditures
Gross Product
Personal Income
Employment
(2015 Dollars) (2015 Dollars) (2015 Dollars) (Jobs)
Agriculture $23,822 $6,511 $4,372 0
Mining $31,861 $7,263 $3,884 0
Construction $59,673 $31,390 $25,868 0
Nondurable Manufacturing
$290,651 $96,551 $51,971 1
Durable Manufacturing
$77,566 $30,390 $19,567 0
Transportation and Utilities
$219,926 $99,144 $59,750 1
Information $93,138 $57,130 $24,611 0
Wholesale Trade $116,211 $78,653 $45,352 1
Retail Trade $1,281,901 $1,021,697 $604,494 17
Finance, Insurance, and Real Estate
$577,533 $150,504 $55,775 1
Business Services
$544,893 $327,287 $266,983 3
Health Services $109,332 $76,661 $64,818 1
Other Services $337,717 $185,048 $146,090 3
TOTAL $3,764,224 $2,168,231 $1,373,534 29
Source: US Multi-Regional Impact Assessment System, The Perryman Group
The Economic Benefits of the Activity Associated with Contracts and Expenditures Arising
from Business Diversity Programs at Dallas/Fort Worth International Airport
39 | P a g e w w w . p e r r y m a n g r o u p . c o m C o p y r i g h t 2 0 1 6
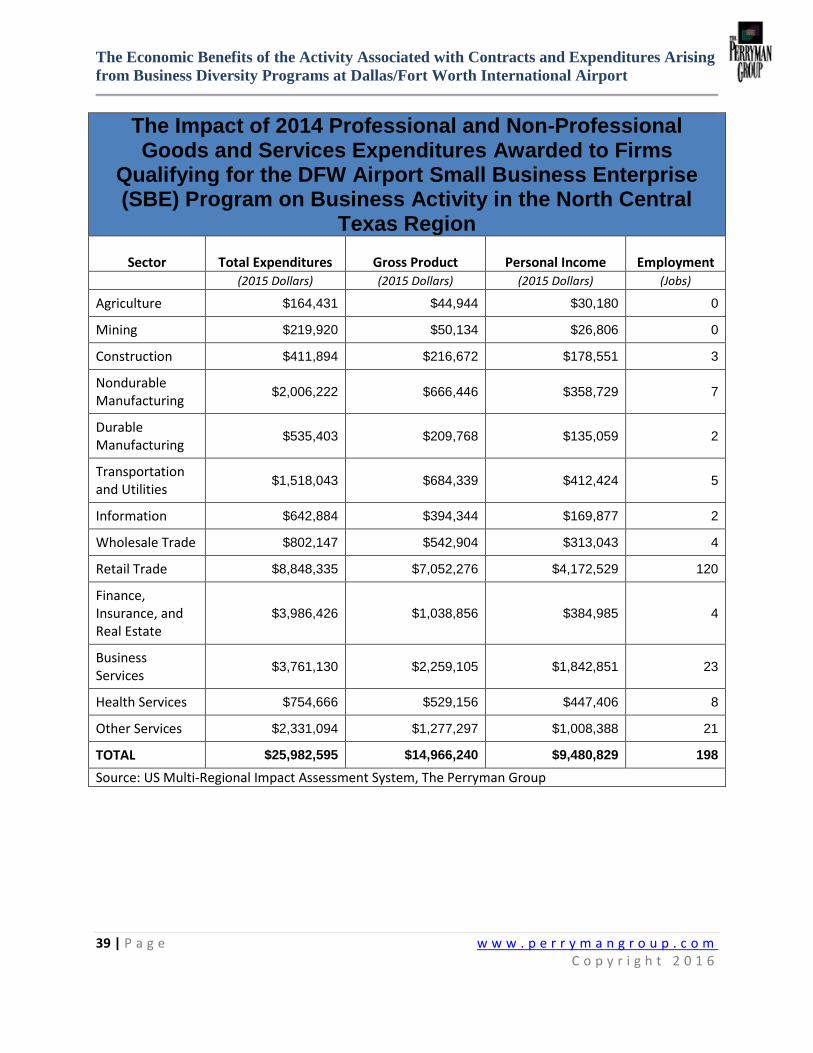
The Impact of 2014 Professional and Non-Professional Goods and Services Expenditures Awarded to Firms
Qualifying for the DFW Airport Small Business Enterprise (SBE) Program on Business Activity in the North Central
Texas Region
Sector
Total Expenditures
Gross Product
Personal Income
Employment
(2015 Dollars) (2015 Dollars) (2015 Dollars) (Jobs)
Agriculture $164,431 $44,944 $30,180 0
Mining $219,920 $50,134 $26,806 0
Construction $411,894 $216,672 $178,551 3
Nondurable Manufacturing
$2,006,222 $666,446 $358,729 7
Durable Manufacturing
$535,403 $209,768 $135,059 2
Transportation and Utilities
$1,518,043 $684,339 $412,424 5
Information $642,884 $394,344 $169,877 2
Wholesale Trade $802,147 $542,904 $313,043 4
Retail Trade $8,848,335 $7,052,276 $4,172,529 120
Finance, Insurance, and Real Estate
$3,986,426 $1,038,856 $384,985 4
Business Services
$3,761,130 $2,259,105 $1,842,851 23
Health Services $754,666 $529,156 $447,406 8
Other Services $2,331,094 $1,277,297 $1,008,388 21
TOTAL $25,982,595 $14,966,240 $9,480,829 198
Source: US Multi-Regional Impact Assessment System, The Perryman Group

The Economic Benefits of the Activity Associated with Contracts and Expenditures Arising
from Business Diversity Programs at Dallas/Fort Worth International Airport
40 | P a g e w w w . p e r r y m a n g r o u p . c o m C o p y r i g h t 2 0 1 6
The Impact of 2015 Professional and Non-Professional Goods and Services Expenditures Awarded to Firms
Qualifying for the DFW Airport Small Business Enterprise (SBE) Program on Business Activity in the North Central
Texas Region
Sector
Total Expenditures
Gross Product
Personal Income
Employment
(2015 Dollars) (2015 Dollars) (2015 Dollars) (Jobs)
Agriculture $402,019 $109,884 $73,787 1
Mining $537,684 $122,573 $65,538 0
Construction $1,007,040 $529,742 $436,540 6
Nondurable Manufacturing
$4,905,020 $1,629,397 $877,058 16
Durable Manufacturing
$1,309,009 $512,862 $330,207 5
Transportation and Utilities
$3,711,469 $1,673,144 $1,008,337 12
Information $1,571,790 $964,132 $415,333 4
Wholesale Trade $1,961,172 $1,327,347 $765,360 9
Retail Trade $21,633,329 $17,242,137 $10,201,433 293
Finance, Insurance, and Real Estate
$9,746,429 $2,539,903 $941,252 10
Business Services
$9,195,601 $5,523,295 $4,505,593 56
Health Services $1,845,085 $1,293,735 $1,093,865 19
Other Services $5,699,302 $3,122,869 $2,465,413 52
TOTAL $63,524,948 $36,591,018 $23,179,716 484
Source: US Multi-Regional Impact Assessment System, The Perryman Group

The Economic Benefits of the Activity Associated with Contracts and Expenditures Arising
from Business Diversity Programs at Dallas/Fort Worth International Airport
41 | P a g e w w w . p e r r y m a n g r o u p . c o m C o p y r i g h t 2 0 1 6
The Impact of Purchase Order Expenditures Awarded to Firms Qualifying
for the DFW Airport Small Business Enterprise (SBE) and Minority or
Women Business Enterprise (M/WBE) Programs

The Economic Benefits of the Activity Associated with Contracts and Expenditures Arising
from Business Diversity Programs at Dallas/Fort Worth International Airport
42 | P a g e w w w . p e r r y m a n g r o u p . c o m C o p y r i g h t 2 0 1 6
The Impact of 2013 Purchase Order Expenditures Awarded to Firms Qualifying for the DFW Airport Small Business Enterprise (SBE) and Minority or Women Business
Enterprise (M/WBE) Programs on Business Activity in the North Central Texas Region
Sector
Total Expenditures
Gross Product
Personal Income
Employment
(2015 Dollars) (2015 Dollars) (2015 Dollars) (Jobs)
Agriculture $87,789 $24,806 $16,670 0
Mining $109,175 $24,637 $12,926 0
Construction $202,583 $107,714 $88,763 1
Nondurable Manufacturing
$969,387 $317,414 $170,849 3
Durable Manufacturing
$280,924 $109,922 $70,967 1
Transportation and Utilities
$826,495 $396,988 $243,774 3
Information $344,390 $212,068 $91,349 1
Wholesale Trade $5,191,340 $3,512,940 $2,025,592 24
Retail Trade $1,795,771 $1,331,717 $771,430 25
Finance, Insurance, and Real Estate
$1,830,465 $471,912 $185,110 2
Business Services
$620,500 $382,237 $311,808 4
Health Services $358,544 $251,224 $212,412 4
Other Services $741,611 $369,969 $295,407 7
TOTAL $13,358,972 $7,513,547 $4,497,057 75
Source: US Multi-Regional Impact Assessment System, The Perryman Group
The Economic Benefits of the Activity Associated with Contracts and Expenditures Arising
from Business Diversity Programs at Dallas/Fort Worth International Airport
43 | P a g e w w w . p e r r y m a n g r o u p . c o m C o p y r i g h t 2 0 1 6
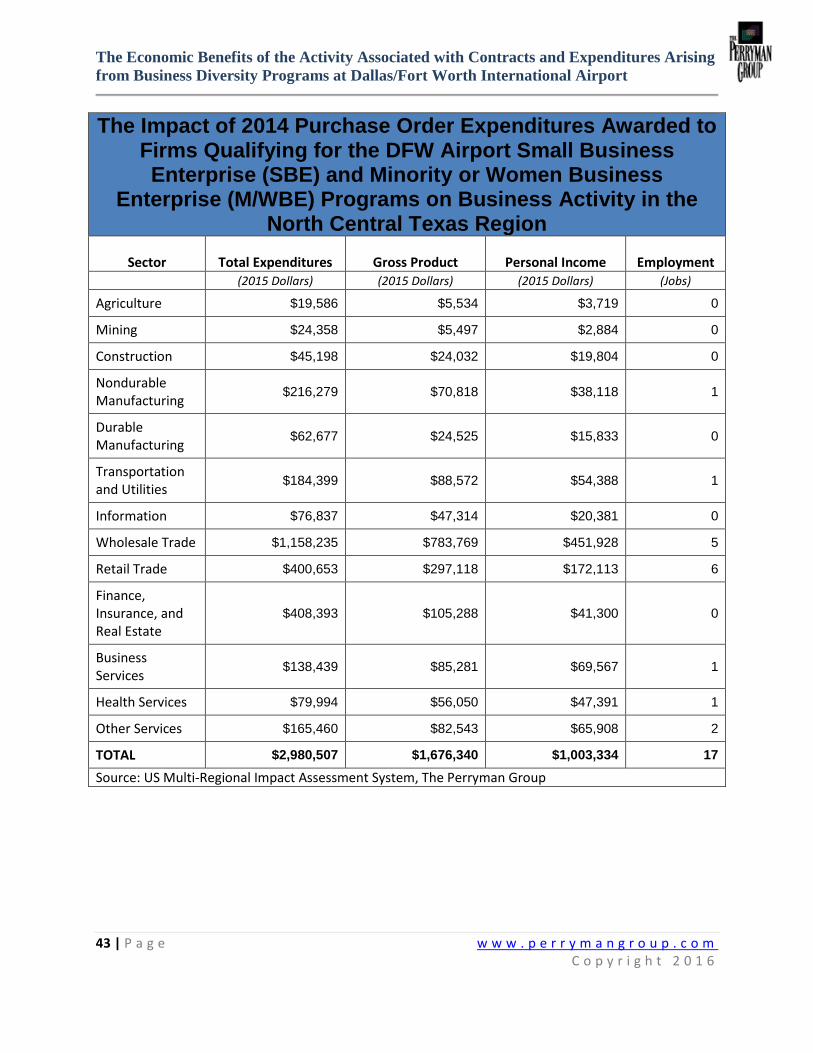
The Impact of 2014 Purchase Order Expenditures Awarded to Firms Qualifying for the DFW Airport Small Business Enterprise (SBE) and Minority or Women Business
Enterprise (M/WBE) Programs on Business Activity in the North Central Texas Region
Sector
Total Expenditures
Gross Product
Personal Income
Employment
(2015 Dollars) (2015 Dollars) (2015 Dollars) (Jobs)
Agriculture $19,586 $5,534 $3,719 0
Mining $24,358 $5,497 $2,884 0
Construction $45,198 $24,032 $19,804 0
Nondurable Manufacturing
$216,279 $70,818 $38,118 1
Durable Manufacturing
$62,677 $24,525 $15,833 0
Transportation and Utilities
$184,399 $88,572 $54,388 1
Information $76,837 $47,314 $20,381 0
Wholesale Trade $1,158,235 $783,769 $451,928 5
Retail Trade $400,653 $297,118 $172,113 6
Finance, Insurance, and Real Estate
$408,393 $105,288 $41,300 0
Business Services
$138,439 $85,281 $69,567 1
Health Services $79,994 $56,050 $47,391 1
Other Services $165,460 $82,543 $65,908 2
TOTAL $2,980,507 $1,676,340 $1,003,334 17
Source: US Multi-Regional Impact Assessment System, The Perryman Group

The Economic Benefits of the Activity Associated with Contracts and Expenditures Arising
from Business Diversity Programs at Dallas/Fort Worth International Airport
44 | P a g e w w w . p e r r y m a n g r o u p . c o m C o p y r i g h t 2 0 1 6
The Impact of 2015 Purchase Order Expenditures Awarded to Firms Qualifying for the DFW Airport Small Business Enterprise (SBE) and Minority or Women Business
Enterprise (M/WBE) Programs on Business Activity in the North Central Texas Region
Sector
Total Expenditures
Gross Product
Personal Income
Employment
(2015 Dollars) (2015 Dollars) (2015 Dollars) (Jobs)
Agriculture $41,221 $11,648 $7,827 0
Mining $51,263 $11,568 $6,070 0
Construction $95,123 $50,577 $41,679 1
Nondurable Manufacturing
$455,176 $149,042 $80,222 1
Durable Manufacturing
$131,908 $51,614 $33,323 0
Transportation and Utilities
$388,081 $186,406 $114,464 1
Information $161,708 $99,577 $42,893 0
Wholesale Trade $2,437,593 $1,649,501 $951,117 11
Retail Trade $843,204 $625,308 $362,225 12
Finance, Insurance, and Real Estate
$859,494 $221,586 $86,918 1
Business Services
$291,356 $179,479 $146,409 2
Health Services $168,354 $117,962 $99,738 2
Other Services $348,223 $173,719 $138,708 3
TOTAL $6,272,705 $3,527,985 $2,111,593 35
Source: US Multi-Regional Impact Assessment System, The Perryman Group

The Economic Benefits of the Activity Associated with Contracts and Expenditures Arising
from Business Diversity Programs at Dallas/Fort Worth International Airport
45 | P a g e w w w . p e r r y m a n g r o u p . c o m C o p y r i g h t 2 0 1 6
The Impact of Concessions Revenues to Firms Qualifying for the Federal
Airport Concessions Disadvantaged Business Enterprise (ACDBE)
Program at DFW Airport

The Economic Benefits of the Activity Associated with Contracts and Expenditures Arising
from Business Diversity Programs at Dallas/Fort Worth International Airport
46 | P a g e w w w . p e r r y m a n g r o u p . c o m C o p y r i g h t 2 0 1 6
The Impact of 2013 Concessions Revenues to Firms Qualifying for the Federal Airport Concessions
Disadvantaged Business Enterprise (ACDBE) Program at DFW Airport on Business Activity in the North Central Texas
Region
Sector
Total Expenditures
Gross Product
Personal Income
Employment
(2015 Dollars) (2015 Dollars) (2015 Dollars) (Jobs)
Agriculture $3,652,813 $905,650 $601,705 10
Mining $3,453,867 $784,382 $405,944 2
Construction $5,160,069 $2,744,420 $2,261,573 33
Nondurable Manufacturing
$34,259,679 $10,295,435 $5,458,709 98
Durable Manufacturing
$9,230,714 $3,760,400 $2,427,451 35
Transportation and Utilities
$19,543,768 $8,922,539 $5,417,112 67
Information $7,643,481 $4,689,409 $2,026,803 20
Wholesale Trade $13,976,880 $9,456,619 $5,452,771 64
Retail Trade $107,357,346 $75,507,928 $43,014,726 1,499
Finance, Insurance, and Real Estate
$46,341,412 $12,567,013 $4,865,633 53
Business Services
$15,855,430 $9,341,033 $7,619,889 95
Health Services $8,468,511 $5,935,144 $5,018,219 85
Other Services $76,019,971 $24,673,244 $20,681,901 502
TOTAL $350,963,942 $169,583,216 $105,252,436 2,562
Source: US Multi-Regional Impact Assessment System, The Perryman Group

The Economic Benefits of the Activity Associated with Contracts and Expenditures Arising
from Business Diversity Programs at Dallas/Fort Worth International Airport
47 | P a g e w w w . p e r r y m a n g r o u p . c o m C o p y r i g h t 2 0 1 6
The Impact of 2014 Concessions Revenues to Firms Qualifying for the Federal Airport Concessions
Disadvantaged Business Enterprise (ACDBE) Program at DFW Airport on Business Activity in the North Central Texas
Region
Sector
Total Expenditures
Gross Product
Personal Income
Employment
(2015 Dollars) (2015 Dollars) (2015 Dollars) (Jobs)
Agriculture $3,918,822 $971,602 $645,523 11
Mining $3,705,388 $841,503 $435,506 2
Construction $5,535,841 $2,944,277 $2,426,268 35
Nondurable Manufacturing
$36,754,573 $11,045,180 $5,856,229 105
Durable Manufacturing
$9,902,923 $4,034,244 $2,604,226 38
Transportation and Utilities
$20,967,005 $9,572,305 $5,811,603 72
Information $8,200,102 $5,030,906 $2,174,400 21
Wholesale Trade $14,994,719 $10,145,279 $5,849,858 68
Retail Trade $115,175,435 $81,006,645 $46,147,189 1,608
Finance, Insurance, and Real Estate
$49,716,135 $13,482,181 $5,219,964 57
Business Services
$17,010,071 $10,021,275 $8,174,792 102
Health Services $9,085,214 $6,367,359 $5,383,661 91
Other Services $81,555,977 $26,470,024 $22,188,020 538
TOTAL $376,522,205 $181,932,782 $112,917,239 2,749
Source: US Multi-Regional Impact Assessment System, The Perryman Group

The Economic Benefits of the Activity Associated with Contracts and Expenditures Arising
from Business Diversity Programs at Dallas/Fort Worth International Airport
48 | P a g e w w w . p e r r y m a n g r o u p . c o m C o p y r i g h t 2 0 1 6
The Impact of 2015 Concessions Revenues to Firms Qualifying for the Federal Airport Concessions
Disadvantaged Business Enterprise (ACDBE) Program at DFW Airport on Business Activity in the North Central Texas
Region
Sector
Total Expenditures
Gross Product
Personal Income
Employment
(2015 Dollars) (2015 Dollars) (2015 Dollars) (Jobs)
Agriculture $4,304,739 $1,067,284 $709,093 12
Mining $4,070,287 $924,373 $478,394 3
Construction $6,080,999 $3,234,223 $2,665,202 39
Nondurable Manufacturing
$40,374,086 $12,132,886 $6,432,938 115
Durable Manufacturing
$10,878,142 $4,431,528 $2,860,684 41
Transportation and Utilities
$23,031,791 $10,514,966 $6,383,917 79
Information $9,007,631 $5,526,339 $2,388,531 23
Wholesale Trade $16,471,367 $11,144,365 $6,425,940 75
Retail Trade $126,517,668 $88,984,009 $50,691,667 1,767
Finance, Insurance, and Real Estate
$54,612,075 $14,809,877 $5,734,015 62
Business Services
$18,685,187 $11,008,150 $8,979,828 112
Health Services $9,979,907 $6,994,403 $5,913,833 100
Other Services $89,587,438 $29,076,736 $24,373,049 591
TOTAL $413,601,317 $199,849,139 $124,037,091 3,019
Source: US Multi-Regional Impact Assessment System, The Perryman Group

The Economic Benefits of the Activity Associated with Contracts and Expenditures Arising
from Business Diversity Programs at Dallas/Fort Worth International Airport
49 | P a g e w w w . p e r r y m a n g r o u p . c o m C o p y r i g h t 2 0 1 6
The Impact of Concessions Revenues to Firms Qualifying for the Minority
Business Enterprise (MBE) Program at DFW Airport

The Economic Benefits of the Activity Associated with Contracts and Expenditures Arising
from Business Diversity Programs at Dallas/Fort Worth International Airport
50 | P a g e w w w . p e r r y m a n g r o u p . c o m C o p y r i g h t 2 0 1 6
The Impact of 2013 Concessions Revenues to Firms Qualifying for the Minority Business Enterprise (MBE)
Program at DFW Airport on Business Activity in the North Central Texas Region
Sector
Total Expenditures
Gross Product
Personal Income
Employment
(2015 Dollars) (2015 Dollars) (2015 Dollars) (Jobs)
Agriculture $817,162 $202,601 $134,606 2
Mining $772,656 $175,472 $90,813 1
Construction $1,154,346 $613,947 $505,931 7
Nondurable Manufacturing
$7,664,148 $2,303,166 $1,221,154 22
Durable Manufacturing
$2,064,980 $841,230 $543,039 8
Transportation and Utilities
$4,372,088 $1,996,039 $1,211,849 15
Information $1,709,904 $1,049,056 $453,411 4
Wholesale Trade $3,126,733 $2,115,517 $1,219,826 14
Retail Trade $24,016,645 $16,891,691 $9,622,718 335
Finance, Insurance, and Real Estate
$10,366,922 $2,811,335 $1,088,479 12
Business Services
$3,546,979 $2,089,659 $1,704,626 21
Health Services $1,894,470 $1,327,736 $1,122,613 19
Other Services $17,006,239 $5,519,590 $4,626,697 112
TOTAL $78,513,272 $37,937,040 $23,545,761 573
Source: US Multi-Regional Impact Assessment System, The Perryman Group
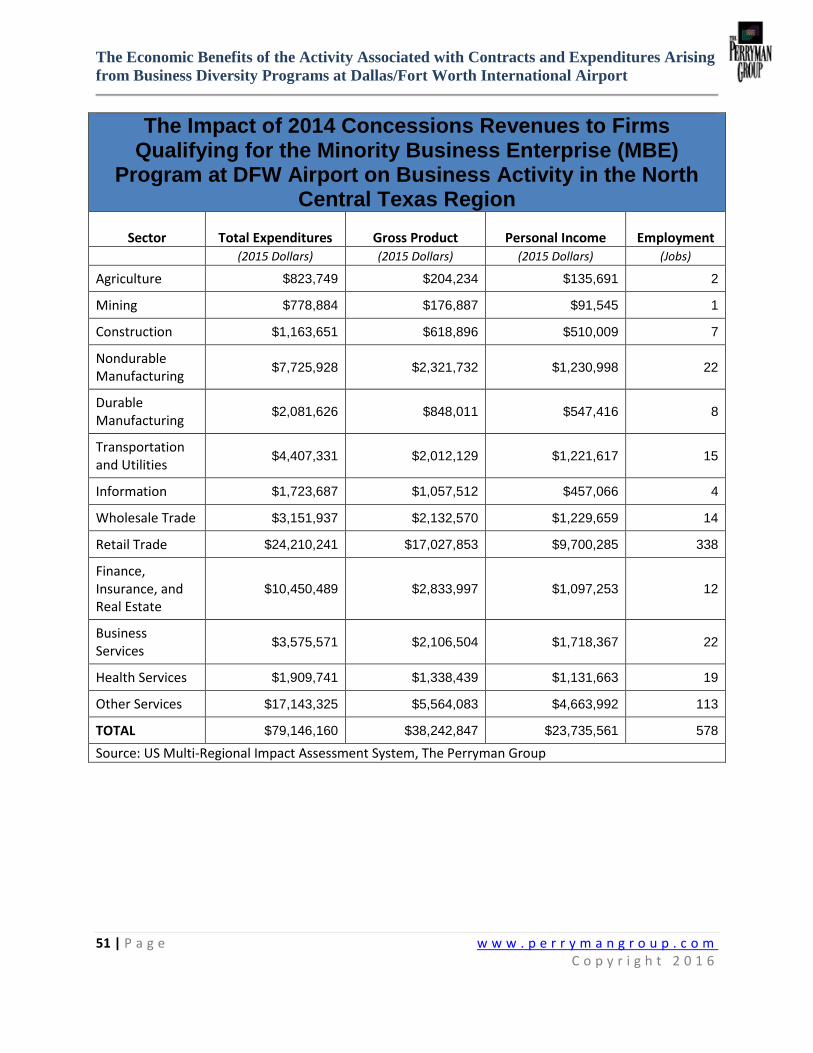
The Economic Benefits of the Activity Associated with Contracts and Expenditures Arising
from Business Diversity Programs at Dallas/Fort Worth International Airport
51 | P a g e w w w . p e r r y m a n g r o u p . c o m C o p y r i g h t 2 0 1 6
The Impact of 2014 Concessions Revenues to Firms Qualifying for the Minority Business Enterprise (MBE)
Program at DFW Airport on Business Activity in the North Central Texas Region
Sector
Total Expenditures
Gross Product
Personal Income
Employment
(2015 Dollars) (2015 Dollars) (2015 Dollars) (Jobs)
Agriculture $823,749 $204,234 $135,691 2
Mining $778,884 $176,887 $91,545 1
Construction $1,163,651 $618,896 $510,009 7
Nondurable Manufacturing
$7,725,928 $2,321,732 $1,230,998 22
Durable Manufacturing
$2,081,626 $848,011 $547,416 8
Transportation and Utilities
$4,407,331 $2,012,129 $1,221,617 15
Information $1,723,687 $1,057,512 $457,066 4
Wholesale Trade $3,151,937 $2,132,570 $1,229,659 14
Retail Trade $24,210,241 $17,027,853 $9,700,285 338
Finance, Insurance, and Real Estate
$10,450,489 $2,833,997 $1,097,253 12
Business Services
$3,575,571 $2,106,504 $1,718,367 22
Health Services $1,909,741 $1,338,439 $1,131,663 19
Other Services $17,143,325 $5,564,083 $4,663,992 113
TOTAL $79,146,160 $38,242,847 $23,735,561 578
Source: US Multi-Regional Impact Assessment System, The Perryman Group

The Economic Benefits of the Activity Associated with Contracts and Expenditures Arising
from Business Diversity Programs at Dallas/Fort Worth International Airport
52 | P a g e w w w . p e r r y m a n g r o u p . c o m C o p y r i g h t 2 0 1 6
The Impact of 2015 Concessions Revenues to Firms Qualifying for the Minority Business Enterprise (MBE)
Program at DFW Airport on Business Activity in the North Central Texas Region
Sector
Total Expenditures
Gross Product
Personal Income
Employment
(2015 Dollars) (2015 Dollars) (2015 Dollars) (Jobs)
Agriculture $957,116 $237,300 $157,660 3
Mining $904,988 $205,525 $106,366 1
Construction $1,352,050 $719,098 $592,581 9
Nondurable Manufacturing
$8,976,779 $2,697,627 $1,430,300 26
Durable Manufacturing
$2,418,647 $985,306 $636,045 9
Transportation and Utilities
$5,120,891 $2,337,899 $1,419,401 18
Information $2,002,758 $1,228,727 $531,066 5
Wholesale Trade $3,662,246 $2,477,839 $1,428,744 17
Retail Trade $28,129,954 $19,784,715 $11,270,791 393
Finance, Insurance, and Real Estate
$12,142,455 $3,292,830 $1,274,902 14
Business Services
$4,154,467 $2,447,553 $1,996,576 25
Health Services $2,218,934 $1,555,136 $1,314,882 22
Other Services $19,918,882 $6,464,925 $5,419,107 131
TOTAL $91,960,167 $44,434,482 $27,578,422 671
Source: US Multi-Regional Impact Assessment System, The Perryman Group
The Economic Benefits of the Activity Associated with Contracts and Expenditures Arising
from Business Diversity Programs at Dallas/Fort Worth International Airport
53 | P a g e w w w . p e r r y m a n g r o u p . c o m C o p y r i g h t 2 0 1 6
The Impact of All Expenditures to Firms Qualifying for the Various Diversity
Initiatives (Excluding the Terminal Renewal and Improvement Program
(TRIP)) at DFW Airport
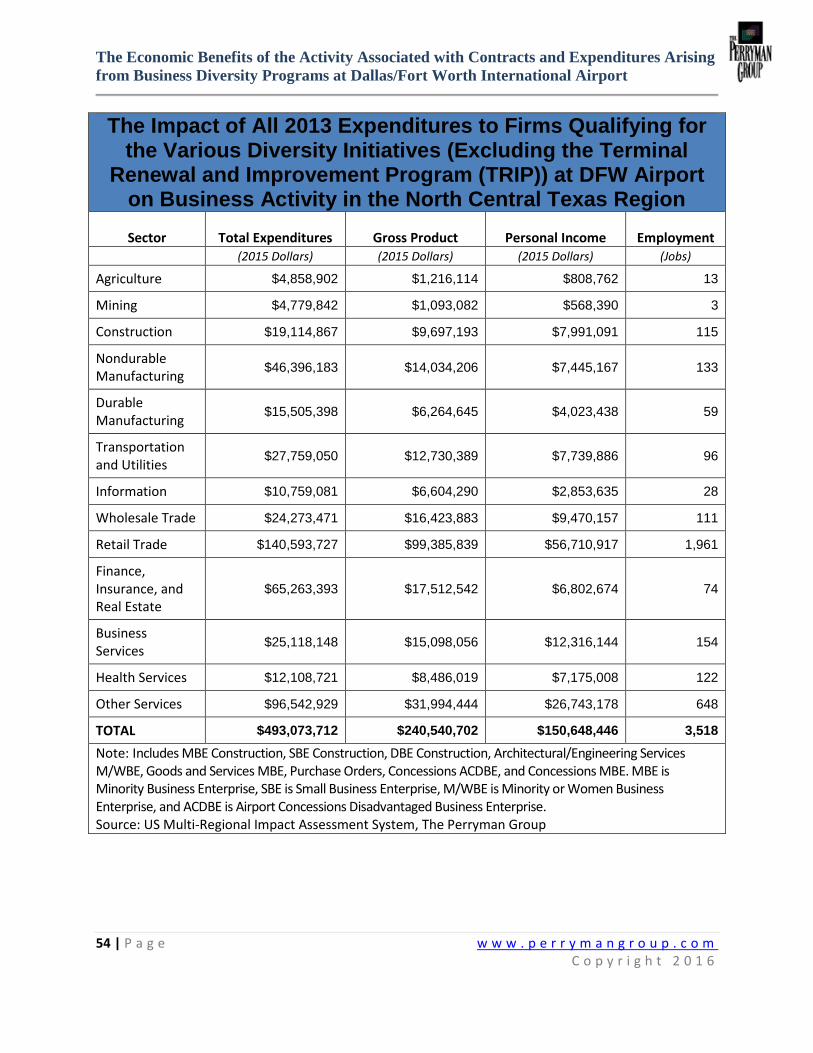
The Economic Benefits of the Activity Associated with Contracts and Expenditures Arising
from Business Diversity Programs at Dallas/Fort Worth International Airport
54 | P a g e w w w . p e r r y m a n g r o u p . c o m C o p y r i g h t 2 0 1 6
The Impact of All 2013 Expenditures to Firms Qualifying for the Various Diversity Initiatives (Excluding the Terminal
Renewal and Improvement Program (TRIP)) at DFW Airport on Business Activity in the North Central Texas Region
Sector
Total Expenditures
Gross Product
Personal Income
Employment
(2015 Dollars) (2015 Dollars) (2015 Dollars) (Jobs)
Agriculture $4,858,902 $1,216,114 $808,762 13
Mining $4,779,842 $1,093,082 $568,390 3
Construction $19,114,867 $9,697,193 $7,991,091 115
Nondurable Manufacturing
$46,396,183 $14,034,206 $7,445,167 133
Durable Manufacturing
$15,505,398 $6,264,645 $4,023,438 59
Transportation and Utilities
$27,759,050 $12,730,389 $7,739,886 96
Information $10,759,081 $6,604,290 $2,853,635 28
Wholesale Trade $24,273,471 $16,423,883 $9,470,157 111
Retail Trade $140,593,727 $99,385,839 $56,710,917 1,961
Finance, Insurance, and Real Estate
$65,263,393 $17,512,542 $6,802,674 74
Business Services
$25,118,148 $15,098,056 $12,316,144 154
Health Services $12,108,721 $8,486,019 $7,175,008 122
Other Services $96,542,929 $31,994,444 $26,743,178 648
TOTAL $493,073,712 $240,540,702 $150,648,446 3,518
Note: Includes MBE Construction, SBE Construction, DBE Construction, Architectural/Engineering Services M/WBE, Goods and Services MBE, Purchase Orders, Concessions ACDBE, and Concessions MBE. MBE is Minority Business Enterprise, SBE is Small Business Enterprise, M/WBE is Minority or Women Business Enterprise, and ACDBE is Airport Concessions Disadvantaged Business Enterprise. Source: US Multi-Regional Impact Assessment System, The Perryman Group

The Economic Benefits of the Activity Associated with Contracts and Expenditures Arising
from Business Diversity Programs at Dallas/Fort Worth International Airport
55 | P a g e w w w . p e r r y m a n g r o u p . c o m C o p y r i g h t 2 0 1 6
The Impact of All 2014 Expenditures to Firms Qualifying for the Various Diversity Initiatives (Excluding the Terminal
Renewal and Improvement Program (TRIP)) at DFW Airport on Business Activity in the North Central Texas Region
Sector
Total Expenditures
Gross Product
Personal Income
Employment
(2015 Dollars) (2015 Dollars) (2015 Dollars) (Jobs)
Agriculture $5,655,087 $1,427,465 $950,204 15
Mining $5,816,018 $1,341,635 $701,575 4
Construction $40,736,675 $20,406,889 $16,816,548 243
Nondurable Manufacturing
$55,144,483 $16,787,477 $8,908,470 160
Durable Manufacturing
$22,860,395 $9,180,363 $5,870,845 88
Transportation and Utilities
$34,437,596 $15,821,256 $9,626,002 119
Information $13,175,247 $8,090,368 $3,495,025 34
Wholesale Trade $25,030,986 $16,936,413 $9,765,687 114
Retail Trade $164,776,120 $117,560,701 $67,282,606 2,293
Finance, Insurance, and Real Estate
$80,697,868 $21,426,879 $8,339,309 90
Business Services
$35,863,039 $21,854,372 $17,827,567 223
Health Services $15,186,705 $10,642,927 $8,998,694 153
Other Services $107,584,720 $36,662,014 $30,530,108 737
TOTAL $606,964,938 $298,138,760 $189,112,638 4,275
Note: Includes MBE Construction, SBE Construction, DBE Construction, Architectural/Engineering Services M/WBE, Goods and Services MBE, Purchase Orders, Concessions ACDBE, and Concessions MBE. MBE is Minority Business Enterprise, SBE is Small Business Enterprise, M/WBE is Minority or Women Business Enterprise, and ACDBE is Airport Concessions Disadvantaged Business Enterprise. Source: US Multi-Regional Impact Assessment System, The Perryman Group

The Economic Benefits of the Activity Associated with Contracts and Expenditures Arising
from Business Diversity Programs at Dallas/Fort Worth International Airport
56 | P a g e w w w . p e r r y m a n g r o u p . c o m C o p y r i g h t 2 0 1 6
The Impact of All 2015 Expenditures to Firms Qualifying for the Various Diversity Initiatives (Excluding the Terminal
Renewal and Improvement Program (TRIP)) at DFW Airport on Business Activity in the North Central Texas Region
Sector
Total Expenditures
Gross Product
Personal Income
Employment
(2015 Dollars) (2015 Dollars) (2015 Dollars) (Jobs)
Agriculture $6,324,634 $1,596,992 $1,063,132 17
Mining $6,476,613 $1,487,603 $777,248 5
Construction $35,284,926 $17,762,893 $14,637,731 211
Nondurable Manufacturing
$61,881,927 $18,892,330 $10,033,800 180
Durable Manufacturing
$23,026,007 $9,258,037 $5,931,677 88
Transportation and Utilities
$38,473,253 $17,636,638 $10,720,159 133
Information $14,929,582 $9,165,441 $3,958,969 39
Wholesale Trade $28,630,573 $19,372,066 $11,170,106 130
Retail Trade $190,833,036 $136,973,075 $78,544,440 2,652
Finance, Insurance, and Real Estate
$91,116,125 $24,251,040 $9,395,712 102
Business Services
$43,621,956 $26,527,551 $21,639,683 271
Health Services $17,066,711 $11,961,024 $10,113,156 172
Other Services $121,026,674 $41,636,309 $34,624,657 832
TOTAL $678,692,015 $336,521,000 $212,610,469 4,832
Note: Includes MBE Construction, SBE Construction, DBE Construction, Architectural/Engineering Services M/WBE, Goods and Services MBE, Purchase Orders, Concessions ACDBE, and Concessions MBE. MBE is Minority Business Enterprise, SBE is Small Business Enterprise, M/WBE is Minority or Women Business Enterprise, and ACDBE is Airport Concessions Disadvantaged Business Enterprise. Source: US Multi-Regional Impact Assessment System, The Perryman Group
The Economic Benefits of the Activity Associated with Contracts and Expenditures Arising
from Business Diversity Programs at Dallas/Fort Worth International Airport
57 | P a g e w w w . p e r r y m a n g r o u p . c o m C o p y r i g h t 2 0 1 6
The Impact of Expenditures within the Terminal Renewal and Improvement
Program (TRIP) to Firms Qualifying for the Small Business Enterprise
(SBE) and Minority and Women Business Enterprise (M/WBE) Programs at
DFW Airport

The Economic Benefits of the Activity Associated with Contracts and Expenditures Arising
from Business Diversity Programs at Dallas/Fort Worth International Airport
58 | P a g e w w w . p e r r y m a n g r o u p . c o m C o p y r i g h t 2 0 1 6
The Impact of 2013 Expenditures within the Terminal Renewal and Improvement Program (TRIP) to Firms
Qualifying for the Small Business Enterprise (SBE) and Minority or Women Business Enterprise (M/WBE) Programs
at DFW Airport on Business Activity in the North Central Texas Region
Sector
Total Expenditures
Gross Product
Personal Income
Employment
(2015 Dollars) (2015 Dollars) (2015 Dollars) (Jobs)
Agriculture $3,272,670 $937,989 $630,273 10
Mining $5,655,575 $1,495,586 $816,762 6
Construction $167,941,101 $72,897,972 $60,072,469 868
Nondurable Manufacturing
$39,451,641 $12,453,191 $6,594,775 119
Durable Manufacturing
$53,190,922 $20,918,406 $12,990,094 207
Transportation and Utilities
$33,124,729 $15,596,841 $9,577,238 121
Information $11,186,099 $6,879,998 $2,968,168 29
Wholesale Trade $23,499,479 $15,906,901 $9,172,061 107
Retail Trade $72,211,503 $54,536,765 $31,770,618 991
Finance, Insurance, and Real Estate
$71,096,040 $17,586,908 $7,085,520 77
Business Services
$41,806,631 $26,609,973 $21,706,919 272
Health Services $14,723,671 $10,318,056 $8,724,012 148
Other Services $28,336,996 $14,408,458 $11,494,983 277
TOTAL $565,497,058 $270,547,043 $183,603,894 3,232
Source: US Multi-Regional Impact Assessment System, The Perryman Group
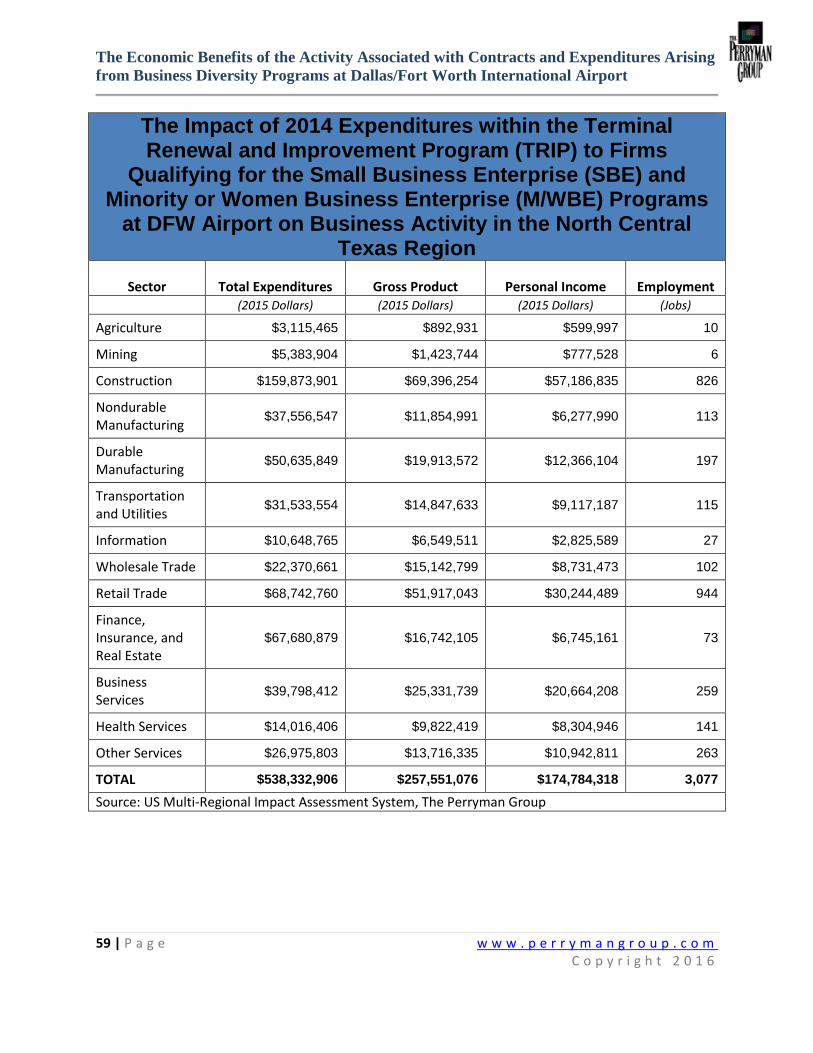
The Economic Benefits of the Activity Associated with Contracts and Expenditures Arising
from Business Diversity Programs at Dallas/Fort Worth International Airport
59 | P a g e w w w . p e r r y m a n g r o u p . c o m C o p y r i g h t 2 0 1 6
The Impact of 2014 Expenditures within the Terminal Renewal and Improvement Program (TRIP) to Firms
Qualifying for the Small Business Enterprise (SBE) and Minority or Women Business Enterprise (M/WBE) Programs
at DFW Airport on Business Activity in the North Central Texas Region
Sector
Total Expenditures
Gross Product
Personal Income
Employment
(2015 Dollars) (2015 Dollars) (2015 Dollars) (Jobs)
Agriculture $3,115,465 $892,931 $599,997 10
Mining $5,383,904 $1,423,744 $777,528 6
Construction $159,873,901 $69,396,254 $57,186,835 826
Nondurable Manufacturing
$37,556,547 $11,854,991 $6,277,990 113
Durable Manufacturing
$50,635,849 $19,913,572 $12,366,104 197
Transportation and Utilities
$31,533,554 $14,847,633 $9,117,187 115
Information $10,648,765 $6,549,511 $2,825,589 27
Wholesale Trade $22,370,661 $15,142,799 $8,731,473 102
Retail Trade $68,742,760 $51,917,043 $30,244,489 944
Finance, Insurance, and Real Estate
$67,680,879 $16,742,105 $6,745,161 73
Business Services
$39,798,412 $25,331,739 $20,664,208 259
Health Services $14,016,406 $9,822,419 $8,304,946 141
Other Services $26,975,803 $13,716,335 $10,942,811 263
TOTAL $538,332,906 $257,551,076 $174,784,318 3,077
Source: US Multi-Regional Impact Assessment System, The Perryman Group
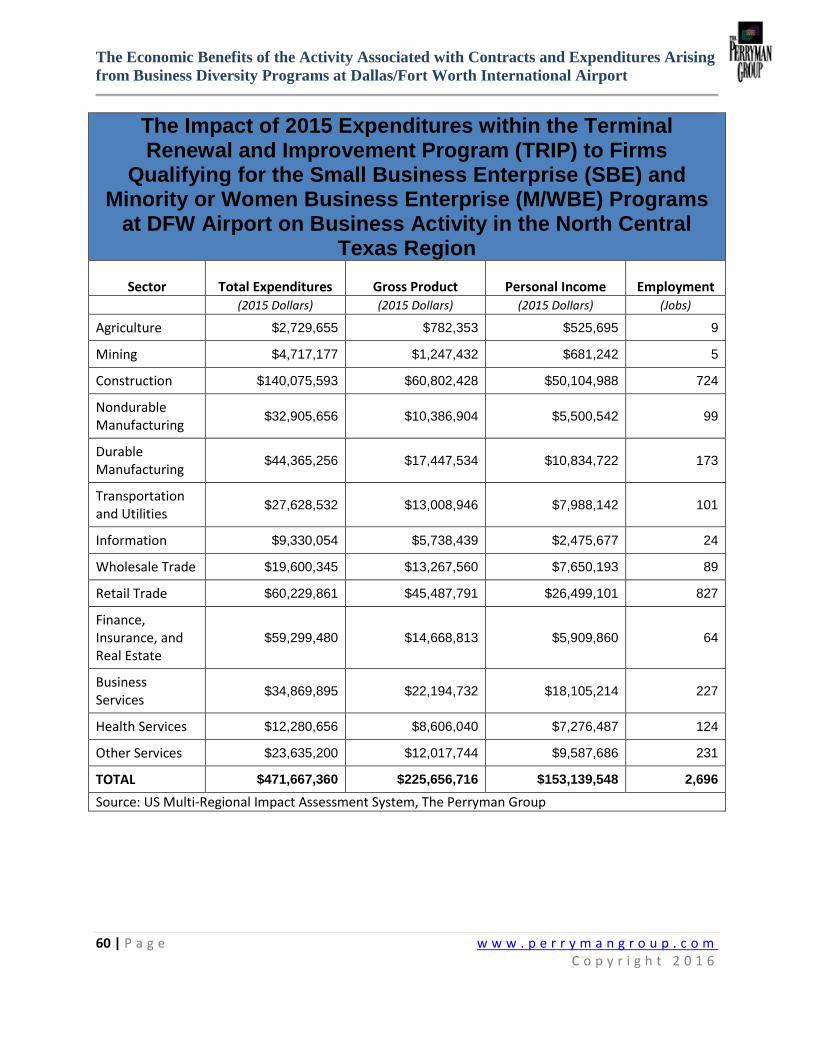
The Economic Benefits of the Activity Associated with Contracts and Expenditures Arising
from Business Diversity Programs at Dallas/Fort Worth International Airport
60 | P a g e w w w . p e r r y m a n g r o u p . c o m C o p y r i g h t 2 0 1 6
The Impact of 2015 Expenditures within the Terminal Renewal and Improvement Program (TRIP) to Firms
Qualifying for the Small Business Enterprise (SBE) and Minority or Women Business Enterprise (M/WBE) Programs
at DFW Airport on Business Activity in the North Central Texas Region
Sector
Total Expenditures
Gross Product
Personal Income
Employment
(2015 Dollars) (2015 Dollars) (2015 Dollars) (Jobs)
Agriculture $2,729,655 $782,353 $525,695 9
Mining $4,717,177 $1,247,432 $681,242 5
Construction $140,075,593 $60,802,428 $50,104,988 724
Nondurable Manufacturing
$32,905,656 $10,386,904 $5,500,542 99
Durable Manufacturing
$44,365,256 $17,447,534 $10,834,722 173
Transportation and Utilities
$27,628,532 $13,008,946 $7,988,142 101
Information $9,330,054 $5,738,439 $2,475,677 24
Wholesale Trade $19,600,345 $13,267,560 $7,650,193 89
Retail Trade $60,229,861 $45,487,791 $26,499,101 827
Finance, Insurance, and Real Estate
$59,299,480 $14,668,813 $5,909,860 64
Business Services
$34,869,895 $22,194,732 $18,105,214 227
Health Services $12,280,656 $8,606,040 $7,276,487 124
Other Services $23,635,200 $12,017,744 $9,587,686 231
TOTAL $471,667,360 $225,656,716 $153,139,548 2,696
Source: US Multi-Regional Impact Assessment System, The Perryman Group

The Economic Benefits of the Activity Associated with Contracts and Expenditures Arising
from Business Diversity Programs at Dallas/Fort Worth International Airport
61 | P a g e w w w . p e r r y m a n g r o u p . c o m C o p y r i g h t 2 0 1 6
The Impact of All Expenditures/Revenues to Firms Qualifying for Various
Diversity Initiatives (Including the Terminal Renewal and Improvement
Program (TRIP)) at DFW Airport

The Economic Benefits of the Activity Associated with Contracts and Expenditures Arising
from Business Diversity Programs at Dallas/Fort Worth International Airport
62 | P a g e w w w . p e r r y m a n g r o u p . c o m C o p y r i g h t 2 0 1 6
The Impact of All 2013 Expenditures/Revenues to Firms Qualifying for Various Diversity Initiatives (Including the
Terminal Renewal and Improvement Program (TRIP)) at DFW Airport on Business Activity in the North Central Texas
Region
Sector
Total Expenditures
Gross Product
Personal Income
Employment
(2015 Dollars) (2015 Dollars) (2015 Dollars) (Jobs)
Agriculture $8,131,572 $2,154,103 $1,439,035 23
Mining $10,435,416 $2,588,668 $1,385,153 9
Construction $187,055,968 $82,595,165 $68,063,561 983
Nondurable Manufacturing
$85,847,825 $26,487,397 $14,039,942 252
Durable Manufacturing
$68,696,320 $27,183,051 $17,013,532 267
Transportation and Utilities
$60,883,780 $28,327,230 $17,317,124 216
Information $21,945,180 $13,484,288 $5,821,803 57
Wholesale Trade $47,772,951 $32,330,784 $18,642,218 218
Retail Trade $212,805,230 $153,922,603 $88,481,535 2,952
Finance, Insurance, and Real Estate
$136,359,433 $35,099,450 $13,888,194 151
Business Services
$66,924,779 $41,708,029 $34,023,063 426
Health Services $26,832,392 $18,804,075 $15,899,020 270
Other Services $124,879,924 $46,402,901 $38,238,160 925
TOTAL $1,058,570,770 $511,087,744 $334,252,339 6,750
Note: Includes MBE Construction, SBE Construction, DBE Construction, Architectural/Engineering Services M/WBE, Goods and Services MBE, Purchase Orders, Concessions ACDBE, Concessions MBE, and spending through the TRIP. MBE is Minority Business Enterprise, SBE is Small Business Enterprise, M/WBE is Minority or Women Business Enterprise, ACDBE is Airport Concessions Disadvantaged Business Enterprise, TRIP is the Terminal Renewal and Improvement Program currently ongoing at DFW Airport. Source: US Multi-Regional Impact Assessment System, The Perryman Group

The Economic Benefits of the Activity Associated with Contracts and Expenditures Arising
from Business Diversity Programs at Dallas/Fort Worth International Airport
63 | P a g e w w w . p e r r y m a n g r o u p . c o m C o p y r i g h t 2 0 1 6
The Impact of All 2014 Expenditures/Revenues to Firms Qualifying for Various Diversity Initiatives (Including the
Terminal Renewal and Improvement Program (TRIP)) at DFW Airport on Business Activity in the North Central Texas
Region
Sector
Total Expenditures
Gross Product
Personal Income
Employment
(2015 Dollars) (2015 Dollars) (2015 Dollars) (Jobs)
Agriculture $8,770,552 $2,320,396 $1,550,201 25
Mining $11,199,922 $2,765,379 $1,479,103 10
Construction $200,610,577 $89,803,143 $74,003,383 1,069
Nondurable Manufacturing
$92,701,030 $28,642,468 $15,186,460 273
Durable Manufacturing
$73,496,244 $29,093,935 $18,236,949 285
Transportation and Utilities
$65,971,149 $30,668,889 $18,743,189 234
Information $23,824,012 $14,639,879 $6,320,614 61
Wholesale Trade $47,401,647 $32,079,212 $18,497,160 216
Retail Trade $233,518,879 $169,477,744 $97,527,094 3,237
Finance, Insurance, and Real Estate
$148,378,747 $38,168,984 $15,084,470 163
Business Services
$75,661,451 $47,186,111 $38,491,774 482
Health Services $29,203,111 $20,465,346 $17,303,640 294
Other Services $134,560,523 $50,378,348 $41,472,919 1,000
TOTAL $1,145,297,844 $555,689,836 $363,896,956 7,351
Note: Includes MBE Construction, SBE Construction, DBE Construction, Architectural/Engineering Services M/WBE, Goods and Services MBE, Purchase Orders, Concessions ACDBE, Concessions MBE, and spending through the TRIP. MBE is Minority Business Enterprise, SBE is Small Business Enterprise, M/WBE is Minority or Women Business Enterprise, ACDBE is Airport Concessions Disadvantaged Business Enterprise, TRIP is the Terminal Renewal and Improvement Program currently ongoing at DFW Airport. Source: US Multi-Regional Impact Assessment System, The Perryman Group
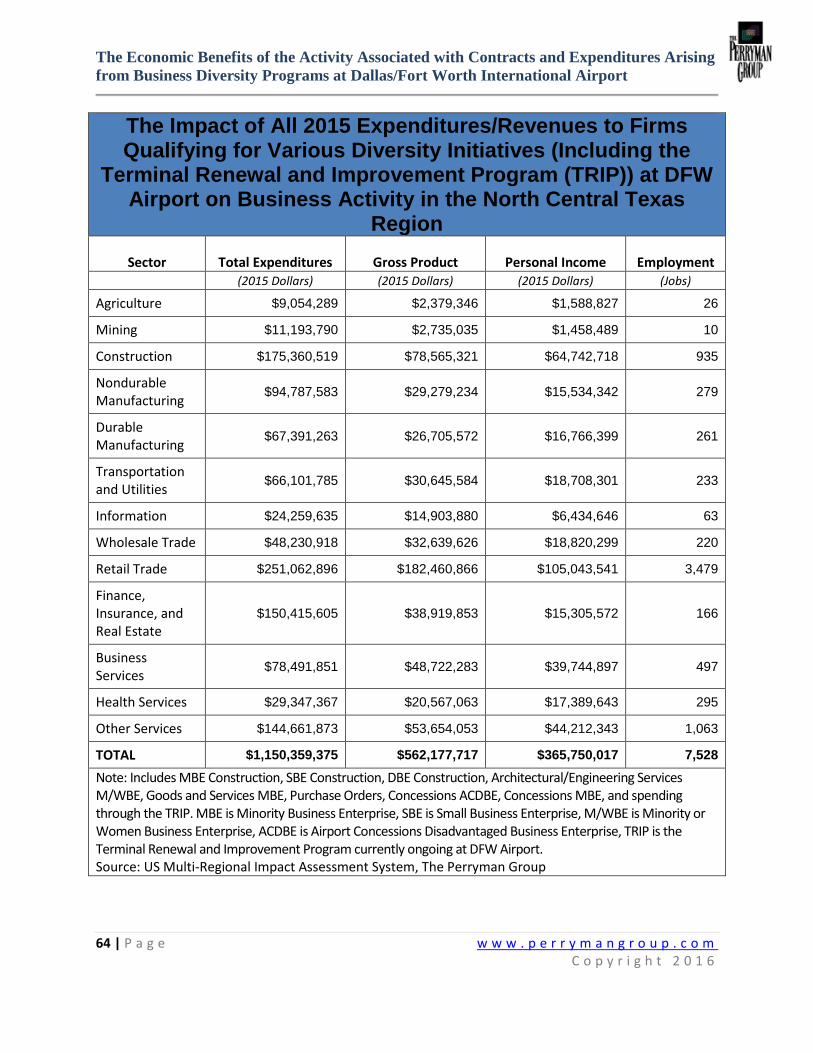
The Economic Benefits of the Activity Associated with Contracts and Expenditures Arising
from Business Diversity Programs at Dallas/Fort Worth International Airport
64 | P a g e w w w . p e r r y m a n g r o u p . c o m C o p y r i g h t 2 0 1 6
The Impact of All 2015 Expenditures/Revenues to Firms Qualifying for Various Diversity Initiatives (Including the
Terminal Renewal and Improvement Program (TRIP)) at DFW Airport on Business Activity in the North Central Texas
Region
Sector
Total Expenditures
Gross Product
Personal Income
Employment
(2015 Dollars) (2015 Dollars) (2015 Dollars) (Jobs)
Agriculture $9,054,289 $2,379,346 $1,588,827 26
Mining $11,193,790 $2,735,035 $1,458,489 10
Construction $175,360,519 $78,565,321 $64,742,718 935
Nondurable Manufacturing
$94,787,583 $29,279,234 $15,534,342 279
Durable Manufacturing
$67,391,263 $26,705,572 $16,766,399 261
Transportation and Utilities
$66,101,785 $30,645,584 $18,708,301 233
Information $24,259,635 $14,903,880 $6,434,646 63
Wholesale Trade $48,230,918 $32,639,626 $18,820,299 220
Retail Trade $251,062,896 $182,460,866 $105,043,541 3,479
Finance, Insurance, and Real Estate
$150,415,605 $38,919,853 $15,305,572 166
Business Services
$78,491,851 $48,722,283 $39,744,897 497
Health Services $29,347,367 $20,567,063 $17,389,643 295
Other Services $144,661,873 $53,654,053 $44,212,343 1,063
TOTAL $1,150,359,375 $562,177,717 $365,750,017 7,528
Note: Includes MBE Construction, SBE Construction, DBE Construction, Architectural/Engineering Services M/WBE, Goods and Services MBE, Purchase Orders, Concessions ACDBE, Concessions MBE, and spending through the TRIP. MBE is Minority Business Enterprise, SBE is Small Business Enterprise, M/WBE is Minority or Women Business Enterprise, ACDBE is Airport Concessions Disadvantaged Business Enterprise, TRIP is the Terminal Renewal and Improvement Program currently ongoing at DFW Airport. Source: US Multi-Regional Impact Assessment System, The Perryman Group