The economic benefits of remittances - Centre for … Economic Benefits... · The economic benefits...
30
1 The economic benefits of remittances A case study from Poland Based on analysis by Centre for Social and Economic Research Warsaw 2012
Transcript of The economic benefits of remittances - Centre for … Economic Benefits... · The economic benefits...

1
The economic benefits of remittances
A case study from Poland
Based on analysis by
Centre for Social and Economic Research
Warsaw
2012

2
The economic benefits of remittances - A case study from
Poland Remittances are flows of money between individuals living in different countries, most typically a
foreign worker sending money back to his or her home country. In the last few years remittances
have risen significantly throughout the world as a result of increased migration flows, as well as
reduced sending costs. Remittance flows to developing countries now account for a large portion of
external capital inflows—well ahead of official development assistance. In many smaller economies,
large-scale remittance flows account for more than a quarter of GDP.
Macroeconomic Effects of Remittances in Poland. Remittances have risen significantly in Poland
over the last twenty years, and now amount to a noticeable share of the balance of payments and
the economy. At over US$8 billion in 2011, they placed Poland as the 17th largest recipient of
remittances. Remittances grew from 0.5 to 1.5 percent of GDP in the period 1995-2011, with a peak
of 2.5 percent of GDP in 2006-2007. The value and share of remittances in GDP increased
considerably after the Polish accession to the EU and the opportunity for the Poles in most European
labour markets. Remittances were also larger than EU transfers until 2008.
In this study we show, through the use of a macro-econometric model, that as a result of the
remittances inflow and its effect on consumption and incomes, the GDP of Poland in 2011 was at
least PLN 22 billion (US$7b) higher than it would have been in the absence of the transfers. Other
intangibles, such as the contribution to financial sector deepening, are more difficult to quantify, but
are clearly positive.
Effects of Remittances on Household Budgets in Poland. How important are remittances in the
budgets of Polish families? Which families are the primary beneficiaries? Does the inflow of income
from abroad reduce poverty and inequality, and to what extent? To address these questions, this
study used data from the 2008 Household Budget Survey, which identifies all sources of foreign
income to Polish individuals. The main results can be summarized as follows:
• Remittances involve a relatively small number of households in Poland, (2.5 per cent or
about 330,000 households, amounting to over 1.2 million people). But because remittances
are concentrated within a small number of households, they actually represent a sizeable
portion of the incomes of their members (on average, 62 per cent of income for households
receiving remittances).
• Recipients of remittances hail mostly from small towns and rural areas rather than large
cities; they tend to live in areas located in the parts of the country which have experienced a
large outflow of migration. In addition, they are often from large households (especially
young families with children), and their educational levels reach basic vocational education
or higher (rather than primary education).
• Because of their concentration and importance among recipients, remittances have a
powerful effect with regard to the overall poverty rate, as they reduce it by nearly two
percentage points. They also result in a slight decrease in income disparities.

3
In conclusion, in this study we show that remittances have increased GDP growth for Poland and,
most importantly, have contributed to increased welfare for some of the least well-to-do segments
of the Polish population. A lesson of the study is that, while in the short-run the current economic
slow-down in Europe may result in reduced opportunities for Polish workers interested in
employment abroad, it would be nevertheless important to keep the facilitation of remittances
(costs, financial instruments, financial literacy) on the policy agenda in order to extend their
contribution to the national economy in the years to come.

4
Remittances: a vital economic function
In countries such as Poland, where labour migration has become a major feature of socio-economic
life, international remittances have assumed a new significance.
Made up of low-value, person-to-person payments, the aggregate value of these international
remittances has escalated in recent years. On a global basis, it exceeds the value of official
development assistance (and has done so for more than 15 years). And, for many emerging
countries, it also exceeds the value of foreign direct investment, private debt flows and portfolio
equity flows.
Given this scale, international remittances perform a valuable and often overlooked economic
function for a migrant’s home country:
• At the macroeconomic level, they contribute to GDP growth and consumption
• At the household level, they alleviate poverty and supplement incomes
Within this paper, we seek to quantify the actual impact. Our focus is Poland. But our broader
conclusions should hold true for any country with a similar scale of labour migration.
5
Remittances – our definition The term ‘remittance’ is used widely but somewhat imprecisely. Within this document, we have adopted a narrow definition of the term, as set out by the United Nations Statistics Division.
The unit under consideration is the migrant (including also short-term migrant), independent
of their status (e.g. employed or not, legal or illegal, etc.). The aim is to capture the net
receivable of transactions, without quid pro quo, between the migrant and the related
household in the home country, independently from the source of income (be it wages and
salaries, social benefits or any other current transfer) and the use this money is put to in the
home country (e.g. alimony, inheritance, lottery, etc.) 1
By using this narrow definition, we are better able to focus on the economic impact of migration on
the migrant’s home economy.
1 As explained in the 2005 Issue Paper: Definition of Remittances and Relevant Bpm5 Flows, Alessandra Alfieri, Ivo Havinga and Vetle Hvidsten

6
Remittances and the global economy
The value of international remittances has increased significantly in recent years.
They now account for a substantial proportion of resource flows towards most developing
economies – so much so that they are generally regarded as the ‘third pillar’ of development
(alongside foreign direct investment and overseas development assistance).
Even during the current global economic climate, the value of remittances continues to grow.
Indeed, the World Bank reports that, in 2011, total remittances to developing countries amounted
to some US$372 billion – representing an annual increase of 12 per cent (Fig. 1).
Remittances (which, it should be stressed, are made up entirely of person-to-person payment flows)
surpassed total Overseas Development Assistance as far back as 1997, and are now greater than
private debt and portfolio equity flows to developing countries.
The substantial growth in remittances can be attributed to a variety of factors – including the
acceleration of labour migration within several specific migration “corridors”, and the progressive
improvement in real wages paid to migrants in many parts of the world.
Remittances are, of course, voluntary money transfers paid between private individuals. As such the
funds can then be used solely according to the wishes of the individuals involved.

7
Several studies involving a number of different countries have investigated the use of remittances by
their recipients. The general consensus is that, by augmenting households incomes (often in
disadvantaged situations), remittances can:
• Contribute to poverty reduction
• Represent an investment in human capital (such as education and health care)
• Foster the establishment of micro businesses (albeit in more limited circumstances)
Investment in residential housing by migrants is one of the most widely-documented uses of
remittances (and also in personal savings by migrants returning to their home country).
Until the crisis of 2008-2009, it had been thought that remittances were less prone to cyclical
fluctuations than other flows of resources towards developing countries. This opinion was backed
up by evidence that migrants from a shrinking economy may actually increase their remittances out
of solidarity with family recipients – thereby helping their home country to cushion the true impact
of the recession.
However, the unprecedented nature of the latest financial crisis did result in an unusual and
temporary dip in overall remittance values during 2009. This was because the crisis simultaneously
struck many sending and receiving countries. It also had a disproportionate impact on sectors such
as construction and travel (which, of course, are traditional occupations for many migrants).
At the time, these dips in remittances are thought to have worsened the magnitude of the recession
in certain countries. However, as indicated in Fig. 1, growth in global remittance values returned
quickly – and flows are forecast to continue increasing for the foreseeable future.

8
Looking at the absolute scale of inward remittance flows (see Fig. 2), China and India emerge as the
clear world leaders. Poland is also among the top 20 countries, just ahead of Italy.
When one looks at these flows as a percentage of GDP (Fig. 3), the picture is very different. Under
this measure, the top 20 countries can all be regarded as low-income developing countries, many of
which can be thought of as “migration dependent”.
0.0%
5.0%
10.0%
15.0%
20.0%
25.0%
30.0%
35.0%
Tajik
ista
n
Leso
tho
Mo
ldo
va
Sam
oa
Kyr
gyz
Rep
ub
lic
Nep
al
Ton
ga
Leb
ano
n
Ko
sovo
El S
alva
do
r
Jam
aica
Ho
nd
ura
s
Bo
snia
an
d…
Jord
an
Gu
yan
a
Togo
Nic
arag
ua
Hai
ti
Sen
egal
Alb
ania
Ph
ilip
pin
es
Fig. 3 - Remittance Recipients,
Percent of GDP

9
Remittances in Poland – the macroeconomic perspective
Over recent years, labour migration has become an important factor of Poland’s socio-economic life,
but understanding the true impact of the resulting remittances is a complex undertaking. Within
this section of the paper, we consider the role they play in Poland’s economy and, more particularly,
the size and nature of consumer spending and the contribution towards economic growth.
Types of transfers and data sources
Data on remittances to Poland have only been compiled and reported by Poland’s Central Bank (the
National Bank of Poland, NBP) since 2001. This data comprises two distinct categories of income
which is accrued abroad by migrant workers and is reported as two separate current account items
under Poland’s Balance of Payments:
• Current incomes
For migrant workers who have been employed overseas for less than one year – their total
compensation is reported as current incomes.
• Current transfers
For migrant workers who have been employed overseas for more than one year – the transfers
(or remittances) they make to Poland (representing a portion of their compensation) are
considered as private value transfers and are reported as current transfers.
This category includes the incomes of individuals whose major economic interests remain
focused in their country of employment.
The Central Bank bases its reports on the payment flows that are officially documented by the
banking system together with its own estimates. In making its estimates (for example, on the
number of Poles working overseas, their respective employment periods, income levels and
propensity to send monies back home) the Central Bank takes the following factors into account:
• Emigration data reported by the Central Statistical Office (GUS)
• The so called BAEL2 survey results on projected emigration flows
• Official (social insurance) data from those countries where Polish migrant workers are employed
• The findings from a one-off survey, conducted by the Central Bank in 2007, on the population of
Poles working in Great Britain and Ireland
• Reports by the Ministry of Labour and Social Policy (MPiPS) on the availability of jobs offered to
Polish workers in Germany
• The official EUROSTAT figures
2 BAEL – quarterly survey on the Population’s Economic Activity Levels (Kwartalne Badanie Aktywności Ekonomicznej Ludności)

10
Separate estimates are made for Great Britain, Ireland and Germany (as the most important
migration destinations for Poles), whereas all other countries are considered together under a single
category.
All of the remittances made by the longer-term migrants are reported as actual amounts sent to
Poland (that is, after taxes and the living expenses they incur overseas). By contrast, the entire gross
compensation received by the shorter-term migrants is reported.
All income taxes collected by foreign governments are shown as expenditures, but not separated
from other items, thus making it impossible to assess their magnitude. Remittances are also subject
to other statistical anomalies. For example, compensation received by short-term or seasonal cross-
border workers tends to be measured in full, even though some of these monies will be spent
overseas to cover their living costs. In the balance of payments such expenditures are presented as
expenses related to foreign trips. But, unlike taxes, they are impossible to separate from other
foreign trip costs. As a consequence, inward foreign transfers to Poland may be slightly over-
reported.
As of 2004, the Central Bank has reported income taxes on compensation paid to short-term
workers. It has also reported their spending overseas. This reporting provides a basis for
extrapolation to such values in previous years (that is, from 1995- 2003).
Estimates for foreign money transfers to various recipient countries are also reported by the World
Bank3. For Poland, these World Bank estimates (shown as contributions to GDP) were reported for
the period of 1994-2010. In fact, the values reported for concurrent periods by both the World Bank
and the Central Bank of Poland (that is, from 2000- 2010) are relatively convergent. In order to
extend the series presented by the Central Bank right back to 1994, we have therefore made use of
the World Bank data. We have also reported transfers as a percentage of GDP drawing on GDP
reports developed by Poland’s Statistical Office (GUS).
Quantifying the value of remittances
As of 1995, the value of overseas money transfers to Poland stood at some PLN 1.7 billion. By 2007,
the figure had risen strongly and steadily to exceed PLN 28.8 billion. Then, by 2011, it had dropped
back down to around PLN 22.5 billion.
Taking a historical perspective, the changes can probably be ascribed to two main events:
• Poland’s accession to the European Union (EU) in 2004 coincided with a near-doubling of the
value of remittances in a single year (from less than PLN 9 billion in 2003 to almost PLN 17
billion in 2004), followed by continued increases.
3http://search.worldbank.org/quickview?name=Workers%27+%3Cem%3Eremittances%3C%2Fem%3E+and+compensation+of+employees%2C+received+%28%25+of+GDP%29&id=BX.TRF.PWKR.DT.GD.ZS&type=Indicators&cube_no=2&qterm=remittances

11
• The global economic crisis of 2008/2009 resulted—in Poland as well as in the rest of the World—
in a sharp decrease in remittance flows (from the peak of almost PLN 29 billion in 2007 to less
than PLN 25 billion in 2008), followed by a more gradual downward trend. One can safely
surmise that a deterioration in working conditions across the EU member states was the main
determinant of the reduction in the income generation capacity of Poles overseas.
Measured as a proportion of GDP, transfers stood at just 0.5 per cent in 1995. They then grew five-
fold to reach a peak of 2.5 per cent of GDP in 2006. The subsequent shrinking of remittances, at a
time of rapid GDP growth within Poland, then saw the figure fall right back to 1.5 per cent in 2011.
Figure 4. Foreign money transfers to Poland as reported in the Balance of Payments (1995-2011)
Balance of Payments
Total transfers
Remittances of compensations by long
term workers Real/(actual) flows
Compensations of short term workers
Total (pre tax) gross values
PLN million
GDP %
disposable income
%
PLN million PLN million
1995 1 686 0,5 0,7 647 1 039
1996 2 112 0,5 0,7 811 1 301
1997 2 577 0,5 0,7 989 1 588
1998 3 605 0,6 0,8 1 384 2 222
1999 3 328 0,5 0,7 1 278 2 051
2000 6 529 0,9 1,2 2 506 4 023
2001 6 408 0,8 1,1 2 436 3 972
2002 7 015 0,9 1,2 2 565 4 450
2003 8 881 1,1 1,5 2 882 5 999
2004 17 184 1,9 2,7 4 074 13 110
2005 21 037 2,1 3,2 5 911 15 126
2006 26 269 2,5 3,8 9 140 17 129
2007 28 821 2,4 3,9 11 696 17 125
2008 24 752 1,9 3,1 11 213 13 539
2009 25 051 1,9 2,9 11 393 13 658
2010 22 906 1,6 2,5 10 887 12 019
2011 22 517 1,5 2,4 10 889 11 628
Sources: 1) Total transfers, remittances of compensations of workers between 2000 and 2011- The Central Bank’s
(NBP)Balance of Payments for 2000-2011; 2) Total transfers as a percentage of GDP and disposable income in 2000 to 2011 – proprietary
computations based on reports by the Central Statistical Office (GUS) (national accounts); 3) Total transfers as a percentage of GDP between 1995 and 1999 – reported by the World Bank; 4) Total transfers between 1995 and 1999 – proprietary computations based on GDP reports by the
World Bank and GUS; 5) Remittances of workers’ compensation between 1995-1999 – proprietary extrapolations inferred from
values reported for 2000 to 2011.
It is helpful to harmonise the two categories of pay that are received by workers overseas and then
transferred to Poland. To do so, we made use of the Central Bank’s detailed estimates of the income
tax paid by short-term workers on the wages they received and the expenses they incurred
12
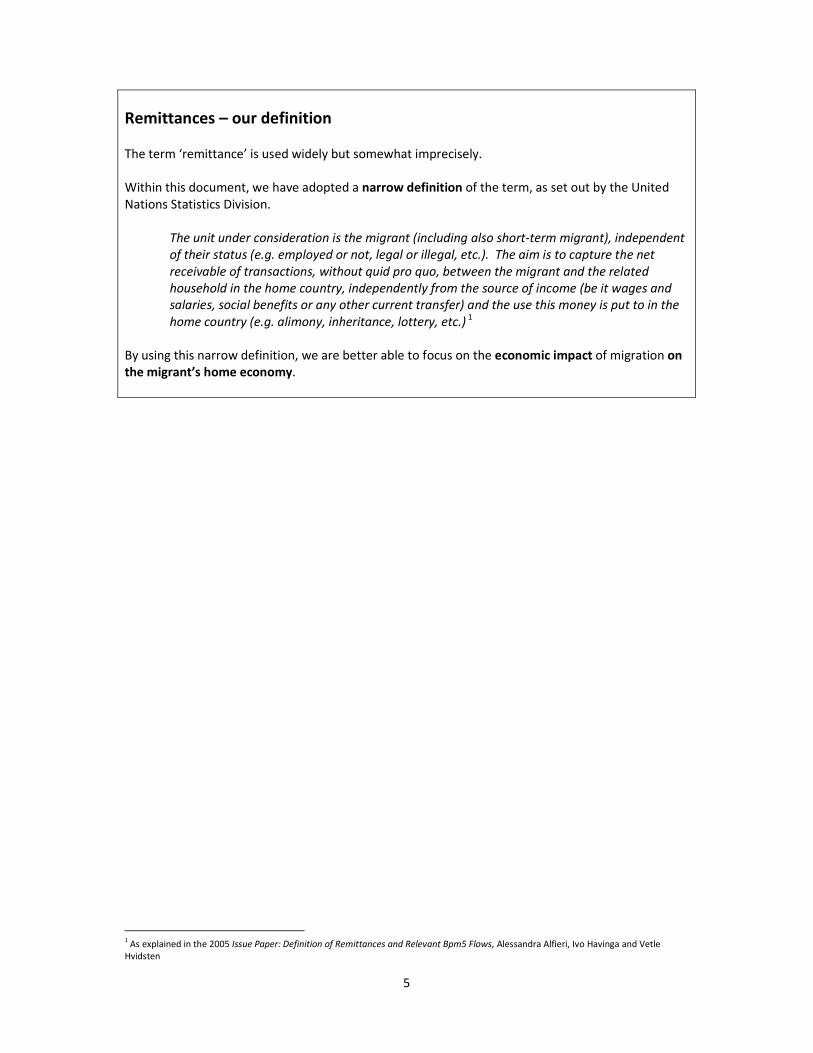
overseas. Given that the share of taxes and expenses remained relatively stable from 2004- 2011, we
assumed that similar proportions would be correct for 1995- 2003. The short-term workers’ earnings
(as reported in the Balance of Payments) were then reduced by the estimated tax and expenditure
amounts, thus revealing the real/actual values of transfers.
Having applied this methodology, the resulting total of the real/actual inflows turned out to be as
much as a third lower than the values reported in the Balance of Payments. In 1995, the figure stood
at PLN 1.2 billion (representing 0.3 per cent of GDP), reaching a height of PLN 20.1 billion in 2007
(1.7 per cent of GDP), before falling down to PLN 17.0 billion in 2011 (1.1 % of GDP).
During the boom years, it is estimated that these real inflows accounted for some 2.7 per cent of
disposable household incomes, subsequently falling to around 1.8 per cent in 2011.
Figure 5. Foreign transfer inflows to Poland – real/actual flows (1995-2011)
ESTIMATED REAL/ACTUAL VALUEs TRANSFERRED
Total transfers
Remittances of compensation by long term
workers real/actual
flows
Compensations of short term
workers real/actual
flows
Compensations of short term
workers pre tax/ gross
values
Income tax on
compensations payable
by short term
workers
Expenditure by short
term workers
while overseas
PLN
million
GDP
%
disposable
income
% o
PLN million PLN million PLN million PLN million PLN million
1995 1 156 0,3 0,5 647 509 1 039 -147 -383
1996 1 448 0,3 0,5 811 638 1 301 -184 -480
1997 1 767 0,3 0,5 989 778 1 588 -224 -586
1998 2 472 0,4 0,6 1 384 1 088 2 222 -313 -820
1999 2 282 0,3 0,5 1 278 1 005 2 051 -289 -757
2000 4 477 0,6 0,8 2 506 1 971 4 023 -567 -1485
2001 4 382 0,6 0,8 2 436 1 946 3 972 -560 -1466
2002 4 745 0,6 0,8 2 565 2 180 4 450 -628 -1643
2003 5 821 0,7 1,0 2 882 2 939 5 999 -846 -2214
2004 10 496 1,1 1,7 4 074 6 422 13 110 -1849 -4839
2005 13 332 1,4 2,0 5 911 7 421 15 126 -2128 -5578
2006 17 560 1,7 2,5 9 140 8 420 17 129 -2402 -6308
2007 20 107 1,7 2,7 11 696 8 411 17 125 -2405 -6310
2008 17 973 1,4 2,2 11 213 6 760 13 539 -1956 -4823
2009 18 397 1,4 2,1 11 393 7 004 13 658 -1991 -4663
2010 17 006 1,2 1,9 10 887 6 119 12 019 -1791 -4109
2011 17 026 1,1 1,8 10 889 6 137 11 628 -1708 -3784
Sources: 1) Total transfers, remittances of workers’ compensation between 2000 and 2011- The Central Bank’s
(NBP) Balance of Payments for 2000-2011; 2) Total transfers as a per centage of GDP and disposable income in 2000 to 2011 – proprietary
computations based on reports by the Central Statistical Office (GUS) (national accounts); 3) Total transfers as a per centage of GDP between 1995 and 1999 – reported by the World Bank; 4) Total transfers between 1995 and 1999 – proprietary computations based on GDP reports by the
World Bank and GUS;

13
5) Remittances of workers’ compensation between 1995-1999 – proprietary extrapolations inferred from values reported for 2000 to 2011.
6) Taxes on compensation paid by short-term workers while overseas, 2004-2011 7) Taxes on compensation paid by short-term workers while overseas, 1995-2003; proprietary
extrapolations inferred from values recorded for 2004 - 2011
From these figures, it becomes evident that the value of these private payments significantly
outweighed considerable value of funds committed to Poland by the EU under its various structural
and cohesion programmes.
Indeed, during 2005, the value of private remittances was five times greater that the inflow of EU
funds. And, during the subsequent few years, they remained considerably higher.
Since the financial crisis, the balance has shifted in the opposite direction – to the extent that, by
2011, the inflows of EU funds were two times higher than the value of private transfers.
Figure 6. Inward foreign transfers to Poland – real/actual flows vs. EU resources committed under
the structural and cohesion programmes (2005-2011)
Inflows of EU
funds
Transfers originated abroad
Real/actual flows
PLN million PLN million
EU funds %
2005 2 419 13 332 551
2006 13 131 17 560 134
2007 14 815 20 107 136
2008 12 532 17 973 143
2009 19 265 18 397 95
2010 33 448 17 006 51
2011 42 786 17 026 40 Sources:
1) EU funds: proprietary computations based on monthly reports by the Ministry for Regional Development on the absorption of funds;
1) Transfers from overseas presented as actual flows – see sources at the bottom of Figure 5.

14
Identifying the source of remittances
In terms of their source, remittances to Poland are largely concentrated within a few key country
“corridors” – with transfers from just six countries accounting for 80 per cent of the total inflows.
In the years leading up to the financial crisis, Great Britain was accounting for an ever-growing
proportion of the total inflows (reaching, in real terms, 25 per cent of total values by 2007). This, of
course, followed Poland’s accession to the EU and reflects the growing importance of remittances
sent home by a sizable cadre of long-term migrant workers.
Likewise, for Ireland, growth in the value of transfers (reaching 23 per cent of the total by 2007) was
driven by remittances payments from long-term workers who benefited from the then Irish
economic boom, and staying for more than a year.
By contrast, the diminishing stock of Polish seasonal labour in Germany resulted in a 50 per cent fall
in real inflows originated from that country (from 40 per cent of the total in 2004 to 19 per cent in
2007). Similarly, a 50 per cent decline was recorded for transfers from USA (to seven per cent in
2007), albeit from a much lower level. In both cases, these falls were largely attributable to a
shrinking volume of transfers from short-term workers.
Meanwhile the monies inflowing from Italy and the Netherlands were relatively smaller and also
more stable (accounting for five per cent and four per cent respectively of the total inflows during
2007).
Figure 7. Foreign transfers by source country (2004-2007, %)
2004 2005 2006 2007
Global 100 100 100 100
Great Britain 16 20 23 25
Ireland 8 13 19 23
Germany 40 34 24 19
USA 14 9 9 7
Italy 6 6 5 5
Netherlands 2 3 3 4
Others 14 16 18 17 Source: CASE computations based on Central Bank (NBP) reports (2008)
Quantifying the contribution to economic growth
The analytical findings presented in the previous pages could easily give the impression that, from a
macroeconomic perspective, the impact of remittances has been quite modest in Poland – equating,
at the very most, to around 2.5 per cent of GDP.

15
It could also be assumed that, since the onset of the global economic crisis, this impact has been
steadily waning.
In fact we take a different view. We believe that remittances do have a significant impact on the
Polish economy. And, to quantify this impact, we have run a series of simulations using a macro-
economic model know as CASE –Advisors (CASE-Doradcy).
This involved the rigorous modelling of a “POLAND without REMITTANCES” scenario over a set time-
span.
How we modelled the impact of remittances on consumption and GDP
Under the CASE-Advisors model, consumption is represented as a function of disposable income,
savings rate and various demographic factors (such as the proportion of citizens aged 60 years and
above in the total population).
When arriving at its official estimates for the income levels of the Polish population, the Central
Statistical Office (GUS) takes account of a wide range of variables, such as employee compensation,
income gained through self-employment, social benefits and a variety of transfers. And, from our
understanding, all private remittances have already been accounted for in the officially-published
GUS income estimates.
Looking specifically at disposable income, this is defined as the total of employee compensation,
social benefits and income from other sources. To simulate our “NO TRANSFERS” scenario, we
therefore isolated and then eliminated the value of overseas transfers from the so-called “income
from other sources”. From there, we were able to infer all the variables involved, in order to
understand the true impact of remittances on personal consumption and GDP during the years from
1995- 2011.
It should be emphasised that the picture is complex.
For example, remittances contribute to disposable income which, in turn, affects household
consumption levels. Increased consumption levels can then contribute to GDP, but can also trigger
imports (which would actually serve to reduce GDP). As a further consequence, both employment
levels and productivity could be affected which, when combined with price rises, could have an
impact on inflation. In time, any impact on headcount would affect the payroll, and become an
added component of disposable income. Any growth in consumption rates would also affect the
way in which businesses assess the prospects for continued growth, which would then have an
impact on their investment behaviour.
The impact on consumption and GDP growth
Between 1995 and 2011 the Polish economy grew at a moderately high rate of 4.4 per cent per
annum, which corresponds to an aggregate growth in GDP of 99 per cent (in constant prices).

16
This rate of growth was driven largely by domestic demand and, in particular, by household
consumption – which saw a yearly increase of 4.2 per cent (at constant prices) over our 17-year time
span.
During the same period:
• Growth in investment was some 50 per cent higher than household consumption (6.5 per cent
annually in constant prices). But, due to its smaller proportion in GDP (21 per cent on average
for investment, compared to 62 per cent for household consumption), the contribution to
economic growth was some 50 per cent lower (1.3 percentage points compared to 2.6
percentage points).
• Government spending grew at an annual average of 3.2 per cent, resulting in an average 0.6
percentage point contribution to GDP growth.
• Although quite volatile, the balance of trade averaged out at -2.5 per cent of GDP. This equated
to a negative average contribution to GDP growth of -0.4 percentage points.
Interestingly, disposable income, when measured as a percentage of GDP, fell from 72 per cent in
1995 to 62 per cent in 2011. Despite this marked decrease, household consumption accounted for a
relatively stable proportion of GDP (from slightly below 60 per cent in 1995, to slightly above 60 per
cent in 2011, with a temporary rise to 66 per cent during 2002).
The mismatch between growth in disposable income and growth in consumption is indicative of a
gradual decrease in the household savings rate (which fell from 17 per cent in 1995 to two per cent
in 2011). It is also correlated with rising levels of indebtedness (expressed as a negative savings
rate). As a consequence, household consumption remained the most stable component of
economic growth, even during times when the wider economy slowed down.
Against this background, it was interesting to model our “NO TRANSFER” scenario. We found that,
over our 17-year time span, the impact of overseas remittances was as follows:
• Total household income was higher
Without remittances, household income would have been reduced by PLN 177 billion. The value
of the remittances themselves equated to PLN 160 billion. The remaining PLN 17 billion would
have been the result of slightly lower payroll and social benefits values, partly compensated for
by diminishing tax inflows (payable on lower taxable incomes) and a small increase in the
incomes of the self employed (due to a slight growth in the number of self employed individuals
against the backdrop of falling employment levels).
• Average disposable income grew more quickly
From 1995- 2011, disposable income grew by 2.9 per cent each year. If it had not been for the
remittances, the corresponding figure would have been 2.7 per cent (that is, some seven per
cent lower)

17
• Average household consumption was higher
From 1995- 2011, household consumption grew by 4.2 per cent each year. In our “NO
TRANSFER” scenario, this would have been held back at 4.1 per cent
• Annual GDP growth was accelerated
As we have said, average GDP growth over the 17-year period was 4.4 per cent. Without the
inflow of remittances, the growth rate would have been 4.3 per cent.
Looking, in general, at the 1995- 2011 time span, we can surmise that the inflow of remittances has
had a positive, although relatively modest, impact on the overall health of Poland’s economy. But, if
we look at the big swings in remittance values during certain years, we can detect a much more
significant impact.
During the year 2000, for example, the value of remittances saw an 80 per cent increase (in real
terms), which directly triggered an increase in consumption growth from 2.7 per cent to 3.0 per
cent. Similarly, in 2004, when remittance values soared by 90 per cent, the growth in consumption
was lifted from 4.0 per cent to 4.7 per cent. By complete contrast, in 2008, when remittances
slumped by 20 per cent, the growth in consumption fell from 6.2 per cent to 5.7 per cent.
It is also worth considering that our “netted off” transfer inflows would have impacted consumption
both directly and indirectly (that is, via total disposable incomes and savings rates). This explains why
growing (or falling) remittance volumes did not affect consumption levels proportionately or
consistently, year-in-year-out.

18
Figure 8. The simulation findings:
a comparison between historical data and our “NO TRANSFERS “ scenario, 1995-2011
Disposable incomes Household consumption GDP
Historical data
“NO TRANSFERS”
scenario
Historical data
“NO TRANSFERS”
scenario
Historical data
“NO TRANSFERS”
scenario
Including overseas transfers
Real terms growth (%) Real terms growth (%) Real terms growth (%)
1995 1996 4,7 4,5 4,7 8,8 8,8 6,2 6,2
1997 7,1 6,2 6,6 7,1 6,6 7,1 6,8
1998 4,6 25,1 4,5 5,0 4,9 5,0 4,9
1999 2,1 -13,9 2,2 5,4 5,5 4,5 4,6
2000 1,4 78,2 1,0 3,0 2,7 4,3 4,1
2001 2,1 -7,0 2,2 2,3 2,4 1,2 1,2
2002 0,4 7,4 0,4 3,4 3,4 1,4 1,4
2003 0,8 25,5 0,6 2,1 1,9 3,9 3,8
2004 2,9 87,0 2,2 4,7 4,0 5,3 5,0
2005 0,6 19,9 0,1 2,1 1,7 3,6 3,4
2006 4,2 23,6 3,6 5,0 4,5 6,2 5,9
2007 5,1 7,1 4,9 4,9 4,7 6,8 6,7
2008 3,8 -17,6 4,3 5,7 6,2 5,1 5,4
2009 3,5 -2,2 3,7 2,1 2,2 1,6 1,7
2010 1,9 -10,9 2,2 3,2 3,5 3,9 4,0
2011 0,5 -5,7 0,6 3,1 3,2 4,3 4,3
1995-2011 56,8 436,2 53,8 94,0 90,4 98,9 96,9 Annual average 2,9 14,2 2,7 4,2 4,1 4,4 4,3
Source: proprietary computations based on the CASE-Advisors macroeconomic model

19
The role of Western Union remittances
Between 1994 and 2011, it is believed that the largest proportion of remittances was sent via
Western Union – totalling some USD 5 billion in value, which (based on an average annual PLN/USD
exchange rate) is equivalent to PLN 15.5 billion.
Over our 16-year time span, this figure equates to around 10 per cent of the total value of foreign
transfers to Poland (reported as real inflows). On a year-by-year basis, however, Western Union’s
share of total transfers was quite volatile.
From 1995 through to 2003, the Western Union share grew gradually and consistently from 1.5 per
cent to 17.9 per cent. Following Poland’s accession to the European Union, other forms of
remittance (including so-called ‘pocket transfers’ by individuals) immediately took a sizeable share,
and continued to grow at an even faster pace. Consequently, the Western Union share of total
remittances had fallen back to 8.1 per cent by 2008 – before climbing back to 10.6 per cent by 2011.
Figure 9. Transfers via Western Union compared to total foreign transfer inflows, 1994-2011
Transfers via Western Union
Average
annual FX
rate
USD PLN, million % of total PLN/USD
1994 3 135 505 7,1 2,27
1995 7 385 442 17,9 1,5 2,42
1996 14 767 408 39,8 2,7 2,69
1997 21 468 371 70,4 4,0 3,28
1998 30 091 953 105,0 4,2 3,49
1999 43 795 447 173,6 7,6 3,96
2000 68 714 144 298,3 6,7 4,34
2001 101 203 536 414,2 9,5 4,09
2002 151 371 322 617,1 13,0 4,08
2003 267 843 602 1 041,2 17,9 3,89
2004 346 290 308 1 263,0 12,0 3,65
2005 401 407 597 1 297,9 9,7 3,23
2006 514 757 206 1 596,5 9,1 3,10
2007 628 026 569 1 735,6 8,6 2,76
2008 606 239 586 1 458,9 8,1 2,41
2009 557 781 356 1 737,0 9,4 3,11
2010 586 461 787 1 766,9 10,4 3,01
2011 611 686 052 1 811,6 10,6 2,96
1995-2011 15 444,8 9,6 Source: proprietary computations based on data provided by Western Union

20
Remittances play a substantially important role
Overall, we can clearly see that inward remittances from short-term and long-term migrant workers
have been substantially important to the Polish economy.
By modelling a “NO TRANSFERS” scenario we can see that, thanks to these remittances, GDP growth
has been accelerated, average household income has been higher, and average household income
has grown more quickly than would otherwise have been the case.
Of course, across Poland’s large and sophisticated economy, it is important to keep the picture in
perspective. Since they equate to no more than 1.7 per cent of GDP, the macroeconomic impact of
remittances has not been as spectacular as in some other countries (in which a larger proportion of
the population choose to work overseas).
It is, however, interesting to narrow our focus – and to consider the role that remittances have
played within the particular regions and the type of households from which the highest proportions
of migrant workers have been drawn.
This is what we address in the final section of the paper.

21
Remittances in Poland – the impact on individual
households
For several years, Poland’s Central Statistical Office (GUS) has been researching typical household
budgets through a periodic survey of 30,000 households.
These surveys provide detailed findings on income, expenditure and living conditions, plus the socio-
demographic characteristics of all household members, their employment and the primary sources
of income. In 2008, GUS took the opportunity to ask more specific questions in order to identify, for
the first time, the size and the significance of income from overseas remittances.
We used the findings as the basis for our statistical analysis. And we sought to get some
authoritative answers to a range of fundamental questions, such as:
• How important are remittances to individual Polish households?
• What types of household are the main beneficiaries of remittances?
• To what extent, if any, have remittances contributed to the alleviation of poverty?
• What role, if any, have remittances played in reducing income disparities?
All of our source material is drawn from the 2008 household budget survey (it would, of course, have
been preferable to use more recent data, but because remittance values have remained relatively
constant since 2008, the findings should still be relevant). In analysing the raw data, we have used
the type of indicators that are most commonly applied to research on living standards.
Identifying the sources of overseas income
In the GUS annual household survey, detailed questions were asked about the scale and the nature
of income from overseas. This is classified across thirteen separate categories of income (such as
income from family members generated through regular or ad hoc employment, income from self-
employment, income from the sale of goods or property and so on).
Although it is not possible to say exactly how this income has been transferred to Poland (through
formal remittances, for example, or directly from the migrant workers, or through some other
means), it is clear that all of the money has come from overseas.
In our analysis, we have taken the 13 categories and, for ease of reference, reduced them down to
three main categories:
1. Income from the employment and self-employment of household members
2. Income from the social benefits of household members
3. Income from non-household members (such as maintenance payments and other donations)
22
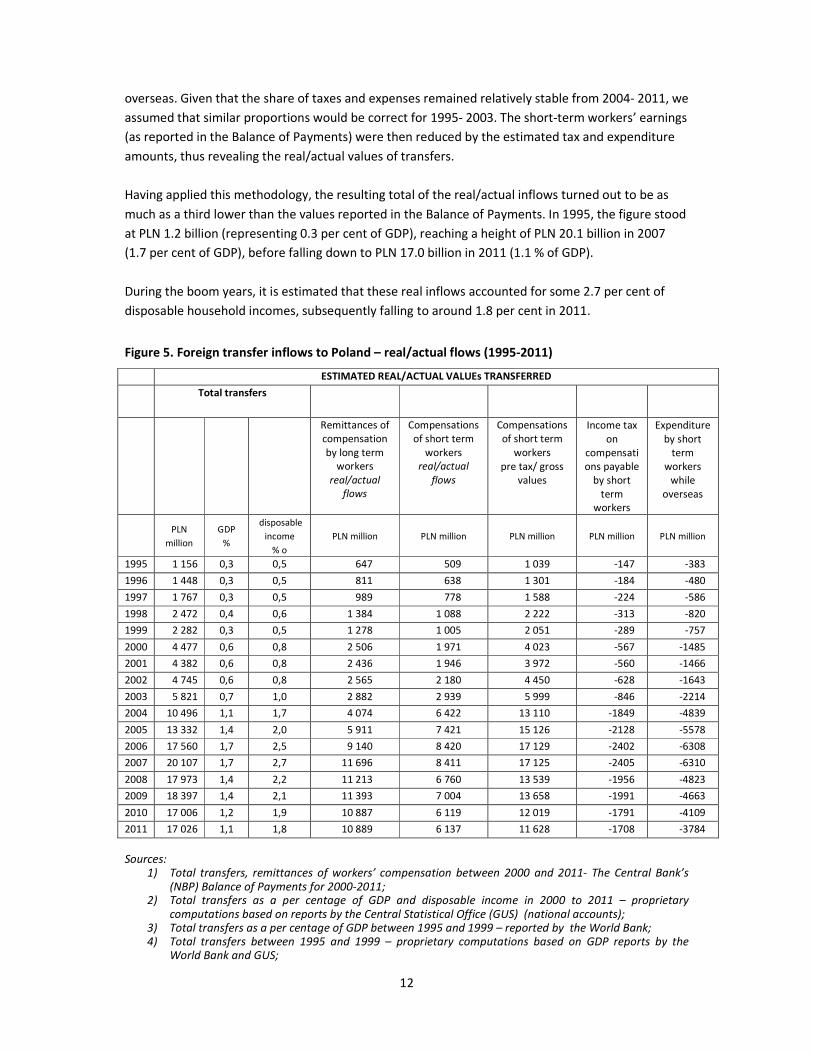
Income from property or other such sources is not reported separately, but is included in the grand
total of all income.
It is perhaps worth pointing out that, defined in such a way, the total value of overseas incomes is
not totally consistent with the value of the transfers as reported in the national accounts. However,
it seems appropriate to consider all overseas income and the impact on living standards, irrespective
of whether it has all been captured within the macroeconomic statistics.
The level of overseas income among individual families
The GUS survey shows that income generated overseas is received by around 2.5 per cent of Polish
households, which equates to some 330,000 households in total. Given that these households will
typically consist of several people, the actual number of beneficiaries goes up to 3.2 per cent of the
population – or 1.2 million individuals.
This figure may not seem overwhelmingly high, particularly given the common perception of Poland
as a source of high numbers of migrant workers. However, the figure is broadly consistent with
official estimates of the number of Polish nationals working overseas (some of whom maintain no
economic ties with their families back home).
Those households receiving funds from overseas, on average, receive some PLN 635.00 per head per
month. Looked at in context, the figure is extremely high. In fact it accounts, on average, for around
62 per cent of total household income. In other words, it supplements “domestic income” by 160
per cent.
In aggregate, the total value of overseas income reported within the GUS household budget survey
comes to a grand total of PLN 9.1 billion to 9.4 billion – representing just over 0.7 per cent of
Poland’s GDP. When considering the economic impact among individual households, it is worth
remembering that the figure is broadly comparable to Poland’s total Labour Fund (which reached
PLN 11.2 billion in 2009), or to the value of the country’s Family Allowances (which exceeds PLN 8.1
billion per annum).
In terms of categories of income, by far the largest proportion comes from employment and self-
employment (accounting for 87 per cent of the total), followed by transfers from other households
(at more than eight per cent). By comparison, other sources of income are insignificant.
Who are the main beneficiaries of remittances?
As indicated in the various figures below, the main characteristics of remittance recipients can be
summarised as follows:

23
1. Recipients are most likely to live in small towns or rural areas, rather than in larger
metropolitan areas.
In larger urban centres (those with more than 500,000 inhabitants) an average of just 1.1 per
cent of households receive remittances. This compares to 3.1 per cent of households in towns
of up to 20,000 inhabitants (that is, almost three times the share), and 2.8 per cent of
households in rural areas)4.
Recipients of transfers from non-household members tend to be more highly concentrated in
medium-sized towns (between 100,000-200,000 inhabitants) – one per cent of households
receive this type of transfer compared to 0.6 per cent of the population as a whole.
Figure 10. Households receiving overseas income by location (%)
Source: The 2008 Household Budget Survey 2008 and proprietary computations
- Income from employment - Transfers from other
households - Total overseas income
City, population
500 thousand
+
City, populatio
n 200-500
thousand
City, populatio
n 100-200
thousand
Town Population 20-100 thousand
Town, popula
tion 20thousand or
less
Rural areas
2. As one would expect, recipients are most likely to live in those regions which account for the
largest numbers of migrant workers
Perhaps unsurprisingly, those households that are most likely to receive income from overseas
tend to be located in these same regions. The provinces (or vojvodships) which have been the
source of the greatest numbers of migrant workers include: Podkarpackie, Świętokrzyskie,
Podlaskie, Lubelskie, Małopolskie and Opolskie (given its particular ethnic structure5).
4 It should be noted that these shares have not been significantly skewed by the relative sizes of the
populations. On aggregate, the populations of smaller towns and rural areas attract as much as 2.3 per cent of all inflowing incomes, whereas the larger metropolitan areas attract as little as 0.4 per cent 5 Ranking of regions by intensity of migration processes – cit. M. Okólski and I. Topińska (2011), “Social impact
of emigration and rural-urban migration in Central and Eastern Europe. National Report: Poland; Project Paper
VC/2010/0026 (unpublished)
0.0
0.5
1.0
1.5
2.0
2.5
3.0
3.5
miasto,500
tysięcy iwięcej
miasto,200-500tysięcy
miasto100-200tysięcy
miasto20-100tysięcy
miasto 20tysięcy i
mniej
wieś
Dochody z pracy
Transfery od innychgospodarstw
Dochody zagraniczne zewszystkich źródeł

24
The Opolskie region is the clear leader. Here, as many as 6.2 per cent of all the households
receive remittances. Second comes the Pomorski region (4.4 per cent of households). And third
is the Podkarpackie region (4.2 per cent of households).
Further down the list come Poland’s western border areas, such as the Lubuskie and Zachodnio-
Pomorskie regions. These may not generally be regarded as prime sources of emigration.
However, their geographic location, close as it is to the national border, provides relatively easy
access to overseas incomes.
By contrast, the Podlaskie region (which may be regarded as a major source of migrant workers)
is not ranked among the top beneficiary regions (1.86 per cent of households). Meanwhile, the
affluent parts of Central Poland (such as the Mazowieckie, Wielkopolskie, and Łódzkie regions)
all appear towards the bottom of the listing.
Figure 11. Percentage of households receiving overseas incomes by region
3. Recipients tend to be larger households (predominantly working-age families with children),
as opposed to smaller households (as populated by older people and single individuals).
Demographic characteristics of households receiving overseas income are worthy of
consideration. In particular, the size of the household and the presence of children within it are
important factors. And, generally speaking, the larger the household, the more likely it will be to
receive overseas income.
Some 4.2 per cent of four-five member households receive overseas income. Meanwhile, the
corresponding figure for single individuals and childless couples stands as low as 1.0 per cent to
1.1 per cent.
Interestingly, more than three per cent of single parents receive remittances from non-
household members but a far lower proportion receive compensation for overseas employment
(which, among the population as a whole, is the main source of overseas income). A possible

25
explanation could be that one of the parents has resided overseas for so long that they are no
longer considered to be a household member.
Figure 12. Access to overseas income by size of household (%)
- Income from
employment - Transfers from
other households - Total overseas
income
Number of
Members 1
Number of
Members 2
Number of
Members 3
Number of Members 4
Number of
Members 5 +
Source: The 2008 Household Budget Survey and proprietary computations
Another interesting – and linked – demographic factor is the age of family members within a
household. The GUS household budget survey reveals that it is younger families who are the
most likely to receive overseas income. For families in which the head of the household is less
than 40 years, the proportion in receipt of overseas income stands at 3.5 per cent. This figure
progressively reduces through the age groups, and stands at around 1.0 per cent for those in
which the head of the household is beyond retirement age.
The same pattern is generally repeated for all categories of overseas income (for example, for
remittances from non-household members). This could suggest that it is uncommon for Polish
migrant workers to be supporting elderly parents or relatives.
0.0
1.0
2.0
3.0
4.0
5.0
1-os. 2-os. 3-os. 4-os. 5-os. iwięcej
Dochody z pracy
Transfery od innychgospodarstwDochody zagraniczne zewszystkich źródeł

26
Figure 13. Households with access to overseas incomes by age of the householder/family
head (%)
- Income from
employment - Transfers from
other households - Total overseas
income
39 and under
40-50 60-70 80 +
Source: The 2008 Household Budget Survey and proprietary computations
4. Household members tend to be educated to lower-secondary standards or to have vocational
qualifications, as opposed to secondary or tertiary-level qualifications
There is also a marked correlation between a beneficiary’s education level and the receipt of
overseas income. The vast majority of beneficiaries are educated to lower-secondary level or
have a vocational qualification (3.5 per cent of such households receive overseas income).
This figure is commensurate with the high levels of emigration among semi-skilled Polish
workers and craftsmen, who typically take up overseas jobs in the construction sector or in
related areas of work (such as mechanical servicing and repairs).
The role played in reducing poverty and alleviating income disparities
Intuitively, one can reach the conclusion that income from overseas should play a role in reducing
poverty and alleviating income disparity. But, if there truly is such an impact, what is its true extent?
To answer this question, it is useful to compare the financial standing and behaviour of two distinct
populations – namely, those households that do receive overseas income, and those that exist on
domestic means alone.
The GUS household budget survey suggests that, in terms of disposable income, there is hardly any
difference between the two types of household: those who receive overseas income have a
monthly disposable income of PLN 1,056, whereas those who do not have PLN 1,045.
0.0
0.5
1.0
1.5
2.0
2.5
3.0
3.5
4.0
39 lat i mniej 40-59 60-79 80 lat i więcej
Dochody z pracy
Transfery od innychgospodarstwDochody zagraniczne zewszystkich źródeł

27
However, the picture changes when we look at the specific income components of the two
respective groups. This reveals that those households with access to funds from overseas derive
three quarters of their income from employment and as little as ten per cent from social benefits
(such as social insurance payments, disability payments and pensions). By contrast, those
households with no access to funds from overseas derive one quarter of their income from social
benefits, and as little as 60 per cent from employment. However, this income structure reflects the
fact that those households with overseas income tend to be younger and more active in the labour
market.
In terms of average expenditure, significant differences also become apparent. Those households
with overseas income have markedly lower levels of monthly expenditure. This is true on a per
capita basis (PLN 815 and PLN 907 respectively) and also an equivalent spending basis (PLN 1,360
and PLN 1,391). Once again, this may reflect the lower age groups of these families. It may also
reflect a higher propensity to save.
Looking at respective poverty rates, the GUS survey also reveals an interesting picture. We can
ascertain this rate by analysing the equivalent levels of spending of each group, and then setting the
poverty line at 50 per cent of average spending (that is, PLN 706 per month). Based on this
calculation, the respective poverty rates stands at 17.1 per cent for households with no overseas
income, and 16.2 per cent for families that do have access to such income.
This overall, aggregated calculation gives us the first indication that remittances do help to reduce
poverty and to alleviate income disparities. By going down to another level of analysis, and
considering the impact among different income groups (by investigating so-called quintile groups
and Gini coefficients), we can get a clearer understanding of its true extent and nature.
• For the poorest households (the first quintile group comprising the 20 per cent of individuals
with lowest equivalent spending), the receipt of overseas income can account for 61 per cent of
total disposable income.
• For the moderately affluent households (the second, third and fourth quintile groups,
representing the next 60 per cent of the population), the equivalent figure ranges between 62
per cent and 64 per cent.
• For the most affluent households (the fifth quintile group and the 20 per cent of individuals with
the highest equivalent spending), the figure stands at 60 per cent.
On this basis, all of the households, irrespective of their level of affluence, would certainly “feel” a
comparatively powerful impact from the overseas funds they receive. Also, interdependences
between income and compensation received for work overseas were found to be quite similar, while
just the opposite was true about income and compensation for domestic employment.
When the total income pool from overseas funds is distributed among the respective quintile groups
yet more clarity emerges. Under this analysis, the least affluent households receive more in
overseas income than in total disposable income, while the most affluent ones receive relatively less
28
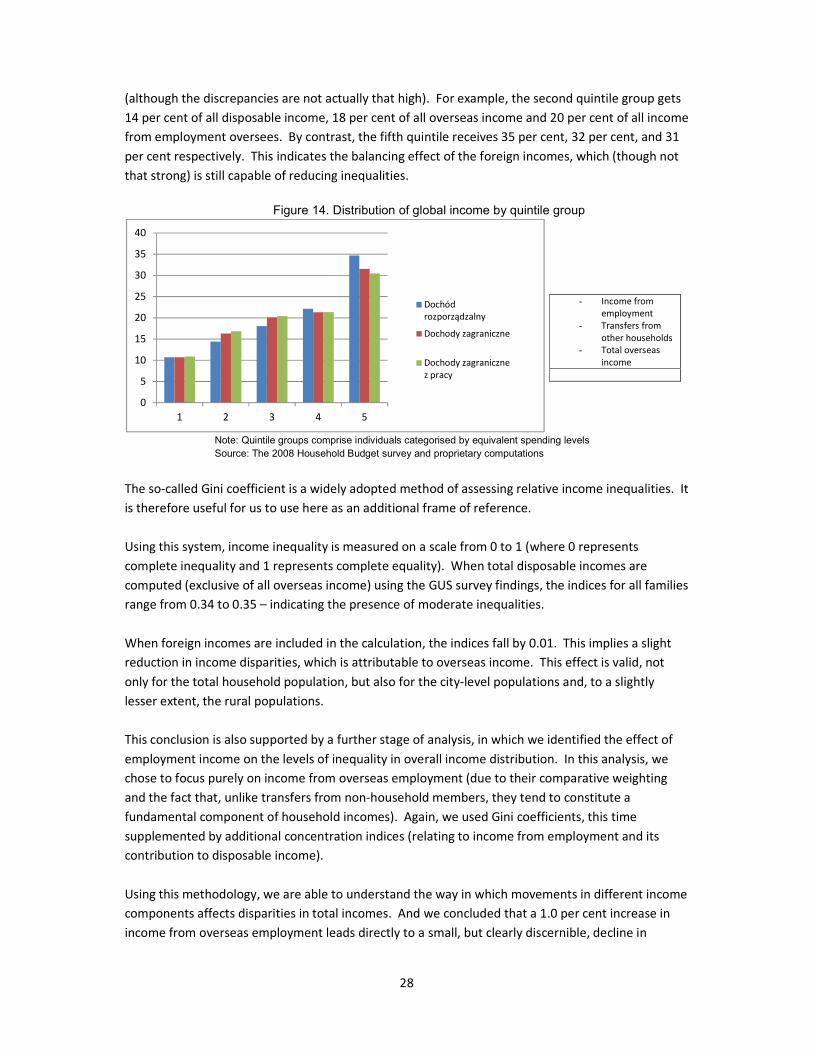
(although the discrepancies are not actually that high). For example, the second quintile group gets
14 per cent of all disposable income, 18 per cent of all overseas income and 20 per cent of all income
from employment oversees. By contrast, the fifth quintile receives 35 per cent, 32 per cent, and 31
per cent respectively. This indicates the balancing effect of the foreign incomes, which (though not
that strong) is still capable of reducing inequalities.
Figure 14. Distribution of global income by quintile group
Note: Quintile groups comprise individuals categorised by equivalent spending levels
Source: The 2008 Household Budget survey and proprietary computations
The so-called Gini coefficient is a widely adopted method of assessing relative income inequalities. It
is therefore useful for us to use here as an additional frame of reference.
Using this system, income inequality is measured on a scale from 0 to 1 (where 0 represents
complete inequality and 1 represents complete equality). When total disposable incomes are
computed (exclusive of all overseas income) using the GUS survey findings, the indices for all families
range from 0.34 to 0.35 – indicating the presence of moderate inequalities.
When foreign incomes are included in the calculation, the indices fall by 0.01. This implies a slight
reduction in income disparities, which is attributable to overseas income. This effect is valid, not
only for the total household population, but also for the city-level populations and, to a slightly
lesser extent, the rural populations.
This conclusion is also supported by a further stage of analysis, in which we identified the effect of
employment income on the levels of inequality in overall income distribution. In this analysis, we
chose to focus purely on income from overseas employment (due to their comparative weighting
and the fact that, unlike transfers from non-household members, they tend to constitute a
fundamental component of household incomes). Again, we used Gini coefficients, this time
supplemented by additional concentration indices (relating to income from employment and its
contribution to disposable income).
Using this methodology, we are able to understand the way in which movements in different income
components affects disparities in total incomes. And we concluded that a 1.0 per cent increase in
income from overseas employment leads directly to a small, but clearly discernible, decline in
0
5
10
15
20
25
30
35
40
1 2 3 4 5
Dochódrozporządzalny
Dochody zagraniczne
Dochody zagranicznez pracy
- Income from employment
- Transfers from other households
- Total overseas income

29
income inequalities (measured with the Gini coefficient, this decline equates to 0.006). Incidentally,
an opposite and much stronger impact occurs for incomes from domestic employment.
Finally, it is interesting to dig deeper into the effects of overseas income on poverty rates.
Again, we define the poverty rates as the proportion of those households whose income falls below
50 per cent of the average equivalent spending level. This calculation was made for all households
taken together. We also identified a range of specific household categories (such as rural dwellers,
city dwellers, specific types of household, and various age groups).
Here, our hypothetical poverty rate (assuming no overseas income) would stand at 19 per cent for
all households. However, the actual poverty rate (including overseas income) equates to 17 per
cent.
It follows, therefore, that overseas income are responsible for a two per centage point decrease in
Poland’s national poverty rates. The fall is deeper for rural inhabitants (2.1 per centage points) than
for city-dwellers (1.8 per centage points), and is particularly visible in smaller towns. The main
beneficiaries tend to be larger, younger families. But the effect on single individuals, on the elderly
and on childless couples tends to be quite meagre.

30
Our overall conclusions
Over recent years, the positive impact of overseas remittances on emerging economies has been the
subject of considerable debate. Again, these remittances are often referred to as the ‘third pillar’ of
development (alongside foreign direct investment and overseas development assistance). And their
value has outweighed the value of official development assistance.
Against this background it is interesting (and important) to conduct an in-depth analysis of the true
impact – particularly for a country such as Poland, which has a reputation as a significant “exporter”
of migrant workers and, by implication, a significant beneficiary of overseas remittances.
Through this analysis we can conclude that, yes, remittances have a clear and positive impact on
Poland’s economic well-being:
• At the macroeconomic level – they do increase disposable incomes and consumer expenditure
and accelerate GDP growth
• At the household level – they do alleviate poverty and reduce income disparities
However, the extent of these impacts should be kept in perspective. Although they are clearly
visible, they tend not to be that strong. They are also quite selective – in that they clearly favour
certain demographic groups and geographic locations.
One should also exercise real caution when extrapolating these findings to other economies. They
are indicative of the true sophistication of the Polish economy, its true scale as an exporter of
migrant workers (not to mention their particular behaviours, family ties and responsibilities).
Having said this, one can safely conclude that remittances do have a positive impact on domestic
economies. But the actual extent of that impact will be determined by the value of the remittances
combined with a wide range of other variables.


![[United Nations] Workers' Remittances, Economic Gr(BookFi.org)](https://static.fdocuments.net/doc/165x107/552b9876550346d6478b475e/united-nations-workers-remittances-economic-grbookfiorg.jpg)