The Economic and Fiscal Impacts of the Gwinnett Place...
37
NOVEMBER 2017 THE ECONOMIC AND FISCAL IMPACTS OF THE GWINNETT PLACE AREA Prepared by: Prepared for: 0
-
Upload
nguyenkiet -
Category
Documents
-
view
241 -
download
0
Transcript of The Economic and Fiscal Impacts of the Gwinnett Place...

N OV EMB E R 2 0 1 7
THE ECONOMIC AND
FISCAL IMPACTS OF THE
GWINNETT PLACE AREA
Prepared by:
Prepared for:
0

Gwinnett Place Community Improvement District Economic and Fiscal Impact Analysis
This analysis examines theeconomic and fiscal impact of theGwinnett Place area: GwinnettCounty ’s premiere employmentand activ ity center.
This report examines the economicand fiscal impact of the GwinnettPlace Community ImprovementDistr ict (GPCID) and its impact onthe economies of Gwinnett Countyand the State of Georgia.
The report considers both:
Economic impact—which measureseconomic activity, both direct andindirect.
Fiscal impact—which compares thepublic revenues generated by thearea to the cost of providinggovernment services to the area.
PURPOSE
1Photos: Mike Cloey

Gwinnett Place Community Improvement District Economic and Fiscal Impact Analysis
Executive Summary
EXECUTIVE SUMMARY

Gwinnett Place Community Improvement District Economic and Fiscal Impact Analysis
The total economicoutput of businesses inthe Gwinnett Place Areaof Influence in 2017 is$9.5 bil l ion.
The direct economic outputof bus inesses in the GwinnettPlace Area of Inf luence(GPAOI) i s $4.5 bi l l ion .
The indirect and inducedeffects resu l t ing from thedirect economic output i s a naddit iona l $5.0 bi l l ion .
In addi t ion to the directemployment of 24,449 atGwinnett P lace, an addi t iona l32,803 ind irect and inducedjobs are supported state -wide, for a tota l employmentimpact of 57,302 jobs .
3
EXECUTIVE SUMMARY—ECONOMIC OUTPUT
Source: US Census , BLS & ARC, RIMS II Economic Impact on State of GA 2017 Direct Output (Sales) obtained based on Gwinnett Place AOI Geometry input to 3-Digit NAICS Report from Environics Analytics.
DirectImpact:
$4.5 billion
IndirectImpact:
$5.0 billion
Gary’s Gwinnett Place CID Impacts Tab= Tables
Gwinnett Place’s Total Economic Impact: $9.5 billion

Gwinnett Place Community Improvement District Economic and Fiscal Impact Analysis
ANNUAL NET FISCAL IMPACT OF GWINNETT PLACE
The Gwinnett Place AOI generates$51.9 million in revenues toGwinnett County and GwinnettCounty Schools annually.
$32.1 mi l l ion to Gwinnett County
$19.9 mi l l ion to Gwinnett Schools
Overa l l , Gwinnett P lace generates acombined net f isca l surp lus of $33.4mi l l ion to Gwinnett County and GwinnettCounty Schools annual ly.
Thus for ever y $1.00 worth of ser v icesrece ived, the Gwinnett P lace areagenerates $2.80 in loca l revenues to theCounty and Schools .
4
Gwinnett Place CID Impact Tables 2017; Tab=Revenue Estimates
* Property, Sales, ATVT and Hotel/Motel Taxes + Estimated Licenses and Permits Sources: Gwinnett County CAFR, Gwinnett County tax Assessor, GSU Fiscal Research Center, CoStar, Inc., BAG
Gwinnett Place Community Improvement District Economic and Fiscal Impact Analysis
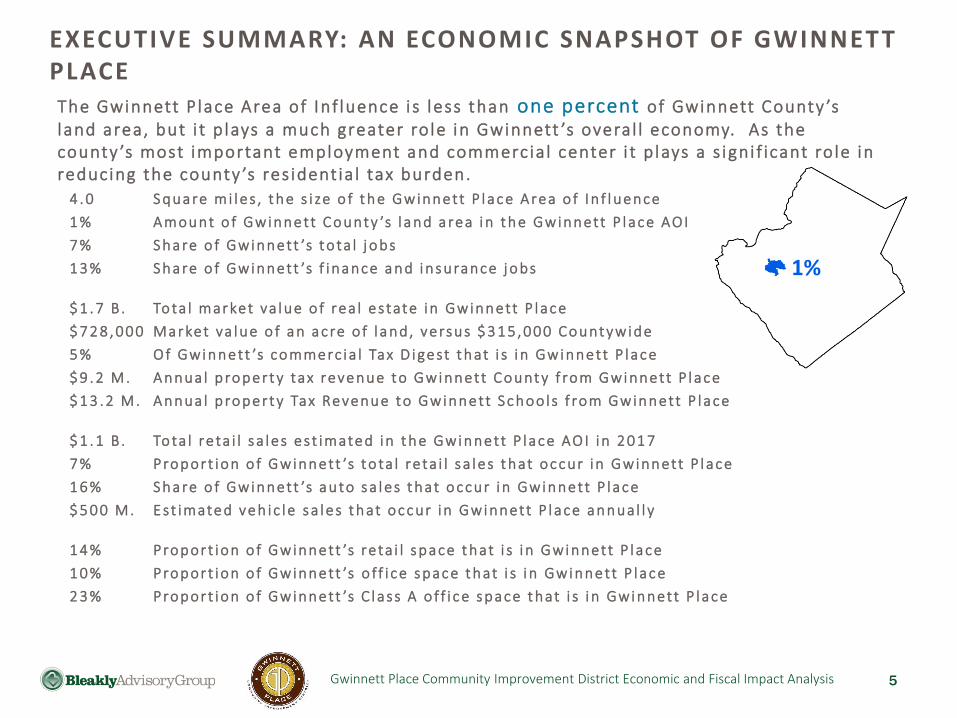
The Gwinnett P lace Area of Inf luence i s less than one percent of Gwinnett County ’s land area, but i t p lays a much greater ro le in Gwinnett ’s overa l l economy. As the county ’s most important employment and commercia l center i t p lays a s igni f icant ro le in reducing the county ’s res ident ia l tax burden.
4 . 0 S q u a re m i l e s , t h e s i ze o f t h e Gw i n n e tt P l a c e A re a o f I n f l u e n c e
1 % A mou nt o f Gw i n n e tt C o u nt y ’s l a n d a re a i n t h e Gw i n n ett P l a c e AO I
7 % S h a re o f Gw i n n ett ’s t o ta l j o bs
1 3 % S h a re o f Gw i n n ett ’s f i n a n c e a n d i n s u ran c e j o bs
$ 1 . 7 B . To ta l mar ket va l u e o f re a l e s tate i n Gw i n n ett P l a c e
$ 7 2 8 , 0 0 0 M a r ket va l u e o f a n a c re o f l a n d , v e rsu s $ 3 1 5 , 0 0 0 C o u nt y w i d e
5 % O f Gw i n n e tt ’s c o mme rc i a l Tax D i ge st t h at i s i n Gw i n n e tt P l a c e
$ 9 . 2 M . A n n ua l p ro p e r t y tax reve n u e t o Gw i n n e tt C o u nt y f rom Gw i n n e tt P l a c e
$ 1 3 . 2 M . A n n ua l p ro p e r t y Tax Re ve n u e t o Gw i n n e tt S c h o o l s f rom Gw i n n ett P l a c e
$ 1 . 1 B . To ta l re ta i l s a l e s e s t i mate d i n t h e Gw i n n e tt P l a c e AO I i n 2 0 1 7
7 % Pro p or t i o n o f Gw i n n e tt ’s t o ta l re ta i l s a l e s t h at o c c ur i n Gw i n n ett P l a c e
1 6 % S h a re o f Gw i n n ett ’s a u to s a l e s t h at o c c ur i n Gw i n n ett P l a c e
$ 5 0 0 M . E st i mate d v e h i c l e s a l e s t h at o c c ur i n Gw i n n ett P l a c e a n n u a l l y
1 4 % Pro p or t i o n o f Gw i n n e tt ’s re ta i l s p a c e t h at i s i n Gw i n n ett P l a c e
1 0 % Pro p or t i o n o f Gw i n n e tt ’s o ff i c e s p ac e t h at i s i n Gw i n n e tt P l a c e
2 3 % Pro p or t i o n o f Gw i n n e tt ’s C l a ss A o f f i c e s p a c e t h at i s i n Gw i n n ett P l a c e
EXECUTIVE SUMMARY: AN ECONOMIC SNAPSHOT OF GWINNETT PLACE
5
1%

Gwinnett Place Community Improvement District Economic and Fiscal Impact Analysis
EXECUTIVE SUMMARY: ECONOMIC SNAPSHOT
6
People
7 , 3 8 4 Re s i d e nt s i n t h e Gw i n n e tt P l a c e A re a o f I n f l u e n c e
Households and Housing
3 , 0 0 4 H o u se h o l d s i n t h e Gw i n n ett P l a c e AO I
6 7 % Pe rc e nt o f h o u s i n g u n i t s i n m u l t i - fami l y b u i l d i n g s
6 1 % H o u se h o l d s w i t h j u st o n e o r t wo p e o p l e
6 5 % H o u se h o l d s w i t h n o c h i l d re n
Household Income
$ 5 3 , 8 2 0 Ave rage h o u se h o l d i n co me
$ 3 9 , 0 8 1 M e d i a n h o u se h o l d i n come
Jobs
2 4 , 4 9 9 N u mb e r o f j o bs i n t h e Gw i n n e tt P l a c e AO I
3 . 3 : 1 R at i o o f j o bs t o re s i d e nt s i n Gw i n n e tt P l a c e — a s i g n i f i cant j o b c e nte r
7 % Pe rc e ntage o f a l l Gw i n n ett j o bs i n t h e Gw i n n e tt P l a c e AO I
$ 1 . 3 B . E st i mate d A n n ua l N e t Pay ro l l o f Gw i n n e tt P l a c e E mp l oye e s

Gwinnett Place Community Improvement District Economic and Fiscal Impact Analysis 7
ECONOMIC AND FISCAL IMPACT ANALYSIS REPORT
Gwinnett Place Community Improvement District Economic and Fiscal Impact Analysis
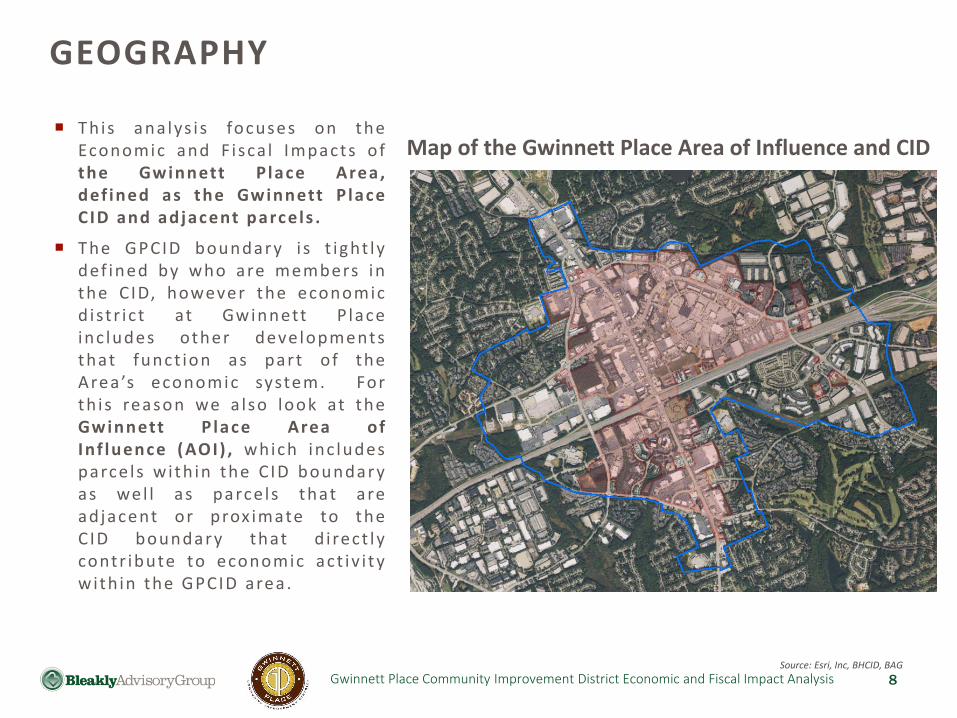
This ana lys i s focuses on theEconomic and Fisca l Impacts ofthe Gwinnett P lace Area,def ined as the Gwinnett P laceCID and adjacent parcels .
The GPCID boundar y is t ight lydef ined by who are members inthe CID, however the economicd ist r ic t at Gwinnett P laceinc ludes other deve lopmentsthat funct ion as part of theArea’s economic system. Forth is reason we a lso look at theGwinnett P lace Area ofInf luence (AOI) , which inc ludesparce ls with in the CID boundar yas wel l as parce ls that areadjacent or prox imate to theCID boundar y that d i rect lycontr ibute to economic act iv i t ywith in the GPCID area .
GEOGRAPHY
8
Map of the Gwinnett Place Area of Influence and CID
Source: Esri, Inc, BHCID, BAG

Gwinnett Place Community Improvement District Economic and Fiscal Impact Analysis
The Gwinnett Place Area of Influence is the home to a s ignif icant share of Gwinnett County ’s commercial real estate inventory and is the largest concentration of commercial space anywhere in the County.
The Gwinnett P lace Area has over 13.3 mi l l ion SF of commercia l development in 399 parcels .
There i s 7 .8 mi l l ion SF of reta i l space; the largest concentrat ion in the County—equiva lent to 14% of the County ’s reta i l space.
10% of the County ’s off ice space and 23% of the County ’s C lass A off ice space i s in the GPAOI .
There are 5 ,301 mult i fami ly uni ts in 15 complexes which i s 9% of the County MF inventory.
REAL ESTATE INVENTORY
9
Gwinnett Place AOI Commercial Real Estate Inventory, 2017
Source: Costar

Gwinnett Place Community Improvement District Economic and Fiscal Impact Analysis
The Gwinnett Place Area of Influence contains a s ignif icant concentration of real estate property values.
The market va lue of rea l estate in the Gwinnett P lace Area of Inf luence i s $1 .7 B i l l ion, with a taxable va lue (40%) of $613 mi l l ion.
The market va lue of an average acre in Gwinnett P lace i s $ 728,000- twice the Gwinnett County Average of $314,581 .
The Gwinnett P lace Area of Inf luence represents 5% of Gwinnett County ’s Commerc ia l tax d igest , on just 1.0% of the County ’s land.
Gwinnett Place Area Property Tax Digest
REAL ESTATE & TAX BASE
10
Source: Gwinnett County GIS, Georgia DOR Consolidated tax Digests 2016
Gwinnett Place CID Impact Tables 2017; Tab=Tax Base

Gwinnett Place Community Improvement District Economic and Fiscal Impact Analysis
42%58%
Property Taxes from Gwinnett Place AOI
The Gwinnett Place Area of Influence generates approximately $22.6 mil l ion in Gwinnett County and Gwinnett County Schools property taxes annual ly
The Gwinnett Place Area of Inf luence generated $9.4 mil l ion in property tax revenue for Gwinnett County .
The Gwinnett Place Area of Inf luence generated $13.2 mil l ion in property tax revenue for Gwinnett County schools annual ly .
REAL ESTATE & TAX BASE
11
Source: Gwinnett County GIS, Georgia DOR Consolidated Tax Digests 2016
Gwinnett Place CID Impact Tables 2017; Tab=Tax Base
Summary of County Property Tax Revenues
from Gwinnett Place AOI
$22.6 million in property taxes
To GwinnettSchools
To GwinnettCounty

Gwinnett Place Community Improvement District Economic and Fiscal Impact Analysis
The Gwinnett P lace AOI is home to an est imated 24,499 jobs .
This employment base represents over 1 ,900 companies with acombined payro l l o f $1.3 b i l l ion , an average sa lar y of $53,063,and combined annual sa les of $4.5 bi l l ion .
Employment in the area has been r is ing stead i ly s ince 2010, withapprox imate ly 5 ,000 jobs added in the GP AOI , s ince the end ofthe Great Recess ion in 2010.
WORKERS: GWINNETT PLACE EMPLOYMENT
12Source: US Census longitudinal employer-household dynamics, Claritas, Inc.
Estimated Jobs in Gwinnett Place AOI
22
,54
2
21
,28
4
19
,80
1
20
,40
9
22
,45
7
23
,31
0
23
,74
5
21
,42
5
19
,54
4
20
,20
3
21
,24
9
23
,77
0
24
,76
3
23
,32
4
23
,90
4
24
,49
9
20
02
20
03
20
04
20
05
20
06
20
07
20
08
20
09
20
10
20
11
20
12
20
13
20
14
20
15
20
16
20
17
3Q

Gwinnett Place Community Improvement District Economic and Fiscal Impact Analysis
WORKERS: GWINNETT PLACE EMPLOYMENT
13
Estimated Jobs by Building, in and around the Gwinnett Place CID and Area of Influence (June 2017)
Source: CoStar, Inc., ITE, BAG
Based on Commercial Real Estate Inventory and Vacancy from CoStar and Typical Building Area per
Employee by Business Type from ITE-Institute of Transportation Engineers 2014
The Gwinnett Place area is among Gwinnett County ’s densest employment centers.
The Gwinnett Place Area of Influence has an average of 6,049 jobs per square mile, compared to 800 for Gwinnett County as a whole.
Gwinnett Place Community Improvement District Economic and Fiscal Impact Analysis
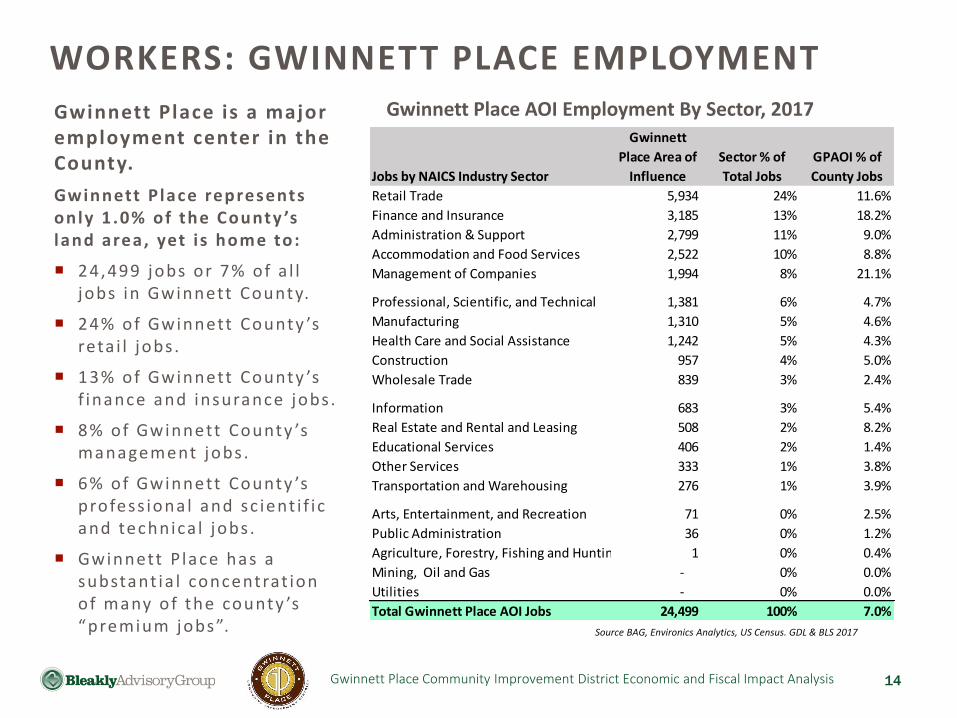
Gwinnett Place is a major employment center in the County.
Gwinnett P lace represents only 1 .0% of the County ’s land area, yet i s home to:
24,499 jobs or 7% of a l l jobs in Gwinnett County.
24% of Gwinnett County ’s reta i l jobs .
13% of Gwinnett County ’s f inance and insurance jobs .
8% of Gwinnett County ’s management jobs .
6% of Gwinnett County ’s profess iona l and sc ient i f i c and technica l jobs .
Gwinnett P lace has a substant ia l concentrat ion of many of the county ’s “premium jobs”.
WORKERS: GWINNETT PLACE EMPLOYMENT
Source BAG, Environics Analytics, US Census. GDL & BLS 2017
Data/OTM Employment BHCID Tab=BHCID Comp
14
Gwinnett Place AOI Employment By Sector, 2017
Jobs by NAICS Industry Sector
Gwinnett
Place Area of
Influence
Sector % of
Total Jobs
GPAOI % of
County Jobs
Retail Trade 5,934 24% 11.6%
Finance and Insurance 3,185 13% 18.2%
Administration & Support 2,799 11% 9.0%
Accommodation and Food Services 2,522 10% 8.8%
Management of Companies 1,994 8% 21.1%
Professional, Scientific, and Technical 1,381 6% 4.7%
Manufacturing 1,310 5% 4.6%
Health Care and Social Assistance 1,242 5% 4.3%
Construction 957 4% 5.0%
Wholesale Trade 839 3% 2.4%
Information 683 3% 5.4%
Real Estate and Rental and Leasing 508 2% 8.2%
Educational Services 406 2% 1.4%
Other Services 333 1% 3.8%
Transportation and Warehousing 276 1% 3.9%
Arts, Entertainment, and Recreation 71 0% 2.5%
Public Administration 36 0% 1.2%
Agriculture, Forestry, Fishing and Hunting 1 0% 0.4%
Mining, Oil and Gas - 0% 0.0%
Utilities - 0% 0.0%
Total Gwinnett Place AOI Jobs 24,499 100% 7.0%
Gwinnett Place Community Improvement District Economic and Fiscal Impact Analysis
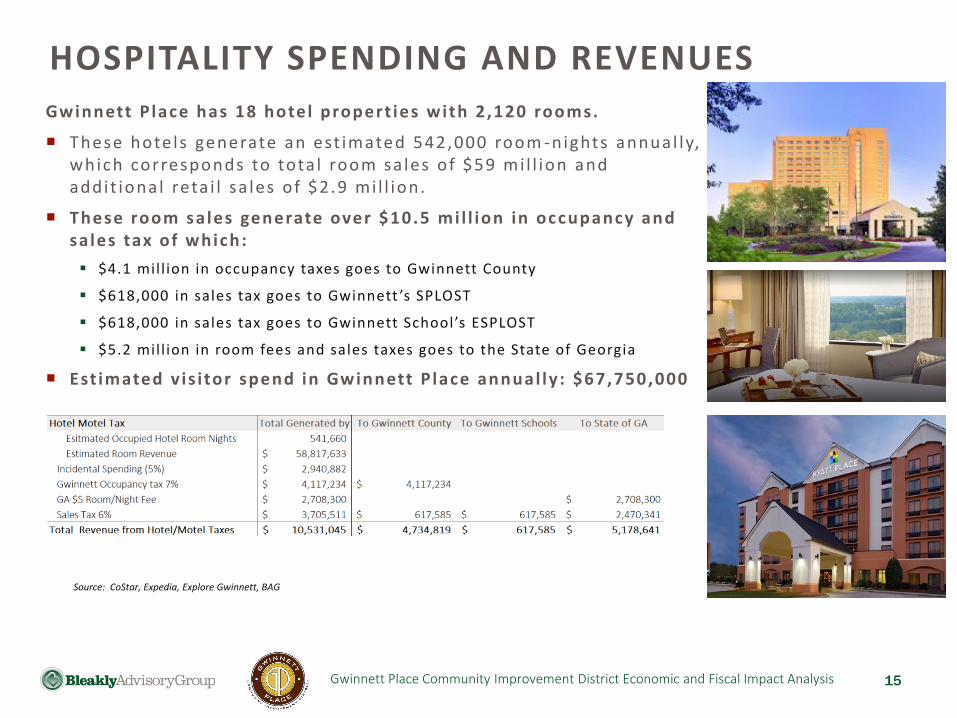
Gwinnett P lace has 18 hotel propert ies with 2 ,120 rooms.
These hote ls generate an est imated 542,000 room -nights annual ly, which corresponds to tota l room sa les of $59 mi l l ion and addit iona l reta i l sa les of $2 .9 mi l l ion.
These room sa les generate over $10.5 mi l l ion in occupancy and sa les tax of which:
▪ $4.1 mil l ion in occupancy taxes goes to Gwinnett County
▪ $618,000 in sales tax goes to Gwinnett ’s SPLOST
▪ $618,000 in sales tax goes to Gwinnett School’s ESPLOST
▪ $5.2 mil l ion in room fees and sales taxes goes to the State of Georgia
Est imated v is i tor spend in Gwinnett P lace annual ly : $67,750,000
HOSPITALITY SPENDING AND REVENUES
15
Gwinnett Place CID Impact Tables 2017; Tab=Hotels
Source: CoStar, Expedia, Explore Gwinnett, BAG

Gwinnett Place Community Improvement District Economic and Fiscal Impact Analysis
RESIDENTS OF GWINNETT PLACE AOI
16
People
7 , 3 8 4 Re s i d e nt s i n t h e Gw i n n e tt P l a c e A re a o f I n f l u e n c e
Households and Housing
3 , 0 0 4 H o u se h o l d s i n t h e Gw i n n ett P l a c e AO I
6 7 % Pe rc e nt o f h o u s i n g u n i t s i n m u l t i - fami l y b u i l d i n g s
6 1 % H o u se h o l d s w i t h j u st o n e o r t wo p e o p l e
6 5 % H o u se h o l d s w i t h n o c h i l d re n
7 7 % H o u se h o l d s t h at a re re nte rs
Household Income
$ 5 3 , 8 2 0 Ave rage h o u se h o l d i n co me
$ 3 9 , 0 8 1 M e d i a n h o u se h o l d i n come
1 4 , 4 8 7 H o u se h o l d s w i t h i n c ome s o f $ 5 0 , 0 0 0 o r h i g h e r w i t h i n 3 m i l e s
Divers i ty
T h e Gw i n n ett P l a c e a re a s i s o n e o f t h e t h e most ra c i a l l y, e t h n i ca l l y a n d c u l t ura l l y d i ve rse a re a s w i t h i n o n e o f t h e n at i o n ’s m ost ra c i a l l y d i v e rse c o u nt i e s .
2 6 % Re s i d e nt s t h at a re A s i an
3 0 % Re s i d e nt s t h at a re B l a c k o r A f r i can A me r i can
2 5 % Re s i d e nt s t h at a re W h i te a l o n e
1 8 % Re s i d e nt s t h at a re O t h e r ra c e o r 2 - o r - more ra c e s
2 9 % Re s i d e nt s t h at a re H i s p an i c o r L at i n o
5 1 % S p e a k a l a n g u age o t h e r t h a n E n g l i s h a t h o me

Gwinnett Place Community Improvement District Economic and Fiscal Impact Analysis
RETAIL SPENDING AND REVENUES
The Gwinnett Place Area is Gwinnett County’s premiere shopping and dining district.• 13% of the County’s retail space is in the Gwinnett
Place area.• The area has 7.8 million SF of retail space.• Over $1.1 billion in retail spending occurs here each
year.• Gwinnett Place area has over 170 restaurants and
bars which sell an estimated $60 million in food and beverages each year.
Food-Service
& Drinking$60 Mil.
Source BAG, Environics Analytics, US Census. GDL & BLS 2017

Gwinnett Place Community Improvement District Economic and Fiscal Impact Analysis
RETAIL SPENDING AND REVENUES
18
Total Annual Gwinnett Place AOI Retail Sales 2017
Source: Environics Analytics
Motor Vehicles &Parts
$501 Mil.
Food & Bev.Stores
$44 Mil.
BuildingMaterial &Hardware$31 Mil.
Clothing & Accessories
$44 Mil.
Non-Storeretailers $34 Mil.
GasStations$27 Mil.
Furniture & Home$29 Mil.
Health$14 Mil.
Misc. Stores
$13 Mil.
General Merchandise Stores $285 Mil.
Food-Service
& Drinking$60 Mil.
Sport & Hobby $6 Mil

Gwinnett Place Community Improvement District Economic and Fiscal Impact Analysis 19
RETAIL SPENDING IN GWINNETT PLACE AOI
Gwinnett Place AOI is expected to generate over $1.1 billion in total retail spending in 2017. • 86% of all retail sales came from
demand outside of the GP AOI.• Only 14% of the retail sales in
the Gwinnett Place AOI where generated internally from residents, employees and overnight visitors.
• The Gwinnett Place AOI serves as a major retail destination for a wide area drawing sales from throughout the County and likely surrounding areas.
14%
86%
Source of Retail Spending in Gwinnett Place AOI
Spending from Outside GPAOI
Spending from Inside GPAOI

Gwinnett Place Community Improvement District Economic and Fiscal Impact Analysis
In 2017 , the auto dealers in the Gwinnett P lace Area ofInf luence are expected to sel l near ly $500 mi l l i on worthof vehic les , represent ing 16% of Gwinnett County ’s tota lvehic le sa les of $3.0 bi l l ion .
In 2016, Gwinnett County Received $70.6 mi l l ion fromTit le Ad Valorem Taxes (TAVT) .
Gwinnett P lace -area auto dea lers were respons ib le forauto sa les generat ing an est imated $16.4 mi l l ion ofTAVT revenue to Gwinnett County and $18.6 mi l l ion tothe state of Georg ia .
The loca l share TAVT is scheduled to increase unt i l i treaches 72% in 2022. Meaning that Gwinnett ’s TAVTloca l revenue wi l l potent ia l ly increase from $16 mi l l ionto $30 mi l l ion by 2022 , making Gwinnett Place’s AutoDea lersh ips an even more integra l part of GwinnettCounty ’s economy.
AUTOMOTIVE SALES AND REVENUES
20
Gwinnett Place Community Improvement District Economic and Fiscal Impact Analysis
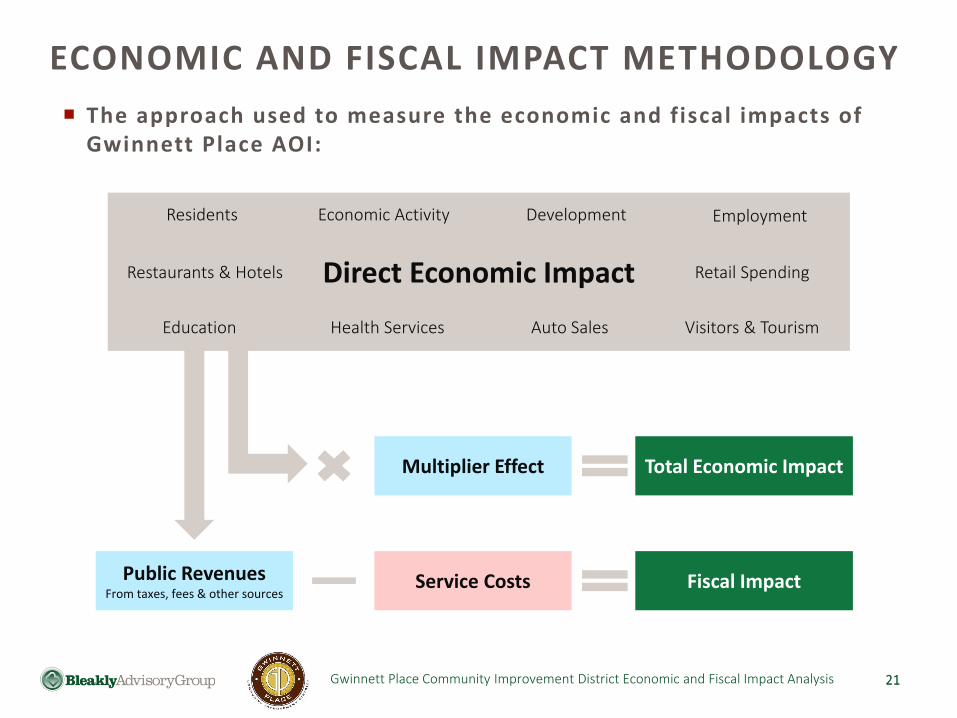
The approach used to measure the economic and fiscal impacts of Gwinnett Place AOI:
21
ECONOMIC AND FISCAL IMPACT METHODOLOGY
21
Direct Economic Impact
Fiscal Impact
Residents Economic Activity Development
Education Health Services Auto Sales Visitors & Tourism
Service CostsPublic RevenuesFrom taxes, fees & other sources
Total Economic ImpactMultiplier Effect
Employment
Retail SpendingRestaurants & Hotels

Gwinnett Place Community Improvement District Economic and Fiscal Impact Analysis
The total economicoutput of businesses inthe Gwinnett Place Areaof Influence is $9.5bil l ion.
The direct economic outputof bus inesses in the GwinnettPlace Area of Inf luence(GPAOI) i s $4.5 bi l l ion .
The indirect and inducedeffects resu l t ing from thedirect economic output i s a naddit iona l $5.0 bi l l ion .
In addi t ion to the directemployment of 24,449 atGwinnett P lace, an addi t iona l32,803 ind irect and inducedjobs are supported state -wide, for a tota l employmentimpact of 57,302 jobs .
22
EXECUTIVE SUMMARY—ECONOMIC OUTPUT
Source: US Census , BLS & ARC, RIMS II Economic Impact on State of GA 2017 Direct Output (Sales) obtained based on Gwinnett Place AOI Geometry input to 3-Digit NAICS Report from Environics Analytics.
DirectImpact:
$4.5 billion
IndirectImpact:
$5.0 billion
Gary’s Gwinnett Place CID Impacts Tab= Tables
Gwinnett Place’s Total Economic Impact: $9.5 billion
Gwinnett Place Community Improvement District Economic and Fiscal Impact Analysis
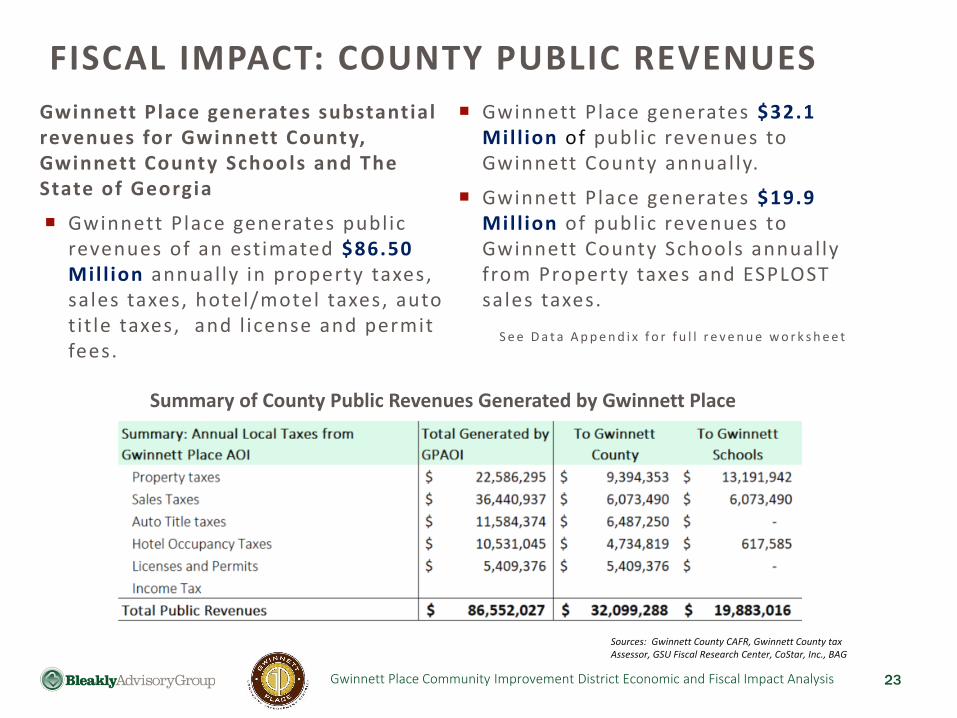
Gwinnett Place generates substantial revenues for Gwinnett County, Gwinnett County Schools and The State of Georgia
Gwinnett Place generates publ ic revenues of an est imated $86.50 Mil l ion annually in property taxes, sales taxes, hotel/motel taxes, auto t it le taxes, and l icense and permit fees.
Gwinnett Place generates $32.1 Mil l ion of publ ic revenues to Gwinnett County annually.
Gwinnett Place generates $19.9 Mil l ion of publ ic revenues to Gwinnett County Schools annually from Property taxes and ESPLOST sales taxes.
S e e D a t a A p p e n d i x f o r f u l l r e v e n u e w o r k s h e e t
FISCAL IMPACT: COUNTY PUBLIC REVENUES
Sources: Gwinnett County CAFR, Gwinnett County tax Assessor, GSU Fiscal Research Center, CoStar, Inc., BAG
23
Summary of County Public Revenues Generated by Gwinnett Place

Gwinnett Place Community Improvement District Economic and Fiscal Impact Analysis
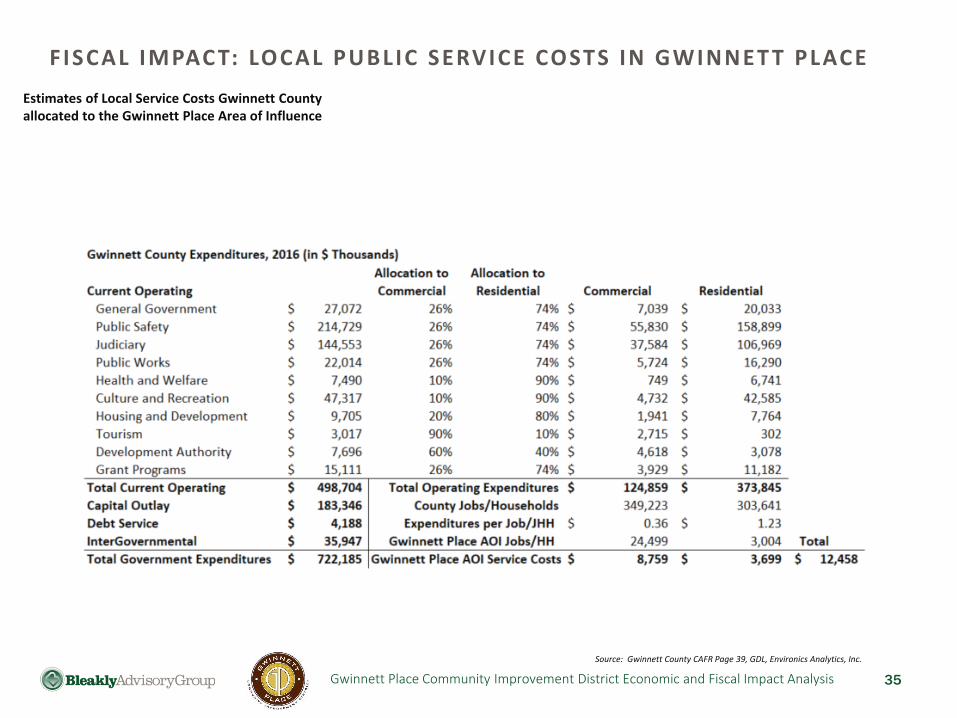
Estimate of County Service Costs allocated to the Gwinnett Place Area of Influence
• Gwinnett County’s 2016 Current Operating Expenditures was $499 million dollars
• Additional expenditure line items bring the Total Government Expenditures for 2016 to $722 million.
• Local revenues (Property taxes, sales taxes, Hotel Occupancy taxes, TAVT Taxes, Other Takes and Permits and Licenses) in 2016 totaled $625 million, covering 81.5% of the County’s total 2016 Expenditures.
• Estimates of local service costs in Gwinnett County were allocated to commercial and residential uses by using the proportional valuation method for fiscal impact analysis which allocates local service cost between residential and commercial uses based on their proportion in the tax digest and then derives a per capita service cost per resident and per employee based on the population and total number of employees in Gwinnett County.
• Using this widely accepted fiscal impact methodology, the cost of providing county services in Gwinnett Place is estimated to be $12.4 million annually, or 2.5% of the county’s Total Current Operating Budget.
See Data Appendix for more detail
Source: Gwinnett County CAFR Page 39, GDL, Environics Analytics, Inc..
24
Gwinnett Place CID Impact Tables 2017; Tab=Budget Allocation
General Government
5%
Public Safety
43%
Judiciary
29%
Public Works
4%
Health and Welfare
2%
Culture and
Recreation
9%
Housing and
Development
2%
Tourism
1%
Development
Authority
2% Grant Programs
3%
GWINNETT COUNTY OPERATING EXPENDITURES BY
CATEGORY 2016
FISCAL IMPACT: DETERMINING COUNTY SERVICE COSTS

Gwinnett Place Community Improvement District Economic and Fiscal Impact Analysis
Gwinnett Count y Schools ’ 2016 tota lbudget was $1.8 b i l l ion , of which $697mi l l ion (38%) was der ived from loca lsources (property tax and ESPLOST) .
2016 tota l enro l lment was 176,048students , meaning that the tota lschoo ls cost per student was $10,382 ,of which $3,960 was der ived from loca lproperty and sa les taxes .
The Gwinnett P lace Area of Inf luencehas an est imated 3,004 households ,with an est imated 0.58 school -agedstudents per household .
In Gwinnett County 87% of loca lstudents attend publ ic schools , th i smeans that in the Gwinnet P lace Areaof Inf luence there are an est imated1,542 students attending GwinnettCounty Schools - less than 1% of tota lenro l lment .
By apply ing the $3,960 per studentschool cost f rom loca l sources to theenro l lment resu l ts in an est imatedannua l school cost of $6.1 mi l l ion forstudents f rom Gwinnett P lace AOI .
The local revenues generated bythe Gwinnett Place Area Influencefor Gwinnett County Schools is$19.9 mil l ion annually resulting ina net fiscal surplus to GwinnettCounty Schools of $13.8 mil l ionannual ly.
For every dollar in school costsfrom students in Gwinnett PlaceAOI, it produces $3.26 in revenueannual ly.
FISCAL IMPACT: ESTIMATING SCHOOL SERVICE COSTS
25
$6.1 MCost
$19.9 MRevenue
$13.8MSurplus

Gwinnett Place Community Improvement District Economic and Fiscal Impact Analysis
NET FISCAL IMPACT OF GWINNETT PLACEGwinnett P lace generates substant ia l lymore revenue for the County and Schoolsthan it consumes in ser v ices .
Overa l l , Gwinnett P lace generates a netf isca l surp lus of $33.4 mi l l ion to GwinnettCounty and Gwinnett County School sannual ly.
Gwinnett County rece ived $32.1 mi l l ionin publ ic revenues* in 2016 from theGwinnett P lace Area of Inf luence, whi leloca l ser v ice costs att r ibutab le to loca ltax revenues were est imated at $12.5mi l l ion, resu l t ing in a surp lus of $19.6mil l ion to the County .
Gwinnett Place’s tota l revenue to theCounty represents the equiva lent of 12%of the County ’s Genera l fund.
Gwinnett County Schools rece ive $19.9mi l l ion in revenues from the GwinnettP lace AOI , whi le the loca l share ofeducat ion costs for ch i ldren l iv ing in theGwinnett P lace AOI i s just $6.01 mi l l ion ,resu l t ing in a net surplus to GwinnettSchools of $13.8 mi l l ion .
26
Gwinnett Place CID Impact Tables 2017; Tab=Revenue Estimates
* Property, Sales, ATVT and Hotel/Motel Taxes + Estimated Licenses and Permits Sources: Gwinnett County CAFR, Gwinnett County tax Assessor, GSU Fiscal Research Center, CoStar, Inc., BAG
For every $1.00 worth of servicesreceived, Gwinnett Place areagenerates $2.80 in local revenues tothe County and Schools.

Gwinnett Place Community Improvement District Economic and Fiscal Impact Analysis
The Gwinnett Place Area generates $95 mil l ion in publ ic revenues for the State of Georgia.
$24.3 mi l l ion in sa les taxes f rom retai l sa les at Gwinnett P lace.
$5.1 mi l l ion in auto t i t le taxes f rom vehicles sold by Gwinnett P lace auto dealers .
$2.5 mi l l ion in sa les taxes f rom Gwinnett P lace area hotels .
$63 mi l l ion in income taxes f rom employees who work in the Gwinnett P lace Area.S e e D a t a A p p e n d i x f o r d e t a i l s
FISCAL IMPACT: STATE REVENUES
27
Summary of State Public Revenues Generated by Gwinnett Place
Sources: Gwinnett County CAFR, Gwinnett County tax Assessor, GSU Fiscal Research Center, CoStar, Inc., BAG
Sales Taxes ,
$24,293,958
Auto Title taxes,
$5,097,125
Hotel Occupancy
Taxes,
$5,178,641
Income Tax,
$63,424,858
State Taxes from Gwinnett Place AOI
Gwinnett Place Community Improvement District Economic and Fiscal Impact Analysis
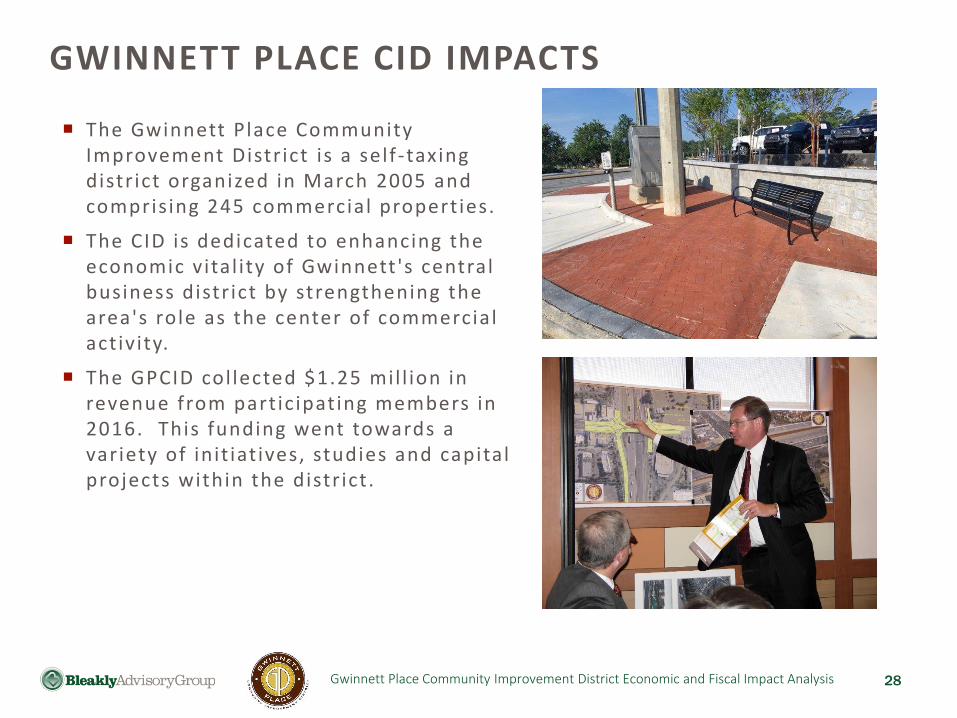
The Gwinnett Place Community Improvement Distr ict is a self -taxing distr ict organized in March 2005 and compris ing 245 commercial properties.
The CID is dedicated to enhancing the economic v ital ity of Gwinnett 's central business distr ict by strengthening the area's role as the center of commercial act iv ity.
The GPCID col lected $1.25 mil l ion in revenue from part ic ipating members in 2016. This funding went towards a variety of init iat ives, studies and capital projects within the distr ict .
GWINNETT PLACE CID IMPACTS
28

Gwinnett Place Community Improvement District Economic and Fiscal Impact Analysis
Key GPCID Accomplishments of the Past Five Years include:
Using CID funding to leverage transportation capital improvements including:
▪ Pleasant hill road interstate bridge upgrade:
▪ Congestion relief
▪ New sidewalks and streetscape improvements
The CID also funds and/or manages a wide variety of improvement operations, research, and economic development activit ies
▪ Community patrols
▪ Intersection redesign projects
▪ Community wayfinding and branding
▪ Research and studies
▪ Economic development initiatives
GWINNETT PLACE CID AND ACTIVITIES
29

Gwinnett Place Community Improvement District Economic and Fiscal Impact Analysis
S ince i ts founding in 2005, the Gwinnett P lace C ID has generated over $13.9 mi l l ion in specia l assessments f rom commercia l property owners .
The CID has leveraged an addi t ional $13.3 mi l l ion in grants and funds f rom Gwinnett County.
GPCID has invested a tota l of $27.4 mi l l ion in the Gwinnett P lace area for a wide range of publ ic improvements , infrastructure and specia l program in i t iat ives .
GPCID INVESTMENT IN GWINNETT PLACE
30
$27.4 million invested in GPCID area
Governmental Total Program
Year Property Taxes Grants Revenue Funds
2005 909,621$ -$ 913,361$ 45,097$
2006 1,098,707$ 100,000$ 1,231,002$ 362,048$
2007 1,355,901$ 74,166$ 1,475,808$ 1,380,530$
2008 1,327,483$ 165,773$ 1,515,801$ 955,840$
2009 1,333,895$ 80,000$ 1,428,540$ 905,137$
2010 1,215,723$ 276,570$ 1,519,702$ 864,046$
2011 1,158,119$ 357,350$ 1,533,779$ 1,540,439$
2012 972,107$ 255,589$ 1,235,624$ 1,939,464$
2013 1,095,303$ 1,440,655$ 2,542,095$ 706,227$
2014 1,043,982$ 230,561$ 1,282,274$ 772,647$
2015 1,246,572$ 30,276$ 1,563,299$ 917,397$
2016 1,213,453$ 176,000$ 1,397,359$ 908,220$
Total 13,970,866$ 3,186,940$ 17,638,644$ 11,297,092$
2009 Co SPLOST Trans. 962,500$
2010 Co. SPLOST Trans. 7,662,500$
2011 Co. SPLOST Sidewalks 654,662$
Federal Trans Grant 1,000,000$
Federal Trans Grant 10,279,662$
GWINNETT PLACE CID REVENUES INVESTED IN AREA 2005-2016
Gwinett County Commitment of SPLOST Funds to GP CID

Gwinnett Place Community Improvement District Economic and Fiscal Impact Analysis
As a result of init iat ives by theGwinnett Place CID to providecoordinated safety and securitythrough community patrols, removalof graff it i and other wel l establ ished“no broken windows” publ ic safetytechniques, reported pol ice incidentsin the CID have decl ined by 39% since2007, to the benefit of residents,businesses, shoppers and visitors .
This represents a savings of $978,747in public safety costs to the CountyBased on 2016 Gwinnett County publ icsafety costs per incident in theCounty.
CID INVESTMENT IN PUBLIC SAFETY PAYS OFF
31
4,016
3,166 2,897
2,690 2,650
2,045
2,524 2,645 2,845
2,455
-
500
1,000
1,500
2,000
2,500
3,000
3,500
4,000
4,500
2007 2008 2009 2010 2011 2012 2013 2014 2015 2016
Total Crime Incidents in GPCID

Gwinnett Place Community Improvement District Economic and Fiscal Impact Analysis
APPENDIX: Data Sources32

Gwinnett Place Community Improvement District Economic and Fiscal Impact Analysis
FISCAL IMPACT: PUBLIC REVENUESSUMMARY
33

Gwinnett Place Community Improvement District Economic and Fiscal Impact Analysis
GWINNETT PLACE CID RETAIL SALES
34
* Non-automotive spending onlyBased on data from Nielsen
Gwinnett Place Community Improvement District Economic and Fiscal Impact Analysis
F ISCAL IMPAC T: LOCAL PUBLIC SERVICE COSTS IN GWINNET T PLACE
Estimates of Local Service Costs Gwinnett County allocated to the Gwinnett Place Area of Influence
Source: Gwinnett County CAFR Page 39, GDL, Environics Analytics, Inc.
35
Gwinnett Place CID Impact Tables 2017; Tab=Budget Allocation

Gwinnett Place Community Improvement District Economic and Fiscal Impact Analysis
Data Sources:
▪ US Census 2010 decennial and 2015 2016 American Community Survey
▪ US Census Center for Economic Studies
▪ Longitudinal Employer Household Dynamics
▪ Environics Analytics, Inc.
▪ A national demographic and economic data f irm.
▪ US Bureau of Labor Statistics
▪ Georgia Department of Labor
▪ Gwinnett County GIS
▪ Gwinnett County Assessor
▪ CoStar, Inc.
▪ Atlanta Regional Commission
DATA SOURCES
36