The East Asian Summer Monsoon in pacemaker experiments...
25
Noname manuscript No. (will be inserted by the editor) The East Asian Summer Monsoon in pacemaker 1 experiments driven by ENSO 2 Do you have a subtitle? 3 If so, write it here 4 Hui Ding · Richard J. Greatbatch · Jian 5 Lu · Ben Cash 6 Received: date / Accepted: date 7 Abstract The variability of the East Asian summer monsoon (EASM) is 8 studied using a pacemaker technique driven by ENSO in an atmospheric gen- 9 eral circulation model (AGCM) coupled to a slab mixed layer model. In the 10 pacemaker experiments, sea surface temperature (SST) is constrained to ob- 11 servations in the eastern equatorial Pacific through a q-flux that measures 12 Hui Ding · Richard J. Greatbatch GEOMAR Helmholtz Centre for Ocean Research Kiel, Kiel, Germany Tel.: +49 431 6004008 E-mail: [email protected] Jian Lu Pacific Northwest National Laboratory, 902 Battelle Boulevard Richland, WA Ben Cash Center for Ocean-Land-Atmosphere Studies, Institute of Global Environment and Society, Calverton, Maryland, USA
Transcript of The East Asian Summer Monsoon in pacemaker experiments...

Noname manuscript No.(will be inserted by the editor)
The East Asian Summer Monsoon in pacemaker1
experiments driven by ENSO2
Do you have a subtitle?3
If so, write it here4
Hui Ding · Richard J. Greatbatch · Jian5
Lu · Ben Cash6
Received: date / Accepted: date7
Abstract The variability of the East Asian summer monsoon (EASM) is8
studied using a pacemaker technique driven by ENSO in an atmospheric gen-9
eral circulation model (AGCM) coupled to a slab mixed layer model. In the10
pacemaker experiments, sea surface temperature (SST) is constrained to ob-11
servations in the eastern equatorial Pacific through a q-flux that measures12
Hui Ding · Richard J. Greatbatch
GEOMAR Helmholtz Centre for Ocean Research Kiel, Kiel, Germany
Tel.: +49 431 6004008
E-mail: [email protected]
Jian Lu
Pacific Northwest National Laboratory, 902 Battelle Boulevard Richland, WA
Ben Cash
Center for Ocean-Land-Atmosphere Studies, Institute of Global Environment and Society,
Calverton, Maryland, USA

2 Hui Ding et al.
the contribution of ocean dynamics to SST variability, while the AGCM is13
coupled to the slab model. An ensemble of pacemaker experiments is analysed14
using a multivariate EOF analysis to identify the two major modes of variabil-15
ity of the EASM. The results show that the pacemaker experiments simulate16
a substantial amount (around 45%) of the variability of the first mode (the17
Pacific-Japan pattern) in ERA40 from 1979 to 1999. Different from previous18
work, the pacemaker experiments also simulate a large part (25%) of the vari-19
ability of the second mode, related to rainfall variability over northern China.20
Furthermore, we find that the lower (850hPa) and the upper (200hPa) tropo-21
spheric circulation of the first mode display the same degree of reproducibility22
whereas only the lower part of the second mode is reproducible. The basis for23
the success of the pacemaker experiments is the ability of the experiments to24
reproduce the relationship between El Nino Southern Oscillation (ENSO) and25
the EASM.26
Keywords East Asian Summer Monsoon · pacemaker · ENSO27
1 Introduction28
The East Asian Summer Monsoon (EASM) is an important component of the29
Asian-Australian monsoon system (Wang, 2006). The EASM brings summer30
rainfall to China, Japan and Korea from the tropical Indian and Pacific Oceans31
and sustains about one fifth of the human population. Fluctuations of the32
EASM have a profound impact on East Asia (e.g., Rodwell and Hoskins, 2001).33

The East Asian Summer Monsoon in pacemaker experiments driven by ENSO 3
Thus, it is of great socioeconomic interest to investigate the variability of the34
EASM.35
Numerous studies have reported the influence of ENSO (Philander, 1990)36
on the western North Pacific and East Asian summer climate (e.g., Zhang37
et al, 1999; Wang et al, 2000; Wu et al, 2003; Wu and Kirtman, 2004; Lu38
et al, 2006; Li et al, 2007; Wang et al, 2008; Sun et al, 2010). The physical39
process that transfers the ENSO signal to the western North Pacific and East40
Asia has been extensively studied (e.g., Wang et al, 2000; Wang and Zhang,41
2002; Lau and Nath, 2006). Recently, some studies found that the Indian42
Ocean capacity effect has a role to play in order to prolong the influence43
of ENSO from winter to the following summer (e.g., Xie et al, 2009, 2010).44
The influence of ENSO provides a physical foundation for predictability of45
the lower tropospheric summer circulation over the western North Pacific and46
East Asia (Li et al, 2012, 2014). Nevertheless, potential predictability of the47
EASM is thought to be low, given the claim that the variability of the EASM48
is dominated by atmospheric internal variability (e.g., Lu et al, 2006)49
Multivariate Empirical Orthogonal Function (EOF) analysis is a useful50
tool to study the EASM, given the complex space and time structures asso-51
ciated with the East Asian summer variability (Wang et al, 2008). Following52
Wang et al (2008), Sun et al (2010) identify two major modes of atmospheric53
circulation variability associated with the EASM by applying the MV-EOF54
analysis to boreal summer (June/July/August: JJA) mean anomalies of zonal55
and meridional winds at 850 and 200 hPa. Both of the two modes are linked to56

4 Hui Ding et al.
rainfall anomalies over East Asia. The first mode is very similar to the Pacific-57
Japan pattern (Nitta, 1987; Kosaka and Nakamura, 2006) and is associated58
with rainfall anomalies in the Meiyu/Changma/Baiu rain band while the sec-59
ond mode is associated with rainfall anomalies over northern China (Sun et al,60
2010). These authors further found that the two EOF modes are both asso-61
ciated with ENSO during the previous winter (December/January/February:62
DJF; Sun et al (2010)), implying that they can be partly reproduced, at least63
statistically, given the best possible information about tropical forcing. Fur-64
thermore, Ding et al (2014) found that about 25% of the variance of the first65
mode can be captured by a coupled climate model (the Kiel Climate Model,66
Park et al (2009)) driven by observed wind stress anomalies alone. However,67
their coupled model fails to reproduce the variability of the second mode as68
seen in observations (Ding et al, 2014).69
In this study, we re-visit the two major modes (Sun et al, 2010) in an70
atmospheric general circulation model (GCM) coupled with a slab mixed layer71
model using a pacemaker technique similar to that described in Cash et al72
(2010). We focus on how much skill the model can achieve at reproducing the73
variability of the two modes in ERA40. This is important according to the74
notion that the skill we find sets an upper limit of potential predictability75
in practice. Results show that the model can capture a considerable part of76
the variability of both the first and second modes, which takes a step forward77
from Ding et al (2014). In Section 2, the model and experiments are described.78

The East Asian Summer Monsoon in pacemaker experiments driven by ENSO 5
Section 3 presents the model results, and section 4 provides a summary and79
conclusion.80
2 Pacemaker experiments81
In this study, the atmospheric model is the Geophysical Fluid Dynamics Labo-82
ratory AM2.1 (Global Atmospheric Model Development Team, 2004; Delworth83
et al, 2006), which is coupled with a slab mixed layer model of depth 50m. To84
perform pacemaker experiments, the atmosphere/slab-ocean coupled model is85
first integrated with the ocean model temperature (model SST) restored to86
observed SST with a relaxation time scale of 1 day. In the integration, a quan-87
tity termed q-flux is calculated as the flux resulting from the restoring term.88
The q-flux represents the contribution of ocean dynamical processes, missing89
in the slab model, to SST evolution. In pacemaker experiments, the q-flux is90
added back to the coupled model as an external forcing. We emphasize that91
the q-flux added back to the pacemaker experiments is independent of the92
model state, so that ocean temperature in the model is not directly prescribed93
from the observations but, rather, is a fully prognostic quantity. Therefore, in94
pacemaker experiments the atmosphere can both drive and be driven by ocean95
model temperature, avoiding some of the issues suffered by atmosphere-only96
or ocean-only simulations (see Greatbatch et al (1995); Wang et al (2005); Wu97
and Kirtman (2005); Wu et al (2006); Wu and Kirtman (2007); Griffies et al98
(2009)).99

6 Hui Ding et al.
An ensemble of experiments is performed in which the monthly varying q-100
flux is prescribed in the central and eastern tropical Pacific (8◦S-8◦N, 172◦E-101
the South American coast) while elsewhere the monthly climatological q-flux102
is prescribed. We stress that all the information about the time series of ob-103
served events comes from the q-flux that is applied in the central and eastern104
tropical Pacific corresponding to the region most strongly influenced by ENSO.105
The model is integrated from 1950 to 1999 with eight ensemble members dif-106
fering only in their initial conditions. In this study, the ensemble mean of the107
eight integrations is analyzed and shown in the figures unless stated otherwise.108
The pacemaker experiments reproduce observed SST variability in the central109
and eastern tropical Pacific (not shown), as expected. These pacemaker exper-110
iments have been shown to capture a substantial part of the East Asian winter111
monsoon rainfall variability (Lu et al, 2011). Further information about the112
pacemaker experiments can be found in Lu et al (2011).113
3 Results114
Like in Sun et al (2010), we apply the same MV-EOF analysis to boreal sum-115
mer (JJA) seasonal mean anomalies of ERA40 (Uppala et al, 2005) wind116
fields at 850 and 200 hPa. The domain of analysis covers 10◦N-50◦N and117
100◦E-150◦E for the years 1958-2001. Prior to the EOF analysis, interannual118
anomalies are calculated by removing the seasonal mean climatology and then119
weighted by the square root of cosine of latitude to provide equal weighting120

The East Asian Summer Monsoon in pacemaker experiments driven by ENSO 7
of equal areas. The MV-EOF analysis method is described in detail in Wang121
(1992).122
The spatial pattern (EOF) and associated principal component (PC) time123
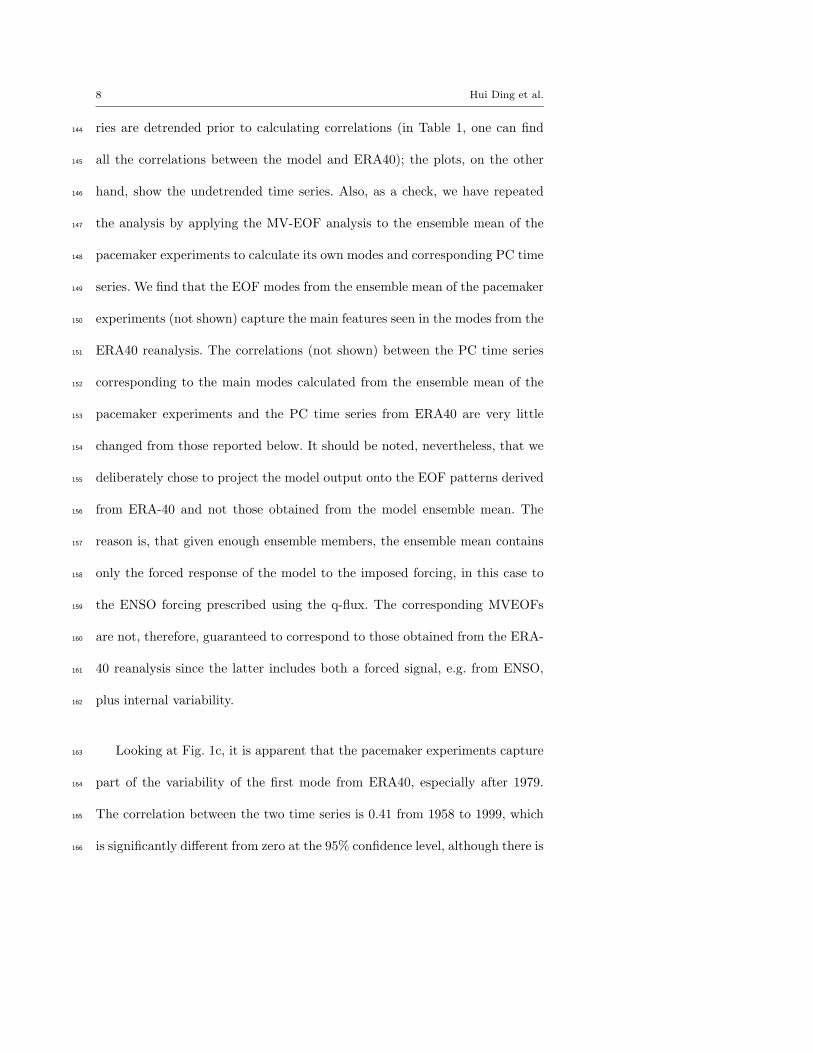
series of the first mode, which explains 20.6% of the variance, are shown in124
Fig. 1. Sun et al (2010) noted that the positive phase of EOF1 at 850hPa125
(Fig. 1a) resembles the negative phase of the Pacific-Japan (PJ) pattern (Nitta,126
1987; Kosaka and Nakamura, 2006). At 200 hPa (Fig. 1b), the positive phase of127
EOF1 displays a large cyclonic anomaly associated with an anomalous westerly128
wind band between 30◦N and 40◦N (Sun et al, 2010). The anomalous westerly129
band is associated with a meridional shift of the East Asian Jet, of which the130
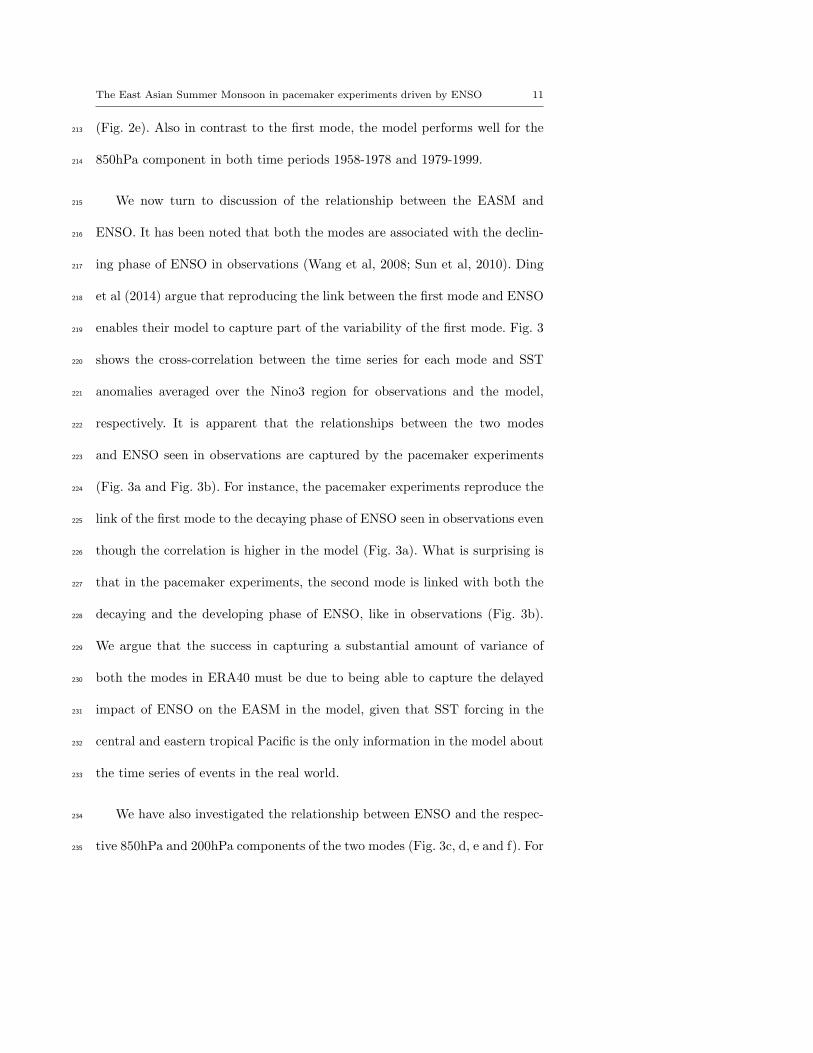
core is located between 40◦N and 45◦N (Lin and Lu, 2005). The second mode,131
which explains 12.1% of the variance, is shown in Fig. 2. The positive phase132
of EOF2 at 850hPa is characterized by southerly wind anomalies extending133
northeastward and covering the southeastern part of China, Korea and Japan134
(Fig. 2a). At 200hPa, the positive phase of EOF2 features an anticyclonic135
anomaly (Fig. 2b). Recently, Greatbatch et al (2013) argue that this mode136
is related to the variability of the Indian Summer Monsoon. As to the two137
modes, one can refer to Sun et al (2010) for more details.138
When assessing the pacemaker experiments, we project the model wind139
fields onto the corresponding spatial patterns of the two modes calculated140
from the ERA40 reanalysis. The resulting time series from the model are141
shown in Fig. 1c and Fig. 2c and compared to the corresponding time series142
from ERA40, respectively. To emphasize interannual variability, all time se-143
8 Hui Ding et al.
ries are detrended prior to calculating correlations (in Table 1, one can find144
all the correlations between the model and ERA40); the plots, on the other145
hand, show the undetrended time series. Also, as a check, we have repeated146
the analysis by applying the MV-EOF analysis to the ensemble mean of the147
pacemaker experiments to calculate its own modes and corresponding PC time148
series. We find that the EOF modes from the ensemble mean of the pacemaker149
experiments (not shown) capture the main features seen in the modes from the150
ERA40 reanalysis. The correlations (not shown) between the PC time series151
corresponding to the main modes calculated from the ensemble mean of the152
pacemaker experiments and the PC time series from ERA40 are very little153
changed from those reported below. It should be noted, nevertheless, that we154
deliberately chose to project the model output onto the EOF patterns derived155
from ERA-40 and not those obtained from the model ensemble mean. The156
reason is, that given enough ensemble members, the ensemble mean contains157
only the forced response of the model to the imposed forcing, in this case to158
the ENSO forcing prescribed using the q-flux. The corresponding MVEOFs159
are not, therefore, guaranteed to correspond to those obtained from the ERA-160
40 reanalysis since the latter includes both a forced signal, e.g. from ENSO,161
plus internal variability.162
Looking at Fig. 1c, it is apparent that the pacemaker experiments capture163
part of the variability of the first mode from ERA40, especially after 1979.164
The correlation between the two time series is 0.41 from 1958 to 1999, which165
is significantly different from zero at the 95% confidence level, although there is166

The East Asian Summer Monsoon in pacemaker experiments driven by ENSO 9
effectively no correlation over the period 1958-1978 (see Table 1 and Ding et al167
(2014) for further discussion of this issue). On the other hand, the correlation168
reaches 0.66 from 1979 to 1999, also statistically different from zero at the169
95% confidence level, when the influence of ENSO on the East Asia summer170
climate becomes stronger after the 1976/77 climate shift (e.g., Xie et al, 2010;171
Sun et al, 2010; Ding et al, 2014). It follows that about 40% of the variability172
associated with the first mode is captured by the pacemaker experiments after173
1979, which is greater than the 25% reported by Ding et al (2014). What is174
more interesting is that the pacemaker experiments also capture part of the175
variability of the second mode (Fig. 2c). The correlation is 0.37 from 1958 to176
1999, which is lower than for the first mode, but still significantly different from177
zero at the 95% confidence level. The pacemaker experiments also perform178
better for the second mode after 1979 with a higher correlation of 0.49 - an179
important result given that no significant part of the second mode variability180
in ERA40 is captured in the previous work of Ding et al (2014). Later, we will181
discuss possible reasons for success in the pacemaker experiments.182
Lu et al (2006) found that interannual variability of the lower troposphere183
summer circulation over the western North Pacific is dominated by tropical184
SST forcing, while fluctuations of the upper troposphere circulation are dom-185
inated by atmospheric internal dynamics, independent of boundary forcings.186
Sun et al (2010) found that a linear, dry dynamical model, when driven by the187
diabatic heating anomalies in the Tropics associated with each mode, can re-188
produce many of the anomalous circulation features for the lower troposphere,189

10 Hui Ding et al.
but not for the upper troposphere. These motivate us to investigate the lower190
and upper components of the two modes, separately.191
To derive the contribution of the wind fields at 850hPa to the time series192
(Fig. 1d and Fig. 2d), we project wind fields onto the corresponding spatial193
patterns of the two modes only at 850hP. Likewise, we can also derive the194
contribution of wind fields at 200hPa to the time series (Fig. 1e and Fig. 2e)195
by projecting wind fields onto the spatial pattern of the two modes only at196
200hPa. The pacemaker experiments perform well for both the 850hP and the197
200hPa components of the first mode when looking at the whole period 1958-198
1999 and also the subperiod 1979-1999. The correlations between the model199
and ERA40 from 1958 to 1999 are 0.42 and 0.31 (both statistically different200
from zero at the 95% confidence level) for 850hPa and 200hPa, respectively201
(see Table 1). As we found using projection onto the full EOF pattern at both202
850hPa and 200hPa, the correlation is only significant after 1979, this being203
true for both the lower (0.58) and upper (0.52) components, and with effec-204
tively no correlation over the period 1958-1978. It follows that about 25% vari-205
ance of the 200hPa component of the first mode is captured by the pacemaker206
experiments after 1979, which is an important result given that interannual207
variability of the upper tropospheric circulation is thought to be dominated by208
internal atmospheric dynamics (Lu et al, 2006). Different from the first mode,209
the pacemaker experiment performs well only at 850hPa for the second mode.210
The correlation between the model and ERA40 is 0.55 from 1958 to 1999 for211
the 850hPa component (Fig. 2d), but only 0.16 for the 200hPa component212
The East Asian Summer Monsoon in pacemaker experiments driven by ENSO 11
(Fig. 2e). Also in contrast to the first mode, the model performs well for the213
850hPa component in both time periods 1958-1978 and 1979-1999.214
We now turn to discussion of the relationship between the EASM and215
ENSO. It has been noted that both the modes are associated with the declin-216
ing phase of ENSO in observations (Wang et al, 2008; Sun et al, 2010). Ding217
et al (2014) argue that reproducing the link between the first mode and ENSO218
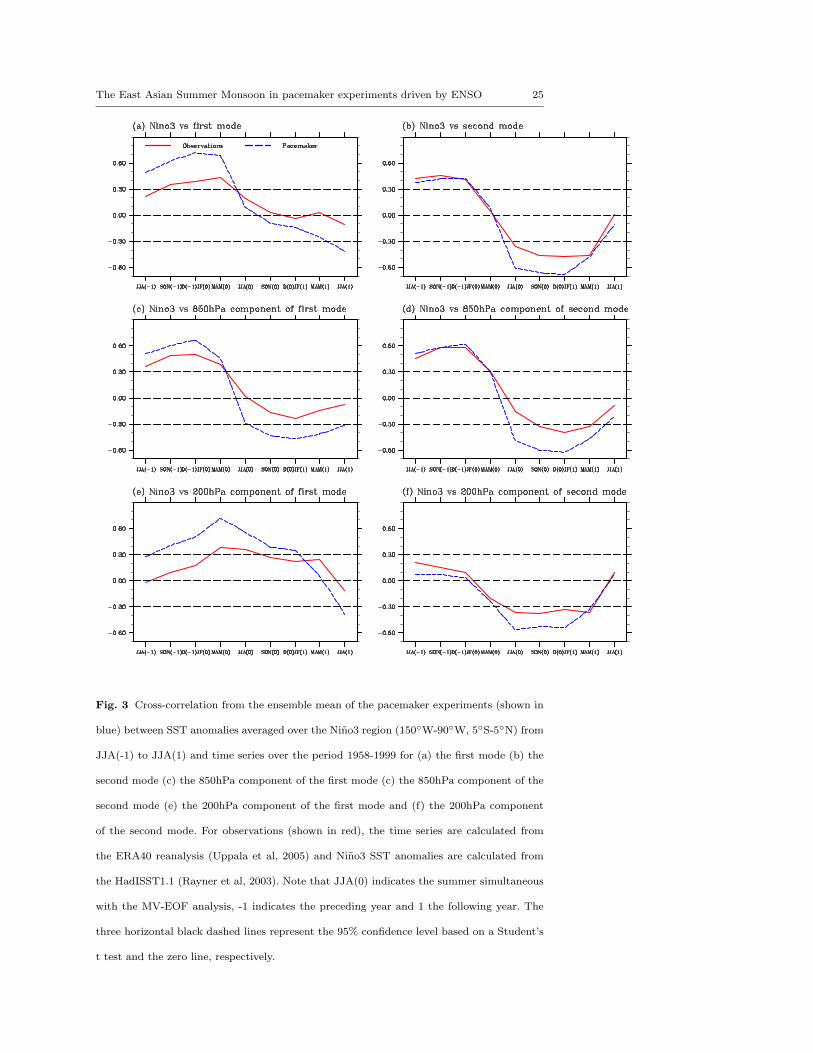
enables their model to capture part of the variability of the first mode. Fig. 3219
shows the cross-correlation between the time series for each mode and SST220
anomalies averaged over the Nino3 region for observations and the model,221
respectively. It is apparent that the relationships between the two modes222
and ENSO seen in observations are captured by the pacemaker experiments223
(Fig. 3a and Fig. 3b). For instance, the pacemaker experiments reproduce the224
link of the first mode to the decaying phase of ENSO seen in observations even225
though the correlation is higher in the model (Fig. 3a). What is surprising is226
that in the pacemaker experiments, the second mode is linked with both the227
decaying and the developing phase of ENSO, like in observations (Fig. 3b).228
We argue that the success in capturing a substantial amount of variance of229
both the modes in ERA40 must be due to being able to capture the delayed230
impact of ENSO on the EASM in the model, given that SST forcing in the231
central and eastern tropical Pacific is the only information in the model about232
the time series of events in the real world.233
We have also investigated the relationship between ENSO and the respec-234
tive 850hPa and 200hPa components of the two modes (Fig. 3c, d, e and f). For235

12 Hui Ding et al.
the first mode, the 850hPa component is significantly correlated with Nino3236
SST variability in the previous winter whereas the 200hPa component is linked237
with Nino3 SST variability in the previous spring. For the second mode, the238
850hPa component is also significantly correlated with Nino3 SST variability239
in the previous winter but there is no significant relationship when ENSO leads240
the 200hPa component. These results are consistent with the reproducibility241
of the 850hPa and 200hPa components of the modes noted earlier and add242
strength to the argument that the success of the pacemaker experiments at243
capturing part of the variability of the EASM comes from their ability to244
capture the ENSO/EASM relationship.245
The relationship between ENSO and the EASM (with ENSO leading), as246
revealed by ERA-40 and HadISST data sets for the two periods 1958-1978247
and 1979-1999, is further illustrated in Table 2. It is clear that the link for248
both strengthens after 1979, especially for the first mode for which there is249
no significant link before 1979, as noted earlier (see also Ding et al, 2014).250
In particular, the correlation coefficients between the first (second) mode and251
ENSO in the previous winter are -0.06 (0.37) and 0.63 (0.52) for 1958-1978252
and 1979-1999, respectively. The stronger link to ENSO after 1979 can also253
be seen for the 850hPa component of the first (second) mode with correla-254
tion coefficients of 0.11 (0.39) and 0.71 (0.74) for 1958-1978 and 1979-1999,255
respectively.256
Finally, we note that the correlation between Nino3 SST anomalies and the257
first mode and its 850hPa and 200hPa components are much higher for the258

The East Asian Summer Monsoon in pacemaker experiments driven by ENSO 13
experiments than in the observations. A possible reason is that the correlations259
shown for the experiments are for the ensemble mean, filtering out the noise260
and increasing the signal (here ENSO-forced) to noise ratio. We have also261
calculated the cross-correlation for the individual ensemble members and find262
that they still capture the delayed impact of ENSO on the EASM even though263
the correlation coefficients are lower (not shown).264
4 Summary and conclusion265
In this study we have revisited the two major modes of variability of the266
East Asian Summer Monsoon (EASM) identified by Sun et al (2010) using267
the pacemaker experiments of Lu et al (2011). In the pacemaker experiments,268
all the information about the time series of events in the real world comes269
from the q-flux that is applied in the central and eastern tropical Pacific.270
The advantage of the pacemaker experiments is that SST is a fully prognostic271
variable and can freely interact with the atmospheric model (Cash et al, 2010;272
Lu et al, 2011), avoiding some of the issues inherent in atmosphere-only or273
ocean-only simulations (Greatbatch et al, 1995; Wang et al, 2005; Wu and274
Kirtman, 2005; Wu et al, 2006; Wu and Kirtman, 2007; Griffies et al, 2009).275
The two modes are calculated by applying a MV-EOF analysis to bo-276
real summer (June/July/August) seasonal mean anomalies of the zonal and277
meridional winds in the lower (850 hPa) and the upper (200 hPa) troposphere278
from the ERA40 reanalysis (Uppala et al, 2005), and corresponding principal279
components (PC) measure the variability of the modes. For the pacemaker280

14 Hui Ding et al.
experiments, we project the model wind fields onto the respective spatial pat-281
terns of the two modes from the ERA40 reanalysis to derive the corresponding282
time series. Results indicate that the model can capture a significant part of283
the variability of both the first and second modes. The correlation coefficients284
using detrended time series between the pacemaker experiments and ERA40285
from 1958 to 1999 are 0.41 and 0.37 for the first and second modes, respectively.286
These correlation coefficients increase to 0.66 and 0.49 after 1979, consistent287
with stronger ENSO forcing after the 1976/77 climate shift (e.g., Xie et al,288
2010). The results from the pacemaker experiments take a step forward from289
Ding et al (2014). In particular, the pacemaker experiments can capture about290
25% of variance of the second mode after 1979. We argue that the key element291
is to capture the delayed impact of ENSO on the East Asian summer climate,292
something that is still a challenge for many of the state-of-the art coupled293
models that took part in CMIP5 (Fu et al, 2013).294
We also investigate the respective 850hPa and 200hPa components of the295
two modes. To derive the 850hPa (200hPa) components, we project wind fields296
from only 850hP (200hPa) onto the corresponding spatial patterns of the two297
modes. For the first mode, the 850hPa and 200hPa components are almost298
equally well captured by the pacemaker experiments whereas for the second299
mode, only the 850hPa component can be captured.300
Finally we note that the MVEOF analysis used here is not dependent301
on the use of the ERA-40 reanalysis. Wang et al (2008) originally obtained302
the same two MVEOFs using a version of the NCEP reanalysis (Kanamitsu303

The East Asian Summer Monsoon in pacemaker experiments driven by ENSO 15
et al, 2002) and, as noted in Section 3, the same two MVEOFs emerge when304
the analysis is applied to the ensemble mean of the pacemaker experiments.305
Another example is given in Figures 5 and 6 of Ding et al (2014). We have306
also repeated the complete analysis carried out in this paper using both the307
NCEP and ERA-Interim reanalyses and found little change to the results (not308
shown).309
Acknowledgements HD and RJG are grateful for continued support from GEOMAR.310
JL is supported by the Office of Science of the U.S. Department of Energy as part of311
the Regional and Global Climate Modeling program. BC acknowledges support from the312
National Science Foundation (grants 0830068, 0957884, and 1338427), National Oceanic313
and Atmospheric Administration (grant NA09OAR4310058) and National Aeronautics and314
Space Administration (grant NNX09AN50G). We are grateful to two anonymous reviewers315
for their helpful comments.316
References317
Cash BA, Rodo X, Kinter III JL, Yunus M (2010) Disentangling the im-318
pact of ENSO and Indian ocean variability on the regional climate of319
Bangladesh: Implications for cholera risk. J Climate 23(10):2817–2831, DOI320
10.1175/2009JCLI2512.1321
Delworth TL, Broccoli AJ, Rosati A, Stouffer RJ, Balaji V, Beesley JA, Cooke322
WF, Dixon KW, Dunne J, Dunne K, et al (2006) GFDL’s CM2 global323
coupled climate models. Part I: Formulation and simulation characteristics.324
J Climate 19(5):643–674, DOI 10.1175/JCLI3629.1325

16 Hui Ding et al.
Ding H, Greatbatch RJ, Park W, Latif M, Semenov VA, Sun X (2014) The326
variability of the East Asian summer monsoon and its relationship to ENSO327
in a partially coupled climate model. Climate Dyn 40(1):367–379, DOI328
10.1007/s00382-012-1642-3329
Fu Y, Lu R, Wang H, Yang X (2013) Impact of overestimated ENSO variabil-330
ity in the relationship between ENSO and East Asian summer rainfall. J331
Geophys Res 118(12):6200–6211, DOI 10.1002/jgrd.50482332
Global Atmospheric Model Development Team (2004) The New GFDL Global333
Atmosphere and Land Model AM2/LM2: Evaluation with Prescribed SST334
Simulations. J Climate 17(17):4641–467, DOI 10.1175/JCLI-3223.1335
Greatbatch R, Li G, Zhang S (1995) Hindcasting ocean climate vari-336
ability using time-dependent surface data to drive a model: An ide-337
alized study. J Phys Oceanogr 25(11):2715–2725, DOI 10.1175/1520-338
0485(1995)025<2715:HOCVUT>2.0.CO;2339
Greatbatch RJ, Sun X, Yang XQ (2013) Impact of variability in the Indian340
summer monsoon on the East Asian summer monsoon. Atmosph Sci Lett341
14(1):14–19, DOI 10.1002/asl2.408342
Griffies S, Biastoch A, Boning C, Bryan F, Danabasoglu G, Chassignet E,343
England M, Gerdes R, Haak H, Hallberg R, et al (2009) Coordinated344
ocean-ice reference experiments (COREs). Ocean Model 26(1-2):1–46, DOI345
10.1016/j.ocemod.2008.08.007346
Kanamitsu M, Ebisuzaki W, Woollen J, Yang SK, Hnilo J, Fiorino M, Potter347
G (2002) NCEP-DOE AMIP-II Reanalysis (R-2). Bull Am Meteorol Soc348

The East Asian Summer Monsoon in pacemaker experiments driven by ENSO 17
83(11):1631–1643, DOI 10.1175/BAMS-83-11-1631349
Kosaka Y, Nakamura H (2006) Structure and dynamics of the summer-350
time Pacific–Japan teleconnection pattern. Quart J Roy Meteor Soc351
132(619):2009–2030, DOI 10.1256/qj.05.204352
Lau NC, Nath MJ (2006) ENSO modulation of the interannual and intrasea-353
sonal variability of the East Asian monsoon-A model study. J Climate354
19(18):4508–4530, DOI 10.1175/JCLI3878.1355
Li C, Lu R, Dong B (2012) Predictability of the western North Pacific summer356
climate demonstrated by the coupled models of ENSEMBLES. Climate Dyn357
39(1-2):2, DOI 10.1007/s00382-011-1274-z358
Li C, Lu R, Dong B (2014) Predictability of the western North Pacific359
summer climate associated with different ENSO phases by ENSEMBLES360
multi-model seasonal forecasts. Climate Dyn 43(11-12):1829–1845, DOI361
10.1007/s00382-013-2010-7362
Li Y, Lu R, Dong B (2007) The ENSO-Asian monsoon interaction in363
a coupled ocean-atmosphere GCM. J Climate 20(20):5164–5177, DOI364
10.1175/JCLI4289.1365
Lin Z, Lu R (2005) Interannual meridional displacement of the East Asian366
upper-tropospheric jet stream in summer. Adv Atmos Sci 22(2):199–211,367
DOI 10.1007/BF02918509368
Lu J, Zhang M, Cash B, Li S (2011) Oceanic forcing for the East Asian precip-369
itation in pacemaker AGCM experiments. Geophys Res Lett 38(12):12,702,370
DOI 10.1029/2011GL047614371

18 Hui Ding et al.
Lu R, Li Y, Dong B (2006) External and Internal Summer Atmospheric Vari-372
ability in the Western North Pacific and East Asia. J Meteor Soc Japan373
84(3):447–462374
Nitta T (1987) Convective activities in the tropical western Pacific and their375
impact on the Northern Hemisphere summer circulation. J Meteor Soc376
Japan 65(3):373–390377
Park W, Keenlyside N, Latif M, Stroh A, Redler R, Roeckner E,378
Madec G (2009) Tropical Pacific climate and its response to global379
warming in the Kiel Climate Model. J Climate 22(1):71–92, DOI380
http://dx.doi.org/10.1175/2008JCLI2261.1381
Philander S (1990) El Nino, La Nina, and the southern oscillation. Academic382
Pr383
Rayner N, Parker D, Horton E, Folland C, Alexander L, Rowell D, Kent E,384
Kaplan A (2003) Global analyses of sea surface temperature, sea ice, and385
night marine air temperature since the late nineteenth century. J Geophys386
Res 108(D14):4407–4453, DOI 10.1029/2002JD002670387
Rodwell M, Hoskins B (2001) Subtropical anticyclones and sum-388
mer monsoons. J Climate 14(15):3192–3211, DOI 10.1175/1520-389
0442(2001)014<3192:SAASM>2.0.CO;2390
Sun X, Greatbatch R, Park W, Latif M (2010) Two major modes of variability391
of the East Asian summer monsoon. Quart J Roy Meteor Soc 136(649):829–392
841, DOI 10.1002/qj.635393

The East Asian Summer Monsoon in pacemaker experiments driven by ENSO 19
Uppala S, Kallberg P, Simmons A, Andrae U, Bechtold V, Fiorino M, Gibson394
J, Haseler J, Hernandez A, Kelly G, et al (2005) The ERA-40 re-analysis.395
Quart J Roy Meteor Soc 131(612):2961–3012, DOI 10.1256/qj.04.176396
Wang B (1992) The vertical structure and development of the ENSO anomaly397
mode during 1979-1989. J Atmos Sci 49(8):698–712, DOI 10.1175/1520-398
0469(1992)049<0698:TVSADO>2.0.CO;2399
Wang B, Zhang Q (2002) Pacific-East Asian Teleconnection. Part II:400
How the Philippine Sea Anomalous Anticyclone is Established during401
El Nino Development. J Climate 15(22):3252–3265, DOI 10.1175/1520-402
0442(2002)015<3252:PEATPI>2.0.CO;2403
Wang B, Wu R, Fu X (2000) Pacific-east Asian teleconnection: How404
does ENSO affect east Asian climate? J Climate 13(9):1517–1536, DOI405
10.1175/1520-0442(2000)013<1517:PEATHD>2.0.CO;2406
Wang B, Ding Q, Fu X, Kang I, Jin K, Shukla J, Doblas-Reyes F (2005)407
Fundamental challenge in simulation and prediction of summer monsoon408
rainfall. Geophys Res Lett 32(15):L15,711, DOI 10.1029/2005GL022734409
Wang B, Wu Z, Li J, Liu J, Chang C, Ding Y, Wu G (2008) How to measure the410
strength of the East Asian summer monsoon. J Climate 21(17):4449–4463,411
DOI 10.1175/2008JCLI2183.1412
Wu R, Kirtman B (2004) Impacts of the Indian Ocean on the Indian413
summer monsoon-ENSO relationship. J Climate 17(15):3037–3054, DOI414
10.1175/1520-0442(2004)017<3037:IOTIOO>2.0.CO;2415

20 Hui Ding et al.
Wu R, Kirtman B (2005) Roles of Indian and Pacific Ocean air–sea cou-416
pling in tropical atmospheric variability. Climate Dyn 25(2):155–170, DOI417
10.1007/s00382-005-0003-x418
Wu R, Kirtman B (2007) Regimes of seasonal air–sea interaction and impli-419
cations for performance of forced simulations. Climate Dyn 29(4):393–410,420
DOI 10.1007/s00382-007-0246-9421
Wu R, Hu Z, Kirtman B (2003) Evolution of ENSO-related rainfall422
anomalies in East Asia. J Climate 16(22):3742–3758, DOI 10.1175/1520-423
0442(2003)016¡3742:EOERAI¿2.0.CO;2424
Wu R, Kirtman B, Pegion K (2006) Local air-sea relationship in ob-425
servations and model simulations. J Climate 19(19):4914–4932, DOI426
10.1175/JCLI3904.1427
Xie S, Du Y, Huang G, Zheng X, Tokinaga H, Hu K, Liu Q (2010) Decadal428
Shift in El Nino Influences on Indo-Western Pacific and East Asian Climate429
in the 1970s. J Climate 23(12):3352–3368, DOI 10.1175/2010JCLI3429.1430
Xie SP, Hu K, Hafner J, Tokinaga H, Du Y, Huang G, Sampe T (2009) Indian431
Ocean capacitor effect on Indo-western Pacific climate during the summer432
following El Nino. J Climate 22(3):730–747, DOI 10.1175/2008JCLI2544.1433
Zhang R, Sumi A, Kimoto M (1999) A diagnostic study of the impact of El434
Nino on the precipitation in China. Adv Atmos Sci 16(2):229–241, DOI435
10.1007/BF02973084436

The East Asian Summer Monsoon in pacemaker experiments driven by ENSO 21
1958-1999 1958-1978 1979-1999
Mode 1 0.41∗ −0.02 0.66∗
850hPa component 0.42∗ 0.15 0.58∗
200hPa component 0.31∗ 0.01 0.52∗
Mode 2 0.37∗ 0.25 0.49∗
850hPa component 0.55∗ 0.47∗ 0.62∗
200hPa component 0.16 0.01 0.32
Table 1 Correlation coefficients between the time series from ERA40 and the pacemaker
experiments for the two modes and their respective 850hPa and 200hPa components in the
three periods: 1958-1999, 1958-1978 and 1979-1999. All the time series are detrended prior
to calculating correlation. Correlations that are significantly different from zero at the 95%
level or higher (assuming each year to be independent) are shown with an asterisk.

22 Hui Ding et al.
1958-1999 1958-1978 1979-1999
Mode 1 0.39∗ −0.06 0.63∗
850hPa component 0.50∗ 0.11 0.71∗
200hPa component 0.39∗ 0.13 0.45∗
Mode 2 0.41∗ 0.37 0.52∗
850hPa component 0.58∗ 0.39 0.74∗
200hPa component 0.09 0.21 0.01
Table 2 Correlation coefficients between Nino3 SST variability in the previous winter and
the two modes and their respective 850hPa and 200hPa components in the three periods:
1958-1999, 1958-1978 and 1979-1999, except for the 200hPa component of the first mode
which is correlated with Nino3 SST variability in the previous spring. All the time series
are detrended prior to calculating correlation. Correlations that are significantly different
from zero at the 95% level or higher (assuming each year to be independent) are shown with
an asterisk. Here, time series for the two modes and their respective 850hPa and 200hPa
components are calculated from the ERA40 reanalysis (Uppala et al, 2005) and Nino3 SST
anomalies are calculated from the HadISST1.1 (Rayner et al, 2003).
The East Asian Summer Monsoon in pacemaker experiments driven by ENSO 23
Fig. 1 Spatial patterns (a and b) of the first MV-EOF mode for 850 hPa winds (a) and
200 hPa winds (b) from ERA40. The corresponding time series from ERA40 (red line) and
the pacemaker experiment (blue line), which is derived by projecting wind fields from the
pacemaker experiment onto the spatial patterns of MV-EOF1 from ERA40, are shown in
panel (c). The 850hPa (d) and 200hPa (e) components of the time series for ERA40 (red
lines) and the pacemaker experiment (blue lines) are derived by projecting wind fields only
at 850hPa (d) and only at 200hPa (e) onto the spatial patterns at the corresponding levels for
MV-EOF1 from ERA40. The first mode explains 20.6% of variance in the ERA40 reanalysis.
Note that the sample arrow in the top right hand corner has length corresponding to 1ms−1.
24 Hui Ding et al.
Fig. 2 Spatial patterns (a and b) of the second MV-EOF mode for 850 hPa winds (a)
and 200 hPa winds (b) from ERA40. The corresponding time series from ERA40 (red line)
and the pacemaker experiment (blue line), which is derived by projecting wind fields from
the pacemaker experiment onto the spatial patterns of MV-EOF2 from ERA40, are shown
in panel (c). The 850hPa (d) and 200hPa (e) components of the time series for ERA40
(red lines) and the pacemaker experiment (blue lines) are derived by projecting wind fields
only at 850hPa (d) and only at 200hPa (e) onto the spatial patterns at the corresponding
levels for MV-EOF2 from ERA40. The second mode explains 12.1% of variance in the ERA40
reanalysis. Note that the sample arrow in the top right hand corner has length corresponding
to 1ms−1.
The East Asian Summer Monsoon in pacemaker experiments driven by ENSO 25
Fig. 3 Cross-correlation from the ensemble mean of the pacemaker experiments (shown in
blue) between SST anomalies averaged over the Nino3 region (150◦W-90◦W, 5◦S-5◦N) from
JJA(-1) to JJA(1) and time series over the period 1958-1999 for (a) the first mode (b) the
second mode (c) the 850hPa component of the first mode (c) the 850hPa component of the
second mode (e) the 200hPa component of the first mode and (f) the 200hPa component
of the second mode. For observations (shown in red), the time series are calculated from
the ERA40 reanalysis (Uppala et al, 2005) and Nino3 SST anomalies are calculated from
the HadISST1.1 (Rayner et al, 2003). Note that JJA(0) indicates the summer simultaneous
with the MV-EOF analysis, -1 indicates the preceding year and 1 the following year. The
three horizontal black dashed lines represent the 95% confidence level based on a Student’s
t test and the zero line, respectively.