The E ect of Start/Stop Strategy on PEM Fuel Cell...
59
The Effect of Start/Stop Strategy on PEM Fuel Cell Degradation Characteristics Master of Science Thesis in the Master Degree Program Applied Physics ERIK ZAKRISSON Department of Applied Physics Division of Condensed Matter Physics CHALMERS UNIVERSITY OF TECHNOLOGY Gothenburg, Sweden, 2011
Transcript of The E ect of Start/Stop Strategy on PEM Fuel Cell...

The Effect of Start/Stop Strategy on PEMFuel Cell Degradation Characteristics
Master of Science Thesis in the Master Degree Program Applied Physics
ERIK ZAKRISSON
Department of Applied PhysicsDivision of Condensed Matter PhysicsCHALMERS UNIVERSITY OF TECHNOLOGYGothenburg, Sweden, 2011

The Effect of Start/Stop Strategy on PEMFuel Cell Degradation Characteristics
Master of Science Thesis in the Master Degree Program Applied Physics
ERIK ZAKRISSON
Department of Applied PhysicsDivision of Condensed Matter Physics
CHALMERS UNIVERSITY OF TECHNOLOGYGothenburg, Sweden, 2011
, Applied Physics, Master’s Thesis i
The Effect of Start/Stop Strategy on PEM Fuel Cell DegradationCharacteristicsMaster of Science Thesis in the Master Degree Program Applied Physics
Erik Zakrisson
c©ERIK ZAKRISSON, 2011, all rights reserved
Department of Applied PhysicsDivision of Condensed Matter PhysicsCHALMERS UNIVERSITY OF TECHNOLOGYSE-412 96 GothenburgSwedenTelephone +46 (0) 31-772 1000Department of Applied Physics, Gothenburg, 2011
ii , Applied Physics, Master’s Thesis

The Effect of Start/Stop Strategy on PEM Fuel CellDegradation Characteristics
ERIK ZAKRISSON
Department of Applied PhysicsDivision of Condensed Matter Physics
Chalmers University of Technology
Abstract
Fuel cells hold the ability to fulfill the objectives of an energy productionthat is effective, virtually free from green house gas emissions andindependent from locally existing raw materials. The most promisingtype of fuel cell for lightweight vehicles and small scale energy productionis the PEM fuel cell, due to its short start-up times and low operatingtemperatures. The development in the last decade has enabled satisfyingpower limits of the PEM fuel cell, which has resulted in an aim to reducethe price and receive a prolonged durability. Conditions during start andstop events result in a severe degradation of the fuel cell, which makesstrategies to mitigate the impact important.
Two protective strategies have been developed and evaluated, one forstart-up and one for shutdown. The strategy tests were performed inlaboratory where the fuel cells were subjected to repetitive start/stopcycles. The performance reduction was measured at 0.5 A/cm2 for each cy-cle and the degradation was analysed with electrochemical in situ methods.
The start-up strategy resulted in a potential loss, at 0.5 A/cm2, of69.7µV/cycle. The corresponding potential loss for the shutdown strategywas 92.5µV/cycle. The degradation analysis showed that the electrochem-ically active platinum surface area was reduced after the preformed cycles,for both of the strategies.
Keywords: PEM Fuel Cell, Degradation, Start-up, Shutdown, CarbonCorrosion, Reformate
, Applied Physics, Master’s Thesis iii

Acknowledgments
This Master’s Thesis is a collaborative work between the industrial sectorand the academia. The project has given me great experiences and a lotof knowledge about several dimensions of the fuel cell technology.
I would like to express my gratitudes to my supervisors Patrik Johanssonat Chalmers University of Technology and Andreas Boden at PowerCellSweden AB for enabling the project and for their support along the process.Matthew Ivity and Axel Baumann Ofstad at PowerCell Sweden AB havealso assisted and guided me through different situations. I would especiallylike to thank Alejandro Oyarce at the Royal Institute of Technology for hisassistance and everlasting interest during my laborative work in Stockholm.
Last but not least I would like to thank my family and friends for supportingand encouraging me during this project.
iv , Applied Physics, Master’s Thesis

Table of Contents
Abstract . . . . . . . . . . . . . . . . . . . . . . . . . . . . . . . . . . . . . . . . . . . . . . . . . . . . . . . . . . . . . . iii
Acknowledgments . . . . . . . . . . . . . . . . . . . . . . . . . . . . . . . . . . . . . . . . . . . . . . . . . . iv
Table of Contents . . . . . . . . . . . . . . . . . . . . . . . . . . . . . . . . . . . . . . . . . . . . . . . . . v
List of Figures . . . . . . . . . . . . . . . . . . . . . . . . . . . . . . . . . . . . . . . . . . . . . . . . . . . . . . vii
List of Tables . . . . . . . . . . . . . . . . . . . . . . . . . . . . . . . . . . . . . . . . . . . . . . . . . . . . . . . viii
List of Abbreviations . . . . . . . . . . . . . . . . . . . . . . . . . . . . . . . . . . . . . . . . . . . . . ix
Chapter 1: Introduction and Basic Theory 1
1.1 About this Thesis . . . . . . . . . . . . . . . . . . . . . . . . . . . . . . . . . . . . . . . . . . . . 1
1.1.1 Limitations . . . . . . . . . . . . . . . . . . . . . . . . . . . . . . . . . . . . . . . . . . . . . . . . 1
1.2 Introduction . . . . . . . . . . . . . . . . . . . . . . . . . . . . . . . . . . . . . . . . . . . . . . . . . . 2
1.3 Fuel Cell Theory . . . . . . . . . . . . . . . . . . . . . . . . . . . . . . . . . . . . . . . . . . . . 3
1.3.1 Construction and Function of the Fuel Cell Parts . . . . . . 4
1.3.2 Reasons for Degradation in Fuel Cells . . . . . . . . . . . . . . . . . . . 6
1.3.3 Studies of Protective Start-up and Shutdown Strategies 10
1.4 Methods for Analysing Fuel Cell Degradation . . . . 11
1.4.1 Polarization Curve . . . . . . . . . . . . . . . . . . . . . . . . . . . . . . . . . . . . . . . . 12
1.4.2 Cyclic Voltammetry. . . . . . . . . . . . . . . . . . . . . . . . . . . . . . . . . . . . . . . 16
1.4.3 Hydrogen Crossover Measurement . . . . . . . . . . . . . . . . . . . . . . . 18
1.4.4 Impedance Spectroscopy. . . . . . . . . . . . . . . . . . . . . . . . . . . . . . . . . . 18
, Applied Physics, Master’s Thesis v

Chapter 2: Methods 23
2.1 Chosen Tests for Reducing Fuel Cell Degradation 23
2.1.1 Start-up Strategy with Voltage Control . . . . . . . . . . . . . . . . . 24
2.1.2 Recirculation of Hydrogen Before Shutdown . . . . . . . . . . . . 25
2.2 Laboratory Equipment . . . . . . . . . . . . . . . . . . . . . . . . . . . . . . . . . . . . . 26
2.3 Performed Analysis Methods . . . . . . . . . . . . . . . . . . . . . . . . . . . . 28
Chapter 3: Results and Discussion 31
3.1 Start-up Strategy . . . . . . . . . . . . . . . . . . . . . . . . . . . . . . . . . . . . . . . . . . . 31
3.2 Shutdown Strategy . . . . . . . . . . . . . . . . . . . . . . . . . . . . . . . . . . . . . . . . . 33
3.3 Analysis of the Degradation . . . . . . . . . . . . . . . . . . . . . . . . . . . . . 34
Chapter 4: Conclusion and Future Work 43
Bibliography 45
vi , Applied Physics, Master’s Thesis
List of Figures
1.1 Cost and durability targets for automotive fuel cell systems . . . 21.2 Simple schematic of a PEM fuel cell . . . . . . . . . . . . . . . . . . . . . . . . . . . . . 41.3 Cross-section of a cathode electrode . . . . . . . . . . . . . . . . . . . . . . . . . . . . . 51.4 Electrolyte potential during reverse current conditions. . . . . . . . . 71.5 Example of a polarization curve and a Tafel plot . . . . . . . . . . . . . . . 131.6 A typical result of cyclic voltammetry for a fuel cell cathode . . 171.7 Typical hydrogen crossover current measurement. . . . . . . . . . . . . . . 191.8 Equivalent circuit and its related Nyquist plots. . . . . . . . . . . . . . . . . 21
2.1 Typical voltage and current curves for two cycles of the start-up strategy. . . . . . . . . . . . . . . . . . . . . . . . . . . . . . . . . . . . . . . . . . . . . . . . . . . . . . . . . 25
2.2 Voltage and current profiles for two cycles of the recyclingshutdown strategy . . . . . . . . . . . . . . . . . . . . . . . . . . . . . . . . . . . . . . . . . . . . . . . . . 26
2.3 Schematic of the experimental setup. . . . . . . . . . . . . . . . . . . . . . . . . . . . . 27
3.1 Measurement of OCV and performance during the start-upstrategy . . . . . . . . . . . . . . . . . . . . . . . . . . . . . . . . . . . . . . . . . . . . . . . . . . . . . . . . . . . . 32
3.2 OCV and performance during the recirculation strategy . . . . . . . 333.3 Polarization curves of initial measurements and after cycling
with each strategy . . . . . . . . . . . . . . . . . . . . . . . . . . . . . . . . . . . . . . . . . . . . . . . . . 353.4 Tafel plot for the performed measurements . . . . . . . . . . . . . . . . . . . . . 363.5 Comparison of the increase of each loss in the polarization curve 373.6 Partial pressure sweep before and after the cycling . . . . . . . . . . . . . 383.7 Impedance spectroscopy performed at low current density. . . . . 393.8 Impedance spectroscopy performed at high current density. . . . 403.9 Results of the cyclic voltammetry measurements before and
after operating strategy cycling . . . . . . . . . . . . . . . . . . . . . . . . . . . . . . . . . . 413.10 Hydrogen crossover measurements for the strategies . . . . . . . . . . . 42
, Applied Physics, Master’s Thesis vii

List of Tables
2.1 Algorithm for the start-up strategy . . . . . . . . . . . . . . . . . . . . . . . . . . . . . . 252.2 Algorithm for the recirculation shutdown strategy . . . . . . . . . . . . . 262.3 Parameters for the different analysis methods . . . . . . . . . . . . . . . . . . 30
3.1 Comparison of the degradation parameters . . . . . . . . . . . . . . . . . . . . . 42
viii , Applied Physics, Master’s Thesis

List of Abbreviations
AC Alternating Current
APU Auxiliary Power Unit
CPE Constant Phase Element
CV Cyclic Voltammetry
ECSA ElectroChemical platinum Surface Area
GDL Gas Diffusion Layer
HOR Hydrogen Oxidation Reaction
KTH Royal Institute of Technology
MEA Membrane Electrode Assembly
MPL MicroPorous Layer
MSL Macroporous Substrate Layer
OCV Open Circuit Voltage
ORR Oxygen Reduction Reaction
PEM Polymer Electrolyte Membrane
PTFE Polytetrafluoroethylene
RHE Reversible Hydrogen Electrode
, Applied Physics, Master’s Thesis ix

x , Applied Physics, Master’s Thesis

Chapter 1
Introduction and Basic Theory
1.1 About this Thesis
This project is a collaboration between PowerCell Sweden AB, ChalmersUniversity of Technology and the Royal Institute of Technology (KTH).The practical laborations on single cells were performed at KTH on fuel cellmaterials from PowerCell. The Master’s Thesis examination was performedby Chalmers.
1.1.1 Limitations
This Master’s Thesis was only focused on the Polymer Electrolyte Mem-brane (PEM) fuel cell, other types of fuel cells were not regarded. Thismeans that when fuel cells are mentioned in the following report it is thePEM fuel cell that is referred, if nothing else is specified.
There are many different reasons for degradation of fuel cells. Howeverthe tests in this thesis were only aimed to analyse the degradation inducedby start and stop events. The only part of the fuel cell that was regardedin this project was the Membrane Electrode Assembly (MEA), that is theanode, cathode and membrane. Degradation is more or less present on allparts of the fuel cell, but these were not investigated and are not discussedfurther in this report. The only performed measurements to evaluate thedegradation was in situ methods.
, Applied Physics, Master’s Thesis 1

Section 1.2. Introduction Chapter 1. Introduction and BasicTheory
1.2 Introduction
Increasing concerns about climate change and aims to develop a sustain-able society have resulted in several restrictions and regulations regardingenergy efficiency and emissions of green house gases. Fuel cells hold the po-tential to fulfill these objectives, due to their low emissions, high efficiencyand the ability to be fueled with energy produced with renewable sourcessuch as wind, solar or biomass. The fact that the fuel can be producedanywhere states a promising step toward a desired energy security in theworld. One of the areas where fuel cells are applicable is in the automotiveindustries. For lightweight vehicles, the PEM fuel cell is a promising typeof cell due to low operating temperature and short start-up time (Borupet al., 2007).
Recent development has enabled a satisfying level in power from the fuelcell, but there still remain challenges for a large scale and commercial useof fuel cells. The two main concerns are the interlinked issues of cost anddurability of the fuel cells (de Bruijn et al., 2008). Figure 1.1 shows thepresent and projected targets for the cost and durability for fuel cells in theautomotive sector, established by the U.S. Department of Energy (2009).To be able to reach these targets, new materials and operation strategieshave to be developed.
2000 2005 2010 2015$0
$100
$200
$300
Year
Co
st [
$/k
W]
FUTURE MILESTONES
$30/kW
$45/kW
$73/kW$94/kW
$110/kW
$275/kWFUTURE MILESTONES
$30/kW
$45/kW
$73/kW$94/kW
$110/kW
$275/kW
(a)
2006 2008 (Status) 2015 (Target)* 5000 hours corresponds to approximately 240,000 kilometers of driving
Ho
urs
1900
950
5000*
(b)
Figure 1.1: Targets for cost, projected to a high-volume manufacturing (a), and dura-bility under real-world conditions (b) for automotive fuel cell systems. Thedata is apprehended from U.S. Department of Energy (2009).
2 , Applied Physics, Master’s Thesis
Chapter 1. Introduction and BasicTheory
Section 1.3. Fuel Cell Theory
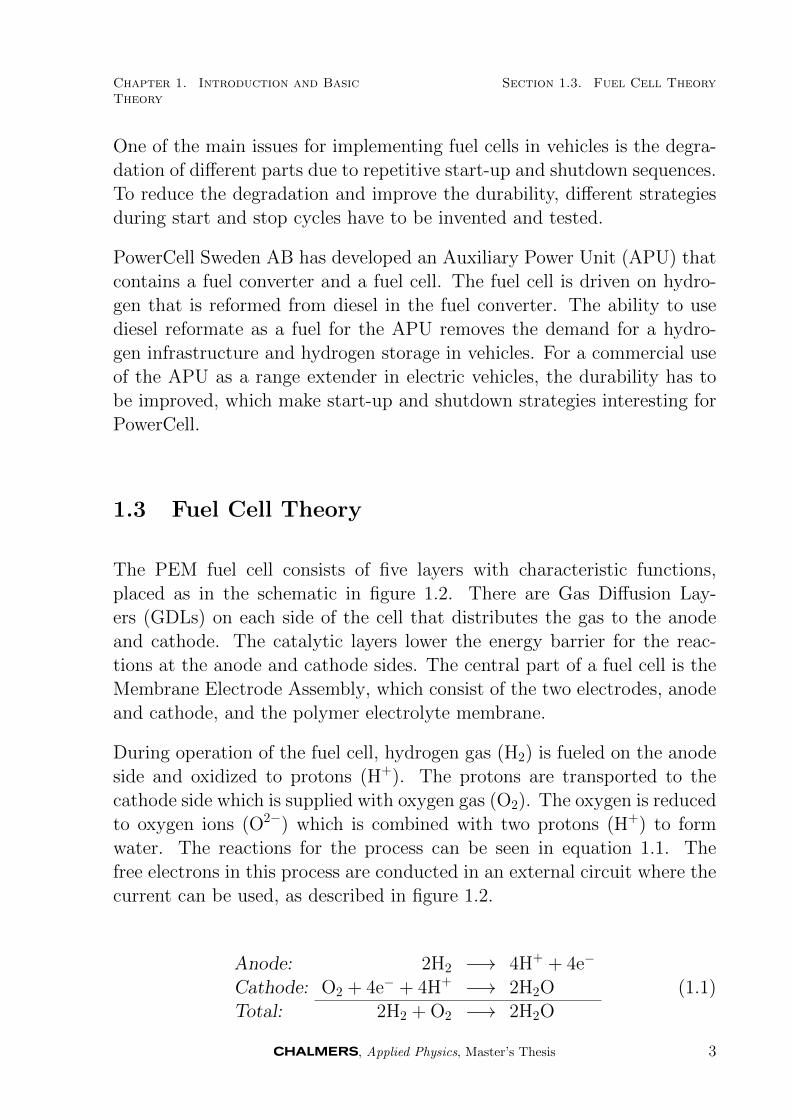
One of the main issues for implementing fuel cells in vehicles is the degra-dation of different parts due to repetitive start-up and shutdown sequences.To reduce the degradation and improve the durability, different strategiesduring start and stop cycles have to be invented and tested.
PowerCell Sweden AB has developed an Auxiliary Power Unit (APU) thatcontains a fuel converter and a fuel cell. The fuel cell is driven on hydro-gen that is reformed from diesel in the fuel converter. The ability to usediesel reformate as a fuel for the APU removes the demand for a hydro-gen infrastructure and hydrogen storage in vehicles. For a commercial useof the APU as a range extender in electric vehicles, the durability has tobe improved, which make start-up and shutdown strategies interesting forPowerCell.
1.3 Fuel Cell Theory
The PEM fuel cell consists of five layers with characteristic functions,placed as in the schematic in figure 1.2. There are Gas Diffusion Lay-ers (GDLs) on each side of the cell that distributes the gas to the anodeand cathode. The catalytic layers lower the energy barrier for the reac-tions at the anode and cathode sides. The central part of a fuel cell is theMembrane Electrode Assembly, which consist of the two electrodes, anodeand cathode, and the polymer electrolyte membrane.
During operation of the fuel cell, hydrogen gas (H2) is fueled on the anodeside and oxidized to protons (H+). The protons are transported to thecathode side which is supplied with oxygen gas (O2). The oxygen is reducedto oxygen ions (O2−) which is combined with two protons (H+) to formwater. The reactions for the process can be seen in equation 1.1. Thefree electrons in this process are conducted in an external circuit where thecurrent can be used, as described in figure 1.2.
Anode: 2H2 −→ 4H+ + 4e−
Cathode: O2 + 4e− + 4H+ −→ 2H2OTotal: 2H2 + O2 −→ 2H2O
(1.1)
, Applied Physics, Master’s Thesis 3

Section 1.3. Fuel Cell Theory Chapter 1. Introduction and BasicTheory
GD
L
An
od
e
Cath
od
e
GD
L
Mem
bra
ne
Catalytic layers
WaterExcesshydrogen
Hydrogen Oxygen
-e
Figure 1.2: Simple schematic of a PEM fuel cell fueled with hydrogen gas at the anodeand oxygen at the cathode.
Individual fuel cells are performing at approximately 0.7 V at a currentdensity of 1 A/cm2, which is not useful for most real world applications. Byconnecting several single cells in series a fuel cell stack is built. The powerin a fuel cell stack can be modified to fit any possible use, by changing thenumber of single cells in it and the active area of the fuel cell. The powerfrom a fuel cell stack with n = 100 single cells with an area of A = 100 cm2,is calculated in equation 1.2.
P = UI = n · u · A · i = 100 · 0.7 · 100 · 1 = 7 kW (1.2)
1.3.1 Construction and Function of the Fuel Cell Parts
One of the most common polymer electrolyte membranes is Nafion R©, thatconsist of a polymeric material base of carbon and fluorine atoms, calledPolytetrafluoroethylene (PTFE), and is commonly used in Teflon R©. ThePTFE is resistant to chemical attacks and it is a strong polymer, a propertyneeded to produce thin membranes. PTFE is hydrophobic, which is animportant feature to drive the produced water out from the membrane,
4 , Applied Physics, Master’s Thesis

Chapter 1. Introduction and BasicTheory
Section 1.3. Fuel Cell Theory
thus preventing flooding. A side chain with an acidic sulfonic end-group isattached to the basic PTFE. The most important feature of the sulfonicacid (HSO3) is that it is hydrophilic. This means that hydrophilic regionsare created in the otherwise hydrophobic structure of the membrane, inwhich protons are weakly bound. The result is that the protons can movequite easily in a well hydrated membrane, where the hydrophilic regionsare large (Larminie & Dicks, 2003). The electrodes are attached on eachside of the membrane, which completes the MEA.
The electrocatalytic layer is placed on the MEA or on the GDL, as shownin figure 1.3, and is often constructed of platinum (Pt) particles supportedon electron conductive carbon particles, and a proton conducting ionomer(Young et al., 2009). The catalytic platinum particles allow reactions ontheir surface, which lower the activation energy for the reactions, resultingin an increased reaction rate. Platinum is expensive and contributes to alarge extent to the high price of PEM fuel cells, which makes it desirableto use the platinum as effective as possible. This fact results in smallparticles supported in a way to maximise the active surface area of theplatinum particles (Larminie & Dicks, 2003).
Macroporous layer
Microporous layer
Catalytic layer
Cathode
150-350mm25-35mm
~10mm
Access for ¤ Electrons ¤ Protons ¤ Gas
O2
H O2
O2
-e
+H
Figure 1.3: Cross-section of a cathode electrode. Pathways for gas, protons and elec-trons are shown, as well as an illustration of the catalytic particles. Thefigure is re-drawn with inspiration from de Bruijn et al. (2008).
, Applied Physics, Master’s Thesis 5
Section 1.3. Fuel Cell Theory Chapter 1. Introduction and BasicTheory
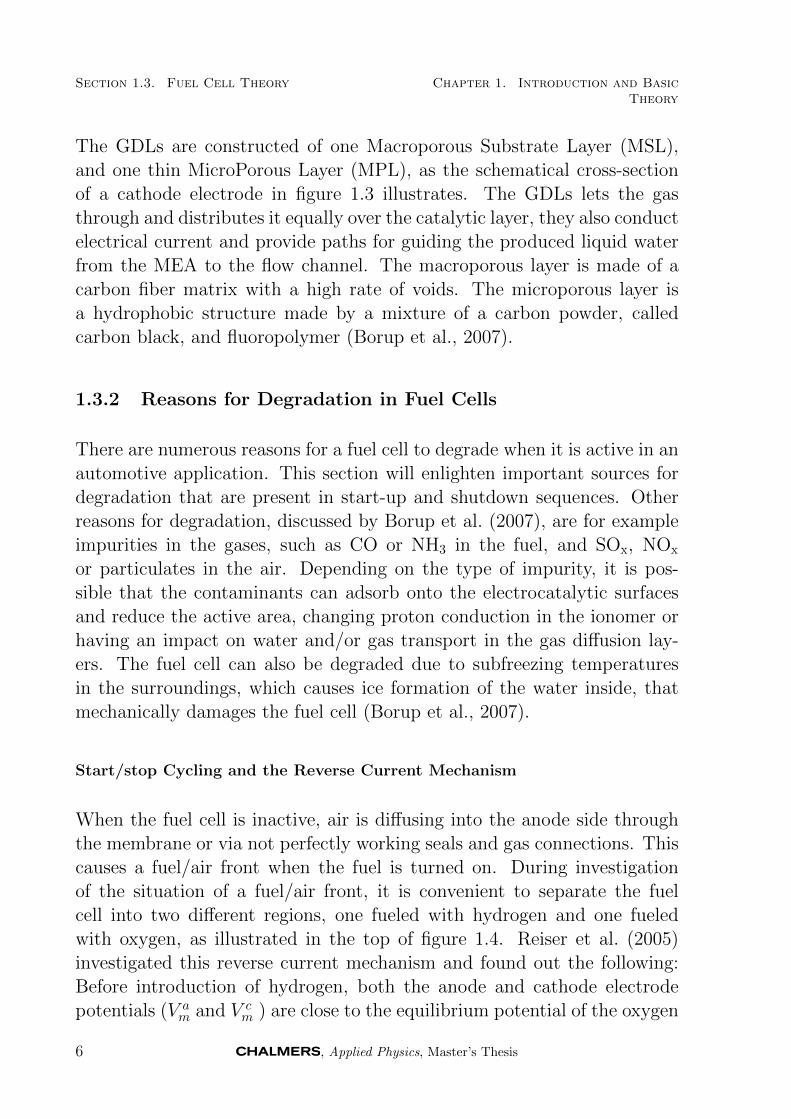
The GDLs are constructed of one Macroporous Substrate Layer (MSL),and one thin MicroPorous Layer (MPL), as the schematical cross-sectionof a cathode electrode in figure 1.3 illustrates. The GDLs lets the gasthrough and distributes it equally over the catalytic layer, they also conductelectrical current and provide paths for guiding the produced liquid waterfrom the MEA to the flow channel. The macroporous layer is made of acarbon fiber matrix with a high rate of voids. The microporous layer isa hydrophobic structure made by a mixture of a carbon powder, calledcarbon black, and fluoropolymer (Borup et al., 2007).
1.3.2 Reasons for Degradation in Fuel Cells
There are numerous reasons for a fuel cell to degrade when it is active in anautomotive application. This section will enlighten important sources fordegradation that are present in start-up and shutdown sequences. Otherreasons for degradation, discussed by Borup et al. (2007), are for exampleimpurities in the gases, such as CO or NH3 in the fuel, and SOx, NOx
or particulates in the air. Depending on the type of impurity, it is pos-sible that the contaminants can adsorb onto the electrocatalytic surfacesand reduce the active area, changing proton conduction in the ionomer orhaving an impact on water and/or gas transport in the gas diffusion lay-ers. The fuel cell can also be degraded due to subfreezing temperaturesin the surroundings, which causes ice formation of the water inside, thatmechanically damages the fuel cell (Borup et al., 2007).
Start/stop Cycling and the Reverse Current Mechanism
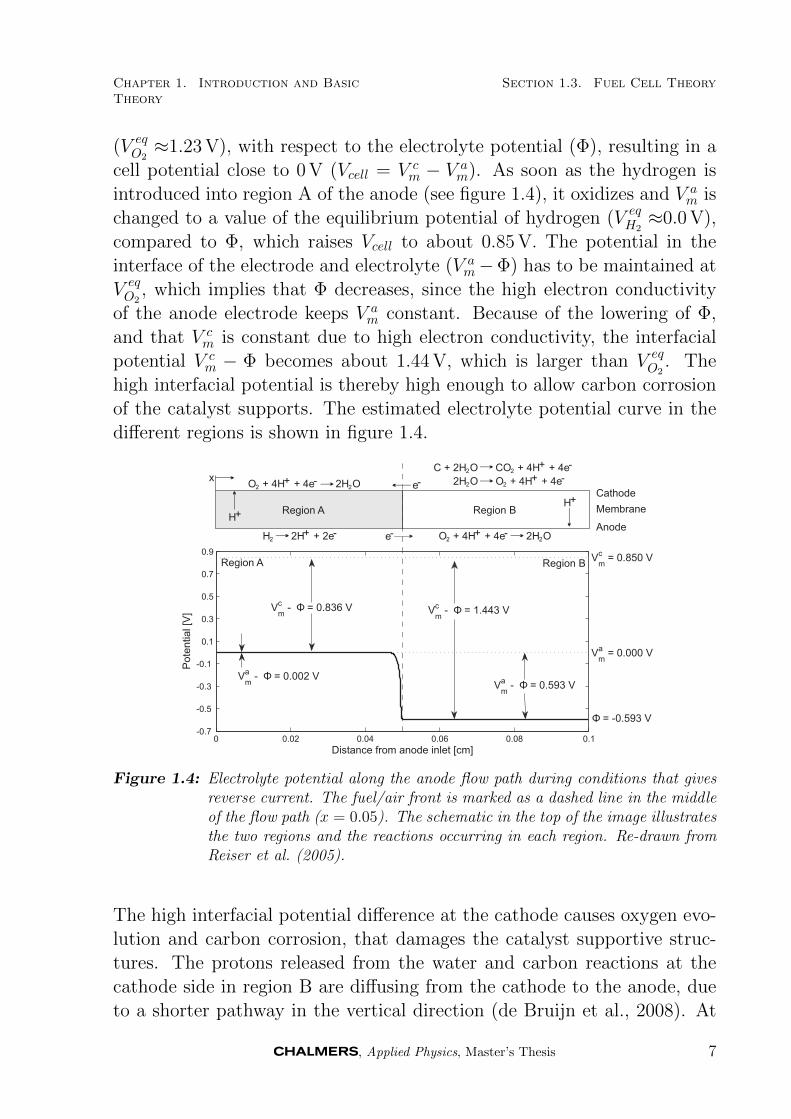
When the fuel cell is inactive, air is diffusing into the anode side throughthe membrane or via not perfectly working seals and gas connections. Thiscauses a fuel/air front when the fuel is turned on. During investigationof the situation of a fuel/air front, it is convenient to separate the fuelcell into two different regions, one fueled with hydrogen and one fueledwith oxygen, as illustrated in the top of figure 1.4. Reiser et al. (2005)investigated this reverse current mechanism and found out the following:Before introduction of hydrogen, both the anode and cathode electrodepotentials (V a
m and V cm ) are close to the equilibrium potential of the oxygen
6 , Applied Physics, Master’s Thesis
Chapter 1. Introduction and BasicTheory
Section 1.3. Fuel Cell Theory
(V eqO2≈1.23 V), with respect to the electrolyte potential (Φ), resulting in a
cell potential close to 0 V (Vcell = V cm − V a
m). As soon as the hydrogen isintroduced into region A of the anode (see figure 1.4), it oxidizes and V a
m ischanged to a value of the equilibrium potential of hydrogen (V eq
H2≈0.0 V),
compared to Φ, which raises Vcell to about 0.85 V. The potential in theinterface of the electrode and electrolyte (V a
m−Φ) has to be maintained atV eqO2
, which implies that Φ decreases, since the high electron conductivityof the anode electrode keeps V a
m constant. Because of the lowering of Φ,and that V c
m is constant due to high electron conductivity, the interfacialpotential V c
m − Φ becomes about 1.44 V, which is larger than V eqO2
. Thehigh interfacial potential is thereby high enough to allow carbon corrosionof the catalyst supports. The estimated electrolyte potential curve in thedifferent regions is shown in figure 1.4.
Region A Region B
+ -C + 2H O CO + 4H + 4e2 2
+ -2H O O + 4H + 4e2 2+ -O + 4H + 4e 2H O2 2
+ -O + 4H + 4e 2H O2 2+ -H 2H + 2e2
-e
-e
+H+H
x
Cathode
Membrane
Anode
0 0.02 0.04 0.06 0.08 0.1-0.7
-0.5
-0.3
-0.1
0.1
0.3
0.5
0.7
0.9
Pote
ntial [
V]
Distance from anode inlet [cm]
Vm
c = 0.850 V
F = -0.593 V
Vm
a = 0.000 V
Region A
Vm
c - F = 0.836 V
Vm
a - F = 0.002 V
Vm
c - F = 1.443 V
Vm
a - F = 0.593 V
Region B
Figure 1.4: Electrolyte potential along the anode flow path during conditions that givesreverse current. The fuel/air front is marked as a dashed line in the middleof the flow path (x = 0.05). The schematic in the top of the image illustratesthe two regions and the reactions occurring in each region. Re-drawn fromReiser et al. (2005).
The high interfacial potential difference at the cathode causes oxygen evo-lution and carbon corrosion, that damages the catalyst supportive struc-tures. The protons released from the water and carbon reactions at thecathode side in region B are diffusing from the cathode to the anode, dueto a shorter pathway in the vertical direction (de Bruijn et al., 2008). At
, Applied Physics, Master’s Thesis 7

Section 1.3. Fuel Cell Theory Chapter 1. Introduction and BasicTheory
the anode side the protons are consumed in the Oxygen Reduction Reac-tion (ORR), which results in a reverse current mechanism.
The phenomenon of reverse current also appears when there is fuel star-vation in some parts of the fuel cell. Fuel starvation is a problem in fuelcells stacks, due to difficulties to maintain an even gas distribution to allthe cells in the stack. Using gas mixtures, such as reformate as fuel, alsoincrease the risk for fuel starvation (Baumgartner et al., 2006). Even ifthere are shortages of hydrogen in some regions of the anode, the electrodepotential is kept constant due to the high conductivity, which can lead tohigh cell potential differences (de Bruijn et al., 2008).
Temperature and Humidity
The life time of a fuel cell is maximised if the cell can be operated atconstant temperature and with well hydrated gases. These parameterscan be controlled when the fuel cell is operated at constant intermediatecurrents. In an application with dynamic loads, however, temperatureand humidity are affected by the current taken from the fuel cell whenthe stoichiometric ratios are fixed. Operation at low currents results in arelatively wet and cold cell, while operation at higher currents increases thetemperature, resulting in a more dry cell membrane. The ionomers in themembrane swells with water uptake, which implies compressive mechanicalstresses in the membrane at high relative humidities, and tensile stressesduring drier operation respectively. The combination of loss in ductilityand the extreme stresses on the MEA can lead to a mechanical failure(Borup et al., 2007).
Except the durability issue, due to humidity and temperature, the per-formance is also affected. Nakamura et al. (2009) showed that a fuel celloperating at low humidity conditions increased the ohmic losses and themass transport losses. That the ohmic losses are reduced relates to thefact that the ionic conduction in the membrane increases with higher wa-ter content. The mass transport at the cathode side is slightly blocked bywater at high humidities, but at low humidities the oxygen transport isreduced over the catalytic layer, which increases the mass transport losses(Nakamura et al., 2009). Ohmic losses and mass transport losses will be
8 , Applied Physics, Master’s Thesis

Chapter 1. Introduction and BasicTheory
Section 1.3. Fuel Cell Theory
further explained in section 1.4.1. The humidity can also have an impacton the active area of the platinum catalysts at the cathode side. Kim et al.(2010a) showed that start/stop cycling at different relative humidities atthe cathode, and constant relative humidity at the anode, resulted in in-creased degradation at higher humidities. The reason for the increaseddegradation was shown to be linked to increased charge transfer resistance(Rct) and a loss of electrochemically active area. Kim et al. (2010b) clearlyshowed that the increased humidity allowed a higher reaction rate, thatcaused carbon corrosion and platinum agglomeration, oxidation, dissolu-tion and/or migration, which in turn implied a higher Rct and a loss ofactive area. Carbon corrosion is discussed further later in this section.
Dynamic Cell Potentials
A fuel cell during operation in an automotive application is exposed todynamic variations in cell potential, as various loads are applied. Severalproperties of the electrode materials are linked to the potential, such as thehydrophobicity of the surfaces and the oxide coverage of the carbon andthe platinum particles (Borup et al., 2007). Experimental data indicatesthat the electrochemically active area reduces rapidly, which is a result ofplatinum dissolution caused by potential cycling (Borup et al., 2007). Thiseffect has also been modeled by Darling & Meyers (2003), who found thatplatinum is stable at both high and low potentials, but that a rapid dis-solution occurs when transitioning from low to high potentials. Gasteigeret al. (2008) discuss that the potential variations are largest at the cathodeelectrode, caused by slower kinetics of the ORR, while the faster kineticsof the Hydrogen Oxidation Reaction (HOR) keeps the anode electrode po-tential almost constant. Yu et al. (2009) concluded that potential cyclingcan cause carbon corrosion and can be assigned to be about 8 % of thetotal carbon loss.
Carbon Corrosion
Carbon is oxidized, or corroded, to carbon dioxide (CO2) at relatively lowpotentials, as described in the reactions in equation 1.3 (de Bruijn et al.,2008), where VRHE denotes the potential difference versus the Reversible
, Applied Physics, Master’s Thesis 9

Section 1.3. Fuel Cell Theory Chapter 1. Introduction and BasicTheory
Hydrogen Electrode (RHE). The RHE is used as reference since it is stableat 0 V in fuel cells. The kinetics in the carbon reactions is however quiteslow, which means that the carbon is stable at normal operating conditionswith potentials between 0–1 VRHE of a PEM fuel cell (Young et al., 2009).As mentioned in previous sections, potential increase occurs during start-upor shutdown sequences, fuel starvation or reverse current situations. Theseelevated potentials can result in a cathode potential larger than 1.0 VRHE,which increases the reaction rates and causes a significant carbon corrosion(Meyers & Darling (2006); Yu et al. (2009)).
C + 2H2O −→ CO2 + 4H+ + 4e− E = 0.207 VRHE
C + 2H2O −→ COsurface + 2H+ + 2e− E > 0.3 VRHE
COsurface + H2OPt−→ CO2 + 2H+ + 2e− E = 0.8 VRHE
(1.3)
Carbon corrosion is responsible for a large part of the degradation of thefuel cell performance. As the carbon oxidizes, the support for the plat-inum particles disappear, leaving the platinum free to agglomerate, oxidizeor dissolve, which reduces the electrocatalytic active area. Yu et al. (2009)showed, during corrosion cycles, a thinning of the cathode catalytic layerfrom about 15µm to 5µm, while the membrane and anode catalytic layerthickness remained unchanged. This results in large potential losses athigher current densities. de Bruijn et al. (2008) discuss that the carboncorrosion also has an effect on the GDL and MPL of the cathode. The cor-rosion changes the porous structures and the MPL gets more hydrophilic.The degradation of the GDL affects the water and gas management at thecathode side, which increase the potential losses due to mass transport.
1.3.3 Studies of Protective Start-up and Shutdown Strategies
Until some 5–10 years ago, the most important question in the fuel celltechnology was to improve the specifications for power density (de Bruijnet al., 2008). This indicates that most of the work made to improve thedurability of fuel cells in different environments has occurred quite recently.
10 , Applied Physics, Master’s Thesis
Chapter 1. Introduction and BasicTheory
Section 1.4. Methods for AnalysingFuel Cell Degradation
Shen et al. (2009) developed a start-up strategy where the anode is purgedwith nitrogen prior an introduction of the hydrogen fuel. This strategyresulted in low potential difference between the cathode and the anode,which implies lower carbon corrosion. It was also found that if a fuel/airboundary can not be avoided, an introduction of fuel at a higher flowrate was preferable. The higher flow rate still results in a high potentialdifference, but during a shorter time, which reduces the carbon corrosion.Another tested start-up strategy is to apply a dummy load as long as thefuel fills the anode compartment (Kim et al. (2009); Perry et al. (2006);Shen et al. (2009)). The dummy load lowers the potential difference andcarbon corrosion is thereby avoided. This type of voltage control reducedthe degradation from ∼100µV/cycle to ∼4µV/cycle in a test made byPerry et al. (2006). A third strategy has been tested by Jo et al. (2010),where the hydrogen is supplied to the anode prior to the introduction ofoxygen on the cathode side. This strategy resulted in decreased power lossand a reduced electrochemically active catalyst surface area loss.
Shutdown strategies have also been developed to improve the durability offuel cells. Kim et al. (2009) tested a nitrogen purge strategy on the anode,that lowered the potential difference at shutdown and reduced degradationof the MEA. Ofstad et al. (2008) tried to purge the anode with air at theshutdown sequence and found that a higher flow rate reduced the carboncorrosion. Dummy load strategies where the remaining hydrogen is con-sumed before shutdown have been developed as well (Shen et al. (2009);Perry et al. (2006)). The dummy load reduces the cell potential which lim-its the carbon corrosion. A Master’s thesis made by Ivity (2010) showedthat an air purge shutdown strategy can be as good as a load purge. Thedegradation after 1200 cycles for these strategies was only a few µA/cm2
per cycle. This result was compared to a scenario where no strategy wasimplemented, which showed a severe degradation after only 200 cycles.
1.4 Methods for Analysing Fuel Cell Degradation
The methods used in order to analyse the degradation of a fuel cell areelectrochemical in situ methods. It is also possible to use ex situ measure-ments, such as measuring the amount of different species in the exhaust
, Applied Physics, Master’s Thesis 11
Section 1.4. Methods for AnalysingFuel Cell Degradation
Chapter 1. Introduction and BasicTheory
gas mixture to get a direct indication of carbon corrosion, or actually seethe physical degradation of the MEA or GDLs in an electron microscopytechnique. The size of the platinum particles is possible to measure withX-Ray diffraction. The electrochemical in situ measurement techniquesare however much more easy to perform and all that is needed is a poten-tiostat to control and measure the current and the potential. Furthermore,it is easy to relate the data to real fuel cell performance. This section willdescribe the electrochemical in situ measurements.
1.4.1 Polarization Curve
When using a polarization curve measurement it is possible to extract alot of information of different fuel cell phenomena. This section will firstdescribe the basics, then different degradation measures.
The characteristic appearance of a fuel cell’s polarization curve can be seenin figure 1.5(a). The polarization curve has three different regions, which isa result of four major irreversible potential losses. Two of the losses can notbe separated in the polarization curve and are combined into a total regionof activation losses. The polarization curve can be modeled with equation1.4 (Gasteiger et al., 2004), where the resulting voltage is a subtractionof each loss from the thermodynamically reversible potential (Erev). Thelosses in equation 1.4 are due to internal currents and fuel crossover (ηix),resistance in all parts of the fuel cell (iRΩ), losses for the HOR and theORR, ηHOR and ηORR respectively, and losses due to transport of gases(ηtx).
Ecell(i) = Erev(pH2, pO2
, T )− iRΩ − ηix − ηHOR(i)− ηORR(i)− ηtx(i) (1.4)
The thermodynamic reversible potential can be calculated with equation1.5, where ∆gf is the difference in Gibb’s free energy of formation per mole,that is the energy gained when two reactants form a product (Larminie &Dicks, 2003). One example is the change in energy when hydrogen andoxygen react to form water as a product. The minus sign in equation1.5 comes from the convention that when energy is gained in a reaction,
12 , Applied Physics, Master’s Thesis

Chapter 1. Introduction and BasicTheory
Section 1.4. Methods for AnalysingFuel Cell Degradation
Current density
Voltage
Erev
2
3
4
1hORR
iRW
htx
EOCV hix
hHOR
(a)
log(Current density)
Activa
tion v
oltage lo
ss
i0
DhORR
Di
(b)
Figure 1.5: (a) Example of a polarization curve for a fuel cell. The four irreversiblelosses are numbered, the dashed and dotted lines are different corrections toimprove the analysis. (b) A typical Tafel plot for a fuel cell. The dashedline is a non-linear logarithmic fit of the linear region of the measured curve.The exchange current density i0 is marked and A is the slope of the fittedline.
the Gibb’s free energy is negative (Larminie & Dicks, 2003). Gibb’s freeenergy is temperature and pressure dependent, hence also the Erev havethese dependences.
Erev = −∆gfzF
= −gproductsf − greactantsf
zF(1.5)
The constants z and F in equation 1.5 are the number of electrons releasedin the HOR and Faraday’s constant respectively. The Erev for a hydro-gen fuel cell operating at 80C, forming water in the gas phase, can becalculated as in equation 1.6.
Erev = −∆gfzF
= −−226.1 · 103
2 · 96485≈ 1.2 V (1.6)
To get a more qualitative understanding of the impact from each loss inan experiment, it is possible to measure the ohmic resistance (RΩ) at eachcurrent and receive a resistance corrected cell voltage EiR−corr = Ecell +iRΩ. A second correction of the polarization curve is to add the hydrogencrossover current to the measured current to get a corrected current density
, Applied Physics, Master’s Thesis 13
Section 1.4. Methods for AnalysingFuel Cell Degradation
Chapter 1. Introduction and BasicTheory
(ieff) as described in equation 1.7 (Gasteiger et al., 2004). One method tomeasure hydrogen crossover current is presented in section 1.4.3.
The following four characteristics can be accessed via polarization curves:
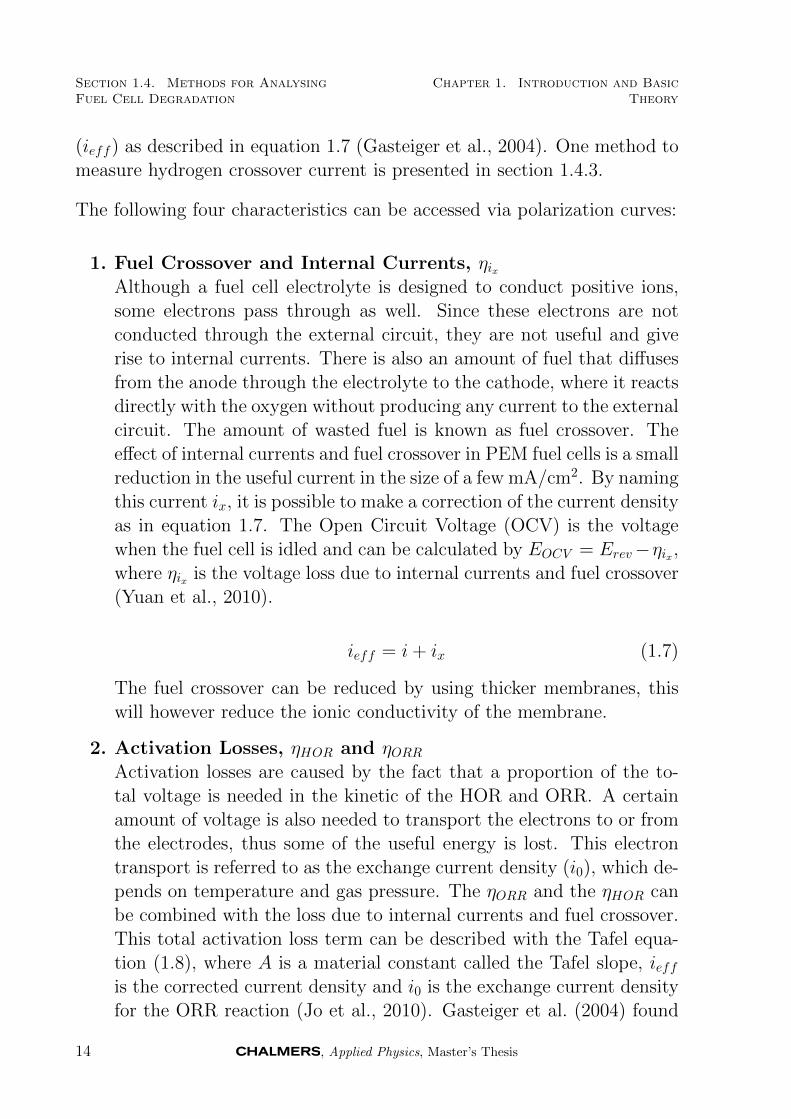
1. Fuel Crossover and Internal Currents, ηixAlthough a fuel cell electrolyte is designed to conduct positive ions,some electrons pass through as well. Since these electrons are notconducted through the external circuit, they are not useful and giverise to internal currents. There is also an amount of fuel that diffusesfrom the anode through the electrolyte to the cathode, where it reactsdirectly with the oxygen without producing any current to the externalcircuit. The amount of wasted fuel is known as fuel crossover. Theeffect of internal currents and fuel crossover in PEM fuel cells is a smallreduction in the useful current in the size of a few mA/cm2. By namingthis current ix, it is possible to make a correction of the current densityas in equation 1.7. The Open Circuit Voltage (OCV) is the voltagewhen the fuel cell is idled and can be calculated by EOCV = Erev−ηix,where ηix is the voltage loss due to internal currents and fuel crossover(Yuan et al., 2010).
ieff = i+ ix (1.7)
The fuel crossover can be reduced by using thicker membranes, thiswill however reduce the ionic conductivity of the membrane.
2. Activation Losses, ηHOR and ηORRActivation losses are caused by the fact that a proportion of the to-tal voltage is needed in the kinetic of the HOR and ORR. A certainamount of voltage is also needed to transport the electrons to or fromthe electrodes, thus some of the useful energy is lost. This electrontransport is referred to as the exchange current density (i0), which de-pends on temperature and gas pressure. The ηORR and the ηHOR canbe combined with the loss due to internal currents and fuel crossover.This total activation loss term can be described with the Tafel equa-tion (1.8), where A is a material constant called the Tafel slope, ieffis the corrected current density and i0 is the exchange current densityfor the ORR reaction (Jo et al., 2010). Gasteiger et al. (2004) found
14 , Applied Physics, Master’s Thesis
Chapter 1. Introduction and BasicTheory
Section 1.4. Methods for AnalysingFuel Cell Degradation
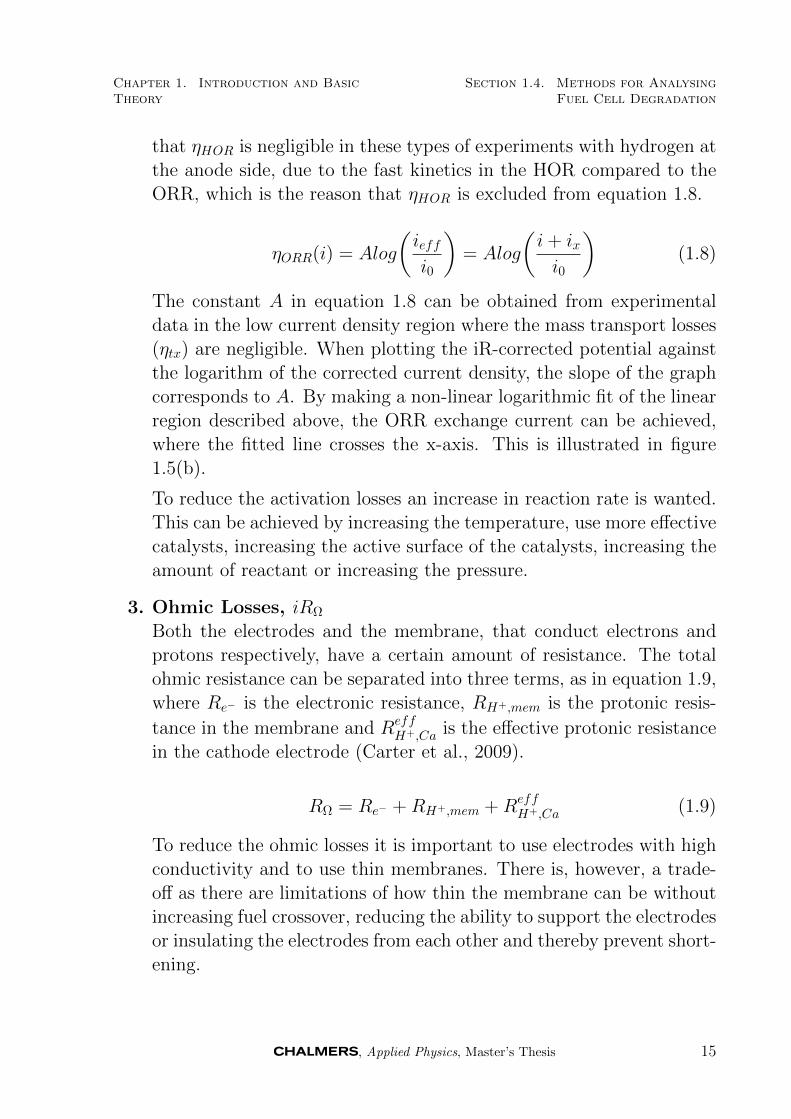
that ηHOR is negligible in these types of experiments with hydrogen atthe anode side, due to the fast kinetics in the HOR compared to theORR, which is the reason that ηHOR is excluded from equation 1.8.
ηORR(i) = Alog
(ieffi0
)= Alog
(i+ ixi0
)(1.8)
The constant A in equation 1.8 can be obtained from experimentaldata in the low current density region where the mass transport losses(ηtx) are negligible. When plotting the iR-corrected potential againstthe logarithm of the corrected current density, the slope of the graphcorresponds to A. By making a non-linear logarithmic fit of the linearregion described above, the ORR exchange current can be achieved,where the fitted line crosses the x-axis. This is illustrated in figure1.5(b).
To reduce the activation losses an increase in reaction rate is wanted.This can be achieved by increasing the temperature, use more effectivecatalysts, increasing the active surface of the catalysts, increasing theamount of reactant or increasing the pressure.
3. Ohmic Losses, iRΩ
Both the electrodes and the membrane, that conduct electrons andprotons respectively, have a certain amount of resistance. The totalohmic resistance can be separated into three terms, as in equation 1.9,where Re− is the electronic resistance, RH+,mem is the protonic resis-
tance in the membrane and ReffH+,Ca is the effective protonic resistance
in the cathode electrode (Carter et al., 2009).
RΩ = Re− +RH+,mem +ReffH+,Ca (1.9)
To reduce the ohmic losses it is important to use electrodes with highconductivity and to use thin membranes. There is, however, a trade-off as there are limitations of how thin the membrane can be withoutincreasing fuel crossover, reducing the ability to support the electrodesor insulating the electrodes from each other and thereby prevent short-ening.
, Applied Physics, Master’s Thesis 15
Section 1.4. Methods for AnalysingFuel Cell Degradation
Chapter 1. Introduction and BasicTheory
4. Mass Transport Losses, ηtxAt high current densities, the fuel and reactants are consumed fasterthan they are supplied, which can be seen as a characteristic voltagedrop in the polarization curve. This effect can be expressed mathemat-ically by describing the pressure drops at different current densities,but there are many problems when using this model, for example if airis used as oxidant instead of pure oxygen (Larminie & Dicks, 2003).The mass transport losses are also increased if the charge transferresistance (Rct) is enlarged. The Rct will be explained in section 1.4.4.
The mass transport losses are certainly important when mixed gasesare used as fuel and oxidant, instead of pure gases, for example re-former gas instead of H2 and air instead of O2. To reduce the lossesdue to mass transport, it is important to keep the area around theelectrodes clean from contaminants that will block the pathways. InPEM fuel cells it is thus important to have an effective transport ofthe produced water away from the cathode electrode.
A simple way to determine the amount of mass transport degradationat the cathode side, is by changing the partial pressure of oxygen whenthe fuel cell is under a constant load. This will give a faster reductionof potential as the amount of oxygen gas at the cathode side reduces.This potential loss is a result of more occupied pathways for the O2
molecules to the catalytic layer, when other gas molecules are blockingthe way.
1.4.2 Cyclic Voltammetry
Cyclic Voltammetry (CV) is a method to determine the ElectroChemicalplatinum Surface Area (ECSA) in fuel cells. Having hydrogen at the anodeside and nitrogen at the cathode side and sweeping the potential, will resultin a curve as in figure 1.6. In the potential sweep the anode can be usedas reference electrode, since the electrode potential is close to zero due tothe fast kinetics small currents of the HOR at the anode side (Marie et al.,2009).
The different numbers in figure 1.6 indicate different actions at the catalystparticles, which can be described as follows:
16 , Applied Physics, Master’s Thesis
Chapter 1. Introduction and BasicTheory
Section 1.4. Methods for AnalysingFuel Cell Degradation
0 0.2 0.4 0.6 0.8 1 1.2-60
-50
-40
-30
-20
-10
0
10
20
30
40
Cu
rre
nt
[mA
/cm
2]
Potential [VRHE
]
1
2
3
4
5
2idl
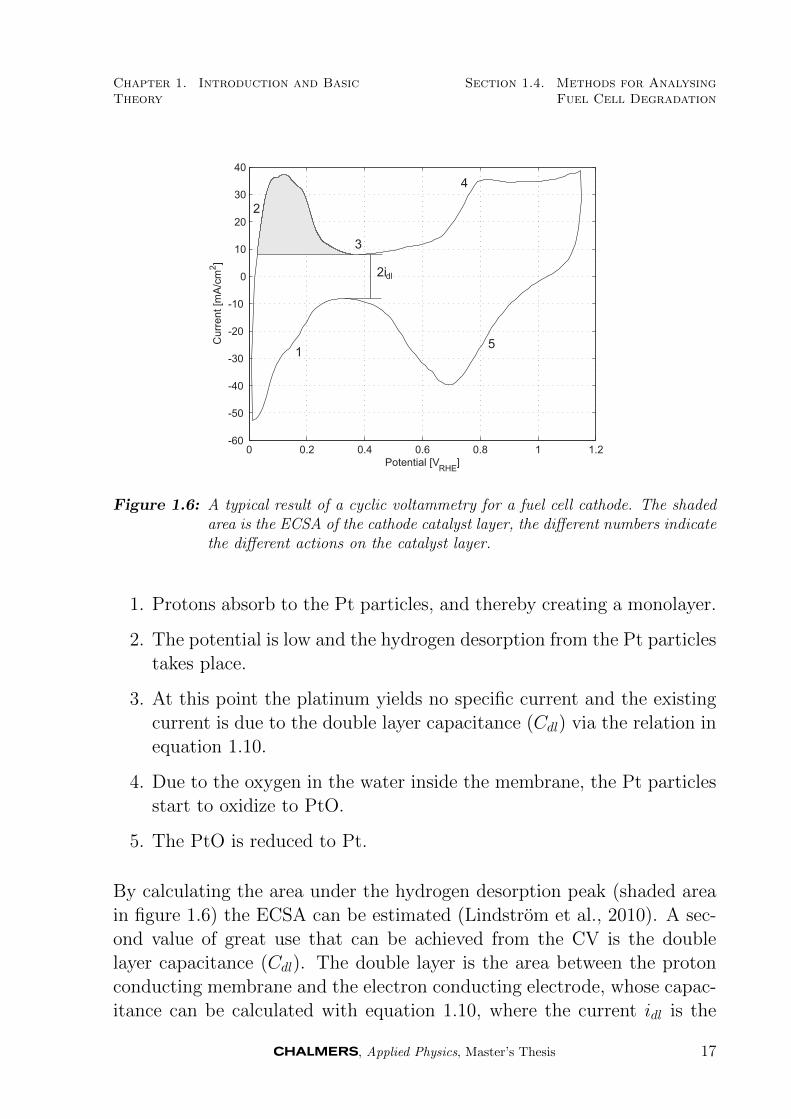
Figure 1.6: A typical result of a cyclic voltammetry for a fuel cell cathode. The shadedarea is the ECSA of the cathode catalyst layer, the different numbers indicatethe different actions on the catalyst layer.
1. Protons absorb to the Pt particles, and thereby creating a monolayer.
2. The potential is low and the hydrogen desorption from the Pt particlestakes place.
3. At this point the platinum yields no specific current and the existingcurrent is due to the double layer capacitance (Cdl) via the relation inequation 1.10.
4. Due to the oxygen in the water inside the membrane, the Pt particlesstart to oxidize to PtO.
5. The PtO is reduced to Pt.
By calculating the area under the hydrogen desorption peak (shaded areain figure 1.6) the ECSA can be estimated (Lindstrom et al., 2010). A sec-ond value of great use that can be achieved from the CV is the doublelayer capacitance (Cdl). The double layer is the area between the protonconducting membrane and the electron conducting electrode, whose capac-itance can be calculated with equation 1.10, where the current idl is the
, Applied Physics, Master’s Thesis 17
Section 1.4. Methods for AnalysingFuel Cell Degradation
Chapter 1. Introduction and BasicTheory
double layer current marked in figure 1.6 and dU/dt is the applied sweeprate during the CV (Marie et al., 2009).
idl = CdldU
dt(1.10)
1.4.3 Hydrogen Crossover Measurement
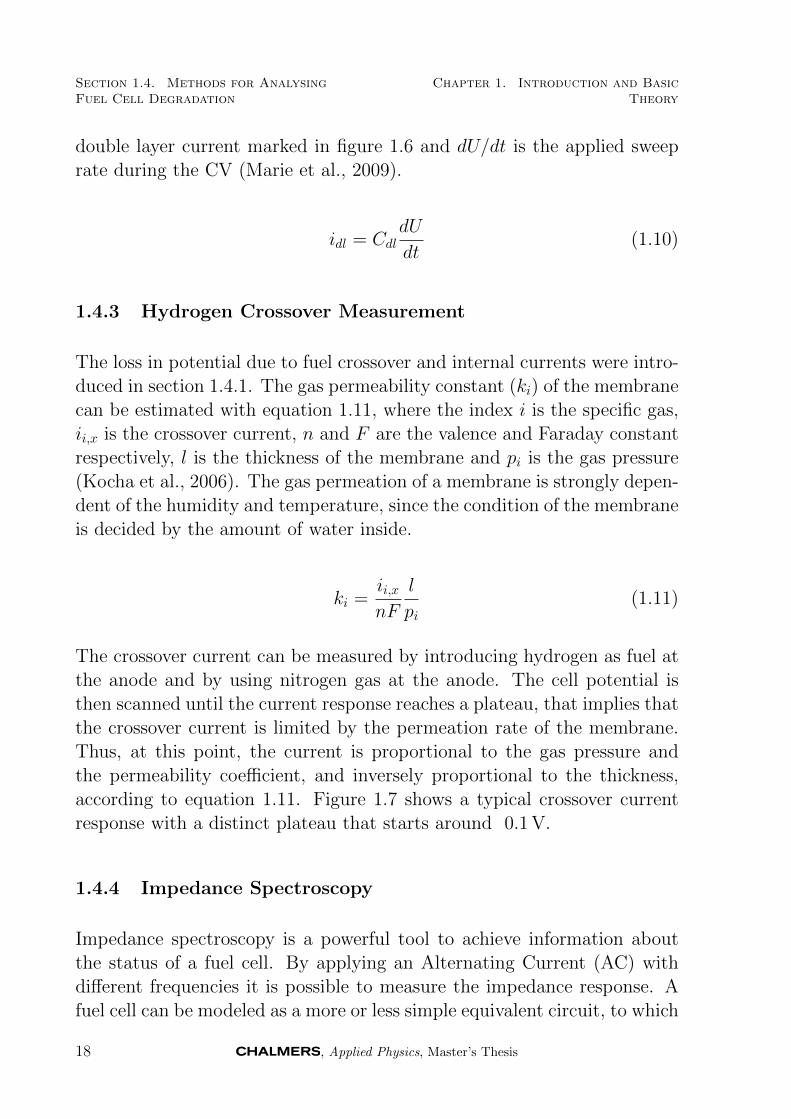
The loss in potential due to fuel crossover and internal currents were intro-duced in section 1.4.1. The gas permeability constant (ki) of the membranecan be estimated with equation 1.11, where the index i is the specific gas,ii,x is the crossover current, n and F are the valence and Faraday constantrespectively, l is the thickness of the membrane and pi is the gas pressure(Kocha et al., 2006). The gas permeation of a membrane is strongly depen-dent of the humidity and temperature, since the condition of the membraneis decided by the amount of water inside.
ki =ii,xnF
l
pi(1.11)
The crossover current can be measured by introducing hydrogen as fuel atthe anode and by using nitrogen gas at the anode. The cell potential isthen scanned until the current response reaches a plateau, that implies thatthe crossover current is limited by the permeation rate of the membrane.Thus, at this point, the current is proportional to the gas pressure andthe permeability coefficient, and inversely proportional to the thickness,according to equation 1.11. Figure 1.7 shows a typical crossover currentresponse with a distinct plateau that starts around 0.1 V.
1.4.4 Impedance Spectroscopy
Impedance spectroscopy is a powerful tool to achieve information aboutthe status of a fuel cell. By applying an Alternating Current (AC) withdifferent frequencies it is possible to measure the impedance response. Afuel cell can be modeled as a more or less simple equivalent circuit, to which
18 , Applied Physics, Master’s Thesis

Chapter 1. Introduction and BasicTheory
Section 1.4. Methods for AnalysingFuel Cell Degradation
0 0.1 0.2 0.3 0.4 0.5 0.6 0.70
0.2
0.4
0.6
0.8
1
1.2
1.4
1.6
Voltage [V]
Cu
rre
nt
[mA
/cm
2]
Figure 1.7: A typical hydrogen crossover current response. The current density startsto reach a plateau value around 0.1 V.
the measured data can be fitted. The most commonly used equivalentcircuit is a resistance connected in series with a Constant Phase Element(CPE) in parallel with another resistance, as illustrated in figure 1.8(a)(Yuan et al., 2010). This circuit is a model of the membrane and thecathode, the anode can be modeled in a similar way, but the influence fromthe anode can, according to Yuan et al. (2010), be neglected due to the fastkinetics of the HOR. The impedance of a CPE is expressed in equation1.13, where q is a constant of numerical values, the exponent n ∈ [−1, 1]describes the phase shift, ω is the frequency and j the complex number1
(j2 = −1). If n = −1, 0, 1 the CPE is a pure inductance, resistance or acapacitance respectively, all other values in between are distortions of one ofthese elements. Figure 1.8(c) illustrates the impact on the impedance curvefor different values of n. Equation 1.12 shows the impedance expressionfor a resistance and equations 1.14 and 1.15 show the sum of N impedanceelements connected in series, or in parallel, respectively. The expression ofthe total impedance of the equivalent circuit in figure 1.8(a) is shown inequation 1.16.
1j is chosen to represent the complex number instead of i, to avoid confusion with the current density.
, Applied Physics, Master’s Thesis 19
Section 1.4. Methods for AnalysingFuel Cell Degradation
Chapter 1. Introduction and BasicTheory
ZR = R (1.12)
ZCPE = q−1(jω)−n (1.13)
ZTotSeries = Z1 + Z2 + ...+ ZN (1.14)
(ZTotParallel)
−1 = Z−11 + Z−1
2 + ...+ Z−1N (1.15)
Z(ω) = Rmem + [R−1ct + qωn(cos(
π
2n) + jsin(
π
2n))]−1 (1.16)
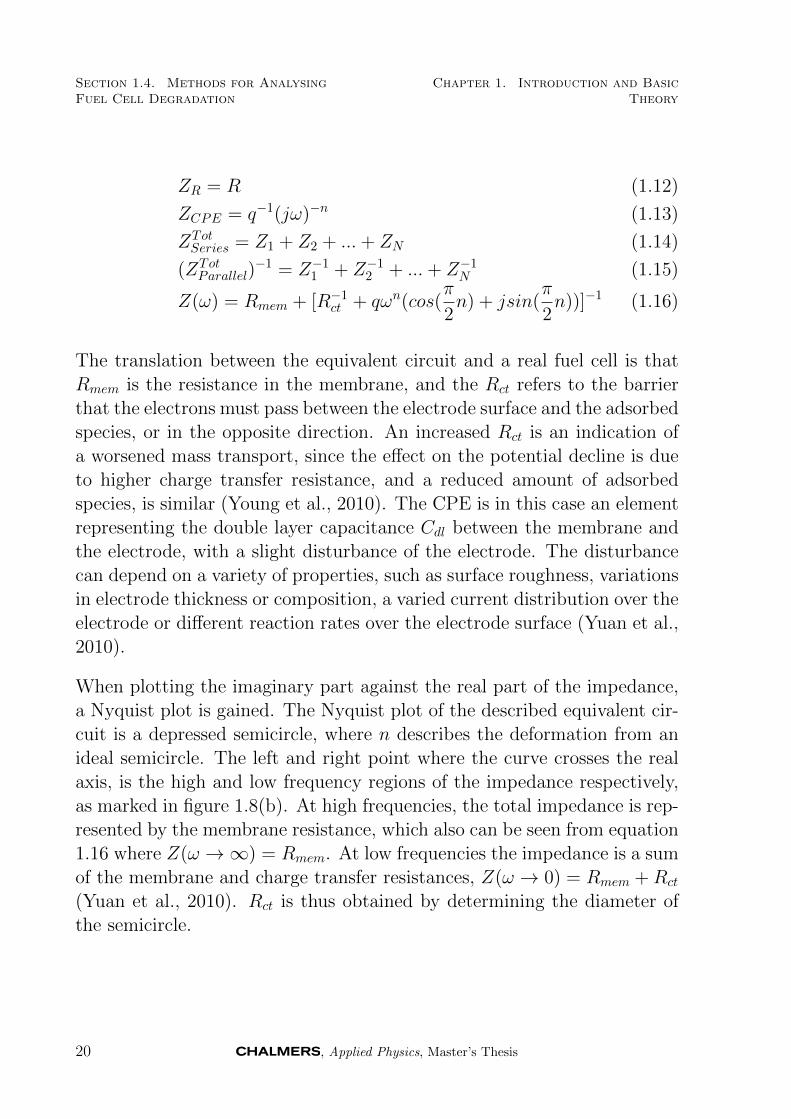
The translation between the equivalent circuit and a real fuel cell is thatRmem is the resistance in the membrane, and the Rct refers to the barrierthat the electrons must pass between the electrode surface and the adsorbedspecies, or in the opposite direction. An increased Rct is an indication ofa worsened mass transport, since the effect on the potential decline is dueto higher charge transfer resistance, and a reduced amount of adsorbedspecies, is similar (Young et al., 2010). The CPE is in this case an elementrepresenting the double layer capacitance Cdl between the membrane andthe electrode, with a slight disturbance of the electrode. The disturbancecan depend on a variety of properties, such as surface roughness, variationsin electrode thickness or composition, a varied current distribution over theelectrode or different reaction rates over the electrode surface (Yuan et al.,2010).
When plotting the imaginary part against the real part of the impedance,a Nyquist plot is gained. The Nyquist plot of the described equivalent cir-cuit is a depressed semicircle, where n describes the deformation from anideal semicircle. The left and right point where the curve crosses the realaxis, is the high and low frequency regions of the impedance respectively,as marked in figure 1.8(b). At high frequencies, the total impedance is rep-resented by the membrane resistance, which also can be seen from equation1.16 where Z(ω →∞) = Rmem. At low frequencies the impedance is a sumof the membrane and charge transfer resistances, Z(ω → 0) = Rmem +Rct
(Yuan et al., 2010). Rct is thus obtained by determining the diameter ofthe semicircle.
20 , Applied Physics, Master’s Thesis

Chapter 1. Introduction and BasicTheory
Section 1.4. Methods for AnalysingFuel Cell Degradation
Rmem
CPE
Rct
(a)
0 0.5 1 1.5 2 2.5 3 3.5 4 4.5 50
0.5
1
1.5
2
Z´ [? cm2]
-Z´´
[?
cm
2]
Rct
=1
Rct
=2
Rct
=3
Rmem Rmem+Rct
w
0
w
(b)
0 0.5 1 1.5 2 2.5 3 3.5 4 4.5 50
0.5
1
1.5
2
Z´ [? cm2]
-Z´´
[?
cm
2]
n=0.8n=0.9n=1
(c)
Figure 1.8: (a) An equivalent circuit of a fuel cell membrane and cathode. The circuitincludes a membrane resistance Rmem, a charge transfer resistance Rct anda CPE representing the double layer capacitance. (b) A Nyquist plot fordifferent Rct. The other parameters are q = 0.01 Ω−1s−1, n = 1 and Rmem =1 Ω as marked in the image. (c) A Nyquist plot illustrating the function ofthe constant n, where Rct = 3 Ω, Rmem = 1 Ω and q = 0.01 Ω−1s−n.
, Applied Physics, Master’s Thesis 21

Section 1.4. Methods for AnalysingFuel Cell Degradation
Chapter 1. Introduction and BasicTheory
22 , Applied Physics, Master’s Thesis
Chapter 2
Methods
The developed strategies and algorithms for analysing and minimising thefuel cell degradation are presented in this chapter. Experimental setupsand equipment are also discussed.
2.1 Chosen Tests for Reducing Fuel Cell Degradation
A PEM fuel cell used in an automotive application is estimated to undergoover 30000 start/stop cycles during its lifetime (Kim et al., 2009). How-ever, when different strategies to mitigate degradation due to start-up andshutdown are tested, less cycles are needed. For the strategies presentedbelow, 1100 cycles were chosen to be enough to be able to evaluate thedegradation.
The gas stoichiometries were chosen to prevent hydrogen and/or oxygenstarvation when operating at 1 A/cm2, which implies stoichiometry 2 atthe cathode and 1.2 at the anode. The gas flows were then calculated viaFaraday’s law and the ideal gas law, as shown in equation 2.1, where Vgas isthe mass flow, I is the current where the chosen stoichiometry λgas is valid,R and T is the gas constant and temperature respectively. The remainingconstants are the gas pressure Pgas, the Faraday constant F , the valenceof the atoms zgas and Cgas, which is the percentage of hydrogen or oxygenin the gas mixture introduced into the anode or cathode, respectively.
, Applied Physics, Master’s Thesis 23

Section 2.1. Chosen Tests forReducing Fuel Cell Degradation
Chapter 2. Methods
ngas = ItF ·zgas
Vgas =ngasRTPgas
Vgas =Vgast
=⇒ Vgas = IRTFzgasPgas
· λgasCgas
(2.1)
The fuel cell test stand used for the operation was designed at KTH whichgave a circular single cell, with an area of 7 cm2. The MEA was pressurisedwith 3 bar and the cell temperature was kept at 70 C. The relative humidityof the gases was controlled to 80 %. The reformate composition was 45 %H2, 32 % N2 and 23 % CO2.
2.1.1 Start-up Strategy with Voltage Control
This strategy uses the fact that the fuel cell is driven by reformate. Byconsuming the hydrogen as it enters the fuel cell, the remaining gases in thereformate pushes the oxygen out from the anode, minimising the fuel/airboundary. To consume the hydrogen, a lower reformate flow was appliedin the start-up sequence at the same time as the potential was controlledvia the potentiostat. At first the potential was kept stable at 0 V until thefuel enters the anode, after that the potential was increased in steps of 0.2,0.4, 0.6 and 0.8 V and kept for 10 s each, after the steps the potential wasreleased to OCV. This strategy was chosen after testing different flow ratesand different times at each potential step, while the cell temperature andcurrent were measured to make sure that the hydrogen was consumed. Anincreased cell temperature could result in pin-holes in the membrane, dueto local fuel starvation. The chosen parameters showed a low temperatureincrease, the hydrogen was consumed and the flow was relatively high tominimise the time of a fuel/air boundary. The shutdown of the fuel cellwas an air purge of the anode. The algorithm is shown in table 2.1 andthe corresponding current and voltage curves for two cycles are presentedin figure 2.1.
24 , Applied Physics, Master’s Thesis
Chapter 2. Methods Section 2.1. Chosen Tests forReducing Fuel Cell Degradation
Table 2.1: Algorithm for the start-up strategy.
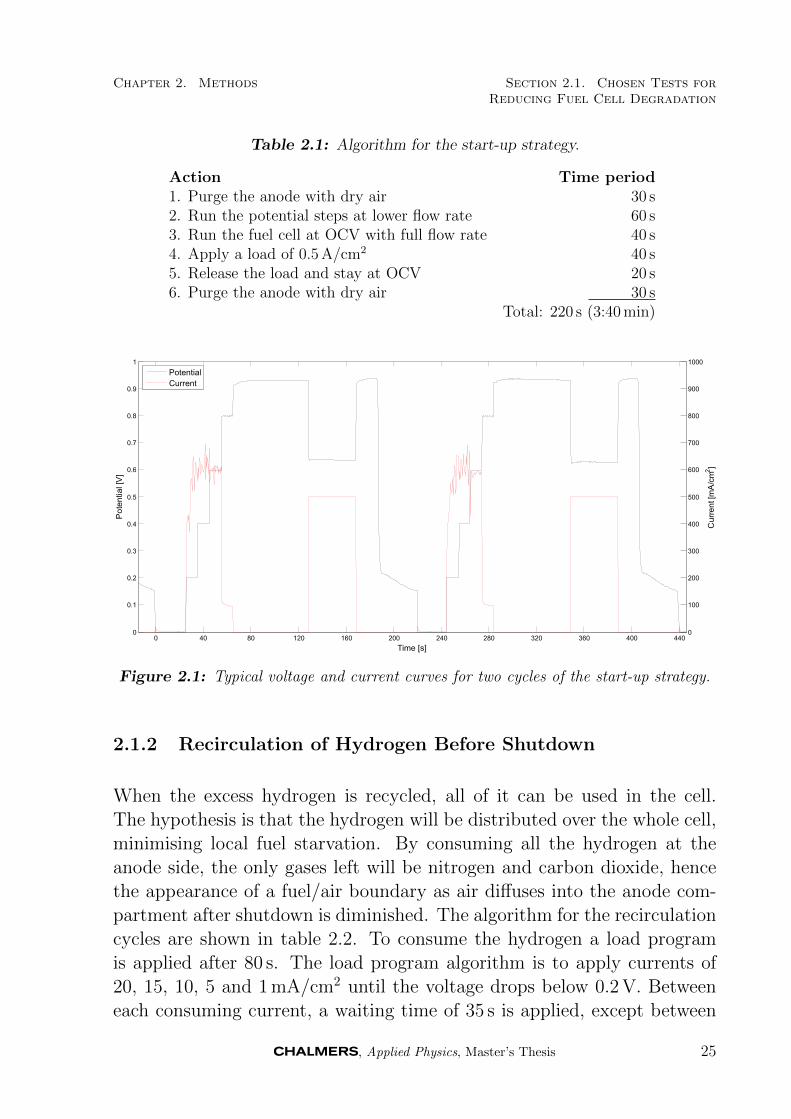
Action Time period1. Purge the anode with dry air 30 s2. Run the potential steps at lower flow rate 60 s3. Run the fuel cell at OCV with full flow rate 40 s4. Apply a load of 0.5 A/cm2 40 s5. Release the load and stay at OCV 20 s6. Purge the anode with dry air 30 s
Total: 220 s (3:40 min)
0 40 80 120 160 200 240 280 320 360 400 4400
0.1
0.2
0.3
0.4
0.5
0.6
0.7
0.8
0.9
1
Po
ten
tia
l[V
]
Time [s]
0
100
200
300
400
500
600
700
800
900
1000
Cu
rre
nt[m
A/c
m2]
Potential
Current
Figure 2.1: Typical voltage and current curves for two cycles of the start-up strategy.
2.1.2 Recirculation of Hydrogen Before Shutdown
When the excess hydrogen is recycled, all of it can be used in the cell.The hypothesis is that the hydrogen will be distributed over the whole cell,minimising local fuel starvation. By consuming all the hydrogen at theanode side, the only gases left will be nitrogen and carbon dioxide, hencethe appearance of a fuel/air boundary as air diffuses into the anode com-partment after shutdown is diminished. The algorithm for the recirculationcycles are shown in table 2.2. To consume the hydrogen a load programis applied after 80 s. The load program algorithm is to apply currents of20, 15, 10, 5 and 1 mA/cm2 until the voltage drops below 0.2 V. Betweeneach consuming current, a waiting time of 35 s is applied, except between
, Applied Physics, Master’s Thesis 25
Section 2.2. Laboratory Equipment Chapter 2. Methods
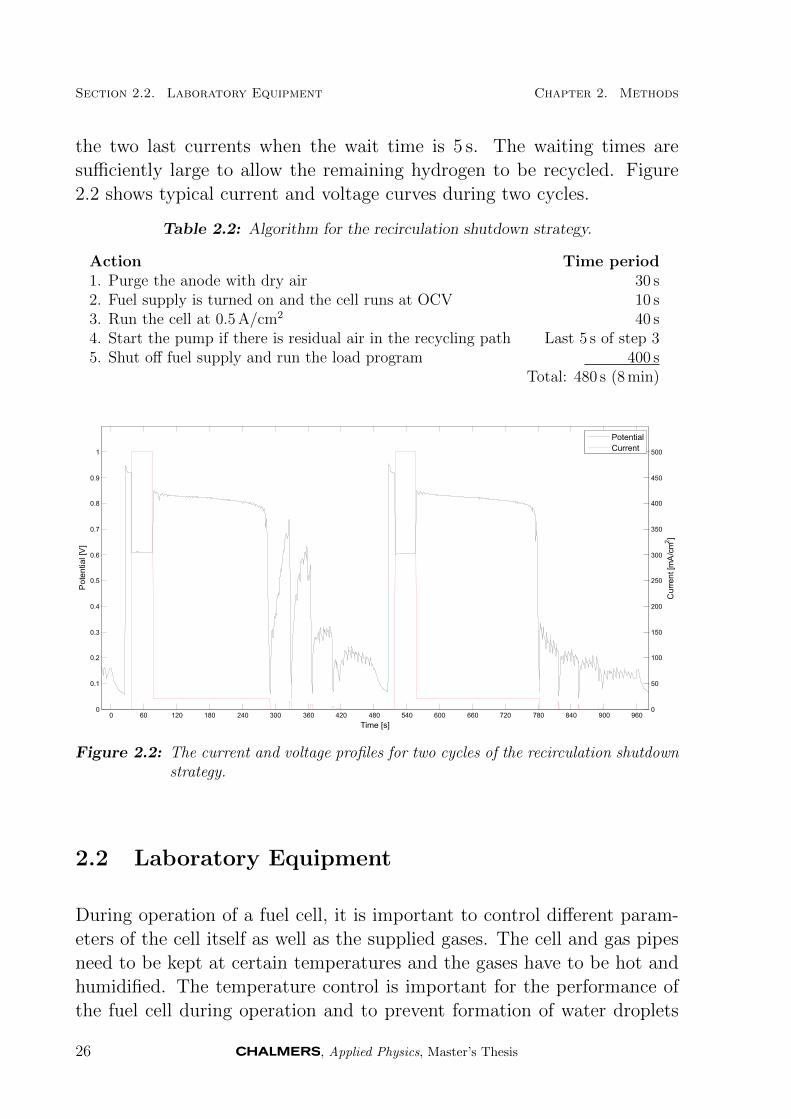
the two last currents when the wait time is 5 s. The waiting times aresufficiently large to allow the remaining hydrogen to be recycled. Figure2.2 shows typical current and voltage curves during two cycles.
Table 2.2: Algorithm for the recirculation shutdown strategy.
Action Time period1. Purge the anode with dry air 30 s2. Fuel supply is turned on and the cell runs at OCV 10 s3. Run the cell at 0.5 A/cm2 40 s4. Start the pump if there is residual air in the recycling path Last 5 s of step 35. Shut off fuel supply and run the load program 400 s
Total: 480 s (8 min)
0 60 120 180 240 300 360 420 480 540 600 660 720 780 840 900 9600
0.1
0.2
0.3
0.4
0.5
0.6
0.7
0.8
0.9
1
Po
ten
tia
l[V
]
Time [s]
0
50
100
150
200
250
300
350
400
450
500
Cu
rre
nt[m
A/c
m2]
Potential
Current
Figure 2.2: The current and voltage profiles for two cycles of the recirculation shutdownstrategy.
2.2 Laboratory Equipment
During operation of a fuel cell, it is important to control different param-eters of the cell itself as well as the supplied gases. The cell and gas pipesneed to be kept at certain temperatures and the gases have to be hot andhumidified. The temperature control is important for the performance ofthe fuel cell during operation and to prevent formation of water droplets
26 , Applied Physics, Master’s Thesis

Chapter 2. Methods Section 2.2. Laboratory Equipment
in the gas pipes. During the test, the pipes and the cell compartmentwere heated and the gas and cell temperatures were measured by K-typethermocouples, the temperature control was performed by an Eurothermthermostat. The anode and cathode gases were humidified with bubblehumidifiers filled with milli-Q water, which is purified and deionised water.
Figure 2.3: Schematic of the experimental setup. The dashed lines represent the electri-cal wires, and the solid lines illustrates the gas pipes.
The gas flows were controlled by solenoid flow meters which were controlledindividually via LabVIEW. The same LabVIEW instrument also controlledtwo solenoid valves and a diaphragm pump, as seen in the schematic infigure 2.3. The signals from LabVIEW to the flow meters, valves and thepump were actuated by two NI USB-6008 DAQs. The solenoid valve placedat the anode inlet prevented leakage of hydrogen from the humidifier andpipes into the fuel cell during purge or recirculation. The solenoid valve atthe anode outlet prevented air from diffusing into the anode via the exhaustpipe during recirculation. Two 1-way valves were used to prevent a backflow of gas into the pump, and the air flow meter respectively. The volt-age and current operations were performed with an Autolab potentiostatconnected to a LabVIEW instrument designed to collect measured dataand to run a pre-designed procedure, where the different current and/orvoltage control algorithms were programmed. The cyclic voltammetry,impedance spectroscopy, hydrogen crossover and polarization curve mea-surements were performed with a Zahner IM6 potentiostat.
, Applied Physics, Master’s Thesis 27
Section 2.3. Performed AnalysisMethods
Chapter 2. Methods
2.3 Performed Analysis Methods
To measure the performance loss during the cycling, a load of 0.5 A/cm2
was applied for 40 s in each cycle, and the potential during this load wasapprehended. All the in situ measurement methods described below wereperformed before and after the start/stop cycles, in order to analyse theimpact of the strategy on the fuel cell. A list of the used parameters in thedifferent methods are presented in table 2.3. The anode was used as thereference electrode in all of the performed measurements.
Cyclic Voltammetry
Before the cyclic voltammetry was performed, both the anode and cathodewas purged with nitrogen, to get rid of residues of oxygen and hydrogen.Then a gas mixture of 5 % H2 and 95 % Argon (Ar) was fueled into theanode, while the cathode was supplied with pure nitrogen. The voltagesweep rate was set to 100 mV/s in the potential range 0.50–1.15 V.
Hydrogen Crossover Measurement
During the measurement of hydrogen crossover, pure hydrogen was sup-plied to the anode and the cathode was supplied with nitrogen. The testwas performed by a linear voltage sweep as described in section 1.4.3, from110 mV to 700 mV. The current was measured during the sweep, and thecrossover current was calculated as a mean of all the measured currentswhen the potential was higher than 300 mV.
Polarization Curves and Impedance Spectroscopy
The polarization curves were performed in a steady state manner, whereeach current was drawn in about 20 minutes, which was the time it took forthe potential to stabilise, and the impedance measurement to be performedat the specified current. A cut-off limit of 0.3 V was introduced to avoiddamaging the fuel cell during the measurement. The polarization curvesand the impedance spectroscopy were made once for each of the different
28 , Applied Physics, Master’s Thesis

Chapter 2. Methods Section 2.3. Performed AnalysisMethods
fuel/oxidant mixtures H2/O2, H2/Air and Reformate/Air respectively. Thedrawn current densities are presented in table 2.3. The flow rate on thecathode side was chosen to be kept constant at 270 ml/min, which impliesthat the stoichiometry varied between the different amounts of oxygen inthe gas mixture. The decision to keep the flow constant was based on thatthe amount of water should be constant. A changing flow rate would effectboth the infusion and outflow of water. The constant parameter on the an-ode was the stoichiometry, while the flow changed between using hydrogenor reformate as fuel. The stoichiometry on the anode was chosen to be 1.2to avoid fuel shortages to be a limiting factor. The water content on theanode is not as important as on the cathode, making it more important tokeep the stoichiometry constant at the anode side.
Partial Pressure Sweep
This method was performed as a steady state method, and not as a partialpressure sweep, at the cathode. The different partial pressures of O2 and N2
were kept constant for about 20 minutes to allow the potential to stabilise,and to perform an impedance measurement at each partial pressure. Thecurrent was kept at 0.5 A/cm2 and hydrogen was fueled into the anodeside during the whole sweep. The flow rate on the cathode was set to270 ml/min and was kept constant, while the stoichiometry changed withthe partial pressure, since the ratio of O2 is reduced. The reason for havinga constant flow is to keep the amount of water constant on the cathode.The flow rate at the anode was 62.8 ml/min, which implies a stoichiometryof 1.2 at the anode.
, Applied Physics, Master’s Thesis 29
Section 2.3. Performed AnalysisMethods
Chapter 2. Methods
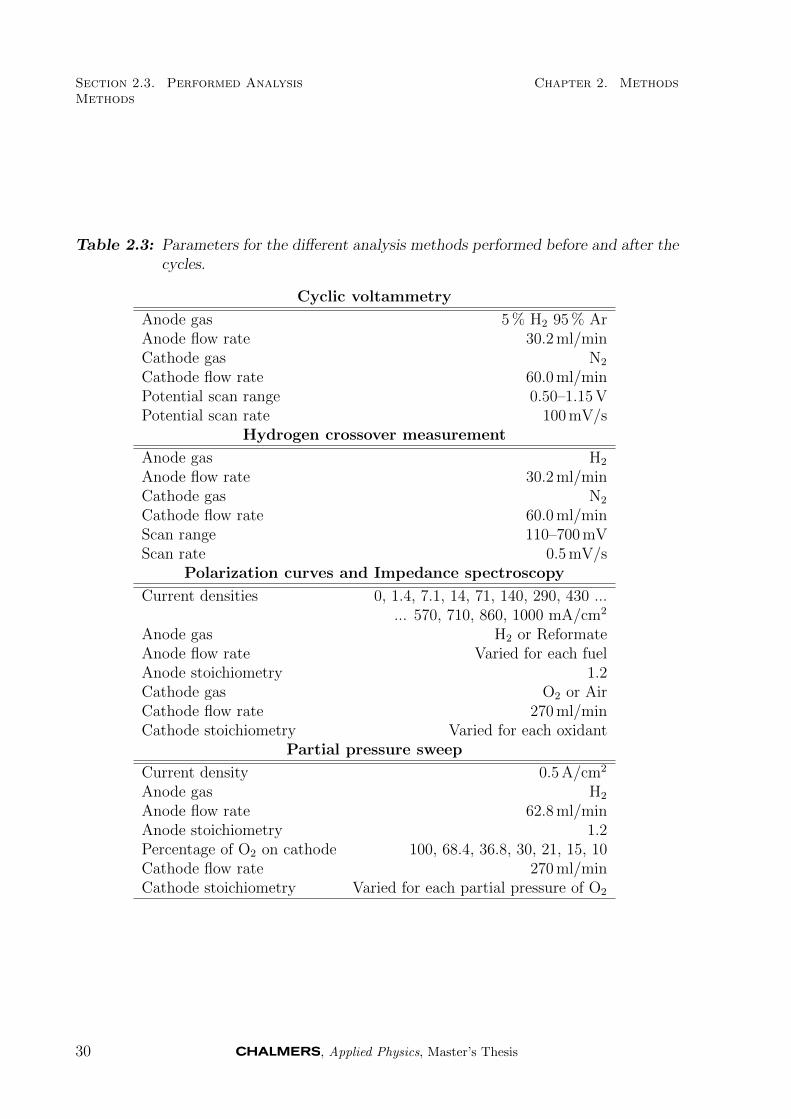
Table 2.3: Parameters for the different analysis methods performed before and after thecycles.
Cyclic voltammetry
Anode gas 5 % H2 95 % ArAnode flow rate 30.2 ml/minCathode gas N2
Cathode flow rate 60.0 ml/minPotential scan range 0.50–1.15 VPotential scan rate 100 mV/s
Hydrogen crossover measurement
Anode gas H2
Anode flow rate 30.2 ml/minCathode gas N2
Cathode flow rate 60.0 ml/minScan range 110–700 mVScan rate 0.5 mV/s
Polarization curves and Impedance spectroscopy
Current densities 0, 1.4, 7.1, 14, 71, 140, 290, 430 ...... 570, 710, 860, 1000 mA/cm2
Anode gas H2 or ReformateAnode flow rate Varied for each fuelAnode stoichiometry 1.2Cathode gas O2 or AirCathode flow rate 270 ml/minCathode stoichiometry Varied for each oxidant
Partial pressure sweep
Current density 0.5 A/cm2
Anode gas H2
Anode flow rate 62.8 ml/minAnode stoichiometry 1.2Percentage of O2 on cathode 100, 68.4, 36.8, 30, 21, 15, 10Cathode flow rate 270 ml/minCathode stoichiometry Varied for each partial pressure of O2
30 , Applied Physics, Master’s Thesis
Chapter 3
Results and Discussion
This chapter contains the results from the performed measurements. TheOCV and voltage response at 0.5 A/cm2 have been measured during theentire start/stop cycling, while the remaining analysis methods were per-formed before and after 1100 cycles of each strategy. The results will alsobe discussed to assess the impact the strategies had on the fuel cell perfor-mance and characteristics.
3.1 Start-up Strategy
The fuel cell was exposed to 1100 cycles of the developed start-up strategy.The details of the strategy are explained thoroughly in section 2.1.1, withcorresponding current and potential profiles for two typical cycles in figure2.1.
The OCV and potential response at 0.5 A/cm2 were measured for eachcycle and the results are presented in figure 3.1.
After the 1100 cycles the OCV was essentially unchanged. A small linearreduction can be distinguished after the first couple of cycles. The strategyresults in an OCV degradation at 9.9µV/cycle. The fact that the OCVis very stable is an indication of that the strategy has no impact on theinternal current or hydrogen crossover parameters, especially the membranethickness.
, Applied Physics, Master’s Thesis 31
Section 3.1. Start-up Strategy Chapter 3. Results and Discussion
0.9
0.95
1
1.05O
pen c
ircuit
volta
ge [V
]
0 200 400 600 800 1000
0.5
0.55
0.6
0.65
Number of cycles
Pote
ntial a
t
i =
0.5
A/c
m2 [V
]
Average value
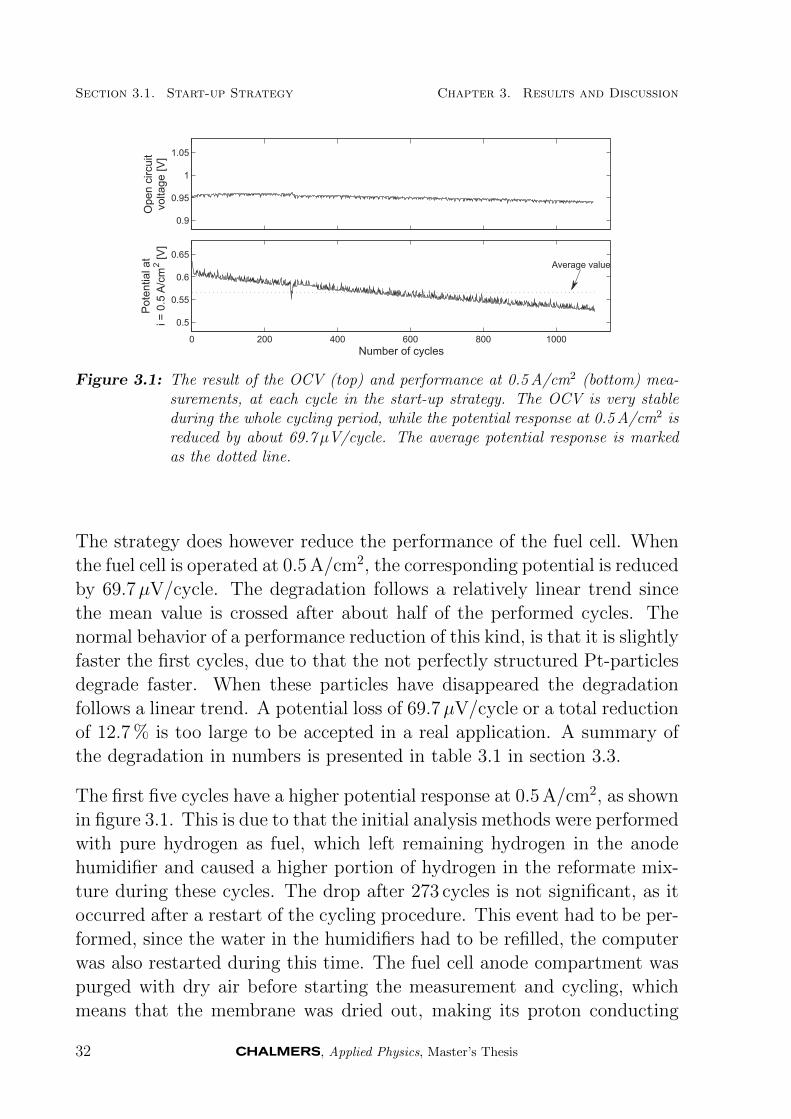
Figure 3.1: The result of the OCV (top) and performance at 0.5 A/cm2 (bottom) mea-surements, at each cycle in the start-up strategy. The OCV is very stableduring the whole cycling period, while the potential response at 0.5 A/cm2 isreduced by about 69.7µV/cycle. The average potential response is markedas the dotted line.
The strategy does however reduce the performance of the fuel cell. Whenthe fuel cell is operated at 0.5 A/cm2, the corresponding potential is reducedby 69.7µV/cycle. The degradation follows a relatively linear trend sincethe mean value is crossed after about half of the performed cycles. Thenormal behavior of a performance reduction of this kind, is that it is slightlyfaster the first cycles, due to that the not perfectly structured Pt-particlesdegrade faster. When these particles have disappeared the degradationfollows a linear trend. A potential loss of 69.7µV/cycle or a total reductionof 12.7 % is too large to be accepted in a real application. A summary ofthe degradation in numbers is presented in table 3.1 in section 3.3.
The first five cycles have a higher potential response at 0.5 A/cm2, as shownin figure 3.1. This is due to that the initial analysis methods were performedwith pure hydrogen as fuel, which left remaining hydrogen in the anodehumidifier and caused a higher portion of hydrogen in the reformate mix-ture during these cycles. The drop after 273 cycles is not significant, as itoccurred after a restart of the cycling procedure. This event had to be per-formed, since the water in the humidifiers had to be refilled, the computerwas also restarted during this time. The fuel cell anode compartment waspurged with dry air before starting the measurement and cycling, whichmeans that the membrane was dried out, making its proton conducting
32 , Applied Physics, Master’s Thesis
Chapter 3. Results and Discussion Section 3.2. Shutdown Strategy
ability reduced. After some cycles the membrane was humidified againand the performance returned to expected values.
3.2 Shutdown Strategy
The recirculation strategy for shutdown was performed for 1100 cycles, asdescribed in section 2.1.2. The potential and current profiles for two cyclesare illustrated in figure 2.2.
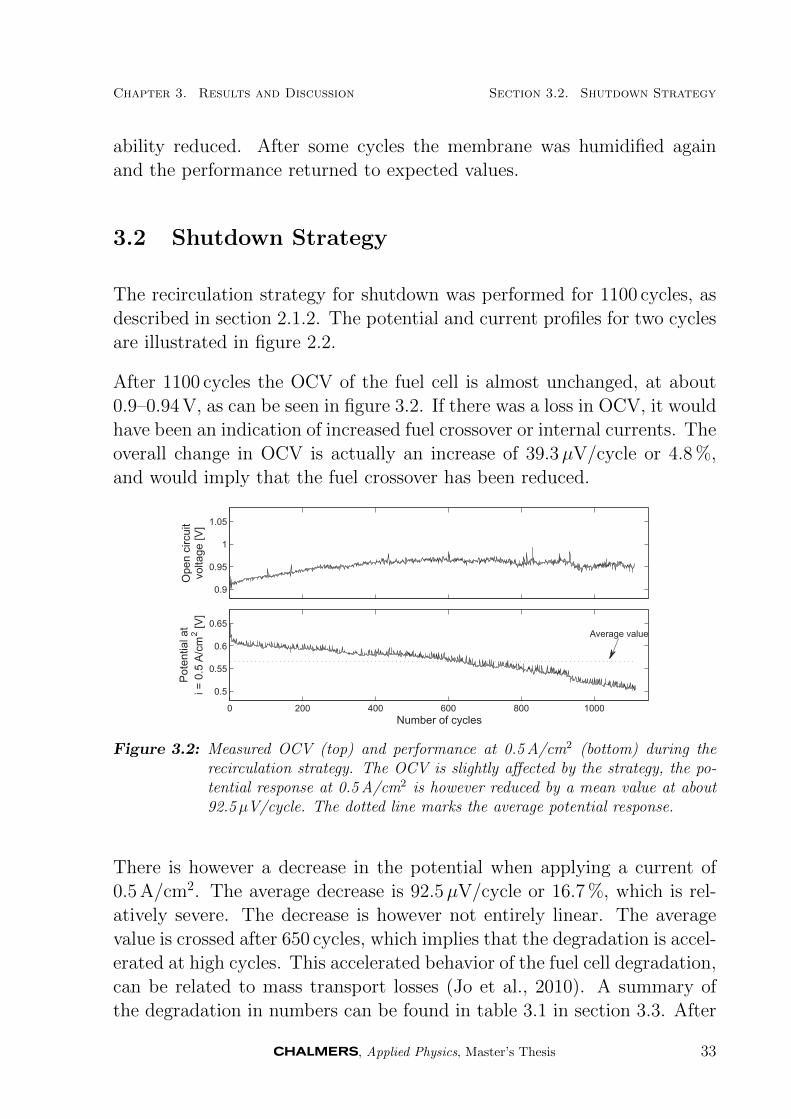
After 1100 cycles the OCV of the fuel cell is almost unchanged, at about0.9–0.94 V, as can be seen in figure 3.2. If there was a loss in OCV, it wouldhave been an indication of increased fuel crossover or internal currents. Theoverall change in OCV is actually an increase of 39.3µV/cycle or 4.8 %,and would imply that the fuel crossover has been reduced.
0.9
0.95
1
1.05
Open c
ircuit
volta
ge [V
]
0 200 400 600 800 1000
0.5
0.55
0.6
0.65
Number of cycles
Pote
ntial a
t
i =
0.5
A/c
m2 [V
]
Average value
Figure 3.2: Measured OCV (top) and performance at 0.5 A/cm2 (bottom) during therecirculation strategy. The OCV is slightly affected by the strategy, the po-tential response at 0.5 A/cm2 is however reduced by a mean value at about92.5µV/cycle. The dotted line marks the average potential response.
There is however a decrease in the potential when applying a current of0.5 A/cm2. The average decrease is 92.5µV/cycle or 16.7 %, which is rel-atively severe. The decrease is however not entirely linear. The averagevalue is crossed after 650 cycles, which implies that the degradation is accel-erated at high cycles. This accelerated behavior of the fuel cell degradation,can be related to mass transport losses (Jo et al., 2010). A summary ofthe degradation in numbers can be found in table 3.1 in section 3.3. After
, Applied Physics, Master’s Thesis 33

Section 3.3. Analysis of theDegradation
Chapter 3. Results and Discussion
935 cycles, the computer controlling the fuel cell crashed and the fuel cellwas operating at OCV without any supply of gases for about six hours.This is the reason for the rapid drop. The potential does however recoverand the decrease after this drop is quite linear, thereby the final resultmight not be affected by this event. The average value is however de-creased by the drop, which in turn leads to that the value would have beencrossed earlier, and that the performance loss was more linear during thecycling as expected. The drop is also an indication of that operation atOCV for a long time period is not good for a fuel cell. The membrane wasalso dried out during this time, since there was no supply of humidifiedgases. The recovering effect of the potential can be assigned to the morehumidified membrane during the first of the remaining cycles.
3.3 Analysis of the Degradation
This section contains all the measurements performed at an initial stageand after the 1100 cycles were completed for both the start-up and shut-down strategy. Table 3.1 is a summary of the discussed degradation effects.
The polarization curves in figure 3.3(a) is the result of measurements per-formed with H2 as fuel and O2 as oxidant. The solid lines are uncorrectedvalues before and after the cycles, which show a distinct performance degra-dation after the cycles for both strategies, with a slightly larger degradationfor the shutdown strategy. The potential loss increases slightly as the cur-rent increases, which indicates mass transport limitations. By using pureH2 and O2 the gas transport losses are minimised, thus the mass trans-port losses originate from a worsened transport of produced water andto a reduced electrochemically active platinum surface area. The dashedlines in figure 3.3(a) are the polarization curves for iR-corrected cell poten-tials. The distance between the non-corrected and the corrected curves areabout the same before and after the cycles, which is a sign of an almostunchanged ohmic resistance in the fuel cell. The iR-correction is howeverslightly larger for the start-up strategy.
The polarization curves in figure 3.3(b) are curves for both non-correctedand iR-corrected potentials for a measurement performed with reformate
34 , Applied Physics, Master’s Thesis

Chapter 3. Results and Discussion Section 3.3. Analysis of theDegradation
0 100 200 300 400 500 600 700 800 900 1000 11000.2
0.3
0.4
0.5
0.6
0.7
0.8
0.9
1
1.1
Po
ten
tial [
V]
Current [mA/cm2]
InitialInitial, iR-correctedAfter shutdown strategyAfter shutdown strategy, iR-correctedAfter start-up strategyAfter start-up strategy, iR-corrected
(a) H2/O2 supplied fuel cell.
0 100 200 300 400 500 600 700 800 900 1000 11000.2
0.3
0.4
0.5
0.6
0.7
0.8
0.9
1
1.1
Po
ten
tial [
V]
Current [mA/cm2]
InitialInitial, iR-correctedAfter shutdown strategyAfter shutdown strategy, iR-correctedAfter start-up strategyAfter start-up strategy, iR-corrected
(b) Reformate/Air supplied fuel cell.
Figure 3.3: Polarization curves of initial measurement and after 1100 cycles of eachstrategy. The dashed lines are iR-corrected values of the potential.
as anode gas and air as cathode gas. The polarization curves indicate in-creased mass transport losses, via the augmented potential drop at highcurrent densities for the measurements performed after the cycles, com-pared to the initial measurement. The strategies thus damage the poroussurroundings of the platinum particles, making the gas pathways narrowerand fewer. The produced water transport is also affected by the cycling.There can also be a agglomeration, diffusion and/or coarsening of the plat-inum catalyst particles during the strategies, that causes the mass transportlosses because of a reduced active platinum surface area. The potential lossdue to mass transport is larger for the start-up strategy than the shutdownstrategy.
, Applied Physics, Master’s Thesis 35

Section 3.3. Analysis of theDegradation
Chapter 3. Results and Discussion
To get further information from the polarization curves a Tafel plot wasmade at current densities lower than 100 mA/cm2. By approximating themeasured data in a non-linear least square fit manner, and plot the activityloss against the logarithm of the current density, the Tafel plot in figure3.4 was apprehended. As described in section 1.4.1 the slope of the linearregion corresponds to the material parameter A and the point where thedashed line crosses the x-axis correspond to the ORR exchange current i0.The slopes are increased when both strategies are performed. The slopesare also similar between the two curves corresponding to the measurementsafter 1100 cycles, indicating that usage of the fuel cell has a similar effect onthis parameter. The ORR exchange current has however decreased morefor the shutdown strategy, which could imply larger effects on the platinumcatalyst supports, leading to reduced ECSA.
100
101
102
0
0.05
0.1
0.15
0.2
0.25
0.3
0.35
Current [mA/cm2]
Act
ivity
loss
( ?
OR
R )
[V
]
InitialAfter shutdown strategyAfter start-up strategy
Figure 3.4: Tafel plot of the measurements performed at an initial stage and after thetwo strategies. The data comes from a non-linear least square approximationof the polarization curves, at low current densities (i <100 mA/cm2).
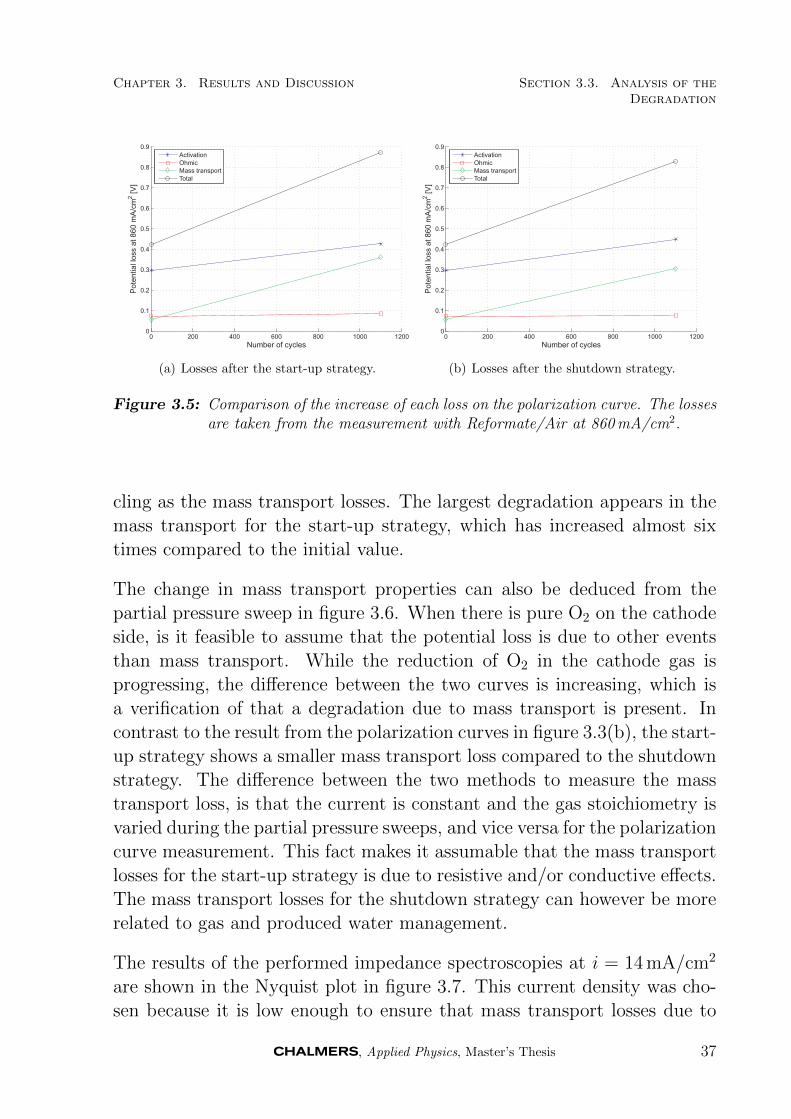
Figure 3.5 shows the increase of the activity losses, ohmic losses and masstransport losses, compared to the initial values. The comparison is made ona Reformate/Air fueled fuel cell operated at a current density of 860 mA/cm2,which is high enough to cause mass transport losses. The red line indicatesthat the ohmic losses stay almost unaffected by the cycling. The activitylosses cause the highest potential loss, but it is not as affected by the cy-
36 , Applied Physics, Master’s Thesis
Chapter 3. Results and Discussion Section 3.3. Analysis of theDegradation
0 200 400 600 800 1000 12000
0.1
0.2
0.3
0.4
0.5
0.6
0.7
0.8
0.9
Number of cycles
Pote
ntia
l loss
at 860 m
A/c
m2 [V
]
ActivationOhmicMass transportTotal
(a) Losses after the start-up strategy.
0 200 400 600 800 1000 12000
0.1
0.2
0.3
0.4
0.5
0.6
0.7
0.8
0.9
Number of cycles
Pote
ntia
l loss
at 860 m
A/c
m2 [V
]
ActivationOhmicMass transportTotal
(b) Losses after the shutdown strategy.
Figure 3.5: Comparison of the increase of each loss on the polarization curve. The lossesare taken from the measurement with Reformate/Air at 860 mA/cm2.
cling as the mass transport losses. The largest degradation appears in themass transport for the start-up strategy, which has increased almost sixtimes compared to the initial value.
The change in mass transport properties can also be deduced from thepartial pressure sweep in figure 3.6. When there is pure O2 on the cathodeside, is it feasible to assume that the potential loss is due to other eventsthan mass transport. While the reduction of O2 in the cathode gas isprogressing, the difference between the two curves is increasing, which isa verification of that a degradation due to mass transport is present. Incontrast to the result from the polarization curves in figure 3.3(b), the start-up strategy shows a smaller mass transport loss compared to the shutdownstrategy. The difference between the two methods to measure the masstransport loss, is that the current is constant and the gas stoichiometry isvaried during the partial pressure sweeps, and vice versa for the polarizationcurve measurement. This fact makes it assumable that the mass transportlosses for the start-up strategy is due to resistive and/or conductive effects.The mass transport losses for the shutdown strategy can however be morerelated to gas and produced water management.
The results of the performed impedance spectroscopies at i = 14 mA/cm2
are shown in the Nyquist plot in figure 3.7. This current density was cho-sen because it is low enough to ensure that mass transport losses due to
, Applied Physics, Master’s Thesis 37
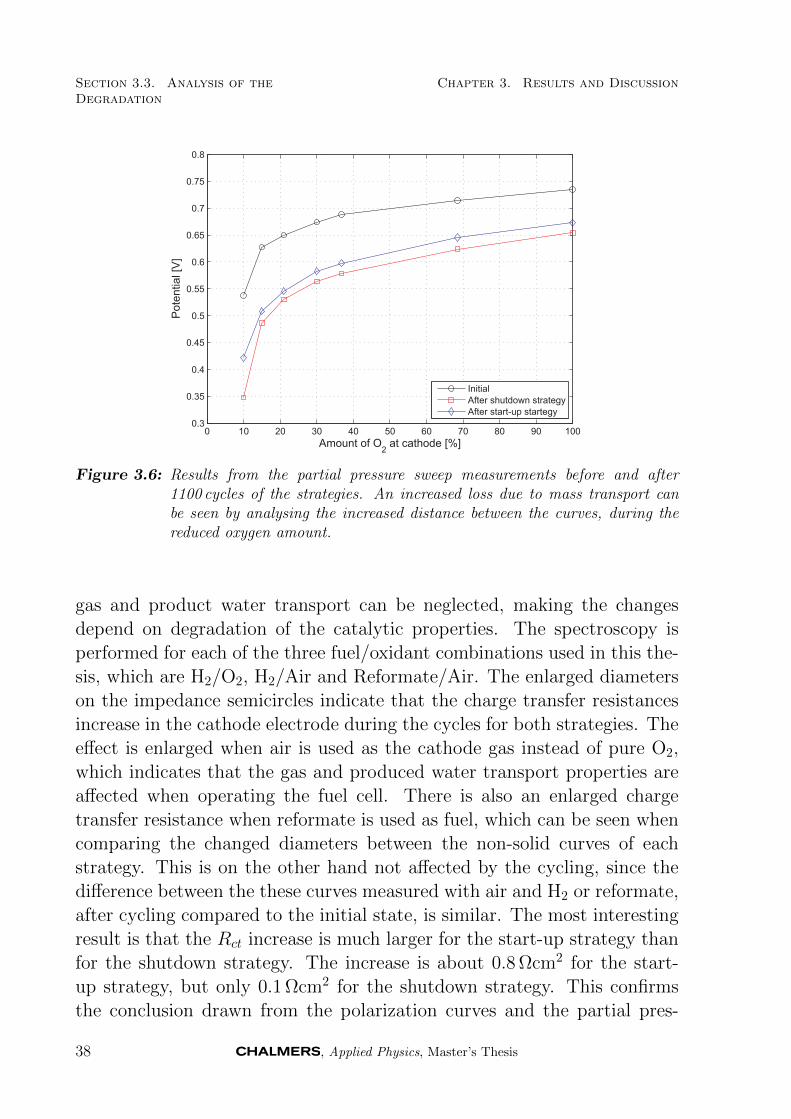
Section 3.3. Analysis of theDegradation
Chapter 3. Results and Discussion
0 10 20 30 40 50 60 70 80 90 1000.3
0.35
0.4
0.45
0.5
0.55
0.6
0.65
0.7
0.75
0.8
Pote
ntial [V
]
Amount of O2 at cathode [%]
InitialAfter shutdown strategyAfter start-up startegy
Figure 3.6: Results from the partial pressure sweep measurements before and after1100 cycles of the strategies. An increased loss due to mass transport canbe seen by analysing the increased distance between the curves, during thereduced oxygen amount.
gas and product water transport can be neglected, making the changesdepend on degradation of the catalytic properties. The spectroscopy isperformed for each of the three fuel/oxidant combinations used in this the-sis, which are H2/O2, H2/Air and Reformate/Air. The enlarged diameterson the impedance semicircles indicate that the charge transfer resistancesincrease in the cathode electrode during the cycles for both strategies. Theeffect is enlarged when air is used as the cathode gas instead of pure O2,which indicates that the gas and produced water transport properties areaffected when operating the fuel cell. There is also an enlarged chargetransfer resistance when reformate is used as fuel, which can be seen whencomparing the changed diameters between the non-solid curves of eachstrategy. This is on the other hand not affected by the cycling, since thedifference between the these curves measured with air and H2 or reformate,after cycling compared to the initial state, is similar. The most interestingresult is that the Rct increase is much larger for the start-up strategy thanfor the shutdown strategy. The increase is about 0.8 Ωcm2 for the start-up strategy, but only 0.1 Ωcm2 for the shutdown strategy. This confirmsthe conclusion drawn from the polarization curves and the partial pres-
38 , Applied Physics, Master’s Thesis
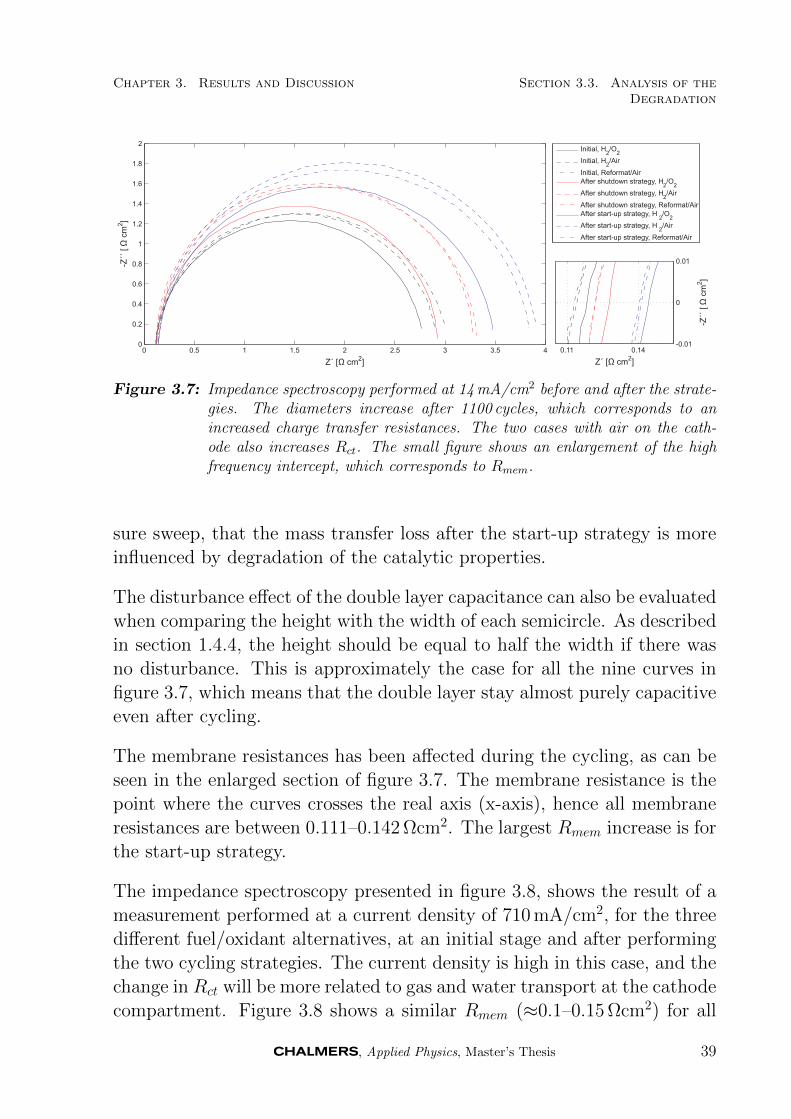
Chapter 3. Results and Discussion Section 3.3. Analysis of theDegradation
0 0.5 1 1.5 2 2.5 3 3.5 40
0.2
0.4
0.6
0.8
1
1.2
1.4
1.6
1.8
2
-Z´´
[?
cm
2]
Z´ [? cm2]
Initial, H
2/O
2
Initial, H2/Air
Initial, Reformat/AirAfter shutdown strategy, H
2/O
2
After shutdown strategy, H2/Air
After shutdown strategy, Reformat/AirAfter start-up strategy, H
2/O
2
After start-up strategy, H2/Air
After start-up strategy, Reformat/Air
0.11 0.14-0.01
0
0.01
-Z´´
[?
cm
2]
Z´ [? cm2]
Figure 3.7: Impedance spectroscopy performed at 14 mA/cm2 before and after the strate-gies. The diameters increase after 1100 cycles, which corresponds to anincreased charge transfer resistances. The two cases with air on the cath-ode also increases Rct. The small figure shows an enlargement of the highfrequency intercept, which corresponds to Rmem.
sure sweep, that the mass transfer loss after the start-up strategy is moreinfluenced by degradation of the catalytic properties.
The disturbance effect of the double layer capacitance can also be evaluatedwhen comparing the height with the width of each semicircle. As describedin section 1.4.4, the height should be equal to half the width if there wasno disturbance. This is approximately the case for all the nine curves infigure 3.7, which means that the double layer stay almost purely capacitiveeven after cycling.
The membrane resistances has been affected during the cycling, as can beseen in the enlarged section of figure 3.7. The membrane resistance is thepoint where the curves crosses the real axis (x-axis), hence all membraneresistances are between 0.111–0.142 Ωcm2. The largest Rmem increase is forthe start-up strategy.
The impedance spectroscopy presented in figure 3.8, shows the result of ameasurement performed at a current density of 710 mA/cm2, for the threedifferent fuel/oxidant alternatives, at an initial stage and after performingthe two cycling strategies. The current density is high in this case, and thechange in Rct will be more related to gas and water transport at the cathodecompartment. Figure 3.8 shows a similar Rmem (≈0.1–0.15 Ωcm2) for all
, Applied Physics, Master’s Thesis 39
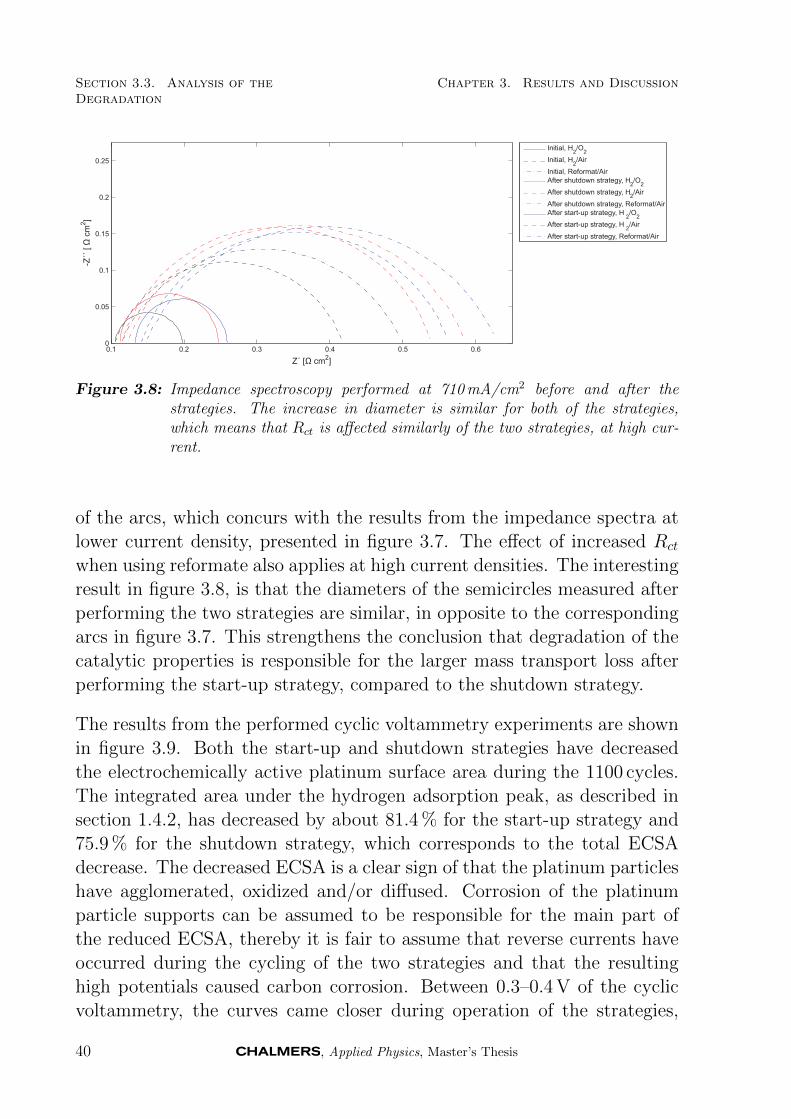
Section 3.3. Analysis of theDegradation
Chapter 3. Results and Discussion
0.1 0.2 0.3 0.4 0.5 0.60
0.05
0.1
0.15
0.2
0.25
-Z´´
[?
cm
2]
Z´ [? cm2]
Initial, H
2/O
2
Initial, H2/Air
Initial, Reformat/AirAfter shutdown strategy, H
2/O
2
After shutdown strategy, H2/Air
After shutdown strategy, Reformat/AirAfter start-up strategy, H
2/O
2
After start-up strategy, H2/Air
After start-up strategy, Reformat/Air
Figure 3.8: Impedance spectroscopy performed at 710 mA/cm2 before and after thestrategies. The increase in diameter is similar for both of the strategies,which means that Rct is affected similarly of the two strategies, at high cur-rent.
of the arcs, which concurs with the results from the impedance spectra atlower current density, presented in figure 3.7. The effect of increased Rct
when using reformate also applies at high current densities. The interestingresult in figure 3.8, is that the diameters of the semicircles measured afterperforming the two strategies are similar, in opposite to the correspondingarcs in figure 3.7. This strengthens the conclusion that degradation of thecatalytic properties is responsible for the larger mass transport loss afterperforming the start-up strategy, compared to the shutdown strategy.
The results from the performed cyclic voltammetry experiments are shownin figure 3.9. Both the start-up and shutdown strategies have decreasedthe electrochemically active platinum surface area during the 1100 cycles.The integrated area under the hydrogen adsorption peak, as described insection 1.4.2, has decreased by about 81.4 % for the start-up strategy and75.9 % for the shutdown strategy, which corresponds to the total ECSAdecrease. The decreased ECSA is a clear sign of that the platinum particleshave agglomerated, oxidized and/or diffused. Corrosion of the platinumparticle supports can be assumed to be responsible for the main part ofthe reduced ECSA, thereby it is fair to assume that reverse currents haveoccurred during the cycling of the two strategies and that the resultinghigh potentials caused carbon corrosion. Between 0.3–0.4 V of the cyclicvoltammetry, the curves came closer during operation of the strategies,
40 , Applied Physics, Master’s Thesis
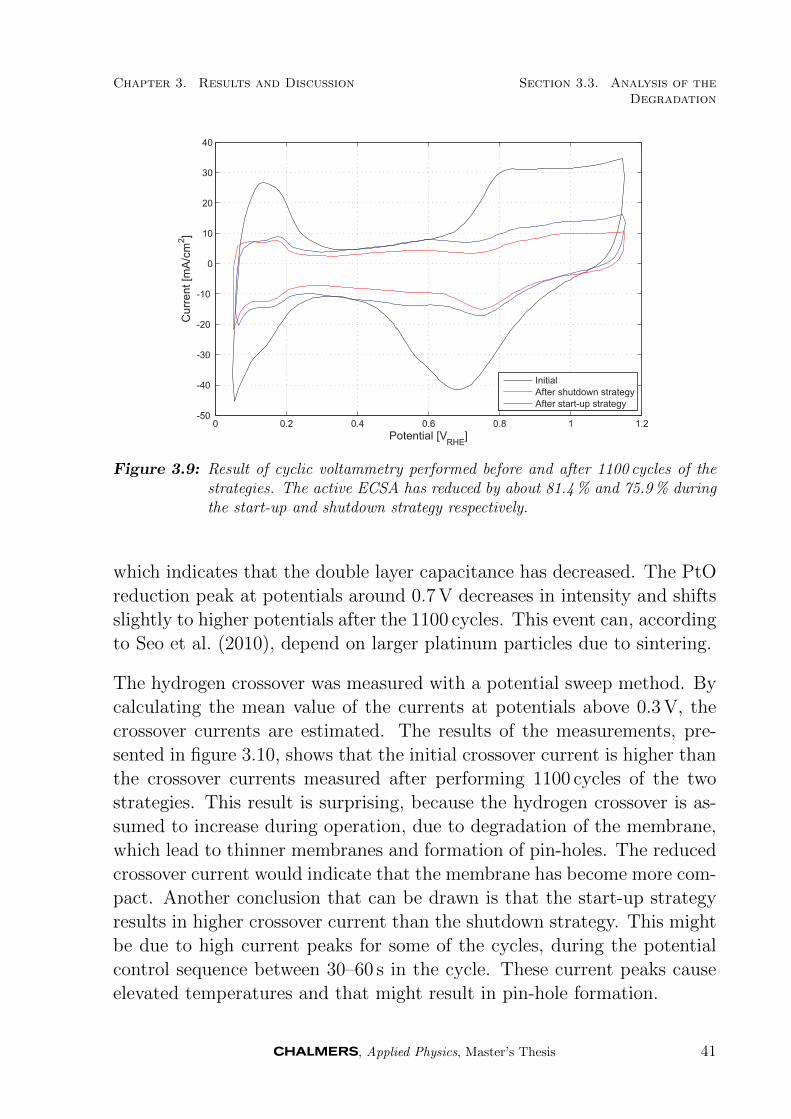
Chapter 3. Results and Discussion Section 3.3. Analysis of theDegradation
0 0.2 0.4 0.6 0.8 1 1.2-50
-40
-30
-20
-10
0
10
20
30
40
Curr
ent [m
A/c
m2]
Potential [VRHE
]
InitialAfter shutdown strategyAfter start-up strategy
Figure 3.9: Result of cyclic voltammetry performed before and after 1100 cycles of thestrategies. The active ECSA has reduced by about 81.4 % and 75.9 % duringthe start-up and shutdown strategy respectively.
which indicates that the double layer capacitance has decreased. The PtOreduction peak at potentials around 0.7 V decreases in intensity and shiftsslightly to higher potentials after the 1100 cycles. This event can, accordingto Seo et al. (2010), depend on larger platinum particles due to sintering.
The hydrogen crossover was measured with a potential sweep method. Bycalculating the mean value of the currents at potentials above 0.3 V, thecrossover currents are estimated. The results of the measurements, pre-sented in figure 3.10, shows that the initial crossover current is higher thanthe crossover currents measured after performing 1100 cycles of the twostrategies. This result is surprising, because the hydrogen crossover is as-sumed to increase during operation, due to degradation of the membrane,which lead to thinner membranes and formation of pin-holes. The reducedcrossover current would indicate that the membrane has become more com-pact. Another conclusion that can be drawn is that the start-up strategyresults in higher crossover current than the shutdown strategy. This mightbe due to high current peaks for some of the cycles, during the potentialcontrol sequence between 30–60 s in the cycle. These current peaks causeelevated temperatures and that might result in pin-hole formation.
, Applied Physics, Master’s Thesis 41

Section 3.3. Analysis of theDegradation
Chapter 3. Results and Discussion
0.1 0.2 0.3 0.4 0.5 0.6 0.7-1
0
1
2
3
4
5
Potential [V]
Curr
ent [m
A/c
m2]
InitialAfter shutdown strategyAfter start-up strategy
Figure 3.10: Results of hydrogen crossover measurements before and after the strategies.The initial crossover current density was estimated to 3.2 mA/cm2. Thecrossover currents after 1100 cycles were 2.8 mA/cm2 and 1.6 mA/cm2 forthe start-up and shutdown strategy respectively.
Table 3.1: Comparison of the discussed degradation parameters. The values from thepolarization curve is the same as presented in figure 3.5. The Rct and Rmem
values are from the curves measured with reformate as fuel and air as oxidant.The values in parenthesis is the percental change, compared with the initialvalues.
Initial After start-up After shutdown Analysisstrategy strategy method
ηORR [V] 0.296 0.425 (43.6) 0.488 (51.6) Polarization curveiRΩ [V] 0.072 0.086 (18.6) 0.076 (5.2) Polarization curveηtx [V] 0.055 0.362 (561) 0.304 (457) Polarization curveix [mA/cm2] 3.24 2.82 (-13.0) 1.59 (-50.9) Hydrogen crossoverRmem [Ωcm2] 0.114 0.147 (29.0) 0.122 (6.7) Impedance spectroscopyR14
ct [Ωcm2] 2.92 3.71 (27.3) 2.97 (9.5) Impedance spectroscopyR710
ct [Ωcm2] 0.384 0.482 (25.5) 0.4638 (20.7) Impedance spectroscopyECSA [%] – -75.9 -81.4 Cyclic voltammetryCdl [mF/cm2] 76.5 68.8 (-10.0) 48.0 (-37.2) Cyclic voltammetry
42 , Applied Physics, Master’s Thesis
Chapter 4
Conclusion and Future Work
In a sustainable future the fuel cell technology is an interesting buildingblock. It has high efficiency and is virtually free from green house gas emis-sions, when fueled with hydrogen. In a future energy sector, it is possiblethat the hydrogen can work as an energy storage. If solar, wind or waterenergy is used to produce hydrogen, it can be stored and used efficientlyin fuel cells whenever and wherever it is needed. The efficiency, lifetimeand cost of the fuel cells are getting closer to the target, but there arestill some issues left to solve before fuel cells can be fully commercialized.Protective start-up and shutdown strategies are very important to increasethe lifetime of a fuel cell.
Both the tested potential control start-up strategy and the recirculationshutdown strategy were much better than doing nothing at all. Ivity (2010)found that the fuel cell potential was significantly reduced already after125 cycles, when the cell was started and stopped without any protectivestrategy at all. The two strategies tested in this paper degraded the fuel cellin a similar manner and the potential loss at 0.5 A/cm2 was about the same.The start-up strategy did degrade the ECSA more than the shutdownstrategy, which resulted in larger charge transfer resistance, that increasedmass transport losses. The degradation of the fuel cell performance wastoo high, for both strategies, in order to apply them in a real application.A satisfying degradation would be lower than approximately 10µV/cycle.Since the degradation was similar for both of the strategies, a possiblereason for the degradation could be the instantaneous load of 0.5 A/cm2.A slower change of the load would have been better for the fuel cell.
, Applied Physics, Master’s Thesis 43
Chapter 4. Conclusion and FutureWork
To further improve the start-up and shutdown protection strategies, testshave to be performed with strategies for both start-up and shutdown ap-plied at the same time. When the start-up and the shutdown strategiesare tested separately, it can be the unprotected sequence that causes themost of the degradation. Before applying the strategies in an application,it is also important to run the strategies for more cycles and with a fuelcell stack. The different properties in gas distribution and series connec-tions between the each single cell in the stack would probably change thedegradation behavior.
44 , Applied Physics, Master’s Thesis

Bibliography
Baumgartner, W. R. R. , et al. (2006). ‘Electrocatalytic Corrosion of Car-bon Support in PEMFC at Fuel Starvation’. ECS Transactions 3(1):811–825.
Borup, R. , et al. (2007). ‘Scientific Aspects of Polymer Electrolyte FuelCell Durability and Degradation’ 107(10):3904–3951.
Carter, R. N. , et al. (2009). Handbook of Fuel Cells - Fundamentals,Technology and Applications, vol. 6. John Wiley & Sons, Ltd., 2 edn.Part 2, Chapter 56.
Darling, R. M. & Meyers, J. P. (2003). ‘Kinetic Model of Plat-inum Dissolution in PEMFCs’. Journal of The Electrochemical Society150(11):A1523–A1527.
de Bruijn, F. , et al. (2008). ‘Review: Durability and Degradation Issuesof PEM Fuel Cell Components’. Fuel Cells 8(1):3–22.
Gasteiger, H. A. , et al. (2008). ‘Catalyst Degradation Mechanisms in PEMand Direct Methanol Fuel Cells’. In S. Kakac, A. Pramuanjaroenkij, &L. Vasiliev (eds.), Mini-Micro Fuel Cells, NATO Science for Peace andSecurity Series, pp. 225–233. Springer Netherlands.
Gasteiger, H. A. , et al. (2004). ‘Dependence of PEM fuel cell perfor-mance on catalyst loading’. Journal of Power Sources 127(1-2):162 –171. Eighth Ulmer Electrochemische Tage.
Ivity, M. (2010). ‘Shutdown strategies for Polymer Electrolyte MembraneFuel Cell to Minimize Degradation’. Master’s thesis, Chalmers Universityof Technology.
, Applied Physics, Master’s Thesis 45
Bibliography
Jo, Y. Y. , et al. (2010). ‘Effects of a hydrogen and air supply procedure onthe performance degradation of PEMFCs’. International Journal of Hy-drogen Energy 35(23):13118 – 13124. Asian Hydrogen Energy Conference2009.
Kim, J. H. , et al. (2009). ‘Development of a Durable PEMFC StartupProcess by Applying a Dummy Load’. Journal of The ElectrochemicalSociety 156(8):B955–B961.
Kim, J. H. , et al. (2010a). ‘Effects of Cathode Inlet Relative Humidity onPEMFC Durability during Startup–Shutdown Cycling’. Journal of TheElectrochemical Society 157(1):B104–B112.
Kim, J. H. , et al. (2010b). ‘Effects of Cathode Inlet Relative Humidity onPEMFC Durability during Startup–Shutdown Cycling’. Journal of TheElectrochemical Society 157(5):B633–B642.
Kocha, S. , et al. (2006). ‘Characterization of gas crossover and its impli-cations in PEM fuel cells’. AIChE Journal 52:1916 – 1925.
Larminie, J. & Dicks, A. (2003). Fuel cell systems explained. John Wileyand Sons Ltd, 2 edn.
Lindstrom, R. W. , et al. (2010). ‘Active Area Determination of Porous PtElectrodes Used in Polymer Electrolyte Fuel Cells: Temperature and Hu-midity Effects’. Journal of The Electrochemical Society 157(12):B1795–B1801.
Marie, J. , et al. (2009). ‘Highly porous PEM fuel cell cathodes based onlow density carbon aerogels as Pt-support: Experimental study of themass-transport losses’. Journal of Power Sources 190(2):423 – 434.
Meyers, J. P. & Darling, R. M. (2006). ‘Model of Carbon Corrosion inPEM Fuel Cells’. Journal of The Electrochemical Society 153(8):A1432–A1442.
Nakamura, S. , et al. (2009). ‘The diffusion overpotential increase andappearance of overlapping arcs on the Nyquist plots in the low humiditytemperature test conditions of polymer electrolyte fuel cell’. Journal ofPower Sources 186(2):278 – 285.
46 , Applied Physics, Master’s Thesis

Bibliography
Ofstad, A. , et al. (2008). ‘Carbon Corrosion of a PEMFC During Shut-down/Start-up when Using an Air Purge Procedure’. ECS Transactions16(2):1301–1311.
Perry, M. L. , et al. (2006). ‘Systems Strategies to Mitigate Carbon Cor-rosion in Fuel Cells’. ECS Transactions 3(1):783–795.
Reiser, C. A. , et al. (2005). ‘A Reverse-Current Decay Mechanism for FuelCells’. Electrochemical and Solid-State Letters 8(6):A273–A276.
Seo, D. , et al. (2010). ‘Physical degradation of MEA in PEM fuel cell byon/off operation under nitrogen atmosphere’. Korean Journal of Chem-ical Engineering 27:104–109.
Shen, Q. , et al. (2009). ‘Study on the processes of start-up and shut-down in proton exchange membrane fuel cells’. Journal of Power Sources189(2):1114 – 1119.
U.S. Department of Energy, (2009). ‘Hydrogen and Fuel Cell Activities,Progress and Plans: Report to Congress’. 19–20.
Young, A. P. , et al. (2009). ‘Characterizing the Structural Degradation ina PEMFC Cathode Catalyst Layer: Carbon Corrosion’. Journal of TheElectrochemical Society 156(8):B913–B922.
Young, A. P. , et al. (2010). ‘Ionomer Degradation in Polymer Elec-trolyte Membrane Fuel Cells’. Journal of The Electrochemical Society157(3):B425–B436.
Yu, P. T. , et al. (2009). ‘Carbon-Support Requirements for Highly DurableFuel Cell Operation’. In F. N. Buchi, M. Inaba, & T. J. Schmidt (eds.),Polymer Electrolyte Fuel Cell Durability, pp. 29–53. Springer New York.
Yuan, X.-Z. , et al. (2010). Electrochemical Impedance Spectroscopy inPEM Fuel Cells Fundamentals and Applications. Springer London.
, Applied Physics, Master’s Thesis 47