
The E ciency of Trading in Social Networks: Experimental
50
The Efficiency of Trading in Social Networks: Experimental Measures from India Kyle Emerick * September 28, 2013 JOB MARKET PAPER Abstract This paper studies whether trading in social networks is efficient. I use a field experiment in Odisha India to compare decentralized trade of a new technology through networks with an approach where demand was revealed via door-to-door sales. The findings show that trading in networks results in significant under-adoption when compared to door-to-door sales. Specifically, the rate of adoption was 83% lower when trading occurred only in networks. Using variation across the sample in estimated returns of the technology, I show that the efficiency loss due to networked trade represents 63% of the expected gains from adoption that were achieved in the door-to-door sales. The costs of making links with farmers from different peer groups offer an explanation for the results. Sub-caste and surname association with suppliers are strong predictors of adoption in networks, but have no effect in door-to-door sales. The results suggest that the costs of interacting with suppliers from different social groups make exchange in social networks inefficient. Keywords : Social Networks, Markets, Transaction Costs JEL Codes : O17, L14 * Department of Agricultural and Resource Economics, University of California Berkeley, [email protected]. I am grateful to Elisabeth Sadoulet and Alain de Janvry for their guidance on all stages of this project. I also thank Ted Miguel, Craig Mcintosh, Jeremy Magruder, Ethan Ligon, and Michael Anderson for helpful comments and suggestions. I gratefully acknowledge financial support from the World Bank and the Agricultural Technology Adoption Initiative of the Bill and Melinda Gates Foundation. I thank Manzoor Dar for his help in setting up the experiment and sharing his abundant knowledge about rice production. I also thank Girija Prasad Swain, Anirudha Patra, Silu Saha, and the staff of the Balasore Social Service Society for outstanding field work. 1
Transcript of The E ciency of Trading in Social Networks: Experimental

The Efficiency of Trading in Social Networks: Experimental
Measures from India
Kyle Emerick∗
September 28, 2013
JOB MARKET PAPER
Abstract
This paper studies whether trading in social networks is efficient. I use a field experimentin Odisha India to compare decentralized trade of a new technology through networks with anapproach where demand was revealed via door-to-door sales. The findings show that trading innetworks results in significant under-adoption when compared to door-to-door sales. Specifically,the rate of adoption was 83% lower when trading occurred only in networks. Using variationacross the sample in estimated returns of the technology, I show that the efficiency loss dueto networked trade represents 63% of the expected gains from adoption that were achieved inthe door-to-door sales. The costs of making links with farmers from different peer groups offeran explanation for the results. Sub-caste and surname association with suppliers are strongpredictors of adoption in networks, but have no effect in door-to-door sales. The results suggestthat the costs of interacting with suppliers from different social groups make exchange in socialnetworks inefficient.
Keywords: Social Networks, Markets, Transaction CostsJEL Codes: O17, L14
∗Department of Agricultural and Resource Economics, University of California Berkeley, [email protected] am grateful to Elisabeth Sadoulet and Alain de Janvry for their guidance on all stages of this project. I alsothank Ted Miguel, Craig Mcintosh, Jeremy Magruder, Ethan Ligon, and Michael Anderson for helpful commentsand suggestions. I gratefully acknowledge financial support from the World Bank and the Agricultural TechnologyAdoption Initiative of the Bill and Melinda Gates Foundation. I thank Manzoor Dar for his help in setting up theexperiment and sharing his abundant knowledge about rice production. I also thank Girija Prasad Swain, AnirudhaPatra, Silu Saha, and the staff of the Balasore Social Service Society for outstanding field work.
1

1 Introduction
The identities of agents are usually considered to be irrelevant in the classic marketplace becausebuyers and sellers come together at “arm’s length” to make efficient transactions. While thisabstract definition of the marketplace constitutes the ideal textbook scenario, a broad set of goodsare exchanged bilaterally between agents that are connected in networks (Jackson, 2009). Thisbroad set includes informal insurance in the Philippines (Fafchamps and Lund, 2003; Fafchampsand Gubert, 2007), electronics in Japan (Nishiguchi, 1994), and fish in southern France (Vignesand Etienne, 2011).
This paper asks whether trading in networks – a common nonmarket institution – can allocatea new technology efficiently, where efficiency is defined as adoption by all potential buyers withpositive expected returns. Despite the importance of networks as a mode of exchange, and agrowing theoretical literature on network-based exchange (Kranton and Minehart, 2001; Elliott,2013), there is little empirical evidence on how efficiently networks allocate goods. I present thefirst field experiment to measure whether network-based exchange is efficient. Ex-ante, the answerto the question is uncertain. On the one hand, the costs of adopting from suppliers coming fromdifferent social groups may create a friction and limit exchange to closely linked individuals (Elliott,2013). Conversely, buyers with high valuations of the technology may be induced to bear the costsof making links with sellers (Kranton and Minehart, 2001).
Overall, I find that trading in social networks is inefficient. This inefficiency is driven byreduced adoption combined with no improvements in targeting of buyers with high valuations ofthe technology. Additionally, existing social relationships between buyers and suppliers – defined bycaste and surname association – have significant influence on adoption in networks. The tendencyto transact with close peers, rather than with the farmers with the highest potential benefits ofhaving the technology, limits the efficiency of networked exchange.
To measure efficiency, I exploit a unique property of a new rice variety that allows me to char-acterize ex-ante the potential adopters with the highest expected returns. The variety, “Swarna-Sub1”, has the specific property that it only offers improved output per hectare when fields areaffected by flooding – creating variation in benefits across the sample due to variation in exposureto flooding.1 This property has been verified in both agronomic trials (Singh, Mackill, and Ismail,2009) and randomized experiments in farmer’s fields (Dar et al., 2013b). It is worth noting thatwhile I rely on a particular new agricultural technology, the most important feature of the tech-nology is that the key determinant of returns is observable. This feature is not unique to new seedvarieties, but is relevant for any technology with heterogeneity in benefits.
There are three sources of experimental variation that are used in the analysis. For the first,a group of five farmers were randomly chosen in each of 82 villages to receive a small amountof the new seed variety. After a single year of production, this small amount of seed produces alarge amount of output that can potentially be used as seeds by other farmers in the village. The
1The technology is otherwise equivalent to Swarna, which is commonly grown throughout eastern India. Fordetails on how the technology was developed, see Xu et al. (2006) and Bailey-Serres et al. (2010).
2

selection of the initial recipients of the technology is akin to selection of “suppliers” because theseinitial recipients were effectively endowed with more than enough seeds for their own cultivation.The random selection of suppliers allows for causal identification of whether social relationshipswith suppliers determine adoption in networks.
Following the first year of production, the second source of variation was village-level random-ization of the mode of exchange. In the first half of villages nothing further was done, effectivelyforcing adopters to rely on suppliers for taking up the technology. I refer to this system of exchangeas the “network” because trading is decentralized, non-anonymous, and thus requires at least somelink between buyers and sellers.2
The seed was additionally made available via door-to-door sales in the remaining half of vil-lages. I refer to this treatment as the “market”, as it introduces anonymity and breaks down therequirement for buyers and sellers to be linked. It is however important to note that some featuresof a real-world market are absent in the door-to-door approach. Namely, the costs of actually go-ing to the marketplace and finding suppliers are eliminated. I therefore consider the door-to-doorapproach as a method for reliably eliciting demand in an environment where transaction costs areabsent. An additional important feature of this design is that since exchange via networks couldstill occur in villages where sales were offered, the design allows me to address whether networkedtrade alone meets demand. If so, then the additional adoption resulting from access to door-to-doorsales should be small.
My third source of variation was randomization of prices at which sales offers were made.Since transaction prices in networks were beyond the control of the experiment, I rely on pricerandomization to ensure that a comparison between the two modes of exchange can be made whileholding prices fixed. Therefore, the design ensures that price differences can not explain the results.
The experiment produced four main empirical results. The first result is that the overall rateof adoption is 83% lower in networks alone. Only 7% of farmers adopted in network villages, while40% did in market villages. While the sign of this effect is not surprising, its magnitude impliesthat a significant share of farmers that otherwise have positive demand for a product, do not adoptwhen exchange occurs in social networks.3
My second result speaks to how social relationships restrict trading in networks. Specifically,farmers relying on networks are much more likely to adopt when the suppliers in their village be-long to the same sub-caste or share the same surname. In my preferred specification, having thesame surname as an additional supplier results in a 106% increase in the probability of adoption.Similarly, being part of the same sub-caste as an additional supplier leads to a 53% increase inadoption probability. These strong peer effects are eliminated when door-to-door sales are made.An equivalent interpretation of the finding is that introducing an outside buying opportunity in-
2The term “link” is used to refer to links used for the purpose of making one-shot transactions, not necessarilylinks for more repeated interactions such as mutual insurance.
3One alternative explanation of this “overall access” effect is that door-to-door sales represented an effectiveincrease in supply. I show that this explanation is unlikely because the amount of seeds available to suppliers wassufficient to meet the demand of more than an entire village.
3

creases adoption, but particularly for those that are not connected to suppliers and thus would haveotherwise had high costs of adopting in networks. The result provides micro-level evidence thatis consistent with the cross-country result that the diffusion of technology is slower in countrieswhere networks are organized into distinct sub-networks or collectives (Fogli and Veldkamp, 2012).Additionally, the result empirically demonstrates the importance of network structure for trad-ing outcomes – something that is consistent with results from laboratory experiments (Charness,Corominas-Bosch, and Frechette, 2007; Gale and Kariv, 2009).
Third, I show that targeting of farmers with higher expected returns is no more effective innetworks. I exploit the flood-tolerance property of Swarna-Sub1 to generate estimated returnsusing impact estimates from a recent randomized experiment (Dar et al., 2013b). Using theseestimated returns, I use historical flood data to classify farmers according to whether they areexpected to gain from the technology or not. I find that while networks exclude significantly morefarmers with positive expected returns, part of this effect is offset by exclusion of farmers withnegative expected returns. Overall, the average return of adopters with door-to-door sales is lowerby approximately 18%, but the difference is not statistically significant, suggesting that improvedtargeting does not offset much of the inefficiency due to reduced adoption.
Building on the first three results, my final result quantifies the magnitude of the efficiencylosses resulting from networked trade. I define efficiency losses as the percentage of the total gainsin expected revenue in the door-to-door sales villages that are not achieved in networks alone. Thetotal expected gain in revenue due to the new technology is almost three times larger in villageswhere farmers were offered door-to-door sales. More precisely, the efficiency loss due to missedtrading opportunities in networks represents 63% of the total gains achieved by the door-to-doorchannel. The magnitude of the welfare effect implies substantial losses due to networked trade.The tendency for transactions to be limited to farmers sharing the same surname or belonging tothe same sub-caste, suggests that costs of trading with suppliers from other social groups explainthe inefficiency of networked trade.
The finding that trade in networks is inefficient adds new empirical evidence helping to dis-tinguish between competing models of networked markets. Even considering the costs of makinglinks, the model in Kranton and Minehart (2001) shows that networked trade can achieve efficiencyby inducing buyers with high valuations to connect with suppliers. My results are more consistentwith a model where costs of exchanging with socially distant peers create a key friction that limitsthe ability of networks to allocate goods (Elliott, 2013).
An important policy implication of the results is that although seemingly desirable as a low-cost method of diffusing a new technology, social networks alone can not efficiently allocate thetechnology. Given the push to make development interventions sustainable (Kremer and Miguel,2007), relying on decentralized exchange through social networks seems ideal because of its lowcost. My results suggest that this approach will leave significant demand unmet.
The rest of the paper is organized as follows. In section 2, I provide a description of howthe experiment was specifically designed to measure the efficiency of networked trade. Section 3
4

provides a model of technology adoption that lays the groundwork for the empirical analysis insection 4. After establishing the inefficiency of exchange in networks, section 5 provides furtheranalysis that points to network structure and the tendency to transact with only close peers as themost likely explanation of this inefficiency result. Section 6 concludes.
2 Experimental Design
In this section I describe the approach to create random variation in the identities of suppliers,the mode of exchange, and transaction prices in door-to-door sales. Motivated by the questions ofwhether exchange in networks is efficient and whether social relationships with suppliers influenceadoption in networks, I discuss how the these sources of variation can be used to answer thesequestions. Finally, I also discuss the timing of data collection.
Before discussing details of the experiment, some details on the sample area are useful. Theexperiment was carried out in 82 villages in three blocks of Bhadrak district of Odisha (see Figure1 for a map of the villages).4 The villages were selected using satellite imagery of flooding during2008 and 2011. The villages are located in a low-lying coastal area adjacent to the Bay of Bengal.The median elevation of the district is approximately 10 meters, and rivers flowing from adjacenthigher-elevation districts make flooding frequent during the rain season from June-October. Mostrecently, heavy flooding occurred in 2008, 2009, and 2011.
Suppliers were randomly selected at a village meeting carried out during May 2012. Each villagewas visited and farmers were informed that there would be a meeting to discuss a new submergence-tolerant rice variety. The meeting was open to any farmers cultivating rice. Participants wereinformed that five farmers would be chosen via lottery to receive a five kilogram minikit of Swarna-Sub1.5 The meetings were attended by anywhere from 15 to 41 farmers, with average attendancebeing 22. During each meeting, enumerators provided a brief overview of the characteristics ofSwarna-Sub1, described its similarity to the known variety Swarna, and pointed to flood toleranceas its only known benefit. After the information was provided, each farmer provided responses to ashort baseline social network survey before placing their name in a bucket for the lottery. After alldata were collected, the names of the five recipients were drawn and minikits were provided. Theselection of five original recipients is akin to random selection of the “suppliers” since their role inthe experiment is to multiply the seed and sell/exchange with other farmers after the harvest butprior to the following growing season. Importantly, the identities of suppliers were known to allfarmers attending, thus eliminating the possibility that lack of information on identities of suppliersaffected the experiment.
The 25 kg of seed provided to suppliers produced enough output to eliminate any concern thatdemand could not be met with this amount. The minikits were planted by suppliers upon the arrival
4The total number of villages is 84. Two villages were used for piloting of surveys and interventions and aretherefore not used in the analysis.
5Minikits are a common approach to introducing a new seed variety in India (Bardhan and Mookherjee, 2011).Each minikit contained only five kg of Swarna-Sub1 seeds, which is enough to cultivate approximately 0.1-0.2 hectares.The minikits were identical to those provided in Dar et al. (2013b).
5

of the southwest monsoon, which occurred around the second week of June. Crops were harvested inlate November to early December. Enumerators returned to all villages during harvesting to collectinformation about production. A total of 396 of the 410 suppliers were contacted and surveyed. Ofthe farmers surveyed, 346 indicated that the minikit had been planted.6 The average amount ofland allocated to Swarna-Sub1 amongst those cultivating it was 0.13 hectares. The average harvestat the village level was approximately 1.8 tons. Since most farmers use approximately 5-10 kg ofseed during their first year of cultivation, the amount of seeds available to suppliers was sufficientto meet demand. As I discuss in further detail in Section 5, alternative uses of output were lessprofitable to suppliers, indicating that when ignoring any transaction costs, the most profitable useof output was trading with other farmers.
By randomly selecting suppliers, I can compare adoption outcomes between non-recipients(henceforth “buyers”) that are more or less connected to suppliers. If costs of exchange withfarmers from other social groups is important, then farmers should be more likely to trade withclose peers.
Prior to randomization of the mode of exchange, a survey was administered to 1,151 randomlyselected potential buyers during February-April 2013.7 There were three purposes of this survey.First, a plot-level record of the duration of past flooding events during the previous five yearswas collected in order to estimate the expected returns of the new technology. I return to theestimation of expected returns using these data below. Second, farmers were also reminded aboutSwarna-Sub1 and the potential to obtain it from other farmers in the village. These reminderslimit the possibility that farmers chose not to adopt simply because they had forgotten or did notknow about the technology. Third, another social network survey was administered, thus allowingfor analysis of whether stated network relationships responded to selection of suppliers.
The mode of exchange was randomized at the village level prior to planting for the 2013 season.In half of the villages, no intervention was carried out and thus decentralized trade between farmerswas the only means of spread of the technology. Take-up in this network treatment obviouslyrequires informal transactions between connected farmers. The transactions could include sales,exchanges, or outright gifts - the latter likely occuring with some expectation of future reciprocity.8
This randomization was stratified by block – an administrate unit two levels above villages – andthe relative importance of suppliers to buyers. Relative importance of suppliers was measuredusing an indicator variable for whether the ratio of the average sharing degree of suppliers to thatof buyers is greater than the sample median.9
6The most common reason reported for not cultivating the minikit was that the seedbed was damaged by droughtor cows. The common method of planting rice in the area is transplanting, which involves preparing a small seedbedand uprooting the small seedlings approximately 3-4 weeks after emergence. The uprooted seedlings are then bundledand planted in the main field. Lack of water is particularly problematic for the seedbed.
7In villages with more than 15 potential buyers, a random sample of 15 names was drawn from the list of remainingfarmers from the original village meeting. All buyers were selected if there was less than 15 names remaining.
8The ability to exchange seeds is an advantage of the networked market if farmers face liquidity constraints at thetime right before planting.
9The sharing degree is simply the number of links of the farmer where a link between two farmers is defined aseither farmer stating that they would go to the other farmer for seeds, fertilizers, or other inputs.
6

In the remaining half of villages, farmers were also given the opportunity to purchase thetechnology from NGO representatives in a door-to-door market. Enumerators were instructed togo directly to the homes of farmers to make sales offers at pre-determined village-level prices.Except for telling the farmers about availability of the technology, enumerators were instructed togive farmers no additional details about its benefits. Since farmers knew about the technology fromthe village meeting and previous surveys, there is little chance that increased awareness could drivethe results.
Since five suppliers were selected in all villages, network-based exchange was equally possiblein all villages. Therefore, taking door-to-door markets as a near-perfect market where transactioncosts are eliminated and demand is revealed, the question being addressed by random provision ofdoor-to-door buying opportunities is whether exchange through networks alone leaves significantdemand unmet. If so, then a large number of farmers will be “crowded in” when door-to-doormarkets are available.
Returning to prices, the prices were randomized in order to approximate the prices paid intransactions between farmers. Prices paid between farmers are commonly near the current marketprice of grain, which is the opportunity cost of participating in the transaction for the supplier.The minimum support price of rice set by the Indian government for the 2012-2013 season was12.5 Rs per kg (1 USD ≈ 58 Rs). Many farmers also sell to private traders at prices ranging from10-11 Rs. Using these prices as a benchmark, prices were randomly set at 3 levels: 14, 12, and 10Rs per kg. This range of prices encompasses the prices paid in network transactions. Therefore, Ican effectively hold prices constant by estimating the main treatment effects at the average priceof network transactions.
A final endline survey was carried out in all villages during July 2013 to track adoption andarea planted. The survey was administered to all farmers in order to verify transactions from bothbuyers and suppliers. A total of 1,150 buyers and 394 suppliers were reached. I use adoption fromthis survey as the main outcome variable throughout the remainder of the paper.
Summary statistics indicate that experimental groups are comparable on observable character-istics. Panel A of Table 1 shows mean values of baseline observable characteristics for the suppliersand randomly selected buyers. Observable characteristics of suppliers appear similar to those ofbuyers, suggesting that the randomization in the field was successful at generating a random groupof suppliers. Focusing on the social network measures, two farmers are defined to have an informa-tion link if either farmer indicated they would go to the other farmer to talk about rice farming.Similarly, two farmers have a sharing link if either farmer indicated that the other farmer is some-body they would hypothetically go to for seeds, fertilizers, or other inputs. Each farmer has onaverage 5 information links and 4.25 sharing links.
Village-level statistics are presented in Panel B of Table 1. The villages are fairly small, withan average of 165 households, 103 of which are engaged in cultivation. The average elevation offive meters shows that the villages are located in a coastal low-lying area. Importantly for thedesign, the share of suppliers not cultivating the minikits and the aggregate Swarna-Sub1 harvest
7

are balanced across market and network villages, suggesting that any differences in adoption cannot be attributed to differences in production of suppliers.10
3 Model of Technology Adoption in Networks
In this section I formulate a model of adoption of a new technology when network relationshipscreate variation in costs of adopting across the population. I then use the model to build un-derstanding on how targeting of buyers with high expected benefits varies between networks anddoor-to-door sales.
3.1 Simple Example
Before formulating the adoption choice of buyers, I present a simple example that is meant toconvey the ways in which trading in networks may vary from door-to-door sales. Figure 2 displaysthe network structure for one of my sample villages, where two farmers are assumed to have a linkif they share a common surname, an assumption I provide support for in Section 5. The blue nodesin the figure represent the five farmers that were selected as suppliers and the remaining nodesare potential buyers. Since the harvest of suppliers is enough to meet demand, and there are noalternate uses of the output that are more profitable, efficiency requires each buyer with positivedemand to adopt. As an example, if B5 has a high valuation for the technology, then she faces atradeoff of bearing the costs of trading with a supplier outside her reference group, or not adopting.As the theoretical literature suggests, it is not obvious as to whether these transactions will takeplace (Kranton and Minehart, 2001; Elliott, 2013).
The link pattern is inconsequential when door-to-door sales are made because an outside selleris available to all buyers. Most importantly, B5 faces no transaction costs of adopting. If networkswork efficiently for exchange, then B5 should adopt regardless of the mode of exchange. In contrast,if networks are inefficient, then adding door-to-door buying opportunities will crowd in those farmersthat are not connected to suppliers.
3.2 Model Setup
The only benefit to the farmer of adopting the new technology is improved flood tolerance. Toformalize this, denote αi as the probability that farmer i is affected by flooding. The agronomicreturn of the technology when flooding occurs is ri > 0. Conversely, the return under non-floodconditions is zero – an assumption consistent with the experimental results in Dar et al. (2013b).Therefore, the expected return of the technology is Ri = αiri.
10Another useful test is the test of whether any differences between suppliers and buyers are greater in marketvillages as compared to network villages. In results not reported, I regress each characteristic in Panel A of Table 1on village-level treatment, a supplier indicator, and the interaction of these two variables. The F-statistics of these 11regressions range from 0.29 to 1.19 and thus the three variables do not jointly explain variation in any of the farmercharacteristics.
8

I assume that a farmer knows his return due to flood exposure Ri with certainty, but that hisperceived returns are Ri + ui, where ui is mean zero and independent of both R and c. The noiseterm ui results from uncertain beliefs about other benefits or costs of the technology. For instance,some farmers may incorrectly perceive that the technology is less susceptible to pest damage, ormore prone to drought. These mistakes can lead to targeting errors independent of the mode ofexchange.
There are two sources of costs. First, the positive difference in prices between the old and newtechnologies is v. Second, the parameter ci denotes the costs to the buyer of making a tradinglink with a supplier. The value of ci varies across the population because of varying degrees ofconnectedness to suppliers. For instance, a farmer that belongs to the same sub-caste as supplierslikely has a smaller value of c than a farmer with no suppliers in his sub-caste. Additionally, itneed not be the case that c > 0. As an example, a farmer may benefit from trading in networks ifpeers extend credit or allow for other types of flexible payments.11
The joint distribution of c and R is f(c,R) and the correlation coefficient is ρ. The probabilityof adopting the new technology is P{Ri + ui − v − ci > 0}. Holding returns fixed, trading innetworks naturally crowds out farmers with large values of c. Introducing a door-to-door marketeliminates these costs and causes the adoption probability to increase to P{Ri + ui − v > 0}.
3.3 Targeting
Since the new technology is only beneficial for farmers cultivating land in areas at risk of flooding,the most efficient allocation would result in adoption by only farmers in these areas. In terms ofthe model, the objective of a social planner would be to allocate the technology to all farmers withRi > 0. The difference between this allocation and the allocation achieved by decentralized tradethrough networks depends on which farmers are screened out from the pool of adopters. If thefarmers with the least connections to suppliers – and thus the highest costs of adopting in networks– are also those that have lower expected returns, then any decreases in adoption in networks areoffset by more effective targeting.
There are two types of errors leading to inefficiencies. First, a farmer with positive expectedreturns may fail to adopt. The probability of this “exclusion error” in networks is written as,
pexcn = P{R+ u < c+ v|R > 0}. (1)
Second, an inclusion error occurs if a farmer that is not expected to benefit from the technologychooses to adopt. The probability of an inclusion error is
pincn = P{R+ u > c+ v|R ≤ 0}. (2)
The model generates predictions on how targeting errors are expected to vary between the two11See Kranton (1996) and Aoki and Hayami (2001) for discussion of some of the benefits of reciprocal exchange
through networks.
9

treatments. Holding u fixed, going from exchange in networks to door-to-door markets naturallyreduces exclusion error because farmers with moderate returns but high costs of exchange are lesslikely to be screened out. Similarly, exclusion errors by networks are most likely for farmers thatare the least connected to suppliers. If c and R are positively correlated, the increase in exclusionerror due to networks is larger. This results because the farmers that are most likely to adopt fromtheir peers are those with the lowest returns. Similarly, If c and R are negatively correlated, thenexclusion error in networks becomes less problematic because farmers with high expected returnsare those that are most likely to adopt from peers.
While introducing a door-to-door market likely reduces exclusion error, this likely comes at acost of increasing inclusion error. The door-to-door market eliminates all transaction costs, thusmaking it more likely that a farmer with a negative value of R and a positive value of u will adopt.Inclusion errors are also more likely for the most connected farmers. Inclusion errors by networksare reduced if c and R are positively correlated because the farmers with the most connectionsto suppliers will be those that benefit the least from the technology. The reverse statement is ofcourse true for ρ < 0.
The important testable predictions of the model are summarized as follows. First, exclusionerrors are more likely in networks, and they are particularly more likely by farmers that are theleast connected to suppliers. Second, inclusion errors are more frequent in door-to-door markets,but the magnitude of this effect is smaller for the farmers that are the most connected to suppliers.
4 Results
In this section I first explain in Section 4.1 the results showing that exchange in social networksresults in lower adoption, crowding out of farmers with fewer connections to suppliers, and nooverall improvement in targeting. These results build up to an overall measure of efficiency lossesdiscussed in Section 4.2. Finally, in Section 4.3, I estimate the demand elasticity in door-to-doorsales.
4.1 Adoption, Peer Effects, and Targeting
Exchange via social networks alone results in significantly lower adoption when compared to villageswhere farmers also had a door-to-door buying opportunity. In order to estimate the magnitudeof this effect while holding prices constant, I rely on random price variation to estimate the effectat the average price observed in network transactions between farmers. Formally, the regressionspecification is
adoptionij = β0 + β1marketj + β2marketj ∗ (pricej − 12.4) + εij , (3)
10

where adoptionij is an indicator for adoption by farmer i in village j, marketj is an indicator fordoor-to-door villages, and pricej is the random offer price in door-to-door villages.12 Since theaverage price of transactions between farmers is 12.4 Rs per kg, the coefficient β1 measures theimpact of adding door-to-door sales at a price equivalent to an average network transaction.
The estimates in column 1 of Table 2 show that when holding price constant, the effect of addingthe door-to-door market is an increase in adoption by 33 percentage points. Using the adoption rateof 7% in networks as a baseline, this result indicates that the adoption rate increased by over 450%when adding the door-to-door treatment. Focusing on the ratio of the two estimates in column 1,the price charged in door-to-door sales would need to approximately double to result in the sameadoption rate observed in networks alone. The adoption effect changes little when including controlvariables (column 2). Further, as shown in column 3, the door-to-door sales led to large increasesin adoption at all three price levels, even at the highest price, which is larger than the prices ofalmost all network transactions.
One potential explanation of the low adoption via networks is that exchange tends to be limitedto farmers from the same social groups, effectively crowding out farmers without relationships withsuppliers. I rely on the random selection of suppliers to test whether relationships between buyersand suppliers are more important in networked trade. The estimating equation is
adoptionij =β0 + β1marketj + β2suppliersij + β3degreeij + β4suppliersij ∗marketj (4)
+ β5degreeij ∗marketj + εij ,
where suppliersij is the number of peers of farmer i that were selected as suppliers and degreeij
is the total number of peers of farmer i. Peers are defined using either the baseline social networksurvey, common surnames, or belonging to the same sub-caste. Importantly for identification of β2
and β4, the random introduction of the technology guarantees that the number of suppliers thatare connected to a given farmer is as good as randomly assigned when conditioning on the totalnumber of connections, thus avoiding the classic reflection problem in Manski (1993).
The results in Table 3 show that while stated relationships with suppliers from the baselinesocial network survey have little impact on adoption in both treatments, fixed relationships withsuppliers are indeed significantly more important for obtaining the technology when trading occursin networks. A natural explanation is that farmers have some flexibility to adopt from others thatare not their closest peers, but that establishing a trading link with another farmer from a differentsocial group is too costly. Sharing a surname with a single additional supplier has a negative effecton adoption in door-to-door sales, but the effect is positive and significantly larger in networksalone.13 The magnitude of this difference is large. As an example, using the specification with
12I focus on a binary adoption rate throughout the paper because the amount used is only relevant for a singleyear. After one year, the harvest produced from only 1-2 kg of seed is enough to cultivate the average farmer’s entirelandholdings. The adoption indicator is set to 1 in the case that a farmer adopted from a peer in a market village.
13The estimates with village fixed effects are slightly larger. This likely occurs because the villages with littlevariation in adoption and where most farmers share the same surname receive less weight in the identification. InTable A1 I show that the estimated peer effects are much larger in the sample of villages where there was at least
11

village fixed effects (column 6), having the same surname as a single additional supplier results ina 105% increase in the likelihood of adoption, when holding fixed the total number of farmers inthe village having the same surname. Under the same baseline assumptions, a farmer would needto share the same surname as an additional 4.5 suppliers in order to have the same likelihood ofadopting as when door-to-door sales are available. I obtain similar results in columns 7-9 whenusing sub-castes rather than common surnames.
The estimated effects of relationships with suppliers are robust to two natural alternative es-timation approaches. First, accounting for the dichotomous nature of the dependent variable byusing a probit specification has little impact on the estimates (columns 5 and 6 in Table A1). Sec-ond, an alternative way of measuring relationships with suppliers is to use the share of the totalfarmers in the reference group that were selected as suppliers. As shown in Table A2, using thisapproach actually improves precision of the estimates.
Compared to the existing literature on peer effects, the result that being connected to suppliersinfluences trading opportunities in networks highlights a different mechanism through which peersinfluence behavior. Namely, when products can be directly traded through networks, one may gainaccess to a new product via their peers. The literature on peer effects consistently points to peersas a source of learning about new technologies or products (Foster and Rosenzweig, 1995; Munshi,2004; Bandiera and Rasul, 2006; Kremer and Miguel, 2007; Conley and Udry, 2010; Oster andThornton, 2012; Cai, de Janvry, and Sadoulet, 2012; Bursztyn et al., 2012). In contrast to thislearning channel where peers help to overcome information barriers, the presence of peer effects intrading networks create inefficiencies by limiting trading opportunities.
The results up to this point suggest that trading in social networks is highly restricted bypersonal relationships and that introducing an outside buying opportunity leads to large increasesin adoption. The immediate next question to ask is whether targeting is any more or less effectivein networks.
As a first step in answering this, I use data on flooding during the past five years to generate ameasure of expected returns for each farmer in the sample,
returnij =
15 ∗
Pij∑p=1
2012∑t=2008
R(dijpt) ∗ areaijp
Pij∑p=1
areaijp
. (5)
The term dijpt represents the duration of flooding for farmer i in village j on plot p during year t,Pij is the total number of plots cultivated, and the function R(·) is the expected agronomic returnof Swarna-Sub1, relative to Swarna. I use estimates of R that were generated using data from arandomized experiment carried out in nearby villages during 2011. Specifically, I use nonparametric
one adopter (columns 1 and 2). This is mostly due to very low adoption in one of the three blocks (columns 3 and4). The results are also more similar to fixed effects results when discarding the 5% of observations where over 15 ofthe farmers in the village have the same surname (not shown).
12

estimates of the treatment effect of Swarna-Sub1 as a function of flood duration.14 The densityof estimated returns for the sample of buyers is shown in the left panel of Figure 3. The rightpanel shows the density of deviations between estimated returns and village means. Variation intopography, and hence flood exposure, generates substantial variation in estimated returns bothacross and within villages.15
Using these values of estimated returns, I define two types of targeting errors. First, farmersthat were incorrectly excluded are those with positive expected returns that failed to adopt. Second,inclusion errors are those with zero or negative returns that adopted. Combining both types oferrors, the first specification is
errorij = β0 + β1marketj + β2marketj ∗ (pricej − 12.4) + εij . (6)
By crowding in more farmers, door-to-door sales led to a large decrease in the rate of exclusionerror. As shown in column 1 of Table 4, the probability that any targeting error was made decreasesby 21.2 percentage points when door-to-door sales were offered – an approximate 28% effect. Turn-ing to column 2, the decreased error rate is driven entirely by a lower rate of exclusion error. Giventhe large adoption effect, and that approximately 85% of farmers are expected to benefit from thenew technology, it is not surprising that exclusion errors are reduced. Consistent with the modelwhere door-to-door sales reduce the cost of adoption, the result in column 3 shows that inclusionerrors are also much more likely in villages where door-to-door sales offers were made. This resultcauses the average return of adopters in column 4 to be approximately 18% lower in door-to-doorvillages, although the result is not statistically significant.
Exchange in networks is significantly less likely to result in exclusion errors for farmers that arebetter connected to suppliers. To establish this, Table 5 shows estimates of Equation 6 where theeffect of introducing door-to-door markets depends on the share of a farmer’s peer group that wasselected as suppliers.16 Farmers sharing the same surname with more suppliers are less likely to beincorrectly excluded from adopting from peers, as shown in column 2. The effects of connectionswith suppliers on inclusion error are not statistically significant, but the coefficients are impreciselyestimated (column 3). As shown in columns 4 and 5, similar results are obtained when using sub-caste as a measure of networks. The combined results indicate that exchange in networks limitadoption to farmers that are both connected to suppliers and expected to gain from the technology.
As an additional measure of targeting effectiveness across the entire support of expected returns,Figure 4 shows nonparametric fan regressions of adoption on expected returns. Adoption in bothtreatment arms is positively correlated with expected returns. However, other than for the lowest
14See the middle panel of Figure 1 in Dar et al. (2013b) for the estimates.15One caveat is that this approach measures agronomic returns rather than economic returns. In a recent paper we
show that access to Swarna-Sub1 causes farmers to change several production practices (Dar et al., 2013a), leadingto increases in yield even during years when flooding does not occur. Increases in investment are generally larger forfarmers that have more farmers in their peer group also cultivating the variety. Since networks favor adoption bypeers, one advantage of farmer-to-farmer exchange is that it could facilitate these behavioral changes.
16I use the share of farmers that were suppliers to simplify interpretation.
13

values of estimated returns, the difference in adoption between networks and door-to-door marketsis fairly constant. Following the literature on how people overweight recent events when makingdecisions, Panel B uses the area weighted average flood duration on the farmer’s land during themost recent flood in 2011. Adoption in the door-to-door villages shows a quadratic relationshipwith flood duration, where the maximum adoption occurs around 12 days. This contrasts withnetworks where adoption is not strongly correlated with 2011 flood intensity. The pattern is quiteremarkable given that impact estimates show that agronomic returns during flooding are maximizedat approximately 13 days.
The positive correlation between adoption and estimated returns and the quadratic relationshipbetween adoption and flood intensity in 2011 rule out a story where lack of information drives theresults. If farmers did not understand the benefits of the technology, then there would be no reasonto expect adoption to be highest in areas exposed to heavy flooding. Farmers appear to have used acombination of available information and their past experiences with flooding, particularly during2011, to base adoption decisions.
Regression results in Table 6 confirm that adoption is indeed positively correlated with expectedreturns. The correlation between adoption and expected returns in networks alone is positive, butnot statistically significant (column 1). Two sets of standard errors are used to make statisticalinference. First, OLS standard errors are reported in parentheses. Second, bootstrapped standarderrors that correct for expected returns being a regressor generated from a separate sample arereported in brackets.17 Both sets of standard errors account for clustering at the village level.Returning to the magnitude of the estimates, adding door-to-door sales results in an increase in thecorrelation between returns and adoption, but the interaction term is not statistically significant.However, the results do rule out that the correlation between adoption and returns is larger innetworks. Finally, column 2 verifies that the quadratic relationship between adoption and 2011flood severity is highly statistically significant in door-to-door sales, but not in networks alone.
Taken together, the results on targeting suggest that there is no evidence that targeting wasmore effective in networks. Decreases in inclusion errors were offset by increases in exclusion errors,and the correlation between adoption and returns was no larger in networks. These results areconsistent with the model where returns are uncorrelated with costs of adopting through networks.
4.2 Efficiency Loss
The absence of direct buying opportunities, and thus having to rely on networks to obtain a newtechnology, is inefficient. As a first step in quantifying the magnitude of this inefficiency, I define
17The issue is similar to two sample instrumental variables, where authors have calculated standard errors usingeither the covariance matrix in Murphy and Topel (1985), the delta method, or by bootstrapping (Inoue and Solon,2010). Following Bjorklund and Jantti (1997), I use the bootstrapping method. I draw 200 samples (clustered atthe village level) from both the main estimation sample and the sample in Dar et al. (2013b). For each samplethe nonparametric fan regression relating returns of Swarna-Sub1 to the duration of flooding is re-estimated andexpected returns in the sample drawn from the estimation sample are re-calculated using this new mapping betweenflood duration and estimated returns. I then estimate the regression with these new values of estimated returns.Bootstrapped standard errors for each parameter are calculated as the standard deviations of the 200 estimates.
14

the gain in expected revenue for farmer i as gaini = adoptioni ∗ returni ∗ hectaresi, where returni
is converted to monetary units by multiplying by the government supported output price of 12.5Rs per kg. The total gain in expected revenue is then calculated by summing gaini across farmers.Panel A of Figure 5 shows the aggregate gain in expected revenue achieved in both the treatmentsas well as the most efficient scenario where every farmer with positive expected returns adopts.18
The total gain in expected revenue in the network villages is 23,000 Rs, while the correspondinggain when adding door-to-door sales is 61,700 Rs. Therefore, the efficiency loss due to tradingin networks represents approximately 63% of the aggregate expected returns generated by door-to-door sales. While the allocation achieved by adding door-to-door sales is more efficient, it isstill far from the fully efficient allocation. This is driven by the fact that only 40% of farmersadopt in markets even though almost 86% of farmers are expected to gain from Swarna-Sub1. Notsurprisingly, regardless of the exchange environment, some farmers are likely to wait until additionalinformation about the technology comes available before making adoption decisions.
Due to the large adoption gap, productivity under heavy flooding is expected to be significantlylarger in villages where door-to-door offers were made. I use the regression estimates of yield as afunction of flood duration in Dar et al. (2013b) to calculate expected yields under two scenarios. Inthe first scenario all varieties are fixed at those cultivated by farmers in 2012, while in the second,the farmers that actually adopted Swarna-Sub1 are assumed to cultivate it on all of their land. Inboth scenarios, flood duration is assumed to be equal to the duration of flooding during the mostrecent large flood in 2011. Panel B in Figure 5 shows that introducing Swarna-Sub1 is expected tolead to a 30% increase in average yield in villages with door-to-door buying opportunities and onlya 5% increase when peer networks were the mode of exchange.
4.3 Demand Curve
I next use the random variation in prices across door-to-door villages to more carefully characterizethe demand curve.19 Table 7 displays regression estimates. While the linear demand estimates incolumn 1 imply a demand elasticity of 0.84 when price is 12 Rs per kg, a perfectly inelastic demandcurve can’t be rejected. This results because power is limited to detect price effects because there issignificant clustering in adoption and the number of villages is small.20. The estimated differencesin demand at the lower prices are large, as shown in column 2, but the estimates remain statisticallyimprecise.
Demand is significantly more responsive to price for farmers with larger expected returns.Turning to column 3, the specification includes interaction terms between the two price indicatorsand estimated returns. Door-to-door sales crowd in farmers with the highest expected returns only
18Since cultivated area is not observed for non-adopters, it is imputed with average cultivated area of adopterswhen calculating the aggregate gain in expected revenue for the efficient scenario.
194.5% farmers surveyed in market villages adopted from their peers rather than from the NGO representatives. Itreat these farmers as non-adopters when estimating demand.
20Village-level prices were chosen to avoid perceptions of unfairness and to create a uniform price situation thatmore closely mimics a real market. The loss in power was acceptable since estimates of demand were of secondaryinterest.
15

when prices are low. The increase in adoption induced by a decrease in price from 14 to 10 isexpected to be higher by 16.8 percentage points when estimated returns are at the 75th percentileas compared to when returns are zero. The order of magnitude is similar for a decrease in pricefrom 14 to 12, suggesting that demand at low prices is fairly inelastic across the entire population.The intuition of this finding is that if returns are sufficiently low, then decreasing price does littleto induce adoption because there are few farmers that were close to adopting at the higher price.If returns are higher, then decreasing price crowds in more farmers because there are more farmersfor which adoption was nearly profitable at the higher price.21
The policy implication of this finding is that small subsidies of this technology may not inducesharp increases in demand by farmers with low benefits. One argument against using subsidies toinduce adoption of a technology is that low prices will induce adoption by people with low benefits.Antimalarial drugs are an example where heavy subsidies result in high adoption by people withlow benefits and therefore potentially reduce the overall effect of the drugs due to resistance andlearning externalities (Cohen, Dupas, and Schaner, 2013). My results indicate that a small changefrom a high to more moderate price will achieve the desirable policy outcome of increasing adoptionsignificantly more for farmers with higher expected returns.
5 Why is exchange in networks inefficient?
Trading in social networks is inefficient. I next show additional analysis consistent with this beingexplained by trading links not being made across peer groups. I also present results that rule outseveral alternative explanations of the findings.
5.1 Failed Network Adjustment
Evidence from the endline survey with suppliers points to failure of buyers to effectively link withsuppliers as an explanation of the inefficiency of networked trade. As displayed in Figure A2, themost popular reason given by suppliers for not selling or exchanging seeds is that nobody asked.Two candidate explanations are (1) networks failed to disseminate information on who supplierswere and (2) farmers knew the identities of suppliers, but chose not to incur the costs of establishinglinks. The first explanation is unlikely because suppliers were publicly identified at the beginningof the experiment when minikits were disseminated via lottery.
Amongst suppliers that traded seeds, most suppliers identified trading partners as being closefamily and friends. Specifically, 63% and 39% report that trading partners were close friendsand close family, respectively. These responses are consistent with the results in Table 3 showingthat trading in networks is strongly limited to pairs of farmers that have strong connections.Interestingly, suppliers clearly expected buyers to initiate trades: only 8% of suppliers reportedactively seeking buyers.
21The quadratic relationship between adoption and 2011 flood intensity is also much more prevalent at low prices(see Figure A1).
16

In addition to the survey evidence from suppliers, followup social network data indicate thatwhile suppliers did become more central in the network, this is almost entirely due to additionalstated links with other suppliers. To establish increased importance of suppliers, I estimate
degreeij = β0 + β1supplierij + β2baselinedegreeij + xijδ + αj + εij , (7)
where degreeij is the degree of farmer i in village j during the follow-up survey, supplierij is anindicator for suppliers, and xij is a vector of control variables. Regression results are reportedin Table 8. In columns 1 and 2 degree is measured as the total number of links, regardless ofwhich farmer reported the link. Being randomly selected as a supplier of the technology leadsto one additional sharing link, which represents an approximate 14% increase. Columns 3 and 4show that increases in in-degree – the number of links reported by other farmers – account forapproximately half of this effect.
While the increases in degree of suppliers suggest that there was at least some change in statednetwork relationships, this alone is not enough to create opportunities for trade. The new linksmust be between buyers and suppliers in order to facilitate trade. To investigate whether newlinks were concentrated between buyers and suppliers, I use a dyadic regression model of networkformation. The baseline specification is
linkikj = β0 + β1onesupplierikj + β2twosupplierikj + αj + εikj , (8)
where onesupplierikj and twosupplierikj are indicators for buyer-supplier and supplier-supplierdyads, respectively.22 If new connections between buyers and suppliers are driving the increaseddegree of suppliers, then β1 should be positive and large. Column 1 of Table 9 shows that most ofthe increase in the degree of suppliers is due to links between suppliers, not links between buyersand suppliers. Specifically, two farmers that were both selected as suppliers are 18.2 percentagepoints – or 48% – more likely to report being linked. An intuitive explanation for the result is thatfarmers cultivating the same variety are more likely to go to each other for sharing information,inputs, or even seeds. Conversely, the effect of one farmer in the dyad being a supplier is small andnot statistically significant. The effect is however slightly larger in the subset of farmers where plotcoordinates were taken (column 2), likely because coordinates were not taken for suppliers that didnot cultivate the new variety.
Homophily – the tendency of farmers to interact with other farmers having similar characteristics– is present in the data. An implication of homophily in this context is that it limits trading tofarmers in the same peer group. Turning to the coefficient estimates, farmers belonging to the same
22The symmetry requirement of dyadic regressions with undirected networks is met by definition since wikj = wkij
for all i 6= k (Fafchamps and Gubert, 2007). Standard errors in dyadic regressions must be adjusted for correlationof error terms across observations. Observations in the same dyad are obviously correlated, leading to artificiallylow OLS standard errors. Fafchamps and Gubert (2007) propose a covariance matrix that corrects for correlatedobservations within dyads. I instead cluster the standard errors at the village level, an approach that is taken inAttanasio et al. (2012). The advantage gained from this approach is that standard errors are robust to arbitrarycorrelation of error terms between dyads in the same village.
17

sub-caste are 3.5 percentage points – or 9% – more likely to be linked. Similarly, farmers sharingthe same surname are 12.2 percentage points – or 32% – more likely to be linked.23 As shownin Table A4, there is significant correlation between common surnames, sub-caste association,and geographic proximity. Overall, networks in the sample are formed according to all of thesecharacteristics.
Taken together, the results suggest that network structure did not adjust in a way that facilitatedexchange. Rather, farmers tended to exchange with close family and friends, preventing spread ofthe technology outside of these groups.
5.2 Supply effects and prices
One different interpretation of the increased adoption in door-to-door sales is that the quantity ofseeds available to suppliers was insufficient to meet demand. If scarcity caused low adoption innetworks, then having access to door-to-door sales would naturally lead to increased adoption.
The experiment was designed specifically to avoid any effects of scarcity. While only 25 kgof seed were initially provided to suppliers, the average quantity produced with this amount wasapproximately 1.8 tons – an amount sufficient to meet demand of approximately 180 farmers. Asverification, Figure 6 shows the distribution of the differences between the harvest of suppliersduring the first year and the total amount planted in the village after door-to-door sales weremade. The total amount planted by all farmers – including suppliers and other farmers outsidethe sample – was smaller than the harvest of suppliers in 40 of the 41 villages where door-to-doorsales were made. In other words, the door-to-door sales did not increase supply above an amountthat could have been met by suppliers. On average, the excess amount was far greater than zero,demonstrating that seed availability can not explain the results.
The value of output to suppliers under alternative uses was lower than prices where farmerswere shown to be willing to purchase seeds. In addition to being used as seeds, the harvest couldbe consumed or sold as grain for consumption. Since the eating quality of Swarna-Sub1 is identicalto Swarna, and the average output price amongst farmers selling for consumption was 10.4 Rs perkg, the most efficient use of output would be use as seed by other farmers. Given that significantdemand exists at prices above 10.4, and that suppliers had more than enough output to meet thisdemand, the most efficient allocation would involve transfers to other farmers. These transfers weresimply not made.
Price differences can not explain the results. In short, the technology was not under-priced indoor-to-door sales. The price interval from 10 to 14 Rs covers the range of prices for transactionsbetween farmers. Using the government’s minimum support price of 12.5 Rs per kg as a conservativeestimate of the price for direct exchanges, the average price of the technology across all sales andexchanges was 12.4 Rs. Since this value falls in the middle of the range of prices charged in door-to-door sales, the analysis was structured to hold prices fixed at the average price of exchanges innetworks. Further, there is still significant demand at prices above this average value, suggesting
23Similar results were found in network data from southern India (Maertens and Barrett, 2012)
18

that welfare could have been improved if these transactions were made.
5.3 Selection of Suppliers
A possible explanation of the results is that adoption is low in network villages because random-ization was a poor strategy for selecting suppliers. A different method commonly used by NGO’swould involve a more targeted approach of selecting the most “progressive” or “lead” farmers asinitial users of the new technology. In theory, this could result in greater diffusion if the morecentral farmers are either better at demonstrating the technology or if other farmers look to themfor the best varieties to cultivate.
Importantly, I can exploit the random selection of suppliers to investigate whether tradingin networks is more effective when suppliers are relatively more important, where importance isdefined by average degree. I partition villages into two groups according to the ratio of the averagedegree of suppliers to that of buyers. Villages where suppliers are more central are defined as thosewhere this ratio is greater than the sample median.24 The regression specification is
adoptionij = β0 + β1marketj + β2importantj + β3marketj ∗ importantj + xijδ + εij , (9)
where importantj is an indicator for villages where suppliers were relatively more important thanbuyers.25
The data rule out that networks were more effective at diffusing the technology when suppli-ers were more central. Focusing on column 1 of Table 10, the adoption rate in networks was 4.7percentage points lower when suppliers were relatively more important. While the estimated coef-ficient is not statistically significant, large positive effects of importance of suppliers can effectivelybe ruled out, suggesting that the inefficiency of networked trade is not due to the nonstrategic wayin which suppliers were selected.26 The results in column 2 show that there is no evidence thattrading in networks was more effective at increasing adoption when suppliers were relatively largerfarmers.
Adding the door-to-door buying opportunity, however, led to larger increases in adoption whensuppliers were more important. Returning to column 1, the predicted increase in adoption fromadding door-to-door sales is 26 percentage points when suppliers are less important and 41 per-centage points when suppliers are relatively more important. This approximate 60% increase inthe effect is statistically significant at the 10% level. One plausible explanation is that farmers dolearn effectively from the most central farmers in the village, but that costs of exchanging with
24Randomization of village-level treatment was stratified by the degree ratio for purposes of investigating hetero-geneity with respect to importance of suppliers. Using the ratio of average degrees carries one additional advantagesince the social network in each village was only partially sampled. Chandrasekhar and Lewis (2011) show that thebias in average degree due to partial sampling of network data is proportional to the sampling rate. Using the ratioof average degrees should therefore minimize concerns regarding biases.
25The specification uses block fixed effects rather than strata fixed effects because randomization was stratified byblock and the relative importance of suppliers.
26The 95% confidence interval for β2 is (-0.122,0.028).
19

other farmers prevent physical transactions from taking place.
5.4 Quality Differences
Seed quality is the only potential product attribute that could have varied between the two treat-ments. The seeds that were exchanged between farmers were second generation, i.e. output fromthe 2012 harvest, while the seeds sold in door-to-door sales were purchased for the purposes of theexperiment from a private seed company in a neighboring state. If farmers fail to produce qualityseeds, this could potentially explain low adoption in peer-to-peer networks.27 Descriptively, 16% ofsuppliers reported that seed quality was the reason they chose not to exchange with others (FigureA2).28
I use two proxy measures for quality preferences to investigate whether networks only crowd outfarmers with stronger preferences for quality seeds. First, approximately 42% of farmers purchasedcertified seeds from local government offices for the 2012 season.29 Farmers that bought certifiedseeds likely value seed quality more than those using output from their own harvests. As a secondmeasure, I use responses to a question asking whether more Swarna-Sub1 seeds would hypotheticallybe purchased when certified seeds are available at local government offices as compared to whenseeds are only available from other villagers. I define those who indicated that a larger quantityof certified seeds would be procured as having a preference for seed quality. This group representsapproximately half of the sample. If quality explains the results, then networks should crowd outfarmers with preferences for higher quality seeds.
There is no evidence that exchange in networks differentially crowded out farmers that preferredquality seeds. Table A6 shows that the correlation between the two measures of quality preferenceand adoption in networks is small and statistically insignificant. Further, adding door-to-door salesdid not lead to significantly larger increases in adoption for these farmers. Overall, the resultsprovide suggestive evidence that differential seed quality does not explain the results.
5.5 Risk preferences
My approach to measuring efficiency uses gains in expected revenue rather than gains in expectedutility. This could complicate interpretation if farmers in flood-prone areas are less risk averse. Inthis case, the most efficient allocation in terms of utility could vary from the that using expectedgains in revenue.
There is no evidence that the least risk averse are those with the highest expected returns. Toestablish this, I use risk preferences that were elicited by asking farmers to select from a set of
27As an example, if seed is stored without proper drying, then germination ability and vigor of seedlings arenegatively affected. Other practices that farmers can do to improve seed quality and purity are hand sorting toremove weeds and seeds of other varieties, winnowing to remove empty grains and chaff, and careful storage to avoidmoisture absorption and damage by pests.
28Common reasons for poor seed quality were that drought affected production, seeds became wet during harvesting,and that Swarna-Sub1 was mixed with other rice varieties after harvesting.
29Seeds that are certified are produced following certain guidelines that ensure purity and higher quality.
20

hypothetical lotteries, where the expected value of each lottery was positively correlated with itsvariance.30 I use the responses to this question to define the highly risk averse as the farmers thatchose the sure option over any lottery with a positive variance. Regression results (not shown)indicate that high risk aversion is positively correlated with the measure of expected returns. Ex-pected returns are on average larger by 30% for the highly risk averse and the estimated differenceis highly statistically significant (p<0.001). This result goes against the argument that the leastrisk averse select into cultivation of flood-prone plots.
5.6 Heterogeneity
Are there some groups that benefit more from having a door-to-door buying opportunity, or is theincrease in adoption similar across the population of farmers? Table A5 investigates heterogeneityaccording to several household characteristics.
The increase in adoption from adding door-to-door sales is smaller for lower caste (SC) farmers,smaller for the better educated, but larger for those cultivating the variety that is otherwise iden-tical to Swarna-Sub1. While the differential effect for SC farmers is difficult to interpret becausecaste status is assuredly correlated with other factors, one plausible explanation is that liquid-ity constraints are more binding for lower caste farmers, making cash transactions less feasible.One implication of this result is that introducing door-to-door sales increases efficiency, but hasa smaller effect on equity because lower caste farmers rely less on formal cash transactions. Anaffirmative action policy that introduces more formal markets at the same time as favoring SC’sin seed distribution could limit the negative effects on equity because the SC’s would benefit morefrom peer-to-peer exchange if more of the initial adopters came from their caste group.
Combining all results on possible explanations of the inefficiency of trading in networks, the lackof strong evidence for any of the alternative explanations, combined with the strong peer effects innetworks, suggest that large costs of exchanging with farmers from other social groups drive theinefficiency of networked trade. An equivalent interpretation is that homophily – the concentrationof links amongst similar individuals – leads to exchange being limited to these groups, and thushas negative implications for efficiency of trade via networks.
6 Conclusions
Many products are exchanged directly between individuals that are connected in networks. Putdifferently, not all goods and services change hands in the textbook marketplace where the iden-tities of buyers and sellers are irrelevant. This paper used a randomized experiment with a newagricultural technology in India to shed light on whether a system of exchanging the technologyvia networks is equally efficient to an approach where demand was revealed via door-to-door sales.The theoretical motivation for the question is transaction costs. Links between buyers and sellers
30This question was administered as part of the pre-intervention survey with buyers during February 2013. Thelotteries were coin flips with the following results: 30-30, 25-50, 20-70, 15-90, 10-110, 5-130, 0-150.
21

are needed for transactions to take place in networks. If transacting with people from other so-cial groups is costly, then it is theoretically ambiguous as to whether buyers and sellers will cometogether to make transactions.
The results indicate strongly that trading in networks is inefficient. The rate of adoptionof the technology was lower by 83% in networks. Trading patterns showed strong peer effectswhen exchange occurred in networks. A farmer with a single additional supplier belonging to hersub-caste was approximately 50% more likely to adopt the technology when trading occurred innetworks. Similarly, a farmer with one additional supplier having her surname was over twice aslikely to adopt from peers. In contrast, being connected to suppliers did not have a positive effecton adoption in villages where farmers had the opportunity to purchase in door-to-door markets.Targeting was also no more effective in social networks. That is, any gains from excluding farmerswith zero returns were offset by exclusion of farmers with positive returns. In summary, the largedecrease in adoption, combined with the lack of improved targeting, cause the efficiency loss ofnetworked trade to represent over 60% of the gains from exchange when door-to-door sales weremade.
An important policy implication of the results is that the network approach may be practicallydesirable, but it is inefficient. Introducing new seed varieties and relying on social networks fordiffusion seems desirable in practice because it is an extremely low cost approach to diffusing a newtechnology. If the allocation achieved by exchange in networks is efficient, then networks could berelied upon as a highly sustainable method of ensuring efficient spread of technologies, particularlyin the absence of anonymous markets. In terms of agricultural seed varieties, informal exchangebetween peers is the status quo in many remote areas of South Asia where formal markets for seedsare absent. Introducing more formal buying opportunities can increase access and thus lead toincreases in efficiency.
The paper also makes a broader contribution to the empirical literature on networked markets.Past theoretical work on transactions in networks has considered numerous topics such as bargainingbetween connected agents, the importance of intermediaries in facilitating transactions, the effects ofnetwork structure on outcomes, and whether agents can make the connections needed for exchangeto occur. This large theoretical literature has generally not been accompanied by experimentaltests, especially outside of the lab environment (Jackson and Zenou, 2013). The results presentedhere make a contribution in this direction by being one of the first to use a field experiment to testthe efficiency of an extremely common mode of exchange. In doing so, the experiment serves asa test of competing theories of networked markets. The results are most consistent with a modelwhere costs of exchange create frictions that prevent efficiency (Elliott, 2013).
One caveat of the results is that the experiment was carried out only over a single year, andthus the results have little to say about the ability of social networks to allocate the technologyover a longer time horizon. Nonetheless, in an environment where farmers commonly learn aboutthe benefits of new technologies from each other, there are clear benefits of having the technologydemonstrated in a wide variety of conditions during the initial years. Further, meeting the Indian
22

government’s goal of achieving widespread adoption of Swarna-Sub1 in a short time period requiresrapid early take-up. My results suggest that taking a hands off approach by relying on trading innetworks will result in a far less efficient initial allocation of this promising new technology.
23

References
Aoki, Masahiko and Yujiro Hayami. 2001. Communities and markets in economic development.Oxford university press.
Attanasio, O., A. Barr, J.C. Cardenas, G. Genicot, and C. Meghir. 2012. “Risk pooling, riskpreferences, and social networks.” American Economic Journal: Applied Economics 4 (2):134–167.
Bailey-Serres, J., T. Fukao, P. Ronald, A. Ismail, S. Heuer, and D. Mackill. 2010. “Submergencetolerant rice: SUB1’s journey from landrace to modern cultivar.” Rice 3 (2):138–147.
Bandiera, O. and I. Rasul. 2006. “Social networks and technology adoption in northern Mozam-bique.” The Economic Journal 116 (514):869–902.
Bardhan, P. and D. Mookherjee. 2011. “Subsidized Farm Input Programs and Agricultural Per-formance: A Farm-Level Analysis of West Bengal’s Green Revolution, 1982-1995.” AmericanEconomic Journal: Applied Economics 3 (4):186–214.
Bjorklund, Anders and Markus Jantti. 1997. “Intergenerational income mobility in Sweden com-pared to the United States.” The American Economic Review 87 (5):1009–1018.
Bursztyn, Leonardo, Florian Ederer, Bruno Ferman, and Noam Yuchtman. 2012. “Understandingpeer effects in financial decisions: Evidence from a field experiment.” NBER Working Paper.
Cai, Jing, A. de Janvry, and E. Sadoulet. 2012. “Social Networks and the Decision to Insure:Evidence from Randomized Experiments in China.” Working Paper.
Chandrasekhar, Arun G and Randall Lewis. 2011. “Econometrics of sampled networks.” WorkingPaper.
Charness, G., M. Corominas-Bosch, and G.R. Frechette. 2007. “Bargaining and network structure:An experiment.” Journal of Economic Theory 136 (1):28–65.
Cohen, Jessica, Pascaline Dupas, and Simone G Schaner. 2013. “Price subsidies, diagnostic tests,and targeting of malaria treatment: Evidence from a randomized controlled trial.” NBER Work-ing Paper.
Conley, T.G. and C.R. Udry. 2010. “Learning about a new technology: Pineapple in Ghana.” TheAmerican Economic Review 100 (1):35–69.
Dar, MH., A. de Janvry, K. Emerick, D. Raitzer, and E. Sadoulet. 2013a. “A Flood of Investments:Flood-Tolerant Rice and Farm Investment in India.” Working Paper.
———. 2013b. “Flood-tolerant rice expected to decrease yield variability, especially for sociallydisadvantaged groups.” Working Paper.
24

Elliott, Matthew. 2013. “Inefficiencies in networked markets.” Working Paper.
Fafchamps, M. and F. Gubert. 2007. “The formation of risk sharing networks.” Journal of Devel-opment Economics 83 (2):326–350.
Fafchamps, M. and S. Lund. 2003. “Risk-sharing networks in rural Philippines.” Journal of Devel-opment Economics 71 (2):261–287.
Fogli, Alessandra and Laura Veldkamp. 2012. “Germs, social networks and growth.” NBER Work-ing Paper.
Foster, A.D. and M.R. Rosenzweig. 1995. “Learning by doing and learning from others: Humancapital and technical change in agriculture.” Journal of Political Economy :1176–1209.
Gale, D.M. and S. Kariv. 2009. “Trading in networks: A normal form game experiment.” AmericanEconomic Journal: Microeconomics :114–132.
Inoue, Atsushi and Gary Solon. 2010. “Two-sample instrumental variables estimators.” The Reviewof Economics and Statistics 92 (3):557–561.
Jackson, Matthew and Yves Zenou. 2013. “Games on networks.” forthcoming, Handbook of GameTheory .
Jackson, Matthew O. 2009. “Networks and economic behavior.” Annu. Rev. Econ. 1 (1):489–511.
Kranton, Rachel E. 1996. “Reciprocal exchange: A self-sustaining system.” The American Eco-nomic Review :830–851.
Kranton, R.E. and D.F. Minehart. 2001. “A theory of buyer-seller networks.” The AmericanEconomic Review :485–508.
Kremer, M. and E. Miguel. 2007. “The Illusion of Sustainability.” The Quarterly Journal ofEconomics 122 (3):1007–1065.
Maertens, Annemie and Christopher Barrett. 2012. “Measuring Social Networks Effects on Agri-cultural Technology Adoption.” American Journal of Agricultural Economics 95 (2):353–359.
Manski, C.F. 1993. “Identification of endogenous social effects: The reflection problem.” TheReview of Economic Studies 60 (3):531–542.
Munshi, K. 2004. “Social learning in a heterogeneous population: technology diffusion in the IndianGreen Revolution.” Journal of Development Economics 73 (1):185–213.
Murphy, Kevin M and Robert H Topel. 1985. “Estimation and inference in two-step econometricmodels.” Journal of Business & Economic Statistics 3 (4):88–97.
25

Nishiguchi, Toshihiro. 1994. Strategic industrial sourcing: The Japanese advantage. Oxford Uni-versity Press, USA.
Oster, E. and R. Thornton. 2012. “Determinants of technology adoption: Peer effects in menstrualcup take-up.” Journal of the European Economic Association 10 (6):1263–1293.
Singh, S., D.J. Mackill, and A.M. Ismail. 2009. “Responses of SUB1 rice introgression lines tosubmergence in the field: yield and grain quality.” Field Crops Research 113 (1):12–23.
Vignes, A. and J.M. Etienne. 2011. “Price formation on the Marseille fish market: Evidence froma network analysis.” Journal of Economic Behavior & Organization .
Xu, K., X. Xu, T. Fukao, P. Canlas, R. Maghirang-Rodriguez, S. Heuer, A.M. Ismail, J. Bailey-Serres, P.C. Ronald, and D.J. Mackill. 2006. “Sub1A is an ethylene-response-factor-like genethat confers submergence tolerance to rice.” Nature 442 (7103):705–708.
26

Tables and Figures
Figure 1: Location of villages in Bhadrak district
#
##
#
#
#
#
#
#
#
#
#
#
#
#
# #
#
#
#
#
#
#
#
#
#
#
#
#
##
#
#
#
##
#
##
#
! !
!!
!!
!
!!
!
!
!
!
!!
!
!
!
!
!
!
!
!
!
!!
!
!
!
!
!
!
!
!!
!
!
!
!
!
!
! Network# Market
Rivers
Bay of Bengal
0 10 205 km
India
27

Table 1: Summary Statistics(1) (2) (3)
Buyer/Network Supplier/Market p-value: (1)-(2)
Panel A: Farmer Level Statistics (N=1584)
Rice acres in Kharif 2011 3.88 3.80 0.53
Acres flooded 4 days or less in Kharif 2011 1.25 1.25 0.94
Acres flooded 5 days or more in Kharif 2011 2.63 2.56 0.52
Acres grown with Swarna in Kharif 2011 1.95 1.88 0.34
Farmer is SC 0.20 0.18 0.46
Age of farmer 48.96 49.07 0.86
Farmer is lead farmer 0.09 0.11 0.29
Information degree 4.89 5.02 0.40
Sharing degree 4.19 4.37 0.21
Information in-degree 2.31 2.44 0.36
Sharing in-degree 1.94 2.16 0.08∗
Panel B: Village Level Statistics (N=82)
Total households 149.68 180.60 0.26
Total cultivators 89.41 117.33 0.13
Total Ag. laborers 46.80 55.42 0.46
Persons per household 5.84 5.90 0.64
Share SC 0.21 0.17 0.29
Literacy Rate 0.63 0.65 0.26
Approximate elevation (m) 5.29 4.28 0.19
Share of farmers not cultivating minikit 0.11 0.14 0.54
Estimated village harvest of Swarna-Sub1 1647.71 2066.22 0.20
Asterisks indicate statistical significance at the 1% ∗∗∗, 5% ∗∗, and 10% ∗ levels. Column 1 in Panel A is for buyers.Column 2 in Panel A is for suppliers. Column 1 in Panel B is for network villages, while column 2 in Panel B is forvillages where door-to-door sales were made. All farmer level statistics are from the baseline survey in May-June2012. Information degree is the number of links (undirected) where a link occurs if either farmer lists the otherfarmer as somebody with which they talk about rice farming. Sharing degree is the number of links (undirected)where a link occurs if either farmer lists the other farmer as somebody with which they would go to if they neededseeds, fertilizers, or other inputs. Information in-degree is the number of other farmers in the village naming thisfarmer as an information contact. Sharing in-degree is equally defined for sharing seeds, fertilizers, or other inputs.The first six village level variables are from the 2001 census. Approximate elevation is calculated at the center ofthe village using SRTM global elevation layer (resolution 250m). The share of farmers not cultivating the minikitand the estimated village harvest of Swarna-Sub1 are taken from the November-December 2012 follow-up withoriginal recipients.
28

Figure 2: A Sample Network
Notes: Figure displays a network diagram for one of the 82 sample villages. Dots (nodes) represent individualfarmers and edges (lines) represent connections, where connections are assumed if the farmers share a commonsurname. Nodes shaded in blue are farmers that were randomly selected as suppliers.
29

Table 2: Effect of adding door-to-door buying opportunity on technology adoption(1) (2) (3)
Market Treatment 0.327∗∗∗ 0.328∗∗∗
(0.042) (0.041)
Market -0.026 -0.026Treatment*(Price-12.4) (0.024) (0.024)
Farmer is SC -0.058 -0.057(0.041) (0.040)
Farmer has BPL card -0.056∗ -0.056∗
(0.031) (0.030)
Land cultivated in 0.005 0.0052012 (0.007) (0.007)
Ag. cooperative -0.019 -0.019member (0.023) (0.023)
Swarna user in 2012 0.087∗∗∗ 0.086∗∗∗
(0.033) (0.032)
Market and Price=10 0.385∗∗∗
(0.078)
Market and Price=12 0.351∗∗∗
(0.067)
Market and Price=14 0.280∗∗∗
(0.059)
Strata Fixed Effects Yes Yes Yes
Mean of Dep Variable: Network 0.07 0.07 0.07Number of Observations 1150 1134 1134R squared 0.190 0.208 0.209
Dependent variable is 1 if farmer adopted Swarna-Sub1 for 2013 wet season. Market Treatment is 1 for villageswhere farmers could either obtain the technology from door-to-door sales or from peer suppliers. Standard errorsare clustered at the village level. Asterisks indicate statistical significance at the 1% ∗∗∗, 5% ∗∗, and 10% ∗ levels.
30

Tab
le3:
Effe
cts
ofso
cial
rela
tion
ship
sw
ith
supp
liers
onte
chno
logy
adop
tion
(1)
(2)
(3)
(4)
(5)
(6)
(7)
(8)
(9)
Mark
etT
reatm
ent
0.3
46∗∗
∗0.3
41∗∗
∗0.3
32∗∗
∗0.3
27∗∗
∗0.3
67∗∗
∗0.3
62∗∗
∗
(0.0
68)
(0.0
67)
(0.0
56)
(0.0
55)
(0.0
65)
(0.0
62)
Mark
etT
reatm
ent
*0.0
02
-0.0
00
-0.0
26
Base
lin
elin
ks
wit
hsu
pp
lier
s(0
.033)
(0.0
33)
(0.0
31)
Mark
etT
reatm
ent
*-0
.003
-0.0
01
-0.0
02
Base
lin
ed
egre
e(0
.016)
(0.0
16)
(0.0
13)
Base
lin
elin
ks
wit
h-0
.007
-0.0
06
-0.0
04
sup
plier
s(0
.011)
(0.0
12)
(0.0
13)
Base
lin
ed
egre
e0.0
05
0.0
03
0.0
03
(0.0
08)
(0.0
08)
(0.0
07)
Mark
etT
reatm
ent
*-0
.075∗
-0.0
72∗
-0.1
09∗∗
Nu
mb
ersu
pp
lier
sw
/sa
me
surn
am
e(0
.043)
(0.0
42)
(0.0
45)
Mark
etT
reatm
ent
*0.0
21
0.0
20
0.0
35∗∗
Tota
lnu
mb
erw
/sa
me
surn
am
e(0
.014)
(0.0
14)
(0.0
14)
Nu
mb
ersu
pp
lier
sw
/0.0
35
0.0
27
0.0
74∗∗
sam
esu
rnam
e(0
.026)
(0.0
27)
(0.0
32)
Tota
lnu
mb
erw
/sa
me
-0.0
08
-0.0
04
-0.0
23∗∗
surn
am
e(0
.008)
(0.0
09)
(0.0
09)
Mark
etT
reatm
ent
*-0
.056∗
-0.0
58∗
-0.0
53
Nu
mb
ersu
pp
lier
ssa
me
sub
-cast
e(0
.030)
(0.0
30)
(0.0
36)
Mark
etT
reatm
ent
*0.0
11
0.0
11
0.0
14
Tota
lnu
mb
ersa
me
sub
-cast
e(0
.009)
(0.0
10)
(0.0
10)
Nu
mb
ersu
pp
lier
s0.0
40∗
0.0
24
0.0
37∗
sam
esu
b-c
ast
e(0
.021)
(0.0
23)
(0.0
21)
Tota
lnu
mb
ersa
me
-0.0
10
-0.0
07
-0.0
11
sub
-cast
e(0
.007)
(0.0
08)
(0.0
07)
Str
ata
Fix
edE
ffec
tsY
esY
esN
oY
esY
esN
oY
esY
esN
o
Villa
ge
Fix
edE
ffec
tsN
oN
oY
esN
oN
oY
esN
oN
oY
es
Hou
seh
old
contr
ols
No
Yes
Yes
No
Yes
Yes
No
Yes
Yes
Mea
nof
Dep
Vari
ab
le:
Net
work
0.0
70.0
70.0
70.0
70.0
70.0
70.0
70.0
70.0
7N
um
ber
of
Ob
serv
ati
on
s1148
1132
1132
1135
1134
1134
1135
1134
1134
Rsq
uare
d0.1
85
0.2
03
0.4
13
0.1
91
0.2
09
0.4
19
0.1
92
0.2
10
0.4
13
Dep
enden
tva
riable
is1
iffa
rmer
adopte
dSw
arn
a-S
ub1
for
2013
wet
seaso
n.
Mark
etTre
atm
ent
is1
for
villa
ges
wher
efa
rmer
sco
uld
eith
erobta
inth
ete
chnolo
gy
from
door-
to-d
oor
sale
sor
from
pee
rsu
pplier
sC
ontr
ol
vari
able
sare
indic
ato
rfo
rSC
,in
dic
ato
rfo
rhold
ing
BP
Lca
rd,
land
are
acu
ltiv
ate
din
2012
wet
seaso
n,
indic
ato
rfo
rm
emb
erof
agri
cult
ura
lco
op
erati
ve,
and
indic
ato
rfo
rSw
arn
acu
ltiv
ato
rin
2012
wet
seaso
n.
Sta
ndard
erro
rsare
clust
ered
at
the
villa
ge
level
.A
ster
isks
indic
ate
stati
stic
al
signifi
cance
at
the
1%
∗∗∗,
5%
∗∗,
and
10%
∗le
vel
s.
31

Figure 3: Distribution of expected returns of Swarna-Sub1
0.1
.2.3
.4D
ensi
ty
-2 0 2 4Estimated return (100kg/ha)
a
0.1
.2.3
.4D
ensi
ty-3 -2 -1 0 1 2Deviation between estimated return and village mean
b
Notes: Figure shows densities of raw estimated returns (Panel A) and deviations between estimated returns andvillage averages (Panel B). Plot-level recall on flood duration and impact estimates in Dar et al. (2013b) were usedto calculate expected returns for each farmer in the sample. The only source of variation in expected returns usingthis methodology is exposure of the farmers’ land to flooding.
32

Table 4: Differential targeting effectiveness of social networks and door-to-door sales(1) (2) (3) (4)
Any error Exclusion Inclusion Average Return
Market Treatment -0.212∗∗∗ -0.317∗∗∗ 0.292∗∗∗ -0.313(0.047) (0.044) (0.089) (0.257)
Market 0.019 0.026 -0.026 -0.062Treatment*(Price-12.4) (0.019) (0.023) (0.056) (0.067)
Strata Fixed Effects Yes Yes Yes Yes
Mean of Dep Variable: Network 0.766 0.916 0.040 1.742Number of Observations 1145 961 184 266R squared 0.094 0.182 0.195 0.096
Dependent variable in column 1 is equal to 1 if any error in targeting was made (either exclusion of farmers withpositive expected returns or inclusion of farmers with negative expected returns). Column 2 limits to the sample offarmers with positive expected returns and looks at exclusion error. Column 3 limits to farmers with negativeexpected returns and considers inclusion error. The dependent variable in column 4 is average expectedreturns.Market Treatment is 1 for villages where farmers could either obtain the technology from door-to-door salesor from peer suppliers. Standard errors are clustered at the village level. Asterisks indicate statistical significance atthe 1% ∗∗∗, 5% ∗∗, and 10% ∗ levels.
33

Tab
le5:
Het
erog
enei
tyin
diffe
rent
ial
targ
etin
geff
ecti
vene
ssof
soci
alne
twor
ksan
ddo
or-t
o-do
orsa
les
(1)
(2)
(3)
(4)
(5)
(6)
Any
erro
rE
xcl
usi
on
Incl
usi
on
Any
erro
rE
xcl
usi
on
Incl
usi
on
Mark
etT
reatm
ent
-0.2
84∗∗
∗-0
.423∗∗
∗0.3
32∗∗
∗-0
.289∗∗
∗-0
.428∗∗
∗0.3
85∗∗
∗
(0.0
64)
(0.0
53)
(0.0
94)
(0.0
64)
(0.0
60)
(0.1
17)
Share
of
sam
e-0
.143
-0.2
27∗∗
0.0
71
surn
am
eth
at
are
supplier
s(0
.120)
(0.0
94)
(0.1
23)
Mark
et0.3
00∗
0.4
10∗∗
∗-0
.116
Tre
atm
ent*
Share
of
sam
esu
rnam
eth
at
are
supplier
s(0
.154)
(0.1
32)
(0.2
64)
Share
of
sam
e-0
.122
-0.1
91∗∗
-0.0
68
sub-c
ast
eth
at
are
supplier
s(0
.096)
(0.0
86)
(0.1
37)
Mark
et0.2
90∗
0.4
29∗∗
-0.3
55
Tre
atm
ent*
Share
of
sam
esu
b-c
ast
eth
at
are
supplier
s(0
.171)
(0.1
77)
(0.4
05)
Str
ata
Fix
edE
ffec
tsY
esY
esY
esY
esY
esY
es
Mea
nof
Dep
Vari
able
:N
etw
ork
0.7
66
0.9
14
0.0
46
0.7
68
0.9
15
0.0
44
Num
ber
of
Obse
rvati
ons
1019
856
163
1066
893
173
Rsq
uare
d0.1
03
0.1
98
0.2
13
0.1
04
0.1
98
0.2
40
All
effec
tsre
port
edin
the
table
are
at
apri
ceof
12.4
Rs
per
kg.
That
is,
regre
ssio
ns
inco
lum
ns
1-3
incl
udeMarketTreatment∗
(Price−
12.4
)and
MarketTreatment∗
(Price−
12.4
)∗Share
ofsa
me
surn
am
eth
atare
supplier
s.Sim
ilarl
ydefi
ned
vari
able
sfo
rsu
b-c
ast
eare
incl
uded
inco
lum
ns
4-6
.Dep
enden
tva
riable
inco
lum
ns
1and
4is
equal
to1
ifany
erro
rin
targ
etin
gw
as
made
(eit
her
excl
usi
on
of
farm
ers
wit
hp
osi
tive
exp
ecte
dre
turn
sor
incl
usi
on
of
farm
ers
wit
hneg
ati
ve
exp
ecte
dre
turn
s).
Colu
mns
2and
5lim
itto
the
sam
ple
of
farm
ers
wit
hp
osi
tive
exp
ecte
dre
turn
sand
consi
der
excl
usi
on
erro
r.C
olu
mns
3and
6lim
itto
farm
ers
wit
hneg
ati
ve
exp
ecte
dre
turn
sand
consi
der
incl
usi
on
erro
r.M
ark
etTre
atm
ent
is1
for
villa
ges
wher
efa
rmer
sco
uld
eith
erobta
inth
ete
chnolo
gy
from
door-
to-d
oor
sale
sor
from
pee
rsu
pplier
s.Sta
ndard
erro
rsare
clust
ered
at
the
villa
ge
level
.A
ster
isks
indic
ate
stati
stic
al
signifi
cance
at
the
1%
∗∗∗,
5%
∗∗,
and
10%
∗le
vel
s.
34

Figure 4: Relationship between estimated returns and adoption, by treatment
0.1
.2.3
.4.5
.6Ad
optio
n
-2 0 2 4
Market Network
a
0.1
.2.3
.4.5
.6Ad
optio
n
0 5 10 15 20
Market Network
b0
.2.4
.6D
ensi
ty
-2 0 2 4Returns (100kg/ha)
c0
.05
.1.1
5D
ensi
ty
0 5 10 15 20Area weighted days flood in 2011
d
Notes: (a) Nonparametric fan regression of adoption on estimated returns. (b) Nonparametric fan regression ofadoption on area weighted duration of flooding during 2011 floods. (c) Density of estimated returns. (d) Density ofarea weighted flood duration in 2011.
35

Table 6: Estimated correlation between expected returns and adoption(1) (2)
Market Treatment 0.300∗∗∗ 0.130(0.049) (0.126)[0.065]
Market 0.031Treatment*Expected (0.025)Returns [0.024]
Expected Returns 0.019(0.013)[0.014]
2011 Area weighted 0.007days flood (0.011)
2011 Area weighted -0.000days flood2 (0.000)
Market 0.044∗∗
Treatment*2011 Area (0.018)weighted days flood
Market -0.002∗∗∗
Treatment*2011 Area (0.001)weighted days flood2
Strata Fixed Effects Yes Yes
Household controls Yes Yes
Mean of Dep Variable: Network 1.24 1.24Number of Observations 1134 1126R squared 0.212 0.213
Dependent variable is 1 if farmer adopted Swarna-Sub1 for 2013 wet season. Market Treatment is 1 for villageswhere farmers could either obtain the technology from door-to-door sales or from peer suppliers. Conventionalstandard errors that are clustered at the village level are reported in parentheses. Bootstrapped standard errorsthat correct for Expected Returns being a generated regressor are in brackets. Asterisks (pertaining to conventionalstandard errors) indicate statistical significance at the 1% ∗∗∗, 5% ∗∗, and 10% ∗ levels.
36

Figure 5: Efficiency loss of exchange in social networks
23
61.7
168.2
010
020
0G
ain
from
Sw
arna
-Sub
1 (1
000
Rs)
Network Market Efficient
a
10921147
1041
1357
050
010
0015
00Av
erag
e Yi
eld
Network Market
No Swarna-Sub1 Swarna-Sub1
b
Notes: (a) Figure shows total gain in expected revenue due to Swarna-Sub1, where expected gain is set to 0 forfarmers that did not adopt. The efficient network is one where every farmer with positive expected returns adopts.Cultivated area for non-adopters is imputed with average cultivated area of adopters for computation of total gainsfrom the efficient network. (b) Plot displays average expected yield under flood conditions identical to thoseexperienced during 2011 floods. Height of gray bars is average expected yield when varieties grown are fixed atthose chosen during 2012. Height of red bars is average expected yield when all plots are cultivated withSwarna-Sub1 only for those that either adopted from a peer or from the market. Varieties are fixed at 2012 choicesif farmer did not adopt Swarna-Sub1. Expected yields are calculated using regression results in Dar et al. (2013b).
37

Table 7: Estimated demand functions in door-to-door sales(1) (2) (3)
Expected Returns 0.048∗∗ 0.049∗∗ -0.003(0.022) (0.022) (0.034)[0.024] [0.023] [0.027]
Price -0.025(0.024)[0.031]
Price = 12 0.101 -0.001(0.081) (0.104)[0.096] [0.154]
Price = 10 0.100 0.001(0.095) (0.121)[0.126] [0.211]
Price=12*Expected 0.086∗
Returns (0.049)[0.051]
Price=10*Expected 0.079∗
Returns (0.047)[0.062]
Strata Fixed Effects Yes Yes YesHousehold controls Yes Yes Yes
Mean of Dep Variable 0.362 0.362 0.362Number of Observations 569 569 569R squared 0.116 0.118 0.125
Data are limited to 41 villages where door-to-door sales were made. Dependent variable is 1 if farmer adoptedSwarna-Sub1 for 2013 wet season. Conventional standard errors that are clustered at the village level are reportedin parentheses. Bootstrapped standard errors that correct for Expected Returns being a generated regressor are inbrackets. Asterisks (pertaining to conventional standard errors) indicate statistical significance at the 1% ∗∗∗, 5%∗∗, and 10% ∗ levels.
38

Table 8: Estimated effect of being selected as a supplier on follow-up social network statusSharing degree Sharing in-degree
(1) (2) (3) (4)
Supplier 0.998∗∗∗ 1.003∗∗∗ 0.497∗∗ 0.473∗
(0.227) (0.221) (0.246) (0.242)Baseline sharing degree 0.147∗∗∗ 0.148∗∗∗
(0.052) (0.050)Baseline sharing in-degree 0.181∗∗∗ 0.180∗∗∗
(0.067) (0.068)Farmer is SC -0.627 -0.872∗∗∗
(0.379) (0.325)Land cultivated in 2012 0.108∗∗ 0.046
(0.044) (0.039)Farmer has BPL card 0.015 -0.004
(0.156) (0.162)Village Fixed Effects Yes Yes Yes Yes
Mean of Dep Variable 7.28 7.29 3.92 3.92Number of Observations 1544 1542 1547 1545R squared 0.341 0.347 0.198 0.204
Asterisks indicate statistical significance at the 1% ∗∗∗, 5% ∗∗, and 10% ∗ levels. Standard errors are clustered atthe village level. Degree is the total number of links reported by either the surveyed farmer or other farmers in hervillage. The in-degree is the total number of other farmers in the village that reported a contact with the farmer.
39

Table 9: Dyadic regressions of network formation at follow-up(1) (2)
One farmer is seller 0.013 0.025∗
(0.014) (0.015)
Both farmers are 0.182∗∗∗ 0.210∗∗∗
sellers (0.030) (0.035)
Same sub-caste 0.035∗
(0.018)
Same surname 0.122∗∗∗
(0.018)
Houses within 25 m 0.007(0.014)
Plots within 100 m 0.023∗
(0.013)
Village Fixed Effects Yes Yes
Mean of Dep Variable 0.380 0.385Number of Observations 27633 24837R squared 0.073 0.088
Data are from follow-up social network survey of all farmers. Dependent variable is 1 if either farmer in the dyadindicated a sharing link (i.e. an undirected network). Standard errors are clustered at the village level. Asterisksindicate statistical significance at the 1% ∗∗∗, 5% ∗∗, and 10% ∗ levels.
40

Figure 6: Distribution of difference between total harvest in year 1 and amount planted in year 2in door-to-door villages
0.0
001
.000
2.0
003
.000
4.0
005
Den
sity
-1000 0 1000 2000 3000 4000Village harvest - Amount planted
Notes: Data are for door-to-door villages. Figure shows the kernel density of difference between total year 1 harvestby suppliers and aggregate amount planted in village during year 2 (in kg). The amount planted during year 2includes amount purchased from door-to-door sales, amount obtained directly from suppliers (by all farmers, notonly farmers in the sample), and amount planted by suppliers.
41

Table 10: Heterogeneous effects according to baseline importance of suppliers(1) (2)
Market Treatment 0.256∗∗∗ 0.309∗∗∗
(0.063) (0.065)
1 if supplier degree -0.047/ buyer degree > median (0.038)
Market Treatment*1 0.157∗
if seller degree / buyer degree > median (0.088)
1 if supplier size / -0.057buyer size > median (0.036)
Market Treatment*1 0.063if seller size / buyer size > median (0.089)
Farmer is SC -0.071∗ -0.058(0.041) (0.038)
Farmer has BPL card -0.061∗ -0.067∗∗
(0.032) (0.033)
Land cultivated in 0.004 0.0052012 (0.007) (0.007)
Ag. cooperative -0.025 -0.019member (0.024) (0.024)
Swarna user in 2012 0.074∗∗ 0.078∗∗
(0.032) (0.033)
Block Fixed Effects Yes Yes
Mean of Dep Variable: Network 0.07 0.07Number of Observations 1134 1119R squared 0.199 0.195
Dependent variable is 1 if farmer adopted Swarna-Sub1 for 2013 wet season. 1 if supplier / buyer degree > medianis a village-level indicator for ratio of average sharing degree of suppliers to average sharing degree of buyers beinglarger than the median. 1 if supplier size / buyer size > median is a similar indicator, but using average landcultivated during 2012 rather than sharing degree.Market Treatment is 1 for villages where farmers could eitherobtain the technology from door-to-door sales or from peer suppliers. Standard errors are clustered at the villagelevel. Asterisks indicate statistical significance at the 1% ∗∗∗, 5% ∗∗, and 10% ∗ levels.
42
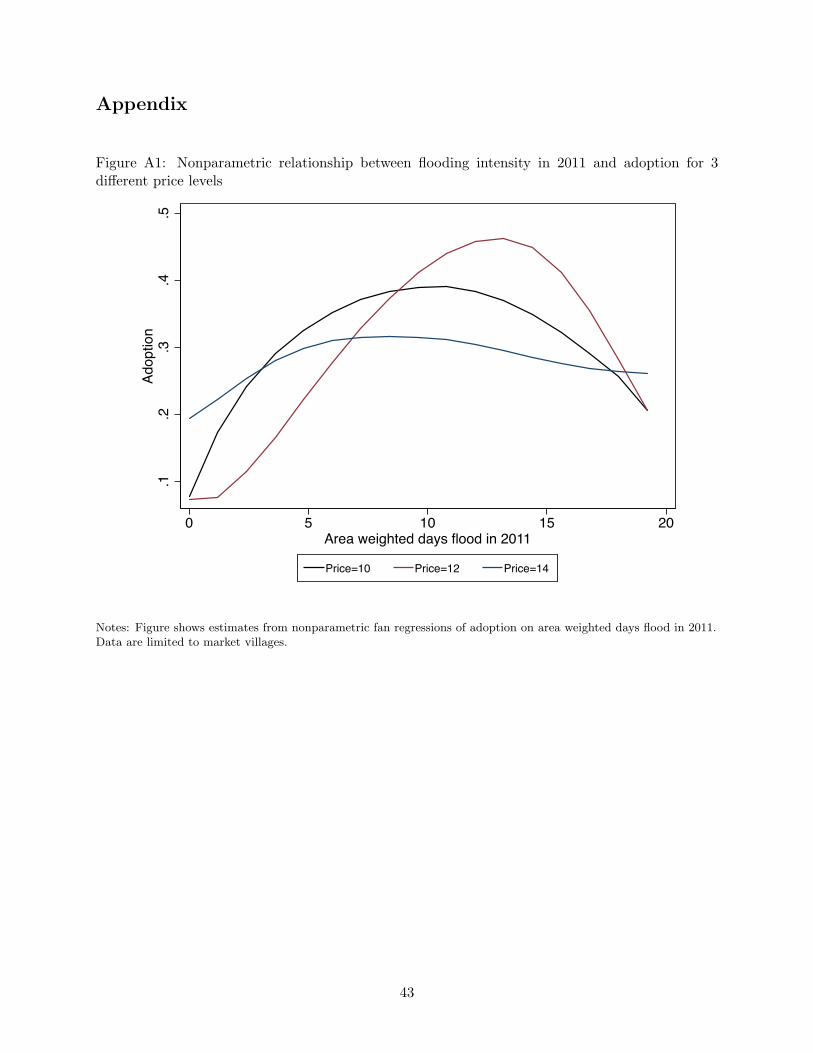
Appendix
Figure A1: Nonparametric relationship between flooding intensity in 2011 and adoption for 3different price levels
.1.2
.3.4
.5Ad
optio
n
0 5 10 15 20Area weighted days flood in 2011
Price=10 Price=12 Price=14
Notes: Figure shows estimates from nonparametric fan regressions of adoption on area weighted days flood in 2011.Data are limited to market villages.
43

Table A1: Robustness of estimated peer effects to different subsamples and nonlinear modelVariation in adoption Drop Dhamanagar block Full sample
(1) (2) (3) (4) (5) (6)OLS OLS OLS OLS Probit Probit
Market Treatment 0.268∗∗∗ 0.206∗∗ 0.316∗∗∗ 0.328∗∗∗ 0.349∗∗∗ 0.357∗∗∗
(0.080) (0.095) (0.069) (0.085) (0.055) (0.059)
Market Treatment * -0.159∗∗ -0.155∗∗∗ -0.076∗∗
Number suppliers w/ same surname (0.061) (0.052) (0.036)
Market Treatment * 0.034∗∗ 0.048∗∗∗ 0.021Total number w/ same surname (0.016) (0.016) (0.014)
Number suppliers w/ 0.110∗∗ 0.061 0.027∗
same surname (0.053) (0.038) (0.016)
Total number w/ same -0.015 -0.017 -0.010surname (0.011) (0.011) (0.013)
Market Treatment * -0.120∗∗ -0.092∗∗ -0.063∗∗
Number suppliers same sub-caste (0.045) (0.035) (0.027)
Market Treatment * 0.031∗ 0.026∗∗∗ 0.017Total number same sub-caste (0.017) (0.010) (0.012)
Number suppliers 0.075∗ 0.053∗∗ 0.024∗
same sub-caste (0.041) (0.023) (0.013)
Total number same -0.024 -0.018∗∗ -0.014sub-caste (0.017) (0.007) (0.012)
Strata Fixed Effects Yes Yes Yes Yes Yes Yes
Household controls Yes Yes Yes Yes Yes Yes
Mean of Dep Variable: Network 0.18 0.18 0.09 0.09 0.07 0.07Number of Observations 744 744 800 800 1134 1134R squared 0.120 0.118 0.204 0.197
Data in columns 1 and 2 are limited to villages where at least one farmer adopted Swarna-Sub1 for 2013 wet season.Data in columns 3 and 4 are for villages in Chandabali and Tihidi blocks. Dependent variable in all columns is 1 iffarmer adopted Swarna-Sub1 for 2013 wet season. Columns 3 and 4 present marginal effects calculated from probitcoefficients, along with standard errors calculated from the delta method. Market Treatment is 1 for villages wherefarmers could either obtain the technology from door-to-door sales or from peer suppliers. Control variables areindicator for SC, indicator for holding BPL card, land area cultivated in 2012 wet season, indicator for member ofagricultural cooperative, and indicator for Swarna cultivator in 2012 wet season. Standard errors are clustered atthe village level. Asterisks indicate statistical significance at the 1% ∗∗∗, 5% ∗∗, and 10% ∗ levels.
44

Table A2: Robustness of estimated peer effects to measurement of peer influence in shares ratherthan levels
(1) (2) (3) (4) (5) (6)
Market Treatment 0.435∗∗∗ 0.439∗∗∗ 0.435∗∗∗ 0.439∗∗∗
(0.049) (0.047) (0.057) (0.054)
Market Treatment * -0.364∗∗∗ -0.373∗∗∗ -0.346∗∗∗
Share of same surname that are suppliers (0.115) (0.112) (0.130)
Share of same 0.207∗∗ 0.206∗∗ 0.202∗∗
surname that are suppliers (0.079) (0.080) (0.095)
Market Treatment * -0.384∗∗ -0.398∗∗ -0.411∗∗
Share of same sub-caste that are suppliers (0.172) (0.167) (0.184)
Share of same 0.175∗∗ 0.125 0.174∗
sub-caste that are suppliers (0.082) (0.090) (0.099)
Strata Fixed Effects Yes Yes No Yes Yes No
Village Fixed Effects No No Yes No No Yes
Household controls No Yes Yes No Yes Yes
Mean of Dep Variable: Network 0.07 0.07 0.07 0.07 0.07 0.07Number of Observations 1009 1008 1008 1056 1055 1055R squared 0.202 0.220 0.435 0.199 0.218 0.434
Dependent variable in all columns is 1 if farmer adopted Swarna-Sub1 for 2013 wet season. Market Treatment is 1for villages where farmers could either obtain the technology from door-to-door sales or from peer suppliers. Controlvariables are indicator for SC, indicator for holding BPL card, land area cultivated in 2012 wet season, indicator formember of agricultural cooperative, and indicator for Swarna cultivator in 2012 wet season. Standard errors areclustered at the village level. Asterisks indicate statistical significance at the 1% ∗∗∗, 5% ∗∗, and 10% ∗ levels.
45

Table A3: Estimated peer effects using stated social networks at followup(1) (2)
Market Treatment 0.316∗∗∗
(0.066)
Market Treatment * 0.009 -0.019Followup links with suppliers (0.027) (0.021)
Market Treatment * 0.001 0.004Followup degree (0.010) (0.008)
Followup links with 0.002 0.014suppliers (0.015) (0.013)
Followup degree 0.006 0.001(0.005) (0.003)
Strata Fixed Effects Yes No
Village Fixed Effects No Yes
Household controls Yes Yes
Mean of Dep Variable: Network 0.07 0.07Number of Observations 1134 1134R squared 0.207 0.413
Dependent variable is 1 if farmer adopted Swarna-Sub1 for 2013 wet season. Market Treatment is 1 for villageswhere farmers could either obtain the technology from door-to-door sales or from peer suppliers. Control variablesare indicator for SC, indicator for holding BPL card, land area cultivated in 2012 wet season, indicator for memberof agricultural cooperative, and indicator for Swarna cultivator in 2012 wet season. Standard errors are clustered atthe village level. Asterisks indicate statistical significance at the 1% ∗∗∗, 5% ∗∗, and 10% ∗ levels.
46

Figure A2: Stated motivation for sharing Swarna-Sub1 by suppliers
45.9
6.975.33
.41
20.08
16.39
4.51
025
50Pe
rcen
tage
Nobody asked Ate it Sold rice Dislike sharing Poor harvest Seed quality Other
A. Reasons for not trading
8.16
86.73
38.78
63.27
30.61
025
5075
100
Perc
enta
ge
Sought them Sought me Close family Close friends Others informed
B. Reasons for choosing trading partners
Notes: Top panel displays distribution of stated reasons why suppliers chose not to sell, exchange or gift seeds. Forinstance, 45.9% of farmers that did not transfer seeds indicated it was because nobody came to them asking forseeds. Bottom panel displays distribution of how trading partners were chosen by suppliers that chose to exchangewith other farmers. For instance, 86.73% of farmers that exchanged indicated that they were sought out by otherfarmers.
47

Table A4: Dyadic regressions of link formation at follow-up(1) (2) (3) (4) (5)
Same sub-caste 0.079∗∗∗ 0.035∗
(0.016) (0.018)Same surname 0.136∗∗∗ 0.126∗∗∗
(0.015) (0.017)Houses within 25 m 0.042∗∗∗ -0.000
(0.012) (0.014)Plots within 100 m 0.028∗∗ 0.017
(0.013) (0.014)Village Fixed Effects Yes Yes Yes Yes Yes
Mean of Dep Variable 0.380 0.380 0.380 0.384 0.385Number of Observations 27633 27633 27427 24979 24837R squared 0.071 0.080 0.067 0.066 0.080
Data are from follow-up social network survey of all farmers. Dependent variable is 1 if either farmer in the dyadindicated a sharing link (i.e. an undirected network). Standard errors are clustered at the village level. Asterisksindicate statistical significance at the 1% ∗∗∗, 5% ∗∗, and 10% ∗ levels.
48

Table A5: Heterogeneous effects of trading in social networks(1)
Market Treatment 0.409∗∗∗
(0.093)
Farmer is SC 0.016(0.044)
Farmer has BPL card -0.014(0.033)
Land cultivated in 2012 0.007(0.006)
Ag. cooperative member -0.020(0.027)
Swarna user in 2012 0.032(0.026)
Education above primary -0.006(0.021)
Market Treatment interacted with:
Farmer is SC -0.197∗∗
(0.076)
Farmer has BPL card -0.103(0.065)
Land cultivated in 2012 -0.001(0.014)
Ag. cooperative member 0.009(0.046)
Swarna user in 2012 0.115∗
(0.068)
Education above primary -0.114∗∗
(0.048)
Strata Fixed Effects Yes
Mean of Dep Variable: Network 0.07Number of Observations 1131R squared 0.224
Dependent variable is 1 if farmer adopted Swarna-Sub1 for 2013 wet season. Market Treatment is 1 for villageswhere farmers could either obtain the technology from door-to-door sales or from peer suppliers. Standard errorsare clustered at the village level. Asterisks indicate statistical significance at the 1% ∗∗∗, 5% ∗∗, and 10% ∗ levels.
49

Table A6: Heterogeneous effect of trading in networks according to proxy measures of preferencefor quality seeds
(1) (2)
Market Treatment 0.352∗∗∗ 0.376∗∗∗
(0.051) (0.050)
Market -0.036Treatment*Seed buyer in 2012 (0.050)
Seed buyer in 2012 -0.021(0.024)
Market -0.078Treatment*Quality preference (0.051)
Quality preference -0.012(0.027)
Farmer is SC -0.063 -0.054(0.041) (0.039)
Farmer has BPL card -0.055∗ -0.057∗
(0.031) (0.030)
Land cultivated in 0.004 0.0052012 (0.007) (0.007)
Ag. cooperative -0.016 -0.007member (0.024) (0.023)
Swarna user in 2012 0.101∗∗∗ 0.091∗∗∗
(0.032) (0.033)
Strata Fixed Effects Yes Yes
Mean of Dep Variable: Network 0.07 0.07Number of Observations 1134 1134R squared 0.206 0.209
Dependent variable is 1 if farmer adopted Swarna-Sub1 for 2013 wet season. Market Treatment is 1 for villageswhere farmers could either obtain the technology from door-to-door sales or from peer suppliers. Standard errorsare clustered at the village level. Asterisks indicate statistical significance at the 1% ∗∗∗, 5% ∗∗, and 10% ∗ levels.
50


