The Dynamics of Potassium in some Australian soils · This work combines soil analysis and...
146
The Dynamics of Potassium in some Australian soils Serhiy Marchuk In fulfilment of the degree of DOCTOR OF PHILOSOPHY Soil Science Group School of Agriculture, Food and Wine The University of Adelaide November 2015
Transcript of The Dynamics of Potassium in some Australian soils · This work combines soil analysis and...

The Dynamics of Potassium in some
Australian soils
Serhiy Marchuk
In fulfilment of the degree of
DOCTOR OF PHILOSOPHY
Soil Science Group
School of Agriculture, Food and Wine
The University of Adelaide
November 2015

2
Table of Contents
ABSTRACT .......................................................................................................................................................... 5
DECLARATION .................................................................................................................................................. 7
ACKNOWLEDGEMENT ................................................................................................................................... 8
CHAPTER 1 INTRODUCTION ......................................................................................................................... 9
1.1 RESEARCH AIM AND OBJECTIVES .................................................................................................................. 9
1.2 THESIS ORGANISATION ............................................................................................................................... 10
CHAPTER 2. LITERATURE REVIEW .......................................................................................................... 12
2.1 FORMS OF POTASSIUM IN SOIL .................................................................................................................... 13
2.2 THE SOURCES OF POTASSIUM IN SOIL: CLASSICAL VIEW ........................................................................... 16
2.2.1 Parent Materials and Mineral Weathering ........................................................................................ 17
2.2.2 K Inputs to the Soil ............................................................................................................................. 18
2.2.3 K Outputs from the Soil ...................................................................................................................... 19
2.3 POTASSIUM IN CLAY MINERALS ................................................................................................................. 19
2.3.1 Clay Minerals ..................................................................................................................................... 20
2.3.2 Study Tools ......................................................................................................................................... 21
2.3.3 Structure of K-bearing Minerals ........................................................................................................ 25
2.3.4 Brief Description of K-bearing Minerals ........................................................................................... 28
2.4 POTASSIUM IN PLANT-SOIL SYSTEM ........................................................................................................... 36
2.5 POTASSIUM AND WASTEWATER IRRIGATION .............................................................................................. 43
2.6 EFFECT OF POTASSIUM ON STRUCTURAL STABILITY AND DISPERSION OF THE SOIL ................................... 46
2.7 SUMMARY ................................................................................................................................................... 47
CHAPTER 3. EXAMINE THE EFFECT OF APPLICATION OF POTASSIUM ON CLAY MINERALS
(FIXATION OF POTASSIUM INDUCED BY WETTING-DRYING CYCLES). ...................................... 49
MATERIALS AND METHODS .............................................................................................................................. 50
Materials ..................................................................................................................................................... 50
Samples preparation ................................................................................................................................... 50
Characterisation Methods ........................................................................................................................... 51
RESULTS AND DISCUSSION ............................................................................................................................... 51
X-ray diffraction .......................................................................................................................................... 51
CONCLUSION .................................................................................................................................................... 54
CHAPTER 4. CATION EXCHANGE AND RELATED PHYSICAL PROPERTIES AS INFLUENCED
BY THE TYPE OF CATIONS IN DIFFERENT TYPE CLAY MINERALS .............................................. 56
MATERIALS AND METHODS .............................................................................................................................. 57
Preparation of homoionic samples ............................................................................................................. 57
Characterization of samples ....................................................................................................................... 58

3
RESULTS AND DISCUSSION ............................................................................................................................... 59
CHAPTER 5. INFLUENCE OF THE MAJOR EXCHANGEABLE CATIONS ON THE PARTICLE
SIZE DISTRIBUTION AND DISPERSIVE BEHAVIOUR OF SOIL CLAYS WITH CONTRASTING
MINERALOGY .................................................................................................................................................. 62
MATERIALS AND METHODS............................................................................................................................... 62
Soil used ...................................................................................................................................................... 62
Soil analysis ................................................................................................................................................ 62
Soil clays preparation for XRD analysis ..................................................................................................... 63
X-Ray diffraction (XRD) analysis of the clay fraction ................................................................................ 64
Preparation of homoionic samples ............................................................................................................. 64
RESULTS AND DISCUSSION ................................................................................................................................ 65
Mineralogical analysis of investigated soils ............................................................................................... 65
Effect of pH and adsorbing cations on CEC of homoionised soil clays ...................................................... 65
Effect of homoionic treatments on particle size and zeta potential of soil clays ......................................... 69
CHAPTER 6. POTASSIUM STATUS OF URRBRAE SOIL. LABORATORY AND FIELD STUDY
USING TRADITIONAL ANALYTICAL METHODS, XRD AND TEM ..................................................... 74
MATERIALS AND METHODS............................................................................................................................... 74
Selection of study site and soil .................................................................................................................... 74
Soil sampling and preparation .................................................................................................................... 76
Clay fractioning .......................................................................................................................................... 76
X-Ray diffraction (XRD) analysis ............................................................................................................... 78
Transmission electron microscopy (TEM) .................................................................................................. 78
RESULTS AND DISCUSSION ................................................................................................................................ 80
Soil Analysis ................................................................................................................................................ 80
MINERALOGICAL DETERMINATION OF CLAY FRACTIONS BY XRD .................................................................... 84
Previous study ............................................................................................................................................. 84
Mineralogical analysis of clay fraction ...................................................................................................... 85
THE BEHAVIOUR OF URRBRAE SOIL CLAY UNDER DIFFERENT RATES OF POTASSIUM APPLICATION ................... 89
Mineralogical analysis of original and treated clays .................................................................................. 90
Clay chemical properties ............................................................................................................................ 93
TEM Study ................................................................................................................................................... 95
CHAPTER 7. POSSIBLE EFFECTS OF IRRIGATION WITH WASTEWATER ON THE
MINERALOGY OF SOME AUSTRALIAN CLAYEY SOILS: LABORATORY STUDY ........................ 97
ABSTRACT ........................................................................................................................................................ 98
INTRODUCTION ................................................................................................................................................. 98
MATERIALS AND METHODS............................................................................................................................. 100
Soil and wastewater used .......................................................................................................................... 100
Experimental design .................................................................................................................................. 100
4
Soil clay preparation ................................................................................................................................. 101
X-Ray diffraction (XRD) analysis of the silt and clay fractions ................................................................ 102
XRD pattern decomposition to obtain the clay mineral assemblages ....................................................... 102
Interpretation of the decomposed XRD patterns ....................................................................................... 104
Spontaneous dispersion and turbidity measurements ............................................................................... 106
Determination of chemical composition of the clay fraction .................................................................... 107
RESULTS AND DISCUSSION .............................................................................................................................. 108
Soil chemical properties ............................................................................................................................ 108
Effect of wastewater application on dispersive behaviour of soils ........................................................... 109
Mineralogical Analysis ............................................................................................................................. 110
Decomposition of XRD patterns ................................................................................................................ 115
Elemental content of clay fraction ............................................................................................................ 118
Clay mineral modification through wastewater treatment: Summary ...................................................... 119
CONCLUSION .................................................................................................................................................. 119
CHAPTER 8. POTASSIUM INDUCED DISPERSION: A FIELD STUDY .............................................. 121
MINERALOGICAL ANALYSIS OF SOIL CLAY FRACTIONS ................................................................................... 122
SOILS PROPERTIES .......................................................................................................................................... 124
CONCLUSION .................................................................................................................................................. 128
CHAPTER 9. GENERAL DISCUSSION ....................................................................................................... 129
CHAPTER 10. CONCLUSIONS, LIMITATIONS OF THE STUDY, AND RECOMMENDATION FOR
FURTHER RESEARCH.................................................................................................................................. 132
CONCLUSIONS ................................................................................................................................................ 132
LIMITATIONS OF THE STUDY AND RECOMMENDATIONS FOR FURTHER RESEARCH .......................................... 133
REFERENCES ................................................................................................................................................. 135

5
Abstract
Potassium (K) is a macro element in plant, animal and human nutrition and is regularly applied
to agricultural land as a fertiliser or as a component of nutrients in irrigation wastewater. Soils
contain variable quantities of potassium-bearing minerals and differ in their inherent K
supplying capacity. Improving knowledge of the potassium cycle in soils is considered to be
important for a better understanding of the productivity and sustainability of many ecosystems.
This work combines soil analysis and mineralogical methods for characterising and quantifying
the movement of different forms of potassium in Australian soils.
Dispersion of clay particles is one of the major processes responsible for the degradation of
soil structure. Adsorbed sodium is traditionally considered to be a primary cause for poor soil
structural stability. However, there is a knowledge gap in understanding the effect of adsorbed
monovalent potassium on soil structure. Mixed results from the literature point to more
research being required to explore the potential effect of applied K+ on soil dispersive
properties and the role of clay minerals in it.
Potassium is common in a wide variety of wastewaters and in some wastewaters is present at
several hundred to several thousand mg/L. Potassium is taken up by expandable clays leading
to its fixation and illitisation of smectitic and vermiculitic layers. Clays have a major effect on
soil physico-chemical properties, and hence the addition of wastewaters to soils may lead to
mineralogical changes in the soils that affect these properties.
The aim of this work was to improve our understanding of potassium dynamics in Australian
soils with emphasis on soil clay mineralogical properties. Soils from different regions of
Southern Australia were used. Studies on pure clays have been included to understand the
fundamental processes involved in potassium cycle in soils.
The results show that applied potassium can cause dispersion of soil but to a lesser extent than
sodium. Potassium cations also could increase soil hydraulic conductivity to some extent when
applied to a soil with high sodium content by substituting the Na+ on exchange sites.
Exchangeable potassium can cause dispersion of soil even if it is present in relatively small
amounts (Exchangeable Potassium Percentage < 4%), particularly in soils with dominant
illite/kaolinite mineralogy. The use of Exchangeable Cation Ratio is tested as an indicator of
soil dispersion because it reflects the combined effects of potassium and sodium as dispersive
agents.

6
Illitic and illitic-kaolinitic soils are more prone to dispersion than soils with dominant smectitic
clay. This is due to their differences in clay microstructure and fabric when interacting with
water. Turbidity and zeta potential could effectively reflect soil clay dispersive properties. But
to understand the meaning of zeta potential for dispersive properties of soils we should have
prior knowledge of the mineralogy of the soil studied. TEM and XRD methods could assist in
providing a better understanding of the processes occurring in soil.
Application of potassium rich wastewater on four clayey soils from Southern Australia induced
changes in the 2:1 clay assemblages of the soils. XRD diagrams and chemical composition of
clays extracted from untreated and treated soils were determined. Characterisation of the effect
of wastewater treatment on clay fraction either by decomposition of XRD patterns into their
component phases or chemical analysis of the mineral content of the studied clays gave
consistent results. In 3 of the 4 soils, shifts in peak positions occurred towards more illitic
components along with increases in K and sometimes also Mg and Na contents of soil clays.
Peak decomposition showed trends towards the formation of interstratifications of illite with
smectite at the expense of smectite and an alteration of poorly-crystallised illite into its more
well-ordered forms. The results show that illitisation may occur as a result of the addition of
K-rich wastewaters to clayey soils. Growers and agricultural managers should consider soil
clay mineralogy before irrigating with potassium-rich wastewater.
7
Declaration
I certify that this work contains no material which has been accepted for the award of any other
degree or diploma in my name in any university or other tertiary institution and, to the best of
my knowledge and belief, contains no material previously published or written by another
person, except where due reference has been made in the text. In addition, I certify that no part
of this work will, in the future, be used in a submission in my name for any other degree or
diploma in any university or other tertiary institution without the prior approval of the
University of Adelaide and where applicable, any partner institution responsible for the joint
award of this degree.
I give consent to this copy of my thesis when deposited in the University Library, being made
available for loan and photocopying, subject to the provisions of the Copyright Act 1968.
The author acknowledges that copyright of published works contained within this thesis resides
with the copyright holder(s) of those works.
I also give permission for the digital version of my thesis to be made available on the web, via
the University’s digital research repository, the Library Search and also through web search
engines, unless permission has been granted by the University to restrict access for a period of
time.
Serhiy Marchuk

8
Acknowledgement
I wish to thank my ever supporting wife Alla for encouraging and believing in me. Without her
love, moral and financial support I wouldn’t be able to do this project.
I am truly grateful to my supervisors, in particular my principal supervisor, Dr Jock
Churchman, for his guidance, inspiring scientific ideas, being ever helpful and available for
discussion and advice, encouragement and patience. I equally thank my co-supervisor Dr Pichu
Rengasamy, for his continuing support, valuable advices and help in all phases of my research.
I also would like to thank the following people for their help and support during my study:
Dr Peter Self introduced me to the world of X-ray diffraction analysis. His guidance and
invaluable advices in XRD data analysis and interpretation enabled me to extend my work and
interests much further than would otherwise possible.
Teresa Fowles, Dr Lyndon Palmer and all staff of Waite Analytical Service for their time,
assistance and advises.
The staff and students and particularly Colin Rivers of the Soil Science Group, School of
Agriculture, Food and Wine for their help and friendship.
Dr Glenn McDonald, Dr Bertram Ostendorf and Dr Megan Lewis for advises and help on the
early stages of my research, thank you for your time.
All members of the Spatial Information Group from Ecology and Environmental Science unit,
for the warm and friendly atmosphere they created and for their ability to help in any moment.
9
Chapter 1 Introduction
Potassium (K) is a macro element in plant, animal and human nutrition (Simonsson et al.,
2009). The K ion is necessary for the functioning of all living cells, and is thus present in all
plant and animal tissues; it is also a key element for plant growth. Potassium is regularly applied
to agricultural land in many areas (Rangel, 2008). Improving knowledge about the K cycle is
considered to be important for a better understanding of the productivity and sustainability of
many ecosystems (Tripler et al., 2006).
Potassium is quite abundant in soils, the total soil K pool constitutes a large K-resource with
between 3000 and 100 000 kg ha-1 in the upper 0.2m of the soil profile depending on parent
material, soil type and mineralogy (Sparks, 1987). However, the availability of this soil K for
the crop depends on the ability of the soil to release K and on the crop itself (Johnston, 2003).
The major source of potassium for plants in soils is from clay minerals (Velde and Barré, 2010)
which are the most reactive inorganic components in soil systems (Barré et al., 2009). Soils
contain varying amounts of K-bearing minerals and, along with K added with irrigation
wastewater, fertilizers and manures, they constitute a major reserve of K (Andrist-Rangel et
al., 2006). As well as acting as sources of K, some minerals may at times act and behave as
sinks for K-fixation. The fixation process involves adsorption of K ions on to sites in the
interlayers of illite, vermiculite and highly charged smectite and their intermediate phases (so-
called mixed layer or interstratified minerals), resulting in a collapse of the interlayer space.
Whether minerals act as sinks or sources for K depends on the K concentration in the soil
solution (McLean and Watson, 1985). Understanding and measuring the inherent potential of
soils to deliver potassium (K) to crops and the key soil properties that are related to their K
status is becoming increasingly important for the development of long-term sustainable
agricultural systems (e.g., Öborn et al., 2005).
1.1 Research aim and objectives
The general aim of this work was to improve our understanding of potassium dynamics in
Australian soils with emphasis on soil clay mineralogical properties.
Specific objectives for this study were:
examine the influence of major exchangeable cations (Ca2+, Mg2+, Na+ and K+) and K+
in particular, on physical and chemical properties of soils with contrasting mineralogy
and the differences induced by different cations on the soils;

10
investigate the effect of different vegetation regimes on clay mineralogy and potassium
status of one of the South Australia’s most common soils – a Chromosol;
investigate the effect of exchangeable and soluble K+ on soil hydraulic properties and
clay dispersion and determine how the clay minerals could be modified through
application of potassium;
determine whether irrigation with wastewater high in potassium could change the clay
mineral assemblage of soils and hence how it could influence soil properties that are
important for agriculture;
demonstrate applicability of modern soil and clay investigation methods and techniques
for characterising and quantifying the effect of applied potassium on soil and soil clay
minerals.
The practical aim was to increase the state of knowledge of the role of potassium in Australian
soil.
1.2 Thesis organisation
This thesis is divided into 9 chapters, including the Introduction and the Literature Review,
with the relevant literature being reviewed at the start of each experimental chapter.
Chapter 1: introduces the main topic of the study – potassium in Australian soils; the aim and
objectives; and the structure of this thesis.
Chapter 2: provides an overview on the state of knowledge on the potassium status in soil and
the important role of clay minerals in the potassium cycle.
In Chapter 3, I have developed the laboratory procedures for studying the effects of the
application of potassium on clay minerals using the most common reference clay – Wyoming
bentonite. I have used this procedure in further experiments. The changes in clay structure were
verified using the X-ray diffraction technique (XRD) with specific software, which enabled
identification of these changes.
Chapter 4: investigates how cation exchange and related physical properties are influenced by
the type of cations in different type clay minerals.
Chapter 5: examines the influence of major exchangeable cations (Ca2+, Mg2+, Na+ and K+)
on the colloidal behaviour of soils with contrasting mineralogy. I also studied the structural
differences induced by different cations using XRD, zeta potential and particle size
measurements.

11
Chapter 6 consisted of two parts. In the first, a field based study, I investigated the variability
of the clay fraction of one of the South Australia most common soils – a Chromosol, with depth
and under different vegetation regimes. In the second, laboratory study, I evaluated the
influence of exchangeable K+ on the dispersive behaviour of the clay fraction of the Chromosol
using traditional analytical methods, XRD and TEM.
Chapter 7: describes studies of possible effect under laboratory conditions of irrigation with
wastewater on the mineralogy of four Australian clayey soils under laboratory condition. The
aim was to determine whether irrigation with wastewater high in potassium could change the
clay mineral assemblage of soils. The changes in clay composition and properties were
monitored using the decomposition of digital XRD data and through chemical analysis of
digested clay fractions before and after treatment with wastewater.
Chapter 8: investigates 17 dispersive soils from different areas of Australia with varied
cropping histories and management practices, except that they all had exchangeable K+/Na+
ratios > 1. The purpose of this experiment was to determine and quantify the influence of high
exchangeable potassium content on various physical and chemical properties of these soils and
their dispersive behaviour.
Chapter 9: integrates and discuss key findings from the experimental chapters 3 – 8.
Chapter 10: summarises and concludes the key findings from the study and discusses
recommendation for further research.

12
Chapter 2. Literature Review
Potassium is the chemical element with the symbol K (Latin: kalium, from Arabic: al-qalyah
- "plant ashes"), atomic number 19, and atomic mass 39.0983 and it is the seventh most
abundant element in the earth's crust. Potassium was first isolated from potash (K2O).
Elemental potassium is a soft silvery-white metallic alkali metal that oxidizes rapidly in air and
is very reactive with water, generating sufficient heat to ignite the evolved hydrogen. Potassium
is the "universal cation" in biological systems. It is nontoxic, even at soil and plant levels far
in excess of minimum requirements for optimum growth (Barak, 1999). Potassium in nature
occurs only as ionic salts. As such, it is found dissolved in seawater, and as part of many
minerals. The potassium ion is necessary for the functioning of all living cells, and is thus
present in all plant and animal tissues. It is found in especially high concentrations in plant
cells, and among foods, it is most highly concentrated in fruits.
The potassium chemical industry dates from 1861, following the development of the extraction
process to recover potassium chloride from potassium and sodium chloride salt deposits
(Stewart, 1985). Potassium chloride (KCl), known also as muriate of potash, is the most widely
used source of potassium for agricultural crops (Kafkafi et al., 2001).
The exact function of potassium in plant growth has not been clearly defined. Potassium is the
only essential plant nutrient that is not a constituent of any plant parts (McAfee, 2005).
Potassium is associated with the movement of water, nutrients, and carbohydrates in plant
tissue. If K is deficient or not supplied in adequate amounts, growth is stunted and yields are
reduced. Various research efforts have shown that potassium:
stimulates early growth
increases protein production
improves the efficiency of water use
is vital for stand persistence, longevity, and winter hardiness of alfalfa
improves the resistance to diseases and insects
These roles or functions are general, but all are important for profitable crop production (Rehm
and Schmitt, 2002).
Excess potassium in the soil will reduce very considerably the amount of other cations the crop
can take up, and this may lead to crop growth being badly upset by these induced deficiencies
of other cations. The discussion on the general effects of potassium deficiency is complicated

13
by the fact that it depends so much on the relative concentration of other elements, particularly
sodium and calcium in the plant tissues (Russell, 1973).
The potassium cycle is almost entirely inorganic. A major role of potassium in living organisms
is osmotic control and potassium is taken up, retained and excreted in ionic form (K+). The
amount of potassium in soil solution is relatively small but is in near equilibrium with usually
the much larger amount of exchangeable potassium from which it is replenished. Soils also
contain potassium in more slowly exchangeable forms which act as sources for crops.
Potassium present in clay minerals (lattice-K) becomes available in exchangeable forms as
these minerals weather. This is a long term process and the amount of potassium made available
each year depends on the proportion and types of clay present in the soil (FWAG). The major
forms in which potassium is held in soils and the changes it undergoes as it cycles through the
soil-plant system are shown below (Figure 1) (Brady and Weil, 2008).
Figure 1 The classical potassium cycle
2.1 Forms of Potassium in Soil
Potassium is quite abundant in soils, typically ranging from 0.5 to 4.0%. Of this, only a small
part is present in water-soluble and exchangeable forms (potassium ion K+), and readily
available for plant uptake, usually less than 1% of the total. Apart from nitrogen, K is a mineral
nutrient that plants require in the largest amount (Marschner 1995 in Scherer et al., 2003).
Potassium, among the mineral cation required by plants, is the largest in size (r = 1.33 Å, Table
1). thus, the number of O2- ions surrounding it in mineral structures is high, 8 – 14, and

14
consequently the strength of each K‒O bonds is relatively weak. Potassium, relative to Ca2+,
Mg2+, Li+, and Na+ ions, has a higher polarizability but NH4+, Rb+, Cs+, and Ba2+ are some of
the cations of interest which have even higher values (Table 1). Other things being equal, the
higher the polarizability the more strongly the cation is attracted in exchange reactions
(Helfferich, 1962) since the distance of closest approach is less (Rich, 1968).
In regard to hydration, however, potassium has a low hydration energy compared to Mg2+, Al3+,
Ca2+, Na+, and Li+ (Table 1). This means that in the interlayer space, K+ ions would cause little
swelling and have less effect on other groups, including organic molecules in the interlayer
space, than the other ions commonly found in these positions (Rich, 1968).
Table 1 Radius, polarizability and hydration energy of certain cations (after Rich, 1968)
Cation Radius, Å Polarizability, Å3 Hydration energy, kcal/g.ion
First shell Total shells
Li+ 0.6 0.02 71 74
Na+ 0.95 0.21 51 51
K+ 1.33 0.97 34 34
Rb+ 1.48 1.47 27 27
Cs+ 1.69 2.37 21 21
Mg2+ 0.65 0.17 300 411
Ca2+ 0.99 0.44 227 311
Sr2+ 1.13 0.84 189 263
Ba2+ 1.35 1.63 163 227
NH4+ 1.43 1.6 30 30
H+ Very small Negative - -
In soils, potassium is described as existing in three forms. These are generally agreed to be:
unavailable
slowly available
readily available
All forms coexist at any point in time in soils and there is a constant change from one form to
another (Figure 2). That is, these three forms are said to be in equilibrium with each other.
Unavailable Potassium: Depending on soil type, approximately 90-98% of total soil K is
found in this form. Feldspars and micas are the primary minerals that contain most of the K.
Plants cannot use the K in this crystalline-insoluble form. Over long periods of time, these
minerals weather (break down) and K is released. This process, however, is too slow to supply
the full K needs of field crops. As these minerals weather, some K moves to the slowly
available pool. Some also moves to the readily available pool (see Figure 2).
Slowly Available Potassium: This form of K is thought to be trapped between layers of clay
minerals and is frequently referred to as being fixed. Growing plants cannot use much of the

15
slowly available K during a single growing season. This slowly available K is not measured by
the routine soil testing procedures. Slowly available K can also serve as a reservoir for readily
available K. While some slowly available K can be released for plant use during a growing
season, some of the readily available K can also be fixed between clay layers and thus
converted into slowly available K (see Figure 2). The amount of K fixed in the slowly available
forms varies with the type of clay that dominates in the soil.
Figure 2 Relationship among different form of potassium in the soil-plant system. (Source:
Regents of the University of Minnesota)
Readily Available Potassium: Potassium that is dissolved in soil water (water soluble) plus
that held on the exchange sites on clay particles (exchangeable K) is considered readily
available for plant growth. The exchange sites are found on the surface of clay particles. This
is the form of K measured by the routine soil testing procedure.
Plants readily absorb the K dissolved in the soil water. As soon as the K concentration in soil
water drops, more is released into this solution from the K attached to the clay minerals. The
K attached to the exchange sites on the clay minerals is more readily available for plant growth
than the K trapped between the layers of the clay minerals.
The relationship between slowly available K, exchangeable K, and water-soluble K are
summarized below:

16
Slowly available K
Exchangeable K
Water-soluble K
Notice that when the arrows go in both directions, one form of K is converted to another. The
rate of conversion is affected by such factors as root uptake, fertilizer K applied, soil moisture,
and soil temperature (Rehm and Schmitt, 2002).
2.2 The Sources of Potassium in Soil: Classical View
The K content in a soil is a reflection of its parent material, degree of weathering, and amount
of K added minus losses (Bertsch and Thomas, 1985):
K Inputs to soil:
Plant and animal residues;
Animal manures;
Rainfall;
Irrigation water;
Fertilizers;
Aeolian dust.
K Outputs from soil:
Crop removal;
Leaching to subsoil or groundwater is of little or no consequence;
Runoff/erosion of topsoil.
Crop removal, irrigation and fertilization are very important factors in cropped soils, whereas
for soils under pasture or forest and range, crop removal and fertilization may be of little or no
importance. Hence, an indication of the native K status of soils can be obtained from pasture,
forest, or range samples, whereas the K status of cropping soils is much more difficult to assess,
yet quite important in relation to their K nutrition status (Bertsch and Thomas, 1985).

17
2.2.1 Parent Materials and Mineral Weathering
The amount of K supplied by soils varies due to large differences in soil parent materials and
the state of weathering of these materials. Potassium is present in igneous, sedimentary, and
metamorphic rocks and comprises about 25g kg-1 (2.5%) of the earth’s crust (Stewart, 1985).
Mineral soils generally range between 0.04 and ≥ 3% K. The most important source of
potassium in mineral soils are the primary aluminosilicates, which include the K-feldspars,
biotite, and muscovite micas, and the secondary aluminosilicates, comprising the hydrous
micas (illite) and the continuum of their weathering products.
According to Ahrens (1965) the K-feldspars comprise approximately 15% of the total
lithosphere. The relative importance of K-feldspars in defining the K status of soils in relation
to K+ availability is very dependent on the intensity of weathering, time of deposition or
exposure and other factors (Bertsch and Thomas, 1985). The most common clay mineral
formed is kaolinite. In the weathering of feldspars to kaolinite, potassium, sodium, calcium and
silicon are released from the feldspar structure and go into solution. Since the speed of chemical
reactions increases with increasing temperature, weathering occurs at a much faster rate in
tropical areas than in more temperate ones. Feldspars generally only remain unaltered in very
arid climates (Gore, 2008) and quite cold climates (Churchman, 1978).
Micas are primary minerals of the 2:1 phyllosilicate group in the silicate mineral class. The
micaceous minerals present in most soils generally range from 8.3% K for the soil micas to
3.3% K for the hydrous micas or illites. The structural differences between the various mica
minerals are of great significance in determining the ease of weathering and K release
characteristics. Micaceous minerals and their weathering products are the most important
sources of plant available K+ in a soil system; however, as with the K-feldspars, the
relationships between K supply and crop demand are dependent on the intensity of weathering,
time of deposition, and relative composition of the soil mineral suite, rather than parent
materials, particularly for more highly weathered soils (Bertsch and Thomas, 1985).
Micas in soil are almost always inherited from the parent material. Micas are
thermodynamically unstable in most soil environments. That said, their rates of weathering are
often very slow and they may persist for many thousands of years. The weathering of micas
produces a variety of secondary products having a range of properties and degrees of disorder.
Weathering occurs most rapidly through the loss of interlayer cations and their exchange for
cations present in the soil solution. Other changes also occur, however. The layer charge of the

18
secondary products is generally lower than that of the mica parent material, so charge reduction
processes must have occurred in conjunction with the loss of interlayer cations (Nater, 2000).
2.2.2 K Inputs to the Soil
Of the K removed by plants, some will be returned to the soil in plant residues, leached from
plant foliage, or returned in the waste of animals feeding on the vegetation (Syers, 1998).
Applying farmyard manure to cropped land and spreading wood ash were observed to improve
crop growth many centuries ago (Johnston, 2003). Wood ash contains about 5% K that is
readily available to the plants. Manure is a good source of K for plant growth. The amount of
potassium in the manure will depend on the animal, its diet, and the way the excreta is handled.
Most of the potassium will be immediately available to the crop, but it must be applied at the
correct time (Johnston, 2003). The K in manure is inorganic. Unlike some of the other manure
nutrients, there are no transformations required by soil microorganisms to make potassium
readily available for plant uptake. K is relatively mobile in coarse textured or organic soils and
less mobile in fine textured soils.
The supply of naturally occurring, plant-available potassium in the soil plus the amounts
recycled through organic manures and residues is usually too small to achieve economically
acceptable yields. Assuring proper nutrition for crop plants generally requires the addition of
fertilizers to the soil. The fertilizers are more easily managed and can be applied with greater
accuracy than manures. Two materials are available for soil K application: muriate of potash
(61% K2O) and sulphate of potash (51% K2SO4) (McAfee, 2005).
Application of potassium fertilizer will be determined by factors such as soil potassium level,
soil type, time of the year and intensity of use of the site. Sandy soils or soils with low cation
exchange capacity (CEC) will require light frequent applications of potassium fertilizer as
opposed to clayey type soils with high to very high levels of potassium. Soils with high levels
of other cations such as calcium, magnesium or sodium will also probably require more
frequent, light applications of potassium. As use of the site increases, so should the amount of
potassium fertilization. Spring and autumn is the most important times of the year to make
potassium fertilizer applications (McAfee, 2005).
Potassium in soluble form is also present in rain and irrigation water, especially in irrigation
with wastewaters from agri-industry processes. These wastewaters all have high levels of
potassium (from 13-20 mg L-1 for municipal wastewater to 10,000 – 200,000 mg L-1 for the
olive oil processing industry) (Arienzo et al., 2009). The annual amount of potassium which

19
comes into the soil with rainwater ranges from 1 to 10 kg per ha (depends from quantity and
location) (Prokoshev, 2005). The aeolian dust suspended in the atmosphere and subsequently
deposited on land also contains some potassium. While potassium which comes with irrigation
water to the soil could be managed, aeolian dust movement and rainfall are largely controlled
by processes related to climate.
2.2.3 K Outputs from the Soil
Crops remove large amounts of potassium from soil: from one-fifth (e.g., in cereal grains) to
nearly all (e.g., in hay crops) of the potassium taken up by plants may be exported to distant
markets, from which it is unlikely to return (Brady and Weil, 2008). Some potassium is lost
with eroded soil particles and in runoff water, and some is lost to groundwater by leaching
(Brady and Weil, 2008). If clay is abundant in the subsoil, potassium leached from the surface
soil may become concentrated there in exchangeable and fixed forms. Erosion of surface soil
in extreme cases may cause an appreciable loss of available potassium by the removal of
fertilizer particles and of soil particles and organic matter that have high exchangeable
potassium content. Because the total content of potassium usually does not vary abruptly with
depth, erosion does not alter appreciably the total potassium of the surface soil (Reitemeier,
1957).
2.3 Potassium in Clay Minerals
Most of the potassium that is readily available to plants exists as exchangeable ions principally
on clay mineral surfaces. As this potassium is removed, it is replaced at various rates depending
on the amount and characteristics of the potassium-bearing minerals present in the soil (Rich,
1968).
Soils contain varying amounts of K-bearing minerals constitute a major K reserve. The
aluminosilicates are the most abundant K-bearing minerals. They include primary minerals,
namely K-feldspars, biotite and muscovite mica. They also include the secondary
aluminosilicates, comprising hydrous mica (illite) as well as a continuum of micaceous
weathered or inherited products (Bertsch & Thomas 1985), including mixed layer
phyllosilicates. The primary soil minerals are inherited from the parent material, whereas the
secondary minerals are either inherited from sedimentary rocks or formed in soils during the
weathering process (Rangel, 2008).

20
The ability of the soil to release and fix potassium depends on the minerals present. The more
finely divided the mineral particles, the more quickly they will release nutrients from the
primary materials. The weathering products of the primary minerals occur predominantly in
the fine fraction of the soil. Potassium added to the soil may be fixed by certain clay minerals
sometimes so strongly as to be no longer available to the plants (Semb et al., 1959).
2.3.1 Clay Minerals
The word “clays” was assigned early to fine grained material in geological formations
(Agricola, 1546) or soils (De Serres, 1600). Clays have been identified as mineral species since
the beginning of the 19th century for the production of ceramic materials (Brongniart, 1844).
Since this pioneer work, the definition of clays has varied. Until recently, the definition of clay
minerals was debated. Bailey (1980) restricted the definition of clay to fine-grained
phyllosilicates (from the Greek “phyllon”: leaf, and from the Latin “silic”: flint) (Velde and
Meunier, 2008).
Clays are historically considered to be formed of < 2 µm particles. The use of the optical
microscope for petrographic observations at the end of the 19th century defined the limit of a
recognizable crystal and mineral. Crystals whose size was lower than the resolution of the
optical microscope, 2 µm, were unidentifiable and called clays. However, the value of the size
limit considered to define clays varies according to the particular need of each discipline: 2 µm
for, geologists; 1 µm for chemists; and 4 µm for sedimentologists. It is evident that such a
definition based on the grain size alone is not convenient for the study of mineral species.
Consequently, no size condition will be imposed. Indeed, the size of clay minerals can be much
greater than 2 µm: for instance, 50 µm sized kaolinites or illites are frequently observed in
diagenetic environments. However surface alteration usually produces new phases almost
always of less than 2 µm diameter (Velde and Meunier, 2008).
The formation of clay minerals most commonly occurs under surface (alterites, soils,
sediments) or subsurface (diagenesis, hydrothermal alterations) conditions. Difficult to observe
without using electronmicroscopy (scanning and transmission), they have been abundantly
studied by X-ray diffraction, which is the basic tool for their identification. While the number
of their species is relatively small, clay minerals exhibit a great diversity in their composition
because of the large compositional ranges of solid solutions and their ability to form
polyphased crystals by interstratification (Meunier, 2005).

21
2.3.2 Study Tools
Because clay particles cannot be seen with a microscope, the initial petrographic-mineralogical
approach, optical petrographic microscopy, cannot be used. The foundations of the knowledge
of clay structures were laid, and the basic mineral names given, in the late nineteenth and first
half of the twentieth centuries. However, much imprecision characterized clay mineralogy. In
favourable cases, such as samples with only one mineral type present, it was possible to give a
general chemical formula and, with the aid of the initial stages of X-ray diffraction in the 1920s
– 1930s, establish the structural family of clay samples. However, clays in soils and also
sediments are most often found in aggregates containing several different minerals, with
millions of grains per gram of sample, and the methods of bulk chemistry of powder diffraction
does not permit a sufficiently precise definition of the clay minerals, so that often a mixture of
phases was present when one assumed a pure species (Velde, 1992).
As the normal means of identification could not be used, clay mineralogy had to wait for new
technology to come to its aid. The new methods refined that of X-ray diffraction, which allows
one to determine the phases present rapidly and with precision. Once the phases are known one
can proceed to an analysis of the aggregate sample. Chemical methods are still employed,
classical as well as those based upon the phenomenon of X-ray fluorescence in macro or micro
(electron microprobe) samples, and infrared spectral analysis and thermo-gravimetric analysis
are also very useful in determining and defining the specific characteristics of clays (Velde,
1992).
In the past 20 years or so synchrotron-based X-ray absorption spectroscopy (XAS)
techniques have become generally available for investigating the crystal structures and surface
chemistry of clays and clay minerals. XAS is a general term denoting a range of X-ray
spectroscopic techniques based on scattering, absorption and emission (fluorescence, auger) of
X-rays by matter. It extends diffraction methods by allowing detailed local (short-range)
structural information to be obtained but can be regarded mainly as a supplementary technique
for clay structure analyses (Gates, 2006).
X-ray diffraction (XRD) remains the most important method for identifying soil minerals
(Schulze, 1989). XRD deals with distances between atomic planes (Meunier, 2005). Soil
minerals are usually studied using the powder diffraction method. A powdered sample, with
particles typically < 50µm in diameter, is placed in the diffractometer and irradiated with x-
rays. A plot of diffracted x-ray intensity versus twice the diffraction angle – i.e. 2θ – is obtained.

22
A simple mathematical relationship called Bragg’s law is then used to relate the peaks on the
x-ray chart with the distances between the diffracting planes of atoms within the crystals
(Schulze, 1989).
Once a mineral phase has been identified based on its diffraction peaks, additional information
often can be obtained from diffraction line widths. Well-crystallized minerals of sand and silt
size give sharp diffraction lines whose widths are determined only by broadening caused by
the x-ray diffractometer itself. Clay-sized particles show broader lines caused by diffraction
effects from the small size of the particles. The smaller the particles are, the broader the
diffraction lines (Schulze, 1989).
The major problem in XRD is that, since clay particles are very small, a coherent domain in a
single crystal will also be very small and will not give strong diffraction maxima, so that most
of these maxima will be invisible or only faintly visible. There are insufficient atoms present
in any one plane to give a satisfactory intensity of diffracted x-rays. This is aggravated by the
fact that the clays are found essentially in a two-dimensional form, due to their sheet structure.
In addition, if the greatest diameter of a clay particle is 2µm, the smallest is smaller by a factor
of 10-20 or more. This reduces the diffraction power of the atomic planes even more in most
of the crystallographic directions. As a result, XRD had to wait for a clever mechanism to be
devised to reinforce the signal coming from the crystal lattice (Velde, 1992).
Thermo-gravimetric analysis determines the differential weight loss associated with energy
changes as a sample is heated (Grim, 1968). Heating of clays at a regular rate affects weight
loss depending upon the energy of retention of water in or on the clay structures. All clays have
at least two, at times three or four, types of water or hydrogen ion in or on their crystallites.
The binding energy of these types of water can be used to identify the clay minerals (Velde,
1992). The method is less sensitive than differential thermal analysis (Grim, 1968).
Differential thermal analysis (DTA) is based upon whether the thermal reaction which occurs
as a clay mineral is heated is exothermic or endothermic. Here not only water loss (endothermic
reactions for the most part) but also eventual recrystallization and recombinations (exothermic)
are observed. The complexity of the full mineral transformations and the problems of kinetics
concerning these reactions make interpretation of full DTA diagrams very complex. Such
methods are rarely employed in routine investigations; they are left for the more specialised
applications of mineral species characterization or certain industrial applications such as
ceramics (Velde, 1992).

23
Infrared (IR) spectral analysis has been used to characterize clays for some time, and to a
lesser extent to identify them. In clay studies IR spectra are produced by passing a multi-
wavelength infrared beam through a finely dispersed sample or reflecting it off a powdered
sample. This method is somewhat less sensitive to the differences in clay structures and as a
result its use as a method of identification, especially in a mixed-phase sample, is difficult.
However, the method is useful in identifying certain features of pure phases. An XRD study
for identification of clay minerals is usually necessary before this method is used (Velde, 1992).
The development of the electron microscope has permitted the precise determination of the
shape and size of the particles of the various clay minerals (Grim, 1968). Several derivative
methods of analysis are based upon the same principle: the physics of interaction of a beam of
electrons with crystalline (or non-crystalline) matter (Velde, 1992).
The scanning electron microscope (SEM) uses the flux of secondary and backscattered
electrons from the material to form an intensity image of the material bombarded by electron
beam. The resulting cathode tube realization indicates the three-dimensional aspect of the
sample. This is very useful in the identification of textures and shapes of mineral grain
aggregates. The definition or resolution of the image is of the order of 0.01µm (Velde, 1992).
Transmission electron microscopes (TEM) are used to see the shapes of crystals in essentially
a two-dimensional plane. The clays are deposited on a carbon-coated copper grid (with holes
in it so that the clays can be “seen” by the electron beam). The electron beam is absorbed more
by the clay than by the carbon film and thus a shadow image of the clay particle is produced.
The TEM resolution is greater than that of SEM (µm). Their main use is that of identifying the
crystal shapes of clays and their dimension (Velde, 1992).
The newer high-resolution transmission electron microscopes (HRTEM) provide a smaller
dimension for the study of clay. Transmission micrographic methods give resolutions of less
than 2 Å. This allows one to “see” the levels of atomic planes in the clays with ease and in
special cases the atoms themselves (Velde, 1992).
The electron microprobe is essentially an x-ray fluorescence spectrometer hooked up to an
electron microscope. The method is a reliable and reasonably rapid one which can be used to
obtain an excellent chemical analysis of a very small quantity of clay material. The method of
analysis allows one to use a normal petrographic thin section (thickness 30 µm) to locate the
precise environment of clay formation or the precise grains which give rise to new clay
minerals. In weathering, for example, it is possible to see what clays form from which minerals.

24
The resolution of the method is close to that of the petrographic microscope and therefore the
old limitations are still present: a single clay particle cannot be designated for analysis as in
TEM (Velde, 1992).
Cation exchange capacity (CEC) is a measure of the soil’s capacity to exchange ions (a charge
on a surface). The surface of the clay can be of two sorts, external and internal. The external
exchange capacity is largely dependent upon broken bonds and surface growth defects and
reflects the average crystalline size but the result is affected by the cation measured. The
internal exchange capacity is much more interesting in that it reflects the overall charge
imbalance on the layer structure and the absorption capacity of the clays. The exchange
capacity is an estimate of both the number of ions adsorbed between the layers of a clay
structure and of those adsorbed on the outer surfaces (Velde, 1992).
The tools listed above are those in common use today and can be classified into the zones and
scales of interest in clay structures.
1 XRD and SEM are methods used to study the form and structure of crystal aggregates.
Information can be derived concerning the crystals by using monomineral samples but
always by using aggregates of crystals. Average interplanar distances and the average
composition of the atomic planes can be derived from XRD study. The morphology of
aggregates is determined by SEM.
2 DTA and TGA studies are concerned with the water molecules in clays. Such studies
are done on clay aggregates.
3 TEM investigates the shapes of individual crystals and the compositions of these
individual crystals. The observation is looking down on the top of the sheet-like clay
grains, that is, the direction of the greatest lateral extension of the crystals.
4 IR methods investigate the relations of individual molecules in the crystals, OH, H2O,
Si-O etc. This is then within the crystals but the method is limited to multi-crystalline
aggregates.
5 At the same level or below it is the HRTEM analysis methods. Here the atomic layers
of the atoms themselves are visible to the investigator’s eye via the electron beam.
6 Cation exchange is used to determine the amount of exchange ions which can be fixed
on clay structure and the nature and proportions of the various exchangeable cations.

25
The relations of scale and method are summarized in Figure 3. The sequence indicates that of
scale with XRD and SEM (scanning electron microscope) being the largest-scale methods and
HRTM giving the smallest-scale view of clay particles (Velde, 1992).
Figure 3 Uses of different methods of analysis to determine the properties of clays (Velde,
1992)
2.3.3 Structure of K-bearing Minerals
Clay minerals, i.e. phyllosilicates, are composed of a combination of two types of layer
structures which are coordinations of oxygen or hydroxyl anions with various cations. Two
types of sheets occur following the number of anions coordinated with the cations, one of six-
fold coordinations (tetrahedra) and the other of eight-fold coordinations (octahedra) (Velde and
Meunier, 2008).
Tetrahedra arranged into sheets are common to the structures of all phyllosilicates. Octahedra
arranged into sheets are present in the structures of phyllosilicates and in some hydroxide
minerals as well. Different combinations of tetrahedral and octahedral sheets give rise to the
different clay mineral structures. Figure 4 shows ideal crystal structures based on the closest
packing of spheres. The real structures have varying degrees of distortion of this ideal structure
(Schulze, 1989).
Phyllosilicates are divided into two groups, 1:1- and 2:1-type minerals, based on the number
of tetrahedral and octahedral sheets in the layer structure. The 1:1 layer structure consists of a
unit made up of one octahedral and one tetrahedral sheet, with the apical O2- ions of the
tetrahedral sheets being shared with (and part of) the octahedral sheet (Figure 5). There are
three planes of anions. One plane consists of the basal O2- ions of the tetrahedral sheet, the
second consists of O2- ions common to both the tetrahedral and octahedral sheets plus OH-

26
belonging to the octahedral sheet, and the third consists only of OH- belonging to the octahedral
sheet (Schulze, 1989).
Figure 4 Types of layer structure of clay minerals (Sivakugan, 2001)
In contrast to the 1:1 minerals, which are represented in soils by only two major minerals
(kaolinite and halloysite), the 2:1 minerals are structurally more diverse and are represented by
several mineral species. The 2:1 layer structure consists of two tetrahedral sheets bound to
either side of an octahedral sheet (Figure 5). There are four planes of anions. The outer two
planes consist of the basal oxygen (O’s) of the two tetrahedral sheets, while the two inner planes
consist of oxygens common to the octahedral sheet and one of the tetrahedral sheets, plus the
hydroxyls (OH’s) of the octahedral sheet (Schulze, 1989).
Figure 5 Structure of 1:1 and 2:1 clay minerals (Sivakugan, 2001)
Many clay materials are composed of more than one clay mineral, and the clay minerals may
be mixed in several ways. The mixture may be of discrete clay-mineral particles in which there
is no preferred geometric orientation of one particle with respect to its neighbouring clay-
mineral particles. Another type of mixing is the interstratification of the layer clay minerals in
which the individual layers are of the order of a single or a few aluminosilicate sheets. These
mixed-layer structures (MLMs) are a consequence of the fact that the layers of the different
layer clay minerals are very similar, all being composed of silica tetrahedral-hexagonal layers
and closely packed octahedral layers of oxygens and hydroxyl groups (Grim, 1968).

27
These minerals are most frequently found in the soil or upper parts of an alteration sequence.
Their importance as far as mineral stability and transformation is not well known at present. In
some cases, it appears that they are a transition between one structure and another, a sort of
intermediate phase while in others their status is less evident. Their importance, though poorly
understood, is most likely the key to understanding clay mineral stability in many soils. The
most commonly described two-component mixed-layer minerals at Earth’s surface are:
dioctahedral species: illite/smectites (I/S) (Figure 6) and kaolinite/smectites (K/S).
They are usually randomly ordered (regular forms of I/S occur in some soils e.g.
(Churchman, 1978)) and abundant in soils
trioctahedral species: biotite-vermiculite, chlorite-vermiculite or smectite (saponite).
These MLMs are ordered and sometimes regular. They are formed in weathered rock
microsystems (Velde and Meunier, 2008)
For clay minerals, the type of bonding within the crystal structure, the extent and type of
disorder within the crystal or at crystal terminations, and crystal size are mineral properties that
determine the rate at which weathering occurs and potassium is released. These crystal
properties also determine, to a great extent, the exchange properties, including potassium-
selectivity and fixation (Rich, 1968).
Figure 6 Structure of an illite-smectite mixed-layer clay (Aldega and Eberl, 2005)
Because of their small size, individual clay mineral crystals are currently observed using
transmission electron microscopes (TEM). Most often, clay minerals appear as complex bodies
whose origin may be natural (particles, aggregates) or due to artefacts (sedimentation during
drying the grid preparation). Because of the difficulty of distinguishing artefacts from natural
bodies, definitions are needed for particles, aggregates and natural coalescence:

28
Particles. Including twinned crystals, these often exhibit re-entrant angles allowing the
boundaries of coalescing crystals to be recognized. These natural particles, contrary to
artefacts, cannot be dispersed by chemical or ultrasonic treatment. They result from crystal
growth processes on individual crystallites (epitaxy) or on an association of crystallites
(coalescence),
Aggregates are units of higher organization in which crystals and/or particles are
bonded together by Coulomb forces or by metal hydroxide or organic matter cements. They
result from chemical and/or physical processes in soils.
Schematical representations of epitaxy, aggregation and coalescence are shown in Figure 7.
Figure 7 Main types of particles and aggregates of clay minerals (Velde and Meunier, 2008)
2.3.4 Brief Description of K-bearing Minerals
Micas
The micas are 2:1 phyllosilicates consisting of unit layers each composed of two Si, Al—O
tetrahedral sheets between which is a M—O, OH octahedral sheet, where M consist of Al3+,
Fe2+, Fe3+, Mg2+, and some other cations (Figure 8). Potassium ions occupy positions between
the unit layers in facing ditrigonal holes. Micas are classified in two major groups, dioctahedral
and trioctahedral. In the dioctahedral group, two out of three octahedral cation positions are
occupied, whereas in trioctahedral micas, all three positions are occupied (Rich, 1968).
Mica in soils is usually inherited from the parent rock and is likely to occur in soils derived
from various igneous and metamorphic rocks, as well as from sediments derived from them.
The most common mica group minerals in soils are three K-containing micas: muscovite,
biotite and phlogopite. The tetrahedral sheets of all three are similar, but their octahedral sheets
differ. Biotite and phlogopite are trioctahedral, with phlogopite containing Mg2+ in the

29
octahedral sites, while biotite contains Mg2+ and Fe2+. Muscovite is dioctahedral and contains
Al in the octahedral sheet (Schulze, 1989).
Figure 8 Diagrammatic sketch of the structure of mica (Grim, 1968) and a transmission
electronic micrograph (Churchman, 1986) of an example of this mineral
Mica in the clay fraction of soils and sediments often has poorer crystallinity, lower K content,
and higher H2O content than the macroscopic muscovite that it most closely resembles. This
clay-sized mica is often referred to as illite. Glauconite is similar to illite, but contains more Fe
and less Al in its octahedral sheet than illite. Both illite and glauconite are poorly defined terms,
and much of what has been described as illite or glauconite may be a mixture of minerals rather
than one discrete phase (Schulze, 1989).
Micas weather to other minerals, particularly to vermiculites and smectites, and the K+ released
during weathering is an important source of K for plants. As a rule, the dioctahedral micas such
as muscovite are more resistant to weathering than trioctahedral micas such as biotite and
phlogopite. Consequently, muscovite is more likely than biotite or phlogopite to occur in more
weathered soils (Schulze, 1989).
Through K release, micas in soils are an important mineral source of K for growing plants. The
natural K-supplying power of a soil depends to a considerable extent on the kinds, amounts,
and particle size of any mica present and upon factors that affect the release of K by these
minerals, such as wetting and drying of the soil (Fanning et al., 1989).
Vermiculites
Expansible layer silicates, the vermiculite and montmorillonite-saponite groups, are
particularly important in exchange reactions, because of the very extensive internal exchange
surface of these minerals (Rich, 1968). Vermiculite consists of the 2:1 layer structure described

30
for mica, but instead of having a layer charge of ~ 1 per formula unit and K+ in interlayer
positions, vermiculite has a layer charge of 0.9 to 0.6 and contains exchangeable cations,
primarily Ca and Mg, in the interlayer (Figure 9). The high charge per formula unit gives
vermiculites a high CEC and causes them to have a high affinity for weakly hydrated cations
such as K+, NH4+, and Cs+. Fixation of K+ by vermiculites can be significant in soils high in
vermiculite (Schulze, 1989) which are held in the interlayer region of the mineral.
Figure 9 Diagrammatic sketch of the structure of vermiculite (Grim, 1968) and a
transmission electronic micrograph (Churchman, 1986) of an example of this mineral
Vermiculite is known to be widely distributed, and it has the widest particle-size distribution
of the secondary phyllosilicates, having been found in all fractions from fine clay to greater
than coarse sand (Douglas, 1989). Vermiculites in soils are believed to form almost exclusively
from the weathering of micas and chlorites. The dioctahedral vermiculites are the most
common in soils, perhaps mirroring the relative stability of muscovite (dioctahedral) over
trioctahedral micas. The weathering of micas to vermiculite (or smectites) is believed to occur
by replacement of K+ in the interlayer sites with hydrated exchangeable cations. The integrity
of the 2:1 layer is preserved, but there is a reduction in the layer charge (Schulze, 1989).
Montmorillonite-saponite (Smectites)
The montmorillonite-saponite (smectites) group is similar to the vermiculite except that the
charge density in less [0.25-0.5 per O10(OH)2] (Rich, 1968). As in vermiculite, the interlayer
contains exchangeable cations (Figure 10). The dioctahedral smectites are the most common
in soils. Their compositions vary between the three end-members montmorillonite, beidellite,
and nontronite. In montmorillonite, Mg substitutes for Al in the octahedral sheet to produce the
layer charge. In beidellite and nontronite, layer charge is produced in the tetrahedral sheet.
Beidellite contains Al in the octahedral sheet, while in nontronite the octahedral sheet contains

31
Fe. Smectites do not fix K+ as readily as do vermiculites because of their lower layer charge
(Schulze, 1989).
Figure 10 Diagrammatic sketch of the structure of smectite (Grim, 1968) and a transmission
electronic micrograph (Churchman, 1986) of an example of this mineral type
Smectites are important minerals in temperate-region soils because of their high surface area
and their adsorptive properties. Smectites shrink upon drying and swell upon wetting. This
shrink-swell behaviour is most pronounced in the Vertisol order and in vertic subgroups
(Schulze, 1989). The expansive nature and negative charge of smectites cause them to be
extremely reactive in soil environments. Smectites in the surface of a soil may be responsible
for the adhesive property that helps prevent sheet erosion, while those in the subsurface may
adsorb large quantities of H2O, diminish the shear strength, and cause the soil to move
downslope (Borchardt, 1989).
Illite
Illite has caused many nomenclature problems for clay mineralogists. Illite was proposed (Grim
et al., 1937) as a name for the “mica occurring in argillaceous sediments” (Fanning et al., 1989).
The name was derived from the state of Illinois where it was first described. It has been widely
used as a name for clay minerals with a ~10 Å d (001) spacing which show substantially no
expanding-lattice characteristics, i.e. no swelling clay components (Meunier and Velde, 2004).
Grim et al. (1937) gave illite a general unit formula which in fact includes both di- and
trioctahedral structures. Hence illite is a mineral group by this conception and not a specific
mineral. Although this definition is generally accepted by soil scientists, it is not completely
satisfying because in other geological situations (diagenesis, supergene and hydrothermal
alterations), illite is often considered as a mineral species (Meunier and Velde, 2004).
32
According to Grim (1968) the illite clay minerals differ from the well-crystallized micas in
several possible ways, all of which may be exhibited by a given sample; these are as follows:
1) there is less substitution of Al3+ for Si4+; in the well-crystallized micas one-fourth of
the Si4+ are replaced, whereas in the illites frequently only about one-sixth are replaced;
2) there is some randomness in the stacking of the layers in the c direction, and the size of
the illite particles occurring naturally is very small, of the order of 1 to 2µm or less.
Since then, the illite definition has been progressively improved. In 1982-83 the Clay Minerals
Society (USA) Nomenclature Committee (CMS, 1984) made a more precise definition of illite
where the mineral illite is:
1 Non-expandable.
2 A dioctahedral mineral.
3 Ionic substitutions occur in both the octahedral and tetrahedral sites of the mica
structure.
4 Interlayer substitutions can include not only potassium but also hydronium (H3O+) ions.
5 Interlayer charge ranges between 0.8 and 0.6.
6 Mineral structure (polytype) is not considered as valid criteria.
More accurate definition was given by (Srodon and Eberl, 1984) who restricted the term “illite”
to the non-expanding dioctahedral aluminous, potassium mica-like minerals occurring in the
clay-size (< 4µm) fraction of a geological sample (Meunier and Velde, 2004). However, this
later definition is not fully satisfying either since it is strictly based on XRD analysis of a given
size fraction (Meunier and Velde, 2004) and a particle size criterion (< 4µm) is not acceptable
for strict mineral classification purposes (Fanning et al., 1989) even though clay minerals are
normally relegated to the clay sized fraction of a geologic material (< 2µm) (Meunier and
Velde, 2004).
Kaolinite and Halloysite
Kaolin minerals are composed of Al-based octahedral sheets and Si-substituted tetrahedral
sheets in a 1:1 relationship. Kaolinite and halloysite are 1:1-layer- based aluminosilicates with
the same ideal composition. Halloysite may be hydrated, in which case there is water between
the structural layers. Collectively they are referred to as kaolins. These minerals typically have
low surface areas and low cation- and anion-exchange capacities (Dixon, 1989). In contrast to
the 2:1 layer silicates, cation exchange in kaolinite and halloysite is at external surfaces only
(Rich, 1968). Kaolinite is one of the most widespread clay minerals in soils, especially those

33
of warm, moist climates. Both kaolinite and halloysite are products of acid weathering, but
halloysite is formed more rapidly in soils of volcanic origin (Dixon, 1989).
Kaolinite is composed of a tetrahedral and an octahedral sheet, which constitute a single 0.7nm
layer in a triclinic unit cell. Two-thirds of the octahedral positions are occupied by Al ions, and
the tetrahedral positions are occupied by Si ions. Aluminium ions are arranged in an orderly
distribution occupying two rows of sites parallel to the x-axis (Figure 11). Every third row of
octahedral sites is vacant (Bailey, 1966). Hydroxyl ions make up the surface plane of the
octahedral sheet and are one-third of the inner (shared) plane of anions in each 0.7-nm layer.
The surface OH’s bond through their H’s to the O plane of the adjacent layer. Halloysite
contains the same basic 0.7-nm layer as kaolinite, but the stacking sequence of layers is
different in each mineral. Because only two of every three octahedral positions are occupied
by Al in the kaolin subgroup members, they are termed dioctahedral (Dixon, 1989).
Figure 11 Diagrammatic sketch of the structure of Kaolinite and Halloysite (Grim, 1968) and
transmission electronic micrographs (Churchman, 1986) of examples of these minerals
Halloysite, with two interlayer H2O molecules per formula unit and 1.0-nm spacing when fully
hydrated, is a member of the kaolin subgroup. Structural layers of halloysite exhibit disordered
stacking in both a and b directions (X and Y axes on Figure 11) (Brindley and Robinson, 1946).
Due to the disorder of halloysite, the structure of the interlayer H2O has largely eluded direct
investigation, and has been considered rigid like that of ice (Dixon, 1989).
There is a general inverse relation between soil fertility and kaolinite content because kaolinite
has neither a significant cation exchange capacity, or useful cations which can be attracted and
desorbed by plants. Further it is devoid of potassium, and hence not a reservoir for this precious
element. Thus kaolinite is often more of a hindrance to agricultural productivity of a soil than
anything else (Velde and Meunier, 2008).

34
Potassium Feldspars
Feldspars are found in virtually all sediments and soils in quantities that vary with the nature
of the parent material and the stage of weathering (Huang, 1989). These are framework silicates
consisting of SiO4 and AlO4 tetrahedra linked in all directions through the oxygen of the
tetrahedra. Potassium in the potassium-feldspars and sodium, calcium, and other cations in
other feldspars, are held in the interstices of the Si, Al—O framework. The negative charge
produced by aluminium in tetrahedral coordination is balanced by the positive charge of the
cations in the interstices. The formula for the various potassium feldspars is KAlSi3O8, showing
that only one out of four of the tetrahedra contain aluminium (Rich, 1968). The three principal
varieties of K-feldspar are: microcline (low temperature origin), orthoclase (medium
temperature origin), and sanidine (high temperature origin). Occurrence, weathering processes
and distribution of K-feldspar are described earlier in this Chapter.
Zeolites
Zeolite are crystalline, hydrated aluminosilicates of alkali and alkaline earth cations that
possess infinite, three-dimensional crystal structures. They are further characterized by their
abilities to hydrate and dehydrate reversibly and to exchange some of their constituent cations,
both without major change of structure. Along with quartz and feldspars, zeolites are
tectosilicates – i.e., they consist of three-dimensional frameworks of SiO44− tetrahedra wherein
all O’s of each tetrahedron are shared with adjacent tetrahedra. This arrangement reduces the
overall O/Si ratio to 2:1, and if each tetrahedron were to contain Si as its central cation, the
structure would be electrically neutral, as is quartz (SiO2). In zeolite structures, however, some
of the quadrivalent Si is replaced by trivalent Al, giving rise to a deficiency of positive charge
in the framework. This charge is balanced by monovalent and divalent cations, principally Na+,
K+, Ca2+, and Mg2+, elsewhere in the structure (Ming, 1989). Zeolites can act as ionic sieves
with characteristic upper limits on the size of the ion that can permeate these structural
channels. An additional feature of the zeolite group is the presence of water molecules within
the structural channel (Sparks and Huang, 1985).
Zeolites are present in vugs and cavities of basalts and other traprock formations. Furthermore,
zeolites are major constituents in numerous bedded pyroclastics and are some of the most
widespread and abundant authigenic silicate minerals in sedimentary rocks (Mumpton and
Sheppard, 1972). Zeolite occurrences have been recognized in all ages of sedimentary rocks of
pyroclastic origin from late Paleozoic to Holocene. In soils, zeolites may be formed when
35
impeded drainage and soda accumulation maintain a high alkali ion to hydrogen ion activity
ratio, e.g. in sodic and saline-sodic soils (Balder and Whittig, 1968; Stitcher, 1972 in Sparks
and Huang, 1985).
Allophane
Allophane is not a distinct mineral species but rather a series of minerals that are hydrous
aluminosilicates of widely varying chemical composition, characterized by short-range order
(van Olphen, 1971 in Sparks and Huang, 1985). Earlier, allophane had been considered an
amorphous material (Rich, 1968). Since the 1970’s information has been accumulated to
indicate that allophane is not amorphous (without form) and that there is some short-range
order in the structure of allophane (Wada, 1989). In the literature allophane is often coupled
with imogolite (Brigatti et al., 2006; Wada, 1989). Their chemical compositions vary, but
remain within the limits necessary to maintain a predominance of Al—O—Si bonds (Wada,
1989). Although these minerals have been found in soils of different origins and environments,
they are especially abundant in soils derived from volcanic ash and weathered pumice (Brigatti
et al., 2006). These minerals are often considered to be precursor phases to others. The key to
the presence of both imogolite and allophane is a continuous humid condition. They are likely
to be very important in processes of chemical transfer from surface to lower horizons in acid
soils under temperate climate conditions (Velde and Meunier, 2008).
Allophane consist of hollow, irregularly spherical particles with diameters of 3.5 to 5 nm and
has a Si/Al ratio typically of 1 : 2 to 1 : 1 (Wada, 1989), but allophanes with Si : Al ratios < 1
: 2 and > 1 : 1 may also occur (Figure 12) (Parfitt and Kimble, 1989 in Wada, 1995). Allophane
has a large specific surface area and high chemical reactivity. This mineral is more sensitive to
chemical dissolution than crystalline clay minerals (Wada, 1989). The cation exchange
capacity of allophanes depends on pH, concentration, and ionic species used to measure CEC
(Wada, 1977 in Norrish and Pickering, 1983), but it is usually in the range 20 – 50 cmol+/kg
. Allophane has a definite affinity for K because of its structural configuration. Wada and
Haranda (1969) obtained unusually high CEC values for Japanese soil allophanes when
determined with K salts. Allophane has high anion sorption capacity and soils containing it
retain large amount of phosphate (Norrish and Pickering, 1983).

36
Figure 12 Diagrammatic sketch of the structure of allophane (Grim, 1968) and a transmission
electronic micrograph (Churchman, 1986) of an example of this mineral type
2.4 Potassium in Plant-Soil System
Potassium (K) is a key element for plant growth and K fertilizers are widely used in agriculture
all over the world (about 28,106 t in 2006–07 according to the FAO). Improving knowledge
about the K cycle is considered to be important for a better understanding of the productivity
and sustainability of many ecosystems (Tripler et al., 2006) and to design management options
that would favour efficient use of K and secure a sustainable future for global K reserves
(Öborn et al., 2005 in Barré et al., 2008).
Among major nutrients, K is usually the most abundant in soils. A major proportion of soil K
(Figure 13) occurs as structural K in feldspars and interlayer K in micaceous minerals (except
in highly weathered soils where these minerals are depleted or absent) (International Potash
Institute, 1987; Munson, 1985; Sparks, 1987 in Hinsinger, 2002).
Figure 13 The various forms of soil K and the chemical processes involved in soil K
dynamics (Hinsinger, 2002)

37
A minor proportion of soil K (usually much less than 1%) is adsorbed on negatively charged
soil constituents, namely clay minerals and organic matter. A marginal part is present as free
K-ions in the soil solution. Bulk soil solution concentrations usually amount to 100 – 1000 µM
(less than 0.01 – 0.1% of total K). The reason for this rather low concentration of K in the soil
solution and hence restricted mobility of K in soils, compared to other metal cations such as
Na or Ca, is related to its selective adsorption onto some clay minerals (Hinsinger, 2002).
Because of its ionic radius and small hydration energy, K-ions perfectly fit into the interlayer
sites of micaceous minerals (micas, illites and mica-derived clays) (Dixon and Weed, 1989).
These sites and, to a lesser degree, the sites on the frayed edges of these minerals have thus a
considerably larger affinity for K than for other cations, including divalent cations such as Ca
or Mg (Figure 14) (Hinsinger, 2002).
Figure 14 The various sites of exchange of K-ions in micaceous clay minerals and the
transition between mica and vermiculite layer that occurs when interlayer K is exchanged by
hydrated divalent cations (Hinsinger, 2002)
Clay minerals also contain sites with larger affinity for divalent cations than for monovalent
cations such as K. These sites are located on the planar faces of clay minerals and are thus
dominant in clays such as kaolins and smectites. They also occur in organic compounds. K is
thus much less strongly held in soils dominated by kaolins (tropical soils), sand or organic
matter than in soils dominated by illite-vermiculite clay minerals. Traces of mica-derived clay
minerals can dramatically influence the dynamics of soil K as evidenced in tropical soils that
are apparently dominated by kaolins (Fontaine et al., 1989). More generally, K dynamics is
largely dependent on soil mineralogy which determines both ion exchange and release-fixation

38
processes (International Potash Institute, 1987; Sparks, 1987), i.e., the dynamics of
“nonexchangeable K” (Hinsinger, 2002).
The latter is defined as that (often major) portion of soil K which cannot be exchanged by NH4-
ions. NH4-ions have the same charge as and similar radius to K-ions and can successfully
displace and desorb K only from low K-affinity sites. Readily available K thus comprises soil
solution and easily desorbable K-ions. Nonexchangeable K mostly comprises interlayer K
(high K-affinity sites) of micaceous minerals and structural K of feldspars (Figure 13), i.e., 90
– 99% of total K in many soils. The release of K from feldspar requires a complete and
irreversible dissolution of the mineral and is enhanced under acidic conditions (International
Potash Institute, 1987; Sparks, 1987). The release of interlayer K from micaceous minerals can
proceed similarly or involve an ion exchange process (Figure 13) leading to an expansion of
the phyllosilicate (Figure 14). This reversible release is essentially governed by the
concentrations of K and competing cations in the outer solution (Dixon and Weed, 1989;
Schneider, 1997; Springob and Richter, 1998). Cations which can be responsible for this
release, such as Ca- and Mg-ions, have large hydration energy, contrary to K- or NH4-ions.
Therefore, they remain hydrated when exchanging interlayer K-ions and expand the interlayer
space (Figure 14), making it possible for the release to proceed further, whereas NH4-ions
would block the reaction (Springob, 1999). However, because of the considerable affinity of
these interlayer sites for K relative to Ca or Mg, the release can occur only for extremely low
concentrations of K in the soil solution (Figure 15), in the micromolar range (Springob, 1999;
Springob and Richter, 1998). Conversely, elevated concentrations of K are prone to the reverse
reaction of fixation, i.e., the collapse of expanded layers and concomitant increase in
nonexchangeable K at the expense of readily available K (Hinsinger, 2002).
Figure 15 Effect of solution K concentration on the rate of release of nonexchangeable K
from a soil. Adapted from (Springob and Richter, 1998) in (Hinsinger, 2002)
39
Soil structure plays an important role in determining the quantity of K that is available to plant
roots (Marschner, 1995). In friable soil the roots are normally smooth and cylindrical, whereas
in compacted soil, where root elongation is impaired, roots become stubby and gnarled
(Marschner, 1995; Passioura, 1991). Thus reduced K uptake is common in soils with high
compaction or mechanical impedance because of the relatively low mobility of K (Bennie,
1996). Potassium mobility decreases with decreasing water content and at water potentials
where water availability is still adequate for normal growth, the K diffusion may be
considerably affected (Mengel et al., 2001). Potassium uptake also increases with temperature
(Barber, 1995; Nelson, 1968). Schimansky (1981) found that the increase in K uptake with
temperature in young barley was greater than for Mg or Ca (Öborn et al., 2005).
Any interpretation of the interaction between plants and their substrate must use clay
identification procedures in order to understand the chemical changes and equilibria that occur
(Velde and Barré, 2010). A review of clay mineral assemblages in weathering profiles indicates
that the upper-most zones (A horizon for the most part) contain species that are not present or
less represented in the layers below, the alterite or C horizon. If there is a difference in the A
horizon mineralogy, it must be either due to a higher intensity of weathering due to rainwater
and clay interaction, or to the influence of the chemistry engendered by plants on clay minerals
(Velde and Meunier, 2008)
As it turns out plants strongly affect the chemistry of the soil in which they evolve and in doing
so change the chemistry of the clays present. In order to understand the dynamics of the plant
systems one must be able to identify the clay minerals and hence estimate their chemistry
(Velde and Barré, 2010). Two to one (2:1) clay minerals are known to play a key role in the
soil K cycle (Arkcoll et al., 1985; Hinsinger, 2002 in Barré et al., 2008).
However, 2:1 soil clay minerals do not all contain potassium. Indeed, if we consider potassium
content as fixed or strongly held, i.e. not exchanged by ambient cations, the most common soil
clay types with the 2:1 structure can be classified as follows: (1) illite with high potassium
content, (2) mixed layered illite/smectite (I/S) with variable potassium content, (3) smectite
with low potassium content, (4) hydroxy-interlayered (HI) clay minerals with very low
potassium content (Barré et al., 2007).
Illite is generally assumed to have a rather low capacity to attract and release ambient
exchangeable ions such as Ca, Mg, Na but a high potential to accumulate potassium. It is the
most potassium-rich of the common soil clay minerals. Smectite normally has low potassium

40
content but a high capacity to accept and release ions. It controls for a large part the amount of
exchangeable ions such as Ca, Mg and to a lesser extent K necessary for plant metabolism.
Mixed layered minerals (essentially variable mixtures of illite and smectite layers in the same
crystallites) have of course intermediate properties depending upon the proportion of each
component, illite or smectite, present. Hydroxy-interlayered (HI) are clay minerals whose
layers are closed with hydroxy-aluminium. HI has very low ability to accept or release ions
and they have very low potassium content. Clay mineral potassium content is therefore strongly
linked to illite layer quantity (true illite and illite layers in I/S clay minerals) (Barré et al., 2007).
The mineralogical difference between illite, smectite and HI is to a large extent based on the
layer charge. Illite layers have a 0.8–0.9 charge whereas smectite layer charge can range
between 0.8 and 0.2. HI (hydroxyl interlayered minerals) are generally described as high charge
smectite layer minerals (0.6–0.8) collapsed with hydroxylaluminium. Studies in diagenetic
contexts showed that there is a good agreement between the theoretical definition of illite and
its identification with X-Ray diffraction techniques (Meunier and Velde, 2004). Basically, it is
assumed that illite layers are collapsed with potassium ions and have characteristic X-ray
diffraction peaks near 10 Å (d-spacing = 10 Å = 1 nm). The situation is more complex in soils.
Indeed, several studies reported that HI minerals could collapse to 10 Å if saturated by
potassium ions (April et al., 1986; Egli et al., 2004; Pevear et al., 1984). Reciprocally, illite or
even mica layers could reopen in a potassium depletion context (Hinsinger et al., 1992). These
studies suggest that soil clay minerals which do not correspond to the mineralogical definition
of illite could be identified as illite and vice-versa. In order to avoid these theoretical problems
in the present study, we will use the term ‘‘illite-like’’ for the 10 Å mineral identified as illite
with XRD techniques (Barré et al., 2007).
Previous studies have shown that total soil potassium content tends to increase with depth
because weathering of primary minerals is greater near the surface than at depth (Mohr and van
Baren, 1954; Oh and Richter, 2005). On the contrary, the ‘‘exchangeable’’ potassium pool
tends to increase in the top of soil profiles (Jobbagy and Jackson, 2004; Mariotti, 1982).
Jobbagy and Jackson (2001) proposed that nutrients are ‘‘uplifted’’ in the soil profile through
plant activity which induces this increase of ‘‘exchangeable’’ potassium ions on top of soil
profiles. Figures 16 and 17 illustrate these two opposite trends. In spite of the potential interest
for soil potassium supply, such trends have not been considered for 2:1 clay minerals (Barré et
al., 2007).

41
Figure 16 Total potassium content as a function of depth in various soil profiles. Profiles of
tropical forest, alpine forest and temperate grassland were established respectively thanks to
data by (Egli et al., 2002; Mohr and van Baren, 1954; Oh and Richter, 2005). Lines are added
by visual interpretation (Barré et al., 2007)
Two opposite patterns could be expected for surface soil 2:1 clay minerals. One would be the
destabilization of minerals which lose potassium by the formation of less potassic clay minerals
through water – rock interaction. In this case, as physical and biological alterations are higher
near the surface, one would expect that the ‘illite-like’’ quantity should increase with depth
with a minimum at the plant–soil interface. On the contrary, one could consider that 2:1 clay
minerals may accept potassium translocated by plants through root absorption at depth and thus
acquire an increased potassium content. In this case, ‘‘illite-like’’ layer quantity should follow
‘‘exchangeable’’ potassium distribution with a maximum at the surface and a decrease with
depth (Barré et al., 2007).
Figure 17 Exchangeable potassium variation with depth. This figure is adapted from
(Mariotti, 1982). The increase of exchangeable potassium near the surface conforms to
Jobbagy and Jackson (2004) observations. Adapted from (Barré et al., 2007)
Several studies were conducted in order to investigate general trends of the ‘‘illite-like’’
minerals dynamics in soil. Barré et al. (2007) showed that the impact of potassium translocation

42
should also be taken in consideration for surface soil clay mineral stability in temperate
ecosystems. These authors reviewed several sites where an increase of illite layers at the
expense of smectite layers in the upper part of soil profiles was observed (Barré et al., 2009).
The increase of illitic layers in surface soils was also clearly observed in the data published by
(Ruhe, 1984). In this study, clay mineralogy of samples from 15 sites in the Kansas–Iowa
region showed a strong tendency to form illite at the surface and increase from 20 to 50% of
the amount of the clays present. In fact, this phenomenon has been described for a long time as
Nettleton et al., (1973) observed the formation of illite materials in surface horizons of several
dryland soils in the US. It is also interesting to note that a few studies reported the occurrence
of illite in the upper part of soils developed on basaltic rocks containing no micaceous phases
originally (He et al., 2008; Juang and Uehera, 1968). Indeed, these later studies show that illite
might be neosynthesized in soils and do not necessarily derive from primary micaceous
minerals (Barré et al., 2009). The references showing an influence of K translocation on surface
soil clay mineralogy are summarized in Table 2.
Most of the presented data are only qualitative. This is due to the fact that very few studies
attempted to quantify the relative abundance of each clay mineral types in complex soil clay
assemblages. More precise quantified data might be available in the future, if soil clay scientists
begin to systematically use X-ray diffractogram modelling programs that allow one to quantify
the different clay mineral types (Barré et al., 2009).
Table 2 Summary or the references indicating an effect of K translocation by plants on clay
mineralogy in the upper part of soil profile (Barré et al., 2009)
References Climatic zone Country
Effect of
element
translocation
(Oh and Richter, 2005) Temperate USA +
(Glenn, 1964) Temperate USA +
(Ruhe, 1984) Temperate USA +
(Nettleton et al., 1973) Temperate USA +
(Juang and Uehera, 1968) Tropical USA +
(He et al., 2008) Tropical China +
(Mahjoory, 1975) Temperate Iran +
(Velde and Peck, 2002) Temperate France +
(Spiers et al., 1984) Temperate Canada +
(Badraoui et al., 1987) Temperate Morocco +
(Kuzila and Lewis, 1993) Temperate USA +
(Tice et al., 1996) Temperate USA +
(Boettinger and Southard, 1995) Arid USA +
de Mecquenem in Barré et al. (2007) Temperate France +
Clays tend to have exchangeable potassium in increased quantities towards the surface of
alteration soil profiles but potassium is none the less a minor component of exchangeable bases.

43
However, the absolute amount of potassium increases on soil exchange sites. The higher
amount of exchange ions present indicates a higher potassium content in the soil materials,
silicate clays and organic matter exchangers. This increase has a strong influence on the
presence of illitic clay minerals. The increase in potassium seems to be dependent on a return
of plant material to the soil profile, either from leaf litter or upper level root masses. Hence
plants typically enrich the surface layers of soils with potassium, among other elements. The
impact is rather strong when replacement occurs each year by plant litter. Grasses for example
enrich soils greatly in potassium while trees do to a lesser extent. Trees on the contrary keep a
significant part of the nutrient material (potassium and silica) in their woody parts which
remain above ground. Such a prolonged subtraction of alkalis as well as calcium, changes the
balance of cations and favours acid soils where K+ and Ca2+ are replaced by hydrogen ions
(Velde and Meunier, 2008).
If plants are responsible for potassium translocation, what effect can this have on the solids
present, i.e. the clay minerals? It is highly probable then that plants control the clay mineralogy
in the soil (plant/silicate) interaction horizon by translocation of silica and potassium plus other
base cations. Thus the presence of these minerals is to a large extent dependent upon the
presence of plants. Climate will dictate the types of plant regime present, and this related to
rainfall in particular will determine the balance between translocation and loss through
water/clay interaction. Hence it is extremely important to observe the type of plant regime
when describing soil (A horizon) mineralogy and hence the type of reaction possible when
changing from one plant regime to another (Velde and Meunier, 2008).
2.5 Potassium and Wastewater Irrigation
As demand for fresh water intensifies, wastewater is frequently being seen as a valuable
resource. An attractive property of reclaimed wastewater is its potential fertilizing capacity. On
the other hand, the high concentrations of nutrients in wastewater can be problematic to
agriculture and the environment. The reality of challenges facing wastewater irrigation are
perhaps best summarized by Part 1 of the Hyderabad Declaration on Wastewater Use in
Agriculture, in which water, health, environmental, and agricultural professionals from 27
institutions across 18 countries formally recognized that (i) wastewater (raw, diluted, or
treated) is a resource of increasing global importance, particularly in urban and peri-urban
agriculture; (ii) with proper management, wastewater use contributes significantly to sustaining
livelihoods, food security, and the quality of the environment; and (iii) without proper

44
management, wastewater use poses serious risks to human health and the environment
(Hamilton et al., 2007).
Potassium is ubiquitous in wastewaters and in some wastewaters is present at several hundred
to several thousand mgL-1. The current trend for substitution of sodium hydroxide with
potassium hydroxide as a caustic cleaning and disinfection chemical in the operational
processes of many industries such as wineries also has the potential to further increase
potassium levels in wastewater. Thus, potassium accumulation in soils is seen by industry and
regulators as a potential problem because of the effect it might have on salt accumulation and
soil structure. These effects at the present are unclear since very few studies exist. The
processes that control the fate of potassium in soils deriving from landwaste disposal are
complex and many of them are poorly understood, e.g. the rate of potassium release, leaching,
as well the long-term plant bioavailability (Arienzo et al., 2009).
A wide variety of wastewaters are produced which contain potassium. These can be from dairy
sheds and milk processing factories, piggeries, chicken farms and processing plants, meat
processing plants, fellmongeries, fish processing plants, timber processing plants, wool scours,
feedlots, vegetable processing plants, wineries, paper and printing operations, textile plants,
metal industries, and sewage treatment plants (Hart and Speir, 1992; McLaren and Smith,
1996). Some examples of the potassium contents of these wastes are given in Table 3.
Table 3 Potassium concentration in municipal and agricultural sewage effluents (Arienzo et
al., 2009)
Water Source K concentration,
(mgL-1)
Milk powder/butter factory 13
Municipal 13–20
Meat processing 20–150
Fellmongery 50
Slaughterhouse 90
Dairy shed 220
Winery 250
Piggery 500–1000
Lactic/casein whey 1,660
Cheese whey 1,680
Palm oil processing 2,100
Olive oil processing 10,000–200,000
The wide range of chemical, physical, and biological characteristics of these wastes makes it
difficult to develop guidelines for their use. The chemical composition not only varies between
the various waste streams but also varies with time and with treatment of the individual waste
stream. A lot of attention has traditionally been paid to nitrogen, phosphorus and organic matter
in wastewater for reuse. These elements can be controlled/treated by typical aerobic and

45
anaerobic treatment processes. The levels of potassium have received less attention and are not
reduced during typical treatment processes, in fact the concentration often increases due to
evaporation from wastewater treatment and storage ponds (Arienzo et al., 2009).
Apart from the concentration of potassium, the total loading to soil is important, therefore when
irrigating crops with wastewater effluent the application of potassium fertilizer should be
reduced (Arienzo et al., 2009). Many studies have shown that the overall soil fertility is
increased after land application of liquid and solid wastes (Cameron et al., 1997; Keeley and
Quin, 1979). Land application of wastewaters can increase the levels of soluble and
exchangeable forms of potassium in soil expressed as potassium exchange percentage more
rapidly than with conventional inorganic fertilizers. Most of the potassium in wastewater is
immediately available (Levy and Torrento, 1995). Because of the equilibrium between the
different potassium forms in soil it is possible that application of high potassium wastewaters,
(500–20,000 mgL-1) can cause a consistent and rapid increase of potassium in solution. This
localized increase of potassium concentration in soil will cause the re-entry of potassium in the
wedge-zones of hydrated micas, vermiculite and illite (Arienzo et al., 2009).
Soil with a higher clay content (illite) retained potassium in the exchangeable form to a much
greater extent than the soil with a low clay content. Smiles and Smith (2004) reported on an
irrigation study with piggery effluents in south-eastern Australia. The effluent had pH values
of 7.5–8, K levels of 370–650mgL−1, Na concentrations of 140–220mgL−1, potassium
adsorption ratio values of 10.2–14.2 and sodium adsorption ratio values of 6.1–8.6. The results
showed that electrical conductivity (EC), exchangeable potassium ratios and PAR values in the
soils that had been irrigated with the wastewater were greater than their non-irrigated partners.
Potassium availability is also strongly affected by the pH of the wastewater as well as by the
pH of the receiving soil (Arienzo et al., 2009).
Some studies report that potassium in wastewater reduced water infiltration rates. Peacock
(1999) determined the effect of potassium added to irrigation water at a concentration of 120mg
L-1, on the rate of water infiltration under drip irrigation in a sandy loam soil. The potassium
significantly reduced infiltration rates compared to the untreated control, and the drop in the
infiltration rate occurred within 2 weeks of the first application of potassium. After 4 weeks
the infiltration rate dropped to less than one-fifth that of the untreated control (Arienzo et al.,
2009).

46
The potential for accumulation of potassium in soil from wastewater disposal is high since the
element has a low leachability. Potassium ions not adsorbed by plants are absorbed by the soil
particles thus minimising the risk of potassium leaching. According to Öborn et al., (2005)
disposal of high K wastewater on soil with a low content of selective adsorbing minerals like
vermiculite and illite will increase the risk of leaching as well in coarse sandy soil following
saturation of the exchange sites of the colloids (Arienzo et al., 2009).
Irrigation with high potassium effluent has been shown to help sustain the overall fertility in
soils. In general, the wastewater constitutes a fertilizing mineral and with a high content of
organic matter and hence the potassium in wastewater can behave differently to fertilizer
potassium. Disposal of high potassium wastewater in soil with a low content of selective
adsorbing minerals will create very high concentrations of potassium in solution with potential
effects on soil structure and potassium mobility. However, the effect of disposing high
potassium effluents on soil structure is still not clear and more research is needed. For
sustainable disposal of wastewaters plant tolerance and uptake of potassium must also be
known. Further research needs also to focus on the effect of the K/Na ratio in the wastewaters
and its effect on potassium availability and leaching in soil and potential increased plant
tolerance to salinity (Arienzo et al., 2009).
2.6 Effect of Potassium on Structural Stability and Dispersion of the
soil
Of the four major cations found in the soil (Ca2+, Mg2+, Na+ and K+), the effect of exchangeable
potassium on soil physical and hydraulic properties is the least clear (Levy and Torrento 1995).
Only limited research data exist on the effects of potassium on soil structure stability (Chen et
al., 1983; Quirk and Schofield, 1955; Reeve et al., 1954; Rengasamy and Sumner, 1998). The
literature shows a broad spectrum of possibilities for the effect of potassium on infiltration,
ranging from being similar to sodium (negative effect) to being similar to calcium (positive
effect). Potassium, as a monovalent cation, appears to be not as effective as sodium in causing
structural problems in soils (Chen et al. 1983; Levy and Van der Watt 1990; Rengasamy and
Sumner 1998). Similarly, Rengasamy (2002a) found modest differences in flocculation
potential between Na and K. Other researchers have reported that this is not the case, and the
effect of exchangeable potassium, while not as detrimental as that of Na, is also not clearly
beneficial as is Ca addition (Reeve et al. 1954). Thus it seems that the research data is
inconclusive.

47
Dispersion of clay particles is one of the major processes responsible for the degradation of
soil structure (Chorom et al. 1994; Rengasamy 2002a). Dispersion involves the breakdown of
associations of the soil clay particles into a heterogeneous collection of individual particles or
groups of particles (Churchman et al. 1993). On interaction with water the clay particles with
high concentrations of adsorbed monovalent cations are separated from the aggregates to form
a dispersive phase. Adsorbed sodium is traditionally considered to be a primary cause for poor
soil structural stability. However, there is a knowledge gap in understanding the effect of
adsorbed monovalent potassium on soil structure. Recent reports have drawn attention to
elevated concentration of potassium in some soils naturally or induced by potassium added as
fertilisers and wastewaters with high potassium content (Smiles and Smith 2004; Arienzo et al.
2009, 2012; Rengasamy and Marchuk A. 2011). Chen at al. (1983) found that the major
mechanism by which K+ can cause a reduction in relative hydraulic conductivity is due to
dispersion of the fine soil fraction (mostly clay aggregates) and its rearrangement in situ to
form a dense network of particles with smaller pores, rather than by massive clay migration
(Arienzo et al. 2012).
Many of the authors have attributed the diverse response of different soils to increases in
exchangeable potassium due to differences in soil clay mineralogy (Shainberg at al. 1987; Levy
and van der Watt 1990; Churchman at al. 1993; Auerswald at al. 1996; Arienzo 2009). In the
studies where the effect of potassium was grouped with that of sodium, or intermediate between
that of sodium and calcium, the soils were mainly illitic (Churchman et al. 1993) or kaolinitic-
illitic (Geeves et al. 1995; Oster 2008; Arienzo et al. 2009). When the soils contained mainly
smectites with high charge densities the effect of potassium on the hydraulic conductivity was
comparable to that of calcium (Boeck et al., 1995). These mixed results from the literature
point to more research being required to explore the potential effect of applied K+ on soil
dispersive properties and the role played by clay minerals.
2.7 Summary
Plant availability of soil K is controlled by dynamic interactions among its different pools.
Misunderstanding of these dynamics leads to mismanagement of soil fertility (Wang et al.,
2004). Understanding (identification) of the factors and processes involved with K dynamics
in soils would help to better evaluate the effects of different management options in different
land-use systems (Öborn et al., 2005).

48
The major readily available source of potassium for plants in soils is from clay minerals (Velde
and Barré, 2010) which are key-components in soil systems (Barré et al., 2009). Understanding
the mechanisms that involve release and fixation of K in soil is important because soils may
contain widely variable pools of K that are potentially mobilized by chemical weathering of
soil minerals (Simonsson et al., 2009). Potassium can be extracted from high temperature
primary minerals in the water – rock interaction portion of alteration profiles, and deeper plant
roots use this as a source of potassium renewal as this rather soluble element is leached out of
the plant soil horizons. The potassium is transferred from root zone to plant and plant to soil
by leaf and other plant decay mechanisms. Then the potassium is reincorporated into the clays
as illite, which contains an anhydrous layer of potassium ions in the 2:1 structures (Velde and
Barré, 2010), or as one of its degraded forms.
Officer et al. (2006) specified the importance of 2:1 clay minerals and plant K nutrition by
showing a very significant relationship between plant available non-exchangeable K and 2:1
clay mineralogy. Conversely, many authors reported that 2:1 clay minerals can fix potassium
ions from the solution. This ability to fix or release K led Barré et al. (2007) to postulate that
2:1 minerals behave as a K reservoir in soils (Barré et al., 2008), which is likely to have a key
role for K cycle in soils. Clay minerals could supply short term K plant needs and preserve
long term ecosystem productivity by reducing K leaching (Barré et al., 2008).
The research into the fate of potassium in the soil–plant system under wastewater application
is limited. Irrigation with high potassium effluent has been shown to help sustain the overall
fertility in soils. In general, the wastewater constitutes a fertilizing mineral and additional
organic matter potential and hence the potassium in wastewater can behave differently to
fertilizer potassium. Disposal of high potassium wastewater in soil with a low content of
selective adsorbing minerals will create very high concentrations of potassium in solution with
potential effects on soil structure and potassium mobility. However, the effect of disposing
high potassium effluents on soil structure is still not clear and more research is needed (Arienzo
et al., 2009; Öborn et al., 2005).
This literature review has summarised the present state of knowledge and research trends
on the fate of potassium in soil-plant system. Particular emphasis has been placed on the
role of soil clay minerals in the dynamics of different forms of potassium in soil.

49
Chapter 3. Examine the effect of application of potassium on
clay minerals (fixation of potassium induced by wetting-
drying cycles).
The fixation and release of potassium by phyllosilicate clay minerals in soils are very important
processes influencing the availability of K to plants (Hosseinpur and Kalbasi, 2001). The
fixation of potassium has been considered to occur because of a good fit of the crystal radius
and coordination number of K within an area created by holes in the two adjacent Si-O sheets
(Barshad, 1951, 1954). The important forces involved in the interlayer reactions in mineral
colloids are electrostatic attractions between the negatively charged layers and the interlayer
cations, and expansive forces due to ion hydration (Huang, 2005). The extent of K fixation is
related to the kind of clay mineral and its charge density, the degree of hydroxy interlayering,
the concentrations of K+ ions and competing cations, and the pH of the ambient solution bathing
the clay or soil (Rich, 1968; Sparks and Huang, 1985). Vermiculite, montmorillonite, kaolinite
and hydrous mica (illite) vary drastically in their ionic preferences, ion-binding affinities, and
types of ion-exchange reactions. Such fundamental differences in these clay minerals account
for the varying kinetics of exchange (Sparks, 1987). Beidellites and vermiculites are known to
have greater K-fixation capacities than montmorillonite.
One method for studying reactions that occur at the mineral-water interface is to concentrate
ions at the interface by drying a clay mineral slurry. The process of fixation of potassium by
clay minerals also responds to wetting-drying cycles (WD). These cycles can rearrange clay
2:1 layers into more stable configurations, can substantially alter smectite selectivity for
competing exchange cations, and can weather sparingly-soluble K-minerals in the presence of
smectite (Eberl et al., 1986). WD is an important mechanism for producing a mixed-layer illite-
smectite from smectite at low temperatures in nature by a transformation mechanism. The
percentage of illite layers formed by this mechanism is proportional to the number of WD
cycles, and to the layer charge of the original smectite. Illite layers form relatively quickly
(most in less than 20 WD cycles), and the reaction rate is not affected greatly by changes in
solution composition or by temperatures that are typical of near-surface environments. The
fixation of K is expected to occur wherever smectite and K-minerals are subjected to the
wetting and drying process. This process occurs, for example, in soils, deltas and flood plains.
The fixation of K decreases the ability of smectites to swell and decreases their cation exchange
capacity (Eberl et al., 1986).

50
The purpose of the study was to characterise the first step of K-smectite evolution following
wetting-drying cycles of Wyoming bentonite. XRD was used for this purpose. My second goal
was to develop and verify a procedure of potassium application to be used in further
experiments.
Materials and Methods
Materials
Wyoming bentonite (SWy-2) from Wyoming, USA was used. The clay was supplied by the
Clay Minerals Society as source clay SWy-2-Na-montmorillonite (Wyoming). This clay
originates from the Newcastle formation (Cretaceous), Crook County, Wyoming. The chemical
composition of the montmorillonite is 62.9% SiO2, 19.6% Al2O3, 0.09 TiO2, 3.35% Fe2O3,
0.32% FeO, 0.006% MnO, 3.05% MgO, 1.68% CaO, 1.53% Na2O, 0.53% K2O, 0.111% F,
0.049% P2O5 and 0.05% S (Clay Minerals Society, 2012).
The formula of the montmorillonite can be expressed as:
(Ca0.12Na0.32 K0.05)[Al3.01Fe(III)0.41Mn0.01Mg0.54Ti0.02][Si7.98Al0.02]O20(OH)4,
as calculated from its chemical composition. Its octahedral charge is - 0.53, its tetrahedral
charge is - 0.02, and its interlayer charge: - 0.55. Its cation exchange capacity (CEC) is 76.4
cmol+/kg (Clay Minerals Society, 2012). The clay was used without further purification and
pre-treatments.
Samples preparation
Firstly, raw Wyoming bentonite was separated from the bulk clay sample by sedimentation
(Jackson 2005). After the clay fraction (< 2µm) was separated and dried, it was ground, mixed
with saturated KCl solution (347 g of KCl per 1L of KCl/DI water solution) and shaken
overnight on an orbital shaker. Excess salt was removed using dialysis against deionised water
until free of chloride by the method described in Churchman and Weissmann (1995), (Figure
18). Chloride in solution was verified using silver nitrate and dialysis was continued until its
addition led to no further white precipitate of silver chloride. Following completion of dialysis,
the conductivity of the dialysate was below 10 µS/cm. The WD treatment was conducted at
60° in a drying oven.

51
Figure 18 Removing excess salts using dialysis
Characterisation Methods
Both the original and potassium treated clays were investigated by powder XRD of oriented
and glycerol saturated clay samples. Clay samples were finely ground and backfilled into steel
holders for XRD analysis. The XRD patterns for randomly oriented air-dried (AD) and
orientated and glycerolated (G) samples were recorded with a PANalytical X'Pert Pro Multi-
purpose diffractometer using Fe filtered CoKα radiation, an automatic divergence slit, 2° anti-
scatter slit and fast X'Celerator Si strip detector. The diffraction patterns were recorded from
3 to 80° 2θ (for randomly oriented samples) and from 3 to 33° 2θ (for orientated and
glycerolated samples) in steps of 0.017° 2θ with a 0.5 second counting time per step for an
overall counting time of approximately 30 minutes.
Results and Discussion
X-ray diffraction
Diffractograms of original and K treated Wyoming montmorillonite clay are shown in Figure
19. The patterns produced by the < 2 µm fraction of air-dried (AD) original sample showed a
sharp d 001 reflection at 15.0 Å which corresponds to discrete smectite mineral. Potassium
treated AD sample of the same fractions showed broad d 001 peak at 11.8 Å and a small sharp

52
10.0 Å peak which occurs on the right side shoulder of the 11.8 Å peak. After glycerol
saturation the peak at 11.8 Å shifted to 17.8 Å, intensified and became sharper. The illitic 10.0
Å peak after glycerol treatment did not shift and was now located on the left side of the shoulder
of the second order smectite peak at 8.9 Å. The quartz mineral is present in all the samples as
evident from the peaks appearing at 3.34 Å.
Figure 19 XRD patterns of clay fraction (< 2 micron) of Wyoming bentonite before and after
treatment with potassium
The following pattern of the reaction could be seen from XRD data. After application of
potassium and drying, the treated AD sample seems to produce illite-smectite interstratified
mineral (11.8 Å in AD sample) and discrete illite (10.0 Å). But glycerolation has shown that
potassium was not fixed and interstratified smectite-illite layers in AD conditions re-expanded
under glycerol. Smectites expand or contract very readily depending on the nature of the
exchangeable cations (Moore and Reynolds 1997). In this experiment, applied potassium, apart
from producing some illite, displaced more hydrated interlayer cations such as Na+ or Ca+ in
smectite, dehydrated its interlayer space and caused a decrease in the d 001 spacing of adjacent
silicate layers (from 15.0 to 11.8 Å in the AD state), but not a collapse.
Figure 20 shows the XRD pattern of glycerolated Wyoming sample before and after treatment
with potassium. The peak position of the d 001 reflection of both treated and original samples
did not change (17.7 Å), but the relative intensity after treatment decreased more than twice
4.0 8.0 12.0 16.0 20.0 24.0 28.0 32.0
15.0
11.810.0
10.0
2° θ
17.8
8.9
Original air dried
Potassium saturated air dried
Potassium saturated glycerolated
3.34

53
(45% for the treated sample compared to the original 100%) and the full width at half maximum
intensity (FWHM) increased from 0.82° 2θ for the original sample to 1.17° 2θ for potassium
treated clay. In XRD patterns, the spacing of d 001, intensities and full width at half maximum
intensity (FWHM) reflect the degree of organization of the smectites (Moore and Reynolds,
1997). In general terms, as the amount of interstratification with illite increases, the first order
peak (17.7 Å) and the second order peak (8.87 Å for the original sample) located to the right
of the illite peak (9.98 Å in the treated sample) move closer together (8.97 Å in treated sample).
It seems that treatment with potassium has transformed smectite into illite and interstratified
smectite-illite. However, the retention of the d 001 peak at 17.7 Å suggests that much of the
smectite remained unaltered.
Figure 20 XRD patterns of glycerolated clay samples (< 2 micron) of Wyoming bentonite
before (red) and after treatment (black) with potassium
In order to obtain quantitative information about the nature of the clay modification that
occurred, modelling of the XRD profiles was carried out using NEWMOD (Reynolds, 1985)
software. As recommended by Moore and Reynolds (1997) the default NEWMOD program
settings (such as goniometer radius and sample length) were adjusted with accordance to the
parameters of the XRD instrument used for the experimental diffractograms. By modelling the
individual clay mineral species in this way we could compare patterns of calculated diffraction
profiles with experimental data. As could be seen from simulated diffractograms (Figure 21)
with illite content increasing towards the lower patterns, the first order peaks did not shift, but
decreased in relative intensity. The second order peaks moved towards the low angle region
with increasing illite content in interstratified smectite-illite (Table 4).
4 9 14 19 24
17.7
17.7
8.87
8.979.98

54
Figure 21 NEWMOD calculated XRD patterns of pure smectite and interstratified smectite-
illite including gradually increased amounts of illite
Table 4 XRD parameters of simulated diffractograms from Figure 21
Mineral
d 001 d 002
d-spacing,
Å
FWHM,
° 2θ
Intensity,
%
d-spacing,
Å
FWHM,
° 2θ
Smectite, 100% 17.69 0.45 100 8.86 0.45
Smectite, 95% 17.69 0.55 72 8.93 0.51
Smectite, 90% 17.69 0.66 54 8.94 0.53
Smectite, 85% 17.69 0.81 42 9.02 0.56
By comparing parameters of experimental diffractograms (Figure 20) with those modelled by
NEWMOD (Figure 21 and Table 4) it could be concluded that the interstratified smectite-illite
phase of the treated sample consisted of approximately 10-15% of illite.
Conclusion
As could be seen from XRD results the application of potassium solutions to Wyoming
smectite with wetting and drying produced randomly interstratified mixed-layered
smectite/illite and illite minerals in clay fraction (< 2 µm) even at 60°C. The procedure
developed enabled transformation of smectite into mixtures of smectite/illite and illite phases.
This experiment indicates that WD can have major effect on reactions that occur at the mineral-
water interface. This process can rearrange clay 2:1 layers into more stable configurations. WD
2 6 10 14 18 22 26 30 34
Smectite, 95%
Smectite, 85%
Smectite, 90%
Smectite, 100%
17.7
5.85
4.428.86
8.93
8.94
3.55
9.02
5.92
5.91
5.89
4.44
4.45
4.45
3.54
3.53
3.53
2° θ

55
may be an important mechanism for producing smectite-illite at ambient temperatures in nature
by a transformation mechanism. Illite layers form relatively quickly by WD (after just one WD
cycle) under temperatures that are typical of near-surface environments. Thus, an effect seen
in the laboratory also may occur abundantly in nature. Agriculturally, the WD process can free
K from sparingly soluble K-minerals, and then store it with varying degrees of availability in
expanding clays (Eberl et al., 1986).

56
Chapter 4. Cation exchange and related physical properties as
influenced by the type of cations in different type clay
minerals
Physical and chemical properties of most soils are influenced by their ion-exchange
characteristics, including the amount and balance of individual ions present (Rayment and
Lyons, 2011). Cation Exchange Capacity is a general indicator of soil/clay storage capacity
for available positively-charged plant nutrients such as calcium, magnesium, potassium and
sodium. Many empirical results are catalogued in the literature of cation exchange
phenomenology, but a clear description of the underlying forces that govern cation selectivity
is lacking. Knowledge of these fundamental forces is desirable, because predictive ability
would enable the rational management of soils (Teppen and Miller, 2005). According to
Jackson (2005), the range and mean values of CEC for natural clays differ when different
cations (particularly Ca or K) are used in the exchange reactions (Table 5).
Table 5 CEC of phyllosilicate minerals, after (Jackson, 2005), mean values in brackets
Mineral cmol+/kg
CaEC KEC
Kaolinite* 2.7 – 4.2 (3.5) 2.3 – 3.6 (2.9)
Micas 6 – 10 (8) 3 - 6 (5)
Vermiculites 140 – 180 (160±20) 2 – 7 (5)
Smectites 80 – 140 (110±30) 80 – 140 (110)
Amorphous minerals 20 – 160 (110) 20 – 160 (110)
* data from Lim et al. 1980
An ion exchange reaction is defined as a thermodynamically reversible interaction between the
ions originally occupying a fixed number of reactive sites of the insoluble exchanger with the
several ionic species in the solution. When a clay mineral is placed in a solution containing
several dissolved salts, the whole assembly will in time reach a steady-state condition of ionic
distribution between the clay and the solution. It is important to know how this equilibrium
distribution depends upon the nature of the exchanger and its physical condition and how it
depends on the nature of the solution (Lewis, 1952).
The literature is abundant with reports on cation exchange phenomena in clays resulting from
clay-cation interactions. Several authors have developed models to compute selectivity
coefficients from the contributions of electrostatic versus specific energies of adsorption as a
function of cation valence and hydrated radius (Bergaya et al., 2006). The importance of clay
layer charge in cation exchange selectivity has also been reported (Teppen and Miller, 2005).

57
Recent models also define cation exchange selectivity in terms of polarizability-based
electrostatic and covalent interactions (Sposito, 2008).
Recently Marchuk, and Rengasamy (2011) developed the ionicity indices for various cations
involved in clay-cation bonds. This new type of index depends on cation valence and the
energy required to extract an electron from a cation, but it does not depend on cation size. Table
3 in Marchuk, A. and Rengasamy (2011) shows that the ionicity index is a very good predictor
of both clay suspension turbidity and clay particle zeta potential for a wide variety of soil clays.
In particular, it predicts observed differences in turbidity, a measure of clay dispersion, with
the ordering: Na > K > Mg > Ca (Smith at al., 2015). The degree of ionicity of clay-cation
bonds will dictate the ease of cation exchange and hence, the cation exchange capacity of the
clays. The present experiment was started with an aim to understand the involvement of the
bonding mechanism in exchange reactions.
Materials and Methods
Preparation of homoionic samples
The clays examined in this study were obtained from variety of sources and are described in
detail in Table 6. The clays were used without any pre-treatment. Firstly, 5 g of each of raw
clay sample was dispersed in 200ml of DI water and shaken in an end-over-end shaker for 16
hours. Then clay suspensions were transferred into 500ml measuring cylinders, shaken for 1
minute and left for 8 hours to settle. The observed dispersion for kaolinite and halloysite were
low and hence a few drops of 0.1M NaOH were added to each clay sample to increase
dispersion.
Table 6 List of clays
No Name Location of clay deposit
1 Kaolinite KGa-1b Washington county, Georgia, USA
2 Halloysite Matauri Bay, Northland, New Zealand
3 Illite-Cambrian shale IMt-1 Silver Hill, Montana
4 Texas MMT* STx-1b Texas, USA
5 Otay MMT SCa-3 Otay, San Diego County, California, USA
6 Wyoming MMT SWy-2 Crook County, Wyoming, USA
7 Arumpo MMT Arumpo, New South Wales, Australia
8 Stop 12 Vermiculite Carl Moss Ranch, Llano County, Texas * Montmorillonite
For determinations of exchange capacities for K, Na, Ca and Mg clay samples were prepared
by treating a portion of the clay suspension with ≈ 220mL of a 1.0 M solution of the monovalent
(K and Na) chlorides and 0.5 M solution of the divalent (Ca and Mg) chlorides. The
suspensions were shaken overnight, then centrifuged to remove excess salts. The clay samples

58
were then washed several times with 250mL of 70 vol. % ethanol/water solution to remove
soluble cations.
The extraction of the exchangeable cations was carried out by shaking clays with ≈ 250mL of
1 M NH4Cl solution in a centrifuge bottle overnight, followed by centrifugation and collection
of supernatant solution. The procedure was repeated three times. These extractions were
combined and the cations (K, Na, Ca and Mg) displaced by NH4Cl were measured by
inductively coupled plasma atomic emission spectrometry (ICP AES). The sum of
exchangeable cations is considered as CEC in this report.
Characterization of samples
Mean particle size
Mean particle size measurements of homoionic samples were performed with dynamic light
scattering using a NICOMP 370 Particle Sizer with a fixed 90° scattering and external (optical
fibre) angle, and a 632.8-nm wavelength helium-neon laser. The instrument operates in two
analysis modes: unimodal (Gaussian) and multi-modal (Nicomp) distributions. The multi-
modal analysis was found to be most suitable for the wide distribution of particles found in
clay suspensions. Prior to measurements, the samples were diluted to an appropriate
concentration so that the intensity of the transmitted laser beam was within the limits required
by the instrument and to attain consistent and compatible measurements. All samples were
placed in the machine for 5 minutes prior to starting measurements to eliminate temperature
differences between the sample and an instrument. The instrument parameters were set as
follows: automatic choice of channel width; solid particle mode; the autocorrelator was set to
clear after each sample. The following values were recorded: mean particle diameter, standard
deviation, chi-squared (χ2), baseline adjustment, fit error and residual. Results presented here
were acquired using intensity-weighted distribution with the Nicomp analysis mode recorded
after 60 min.
Zeta potential measurements
The zeta potential (ζ) is related to the surface charge, a property that all materials possess, or
acquire, when suspended in a fluid. In terms of soil/clay particles - water interactions it is a
function of the surface charge of the particle, adsorbed species on its surface (cations or anions),
and the composition and ionic strength of the surrounding solution (Powers et al. 2006). Zeta
potential is directly related to the total interaction energy between particles and is used to
interpret clay dispersion behaviour (Chorom and Rengasamy 1995; Marchuk A. and

59
Rengasamy 2011; Yong et al. 2012). The zeta potential is measured experimentally from the
migration rate of suspended particles under the action of an electric field.
The zeta potential of the homoionized samples was measured by laser Doppler velocimetry on
a Malvern Zeta Master Particle Electrophoresis Analyser. The intensity for each clay sample
was measured prior to the readings to ensure the compatibility of the samples. The zeta
potentials (ζ) were calculated as the mean of ten runs, each of which was averaged over 25
individual measurements performed automatically by the instrument.
Results and Discussion
The exchangeable K, Na, Ca, Mg and CEC for each sample are presented in Table 7.
Table 7 Experimental cation-exchange capacities
Clay pH EC,
dS/m Treatment
ζ
mV
Exchangeable cations, cmol+/kg Σ of
Exch.
Cations Na K Mg Ca
Kaolinite
KGa-1b 10.7 0.01
K -29 5.51 5.35 1.29 0.21 12.36
Na -36 9.66 1.31 1.23 0.19 12.40
Ca -10 5.52 1.02 1.23 4.86 12.62
Mg -20 5.43 0.95 7.28 0.18 13.84
Halloysite 9.3 0.03
K -50 6.65 1.56 0.73 0.37 9.31
Na -58 6.87 0.81 0.73 0.27 8.68
Ca -39 6.70 0.74 0.74 2.55 10.73
Mg -41 6.64 0.57 2.33 0.16 9.70
Illite-
Cambrianshale
IMt-1
7.3 0.04
K -44 12.45 18.85 1.64 0.21 33.15
Na -47 31.80 1.76 1.56 0.18 35.31
Ca -13 11.73 1.40 3.00 25.78 41.91
Mg -16 11.89 1.07 23.42 0.51 36.89
Smectite
STx-1b 9.8 0.01
K -59 13.20 98.72 1.76 0.27 113.96
Na -61 96.49 1.62 1.79 0.27 100.18
Ca -34 14.17 6.10 1.81 94.51 116.59
Mg -36 14.04 3.91 95.67 0.27 113.89
Smectite
SCa-3 10.5 0.02
K -55 9.27 122.80 1.94 0.18 134.19
Na -57 132.26 2.24 2.57 0.18 137.25
Ca -35 9.70 2.39 1.78 131.49 145.37
Mg -37 9.78 3.03 130.95 0.18 143.94
Smectite
SWy-2 7.9 0.05
K -40 6.56 97.65 1.57 0.07 105.85
Na -41 97.65 0.95 2.42 0.75 101.77
Ca -15 6.73 0.58 1.25 104.69 113.24
Mg -18 6.43 0.44 100.44 0.07 107.38
Smectite
Arumpo 7.2 0.04
K -45 15.33 71.29 2.36 1.75 90.73
Na -44 89.21 1.36 2.04 1.15 93.77
Ca -20 8.94 1.03 0.98 93.36 104.32
Mg -18 13.08 1.09 97.01 1.09 112.26
Stop 12
Vermiculite 10.4 0.01
K -50 33.04 85.44 24.23 0.61 143.33
Na -52 158.54 8.43 18.37 0.68 186.03
Ca -26 33.92 3.32 14.97 138.75 190.95
Mg -31 35.07 4.32 154.82 0.65 194.86

60
Data represent an average of duplicates for all determinations. Values of CEC tend to be high,
compared to the reported data in the literature, because of the high pH induced by the addition
of NaOH during sample preparation.
Illite Texas MMT Otay MMT
Wyoming MMT Arumpo MMT Stop 12 Vermiculite
Figure 22 Mean particle size in µm (upper) and Zeta potential in mV (lower) of investigated
homoionic clays
Comparing the CEC of monovalent cationic clays, K-saturated clays have lower CEC’s than
Na-saturated clays with the exception of halloysite, Wyoming and Texas smectites. The
0.50 0.56
3.003.19
0.0
0.5
1.0
1.5
2.0
2.5
3.0
3.5
Na K Mg Ca
0.47 0.50 0.63 0.69
Na K Mg Ca
0.340.61 0.54 0.65
Na K Mg Ca
-47-44
-16
-13
-70
-50
-30
-10
-61-59
-36
-34
-57-55
-37-35
0.61 0.71
1.35 1.42
0
0.5
1
1.5
2
2.5
3
3.5
Na K Mg Ca
0.35 0.44 0.590.42
Na K Mg Ca
0.650.82
1.04 1.09
Na K Mg Ca
-41-40
-18-15
-70
-50
-30
-10
-44-43
-18-20
-52-50
-31
-26

61
monovalent cations almost always gave lower CECs than divalent ones. However, values from
each cation are never vastly different from each other, except in one case (vermiculite).
CEC of K-vermiculite is much lower than that of Na-vermiculite. This is probably because of
the great affinity of the vermiculite interlayer for potassium. For the divalent cationic clays, the
effect of Ca and Mg is not clear. Ca-saturated clays have higher CEC’s than Mg-saturated clays
with the exception of kaolinite, Arumpo smectite and vermiculite.
The changes in particle size after ion adsorption are given as the mean particle size measured.
The mean particle size increased in all clay samples in the order Na < K < Mg < Ca. The
changes in size observed correlate well with zeta potential data which tended to become less
negative in this order.
The ionicity indices of clay-cation bonds are in the order Na > K > Mg > Ca (A. Marchuk and
Rengasamy, 2011). The results presented here do not show a similar order for CEC values for
homoionic clays. But, when monovalent ions and divalent ions are separately considered, the
higher were the ionicity indices, the greater was the CEC. There are exceptions, as mentioned
earlier. Differences in the CEC of homoionic clays are attributed to differences in particle size
(Figure 22), i.e. lower CECs of monovalent clays corresponded with smaller particles.

62
Chapter 5. Influence of the major exchangeable cations on the
particle size distribution and dispersive behaviour of soil clays
with contrasting mineralogy
In soil/water systems an equilibrium exists between the cations in the soil solution and those
on the exchange sites. Hence, the soil will adsorb ions from the soil solution in proportion to
its composition and the concentration of the cations in solution. The nature of cations adsorbed
on soil surfaces (exchange complex) has the potential to significantly affect the physical and
chemical properties of the soils. The purpose of this investigation has been to study the effect
of the most common cations (Na+, K+, Mg2+ and Ca2+) on the dispersive behaviour of soils with
contrasting mineralogy.
Materials and methods
Soil used
Four soils from South Australia (Figure 23) were chosen for the study. Selection of these soils
was based on the differences in their texture, clay mineralogy, electrical conductivity and pH
(Tables 8 and 9). Soil samples were collected from the 0.20–0.40 m depth (where clay content
is relatively high and organic matter content is relatively low) by a hand auger, air-dried,
crushed, and passed through a 2-mm sieve. Soil particle size distribution, soluble and
exchangeable cations, pH and EC are presented in Table 9.
Table 8 Soil type, location, classification and main clay minerals
Soil texture Location Mineralogy Australian
classification1
Urrbrae Sandy Loam Waite Research Institute,
34°58’00.41” S; 138°38’03.29” E Illite, Kaolinite Red Chromosol
McLaren Clay Loam McLaren Valley,
35°15’04.31” S; 138°33’44.9” E Illite, Kaolinite Brown Sodosol
Claremont Clay Waite Research Institute,
34°58’20.7” S; 138°38’11.87” E Montmorillonite Vertosol
Keilira Clay Woolumbool,
36°48.726' S; 140°08.638'E Saponite Grey Sodosol
1 Australian Soil Classification (Isbell 1996)
Soil analysis
Standard methods were used for the determination of pH and EC (1:5 soil/water) (Rayment
and Lyons 2011) and particle size distribution (Gee and Bauder 1986). Mean particle size and

63
zeta potential (ζ) measurements of homoionic soil samples were done as described in Chapter
4.
Figure 23 Soil sites location
Table 9 Selected physico-chemical properties of soils
Soil pH EC,
dS/m
CEC,
cmol+/kg
Texture Zeta potential,
mV Clay Silt Sand
Urrbrae 6.7 0.06 5.8 26 34 40 -38
McLaren 7.3 0.14 8.8 44 19 37 -42
Claremont 8.3 0.16 30.6 63 13 25 -19
Keilira 8.6 1.45 26.6 73 11 16 -21
Soil clays preparation for XRD analysis
In order to improve the identification of the mineralogical composition of the soils by XRD
analysis, clay fractions were separated by sedimentation (Jackson 2005). Firstly, 5 g of the
sieved original soil from each sample was mixed with 150 ml of deionised water and
disaggregated by using a RATEK orbital mixer with a speed of 120 rpm for 16 hours. Then
soil/water suspensions were transferred into 1 L glass cylinders with addition of deionised
water to the required level. The height of the soil/water column (19 cm) was determined by
Stokes’ Law to give the settling time (16 hours) required for settling particles ≥ 2 μm. The
cylinders were then allowed to stand, and after 16 hours of settling the clay fraction (< 2 μm)
was isolated from soil by siphoning off the dispersed material. The procedures of adding water,
stirring, settling, and siphoning were carried out for a total of 6 times, and the clay suspensions

64
thus obtained were combined. The supernatant suspension containing < 2 μm clay fraction was
transferred into a 5 L beaker and oven-dried at 60oC. No additions of dispersing agent or other
chemical treatments (such as for organic matter or oxide removal) were applied to the clay
samples.
X-Ray diffraction (XRD) analysis of the clay fraction
Dry clay samples (<2 µm fraction) were finely ground and backfilled into steel holders for
XRD analysis. The XRD patterns for randomly oriented air-dried (AD) and orientated, Mg
saturated-glycerolated (G) samples were recorded with a PANalytical X'Pert Pro Multi-purpose
diffractometer using Fe filtered CoKα radiation, automatic divergence slit, 2° anti-scatter slit
and fast X'Celerator Si strip detector. The diffraction patterns were recorded from 3 to 80° 2θ
(for randomly oriented samples) and from 3 to 33° 2θ (for orientated, Mg saturated-
glycerolated samples) in steps of 0.017° 2θ with a 0.5 second counting time per step for an
overall counting time of approximately 30 minutes.
XRD data were collected and displayed using CSIRO software XPLOT for Windows (Raven
1990). Mineralogical phase identifications were first made by comparing the measured XRD
patterns with the ICDD database of standard diffraction patterns using computer aided
search/match algorithms. Quartz structure tolerates no significant atomic substitution and its
peak position was used as the internal standard for estimating the accuracy and precision of
peak position for the other phases present (Moore and Reynolds 1997). Specific clay mineral
identification criteria were based on Brindley and Brown (1980) and Moore and Reynolds
(1997). Only peaks for crystalline minerals were considered in these analyses. Information
about the dioctahedral/trioctahedral structure of the clay minerals was obtained by examination
of the 060 reflections of randomly oriented samples.
Preparation of homoionic samples
Homoionic forms of soils with Na+, K+, Ca2+ and Mg2+ adsorbed cations were prepared by
treating a 10 g portion of the soils with 200 mL of a 1 M solutions of NaCl and KCl, and 0.5
M of MgCl2 and CaCl2. The suspensions were shaken overnight and centrifuged to remove
excess salts. The homoionized samples were then washed several times with 200 mL of 60
vol. % ethanol/water solution until the electrolyte concentration of each of the homoionic
samples was below 0.05 dS/m. The soils were then air dried and 2 g of each soil was redispersed
in 100 ml of deionised water (EC< 0.035dS/m) and allowed to settle in 100 ml cylinders for 4

65
hours. The clay particles (<2 µm) up to a depth of 10 cm in the cylinders were pipetted out and
used for measurements of zeta potential and particle size.
The extraction of the exchangeable cations was carried out by shaking 5 g of each homoionized
soil samples with ~ 200 mL of 1 M NH4Cl solution in a centrifuge bottle overnight, followed
by centrifugation and collection of supernatant solution. The procedure was repeated three
times. These extractions were combined and the cations (K+, Na+, Ca2+ and Mg2+) displaced
by NH4Cl were measured by ICP AES.
Results and discussion
Mineralogical analysis of investigated soils
The XRD patterns for randomly oriented clay samples (< 0.2 µm) of the soils are shown in
Figure 24. Urrbrae and McLaren soils have largely a two-component clay mineral suite of illite
and kaolinite dioctahedral types for both soils (060 patterns not shown) in addition to the
primary minerals quartz and k-feldspar. The Claremont and Keilira soils were dominated by
smectite with small quantities of illite and kaolinite. Quartz and k-feldspar were also present.
The analysis of their 060 diffraction area (not shown) revealed that in the case of Claremont
soil the smectite is of a dioctahedral type (montmorillonite), whereas the Keilira smectite is of
trioctahedral nature (saponite).
Effect of pH and adsorbing cations on CEC of homoionised soil clays
The pH and CEC values for original and homoionic soil samples are presented in Table 10.
Data represent an average of triplicates for all determinations. The pH and CEC of the different
homoionic systems varies. Variation in CEC partially could be explained by the presence in
the studied soils of clay assemblages with considerable pH dependable variable charge –
kaolinite and illite (Chorom and Rengasamy 1995). The other reason is the fact that CEC values
for the same soil/clay vary when different cations are used as an exchanger in the cation
exchange reactions (Sawhney et al. 1959; Jackson 2005; Marchuk S. et al. 2012). The
distribution of cations (in cmol+/kg and % of saturation) on exchange sites before and after
treatment are presented in Table 11.
Cation exchange is a stoichiometric reaction governed by the laws of mass action. This means
that, in general, increased concentration of the replacing cation in the exchanging solution
causes greater exchange by that ion on the exchange sites of soil/clay particles.

66
Figure 24 XRD patterns of clay fractions for investigated soils
Table 10 pH and CEC (in cmol+/kg) of original and homoionic samples
Soil Measurement Original Na K Mg Ca
Urrbrae pH 6.7 7.9 7.9 7.3 6.8
CEC 5.8 6.7 6.5 7.3 7.0
McLaren pH 7.3 9.2 8.2 7.4 7.3
CEC 8.8 14.6 10.0 10.1 11.1
Claremont pH 8.3 10.9 10.6 9.8 9.0
CEC 30.6 36.8 46.5 49.4 32.4
Keilira pH 8.6 11.0 10.8 10.0 9.1
CEC 26.6 35.2 32.0 35.6 27.2
Results for the kaolinitic/illitic Urrbrae and McLaren soils (Table 11) show that all cation-
saturated samples were nearly homoionic with concentration of desired cations more than 95%
with one exception: in McLaren soil Na could only saturate the exchange complex to 91%. A
different tendency was observed in the smectitic Claremont and Keilira soils. Only saturation
with Ca produced homoionic species with 97.6 and 94.9% of saturation respectively for
Claremont and Keilira soils. Mg could only occupy 81.5 and 69.9% of exchange sites for the
3.0 8.0 13.0 18.0 23.0 28.0 33.0
Urrbrae
McLaren
Claremont
Keilira
Smectite
KaoliniteIllite
Quartz
2° θ

67
same soils. Potassium ions saturated Claremont soil by 76% and Keilira by 46.1% and the
results for Na were 61 and 48.8% respectively.
Table 11 Cationic composition of exchange complex for original and treated soils (in
cmol+/kg and % of saturation)
Soil ID Ca Mg Na K Ca Mg Na K
cmol+/kg % saturation
Urrbrae original 4.31 0.86 0.12 0.51 74.3 14.8 2.1 8.8
Urrbrae Na treated 0.06 0.03 6.48 0.11 0.9 0.5 96.9 1.7
Urrbrae K treated 0.03 0.02 0.11 6.36 0.4 0.3 1.7 97.5
Urrbrae Ca treated 6.72 0.03 0.12 0.11 96.4 0.4 1.7 1.5
Urrbrae Mg treated 0.03 6.98 0.13 0.15 0.3 95.8 1.7 2.1
McLaren original 4.74 2.74 0.71 0.60 53.9 31.2 8.1 6.8
McLaren Na treated 0.18 0.10 13.25 1.09 1.2 0.7 90.6 7.5
McLaren K treated 0.26 0.09 0.12 9.48 2.6 0.9 1.2 95.3
McLaren Ca treated 10.68 0.19 0.13 0.15 95.9 1.7 1.1 1.3
McLaren Mg treated 0.12 10.08 0.14 0.07 1.1 96.9 1.3 0.7
Claremont original 21.37 7.44 0.26 1.48 70.0 24.4 0.9 4.8
Claremont Na treated 13.24 0.91 22.44 0.18 36.0 2.5 61.0 0.5
Claremont K treated 10.15 0.78 0.24 35.38 21.8 1.7 0.5 76.0
Claremont Ca treated 31.61 0.21 0.20 0.39 97.6 0.6 0.6 1.2
Claremont Mg treated 8.78 40.23 0.16 0.19 17.8 81.5 0.3 0.4
Keilira original 10.70 9.44 5.34 1.07 40.3 35.6 20.1 4.0
Keilira Na treated 14.94 2.92 17.14 0.12 42.6 8.3 48.8 0.3
Keilira K treated 14.32 2.71 0.19 14.75 44.8 8.5 0.6 46.1
Keilira Ca treated 25.85 1.07 0.17 0.15 94.9 3.9 0.6 0.5
Keilira Mg treated 10.36 24.85 0.22 0.12 29.1 69.9 0.6 0.3
These differences in response to homoionic treatments of the soils reflect the differences in
their clay mineralogy. The main structural difference between kaolinite/illite and smectite in
terms of cation adsorptions is that kaolinite and illite adsorb cations on their outer surfaces,
whereas in case of smectites the exchange complex is located both on the outer and also the
inner surfaces (interlayer exchange sites). For smectites the interlayer exchange sites have
much larger capacities and also divalent cations tend to concentrate on interlayer rather than
on external surfaces (Churchman et al. 1993). Smectites expand or contract very readily
depending on the nature of the exchangeable cations (Moore and Reynolds 1997). Cations
which are easily hydrated, such as sodium, readily induce expansion of smectites. By contrast,
anhydrous monovalent potassium cations, when entering the inner exchange complex, could
induce contraction, or even collapse of the interlayer space around the edges of particles,

68
locking exchangeable divalent cations inside the interlayers of clay particles. We demonstrate
this effect using XRD diffractograms of homoionic Keilira samples (Figure 25).
Figure 25 XRD of homoionic Keilira samples
The variation of the basal spacings of smectites as a function of water adsorption has been
studied by a number of workers (e.g., Hendricks et al. 1940; Mooney et al. 1952; Zettlemoyer
et al. 1955; Fripiat et al. 1965; Keren and Shainberg 1975). These works indicate that the
variation of basal spacings depends chiefly on the chemical difference among interlayer
cations, especially between monovalent and divalent cations. Ca2+ and Na+ are usually found
in smectites as interlayer cations, Ca2+ having two layers of molecular water and giving rise to
a basal spacing d of about ~ 15.2 Å, and Na+ having one layer of molecular water and giving
rise to a basal spacing of about ~ 12.6 Å (see, e.g., Keren and Shainberg 1975). Glaeser and
Mering (1954) pointed out that these ions tend to occur in a "demixed state," that is, some
interlayer regions are occupied mainly by Ca2+ and others mainly by Na+.
Keilira Ca2+, Mg2+ and Na+ saturated samples have 001 d-spacing at ~15.20 Å – typical for
smectite saturated with divalent cations which has double water layer. The K+ – homoionised
sample having saturated exchangeable sites for only 46% of its capacity has a d-spacing at
~14.10 Å. This could be due to: a) the collapse of part of the smectite layers and their
Ca=15.174
Mg=15.172
K= 14.123
Na=15.173
4.0 8.0 12.0 16.0 20.0 24.0 28.0 32.0 36.0
Saponite
2 θ°
Illite/Mica
Kaolinite
Quartz
Calcite
d=14.12Å
d=15.17Å
Ca saturated
Mg saturated
Na saturated
K saturated

69
transformation into an interstratified smectite-illite phase (Eberl and Hower 1977; Velde and
Barré 2010 among many others), where in this scenario potassium became a part of mineral
structure; b) potassium cations having saturated a part of the smectite interlayer space
dehydrated, but did not collapse it. In the second scenario potassium is available for exchange
reaction (Velde and Barré 2010). Considering that the CEC of the K+ homoionised sample is
slightly lower than Na+ and Mg2+ samples both reactions could occur: part of the smectitic layer
became interstratified and another part just dehydrated, decreasing the interlayer space.
Effect of homoionic treatments on particle size and zeta potential of soil clays
The results of mean particle size (MPS) and zeta potential measurements show that for all soil
clays studied the samples with monovalent homoionic species have smaller MPS and higher
negative zeta potential values (Figure 26). The homoionic clays treated with divalent cations
showed larger MPS and lower negative zeta potentials. The MPS increased in all clay samples
in the order Na < K < Mg < Ca with the exception of the Urrbrae Ca-saturated sample which
had a smaller MPS than its Mg-saturated sample. The changes in size observed are reflected
in the zeta potential data, with samples having smaller sizes giving higher negative zeta
potentials.
Zeta Potential, mV Particle size distribution, µm
Figure 26 Zeta potential and mean particle size measurements for studied soils
The zeta potential is directly related to the total interaction energy between particles. Yong and
Sethi (1977) studied clay dispersibility using refiltration experiments. Measurements of
refiltration rate relative to zeta potential provided information on the dispersibility of the clay
studied. The results showed that the higher the refiltration rate, the more flocculated the clay
-68.3 -66.6
-42.5 -41.7
-61.3-59.8
-47.3
-43.5
-36.9
-31.5
-26.4 -25.6-31.5 -29.8
-26.1 -24.4
-70
-60
-50
-40
-30
-20
Urrbrae McLaren Claremont Keilira
Na CaMgK
0.50
0.64
0.80
0.76
0.55 0.56
0.64
0.78
0.31
0.45
0.74
0.86
0.38
0.41
0.46
0.54
0.20
0.30
0.40
0.50
0.60
0.70
0.80
0.90
Urrbrae McLaren Claremont Keilira
Na CaMgK

70
and vice versa. Yong et al. (2012) categorized zeta potential values in terms of dispersion
behaviour of clays (Figure 27). The illustration shows that as the zeta potential decreases, the
degree of dispersibility increases. Chorom and Rengasamy (1995) came to the same
conclusion. In our experiment all soil clays saturated with monovalent cations gave higher
negative zeta potential values than those saturated with Ca2+ or Mg2+. The potassium saturated
samples have larger MPS and higher (less negative) zeta potential values than those saturated
with sodium. In view of the findings of Chorom and Rengasamy (1995) and Yong et al. (2012)
I can conclude that exchangeable potassium has a lower dispersive potential than exchangeable
sodium. Both monovalent cations, when present on the outer exchange sites of clays, have a
greater ability to promote dispersion than their divalent counterparts.
Figure 27 Interpretation of presence of microstructures from ranges of average zeta potential
(after Yong et al. (2012)
Clay particles of smaller size would be expected to disperse more easily, but their charge
characteristics, as indicated by zeta potentials, also affect ease of dispersion. My findings show
that smectitic Claremont and Keilira samples homoionized with monovalent cations have
smaller MPS but lower negative values of zeta potential than illite/kaolinite Urrbrae and
McLaren soil clays and lower dispersion potential. Dispersion/flocculation phenomena are
governed by the attractive and repulsive forces in the electrical double layer at the surface of
charged colloids (Chorom and Rengasamy 1995). The balance between these forces is
determined by factors such as exchangeable cation and ionic strength of the soil solution
(Rengasamy and Olsson 1991).
Maximum aggregation and floculation
Fair aggregation and floculation
Excellent aggregation and floculation
+3
0
- 5
- 10
- 60
Plateau of slight dispersion
Treshhold of aggregation and
Moderate dispersion
Good dispersion
Very good dispersion
Avera
ge Z
eta
Pote
ntial ζ in m
v
- 20
- 80
- 30
- 40
- 50
Excellent dispersion
Maximum dispersion- 100
Sin
gle
pa
rtic
le in
tera
cti
on
gra
du
ati
ng
to
msu
in
tera
cti
on
s

71
Of the attractive forces, van der Waals forces account for most attractive effects (Churchman
et al. 1993) though they are strongly inversely related to particle separation (Crooks 1999).
Since van der Waals forces are additive in polyatomic systems, their strength is directly related
to the number of atoms and to their closeness of approach. Hence, they are likely to be enhanced
by large surface areas and by flat particles which fit closely together. Particles with low surface
areas, and/or irregular surfaces which prevent close approach will generate low attractive forces
of the van der Waals type (Churchman et al. 1993).
Kaolinite, illite and smectite are the most common clay minerals in soils. Typically, kaolinites
have large particles, low specific surface areas and a low CEC, while smectites have small
particles, high specific surface areas and high CEC's. For most illites, these properties are
intermediate between those for kaolinites and smectites. The shapes of their particles also
contrast. Kaolinites have flat, relatively thick and generally regular (hexagonal) platy particles,
while smectites have thin flakes. Illites also have platy particles which cover a range of
thicknesses and which often have irregular surfaces (Churchman et al. 1993). Many illites
consist of relatively thick particles with little flexibility (Greene et al. 1978). In contrast,
smectite particles can be very thin and highly flexible (Emerson 1983). Electron micrographs
show that illite crystals may have irregular surfaces (Greene et al. 1978). In particular, their
planar surfaces can be terraced (Quirk 1978). These features mean that contact between illite
particles is less intimate than that between the flexible thin flakes in smectites. Both these
morphological factors and a lower effective layer charge mean that edge-to-face attraction
between illite particles is usually weaker than between those of smectites (Churchman at al.
1993). In general, these differing morphologies of smectite, illite and kaolinite lead to differing
packing of their tactoids, so that they form clay aggregates that differ in their stability (Fig. 28).
The differences in the organisation of clay particles of different clay minerals and their electric
charge reflects their differences in interactions with water in soil solution and consequently in
their dispersive behaviour (Lado and Ben-Hur 2004).
Tessier at al. (1992) studied the changes in clays microstructure under different wetting
regimes. They noticed that illite and smectite clays have different pore size distributions and,
consequently, very different solid phase structures. For illite, a single wetting was enough to
bring about a breakdown of the structure so that the arrangement of the particles was affected
and a significant fraction of the pore volume was occupied by air. For smectite, under direct
wetting with water, the structure was like a sponge, without a complete dispersion of the
particles. The system would appear to be like a continuous network of particles arranged face

72
to face, limiting the pores and without any real continuity with each other. At higher resolution
the layers appear to be stacked in parallel, or practically parallel, ensembles. The pore size was
of the order of 1 µm for illite to 10 nm for smectite. Tessier and co-workers concluded that in
the case of illite the loss of cohesion was related to two factors: a) 90% of the porosity of the
sample was occupied by air; b) the large size interparticle pores results from the stacking of
rigid particles. Therefore, some free water (at atmospheric pressure) in contact with the illite
can very quickly migrate to the pores by capillarity. An overpressure of air should result and
lead to the disintegration of the illite and produce slaking. The interlayer spaces in illites are
closed and the particles are flat and very rigid and the interparticle contact surface is very
limited. This results in very weak overall interparticle cohesion forces, even if they are locally
very strong.
Figure 28 Schematic structure of clay aggregates (after Oades and Waters 1991)
With smectite, the structure is very different. As the size of the pores before wetting was small
(1-2 nm), the hydraulic conductivity was low and the water can migrate only very slowly in
the material. Moreover, because there is only a small amount of air, it can escape without
producing an overpressure. As the smectite clay layers are stacked face to face, their surfaces
overlap over large surface areas. Thus there is extensive continuity of the solid phase through
the hydrated interlayer spaces. These two aspects of the structure of smectites lead to very
strong cohesion and low hydraulic conductivities (Tessier at al. 1992).
Idealised cross section of clay aggregates

73
Taking into account all morphological and structural differences between smectite and illite
microstructures it can be deduced that smectitic soils having smaller particles possess better
organization of aggregates than illite. For smectites, when interacting with water, the attractive
forces of the van der Waals type overcome repulsive forces which reflect in better cohesion
and lesser dispersivity than illitic minerals. Particle size distribution and zeta potential data
presented in Figure 26 support this finding. Illitic soils are more dispersive than soils with
dominant smectitic clays. In this experiment I have shown that zeta potential could effectively
reflect soil clay dispersive properties. But to appropriately understand the meaning of zeta
potential we should have prior knowledge of the mineralogy of the soil studied.

74
Chapter 6. Potassium status of Urrbrae soil. Laboratory and
field study using traditional analytical methods, XRD and
TEM
In the first, a field based study, I investigated the variability of the clay fraction of one of the
South Australia most common soils – a Chromosol, with depth and under different vegetation
regimes. In the second, laboratory study, I evaluated the influence of exchangeable K+ on the
dispersive behaviour of the clay fraction of the Chromosol using traditional analytical methods,
XRD and TEM.
In the second study I have used the Urrbrae soil material from a laboratory controlled
experiment conducted by A. Marchuk (2013) and reported in her PhD thesis. A. Marchuk in
her study concentrated on the behaviour of Urrbrae soil as a whole, while my study was focused
on clay fractions of Urrbrae soil. I studied the influence of exchangeable K+, compared with
exchangeable Na+, Ca2+ and Mg2+, on the dispersive behaviour of Urrbrae soil clays.
Materials and methods
Selection of study site and soil
Red Brown Earth soil was taken from six soil profiles in the Permanent Rotation Trial at the
Waite Agricultural Research Institute. Profiles were chosen under different vegetation regimes:
cereal crops (cultivated site), grazing, vineyard, soil under a coniferous tree, soil under a
deciduous tree and uncultivated soil. The soil sampling sites were located within 50 m of each
other (Figure 29 and Table 12), which gave a unique opportunity to explore the short distance
variability of soil clays.
The Waite Agricultural Research Institute at Urrbrae, about 7 km from the centre of Adelaide,
was established in 1925. The climate is typically Mediterranean with a mean annual rainfall of
626 mm, of which 487 mm falls in the growing season (April-October). Mean annual maximum
and minimum temperatures are 21° and 12°C, respectively. The fine sandy loam found on this
site is a prime example of a red-brown earth (Stace et al., 1968) Urrbrae series (Litchfield,
1951) defined as a Red Chromosol (Isbell, 1996), with illite and kaolin being the main clay
minerals (Norrish and Pickering, 1977). The topography of the area is a plain with gentle
slopes.

75
The Urrbrae series of red-brown earths may be regarded as an automorphic soil developed
under well-drained conditions under the regional climate beneath the scarp of the range. The
low proportion of coarse sand and relatively high proportions of fine sand and silt reflects the
dominance of the argillaceous or finely siliceous material of the adjacent Pre-Cambrian strata
and indicates the uniform nature of the original parent material through the profile. The reddish
surface colour is presumably an expression of the mineral content, the organic matter being
depleted through cultivation or sheet erosion (Litchfield, 1951).
Figure 29 Study sites
Table 12 Location, elevation and climate condition of soil sampling sites
Soil sampling sites Latitude
(°S)
Longitude
(°E)
Elevation
(m)
Mean
annual
temperature
Annual
rainfall
Cultivated, cereal crops 34.966938 138.634416 109
Max 21°C
Min 12° C 626 mm
Cultivated, grazing 34.966916 138.634152 108
Uncultivated 34.967187 138.634195 110
Cultivated, vineyard 34.967146 138.634067 109
Uncultivated, pine tree 34.967281 138.634347 112
Uncultivated, deciduous tree 34.967301 138.634205 111

76
Soil sampling and preparation
Soil samples were collected and geo-referenced using a Garmin eTrex GPS device with 5 m
accuracy in November 2010. At each site, soil was taken with a hand auger from the following
depths: 0 – 10, 10 – 20, 20 – 30, 30 – 40, and 40 - 50 cm (where possible) in polyethylene bags.
Samples were first air-dried, ground and sieved to < 2 mm.
Clay fractioning
The soil was fractionated in water following the procedure summarised in Figure 30. The height
of the soil/water column (19 cm) was calculated according to settling time (16 hours) by means
of Stokes’ Law (Jackson, 2005) to ensure that particles in suspension were all < 2 μm.
Figure 30 Fractionation procedure

77
Figure 31 Settling of soil/water suspension of Urrbrae soil from cultivated (cereal) site for
different depths, from the left: 0-10 cm, 10-20 cm, 20-30 cm and 30-40 cm
The cylinders were then allowed to stand (Figure 31), and after 16 hours of settling the clay (<
2 μm) fraction was isolated from soil by siphoning of the dispersed material. No chemical
treatments were applied to the raw samples in order to preserve all forms of potassium and
other chemical elements in soil in their initial states. The procedures of adding water, stirring,
allowing settling and siphoning were carried out for a total of 6 times, and the clay suspensions
thus obtained were combined. The bulk clay fraction was divided into fine (< 0.2 µm) and
coarse (0.2-2 µm) clay subfractions using a Beckman J2-21M centrifuge equipped with the JS-
7.5 swinging bucket rotor. The supernatant containing 0.2 µm clay fraction (Fig. 33, B) was
poured in a beaker and oven-dried at 60ºC (Figures 32 and 33).
Figure 32 Clay fractionation: A - Bulk clay fraction before centrifugation. B - Suspended <
0.2 µm clay fraction (supernatant) after centrifugation
The particle size distribution of the remaining supernatant was also examined using a Nicomp
Submicron Particle-Sizer, Model 370 which analyses particles using dynamic light scattering.
The average particle size and size distribution was determined by a number-based so-called
‘Nicomp’ (non-Gaussian) fit to raw data which had been collected over 7-8 min at 20 °C at an
angle of 90° (Figure 34).
A B

78
Figure 33 Drying of supernatant in oven
Figure 34 Snapshot of particle size distribution data (in nm) for < 0.2 µm clay fraction
obtained using a Nicomp Particle-Sizer
X-Ray diffraction (XRD) analysis
The protocol for XRD analysis was described in previous experiment (Chapter 5).
Transmission electron microscopy (TEM)
Transmission electron microscopy was undertaken to determine the mineralogy and
composition of the clay samples. Among the tools available for the study of very small
particles, transmission electron microscopy (TEM) is perfectly adapted to the characterization
of soil fine particles (Elsass et al. 2008). Samples were prepared by dispersing a small amount
(10-15 mg) of material in similar amount of deionised water by ultrasonic treatment. A drop of
the remaining slurry was allowed to dry on a carbon-coated cellulose film supported by a 200
mesh copper grid.
High-resolution imaging and chemical analyses were performed using a Philips CM200
Transmission Electron Microscope (Figure 35)) fitted with an EDAX r-TEM system to perform
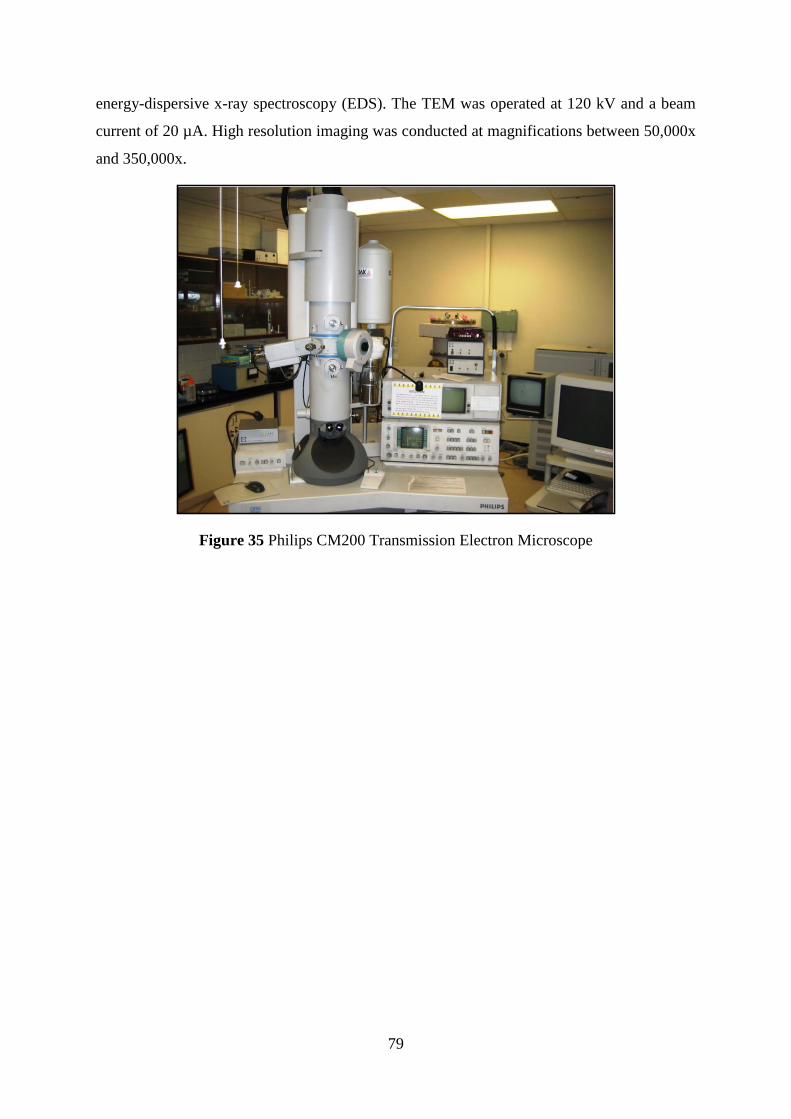
79
energy-dispersive x-ray spectroscopy (EDS). The TEM was operated at 120 kV and a beam
current of 20 µA. High resolution imaging was conducted at magnifications between 50,000x
and 350,000x.
Figure 35 Philips CM200 Transmission Electron Microscope

80
Results and discussion
Soil Analysis
Soils from 6 locations, each under different types of vegetation, were analysed for the
determination of pH, EC and soluble potassium content (Rayment and Lyons, 2011). The
results of soil analysis (Table 13 and 14) has shown that investigated sites differ in pH, EC and
soluble potassium content. Figures 36 - 38 illustrates the spatial distribution of the pH, EC and
soluble K+ within sampling depths. Soluble potassium content particularly varied
considerably, mostly in the top two horizons.
Table 13 Variation of analysed soil properties with depth
Depth Cultivated Grazing Uncultivated Wine Pine Tree
pH
0 – 10 5.5 7.4 6.0 7.0 6.7 7.5
10 – 20 5.5 7.2 6.3 7.3 6.8 8.1
20 – 30 6.1 7.2 6.5 7.4 7.4 8.4
30 – 40 6.4 7.2 6.7 7.4 7.8 8.5
EC, dS/m
0 – 10 0.18 0.19 0.07 0.06 0.21 0.12
10 – 20 0.09 0.08 0.03 0.04 0.31 0.1
20 – 30 0.08 0.04 0.03 0.03 0.30 0.08
30 – 40 0.09 0.04 0.04 0.03 0.24 0.06
K+, ppm
0 – 10 9 40 7 2 18 15
10 – 20 7 12 3 1 13 11
20 – 30 5 6 1 1 7 8
30 – 40 5 3 1 1 3 5
Table 14 Summary statistics of analysed soil properties
Statistics pH EC,
dS/m K+, ppm
Minimum 5.5 0.03 1
Maximum 8.5 0.31 40
Mean 6.99 0.11 7.52
Standard Error 0.16 0.02 1.65
Standard Deviation 0.79 0.08 8.23
Coefficient of variation, % 11 73 109

81
Figure 36 Spatial variability of soil pH

82
Figure 37 Spatial variability of soil EC

83
Figure 38 Spatial variability of soil soluble potassium

84
Mineralogical determination of clay fractions by XRD
Previous study
In 1951 Radoslovich conducted survey “Soil Colloids of Several Adelaide Red-Brown Earths”.
Up to the present date this is the most comprehensive existing mineralogical report on Urrbrae
soil. The closest pit examined is from the north-west part of arboretum of Waite institute
(Figure 39). The results of this survey are presented in table 15.
Figure 39 Location of survey pit and experimental soil sites on map of W.H. Litchfield, 1951
According to Radoslovich’s (1951) survey, in clay mineral composition Urrbrae soil colloids
are basically mixtures of illite and kaolinite. A moderate amount of chlorite is present in some
cases and is apparently alluvial in origin. Montmorillonite is definitely present (in fairly small
Waite Main Building
Urrbrae House

85
amounts, probably < 10% of the clay fraction) in a few horizons. There is also evidence of
components of rather indefinite structure and spacing in some cases. These have been termed
“mica-montmorillonite intermediates”, but they have not been positively identified as any
definite clay mineral types. The montmorillonite found in these soils could occur mainly in
these phases.
Table 15 X-Ray Crystallograph Analysis of the Colloidal Fraction of the Waite Institute
Profile Pit (in Litchfield, 1951) based on survey of Radoslovich, 1951
Depth 0-18 cm 18-33 cm 33-75 cm 88-113 cm 113-173 cm
Horizon A1 A2 B1 B2C B3C
Minerals
present
Illite
Kaolinite
Quartz
Ferric oxide
Chlorite (weak)
Mica-MMT*
(some
evidence)
Illite
Kaolinite
Quartz
Ferric oxide
Mica-MMT
(some
evidence)
Kaolinite
Illite
Ferric oxide
(fairly intense,
stronger)
Quartz (weak)
Mica-MMT
(some
evidence)
Chlorite
(very weak)
Kaolinite
Illite
Chlorite
(stronger)
Quartz
Ferric oxide
Calcite
MMT (weak)
Kaolinite
Illite
Chlorite
(strong)
Quartz
Ferric oxide
Mica-MMT
(stronger)
Goethite (?)
Gibbsite (?)
* Montmorillonite
Mineralogical analysis of clay fraction
Similar XRD patterns were acquired from all six profiles (Figures 40). The XRD traces of < 2
μm clay fractions obtained for the randomly orientated, air-dried (AD) samples show
diffraction peaks typical of clay minerals, with additional reflections that were attributed to the
primary minerals quartz (4.26, 3.34 Å) and K-feldspar (3.24 Å). The rational 00l reflections
series appeared at ~10.0, ~5.00, and ~3.34 Å, and at ~7.2 and ~3.6 Å corresponding to discrete
illite/mica and kaolinite phases, respectively. The positions of these peaks were not affected by
glycerol treatment (Figure 41). The samples from cultivated and grazing profiles contain traces
of vermiculite and vermiculite-illite. Given the problems of proper identification of vermiculite
phases (Brindley and Brown 1980) and the small amount possibly present, no further attempt
was made to identify these minerals. The position of the 060 reflection is useful in
distinguishing between dioctahedral and trioctahedral species (Figure 42). A peak at d = 1.49
Å was attributed to kaolinite, which is dioctahedral (Grim 1968); a peak at d = 1.54 Å was
attributed to quartz. A peak at d~1.50 Å overlapped with the kaolinite 060 peak indicated an
illite/mica with a dioctahedral structure.
In order to achieve a better insight on the detailed structural aspects of clay mineral
assemblages of studied clays semiquantitative assessment was performed. The

86
semiquantitative clay mineral proportions were estimated from the glycerolated patterns.
Expansion with glycerol is diagnostic for swelling clays, including smectites and vermiculites.
Figure 40 XRD patterns of Urrbrae soil clay under different vegetation regime. V,
vermiculite (d~14.2 Å); I/V, illite-vermiculite (d~12.1 Å); I/Mi, illite/mica (d~10.0 Å); K,
kaolinite (d~7.2 Å); Q, quartz (d=3.43 Å); K-F, K –feldspar (d=3.24 Å), Co Kα radiation
Figure 41 Air dried and glycerolated XRD patterns of cultivated profile
4 8 12 16 20 24 28 322θ
I/MiK
Qz
K-F
V I/V Cultivated
Grazing
Uncultivated
Vineyard
Deciduous tree
Conifer tree
File Name: c:\...\urrbrae_txt\cult_20_30_peter.txt c:\...\cultiv\cult_20_30\cult_20_30_2_0.2_sm.txt
Urrbrae Cultivated 20-30 cm depth
2-Theta Angle (deg)10.00 20.00 30.00
10
20
30
40
50
60
70
80
90
Inte
nsity (
Counts
) X
1000
Glycerolated
Air Dried
2°θ
Illite/Mica Kaolinite
Quartz

87
Figure 42 060 region of XRD traces for cultivated profile
The integrated areas were multiplied by weighting factors (Biscaye, 1965) and normalized to
100%. Weighting factors used are 0.6 for illite, 1.1 for kaolinite, 3.1 for quartz and 0.7 for
potassium feldspar (P. Self, personal communication). Weighting factors vary in detail with
operators and XRD machines used, P. Self has worked them out for his system. The results for
all 6 profiles (20-30 cm depth) are presented in Table 16.
Table 16 Quantitative estimation of clay phases
Mineral Cultivated Grazing Uncultivated Wine Coniferous
tree
Deciduous
tree
Illite 37% 39% 35% 35% 49% 45%
Kaolinite 26% 27% 29% 24% 29% 33%
Quartz 21% 22% 24% 25% 15% 15%
Feldspar 16% 12% 12% 17% 7% 7%
Illite and kaolinite were the most abundant clay minerals in all profiles ranging from 49 to 35
% and from 33 to 24 % respectively. The clay assemblages under both coniferous and
deciduous trees had the highest content of illite and kaolinite. In order to identify variability of
clay assembledges with depth, XRD patterns of cultivated profile for 3 depths were quantified
(Figure 43). We observed a gradual increase with depth in illite and kaolinite mineral content
at the expenses of quartz and k-feldspar.
70 72 74 76
Quartz
Illite/Mica
Kaolinite
2°θ
1.54
1.50
1.49

88
Figure 43 Variation of clay assembledges with depth for samples from cultivated profile
The results of mineralogical analysis of Urrbrae soil clays from 6 sites with different vegetation
regime correspond well with the study of Radoslovich (1951). Both horizontal and vertical
variability in clay-mineralogical composition of the studied soil clays were found to be
qualitatively homogeneous.
The study was an attempt to clarify the relationship between the clay minerals and different
plants. The main part of the work comprised a study of the X-ray diffraction basal peak
reflection of clay minerals in Urrbrae soil. These particular reflections are of interest since they
characterise the potassium status of particular soil. Even with a range of land treatments
Urrbrae soil shows only minor changes in its XRD diagrams. The samples taken from soil
under cereal crops and grazing show the presence of vermiculite and mixed layered illite-
4 8 12 16
0-10 cm
10-20 cm
20-30 cm
2θ
I/Mi K
VI/V
26%
17%35%
23%
0-10 cm
31%
17%30%
22%
10-20 cm
37%
26%
21%
16%
20-30 cm
Illite Kaolinite
Quartz K-Feldspar

89
vermiculite phases, which were not present in clay from uncultivated soil. These minerals
derive from Illite which has been completely (in the case of vermiculite) and partially (for illite-
vermiculite) depleted of potassium. It is a quite difficult for plants to remove enough K from
Illite to show mineral changes. Urrbrae soil does not give a strong XRD effect for the removal
of K. The results from XRD alone are not enough to characterise the potassium status of a
particular soil.
The behaviour of Urrbrae soil clay under different rates of potassium
application
XRD data analysis of 6 soil profiles from different vegetation regimes has shown variation
only in the amount of clay mineral present, with mineralogical composition being the same for
all soils: illite, kaolinite, quartz and k-feldspar. During the clay separation procedure, I have
noticed that clays from different sampling sites and depth showed varying levels of dispersion.
In Chapter 5 I have shown that zeta potential could reflect the dispersive behaviour of soil/clay.
Table 17 presents zeta potential measurements for all soil clays studied. Taking into account
that the clay mineralogy for all soils was similar, variation in zeta potential could reflect
differences in the distribution of exchangeable cations and as a result differences in surface
charge.
Table 17 Zeta potential (mV) for studied soils
Depth Cultivated Grazing Uncultivated Wine Pine Tree
0 – 10 -25 -40 -43 -37 -38 -30
10 – 20 -29 -45 -40 -46 -30 -27
20 – 30 -31 -43 -41 -51 -34 -27
30 – 40 -27 -44 -38 -51 -40 -28
A. Marchuk in her PhD study (2013) used the same Urrbrae soil from cultivated plots. In
laboratory controlled leaching experiments she applied solutions with different amount of
potassium. Her results have shown that, as amount of applied potassium increased, the
hydraulic conductivity decreased and dispersibility, expressed as turbidity, increased. In this
experiment, cation ratio of structural stability index (CROSS) (Rengasamy and Marchuk, A.,
2011) was used as the indication of different potassium rates. The cationic composition of
solutions applied is given in Table 18. Application of potassium simulated the effects of
disposal of common fruit-based wastewaters on this soil, which is a soil type that is widespread
in the agricultural regions of South Australia. For my study I have used two treated soils: with

90
CROSS 6 and 15 solutions applied. For comparison, I have used untreated soil from the same
plot. The soil samples after treatment were dried and the clay fraction extracted.
Table 18. Cationic composition of treatment solutions expressed as CROSS. After Marchuk
A., (2013)
Treatment
Cations in treatment solutions
(mmolc/L) CROSS
K+ Na+ Ca2+ Mg2+ mol0.5m-1.5
1 20 3.2 5.4 10 6.0
2 30 3.2 5.4 10 8.4
3 42 3.2 5.4 10 11.2
4 60 3.2 5.4 10 15.4
Mineralogical analysis of original and treated clays
The XRD patterns of the < 0.2 µm fractions for original and treated soil clays (‘fine clays’) are
shown in Figure 44. As one of the aims of this experiment was to assess the effect of
application of solutions with different potassium concentrations on clay minerals, we were
particularly interested in establishing the clay mineralogy of the studied soils, and identifying
differences in the original clay as well as mineralogical changes after treatment.
Figure 44 XRD of Urrbrae soil clays (< 0.2 micron): original and after treatments
The XRD patterns of < 0.2 μm fraction obtained for the orientated, Mg-saturated glycerolated
states show diffraction peaks typical of clay minerals, with additional reflections that are
attributed to quartz (4.26, 3.34 Å). The rational 001 reflections series at 9.98, 4.99, and 3.34 Å,
and at 7.17 and 3.58 Å correspond to discrete illite and kaolinite phases, respectively.
8.0 12.0 16.0 20.0 24.0 28.0 32.0
CROSS 15 Treated
CROSS 6 Treated
Original
Illite
Kaolinite
Quartz
2 θ

91
Quantitative assessment of the identified clay phases and their relative abundance are given in
Table 19. From the comparison of diffractograms of original and treated soils we could observe
a gradual symmetrical broadening of the illite peak with increasing solution concentration
(from CROSS 6 to CROSS 15). The broadening of XRD peaks could be due to interlayering
and/or a decrease in the size of the diffraction domain (small grain size) (Moore and Reynolds
1997). In our case, as we did not detect expandable clay minerals in any samples, so broadening
of XRD peak means a decrease in the grain size of the illitic mineral phase (Velde and Barré
2010).
Table 19 Quantitative analysis of clay < 0.2 micron fraction
Sample Illite Kaolinite Quartz
Original 46 46 8
Treated with CROSS 6 45 47 6
Treated with CROSS 15 46 47 7
In order to separate the contribution of various phases to the diffracted intensity Lanson (1992,
1997) developed a decomposition program for X-ray profiles of clay minerals. This
decomposition program can fit the experimental XRD pattern with elementary curves that are
related to the different phases present in the soil clays. The position and full width at half
maximum intensity (FWHM) of these elementary curves should let us identify each associated
phase by comparison with simulated patterns (Lanson and Besson 1992). Peak position
indicates, for the most part, compositional changes, while FWHM indicates the relative number
of layers coherently diffracting in the crystallites. Peak area can be used to indicate the relative
proportions of the different clay phases within the same soil/clay type and to quantify
modifications in the clay assemblages (in our example – before and after treatments) (Velde et
al. 2003). Any phase identified with this method will be characterized by a mean value for all
these parameters, with the mean values actually representing a population. The major use of
decomposition is to identify the peaks present and to compare their relative areas in order to
identify changes in mineral abundance and mineral type. This can be done for similar materials
which have been subjected to different chemical changes (Velde and Barré 2010).
From all of the clay phases identified (Figure 44) only illite has potassium in its structure and
its potential to release and uptake K+ from soil water solution could lead to mineralogical
changes of the whole mineral assemblage of a particular soil clay fraction (Reitemeier 1951;
Velde and Barré 2010). In our further investigations kaolinite was not considered, because it
has a very low cation exchange capacity and little or no potassium in its mineral structure. The
decomposition procedure (Lanson 1992, 1997) was applied essentially on the illite 001

92
reflection region. As recommended by Lanson and Besson (1992), the XRD patterns were
decomposed by progressively increasing the number of elementary curves, in order to obtain a
good fit with the smallest number of curves. The decomposed patterns for original clay and
after the treatments are shown in Figure 45. For the illite phase two peaks are normally present.
The narrower 10 Å peak indicates the presence of fully anhydrous interlayer potassium ions,
and this phase is called illite (WCI or well crystallized illite). The wider peak at 10.1 Å in
general represents the small grained illite material (PCI or poorly crystalized illite), usually of
less than 6 units layers thickness (Lanson and Velde 1992; Lanson and Besson 1992; Lanson,
1997).
a) Original b) Treated with CROSS 6 c) Treated with CROSS 15
Figure 45 The decomposed patterns of illite phase for original and treated samples
The decomposition of the XRD diagram for the original sample produced 2 basic peaks with
maximum intensities at d = 10.12 and 9.98 Å (Figure 45a and Table 20). By its position and
sharpness, the curve near 9.98 Å was attributed to a mica-like phase (or well-crystallized illite,
WCI). The band near 10.1 Å was typical of an illitic mineral (PCI), which was thought to have
a finer grain size than the WCI. This is indicated by a broader peak, with a width at half height
near 0.41° 2θ against 0.25° 2θ for the WCI phase.
Table 20 Tabulated decomposition parameters for studied clay samples
Sample Phase d-sp (Å) FWHM (2 θ) Area %
Original WCI 9.98 0.25 98082 71
PCI 10.1 0.41 41576 30
CROSS 6 WCI 9.98 0.4 47864 42
PCI 10.0 1.2 64951 58
CROSS 15 WCI 9.98 0.4 23416 31
PCI 10.0 1.2 53243 70
The same illitic phases were identified in treated clays (Figures 45b, 45c and Table 20). The
WCI peaks after treatment with CROSS 6 and CROSS 15 solution were constant in peak
position (9.98 Å) and FWHM (0.4° 2θ) but the peak area (relative amount of WCI) gradually
decreased after the treatment was performed more than twice. The PCI peaks after treatments
shifted slightly towards the lower d-spacing (from 10.12 to 10.0 Å) and increased in relative
0
1
2
3
4
5
6
9 10 11 12
WCI
PCI
2θ
0
1
2
3
4
5
6
9 10 11 12
WCI
PCI
2θ
0
1
2
3
4
5
6
9 10 11 12
WCI
PCI
2θ

93
area from 30 % for original sample to 58 and 70% for samples treated with CROSS 6 and
CROSS 15 solution respectively. FWHM has changed from 0.41 to 1.2° 2θ after the treatments
inferring a decrease in grain size which characterizes the transformation from WCI to PCI
(Righi et al. 1995; Velde 2001; Barré et al. 2008). It seems that an application of potassium
rich solution changed the grain size of the illite phase of Urrbrae soil.
Particle size distribution of the studied clays was verified using Zetasizer Nano Malvern®
instrument. The Zetasizer system determines the size by first measuring the Brownian motion
of the particles in a sample using Dynamic Light Scattering (DLS) and then interpreting a size
from this using established theories. According to Pieri et al. (2006) and Sandler et al. (2015)
laser-determined grains of < ~5 μm are equivalent to the clay fraction determined by
sedimentation (< ~2 μm). The results obtained are presented in Figure 46. On a graph, each
curve represents the particle size distribution for a single run. Each clay sample was run 6
times, each run consisted of an average value of 15 measurements. As could be seen from
Figure 46, particle size gradually decreased with increasing amount of potassium applied. The
Zetasizer Nano measurements support the XRD data results.
Mean particle size, nm
Clay Mean PS
Urrbrae Original 601
Urrbrae CROSS 6 559
Urrbrae CROSS 15 506
Figure 46 Particle size distribution (%) and mean particle size (nm) for the studied clays
Clay chemical properties
Selected chemical characteristics and particle size distributions of the studied clays before and
after treatment are given in Table 21 and Figure 47, respectively. Data represent an average of
0
2
4
6
8
10
12
0 1000 2000 3000 4000 5000 6000
Urrbrae CROSS 15
Per
cent
Particle size, nm
0
2
4
6
8
10
12
14
16
0 1000 2000 3000 4000 5000 6000
Urrbrae CROSS 6
Particle size, nm
Per
cen
t

94
triplicates for all determinations. The original untreated clay has the highest pH, EC and CEC.
After each treatment pH gradually decreased. Exchangeable potassium increased after each
treatment, as expected.
Table 21 Analysed chemical properties of clays
Soils ID pH EC,
dS/m
Soluble, mg/l Exchangeable, cmol+/kg CEC
cmol+/kg Ca Mg Na K Ca Mg Na K
Original 7.2 0.86 14.27 0.89 152.20 20.72 14.83 1.27 3.27 3.35 22.7
CROSS 6 6.8 0.26 1.17 1.66 31.87 26.20 4.66 8.42 0.95 4.75 18.8
CROSS 15 6.6 0.31 0.93 0.97 36.43 40.68 6.13 4.59 1.30 9.97 19.0
Urrbrae Clay Original
Urrbrae Clay CROSS 6
Urrbrae Clay CROSS 15
Figure 47 Zeta potential measurement as it shown on Malvern Zeta master instrument
A decrease in CEC after treatments could partially be explained by the presence in studied soils
of clay minerals – kaolinite and illite - with substantial pH dependable variable charge (Chorom
and Rengasamy 1995). The second factor is a fixation of potassium by illite. The most
important K-bearing minerals are K-feldspar (3-12% K) and mica (biotite, 5-8% K; muscovite,
6-9% K). Weathering of primary K-bearing minerals is associated with the release of K+. The
minerals formed during the weathering of micas correspond with the following sequence
(Schroeder, 1976): mica (~10% K) → hydromicas (6 to 8% K) → illite (4 to 6 % K). The illite
Run Pos. KCps Mob. Zeta Width Time1 17.0 2857.2 -3.361 -45.9 1.7 11:03:272 17.0 2783.7 -3.407 -46.4 1.7 11:03:493 17.0 2686.9 -3.422 -46.6 1.7 11:04:154 17.0 2614.2 -3.449 -46.9 1.7 11:04:405 17.0 2851.4 -3.383 -46.0 1.7 11:05:03Average 2758.7 -3.405 -46.4 1.7+/- 106.0 0.034 0.4 0.0
Zeta Potential
-100 0 100Zeta Potential
10
20
Inten
sity
Run Pos. KCps Mob. Zeta Width Time1 17.0 3590.7 -2.880 -38.8 1.7 11:13:522 17.0 3637.6 -2.972 -40.1 1.7 11:14:173 17.0 3386.0 -2.974 -40.1 1.7 11:14:394 17.0 3340.5 -2.934 -39.5 1.7 11:15:045 17.0 3403.6 -3.035 -40.9 1.7 11:15:26Average 3471.6 -2.959 -39.9 1.7+/- 133.1 0.057 0.8 0.0
Zeta Potential
-100 0 100Zeta Potential
10
20
Inten
sity
Run Pos. KCps Mob. Zeta Width Time1 17.0 2531.5 -3.679 -48.3 1.6 12:00:172 17.0 2568.6 -3.781 -49.5 1.6 12:00:433 17.0 2460.0 -3.674 -48.2 1.6 12:01:084 17.0 2496.4 -3.759 -49.1 1.6 12:01:315 17.0 2255.1 -3.804 -49.8 1.6 12:01:55Average 2462.3 -3.739 -49.0 1.6+/- 122.7 0.060 0.7 0.0
Zeta Potential
-100 0 100Zeta Potential
10
20
Inten
sity

95
in soil clays certainly have the capacity to fix potassium. As potassium becomes fixed by clay
minerals, the cation exchange capacity decreases.
In the case of the Urrbrae soil we are dealing with illitic/kaolinitic soil with exchange
complexes located on the outer surface of phyllosilicates. As a monovalent cation, applied
potassium exchanges with monovalent sodium first. As we could see from the data presented
in Table 22, after CROSS 6 treatment, the Ca+ and Mg+ cations occupied 70% of exchangeable
sites (before treatment – 71%). Potassium displaced sodium, changing Na/K ratio from 0.93 to
0.2. However, the potassium dispersive potential is lower than that of sodium and we observe
an increase in zeta potential (from – 46.4 to -39.9). This increase reaches a maximum when all
available exchange sites previously occupied by sodium are now occupied by potassium. As
the exchange reaction continues and the concentration of potassium increases (CROSS values
increase) potassium cations now displace magnesium (first) and then calcium cations. In doing
so, “dispersive” potasium cations displace “floculating” magnesium and calcium cations. And
we observed, a steady decrease in zeta potential (till -49.0) occurred until exchange reactions
reached their equilibrium.
Table 22 Zeta potential and cationic composition in % of studied clays
Clay ID
Zeta
potential,
mV
Exchangeable cations, % base saturation Ca + Mg,
%
Na + K,
% Ca Mg Na K
Original -46.4 65% 6% 14% 15% 71 29
Treated CROSS 6 -39.9 25% 45% 5% 25% 70 30
Treated CROSS 15 -49.0 32% 24% 7% 37% 56 44
TEM Study
The nature of clay particle associations for original and CROSS 15 treated soils were also
examined by transmission electron microscopy (TEM). TEM observations of the effect of
applied potassium in a CROSS 15 solution on clay fabric are presented in Figure 48. The
untreated clay particles show discrete, rounded clay aggregates (the boundary between particles
is clear). Potassium enrichment resulted in formation of a dense continuous network of very
fine clay particles with a cloud-like appearance. And at higher magnification the differences –
the dispersive effects of adsorbed K+- are seen. The TEM image of a treated sample shows that
the clay particles dispersed and have formed a rougher surface. By contrast the original sample
shows that the clay particles are flocculated and have formed a coarser granular structure.

96
Original Treated with CROSS 15
Figure 48 TEM images of Urrbrae Clay fraction (<0.2 micron) before and after application
of CROSS 15 solution
Results obtained in this experiment show how application of potassium could change soil
physical and chemical properties. There is an indication that at low levels of potassium soil
structure may not be affected. TEM and XRD methods could compliment a better
understanding of the processes occuring in soil.

97
Chapter 7. Possible effects of irrigation with wastewater on
the mineralogy of some Australian clayey soils: laboratory
study

98
Abstract
Potassium is common in a wide variety of wastewaters and in some wastewaters is present at
several hundred to several thousand mgL-1. Potassium is taken up by expandable clays leading
to its fixation and illitisation of smectitic and vermiculitic layers. Hence the addition of
wastewaters to soils may lead to mineralogical changes in the soils that affect their physico-
chemical properties.
Winery wastewater was equilibrated with some clayey soils from Southern Australia. XRD
patterns and chemical composition of clays extracted from untreated and treated soils were
determined. In 3 of the 4 soils, shifts in peak positions occurred towards more illitic
components along with increases in K and sometimes also Mg and Na contents of soil clays.
Peak decomposition showed trends towards the formation of interstratifications of illite with
smectite at the expense of smectite and an alteration of poorly-crystallised illite into its more
well-ordered forms. The results show that illitisation may occur as a result of the addition of
K-rich wastewaters to clayey soils.
Introduction
As demand for fresh water intensifies, wastewater is frequently being seen as a valuable
resource for irrigation. An attractive property of reclaimed wastewater is its potential fertilizing
capacity. On the other hand, the high concentrations of nutrients in wastewater can be
problematic to agriculture and the environment (Hamilton et al. 2007).
Potassium is ubiquitous in wastewaters and in some wastewaters is present at several hundred
to several thousand mgL-1. A wide variety of wastewaters contain potassium (Table 23).
Potassium accumulation in soils is seen by industry and regulators as a potential problem
because of the effects it might have on salt accumulation and soil structure. These effects are
unclear at present because there have been very few relevant studies (Arienzo et al. 2009).
Potassium ions are strongly retained by expandable clay minerals such as smectites and
vermiculites (Volk 1934; Levine and Joffe 1947; Reitemeier 1951; Barshad 1954; Mortland et
al. 1956; Richards and Mclean 1963; Sparks and Huang 1985, amongst many others).
Smectites and vermiculites are common components of many soils where they occur as single
mineral phases or in interstratifications with layers of other minerals such as illite/mica and
kaolinite (Norrish and Pickering 1983). The uptake of K+ by these minerals often leads to its
‘fixation’ within the interlayer region of the expandable layers.

99
Table 23 Potassium and sodium concentration in municipal and agricultural wastewater
(Arienzo et al., 2009)
Water Source K concentration,
(mgL-1)
Na concentration (mg
L−1)
Cheese whey 1,680 n.d.*
Lactic/casein whey 1,660 n.d.
Slaughterhouse 90 n.d.
Fellmongery 50 n.d.
Meat processing 20–150 50-250
Dairy shed 220 50
Piggery 500–1000 320
Winery 250 130
Olive oil processing 10,000–200,000 160-400
Palm oil processing 2,100 80-120 * not determined
Smectite íllitization has been well observed and documented in diagenetic series, hydrothermal
environments, in bentonite beds, or in a contrast metamorphism context (see Lanson and
Champion, 1991 and Meunier and Velde, 2004 for a summary). But this transformation in
upper soil horizons of soils occurs under completely different environmental conditions – under
lower temperature and pressure. In terms of our investigation we define illitisation as a
pedogenetic process, resulting in the fixation (reversible or partially reversible) of applied
potassium in the interlayer space of expandable minerals. This newly formed illite or illite-like
mineral phase is likely to be different from native illite already present in the profile. Illitisation
in soils can occur in a short time interval (Barré at al. 2008). Hence it is likely that the
application of potassium rich wastewaters to soils may lead to mineralogical changes in the
soils that affect their physico-chemical properties.
Powder X-ray diffraction remains the standard technique of clay mineral identification (Środoń
2006; Barré et al. 2007a). Recent progress in X-ray diffraction techniques and X-ray data
processing give us the ability to deal with complex overlapping reflections with a variety of
computer-based programs, including Rietveld analysis, whole pattern fitting and
decomposition, allowing us to observe even subtle modifications in clay minerals (Barré et al.
2007b). Because the clay fractions in soils are complex mixtures of different clay mineral
phases, including mixed-layer minerals, their characterisation is generally a difficult task.
These mixtures exhibit complex XRD reflections combining several poorly resolved maxima
(Righi and Elsass 1996). Significant recent progress in understanding of the illite-smectite
fundamental particles and interpretation of diffractograms (Lanson 1997; Moore and Reynolds
1997) that has occurred in the past decades, has allowed mineralogists to numerically analyse
100
complex reflection groups which are commonly present in the X-ray diffraction diffractograms
of soils (Barré et al. 2007a).
Given the fact that the quality of X-ray diffraction equipment has also made great advances in
the last three decades, we can now study un-treated soil clay samples. In particular, it has been
found that the destruction of organic matter can significantly change the observed clay
mineralogy of prairie type soil clay materials (Velde 2001). We can now observe the clay
minerals actually present in the soil, with their properties which are important for plant-soil
interactions (Barré et al. 2007a). Some recent studies by Li et al. (2003), Barré et al. (2007a,
b, 2008) and Velde and Barré (2010) demonstrated that K fixation or release in a soil clay
fraction dominated by 2:1 clay minerals could be observed and quantified through X-ray
diffraction measurements.
Until now, no attempt has been made to quantify the changes in clay minerals induced by
wastewater irrigation. The aim of this work was to determine whether irrigation with
wastewater high in potassium could change the clay mineral assemblage of soils and hence
how it could influence soil properties that are important for irrigation.
Materials and methods
Soil and wastewater used
Four soils were used in this laboratory study, namely Barossa (SA) Red Brown Earth, Charlton
(Vic.) Red Sodosol, Claremont series Black Vertosol, Waite Research Institute (Adelaide, SA)
and Renmark (SA) Grey Vertosol. Soil samples were collected from the 0.20–0.40m depth
(where clay content is relatively high and organic matter content is low) by a hand auger, air-
dried, and sieved to 2mm. Location, coordinates, soil particle size distribution (Gee and Bauder
1986), soluble and exchangeable cations (Rayment and Lyons 2011), and clay mineralogy are
presented in Table 24. These soils were selected because of the range that they represent in
their texture, clay mineralogy, EC, and pH. The wastewater used was from a Barossa Valley
winery (Table 25).
Experimental design
100 g of each soil was fully saturated with an appropriate volume of wastewater and allowed
to equilibrate for 48 hours at room temperature. Then soils were placed into an oven and dried
at 60° C for 48 hours. The procedure was repeated 6 times in order to simulate the irrigation

101
cycle over one season. The chemical and physical properties of treated soils were analysed and
compared with original soils.
Table 24 Selected physical and chemical properties, main clay minerals, classification, and
location of the soils used
Soil properties Units
Soil
Red Brown
Earth1
Red Sodosol1 Black Vertosol1
Claremont series
Grey Vertosol1
Depth cm 20-40 20-40 20-40 20-40
pH (1:5 soil/water) 7.8 8.0 7.8 5.4
EC (1:5 soil/water) dS/m 0.11 0.06 0.15 6.39
CEC cmol+/kg 21.5 30.7 32.0 30.0
Texture Clay Clay Clay Clay
Particle size
distribution, %
Clay
Silt
Sand
43 63 56 63
14 12 17 20
44 25 28 18
Dominant Clay Minerals Illite, Kaolinite Illite, Kaolinite Smectite Smectite
Location in Australia
Greenock,
Barossa Valley,
SA
Near Charlton,
Vic
Waite Institute,
Adelaide, SA
Pike River, near
Renmark, SA
Coordinates 34°27’49.67”S
138°56’08.72”E
36°15’34.39”S
143°19’13.63”E
34°58’20.64”S
138°38’12.26”E
34°13’37.68”S
140°46’46.65”E
1 Australian Soil Classification (Isbell, 1996)
Table 25 Chemical characteristics of the wastewater used in this study
pH EC,
dS/m
Soluble cations, mg/L
K+ Na+ Ca2+ Mg2+
8.4 0.865 250 42 36 7
Soil clay preparation
In order to improve the identification of the mineralogical composition of the soils by XRD
analysis, clay fractions were separated by sedimentation (Jackson 2005). Firstly, 5 g of the
sieved soil from each sample was mixed with 150 ml of deionised water and disaggregated by
using a RATEK orbital mixer with a speed of 120 rpm for 16 hours. Then soil/water
suspensions were transferred into 1 L glass cylinders with addition of deionised water to the
required level. The height of the soil/water column (19 cm) was calculated by means of Stokes’
Law to give the settling time (at 16 hours) required for settling particles ≥ 2 μm. The cylinders
were then allowed to stand, and after 16 hours of settling the clay fraction (< 2 μm) was isolated
from soil by siphoning off the dispersed material. The procedures of adding water, stirring,
allowing settling, and siphoning were carried out for a total of 6 times, and the clay suspensions
thus obtained were combined. The suspensions containing < 2 µm clay fraction were
transferred into a 5 L beakers and oven-dried at 60ºC. No addition of dispersing agents or
chemical treatments (such as for organic matter or oxide removal) were made to the clay
samples, because we wanted to specifically investigate the soil clays as they would respond to

102
cations in wastewater in their natural state. Such factors as cation exchange capacity and
potassium fixation can only be understood in the context of the natural sample (Velde and Peck
2002).
X-Ray diffraction (XRD) analysis of the silt and clay fractions
Dry clay samples (<2 µm fraction) were finely ground and backfilled into steel holders for
XRD analysis. The XRD patterns for randomly oriented air-dried (AD) and orientated, Mg
saturated-glycerolated (G) samples were recorded with a PANalytical X'Pert Pro Multi-purpose
diffractometer using Fe filtered CoKα radiation, automatic divergence slit, 2° anti-scatter slit
and fast X'Celerator Si strip detector. The diffraction patterns were recorded from 3 to 80° 2θ
(for randomly oriented samples) and from 3 to 33° 2θ (for orientated, Mg saturated-
glycerolated samples) in steps of 0.017° 2θ with a 0.5 second counting time per step for an
overall counting time of approximately 30 minutes.
XRD data were collected and displayed using CSIRO software XPLOT for Windows (Raven
1990). Mineralogical phase identifications were first made by comparing the XRD patterns
with the ICDD database of standard diffraction patterns using computer aided search/match
algorithms. Specific clay mineral identification criteria were based on Brindley and Brown
(1980) and Moore and Reynolds (1997). Only reflections for crystalline minerals were
considered in these analyses. Information about the dioctahedral/trioctahedral structure of the
clay minerals was obtained by examination of the 060 reflections of randomly oriented
samples. The XRD diffraction patterns were recorded as intensity-position counts and hence
could be treated numerically using curve decomposition methods given in Lanson and Besson
(1992) and Lanson (1997). Simulated diagrams made with the NEWMOD program of
Reynolds (1985) were also used to help interpretation of experimental XRD diagrams.
XRD pattern decomposition to obtain the clay mineral assemblages
Because of the coexistence of several clay minerals in the same sample, X-ray diffraction
patterns most often contain partially overlapping peaks representative of mixed-layered
illite/smectite, vermiculite, illite, mica, and occasionally chlorite. The separation of the
contributions from these different phases is essential for soil clay characterization (Lanson and
Velde 1992). The problem of overlapping XRD peaks occurs over the whole angular range.
The complex peak located between 4° and 10° 2° θ CoKα appears to be the most interesting:
1) because of its high intensity; 2) because of the presence there of reflections due to all the
illitic and smectitic phases and only these phases; 3) and because of the availability of some

103
critical information (e.g., broad coherent scattering domain size) (Lanson and Besson 1992). It
was only near 4° to 10° 2° θ that areas were considered due to the greater intensities of these
peaks and to fewer problems of interference of the other phases with higher order I/S
reflections. Also, the effect of the coherent scattering domain size (CSDS) on pattern width
and position is greater here, which gives additional information concerning the changes in clay
assemblages (Lanson and Champion 1991).
Lanson (1992) developed a decomposition program for X-ray profiles of clay minerals that
enables the separation of the individual contributions of various phases to the diffracted
intensity. This decomposition program can fit the experimental XRD pattern with elementary
curves that are related to the different phases present in the soil clays. The position and full
width at half maximum intensity (FWHM) of these elementary curves should let us identify
each associated phase by comparison with simulated patterns (Lanson and Besson 1992). By
running a large series of tests, Lanson (1990) demonstrated that the standard deviation on curve
characteristics is induced mostly by the experimental equipment and that the calculated
characteristics are representative of the sample studied (Righi and Elsass 1996).
Prior to decomposition, digitized XRD data were treated using a 4-point smoothing routine and
a background stripping in the low-angle region (4 – 10° 2θ) using the default options of
Decomp software (Lanson 1997). As recommended by Lanson and Besson (1992), the XRD
patterns were decomposed by progressively increasing the number of elementary curves, in
order to obtain a good fit with the smallest number of curves. Each elementary curve
corresponds to a clay mineral population simulated using NEWMOD software (Reynolds,
1985). The quality of fit is evaluated visually and assumed to be good when the fitted profile,
which is the sum of all the elementary peaks, is located within the noise of the smoothed
experimental data over complete angular range fitted (Lanson and Velde, 1992). In the
decomposition process, FWHM (in 2° θ) and intensity are obtained and are used to determine
peak areas which are compared on a scale of 100% for the total of the peak areas investigated
(Velde and Peck 2002).
The major use of decomposition is to identify the peaks present and to compare their relative
areas in order to identify changes in mineral abundance and mineral type. This can be done for
similar materials which have been subjected to different chemical changes (Lanson and Velde
1992; Velde 1995; Velde and Barré 2010).

104
Interpretation of the decomposed XRD patterns
According to Barré et al. (2007a) the different peaks obtained from the decomposition were
attributed to clay mineral populations based on the observations of Moore and Reynolds
(1997), Righi and Elsass (1996) and Velde (2001).
Illite-mica was identified by a single asymmetric peak near 10 Å. The presence of an
asymmetric diffraction peak near d = 10 Å was always part of the initial observations on illites
made using XRD techniques. The asymmetry is caused by the presence of both poorly
crystallized illite and well crystallized illite components in the diffraction spectra and also, at
times, I/Sm mixed layer minerals (Meunier and Velde, 2004). According to Gharrabi et al.
(1998) the poorly crystallized illite (PCI of Lanson) would be a highly illitic phase with some
(< 5%) smectite layers, while the well-crystallized illite (WCI) would be pure illite. As pointed
out Lanson (1997), when using Decomp, the separation of two peaks, one associated with PCI
and the other with a WCI, does not imply the actual existence of two distinct illitic phases.
Both peaks may be related to the same illite phase, and are then a simplified way of describing
a complex population of illite crystallites (Lanson and Velde 1992). Even though such an
asymmetric peak fit is artificial, various elementary peaks may be easier to interpret than by
use of an asymmetry coefficient (Lanson, 1997). The PCI peak has a greater width at half-
height than that for WCI (about 0.9° vs 0.4° 2θ), and a 10.3 – 10.5 Å spacing whereas WCI has
a spacing near 10.0 Å. The WCI and PCI peaks did not change position significantly with
glycol or glycerol treatment. In the 5 Å region they form one band at d = 5.01 Å (Figure 49),
using the simulation methods of Reynolds (1985) for micas of different coherent domain sizes
(Velde and Peck, 2002).
Figure 49 Calculated X-ray powder diffraction patterns of illite with different domain size
(N) using NEWMOD (Reynolds, 1985). N denote coherent domain size. Cobalt Kα radiation
5.0 10.0 15.0 20.0 25.0
10.37
10.12
5.01
5.01
9 ≥ N ≤ 16
3 ≥ N ≤ 9
FWHM = 1.05
FWHM = 0.6

105
The peaks with spacings ranging from d = 11.5 to 15 Å in AD state were attributed to illite-
smectite mixed layer minerals. These peaks show widths of 1.5 to 2° 2θ. Such peaks are well
modelled by a disordered arrangement of bi-hydrated smectite layers (15.2 Å spacing) and un-
hydrated illite layers (10 Å) using the program “NEWMOD” (Moore and Reynolds 1997).
Figure 50 shows NEWMOD (Reynolds, 1985) calculated patterns for random (R0) and ordered
(R1) illite-smectite interstratified minerals with different Illite/smectite content and their peak
positions have been assumed to depend on the proportion of illite and smectite layers. Most
soil clay minerals have a disordered, or non-ordered, succession of layers of the different
components (Velde and Barré, 2010). In the majority of cases peaks for mixed-layered
smectite-illite phases will have a position d between 10 and 15.2 Å. Figure 51 indicates the
change in peak position for changes in the content of illite relative to smectite (after Velde and
Barré 2010). Calculations were made using the NEWMOD (Reynolds, 1985) program.
Figure 50 Calculated X-ray powder diffraction patterns of mixed-layer illite/smectite (I/S)
with different expandability and Reichweite (R) ordering using NEWMOD (Reynolds, 1985).
Cobalt Kα radiation
This method is not precise near the illite end-member (<10% smectite) composition, as shown
by Lanson and Velde (1992) because the I-S peak position varies only slightly for <10%
smectite content. However, this method is used in the present study as a simple approach to an
as yet unsolved problem of accurate identification of mineral composition of illite-smectite
2.0 6.0 10.0 14.0 18.0 22.0
5.00
R1
R0
Illite 20%
Illite 50%
Illite 80%
14.65
14.25
11.05
11.45
5.00
5.00
5.00
5.00
R1
R1
R0
R0
5.00
24.40
12.51
13.86

106
phases in the very low expandable phase range. The method has the merit of being internally
consistent, i.e. band shifts indicate relative change (Gharrabi and Velde, 1995).
Figure 51 Relations of peak position in Å and illite content in randomly (R0) interstratified
illite-smectite minerals. Calculations were made using NEWMOD (Reynolds, 1985) for
randomly oriented XRD patterns in air dried state. Cobalt Kα radiation (After Velde and
Barre, 2010)
In order to compare the illite–smectite relations of the sample under different treatments Barré
et al. (2007b) used a unique parameter devised from the values calculated by the decomposition
program so as to compare them globally and easily. We used the centre of gravity (cg) of the
X-ray patterns, a position whose calculation allows all the modifications observed in the X-ray
pattern (peak area modifications as well as peak position shifts) to be taken into account. The
cg position could be easily calculated as follows:
cg = Σ (ai*posi/Σai)
where ai is the area (FWHM x intensity) of the peak i and posi is the position (d-spacing) of
the peak i in Å.
The X coordinate of the centre of gravity of the diffractograms (2θ° or d-spacing axis) could
be considered as indicator of the observed modification in clay mineral composition. An
increase of the quantity of illitic phases in the clay assemblage should decrease the X-
coordinate value (in Å) of the centre of gravity whereas an increase of smectitic or HI
vermiculite layers should increase this value (Barré et al. 2007a).
Spontaneous dispersion and turbidity measurements
Spontaneous dispersion was assessed by a modification of the method described by Rengasamy
(2002b) and Marchuk, A. (2013). Firstly, soluble salts were removed from all soil samples
10.00
11.00
12.00
13.00
14.00
15.00
16.00
0 20 40 60 80 100Illite content, %
d-spacing, Å

107
using dialysis against deionised water until free of chloride by the method described in
Churchman and Weissmann (1995). Chloride in solution was verified using silver nitrate and
dialysis was continued until its addition lead to no further white precipitate of silver chloride.
Following completion of dialysis, the conductivity of the dialysate was below 50 µS/cm and
soil samples were dried at room temperature.
For dispersion measurement original and treated dry soil samples (20g) were placed into 250
ml transparent measuring cylinders and 200 ml of distilled water was added slowly down the
sides of the cylinders, taking care to avoid disturbance of the soil. After approximately 5 hr,
any particles which had dispersed from the soils were gently stirred into suspension and left to
stand for 2 hours. 50 ml of suspensions were pipetted out from 10 cm depth for turbidity
measurements. After turbidity measurement the samples were air-dried and weighted.
To quantify the amount of < 2µm particles dispersed, measurements were made on a Hach
2100N Laboratory Turbidimeter at 25°C and recorded in Nephelometric Turbidity Units
(NTU). A standard suspension of Formazin was used to calibrate the instrument. The 2100N
is equipped with a stable halogen-filled, tungsten filament lamp to meet the reporting
requirements of EPA Method 180.1(ASTM 1976,Eaton and Franson 2005). The method is
based on a comparison of the intensity of light scattered by the sample under defined conditions
with the intensity of light scattered by a standard reference suspension. The higher the intensity
of scattered light, the higher is the turbidity.
Determination of chemical composition of the clay fraction
The chemical composition of the clay fraction was measured by inductively coupled plasma
mass spectrometry (ICP-MS) (ELAN 6000, Perkin Elmer) after acidic digestion in a
microwave oven (Multiwave, 3000 Anton Paar). Prior to digestion soluble and exchangeable
cations were extracted using 1M NH4Cl. After extraction samples were dried in an oven at
105°C for 48 hours and finely ground. Samples were weighed to 0.2±0.001g and 9ml of 37%
HCl and 3ml of 70% HNO3 added to each sample, using a Dispensette®. Samples were
microwave digested using a Multiwave 3000 microwave oven for 40 minutes at 1200W. After
digestion the samples were filtered using 0.45 μm PVDF syringe filters and made up to 50ml
volume using analytical grade water. Each sample run was replicated three times. After being
digested the samples were analysed by ICP-MS. With the ICP-MS analysis seven standards
were run first to ensure that the readings were correct. This analysis allowed us to determine
mineral Al, Fe, Ca, Mg, K, Na and Mn concentrations of the clay fraction.

108
Results and discussion
Soil chemical properties
The chemical composition of the wastewater used for treatment (Table 25) indicates that, of
the four major cations, potassium was the most abundant, with sodium second. Usually, salinity
in wastewater relates to Na+ concentrations, but in winery wastewater K+ tends to be the
dominant major cation (Arienzo at al. 2012).
Selected chemical characteristics of the soils before and after treatment are given in Table 26.
The original Renmark Grey Vertosol had the highest EC and lowest pH compared to the
Barossa, Charlton and Waite Claremont soils. The effect of treatments on soil pH was not
consistent. Soil salinity, measured as electrical conductivity in 1:5 soil/water solution,
increased significantly for all soils after wastewater treatment. This increase was expected as
we applied saline wastewater (EC=0.865 dS/m, Table 25) during the experiment. The
exchangeable potassium pool for all soils after the treatment was 2.5 times greater than in the
original samples.
Table 26 Selected soil properties
Soil pH EC,
(dS/m)
K sol
mg/l
Exchangeable cations,
(cmol+/kg) CEC,
(cmol+/kg) Ca Mg Na K
Barossa original 7.8 0.11 2.1 15.1 4.8 1.0 0.6 21.5
Barossa treated 7.5 0.39 9.9 15.0 4.4 1.2 1.5 22.0
Charlton original 8.0 0.06 5.2 15.6 13.0 0.7 1.5 30.7
Charlton treated 8.1 0.33 14.9 15.6 11.6 1.3 3.8 32.3
Claremont original 7.8 0.15 2.1 22.3 8.0 0.1 1.0 31.4
Claremont treated 8.5 0.35 14.5 22.9 5.8 0.5 2.8 32.0
Renmark original* 5.4 6.39 15.3 13.5 9.1 6.7 0.8 30.0
Renmark treated* 6.9 7.95 71.0 17.2 9.9 6.3 1.9 35.3
* Renmark soil was not included in further investigation (see Mineralogical Analysis section for the
explanation)
CEC for Barossa and Charlton soils increased slightly after the treatment. Table 27 shows the
chemical properties of clay fractions of investigated soils. Increase in CEC after wastewater
treatment partially could be explained by the presence in studied soil clays assembledges with
pH dependable variable charge. The relative importance of variable charge in the overall CEC
is negligible in smectite and important in illite and kaolinite (Chorom and Rengasamy, 1995;
Velde and Barré, 2010). Both Barossa and Charlton soil have illite and kaolinite as dominant
clay minerals. In contrast, in Claremont soil, the main constituent of clay fraction is smectite

109
and calcite (Table 29). The other reason of the rise in CEC is the increase in organic carbon
after the treatment (Table 27).
Table 27 Selected properties of clay fraction (< 2µm) of investigated soils
Soil pH EC,
(dS/m) OC*, %
Exchangeable cations, (cmol+/kg) CEC,
(cmol+/kg) Ca Mg Na K
Barossa original 6.0 1.35 1.23 24.1 8.1 3.0 2.7 37.8
Barossa treated 7.8 0.89 1.59 30.3 5.0 3.0 4.8 43.0
Charlton original 6.8 0.43 0.49 21.9 18.7 1.3 3.6 45.5
Charlton treated 8.1 0.89 0.66 34.1 6.9 3.4 8.7 53.2
Claremont original 8.0 0.44 1.99 49.8 10.3 1.3 2.8 64.2
Claremont treated 8.6 0.59 2.38 47.7 1.2 2.9 5.0 56.8
* Organic carbon
Effect of wastewater application on dispersive behaviour of soils
Dispersible clay is widely considered as a measure of soil structural stability (Sumner, 1993).
The change in dispersive behaviour of studied soil after wastewater treatment was evaluated
by the means of zeta potential and turbidity measurements. The results are given in Table 28
and Figure 52.
Table 28 Dispersive properties of studied soils
Soil Turbidity,
NTU
Dispersed
clay, g
Dispersed
clay, %*
Zeta
potential,
mV
Barossa original 1965 0.33 1.64% -52.6
Barossa treated 1478 0.29 1.46% -36.5
Charlton original 1667 0.29 1.44% -43.2
Charlton treated 1078 0.21 1.05% -28.2
Claremont original 614 0.15 0.74% -25.7
Claremont treated 487 0.09 0.46% -25.2
* % of total weight (20 g) of a sample
For all soils turbidity and zeta potential decreased after treatment. As a result, the amount of
dispersed clay decreased as well. Claremont soil behaved differently from Barossa and
Charlton reflecting differences in its mineralogy. We can conclude that for the studied soils the
risk of soil dispersion associated with used winery wastewater for irrigation is reduced in the
presence of K.

110
Turbidity v Clay, g
Figure 52 Relation between turbidity and amount of dispersed clay
Mineralogical Analysis
The XRD patterns of the <2 µm fractions of original and treated soil clays are shown in Figure
53. As one of the aims of this paper is to assess the effect of application of wastewater irrigation
on clay mineral assemblages, we were particularly interested in establishing the clay
mineralogy of the studied soils, identifying differences in initial mineralogy as well as
mineralogical change after treatment. The XRD pattern of Renmark Grey Vertosol soil clay
did not change in intensity and shape of reflections, nor in peak positions after treatment in the
low-angle region (4 – 10° 2θ) and was excluded from further mineralogical investigation.
Qualitative Description of Experimental XRD Patterns
Barossa Red Brown Earth
The XRD patterns of <2 μm fractions obtained for the air-dried (AD) and glycerolated (G)
states show diffraction peaks typical of clay minerals, with additional reflections that are
attributed to quartz (4.26, and 3.34 Å). Figure 54 illustrates a peak shift after glycerolation from
~ 15.2 Å in the AD state to ~ 18 Å, indicating the presence of smectite. Peaks near 10 Å
occurred for both AD and G states; this indicates the presence of a mica/illite mineral. A peak
near 7 Å could denote 002 from chlorite or 001 from kaolinite. The pattern for the Mg-saturated
glycerolated state did not show any chlorite present (in ~ 14.2 Å region). Thus XRD evidence
suggests that kaolinite is present.
The untreated randomly oriented material was also scanned up to 80° 2θ. The position of the
060 reflection is useful in distinguishing between dioctahedral and trioctahedral species (Figure
54, inset). A peak at d=1.49 Å was attributed to kaolinite, which is dioctahedral (Grim 1968);
a peak at d=1.54 Å was attributed to quartz.
y = 0.0002x + 0.0398R² = 0.9638
0.00
0.05
0.10
0.15
0.20
0.25
0.30
0.35
0.40
0 500 1000 1500 2000 2500

111
Figure 53 XRD patterns of air-dried fractions before (lower patterns) and after wastewater
treatment (upper patterns). Exp, expandable (d~15.2 Å); I/Mi, illite/mica (d~10.0 Å); K,
kaolinite (d=14.2 Å); Bas, bassanite (d=6.03 Å); Q, quartz (d=3.43 Å); K-F, K-feldspar
A broad peak at d~1.50 Å overlapped with the kaolinite 060 peak indicating a smectite with a
dioctahedral structure, i.e. montmorillonite. A sharp peak at d~1.53 Å was attributed to a
trioctahedral mica/illite phase. These minerals are relatively rare in soil (Fordham 1990;
Churchman and Lowe 2012). According to Walker (1950) XRD patterns of trioctahedral micas
showed strong, sharp, first-order basal reflections at 10 Å and medium to strong 060 reflections
at 1.53 Å. Trioctahedral mica has been reported in soils of the Barossa region in studies by
Fordham (1990) and Stace et al. (1968).
4 8 12 16 20 24 28 32 36 40
Barossa
Charlton
Claremont
Renmark
Original
Original
Original
Original
Treated
Treated
Treated
Treated
2 θ
Exp I/Mi K
Qz
Bas
CalcAlb
K-F
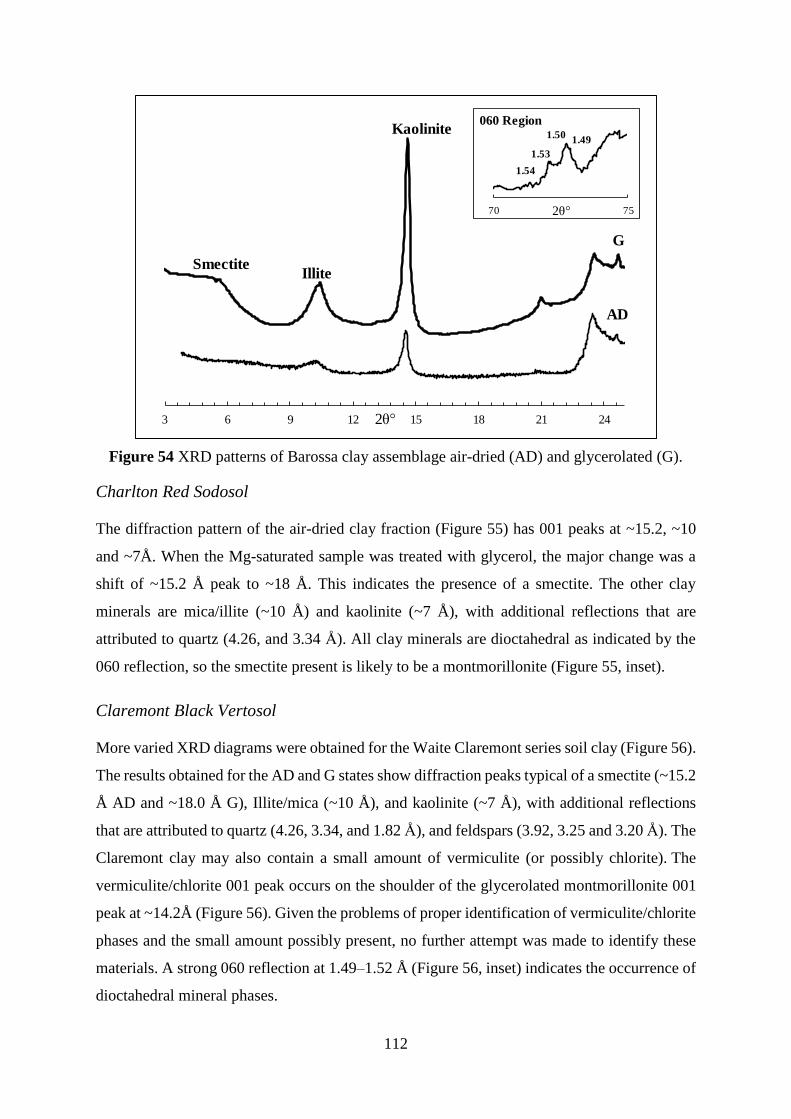
112
Figure 54 XRD patterns of Barossa clay assemblage air-dried (AD) and glycerolated (G).
Charlton Red Sodosol
The diffraction pattern of the air-dried clay fraction (Figure 55) has 001 peaks at ~15.2, ~10
and ~7Å. When the Mg-saturated sample was treated with glycerol, the major change was a
shift of ~15.2 Å peak to ~18 Å. This indicates the presence of a smectite. The other clay
minerals are mica/illite (~10 Å) and kaolinite (~7 Å), with additional reflections that are
attributed to quartz (4.26, and 3.34 Å). All clay minerals are dioctahedral as indicated by the
060 reflection, so the smectite present is likely to be a montmorillonite (Figure 55, inset).
Claremont Black Vertosol
More varied XRD diagrams were obtained for the Waite Claremont series soil clay (Figure 56).
The results obtained for the AD and G states show diffraction peaks typical of a smectite (~15.2
Å AD and ~18.0 Å G), Illite/mica (~10 Å), and kaolinite (~7 Å), with additional reflections
that are attributed to quartz (4.26, 3.34, and 1.82 Å), and feldspars (3.92, 3.25 and 3.20 Å). The
Claremont clay may also contain a small amount of vermiculite (or possibly chlorite). The
vermiculite/chlorite 001 peak occurs on the shoulder of the glycerolated montmorillonite 001
peak at ~14.2Å (Figure 56). Given the problems of proper identification of vermiculite/chlorite
phases and the small amount possibly present, no further attempt was made to identify these
materials. A strong 060 reflection at 1.49–1.52 Å (Figure 56, inset) indicates the occurrence of
dioctahedral mineral phases.
3 6 9 12 15 18 21 24
Kaolinite
IlliteSmectite
70 75
060 Region
1.53
1.491.50
G
AD
2θ°
1.54
2θ°

113
Figure 55 XRD patterns of Charlton clay assemblage air-dried (AD) and glycerolated (G)
Figure 56 XRD patterns of Claremont clay assemblage air-dried (AD) and glycerolated (G).
Mineralogical Composition of the Clay Fractions
Semi-quantitative measurements of the identified minerals (Figures 54 – 56) and their relative
abundance in the clay fraction of the studied soils before treatment (original) are given in Table
29. Kaolinite was present in all clays investigated, but its proportion and peak position did not
3 6 9 12 15 18 21 242 θ°
KaoliniteIlliteSmectite
G
AD
70 75
1.491.50
060 Region
1.54
2θ°
3 6 9 12 15 18 21 242 θ°
KaoliniteIllite
SmectiteG
AD
70 75
Chlorite/
Vermiculite
060 Region 1.491.50
1.54
2θ°
1.52
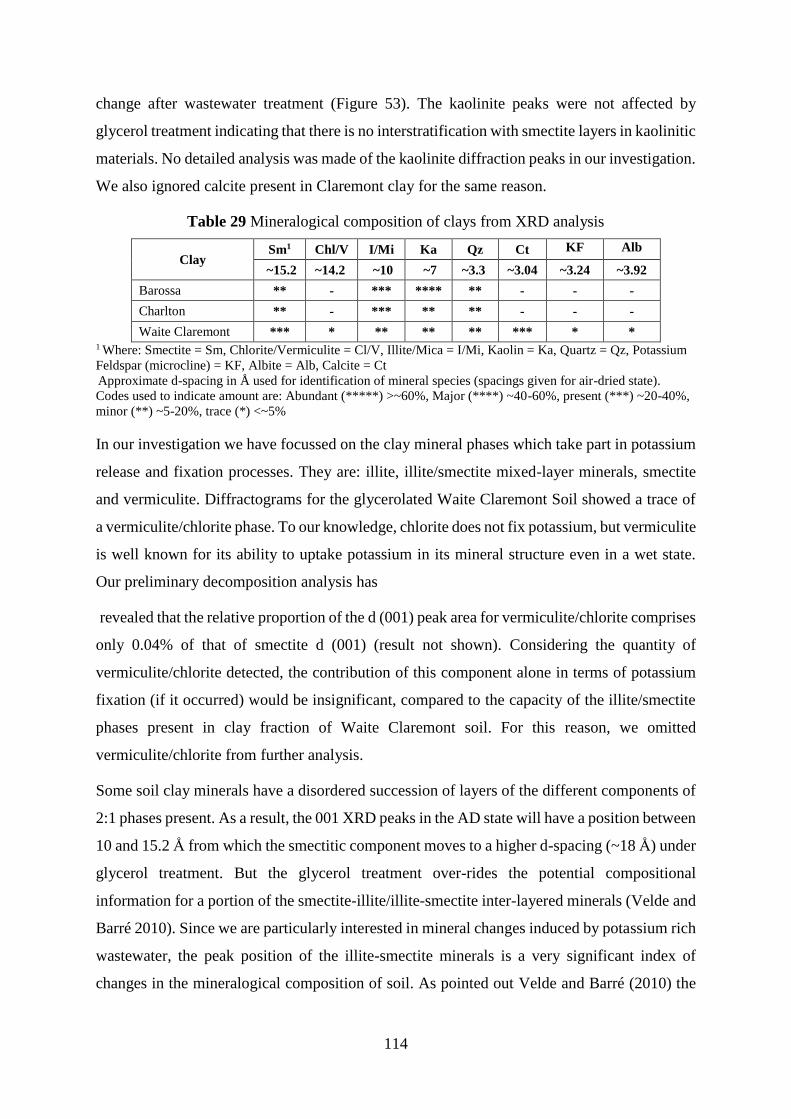
114
change after wastewater treatment (Figure 53). The kaolinite peaks were not affected by
glycerol treatment indicating that there is no interstratification with smectite layers in kaolinitic
materials. No detailed analysis was made of the kaolinite diffraction peaks in our investigation.
We also ignored calcite present in Claremont clay for the same reason.
Table 29 Mineralogical composition of clays from XRD analysis
Clay Sm1 Chl/V I/Mi Ka Qz Ct KF Alb
~15.2 ~14.2 ~10 ~7 ~3.3 ~3.04 ~3.24 ~3.92
Barossa ** - *** **** ** - - -
Charlton ** - *** ** ** - - -
Waite Claremont *** * ** ** ** *** * * 1 Where: Smectite = Sm, Chlorite/Vermiculite = Cl/V, Illite/Mica = I/Mi, Kaolin = Ka, Quartz = Qz, Potassium
Feldspar (microcline) = KF, Albite = Alb, Calcite = Ct Approximate d-spacing in Å used for identification of mineral species (spacings given for air-dried state).
Codes used to indicate amount are: Abundant (*****) >~60%, Major (****) ~40-60%, present (***) ~20-40%,
minor (**) ~5-20%, trace (*) <~5%
In our investigation we have focussed on the clay mineral phases which take part in potassium
release and fixation processes. They are: illite, illite/smectite mixed-layer minerals, smectite
and vermiculite. Diffractograms for the glycerolated Waite Claremont Soil showed a trace of
a vermiculite/chlorite phase. To our knowledge, chlorite does not fix potassium, but vermiculite
is well known for its ability to uptake potassium in its mineral structure even in a wet state.
Our preliminary decomposition analysis has
revealed that the relative proportion of the d (001) peak area for vermiculite/chlorite comprises
only 0.04% of that of smectite d (001) (result not shown). Considering the quantity of
vermiculite/chlorite detected, the contribution of this component alone in terms of potassium
fixation (if it occurred) would be insignificant, compared to the capacity of the illite/smectite
phases present in clay fraction of Waite Claremont soil. For this reason, we omitted
vermiculite/chlorite from further analysis.
Some soil clay minerals have a disordered succession of layers of the different components of
2:1 phases present. As a result, the 001 XRD peaks in the AD state will have a position between
10 and 15.2 Å from which the smectitic component moves to a higher d-spacing (~18 Å) under
glycerol treatment. But the glycerol treatment over-rides the potential compositional
information for a portion of the smectite-illite/illite-smectite inter-layered minerals (Velde and
Barré 2010). Since we are particularly interested in mineral changes induced by potassium rich
wastewater, the peak position of the illite-smectite minerals is a very significant index of
changes in the mineralogical composition of soil. As pointed out Velde and Barré (2010) the

115
proper assessment and identification of illite-smectites as well as smectite-illites should be
done in the air-dried state.
Decomposition of XRD patterns
The XRD patterns of air-dried clay showed the greatest variations as a function of wastewater
application and will form the core of the discussion which follows. The decomposition
procedure was applied essentially in the 4 – 10° 2θ region where the major 001 clay mineral
reflections are located (Figures 57 – 59).
According to Velde at el. (2003) the decomposition of the XRD spectra can give information
concerning the peak position, peak intensity and peak width of individual clay mineral
components of a multiphase sample. Peak position indicates, for the most part, compositional
changes, either in mica/illite population (see Gharrabi and Velde 1995) or in the proportion of
layers within the illite-smectite components of the mixed-layer phases (see Moore and
Reynolds 1997). Peak width indicates, for the most part, the relative number of layers
coherently diffracting in the crystallites. Peak area can be used to indicate the relative
proportions of the different clay phases within the same soil/clay type and to quantify
modifications in the clay assemblages (in our example – before and after treatments).
Barossa Red Brown Earth
The decomposition of the XRD diagram for the air dried Barossa original sample produced 4
basic peaks with maximum intensities at d = 15.51, 11.59, 10.29 and 10.02 Å (Figure 57a).
Each of these peaks should be related to a distinct mineral “phase”. A clay “phase” is not
associated with a unique homogeneous material but represents a population of particles whose
structural characteristics (smectite/illite content, nature, number and position of the atoms in
the structure) can vary within a discrete range. Each of the “phases” identified with this
decomposition method will be characterized by its mean value for each of these parameters
(Lanson and Champion 1991). The same initial parameters in the decomposition procedure
were assumed for all clay samples.
By its position and sharpness, the maximum at 10.02 Å (Figure 57a) was attributed to a mica-
like phase (or well-crystallized illite, WCI). The band near 10.29 Å was typical of an illitic
mineral (PCI), which was thought to have a finer grain size than the mica. This is indicated by
a broader peak, with a width at half height near 1.10° 2θ. An interstratified mineral was
identified by the band near 11.59 Å. This band was displaced by the glycerol treatment. Using
the NEWMOD based calculation of relations between peak position and smectite content in

116
mixed layer illite-smectites (Figure 51) it was assumed to be an illite-smectite mixed-layer
phase with 76% of illite. The curve near 15.51 Å is that of a dominantly smectitic mineral.
Figure 57b shows the decomposed patterns of Barossa clay fraction after wastewater
application. Four basic curves with maximum intensities at d = 13.67, 11.29, 10.29 and 10.04
Å were attributed to two interstratified illite-smectite (with 58 and 78% of illite according to
Figure 51), illite (PCI) and mica (WCI) respectively.
(a) Barossa original (b) Barossa after treatment
Phase d-sp
(A) FWHM Area %
CG
(A)
Sm 15.51 1.7 15522 28 4.38
I/Sm 11.59 1.5 3359 6 0.71
PCI 10.29 1.1 23445 43 4.39
WCI 10.02 0.45 12622 23 2.30
Ʃ 100 11.78
Phase d-sp
(A) FWHM Area %
CG
(A)
Sm/I 13.67 1.97 11992 15 2.08
I/Sm 11.29 1.36 5841 7 0.84
PCI 10.29 0.82 32962 42 4.30
WCI 10.04 0.42 28102 36 3.58
Ʃ 100 10.79
Figure 57 Decomposition results for Barossa soil clay before and after application of
wastewater. The darker pattern represents experimental data and dotted line pattern represents
best fit computed data
The WCI peaks before and after treatment for Barossa soil clay were constant in peak position
(10.02 and 10.04 Å respectively) and FWHM (0.45 and 0.42° 2θ) but the peak area (relative
amount of WCI) increased after the treatment from 23 to 36%. The PCI peak position and
relative area did not change (~ 10.3 Å and 43 %), but FWHM decreased from 1.10 to 0.82° 2θ
after treatment inferring an increase in grain size which characterizes the transformation from
PCI to WCI (Righi et al. 1995; Velde, 2001; Barré et al. 2008). In contrast, the smectitic phases
decreased in relative peak areas (from 34 to 22% combined) with a move of peak positions to
the higher angle.
Charlton Red Sodosol
The decomposition of the XRD diagram for the air dried Charlton original sample produced 4
basic peaks with maximum intensities at d = 15.59, 12.21, 10.32 and 10.03 Å which were
attributed to smectite, illite-smectite (72 % of illite, Fig. 3), PCI and WCI respectively (Figure
4.0 6.0 8.0 10.0 12.0
SmI/Sm
PCIWCI
4.0 6.0 8.0 10.0 12.0
Sm I/Sm
PCI
WCI

117
58a). Figure 58b shows the decomposed patterns of Charlton clay fraction after wastewater
application: 4 basic curves with maximum intensities at d = 12.78, 11.19, 10.29, and 10.00 Å
which were attributed to two illite-smectite mixed-layer phases with illite contents of 70 and
79 %, PCI and WCI respectively.
(a) Charlton original (b) Charlton after treatment
Phase d-sp
(A) FWHM Area % CG (A)
Sm 15.59 2.25 53576 48 7.40
I/Sm 12.21 1.6 12869 11 1.39
PCI 10.32 1.35 27116 24 2.48
WCI 10.03 0.42 19324 17 1.72
Ʃ 100 12.99
Phase d-sp
(A) FWHM Area %
CG
(A)
Sm/I 12.78 2.00 11854 20 2.52
I-Sm 11.19 1.10 5360 9 1.00
PCI 10.29 1.10 21926 36 3.75
WCI 10.00 0.42 21078 35 3.50
Ʃ 100 10.76
Figure 58 Decomposition results for Charlton Red Sodosol soil clay before and after
application of wastewater
Similar changes after wastewater application occurred in the Charlton soil clay (Figure 58b) as
in the sample from the Barossa (Figure 57b). The WCI peak position (~10.0 Å) and the FWHM
(0.42° 2θ) did not change upon wastewater application, but its relative peak area increased from
17 to 35%. For the PCI phase the peak position changed slightly towards a higher 2θ angle
from 10.32 to 10.29 Å, the relative peak area increased from 24 to 36% and the FWHM
decreased from 1.35 to 1.10° 2θ indicating more ordered illitic or mica-like structures with a
larger grain size. Moreover, the smectitic peaks shifted to a higher 2θ angle after treatment
(smectite from 15.59 to 12.78 Å and illite-smectite from 12.21 to 11.19 Å), indicating
transformation into mixed-layered illite-smectite with decrease in relative peak area (from 59
to 29% combined).
Waite Claremont Vertosol
The major clay phases present in the original sample are WCI (10.05 Å), PCI (10.30 Å),
smectite (16.02 Å), and two interstratified illite-smectites (13.20 Å, I= 64% and 11.73 Å,
I=76%, Figure 59a). The decomposition of wastewater treated sample (Figure 59b) also
4.0 6.0 8.0 10.0 12.0
SmI/Sm
PCI
WCI
4.0 6.0 8.0 10.0 12.0
WCI
PCII/SmSm/I

118
produced 5 basic curves which were attributed to WCI (10.04 Å), PCI (10.23 Å) smectite
(15.58 Å), and two illite-smectites (13.12 Å, I= 64% and 11.19 Å, I=79%).
(a) Claremont original (b) Claremont after treatment
Phase d-sp (A) FWHM Area %
CG
(A)
Sm 16.02 2.25 108290 78 12.42
Sm/I 13.2 1.23 9584 7 0.91
I/S 11.73 1.31 8524 6 0.72
PCI 10.3 1.05 8531 6 0.63
WCI 10.05 0.4 4742 3 0.34
Ʃ 100 15.01
Phase d-sp
(A) FWHM Area %
CG
(A)
Sm 15.58 2.26 47880 52 8.04
Sm/I 13.12 1.68 15256 16 2.16
I/S 11.19 1.32 13412 14 1.62
PCI 10.23 1.02 10025 11 1.10
WCI 10.04 0.42 6257 7 0.68
Ʃ 100 13.59
Figure 59 Decomposition results for Waite Claremont Vertosol soil clay before and after
application of wastewater
Because of the dominance of smectite in the clay fraction of Waite Claremont soil, application
of wastewater induced more complex mineralogical modifications. WCI peak position (10.05
Å) and FWHM (0.4° 2θ) did not change with increasing relative peak area (from 3 to 7%).
Peak position for PCI moved towards higher 2θ angles (from 10.30 to 10.23 Å), FWHM
decreased slightly (from 1.05 to 1.02° 2θ) with increase in relative peak area (from 6 to 11%).
The smectitic phases decreased in relative peak areas (from 91 to 82% combined) with a move
of peak positions to the higher 2θ° angle.
Elemental content of clay fraction
Total chemical analyses of clay fractions after removal of exchangeable bases are given in
Table 30. Data in this study are reported on a mgg-1 basis. In each soil clay under study the
content of potassium increased considerably after treatment: for Barossa, + 12%, Charlton, +
15% and Claremont, + 16%. There is no noticeable relationship between Al, Fe, Ca, Mg, Na
and K contents. Mg and Na content for Charlton clay increased after treatment (for 10 and 53%
respectively) and those for Barossa clay increased to lesser extents. We can conclude that clay
K content modification occurred independent by Al, Fe, and Ca contents. The modification
observed through decomposition of X-ray data are in a good agreement with variations of
4.0 6.0 8.0 10.0 12.0
Sm
Sm/II/Sm
PCIWCI
4.0 6.0 8.0 10.0 12.0
Sm/I
I/Sm
PCI
WCI
Sm

119
mineral clay K concentration: increase in K content after treatment reflects in growth of illitic
component of clay assemblages.
Table 30 Chemical composition of clay fractions, mg/g
Sample ID Ca Mg Na K Al Fe Mn
Barossa Original 2.73 9.02 0.82 9.21 88.73 41.55 0.14
Barossa WW 2.90 9.61 0.98 10.33 88.13 42.37 0.14
Charlton Original 2.61 7.48 0.71 12.32 78.07 38.65 0.24
Charlton WW 2.86 8.20 1.09 14.15 79.20 38.43 0.29
Claremont Original 44.64 12.40 0.67 8.84 56.19 36.15 0.36
Claremont WW 43.74 12.35 0.65 10.22 54.13 35.63 0.42
Clay mineral modification through wastewater treatment: Summary
For all clays under study, the relative peak areas for illitic phases (PCI and WCI) increased
compared to the smectite peaks after treatment. Furthermore, smectite and smectite/illite peak
positions shifted to higher 2θ angles and as a result, a portion of the initial phases became either
an illite-rich inter-layered mineral or illite (Velde and Barré 2010).
The measurement of the center of gravity of X-coordinates allows a numerical comparison of
the diffractograms before and after wastewater treatment, summarising modification of clay
assemblages. According to Moore and Reynolds (1997), the centre of gravity should depend to
a large extent on the anhydrous K layer content of the whole clay assemblage and may therefore
give an approximation of the K content (Barré at al. 2007b). In all clays studied cg value
decreased after treatment – meaning an increase in the quantity of illitic layers at the expense
of the expandable smectitic phases.
The present data suggest that illite content, as a phase or as a part of interlayer mineral
assemblage increased after wastewater treatment. Our results are similar to the study of Arienzo
at al. (2012). They investigated the relative effects of Na+ and K+ on soil structural stability.
When they treated soil with solutions of different amounts of potassium (9 treatments), in each
case they reported an increase in illite content with simultaneous decrease in smectite in clay
fraction.
Conclusion
Characterisation of the effect of wastewater treatment on clay fraction either by decomposition
of XRD diagrams or chemical analysis of the mineral content of studied clays gave consistent
results. Hence, it appeared that decomposition of XRD patterns gave a realistic analysis of
complex clay assemblages. Many soils contain clay minerals with smectitic layers, often in

120
insterstratifications with illite and also kaolinite (Norrish and Pickering 1983; Velde 2001;
Churchman and Lowe 2012). The dynamic of illitisation can be monitored by XRD both
qualitatively and quantitatively. Although this study was not performed under field conditions,
it suggests that illitisation is likely to occur in interactions of many real soils upon their
irrigation with wastewaters rich with potassium. 2:1 clay minerals play a vital role in the
potassium cycle in soil. They are capable of sequestering potassium from the soil solutions.
Moreover, the sequestered potassium becomes a source of potassium for plant growth.

121
Chapter 8. Potassium induced dispersion: a field study
For this study I have chosen 74 dispersive soils from different areas of Australia. The main
criteria for selection were: visual assessment of the intensity of soil dispersion after 48 hours
(Rengasamy 2002b) and turbidity, measured as nephelometric turbidity units (NTU). In
Australia, soil with exchangeable sodium percentage (ESP) > 6% is considered to be dispersive.
Out of 74 soils 17 showed high dispersion levels but ESP < 5% (in fact the highest ESP value
was 4.2%).
These soils varied in cropping history, management, and physical and chemical properties,
except they all had exchangeable K+/Na+ ratios > 1 (Figure 60 and Table 31). There is little
systematic information in the literature on the effects of exchangeable K+ on soil structure and
a need to examine its effect on soil/clay dispersive behaviour using exchangeable ratios, rather
than solution ratios. I intentionally have chosen these dispersive soils with high levels of
exchangeable potassium relative to sodium in order to quantify its effect. The main objectives
of this study were: a) determine the relative importance of various physical and chemical
properties of potassium rich soils on their dispersive behaviour; b) quantification of the effects
of potassium induced dispersion in soils.
Figure 60 Soil sites locations

122
Table 31 Soil sites characteristics
Id Location Land use and horizon Soil1 Texture
class
Elevation
m
Rain
Fall,
mm y-1
1 Lake Cargelligo, Vic Agriculture, A hor. Dermosol Loam 37 961
2 Forbes, NSW Agriculture, A hor. Kandosol Silty loam 19 683
3 Melbourne, Vic Recreation, A hor. Sodosol Clay 37 572
4 Kew East, Vic Recreation, A hor. Sodosol Clay loam 298 645
5 Temora, NSW Agriculture, Plot 2, B hor. Kandosol Sandy loam 199 431
6 Temora, NSW Agriculture, Plot 32, B hor. Kandosol Loam 199 429
7 Temora, NSW Agriculture, Plot 33, B hor. Kandosol Loam 199 411
8 Charlton, Vic Agriculture, A hor. Chromosol Clay 480 686
9 Charlton, Vic Agriculture, B hor. Chromosol Clay 480 653
10 Charlton, Vic Agriculture, B hor. Chromosol Clay 470 653
11 Sutton Grange, Vic Recreation, B hor. Sodosol Clay 65 357
12 West Essendon, Vic Recreation, B hor. Rudosol Clay 64 357
13 Balaklava, SA Agriculture, A2 hor. Chromosol Clay 64 423
14 Balaklava, SA Agriculture, A1 hor. Chromosol Clay loam 64 423
15 Balaklava, SA Agriculture, A2 hor. Chromosol Clay 64 423
16 Jamestown, SA Agriculture, A1 hor. Chromosol Loam 408 477
17 Jamestown, SA Agriculture, A2 hor. Chromosol Clay loam 408 477
1 Australian Soil Classification (Isbell, 1996)
Mineralogical analysis of soil clay fractions
As I pointed out previously, one of the reasons for different response of soils to application of
potassium (as a fertiliser or in irrigation water) was attributed to differences in their mineralogy
(Levy and van der Watt 1990; Churchman et al. 1993; Arienzo et al. 2009). I examined 17
chosen soils for their mineralogy. The XRD patterns of the <2 µm fractions of investigated
soils are shown in Figure 61. The samples 5, 6 and 7; 8 and 9; 13, 14 and 15; 16 and 17 represent
the same sampling sites, but different plots or horizons (Table 31). Their XRD patterns are
identical in each case and only one XRD diffractogram is presented from the same site.
All samples revealed the reflections of illite (d = 9.9 – 10.0 Å), kaolinite (d = 7.1 – 7.2 Å) and
quartz (d = 2.34 Å). The majority of clays have also varying amount of primary minerals –
potassium feldspar (d = 2.24 Å) and albite (d = 2.2 Å). Sample 3 was dominated by chlorite (d
= 14.2 Å). Expandable minerals (smectite and vermiculite) with some interstratified phases
were also present. Illite and kaolinite were the dominant clay phases in general. 3 samples from
Temora, NSW (samples 5, 6 and 7) contained trioctahedral illite (the 060 reflections not
shown). The rest of the soils studied contained clays with a dioctahedral structure. The results
of quantitative mineralogical analyses are presented in Table 32.

123
Figure 61 Experimental XRD patterns obtained for the < 2 micron fraction of the studied
soils
As shown by XRD analysis, all samples, except sample 3, have illite/kaolinite as dominant clay
minerals. Sample 3 was composed of 49% chlorite with illite (10%) and kaolinite (21%) also
present. Only sample 2 had over 10% of expandable minerals.
Table 32 Quantitative analysis of clay fractions, %
Soil ID
Sm1 and
Sm/I
V and
V/I Chl I K Quartz KF Alb
16.2-15.22 14.0 14.2 9.9-10.0 7.1-7.2 3.34 3.24 3.2
1 1 - - 16 29 36 17 -
2 13 - - 14 17 30 13 13
3 - - 49 10 21 12 9 -
4 - 2 - 25 37 22 5 7
5 - - - 46 20 20 7 6
6 - - - 41 21 23 8 7
7 - - - 48 21 22 4 5
8 1 - - 38 17 22 11 11
9 5 - - 33 19 16 10 16
10 2 - - 37 36 25 - -
11 - - - 4 87 9 - -
12 9 - - 6 38 16 19 12
13 1 - - 41 16 14 14 14
14 <0.5 - - 25 21 18 19 17
15 <0.5 - - 45 13 24 6 12
16 - - - 38 20 22 9 11
17 1 - - 31 23 12 21 13 1 Where: Smectite = Sm, Vermiculate = V, Chlorite = Chl, Illite = I, Kaolin = Ka, Quartz = Qz, Potassium
Feldspar (microcline) = KF, Albite = Alb 2 Approximate d-spacing in Å used for identification of mineral species (spacings given for air-dried state)
All soils have in common that they were all composed of clay minerals in which exchangeable
cations are almost entirely located on outer surfaces of clay particles. Dispersion of clay
minerals related to their structure, composition and particularly the nature of the exposed outer
surface, because it is these surfaces which interact with the water and nutrients (Wilson 2014).
0
5
10
15
20
25
30
35
40
4 8 12 16 20 24 28 32
1
2
3
4
8, 9
5, 6, 7
2θ°
0
5
10
15
20
25
4 8 12 16 20 24 28 32
10
11
12
16, 17
13, 14, 15
2θ°

124
Soils properties
The results of soil physico-chemical analysis (Table 33) have shown that investigated soils
differ in pH, EC, organic carbon, texture and CEC. As previously indicated, all the studied soils
were predominantly illitic/kaolinitic. However, in spite of their similar mineralogy, the
dispersive behaviour of these soils is quite variable (coefficient of variation, CV = 18% for
turbidity, 67% for CEC and 42% for clay content), suggesting that other soil properties were
also affecting dispersion.
Table 33 Selected soil properties
Soil K/Na1 pH EC,
dS/m
Organic
C%
Turbidity
NTU Level of
dispersion PSD2, % CEC,
(cmol+/kg) Clay Silt Sand
1 28.17 4.9 0.19 0.75 3970 Very high 22 14 64 7.0
2 2.00 7.9 0.29 0.90 2580 High 44 9 47 21.6
3 18.05 5.0 0.18 2.48 3480 Very high 40 22 38 7.0
4 4.28 6.1 0.12 2.43 1860 Medium 30 26 44 9.5
5 9.58 5.4 0.04 0.49 3240 Very high 18 10 72.5 2.9
6 9.94 5.1 0.04 0.46 3510 Very high 21 16 63 2.7
7 10.28 5.0 0.04 0.49 3260 High 22 14 64 2.9
8 6.83 6.7 0.07 1.16 2890 High 39 13 49 11.7
9 1.79 8.1 0.06 0.40 2820 High 73 10 18 24.9
10 1.12 8.8 0.16 0.56 2130 Medium 65 6 29 29.1
11 6.50 6.3 0.10 0.91 2970 High 58 6 37 5.7
12 1.42 7.7 0.19 0.95 2560 High 43 16 41 17.5
13 7.44 9.0 0.10 1.27 2810 High 53 16 32 12.8
14 7.77 8.5 0.13 0.69 3300 High 33 27 41 15.3
15 1.65 8.9 0.14 1.19 2780 High 48 20 32 20.5
16 15.83 5.6 0.15 0.70 3510 High 23 24 53 6.4
17 10.21 6.0 0.15 1.19 2870 High 33 22 46 8.8
These 17 soils were further analysed for a range of properties (Table 34) in order to find out
the key soil properties and/or indexes which would assist in prediction and assessment of soil
dispersion, induced, I hypothesise, by elevated levels of exchangeable potassium relative to
sodium. The results of linear regression analysis are presented in Table 35. Dispersion
characteristics, expressed as turbidity and zeta potential, were used as dependent variables.
CEC, exchangeable cation ratio (ECR), exchangeable sodium percentage (ESP), exchangeable
potassium percentage (EPP), clay content and water dispersible clay (WDC) content were then
used as independent variables in regression analysis.
The ECR, the ESP and the EPP were calculated as:
ECR %= [(Na +0.56K)/ [exch (Na+K+Ca+Mg)] x100 (1)

125
ESP % = (Na)/[exch (Na+K+Ca+Mg)] x100 (2)
EPP % = (K)/[exch (Na+K+Ca+Mg)] x100 (3)
In the ECR formula the measured difference between the dispersive effect of K+ and that of
Na+ was taken into account by multiplying the values for exchangeable K by 0.56 (Rengasamy
and Marchuk A. 2011). WDC is considered a good indicator of soil structural stability and has
been used to study structural stability of saline and sodic soils (see Nelson et al. 1998).
Table 34 Zeta potential, exchangeable cations, CEC, ECR, ESP, EPP and WDC of selected soils
Soil
ID
Zeta Exchangeable cations,
cmol+/kg CEC ECR ESP EPP WDC
mV Ca Mg Na K cmol+/kg % % % %
1 -51.6 3.58 1.51 0.06 1.80 7.0 15.43 0.92 25.71 10
2 -39.7 13.49 6.35 0.58 1.15 21.6 5.66 2.67 5.32 27
3 -40.4 3.98 1.49 0.08 1.42 7.0 12.53 1.13 20.29 21
4 -37.7 6.73 2.14 0.13 0.54 9.5 4.53 1.33 5.68 35
5 -44.6 2.17 0.22 0.05 0.44 2.9 10.19 1.60 15.17 13
6 -46.8 2.02 0.24 0.04 0.40 2.7 9.78 1.49 14.81 17
7 -49.0 2.22 0.25 0.04 0.40 2.9 8.95 1.33 13.79 18
8 -37.4 7.75 2.74 0.16 1.09 11.7 6.57 1.36 9.32 23
9 -38.3 11.25 11.25 0.85 1.52 24.9 6.82 3.41 6.10 45
10 -37.5 19.75 7.44 0.90 1.00 29.1 5.02 3.08 3.44 38
11 -37.9 1.54 3.10 0.14 0.93 5.7 11.64 2.51 16.32 33
12 -36.1 8.25 7.67 0.65 0.92 17.5 6.66 3.71 5.26 30
13 -38.0 9.25 2.28 0.15 1.12 12.8 6.08 1.18 8.75 40
14 -42.9 11.25 1.95 0.24 1.84 15.3 8.31 1.55 12.03 19
15 -37.1 13.50 4.69 0.86 1.41 20.5 8.05 4.18 6.88 26
16 -47.8 4.18 1.20 0.06 0.99 6.4 9.61 0.97 15.47 13
17 -36.7 5.75 2.05 0.09 0.92 8.8 6.84 1.02 10.45 22
Turbidity was highly related to ECR and EPP; increasing ECR and EPP leading to increased
turbidity. Figure 62 demonstrates ECR and EPP as superior to ESP as an index to predict soil
structural deterioration when sodium is low on soil clay exchange sites. Importantly, the
modification of ESP to create ECR has incorporated the Na factor of the function as Na is
clearly common and a well-documented issue in the Australian landscape. The extent of soil
clay dispersion in investigated soils was influenced by K+ rather than Na+ on the exchange
sites, confirming earlier reports on the effects of K+ on soil structural changes (Marchuk A. and
Rengasamy 2011; Rengasamy and Marchuk A. 2011).

126
Table 35 Results of linear regression analysis (R2)
Properties Text Clay WDC CEC ECR ESP EPP
Turbidity 0.267 0.566 0.349 0.736 0.226 0.773
Zeta 0.489 0.561 0.327 0.433 0.274 0.524
Turbidity v ESP Turbidity v ECR Turbidity v EPP
Figure 62 Relationships between turbidity against exchangeable sodium percentage,
exchangeable cation ratio and exchangeable potassium percentage
For the whole soil dataset EPP was a better predictor of dispersion than ECR (Figure 62). But
EPP considers only potassium as a dispersive cation in the same way as ESP considers only
sodium. I have shown that potassium could also induce dispersion, although to a lesser extent
than sodium. Hence, the most useful index should reflect the combined effects of potassium
and sodium as dispersive agents. In soil data presented K/Na ratio varied from 1.12 to 28.17. I
suggesting that EPP would be a better predictor than ECR for soils with higher K/Na ratio and
vice versa. I separated the 17 soils into two groups, according to K/Na ratio; one group with
K/Na ratio ≥ 7 and other group with K/Na ratio < 7 (Tables 36 and 37).
Table 36 Soils with K/Na ratio ≥ 7
Soil ID K/Na ratio Turbidity ECR EPP
1 30.0 3970 15.43 25.71
3 17.8 3480 12.53 20.29
5 8.8 3240 10.19 15.17
6 10.0 3510 9.78 14.81
7 10.0 3260 8.95 13.79
8 7.0 2890 6.57 9.32
11 7.0 2970 11.64 16.32
13 7.5 2810 6.08 8.75
14 7.7 3300 8.31 12.03
16 16.5 3510 9.61 15.47
17 10.2 2870 6.84 10.45
For the soils with K/Na ratio ≥ 7, EPP is a better predictor than ECR (Figure 63). But for the
soils with K/Na ratio < 7, ECR correlates much better with turbidity data (Figure 64).
y = -0.001x + 4.8123R² = 0.2265
0
0.5
1
1.5
2
2.5
3
3.5
4
4.5
1500 2000 2500 3000 3500 4000
y = 0.0047x - 5.6103R² = 0.7365
0
2
4
6
8
10
12
14
16
18
1500 2000 2500 3000 3500 4000
y = 0.0101x - 18.529R² = 0.773
0
5
10
15
20
25
30
1500 2000 2500 3000 3500 4000

127
Considering that soils from Table 36 represent extreme cases with enormously high K/Na ratios
and it is likely that soils similar to those from Table 37 are more common, we think that ECR
is generally a better, more objective indicator of soil dispersibility.
Figure 63 Turbidity v ECR and EPP for soils with K/Na ratio ≥ 7
Table 37. Soils with K/Na ratio < 7
Soil ID K/Na ratio Turbidity ECR EPP
2 2.0 2580 5.66 5.32
4 4.2 1860 4.53 5.68
9 1.8 2820 6.82 6.10
10 1.1 2130 5.02 3.44
12 1.4 2560 6.66 5.26
15 1.6 2780 8.05 6.88
Figure 64 Turbidity v ECR and EPP for soils with K/Na ratio < 7
Another important issue is a critical or threshold value of EPP (as an analogue for ESP ≥ 6 for
dispersive soils). In our dataset we observed dispersion even under such small EPP values as
3.44 %. Figure 65 shows results of dispersion tests on samples 2, 10 and 12 with the lowest
EPP values (Table 34).
y = 0.0063x - 11.019R² = 0.6441
4
6
8
10
12
14
16
18
2000 2500 3000 3500 4000 4500
y = 0.012x - 24.207R² = 0.7291
4
9
14
19
24
29
2000 2500 3000 3500 4000 4500
y = 0.003x - 1.2757R² = 0.7789
3
4
5
6
7
8
9
1500 2000 2500 3000
y = 0.0016x + 1.4456R² = 0.2906
3
4
5
6
7
8
1500 2000 2500 3000

128
Sample 2 Sample 10 Sample 12
EPP = 5.32%;
NTU = 2580
EPP = 3.44%;
NTU = 2130
EPP = 5.26%;
NTU = 2560
Figure 65 Dispersion test for the samples 2, 10 and 12
Conclusion
Exchangeable potassium can cause dispersion of soil even if it’s present in relatively small
amount (EPP < 4%). This occurs particularly in soils with dominant illite/kaolinite mineralogy.
Exchangeable Cation Ratio, as an indicator of soil dispersion, reflects the combined effects of
potassium and sodium as dispersive agents. The ECR is a relatively new index and its
applicability in predicting dispersion must be further clarified.

129
Chapter 9. General Discussion
This thesis examines various aspects of potassium both inherent in soils and added to soils, as
commonly occurs with wastewaters from agricultural industries. It studies both the fate of
added K in soil clays and also the effect of potassium as an exchangeable ion on the behaviour
of soils and soil clays. It examines the mechanism by which potassium becomes incorporated
in soil clay minerals, changing their nature and also the relative behaviour of the K+ cation in
relation to other cations in soils, particularly Na+ and the common divalent cations, Ca2+ and
Mg2+.
In Chapter 3, experiments with application of potassium to a pure smectitic mineral, Wyoming
montmorillonite, show that wetting and drying, which are often experienced in soils in the
Australian environment, when carried out repeatedly, as may occur within a season or from
year to year, at realistic surface temperatures, brings about changes in the structure of the clay
mineral. The result is that potassium becomes sequestered between the layers of the mineral.
The mineral becomes more illitic, step-wise through an interstratification of K-rich illite layers
and K-depleted smectite layers. This is the reverse of the weathering that occurs by
transformation of micaceous minerals to give first illite, then expanded layer silicates such as
vermiculite and smectites. This chapter establishes a mechanism for the uptake and retention
of potassium added to soils in, e.g. wastewaters.
Chapter 4 concentrates on the charges on mineral layers as they are determined by displacement
by index cations of the mixed suite of cations commonly found in natural clays, to give
measures of their cation exchange capacities CEC. It asks the fundamental question about the
effect of the nature of the displacing cations on the charge measured. A variety of clay minerals
have their CECs determined using the common cations, K, Na, Ca and Mg. It is shown that,
generally, differences between the CECs determined using the different cations were relatively
minor, indeed, tended to follow similar trends with the different index cations. These trends
were related to both the particle sizes resulting from different saturating cations and also their
surface charges as given by zeta potentials. The major outstanding difference between CECs
measured by different index cations occurred when K+ was used to measure the CEC of a
vermiculite, the mineral with the highest layer charge among the set studied.
In Chapter 5, the study of four soils with contrasting mineralogies in relation to their tendencies
to disperse with the common cations in soils, namely Na, K, Ca and Mg, were shown to reflect
a combination of surface charges, as given by zeta potential, particle sizes and also aspects of

130
particle shape that reflected their mineralogies. There was a consistent effect of the cations,
with Na saturation leading to the strongest tendency to disperse, relatively closely followed by
K and generally, Mg and Ca were considerable less dispersive as exchangeable cations. Soils
with dominantly kaolinite, illite and smectite mineralogies were studied. It was only through a
knowledge of their mineralogies and their attendant shapes that the tendencies of particles to
disperse and/or flocculate could be understood in relation to the forces of association and
dissociation in double layer interactions. In particular, blocky kaolinite particles formed weak
associations by van der Waals attractive interactions. At the other extreme, smectites with
generally thinner, more extensive and flexible particles, showed close fits together and
therefore stronger associations by van der Waals attractions.
Chapter 6 examined the effects of potassium as it was inherently contained within an illite-
kaolinite soil of a type that is common in South Australia and also examined the effects of
additions of K+ to such a soil. An illite in such a soil is typically partially depleted of structural
potassium, reflecting previous land-use to some extent. It was shown that this type of soil, in
which smectite was not a significant component could nonetheless re- incorporate potassium
into its structure. Newly-developed computer programs for the decomposition of X-ray
diffraction patterns into their component separate phases, including at the subtle level of
distinguishing poorly-crystallised and well-crystallised forms of the same mineral type (in this
case, illite), enabled identification of the formation of a newly-formed poorly crystallised illite
that results from the addition of extra potassium. The formation of this phase is shown to
accompany a decrease in particle size, a decrease in CEC, a lower zeta potential and the
apparent formation of fine particles as seen in electron micrographs. In general, this chapter
shows that there is a dynamic in the structural content of potassium in soils regardless of
whether they contain smectites. The effect with illites are more subtle than those with smectites
that were noted more clearly in Chapters 3-5 (and in Chapters 7 and 8).
In Chapter 7, a laboratory study carried out with real wastewaters examined their effects upon
disposal on a number of Australian soils with mixed clay mineralogies. In particular, these soils
each had smectitic layers in interstratifications with other layers, particularly illite.
Interstratified phases in which smectites appear along with other types of layers are common
in Australian soils. Using a recently-developed peak decomposition procedure, it was shown
that potassium in wastewaters became incorporated in the interlayers in the structures of the
soil clays involved and the mineralogical changes reflected those in the chemical composition
131
of the soils. The net effect was sequestration of some of the added potassium into the structures
of the clays so that they become potentially available to plants as nutrients.
Chapter 8 specifically examined the effects of potassium on dispersion, especially when
potassium content on exchange sites is high relative to sodium, normally regarded as the
principal cation responsible for dispersion in the Australian landscape. A wide range of
dispersive soils were studied; generally, these had an illite-kaolinite clay mineral composition.
When exchangeable content of K+ was particularly high in relation to that of Na+, an index
exchangeable potassium percentage, EPP that is exactly analogous to exchangeable sodium
percentage ESP for sodium gave a good prediction of turbidity. However, when potassium and
sodium contents were more comparable, exchangeable cation ratio ECR gave a closer
relationship with measures of turbidity. ECR incorporates measured differences between the
relative dispersion effects of Na+ and K+ and is recommended as an objective index of soil
dispersibility that accounts for the effects of both potassium and sodium exchangeable ions as
clay dispersion in soils.

132
Chapter 10. Conclusions, Limitations of the study, and
Recommendation for further research
Conclusions
The nature of cations adsorbed on soil/clay surfaces (exchange complex) has the potential to
significantly affect the physical and chemical properties of the soils and clays. The changes in
the adsorbed complex can result in considerable changes in the average size of particles and
dispersive/flocculating properties of clays (Chapters 4 and 5). In general, the mean particle size
increased in all clay samples in the order Na < K < Mg < Ca. The changes in size observed are
reflected in the zeta potential measurements, with samples having smaller sizes giving higher
negative zeta potentials. These relationships were independent of the type of clay studied.
The main part of the field study on the effect of vegetation on potassium status of Urrbrae
Chromosol comprised a study of the X-ray diffraction basal peak reflections of clay minerals
from different profiles and depths (Chapter 6). The analysis presented here demonstrates that
even with a range of vegetation regimes Urrbrae soil shows only minor changes in its XRD
diagrams, and hence in clay mineral composition. The general trend observed: the growth in
illite and kaolinite content at the expense of quartz and feldspar with increasing depth.
In spite of the beneficial effects of potassium as a major plant nutrient, as a monovalent cation
it can cause dispersion but to a lesser extent than sodium (Chapters 5 and 6). Potassium cations
also could increase soil hydraulic conductivity to some extent when applied to a soil with high
sodium content by substituting the Na+ on exchange sites (Chapter 6). I have shown this on
Urrbrae soil – an illitic/kaolinitic soil with all exchangeble cations located on the outer surfaces
of phyllosilicates. In this case, when potassium cations substitute sodium on the exchange sites,
we observe an increase in soil permeability and hydraulic conductivity due to the lower
dispersive potential of potassium compared to sodium. But when exchangeable potassium
substitutes magnesium or calcium it induces a dispersion of Urrbrae soil, a decrease of clay
mean particle size, and as a result, reduction in soil permeability. Illitic and illitic-kaolinitic
soils are more prone to dispersion than soils with dominant smectitic clay. This is due to their
differences in clay microstructure and fabric when interacting with water (Chapters 5 and 8).
I have also proposed the use of Exchangeable Cation Ratio as an indicator of soil dispersion
because it reflects the combined effects of potassium and sodium as dispersive agents (Chapter
8).

133
The application of potassium rich wastewaters to soils may lead to mineralogical changes in
the soils that affect their physico-chemical properties. This process is very much dependent on
soil clay mineralogy. In an experiment described in Chapter 7, illitic/kaolinitic and smectitic
soils changed their clay composition after treatment with wastewater. The results showed
trends towards the formation of interstratifications of illite with smectite at the expense of
smectite and an alteration of poorly-crystallised illite into its more well-ordered forms.
Mineralogical changes gave consistent results, whether monitored by decomposition of XRD
diagrams or by chemical analysis of the mineral content of the clays.
The results show that illitisation may occur as a consequence of the addition of K-rich
wastewaters to clayey soils. Our results support the view of 2:1 clay minerals as a potassium
reservoir and specify the role of each of the 2:1 clay mineral populations in the potassium cycle
in soil. Many soils contain clay minerals with smectitic layers, often in insterstratifications with
illite and also kaolinite. The dynamics of illitisation can be monitored by XRD both
qualitatively and quantitatively. Although this study was not performed under field conditions,
it suggests that illitisation is likely to occur in interactions of many real soils upon their
irrigation with wastewaters rich with potassium.
The use of mineralogy to explain the potassium dynamics in soil was quite effective. The recent
advances in XRD-pattern treatment by specific computer programms such as Decomp and
NEWMOD permit the identification of complex clay mineral assemblages and the
characterization of their transformation. In my research I have shown that zeta potential and
turbidity measurements could effectively reflect soil clay dispersive properties. However, to
correctly understand the significance of zeta potential we should have prior knowledge of the
mineralogy of the soils studied. TEM and XRD methods could assist in providing a better
understanding of the processes occurring in soil.
Limitations of the study and Recommendations for further research
The research undertaken during the completion of this thesis highlighted several future research
opportunities.
Some of the opportunities for future research arise from the limitations of the study to 1) clay
fractions only of soils, 2) laboratory studies rather than field studies, and 3) the shortcomings
of the available indices for predicting dispersion from the composition of exchangeable cations.

134
In my study of potassium dynamics in soil I have concentrated on clay fractions. The recent
works of Murashkina et al. (2007) and Najafi-Ghiri and Abtahi (2013) indicate that silt and
sand fractions of soil could also contribute significantly to the potassium fixation and release.
Further research is required to assess the contribution of different soil fractions to the potassium
cycle in soil.
The experiment with wastewater treatment of soil was carried out in laboratory condition, but
it suggests that illitisation could occur in interactions of many real soils upon their irrigation
with wastewaters rich with potassium. Detailed soil and mineralogical studies need to be
conducted on a field with a range of irrigated soils.
Finally, the application of Exchangeable Cation Ratio in assessing soil dispersion does not take
into account the effects of Mg2+, or the concept of threshold cation concentrations in
understanding the dispersive behaviour of soils. Future iterations should continue to explore
the combined effect of exchangeable cations on the dispersive behaviour of agricultural soils.

135
References
Agricola, G., 1546. Natura fossilium. (Translation by Brandy MC, Brandy JA (1955),
Geological Sociaty of America, Special Paper 63).
Ahrens, L., 1965. Distribution of elements in our planet. McGraw-Hill Book Co, New York.
Aldega, L. and Eberl, D., 2005. Detrital illite crystals identified from crystallite thickness
measurements in siliciclastic sediments. American Mineralogist, 90: 1587-1596.
Andrist-Rangel, Y., Magnus Simonsson, M., Andersson, S., Öborn, I. and Hillier, S., 2006.
Mineralogical budgeting of potassium in soil: A basis for understanding standard
measures of reserve potassium. Journal of Plant Nutrition ans Soil Science, 169 (5):
605–615.
April, R., Hluchy, M. and Newton, R., 1986. The nature of vermiculite in Adirondack soils and
till. Clays Clay Minerals, 34: 549–556.
Arienzo, M., Christen, E., Quayle, W. and Kumar, A., 2009. A review of the fate of potassium
in the soil–plant system after land application of wastewaters. Journal of Hazardous
Materials, 164: 415-422.
Arienzo, M., Christen, E., Jayawardane, N. and Quayle, W., 2012. The relative effects of
sodium and potassium on soil hydraulic conductivity and implications for winery
wastewater management. Geoderma, 173: 303–310.
Arkcoll, D., Goulding, K. and Hughes, J., 1985. Traces of 2:1 layer silicate clays in oxisols
from Brazil and their significance for potassium nutrition Journal of Soil Science, 36:
123–128.
ASTM, 1976. Annual Book of ASTM Standards. Part 31 Water. Standard D1889-71: 223.
Auerswald, K., Kainz, M., Angermüller, S., Steindl, H., 1996. Influence of exchangeable
potassium on soil erodibility. Soil Use and Management 12: 117-121.
Badraoui, M., Bloom, P. and Rust, R., 1987. Occurrence of high-charge beidellite in a vertic
haplaquoll of northwest Minnesota Soil Science Society of America Journal, 51: 813–
818.
Bailey, S., 1966. The status of clay mineral structures. Clays and Clay Minerals, 14: 1-24.
Bailey, S., 1980. Structures of layer silicates. In: Brindley GW, Brown G (Eds) (1980) Crystal
Structure of Clay Minerals and their X-ray Identification. Mineralogical Society
Monograph No. 5, London.
Balder, N. and Whittig, L., 1968. Occurence and synthesis of soil zeolites. Soil Science
Society of America Journal, 32: 235-238.
Barak, P., 1999. Essential Elements for Plant Growth. Potassium. Univ. of Wisconsin (Editor).
http://www.soils.wisc.edu/~barak/soilscience326/potassium.htm
Barber, S., 1995. Soil Nutrient Bioavailability. A Mechanistic Approach, New York.
Barré, P., Velde, B. and Abbadie, L., 2007a. Dynamic role of ‘‘illite-like’’ clay minerals in
temperate soils: facts and hypotheses. Biogeochemistry, 82: 77–88.
Barré, P., Velde, B., Catel, N., Abbadie, L., 2007b. Soil-plant potassium transfer: impact of
plant activity on clay minerals as seen from X-ray difraction. Plant Soil 292: 137-146.

136
Barré, P., Velde, B., Fontaine, C., Catel, N. and Abbadie, L., 2008. Which 2:1 clay minerals
are involved in the soil potassium reservoir? Insights from potassium addition or
removal experiments on three temperate grassland soil clay assemblages. Geoderma,
146: 216–223.
Barshad, I., 1951. Cation exchange in soils: I. Ammonium fixation and its relation to potassium
fixation and to determination of ammonium exchange capasity. Soil Science,
72(5):361-372.
Barshad, I., 1954. Cation exchange in micaceous minerals: 1. Replaceability of the interlayer
cations of vermiculite with ammonium and potassium ions. Soil Science 77: 463-472.
Barré, P., Berger, G. and Velde, B., 2009. How element translocation by plants may stabilize
illitic clays in the surface of temperate soils. Geoderma, 151: 22–30.
Bennie, A., 1996. Growth and mechanical impedance. In: Plant roots. The hidden half, 2nd
edn, eds Y Waisel A Eshel & U Kafkafi, Marcel Dekker New York, pp. 453–470.
Bergaya, F., Lagaly, G. and Vayer, M., 2006. Cation and anion exchange, F. Bergaya, B.K.G.
Theng, G. Lagaly, Editors , Developments in Clay Science, Elsevier, pp. 979–1001.
Bertsch, P. and Thomas, G., 1985. Potassium Status of Temperate Region Soil. In: R.D.
Munson (Editor), Potassium in Agriculture. ASA/CSSA/SSSA, Madison, WI, pp. 131-
162.
Biscaye, P.E., 1965. Mineralogy and sedimentation of recent deep-sea clay in the Atlantic
Ocean and adjacent seas and oceans. Geological Society of America Bulletin, 76:803–
831.
Boeck, E., Coveney, J. and Skipper, N., 1995. Monte Carlo molecular modelling studies of
hydrated Li-, Na-, and K-smectites: understanding the role of K as a clay swelling
inhibitor. Journal of the American Chemical Society, 117: 12608–12617.
Boettinger, J. and Southard, R., 1995. Phyllosilicate distribution and origins in aridisols on a
granitic pediment, western Mojave desert. Soil Science Society of America Journal, 59:
1189–1198.
Borchardt, G., 1989. Smectites. In: D. Weed (Editor), Minerals in Soil Environments. SSSA,
Madison, Wisconsin, USA, pp. 675-727.
Brady, N. and Weil, R., 2008. The Nature and Properties of Soil. Pearson Prentice Hall,
Columbus, Ohio, 975 pp.
Brigatti, M., Galan, E. and Theng, B., 2006. Structures and Mineralogy of Clay Minerals. In:
B.K.G.T.a.G.L. F. Bergaya (Editor), Handbook of Clay Science. ELSEVIER,
Amsterdam, pp. 19-86.
Brindley GW, Brown G (Eds), 1980. Crystal Structure of Clay Minerals and their X-ray
Identification. Mineralogical Society Monograph No. 5, London.
Brongniart, A., 1844. Traité des arts céramiques et des poteries, vol II et atlas, Paris.
Cameron, K., Di, H. and McLaren, R., 1997. Is soil an appropriate dumping ground for our
wastes. Australian Journal of Soil Research, 35: 995-1035.
Chorom M, Rengasamy R, Murray R., 1994 Clay dispersion as influenced by pH and net
particle charge of sodic soils. Australian Journal of Soil Research, 32: 1243-1252.

137
Chorom M., Rengasamy P., 1995. Dispersion and zeta potential of pure clays as related to net
particle charge under varying pH, electrolyte concentration and cation type. European
Journal of Soil Science, 46: 657-665.
Chen, Y., Banin, A., and Borochovitch, A., 1983. Effect of potassium on soil structure
in relation to hydraulic conductivity. Geoderma, 30: 135-147.
Churchman, G., 1978. Studies on a climosequence of soils in tussock grasslands 21.
Mineralogy. New Zealand Journal of Science, 21: 467–480.
Churchman, G., 1986. Towards Understanding Soil Mineralogy. 1. An Introduction to Clay
Minerals in Soils, Soil Chemistry and Mineralogy Section, Lower Hutt.
Churchman, G., Skjemstad, J. and Oades, J., 1993. Influence of clay minerals and organic
matter on effects of sodicity on soils. Australian Journal of Soil Research, 31: 779– 800.
Churchman, G. and Weissmann, D., 1995. Separation of sub-micron particles from soils and
sediments without mechanical disturbance. Clays and Clay Minerals, 43(1): 85-91.
Churchman, G., Lowe, D., 2012. Alteration, Formation and Occurrence of Minerals in Soils.
In: P.M. Huang, Y. Li and M.E. Sumner (eds.). Handbook of Soil Sciences. Properties
and Processes, 2nd edition, CRC Press, Boca Raton, Florida, 20.1-20.72.
Clay Mineral Society, 2012. SOURCE CLAY PHYSICAL/CHEMICAL DATA.
http://www.clays.org/SOURCE%20CLAYS/SCdata.html
Clay Mineral Society, 1984. Report of the Clay Minerals Society Nomenclature Commitee for
1982 and 1983. Clays and Clay Minerals, 32: 239-240.
De Serres, O., 1600. Le théâtre d’agriculture et mesnage des champs. Actes Sud, Arles, France
(Reproduction of the 1600 edition, 2001, 1543 pp).
Dixon, J., 1989. Kaolin and Serpentine Group Minerals. In: S.B.W. J.B. Dixon (Editor),
Minerals in Soil Environments. Soil Science Soc. America, Madison, pp. 467-525.
Dixon, J. and Weed, S., 1989. Minerals in Soil Environment. Soil Science Society of America:
Madison, WI.
Douglas, L., 1989. Vermiculites. In: D. Weed (Editor), Minerals in Soil Environments. SSSA,
Madison, Wisconsin, USA, pp. 635-674.
Eaton, A. and Franson, M., 2005. Standard Methods for the Examination of Water &
Wastewater. (American Public Health Association).
Eberl, D. and Hower, J., 1977. The hydrothermal transformation of sodium and potassium
smectite into mixed layer clay. Clays and Clay Minerals 25: 215-227.
Eberl, D., Srodon, J. and Northrop, H., 1986. Potassium fixation in smectites by wetting and
drying. In J.Davis and K. Hayes, eds. American Chemical Society Symposium series,
323:296-326
Egli, M., Mirabella, A., Mancabelli, A. and Sartori, G., 2004. Weathering of soils in Alpine
areas as influenced by climate and parent material. Clays Clay Minerals, 52: 287–303.
Egli, M., Zanelli, R., Kahr, G., Mirabella, A. and Fitze, P., 2002. Soil evolution and
development of the clay mineral assemblages of a Podzol and a Cambisol in
‘Meggerwald’, Switzerland Clay Minerals, 37: 351–366.
Elsass, F., Chenu, C. and Tessier, D. 2008. Transmission Electron Microscopy for Soil
Samples: Preparation Methods and Use. In: A.U. L.Drees (Editor), Methods of Soil

138
Analysis. Part 5 - Mineralogical Methods. (Soil Science Society of America, Inc,
Madison, Wisconsin, USA)
Emerson, W., 1983. Inter-particle bonding. In 'Soils: an Australian Viewpoint'. (CSIRO Aust.
Division of Soils, Melbourne/Academic Press: London.), pp. 477-98.
Fanning, D., Keramidas, V. and El Desoky, M., 1989. Micas. In: S.B.W. J.B. Dixon (Editor),
Minerals in Soil Environments. Soil Science Soc. America, Madison, pp. 551-634.
Fontaine, S., Delvaux, B., Dufey, J. and Herbillon, A., 1989. Potassium exchange behaviour in
Carribean volcanic ash soils under banana cultivation. Plant and Soil, 120: 283-290.
Fordham, A., 1990. Formation of trioctahedral illite from biotite in a soil profile over granite
gneiss. Clays and Clay Minerals, 38: 187-195.
Fripiat, J., Jelli, A., Poncelet, G. and Andre, J., 1965. Thermodynamic properties and absorbed
water molecules and electrical conduction in montmorillonite and silicates. Journal of
Physical Chemistry, 69: 2185-2197.
FWAG, Potassium cycle. Farming and Wildlife Advisory Group (Editor).
http://forum.fwag.org/data/public/727_4.doc.
Gates, W., 2006. X-ray Absorption Spectroscopy. In: Bergaya (Editor), Handbook of Clay
Science. ELSEVIER, Amsterdam, pp. 789-864.
Gee, G., Bauder, J., 1986. Particle-size analysis. In ‘Methods of soil analysis: Part 1. Physical
and mineralogical methods. Vol. 9’. 2nd edn (Ed. A Klute) pp. 383–411. American
Society of Agronomy, Madison, WI.
Geeves, G., Cresswell, H., Murphy, B., Gessler, P., Chartres, C., Little, I. and Bowman, G.,
1995. The physical, chemical and morphological properties of soils in the wheat-belt of
southern NSW and northern Victoria. NSW Department of Conservation and Land
Management/CSIRO Division of Soils, An Occasional Report
Gharrabi, M., Velde, B., 1995. Clay mineral evolution in the Illinois Basin and its causes. Clay
Minerals, 30: 353-364.
Gharrabi, M., Velde, B., Sagon, J., 1998. The transformation of illite to muscovite in pelitic
rocks: constraints from X-ray diffraction. Clays and Clay Minerals, 46:79-88.
Glaeser, P. and Mérring, J., 1954. Isotherms d'hydration des montmorillonites bi-ioniques (Ca,
Na). Clay Mineral Bulletin 2, 188-193.
Glenn, R., Nash, V., 1964. Weathering relationship between gibbsite, kaolinite, chlorite and
expansible layer silicates in selected soils form the Lower Mississippi Coastal plain.
Clays and Clay Minerals, 19: 529–548.
Gore, P., 2008. Weathering. Georgia Perimeter College, Clarkston, GA (Editor)
http://facstaff.gpc.edu/~pgore/geology/geo101/weather.htm.
Grim, R., Bray, R. and Bradley, W., 1937. The mica in agrillaceous sediments. American
Mineralogist, 22: 813-829.
Greene, R., Posner, A. and Quirk, J. 1978. A study of the coagulation of montmorillonite and
illite suspensions by calcium chloride using the electron microscope. In 'Modification
of Soil Structure' (Eds W. W. Emerson, R. D. Bond and A. R. Dexter) pp. 35-40. (John
Wiley: New York).
Grim, R., 1968. Clay Mineralogy. McGraw-Hill Book Company, New York, 596 pp.

139
Crooks, S., 1999. A mechanism for the formation of overconsolidated horizons within estuarine
floodplain alluvium: implications for the interpretation of Holocene sea-level curves,
in Floodplains: Interdisciplinary Approaches. p. 197-215 (Eds. Marriott S and
Alexander J, Geological Society, London, Special Publications 163).
Hamilton, A., Stagnitti, F., Xiong, X., Kreidl, S., Benke, K. and. Maher, P., 2007. Wastewater
irrigation: the state of play. Vadose zone journal, 6(4): 823-840.
Hart, P. and Speir, T., 1992. Agricultural and industrial effluents and wastes as fertilisers and
soil amendments in NewZealand, Fertilizer and Lime Research Centre, Massey
University, Palmerston North.
He, Y., Li, D., Velde, B. and Zhang G.‐L. , 2008. Clay minerals in a soil chronosequence
derived from basalt on Hainan Island China. Geoderma, 148: 206–212.
Helfferich, F., 1962. Ion Exchange. Mc. Graw Hill, New York.
Hendricks, S., Nelson, R. and Alexander, L., 1940. Hydration mechanism of the clay mineral
montmorillonite saturated with various cations. Journal of American Chemical Society,
62: 1457-1464.
Hinsinger, P., 2002. Potassium. In: R. Lal (Editor), Encyclopedia of Soil Science. Marcel
Dekker, Inc., New-York, USA.
Hinsinger, P., Jaillard, B. and Dufey, E., 1992. Rapid weathering of a trioctahedral Mica by the
roots of Ryegrass. Soil Science Society of America Journal, 56: 977–982.
Hosseinpur, A. and Kalbasi, M., 2001. Potassium Fixation and Charge Characteristics of Clay
in some Soils of Central and Northern Iran. JWSS - Isfahan University of Technology,
5 (3): 79-93.
Huang, P., 1989. Feldspars, Olivines, Pyroxenes, and Amphiboles. In: D. Weed (Editor),
Minerals in Soil Environments. SSSA, Madison, Wisconsin, USA, pp. 975-1050.
Huang, P., 2005. Chemistry of Potassium in Soils. Ed:Tabatabai, M. A.;Sparks, D. L.;Al-
Amoodi, L.;Dick, W. A. Chemical processes in soils, pp. 227-292.
Incitec Pivot Ltd., 2009. Potassium Factsheet. Incitec Pivot Limited (Editor):
www.pivot.com.au/zone_files/PDFs/Potassium_Factsheet.pdf.
International Potash Institute, 1987. Methodology in Soil-K Research; Proceeding of the 20th
Colloquium of the International Potash Institute, Baden bei Wien, Austria, IPI: Bern,
Switzerland.
Isbell, R., 1996. The Australian Soil Classification. CSIRO Australia, Collingwood.
Jackson, M. (Editor), 2005. Soil Chemical Analisys - Advanced Course. 2nd ed., rev. Parallel
Press, University of Wisconsin - Madison Libraries, Madison, Wis.
Jobbagy, E. and Jackson, R., 2001. The distribution of soil nutrients with depth: Global patterns
and the imprint of plants. Biogeochemistry, 53: 51–77.
Jobbagy, E. and Jackson, R., 2004. The uplift of soil nutrients by plants: biogeochemical
consequences across scales. Ecology, 85: 2380–2389.
Johnston, A., 2003. Understanding Potassium and Its Use in Agriculture. European Fertilizer
Manufacturers Association.
Juang, T. and Uehera, G., 1968. Mica genesis in Hawaiian soils. Soil Science Society of
America Proceedings, 32: 31–35.

140
Kafkafi, U., Xu, G., Imas, P., Magen, H. and Tarchitzky, J., 2001. Potassium and Chloride in
Crops and Soils: The Role of Potassium Chloride Fertilizer in Crop Nutrition,
International Potash Institute, Basel / Switzerland.
Keeley, G. and Quin, B., 1979. The effects of irrigation with meatworks-fellmongery effluent
on water quality in the unsaturated zone and shallow aquifer. Progress in Water
Technology, 11: 369–386.
Keren, R. and Shainberg, I. 1975. Water vapour isotherms and heat of immersion of Na/Ca-
montmorillonite system. I, homoionic clay. Clays and Clay Minerals, 23: 193-200.
Kuzila, M. and Lewis, D., 1993. Properties and genesis of loessial soils across a southcentral
Nebraska basin. Soil Science Society of America Journal, 57: 155–161.
Lado, M. and Ben-Hur, M., 2004. Soil mineralogy effects on seal formation, runoff and soil
loss. Applied Clay Science, 24: 209–224.
Lanson, B., 1990. Mise en évidence des mécanismes de transformation des interstratifiés
illite/smectite au cours de la diagenése: Ph.D. thesis, Univ. Paris 6-Jussieu, France, 366
p.
Lanson, B., Champion, D., 1991. The I/S-to-Illite Reaction in the Late stage Diagenesis.
American Journal of Science, 291: 473-506.
Lanson, B., 1992. Application de la décomposition des diffractogrammes de rayons-X á
l'identification des minéraux argileux: in Comptes-rendus du colloque rayons-X, Paris
1992, Siemens, ed., Val. 2.
Lanson, B. and Besson, G. 1992. Characterization of the end of smectite-to-illite
transformation: decomposition of the X-ray patterns. Clays and Clay Minerals, 40: 40-
52.
Lanson, B. and Velde, B. 1992. Decomposition of X-ray diffraction patterns: a convenient way
to describe complex diagenetic smectite-to-illite evolution. Clays and Clay Minerals,
40: 629-643.
Lanson, B., 1997. Decomposition of experimental X-ray diffraction patterns (profile fitting):
A convenient way to study clay minerals. Clays and Clay Minerals, 45: 132- 146.
Levine, A., Joffe, J., 1947. Fixation of potassium in relation to exchange capacity of soils:
mechanism of fixation. Soil Science, 63: 407-416.
Levy, G., and Van Der Watt, H., 1990. Effect of exchangeable potassium on the hydraulic
conductivity and infiltration rate of some South African soils. Soil Science, 149: 69-77.
Levy, G. and Torrento, J., 1995. Clay dispersion and macroaggregate stability as affected by
exchangeable potassium and sodium. Soil science, 160: 352–358.
Lewis, D., 1952. Ion Exchange Reactions of Clays. Clays and Clay Minerals, 1(1): 54-69.
Li, Z., Velde, B., Li, D., 2003. Loss of K-bearing clay minerals in flood-irrigated, rice-growing
soils in Jiangxi Province, China. Clays and Clay Minerals, 51(1): 75–82.
Lim, C., Jackson, M., Koons, R., and Helmke, P., 1980. Kaolins: Sources of Differences in
Cation-Exchange Capasities and Cesium Retention. Clays and Clay Minerals, 28/3:
223- 229.
Litchfield, W., 1951. Soil survey of the Waite Agricultural Research Institute, Glen Osmond,
South Australia, CSIRO Australia, Division of Soils, Divisional Report 2/51.

141
Mahjoory, R., 1975. Clay mineralogy, physical and chemical properties of some soils in arid
regions of Iran. Soil Science Society of America Journal, 39: 1157–1164.
Marchuk, A. and Rengasamy, P., 2011. Clay behaviour in suspension is related to the ionicity
of clay–cation bonds. Applied Clay Science, 53(4): 754-759.
Marchuk, A., 2013 “Effect of Cations on Structural Stability of Salt-affected Soils. PhD Thesis,
University of Adelaide, Australia, 167p.
Marchuk, S., Rengasamy, P. and Churchman, J. 2012. Cation exchange as influenced by the
type of cations in different clay minerals. In: Churchman, G., R. Cresswell, R., and B.
Singh (eds.) (Proceeding of the Australian Regolith and Clays Conference, Mildura).
Mariotti, A., 1982. Apports de la geochimie isotopique a la connaissance du cycle de l’azote.
These de Doctorat de l’Universite´ Paris VI.
Marschner, H., 1995. Mineral nutrition of higher plants. Academic Press, London.
McAfee, J., 2005. Potassium, A key Nutrient for Plant Growth.
http://jimmcafee.tamu.edu/files/potassium%20a%20key%20nutrient%20for%20plant
%20growth.pdf
McLaren, R. and Smith, C., 1996. Issues in the disposal of industrial and urban wastes. In:
R.S.K. R. Naidu, D.P. Oliver, S. Rogers, M.J. McLaughlin (Editor), Contaminants and
the Soil Environment in the Australasia Pacific Region. Kluwer, Dordrecht.
McLean, E. and Watson, M., 1985. Soil measurements of plant-available potassium. In:
Potassium in agriculture, ed RD Munson, American Society of Agronomy – Crop
Science Society of America – Soil Science Society of America Madison WI pp 277–
308.
Mengel, K., Kirkby, E., Kosegarten, H. and Appel, T., 2001. Principles of plant nutrition, 5th
edn. Kluwer Academic Publishers Dordrecht Netherlands
Meunier, A. and Velde, B., 2004. Illite / Origins, Evolution and Metamorphism. Springer.
Meunier, A., 2005. Clays. Springer Berlin Heidelberg, Berlin.
Ming, D., 1989. Zeolites in Soils. In: D. Weed (Editor), Minerals in Soil Environments. SSSA,
Madison, Wisconsin, USA, pp. 873-911.
Mohr, E. and van Baren, F., 1954. Tropical soils. Van Hoerve, The Hague.
Mooney, R., Keenan, A. and Wood, L., 1952. Adsorption of water vapour by montmorillonite.
II. Effect of exchangeable ions and lattice swelling as measured by X-ray diffraction.
Journal of American Chemical Society, 74: 1371-1374.
Moore, D. and Reynolds, R., 1997. X-ray Diffraction and the Identification of Clay Minerals,
2nd edition. (Oxford University Press, New-York, USA)
Mortland, M., Lawton, K. and Uehara, G., 1956. Alteration of biotite to vermiculite by plant
growth. Soil Science, 82: 477–481.
Mumpton, F. and Sheppard, R., 1972. Zeolites. Geotimes, 17: 16-17.
Munson, R., 1985. Potassium in Agriculture. ASA/CSSA/SSSA, Madison, Wisconcin, USA.
Murashkina M.A., Southard R.J., Pettygrove G.S. (2007): Silt and fine sand fractions dominate
K fixation in soils derived from granitic alluvium of the San Joaquin Valley, California.
Geoderma, 141: 283–293

142
Najafi-Ghiri, M. and Abtahi, A., 2013. Potassium Fixation in Soil Size Fractions of Arid Soils.
Soil & Water Resources, 8(2): 49–55
Nater, E., 2000. The 2:1 Phyllosilicates. Regents of the University of Minnesota (Editor)
http://www.soils.umn.edu/academics/classes/soil5311/Lectures/notes/two-to-
one_phyllosilicates.html.
Nelson, W., 1968. Plant factors affecting potassium availability and uptake. In: The role of
potassium in agriculture, eds VJ Kilmer SE Younts & NC Brady, ASA-CSSA-SSSA
Madison WI, pp. 355–383.
Nelson, P., Baldock, J. and Oades, J. 1998. Changes in dispersible clay content, organic carbon
content, and electrolyte composition following incubation of sodic soil. Australian
Journal of Soil Research, 36: 883–897.
Nettleton, W., Nelson, R. and Flach, K., 1973. Formation of mica in surface horizons of dryland
soils. Soil Science Society of America Proceedings, 37: 473–478.
Norrish, K. and Pickering, J., 1977. Clay mineralogic properties.In "Soil Factors in Crop
Production in a Semiarid Environment" (Eds J. S. Russell and E. L. Greacen.) pp. 31-
53. (University of Queensland Press: St. Lucia, Qld.).
Norrish, K. and Pickering, J., 1983. Clay minerals. In: CSIRO (Editor), Soils: an Australian
viewpoint. CSIRO/Academic Press, Melbourne, pp. 281-334.
Öborn, I., Andrist-Rangel, Y., Askekaard, M., Grant, C., Watson, C. and Edwards, A., 2005.
Critical aspects of potassium management in agricultural systems. Soil Use and
Management, 21: 102–112.
Oades, J. and Waters, A., 1991. Aggregate Hierarchy in Soils. Australian Journal of Soil
Research, 29: 815-828.
Officer, S., Tillman, R., Palmer, A. and Whitton, J., 2006. Variability of clay mineralogy in
two New Zealand steep-land topsoils under pasture. Geoderma, 132: 427–440.
Oh, N. and Richter, D., 2005. Elemental translocation and loss from three highly weathered
soil-bedrock profiles in the southeastern United States. Geoderma, 126: 5–25.
Oster, J., 2008. Potassium Impacts on Soil Physical Properties,
http://esce.ucr.edu/oster/slphynote/note04.html. 10.04.2015
Parfitt, R. and Kimble, J., 1989. Conditions for formation of allophane in soils. Soil Science
Society of America Journal, 53: 971-977.
Passioura, J., 1991. Soil structure and plant growth. Australian Journal of Soil Research, 29:
717–728.
Peacock, B., 1999. Potassium in Soils and Grapevine Nutrition The University of California
Cooperative Extension, Tulare County.
Pevear, D., Goldin, A. and Spragur, J., 1984. Mineral transformations in soils formed in
glacialmarine drift, Northwestern Washington Soil Science Society of America
Journal, 48: 208–216.
Pieri, L., Bitteli, M., Rossi Pisa, P., 2006. Laser diffraction, transmission electron microscopy
and image analysis to evaluate a bimodal Gaussian model for particle size distribution
in soils. Geoderma, 135: 118–132.

143
Powers, K., Brown, S., Krishna, V., Wasdo, S., Moudgil, B. and Roberts, S., 2006. Research
Strategies for Safety Evaluation of Nanomaterials. Part VI. Characterization of
Nanoscale Particles for Toxicological Evaluation. Toxicological Science, 90: 296-303.
Prokoshev, V., 2005. The Place and Importance of Potassium in Agroecosystem. Russian
Chemical Journal, XLIX(3): 35-43.
Quirk, J. and Schofield, R., 1955. The Effect of Electrolyte Concentration on Soil
Permeability. European Journal of Soil Science, 6: 163-178.
Quirk, J. 1978. Some physico-chemical aspects of soil structural stability: a review. In
'Modification of Soil Structure'. (Eds W. W. Emerson, R. D. Bond and A. R. Dexter.)
pp. 3-16. (John Wiley: New York.)
Radoslovich, E., 1951. Soil Colloids of Several Adelaide Red-Brown Earths, CSIRO
Divisional Report, 9/51. Adelaide.
Rangel, Y., 2008. Quantifying Mineral Sources of Potassium in Agricultural Soils. PhD Thesis,
Swedish University of Agricultural Sciences, Uppsala, 103 pp.
Raven, M., 1990. XPLOT version 1.48e user manual. Manipulation of X-ray diffraction data.
CSIRO Division of Soils Technical Report No. 24/1990.
Rayment, G., Lyons, D., 2011. Soil Chemical Methods-Australasia. (Collingswood: CSIRO
Publishing)
Reeve, R., Bower, C., Brooks, R. and Gschwend, F., 1954. A comparison of the effects of
exchangeable sodium and potassium upon the physical condition of soils. Soil Science
Society of America Proceedings, 18: 130–132.
Rehm, G. and Schmitt, M., 2002. Potassium for crop production. Regents of the University of
Minnesota (Editor). http://mn4h.com/distribution/cropsystems/DC6794.html.
Reitemeier, R., 1951. The chemistry of soil potassium. Advances in Agronomy, 3: 113-164.
Reitemeier, R., 1957. Soil Potassium and Fertility, The Yearbook of Agriculture. Library
Science, Amor Way, Letchworth Garden City, Herts, SG6 1ZA. UK.
Rengasamy, P. and Olsson, K., 1991. Sodicity and soil structure. Australian Journal of Soil
Research, 29: 935-952.
Rengasamy, P. and Sumner, M., 1998. Processes Involved in Sodic Behaviour. In: Sumner,
M.E., Naidu, R. (Eds.), Sodic Soils. Distribution, Properties, Management, and
Environmental Consequences. pp. 35-50. (New York Press., New York)
Rengasamy, P. 2002a. Clay Dispersion. In: McKenzie, B.M., Coughlan, K., Cresswell, H.
(Eds.), Soil Physical Measurement and Interpretation for Land Evaluation. pp. 200-210.
(CSIRO Publishing, Collingwood)
Rengasamy, P. 2002b. Clay dispersion. In 'Soil physical measurement and interpretation for
land evaluation'. pp. 200–210. (Eds BM McKenzie, et al., CSIRO Publishing)
Rengasamy, P. and Marchuk, A., 2011. Cation ratio of soil structural stability (CROSS). Soil
Research, 49: 280-285.
Reynolds, R., Jr. 1985. NEWMOD: A computer program for the calculation of one-
dimensional diffarction patterns of mixed-layered clays. R.C. Reynolds, 8 Brook Rd.,
Hanover, New Hampshire, USA

144
Rich, C., 1968. Mineralogy of Soil Potassium. In: V. Kilmer, S. Younts and N. Brady (Editors),
The Role of Potassium in Agriculture. ASA/CSSA/SSSA, Madison, Wisconsin, USA.
Richards, G., McLean, E., 1963. Potassium fixation release by clay minerals soil clays on
wetting and drying. Soil Science, 95: 308-314.
Righi, D., Velde, B. and Meunier, A., 1995. Clay stability in clay dominated soil systems. Clay
Minerals, 30: 45–54.
Righi, D., Elsass, F., 1996. Characterization of soil clay minerals: decomposition of X-Ray
diffraction diagrams and high resolution electron microscopy. Clays and Clay Minerals,
44: 791-800.
Ruhe, R., 1984. Soil climate system across the prairies in Midwestern USA. Geoderma, 34:
201–219.
Russell, W., 1973. Soil Conditions and Plant Growth. LONGMAN, London, 849 pp.
Sandler, A., Meunier, A., Velde, B. 2015 Mineralogical and chemical variability of mountain
red/brown Mediterranean soils. Geoderma, 239–240: 156–167.
Sawhney, B., Jackson, M. and Corey, R., 1959. Cation exchange capacity determination of
soils as influenced by the cation species. Soil Science, 87 (9): 243-248.
Scherer, H., Goldbach, H. and Clemens, J., 2003. Potassium dynamics in the soil and yield
formation in a long-term field experiment. PLANT SOIL ENVIRON, 49(12): 531–535.
Schimansky, C., 1981. Die Aufnahme von 28Mg, 86Rb und 45Ca durch Gerstenpflanzen bei
unterschiedlichen Wurzeltemperaturen. Zeitschrift fur Pflanzenernahrung und
Bodenkunde, 144: 356–365.
Schneider, A., 1997. Influence of soil solution Ca concentration on short-term K release and
fixation of a loamy soil. European Journal of Soil Science, 48: 513-522.
Schroeder, D. 1976 Structure and weathering of potassium containing minerals. In: Potassium
in the Soil/Plant Root System. International Potash Institute Research Topics No. 5. , p
5-26.
Schulze, D., 1989. An Introduction to Soil Mineralogy. In: D. Weed (Editor), Minerals in Soil
Environments. SSSA, Madison, Wisconsin, USA, pp. 1-34.
Semb, G., Sorteberg, A. and Øien, A., 1959. Investigations on Potassium Available in Soils
Varying in Texture and Parent Material. Acta Agriculturae Scandinavica, 9(3): 229-
252.
Shainberg, I., Keren, R., Alperovitch, N. and Goldstein, D., 1987. Effects of exchangeable
potassium on hydraulic conductivity of smectite-sand mixture. Clays and Clay
Minerals, 35: 305-310.
Simonsson, M., Hillier, S. and Öborn, I., 2009. Changes in clay minerals and potassium fixation
capacity as a result of release and fixation of potassium in long-term field experiments.
Geoderma, 151: 109-120.
Sivakugan, N., 2001. Basic Structural Units of Clay Minerals. In: claymin.ppt (Editor), Power
Point. James Cook University, Townsville. Australia.
Smiles, D. and Smith, C., 2004. A survey of the cation content of piggery effluents and some
consequences of their use to irrigate soils. Australian Journal of Soil Research, 42:
231–246.

145
Smith, C., Oster, J. and Sposito, G. 2015 Potassium and magnesium in irrigation water quality
assessment. Agricultural Water Management 157: 59–64
Sparks, D., 1987. Potassium dynamics in soils. Advances in soil sciences, 6: 1-63.
Sparks, D. and Huang, P., 1985. Physical Chemistry of Soil Potassium. In: R.D. Munson
(Editor), Potassium in Agriculture. ASA/CSSA/SSSA, Madison, Wisconsin, USA, pp.
201-276.
Spiers, G., Dudas, M., Muehlenbachs, K. and Turchenek, L., 1984. Mineralogy and oxygen
isotope geochemistry of clays from surficial deposits in the Athabasca Tar Sands area.
Canadian Journal of Earth Sciences, 21: 53–60.
Sposito, G., 2008. The Chemistry of Soils, Oxford University Press, New York.
Springob, G., 1999. Blocking the Release of Potassium from Clay Interlayers by Small
Concentrations of NH4+ and Cs+. European Journal of Soil Science, 50: 665-674.
Springob, G. and Richter, J., 1998. Measuring interlayer potassium release rates from soil
materials. I. Critical evaluation on the use of resin and other batch procedures for
determining kinetic data Z. Pflanzenernaehr. Bodenkd, 161: 315-322.
Środoń, J. and Eberl, D., 1984. Illite. Reviews in Mineralogy and Geochemistry, 13(1): 495-
544.
Środoń, J., 2006. Identification and quantitative analysis of clay minerals. In: Bergaya, F.,
Theng, B.K.G., Lagaly, G. (Eds.), Handbook of Clay Science. Elsevier.
Stace, H. et al., 1968. A Handbook of Australian Soils. RELLIM, Glenside, South Australia.
Stewart, J., 1985. Potassium source, use and potential. In: R.D. Munson (Editor), Potassium in
Agriculture. ASA/CSSA/SSSA, Madison, WI, pp. 83-98.
Stitcher, H., 1972. Potassium in allophane and zeolites, Potash Inst.
Sumner, M., 1993. Sodic soils - New perspectives. Australian Journal of Soil Research, 31:
683-750.
Syers, J., 1998. Soil and Plant Potassium in Agriculture York, UK.
Teppen, B. and Miller, D., 2005. Hydration energy determines isovalent cation exchange
selectivity by clay minerals. Soil Science Society of America Journal, 70: 31–40.
Tessier, D., Lajudie, A. and Petit, J-C., 1992. Relation between the macroscopic behaviour of
clays and their microstructural properties. Applied Geochemistry, Suppl. Issue No 1:
151-161.
Tice, K., Graham, R. and Wood, H., 1996. Transformations of 2:1 phyllosilicates in 41- year-
old soils under oak and pine. Geoderma, 70: 49–62.
Tripler, C., Kaushal, S., Likens, G. and Walter, M., 2006. Patterns in K dynamics in forest
ecosystems. Ecology Letters, 9: 451–466.
van Olphen, H., 1971. Amorphous Clay Materials. Science, New Series, 171: 91-92.
Velde, B., (Editor), 1992. Introduction to Clay Minerals. Chapman & Hall, 198 pp.
Velde, B., 1995. Origin and Mineralogy of Clays: Clays and the environment. Springer, Berlin,
334 pp.
Velde, B. 2001. Clay minerals in the agricultural horizon of loams and silt loams in the Central
United States. Clay Minerals, 36: 277-294.

146
Velde, B. and Peck, T., 2002. Clay mineral changes in the morrow experimental plots,
University of Illinois. Clays and Clay Minerals, 50: 364–370.
Velde, B., Goffé, B. and Hoellard, A., 2003. Evolution of clay minerals in a chronosequence
of poldered sediments under the influence of a natural pasture development. Clays and
Clay Minerals, 51: 205–217.
Velde, B. and Meunier, A., 2008. Clay Minerals in Soils and Weathered Rocks. Springer Berlin
Heidelberg, Berlin.
Velde, B. and Barré, P., 2010. Soils, Plants and Clay Minerals. Springer.
Volk, N., 1934. The fixation of potash in difficultly available form in soils. Soil Science, 37(4):
267-287
Wada, K. and Harada, Y., 1969. Effects of salt concentration and cation species on the
measured cation-exchange capacity of soils and clays. In: L. Heller (Editor), Proc. Int.
Clay Conf., Tokyo, pp. 561–571.
Wada, K., 1977. Allophane and imogolite. In: J.B.a.W. Dixon, S.B. (Editor), Minerals in Soil
Environments. SSSA, Madison, Wisc, pp. 603–638.
Wada, K., 1989. Allophane and Imogolite. In: D. Weed (Editor), Minerals in Soil
Environments. SSSA, Madison, Wisconsin, USA, pp. 1051-1087.
Wada, K., 1995. Structure and formation of non- and para-crystalline aluminosilicate clay
minerals: a review. , In ‘Proceedings 10th International Clay Conference', Adelaide, pp.
443-448.
Wang, J., Harrell, D. and Bell, P., 2004. Potassium Buffering Characteristics of Three Soils
Low in Exchangeable Potassium. Soil Science Society of America Journal, 68: 654–
661.
Walker, G., 1950. Trioctahedral minerals in the soil-clays of North-East Scotland.
Mineralogical Magazine, 29: 72-84.
Wilson, M. and Wilson, L. 2014. Clay mineralogy and shale instability: an alternative
conceptual analysis. Clay Minerals, 49: 127-145.
Yong, R., Sethi, A., 1977, “Turbidity and zeta potential measurements of clay dispersibility”,
Dispersive Clays, Related Piping, and Erosion in Geotechnical Projects, ASTM STP
623, J.L. Sherard and R.S. Decker, Eds. pp. 419–431. (American Society for Testing
and Materials).
Yong, R., Nakano, M. and Pusch, R., 2012. Review of Environmental Soil Properties and
Behaviour. (Boca Raton, FL: CRC Press, Taylor & Francis Group).
Zettlemoyer, A., Young, E. and Chessick, J., 1955. Studies of the surface chemistry of silicate
minerals – III. Heat of immersion of bentonite in water. Journal Physical Chemistry,
59: 962-966.