The Drama of Urban America Since 1950 in Three Acts – or ... · The Drama of Urban America Since...
43
The Drama of Urban America Since 1950 in Three Acts – or Is It Four? RSAI Plenary Session November, 2009 John F. McDonald Roosevelt University Includes excerpts from Urban America: Growth, Crisis, and Rebirth, M.E. Sharpe, 2007.
Transcript of The Drama of Urban America Since 1950 in Three Acts – or ... · The Drama of Urban America Since...

The Drama of Urban America Since 1950 in Three Acts – or Is It Four?
RSAI Plenary SessionNovember, 2009
John F. McDonaldRoosevelt University
Includes excerpts from Urban America: Growth, Crisis, and Rebirth, M.E. Sharpe, 2007.

Urban America: Growth, Crisis and Rebirth
• Period of Growth: 1950-1970Growth, with the Great Migration. But trouble was brewing, especially in the Northeast and LA. Watts Riot of 1965 announced the end of Act 1.
• Period of Urban Crisis: 1970-1990The Great Migration ends. Myrdal’s vicious circle is at work.
• Period of Rebirth: 1990 - ??Act 3 does not begin with a “bang.” Has a virtuous circle been at work?

US Population(millions) 48 States plus DC
1950 1970 1990 2000 2008US Total 151 202 247 280 303
Growth 34% 22% 13% 8%US Black 15 23 30 35 39
Growth 50% 33% 16% 12%Northeast 87 111 117 125 128
Growth 27% 5% 7% 3%N’east Black 5 10 13 15 15
Growth 106% 27% 12% 6%

Population
1950 1970 1990 2000 2008South 44 58 79 94 125
Growth 32% 38% 18% 33%South Black 10 11 14 17 19
Growth 12% 33% 20% 14%West 20 34 51 61 69
Growth 72% 52% 20% 12%West Black .6 1.7 2.8 3.0 3.9
Growth 194% 159% 9% 30%

U.S. Population Projections
2000 282 mil.2010 309 9.6%2020 336 8.7%2030 364 8.3%2040 392 7.7%2050 420 7.1%
U.S. Census Bureau, 2004, “U.S. Interim Projections…”

Poverty Rates in the US
1949 1960 1970 1980 1990 2000 2008All persons 40% 22% 13% 13% 13% 11% 13%Blacks 77% 55% 34% 33% 32% 22% 25%Hispanics 65% na 23%* 26% 28% 22% 23%Persons infemale hh 62% 49% 38% 37% 37% 28% 31%
Blacks in female hh na 71% 59% 53% 51% 39% 40%
* Figure for 1972Data for 1949 from Iceland (2006).

“An American Dilemma” in 1950
Gunnar Myrdal’s (1944) landmark study, cited by the Nobel Prize committee, documented the desperate state of the black population –especially in the South.
Migration of blacks from the South in 1940s – 1.7 million (11% of entire black population). Black population of South was 9.4 mil. in 1940 and just 9.5 mil. in 1950.

Chapter 1The Period of Urban Growth: 1950-1970
Summary of US Economic Growth: 1950-70- Population growth: 151 to 202 million (34%)- Baby boom, 1946-64 76.4 million born- GDP per capita growth: 60.4%- Employment growth 45.2 to 70.9 million (56%)- Median family income growth 99.4%- Change in composition of the economy
Employment in goods-production 40.0% to 36.1%Share would decline to 28.4% in 1980,
22.8% in 1990Manufacturing employment 33.7% to 27.3%

Improvements in the Quality of Life
- Higher levels of educationAdults, High-school graduates in 1950 49%Adults, High-school graduates in 1970 76%
- New houses- Automobiles- Suburbanization- Consumer products: TV, washers and dryers,
dishwashers, vacuum cleaners, electric ranges, refrigerators, Polaroid camera, frozen foods, new fibers, vinyl floors, transistor radios, stereo systems,…

The Great Migration: 1950 - 1970
• The black population of the Northeast more than doubled, from 4.96 mil. to 10.23 mil.
• Black population of the South grew by only 12%, from 9.52 mil. to 10.65 mil. The black population of the South continued to respond to the economic and social opportunities in the Northeast.
• Black population of the West increased from 0.6 mil. to 1.7 mil.

Northeastern Urban Areas Included in the Study
New York BaltimoreChicago Minneapolis-St. PaulPhiladelphia BuffaloDetroit CincinnatiBoston MilwaukeePittsburgh Kansas CitySt. Louis IndianapolisCleveland ColumbusWashington, DC

Statistical Results for 16 Northeastern Metro Areas1950-1970 (excluding DC)
• EMPGRO = 159.6 – 1.37 MFG% – 9.84 LNPOPR square = .39
• POPGRO = 157.5 – 0.79 MFG% – 11.70 LNPOPR square = .28; MFG not statistically significant
• CCPOPGRO = -23.35 + 0.41 POPGRO + 5.21 AREA%R square = .60

Growth of Urban Areas in the Northeast(Means for 17 urban areas)
• Urban area population 46%
• Urban area employment 43%• Manufacturing employment 18%
• Median family income 89%
• Central city population -2% Exclude Milw., KC, Indy, Colum. -13%
(added land area)

Suburbanization: 1950-70
Causes of Suburbanization- Population growth; cities build out more than up.- Income and wealth growth = houses, cars, privacy- Spacious living vs. easy access tradeoff- Inexpensive land at urban fringe- Freeway systems reduce commuting costs (Baum-Snow,
QJE, 2007)- Low cost of construction (balloon frame)- Mortgage insurance (FHA, VA), interest tax deduction- Employment location shifts, especially manufacturing

Signs of Trouble Ahead
• Growth and Segregation of the Black Population1950 1960 1970
Percent black in central city 14 22 29Segregation index for c.c. 89 87 84Percent of black pop. in c.c. 82
• Housing QualityBlacks occupy more substandard housing – lacking plumbing or dilapidated
• The poor pay more

More Signs of Trouble Ahead
• Housing prices: Rapid growth of black population drove up prices and rents in the black submarket, until the supply side of the market responded in the 1970s.
• Blacks faced discrimination in the ability to own a home.
• Employment discrimination, which includesDe facto school segregation; discrimination in job training, job search, placement, pay, and promotion; and last hired – first fired.

Kenneth Clark’s “Dark Ghetto”
Clark attempts to understand the combined problems of the confined black population and the problems of the slum, the psychological pathologies that result from lack of opportunity and power to change one’s status.
Selective list of chapters and their topics- Social dynamics of the ghetto; economic and social
decay, housing decay, under-employment, family instability
- Pathology of the ghetto; emotional illness, homicide and suicide, delinquency, drug addiction
- Ghetto schools; separate and unequal, defeatism

Watts August 11, 1965
• Alleged act of police brutality• Rioting lasted 5 days, 34 killed, at least 1000 wounded, property
damage of $200 million, 35,000 black people took part, violence over 46.5 sq. miles, 16,000 police and National Guardsmen need to quell.
• McCone Commission reportMany thought that problems in LA were less acute.Blamed riot on migrants unprepared for urban life (Black population in LA went from 75,000 in 1940 to 650,000 in 1965.), spiral of failure in schools, delays in federal programs, advocates of disorder.
• McCone Commission called riot senseless, but surveys showed thatmany black people thought otherwise.
• August 12, 1965; smaller riot on west side of Chicago.

The Great Society
• Civil Rights Act of 1964 (EEOC• Voting Rights Act of 1965• Elementary and Secondary Education School Act, 1965• Manpower Act, 1965• Medicare• Dept. of Housing and Urban Development Act, 1965• Law Enforcement Assistance Act, 1965• Amendment to Immigration and Nationality Act, 1965• Department of Transportation, 1966• Model Cities, 1966• Fair Housing Act, 1968 (Title VIII of Civil Rights Act)• Expansion of ADC

The Urban Riots
• 752 riots from 1964 to 1971• 1968 was peak year, with 289 riots• 228 killed, including 83 in 1967 and 66 in 1968• Biggest riots; Detroit (1967), LA (1965), Newark (1967)• Severe riot incidence related to size of black population
and region (lower in South), had precipitating incident.• Consequences of riots were severe in both housing and
labor markets and long-lasting.• Kerner Commission blamed discrimination in
employment, education, and housing; Black in-migration with white exodus; ghetto conditions.

Chapter 2The Years of Urban Crisis: 1970-90
• Slow population growth at metro level• Population decline in central city, move to suburbs• Filtering in housing market; huge declines in some
neighborhoods• Decline in employment of central city residents• Decline in median family income for central city• Increasing central city poverty rate• Increasing concentration of poverty• Crime, which generates more suburbanization• One-parent families• The Underclass

Change in the Northeastern Urban Areas1970-1990
(Means for 17 urban areas)
Metro AreaPopulation growth, 1970-90 5.6%Employment growth, 1970-90 30%Median family income growth, 1970-90 7.3%
Central CitiesPopulation change, 1970-90 -17%Poverty: 14.7% in 1970,
21.2% in 1990Black population: 29% in 1970
37% in 1990

Regression Results for 17 Northeastern Urban Areas: 1970-90
EMPGRO = 87.41 – 2.14 MFG70% R sq. = .56
EMPGRO – POPGRO = 48.10 – 0.91 MFG70%R sq. = .70
INCOMEGRO = 34.04 – 0.99 MFG70%R sq. = .65
∆CCPOV = -3.45 + 0.35 MFG70% R sq. = .59
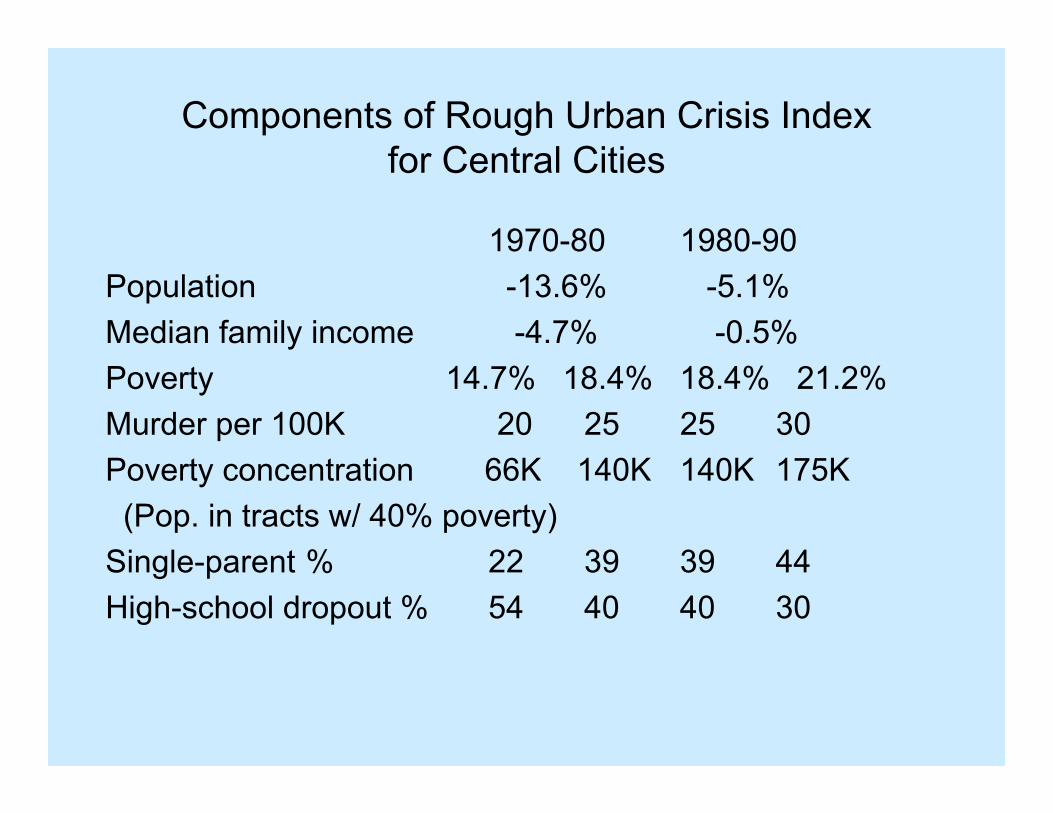
Components of Rough Urban Crisis Indexfor Central Cities
1970-80 1980-90Population -13.6% -5.1%Median family income -4.7% -0.5%Poverty 14.7% 18.4% 18.4% 21.2%Murder per 100K 20 25 25 30Poverty concentration 66K 140K 140K 175K (Pop. in tracts w/ 40% poverty)
Single-parent % 22 39 39 44High-school dropout % 54 40 40 30

Correlations Among Urban Crisis VariablesNortheastern Central Cities in 1980
Murder HS One Poverty Dropouts Parent Rate
HS Dropouts .60
One-parent .58 .54
Poverty Rate .60 .81 .76
Concentrated .46 .77 .76 .73Poverty
All statistically significant at 95% level.

“New” Urban Scholarship
• Urban Economics and the Urban CrisisBasic theory, and studied specific urban problemsDid not produce comprehensive analysis of urban crisisFocus on housing, sidetracked by Tiebout hypothesisSome notable exceptions; J. Kain most prominent
• Urban Sociology and the Urban UnderclassEducation and Coleman ReportFamily structure and Moynihan ReportCrimeWilliam J. Wilson and the Underclass

Tangle of Pathologies (Wilson)Vicious Circle (Myrdal)
• Reaction to Moynihan Report discouraged research• William J. Wilson revived the field in 1978 with The Truly
Disadvantaged: The Inner City, the Underclass, and Public Policy.
• Wilson defined the black underclass as people who live in high-poverty areas; lack education, training, and employment; are dependent on welfare. Some engage in crime or other aberrant behavior.
• Wilson’s tangle of pathologies – increases in crime, drug addiction, out-of-wedlock births, female-headed families, welfare dependency. Concentration makes it all worse.

Chapter 3Urban Rebirth: Basic Causes
• Evolution of urban areaTransformation of economy slows downReaction to expressway system slows
• Responses to urban crisisFederal policy changesUrban government improves (esp. NY City)Community organizations
• Exogenous factorsStrong economyMigrationDecline in crime

Urban Rebirth after 1990:A Catalog of Causes
Adjustments completed (expressways, transition to service economy)
Strong economy, productivity growthRenovation of central cityCentral city governments improvePopulation growth, migration from abroadCrime declineCommunity-based organizationsFederal policies: Laws outlaw racial discrimination,
LIHTC, EITC, welfare reform, change in public housing policy

Northeastern Metropolitan Areas1990-2000
Population growth 8%
Employment growth 7%
Median family income growth 6%
MFIGRO = 2.43 + 0.56 EMPGRO R sq. = .65

Northeastern Central Cities: 1990-2000(Means for 17 cities)
Population change -2% (-3% excl. Columbus)
Median family income +1.3%Poverty rate 21.2% to 20.6%Murder rate 30 to 20 per 100KConcentrated poverty 175K to 129KSingle-parent families 44 to 51%High school dropouts 30 to 26%

“Rebirthers” in the 1990s and Others
• New York (80s) Others• Chicago Philadelphia• Detroit Boston (?)• Pittsburgh St. Louis• Cleveland Washington DC• Minn. – St. Paul Baltimore• Cincinnati Buffalo• Milwaukee• Kansas City• Indianapolis• Columbus

What Do You Mean Detroit?Are You Nuts?
NY Chicago Philly DetroitPop. Change 9.4% 4.0% -4.3% -7.5%Income Ch. (med.) -2.7% 3.4% -8.6% 17.1%*Poverty Rate +1.9% -2.0% +1.4% -6.5%Murder Rate -22 -9 -10 -16Pop. in Hi Pov Area -15K -178K -1K -313KOne-Parent Fam. +2.8% +.7% +7.7% +2.1%Hi School Dropouts -4% -6% -7% -8%Rebirth Index 0 +6 -2 +5-
(* Two points awarded.)

Urban Rebirth in the Northeast: 1990-2000
• Employment growth seems to be the critical factor.
• Ten of 17 urban areas had urban rebirth indexes of +2 or more, 8 were +3 or more. Chicago was +6, tied with Minneapolis-St. Paul for best score.
• New York did well in 80s, but lack of empl. growth in 1990s held it back.
• Metro employment growth in those ten was 10.5%, while employment growth was just 2.6% in the other seven.

The Decade of the 00sIs This Chapter 4?
• Recession and 9/11• “Jobless” recovery• Greenspan bets on housing• Housing price bubble and collapse• Subprime lending – foreclosures hit central cities• Recession starts in Dec. 2007, 7 million jobs lost• How far down are the cities?• Can the cities come back? Will they?
Time will tell…

William J. Wilson’s Opinion
“The notable reduction in the number of high-poverty neighborhoods and the substantial decrease in the population of such neighborhoods may simply be blips of economic booms rather than permanent trends. Unemployment and individual poverty rates have increased since 2000, and we have every reason to assume that concentrated poverty rates are on the rise again…”
W. J. Wilson, More Than Just Race, 2009, p. 59.Written before the crash of 2008.

Population Change: 2000-2008Metro Area and Central City
New York 3.73% 4.45% M. St. P. 8.79 -1.04Chicago 5.89 -1.48 Buffalo -3.93 -7.51Phil. 2.66 -4.68 Cincinnati 5.22 .60Detroit -.56 -4.20 Milwaukee 3.20 1.17Boston 3.01 3.40 KC 9.04 2.26Pittsburgh -3.29 -7.46 Indy 12.46 2.05St. Louis 6.74 1.72 Columbus 9.92 6.19Cleveland -2.79 -9.21Wash DC 11.72 3.50 Mean 4.49 -.73Baltimore 4.51 -2.15

Metro and Central City Population Change2000-2008
CCPopGro = -3.92 + 0.71 MSAPopGroR Sq. = .63
Break even for central city is at MSA population growth of 5.52%.
Seven MSAs had population growth above 5.52%(but cities of Chicago and Minn.–St. Paul still lost population).

Employment in Metro Areas
2000 2006 2008 2000 2006 2008New York 8392 8456 8610 Balt. 1251 1307 1315 Chicago 4571 4520 4529 M SP 1748 1787 1784Philly 2744 2800 2810 Buff. 559 546 552Detroit 2205 2003 1899 Cincy 1017 1037 1043Boston 1749 1674 1715 Milw. 868 851 852Pittsburgh 1147 1137 1149 KC 981 994 1018St. Louis 1338 1350 1358 Indy 853 902 914Cleveland 1136 1075 1059 Colum. 915 932 941Wash DC 2132 2391 2432

Crime in Central Cities: Murder Rates for 1990, 2000 and 2008
New York 31 9 6 Minn-St.P. 17 14 12Chicago 31 22 18 Buffalo 11 13 14Philly 32 22 23 Cincy 14 4 22Detroit 57 41 34 Milwaukee 25 21 12Boston 25 7 10 KC 28 25 25Pittsburgh 10 11 23 Indy 12 12 14St. Louis 45 36 47 Columbus 14 10 14Cleveland 33 14 23Wash DC 78 42 31 Mean 30 20 20Baltimore 41 40 11

What May Be Ahead?Studies Say -- College Graduates
1970 2000 1970 2000New York 12 29 Baltimore 10 29Chicago 12 30 Minn-StP 14 33Philly 11 28 Buffalo 10 23Detroit 9 23 Cincy 10 25Boston 15 40 Milwaukee 11 27Pittsburgh 9 24 KC 11 28St. Louis 10 25 Indy 10 26Cleveland 10 23 Columbus 13 29Wash DC 22 42 Mean 12 28(data for metro areas)

How Will We Know?
• Exogenous forcesForeclosure wave concentrated in central cityDeep recession - recovery – when and where?
• Continuation of trends in urban areasNeighborhood and downtown revitalization
• Policy responsesNeighborhood stabilization programFederal support for housingWill there be more federal support for state and local
government and any for commercial real estate? Immigration reform?

Why This is not a Replay of the 1970s
• 1970s came immediately after- Riots- Opening of expressway systems
• 1970s saw the end of the Great Migration; slow population growth in Northeast.
• 1970s had the explosion in crime in cities.• 1970s had devastating drop in manufacturing.So, the we don’t have the same incentive to move
to the suburbs and disinvest in the central city.