The DRAM Market - Smithsonian Institution
35
1996 F ACTS 1997 FORECAST Market Size: $25,130 million Market Size: $21,485 million Shipments: 2,762 million Shipments: 3,064 million ASP: $9.10 ASP: $7.01 OVERVIEW Dynamic random access memory or DRAM is the main memory component of most computers and many electronic systems. From 1993-1995, industry observers were stunned and amazed as the DRAM market displayed relentless growth. Helping the DRAM market grow at its acceler- ated pace was the lack of sufficient memory production capacity available to meet the needs of the vigorous PC market. In 1996, a different scenario panned out for the DRAM market and its suppliers. In 1Q96, DRAM prices for 4Mbit devices plunged and continued to drop through the balance of the year. Furthermore, 16Mbit DRAM average selling prices (ASPs) also rapidly declined. Softer PC sales and a rather sudden glut of worldwide production capacity turned the DRAM market from one of the most lucrative to one of most difficult in which to participate. For 1997, ICE anticipates another soft year for the DRAM market. Although unit demand will remain strong and bit volume will continue to grow nicely, excess capacity will further erode aver- age selling prices. This will keep the market from growing at the rapid pace it experienced just a few years ago. THE DRAM MARKET The DRAM market has been through many up and down cycles as shown in Figure 2-1, but few suppliers recalled demand being so strong over such a long period of time as during the recent past few years. For the already huge DRAM market to grow by such large percentages over a sev- eral year period was quite remarkable. INTEGRATED CIRCUIT ENGINEERING CORPORATION 2-1 2 THE DRAM MARKET
Transcript of The DRAM Market - Smithsonian Institution
1996 FACTS 1997 FORECAST
Market Size: $25,130 million Market Size: $21,485 million
Shipments: 2,762 million Shipments: 3,064 million
ASP: $9.10 ASP: $7.01
OVERVIEW
Dynamic random access memory or DRAM is the main memory component of most computersand many electronic systems. From 1993-1995, industry observers were stunned and amazed asthe DRAM market displayed relentless growth. Helping the DRAM market grow at its acceler-ated pace was the lack of sufficient memory production capacity available to meet the needs of thevigorous PC market.
In 1996, a different scenario panned out for the DRAM market and its suppliers. In 1Q96, DRAMprices for 4Mbit devices plunged and continued to drop through the balance of the year.Furthermore, 16Mbit DRAM average selling prices (ASPs) also rapidly declined. Softer PC salesand a rather sudden glut of worldwide production capacity turned the DRAM market from oneof the most lucrative to one of most difficult in which to participate.
For 1997, ICE anticipates another soft year for the DRAM market. Although unit demand willremain strong and bit volume will continue to grow nicely, excess capacity will further erode aver-age selling prices. This will keep the market from growing at the rapid pace it experienced just afew years ago.
THE DRAM MARKET
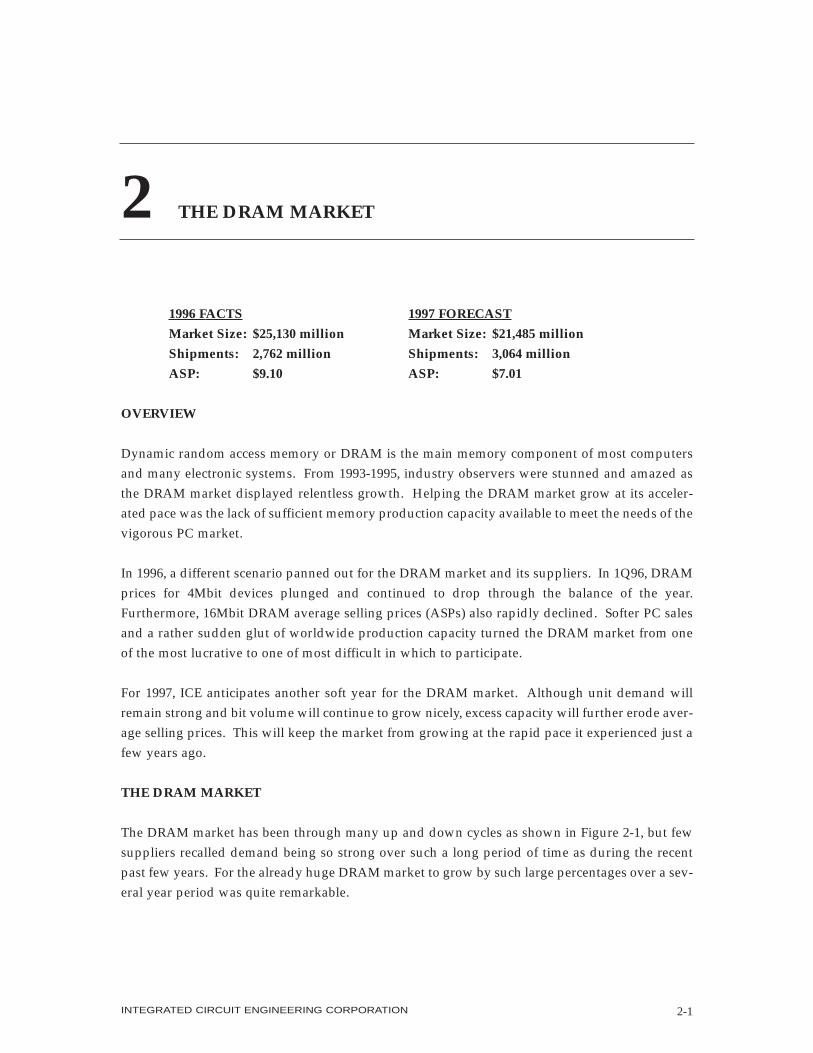
The DRAM market has been through many up and down cycles as shown in Figure 2-1, but fewsuppliers recalled demand being so strong over such a long period of time as during the recentpast few years. For the already huge DRAM market to grow by such large percentages over a sev-eral year period was quite remarkable.
INTEGRATED CIRCUIT ENGINEERING CORPORATION 2-1
2 THE DRAM MARKET
However, as the graph shows, good times don’t last forever. Excess capacity and plunging aver-age selling prices resulted in a 38 percent decline in the 1996 DRAM market. Following that dis-astrous year, there is good news and bad news.
The bad news is that ICE forecasts another double-digit decline in for the 1997 DRAM market (–15percent). Back to back double-digit declines would be a first for the DRAM market. The goodnews is that recent DRAM market history shows that negative growth has lasted one or, at themost, two years, while positive growth periods have been three or four-plus years in duration. Atthe end of these growth spurts, the DRAM industry has always greatly increased in size.
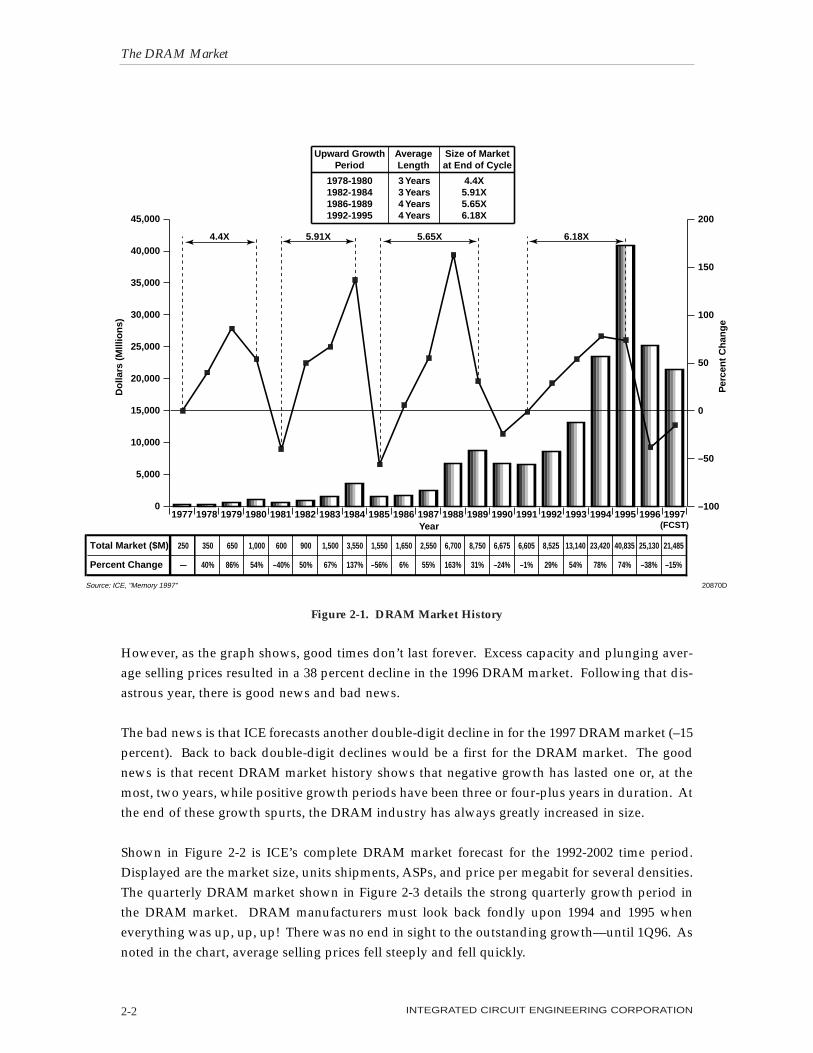
Shown in Figure 2-2 is ICE’s complete DRAM market forecast for the 1992-2002 time period.Displayed are the market size, units shipments, ASPs, and price per megabit for several densities.The quarterly DRAM market shown in Figure 2-3 details the strong quarterly growth period inthe DRAM market. DRAM manufacturers must look back fondly upon 1994 and 1995 wheneverything was up, up, up! There was no end in sight to the outstanding growth—until 1Q96. Asnoted in the chart, average selling prices fell steeply and fell quickly.
The DRAM Market
INTEGRATED CIRCUIT ENGINEERING CORPORATION2-2
Do
llars
(M
Illio
ns)
Per
cen
t C
han
ge
Year
20870DSource: ICE, "Memory 1997"
Total Market ($M)
Percent Change
350
40%
250
—
650
86%
1,000
54%
600
–40%
900
50%
1,500
67%
3,550
137%
1,550
–56%
1,650
6%
2,550
55%
6,700
163%
8,750
31%
6,675
–24%
6,605
–1%
8,525
29%
13,140
54%
23,420
78%
40,835
74%
25,130
–38%
21,485
–15%
Upward GrowthPeriod
AverageLength
Size of Marketat End of Cycle
1978-19801982-19841986-19891992-1995
3 Years3 Years4 Years4 Years
4.4X5.91X5.65X6.18X
4.4X 5.91X 5.65X 6.18X
(FCST)
0
5,000
10,000
15,000
20,000
25,000
30,000
35,000
40,000
45,000
199719961995199419931992199119901989198819871986198519841983198219811980197919781977–100
–50
0
50
100
150
200
Figure 2-1. DRAM Market History
The DRAM Market
INTEGRATED CIRCUIT ENGINEERING CORPORATION 2-3
64Kbit Units (M)
ASP ($)
Price Per Mbit ($)
Market ($M)
256Kbit Units (M)
ASP ($)
Price Per Mbit ($)
Market ($M)
1Mbit Units (M)
ASP ($)
Price Per Mbit ($)
Market ($M)
4Mbit Units (M)
ASP ($)
Price Per Mbit ($)
Market ($M)
16Mbit Units (M)
ASP ($)
Price Per Mbit ($)
Market ($M)
64Mbit Units (M)
ASP ($)
Price Per Mbit ($)
Market ($M)
128Mbit Units (M)
ASP ($)
Price Per Mbit ($)
Market ($M)
256Mbit Units (M)
ASP ($)
Price Per Mbit ($)
Market ($M)
512Mbit Units (M)
ASP ($)
Price Per Mbit ($)
Market ($M)
1Gbit Units (M)
ASP ($)
Price Per Mbit ($)
Market ($M)
Total Market ($M)
Total Units (M)
ASP ($)
30
1.33
20.29
40
272
1.80
6.87
490
827
4.50
4.29
3,720
145
16.05
3.83
2,328
0.1
275.00
16.39
28
—
—
—
—
—
—
—
—
—
—
—
—
—
—
—
—
—
—
—
—
6,605
1,274
5.18
4
1.45
22.13
6
197
1.70
6.48
335
822
3.01
2.87
2,470
457
11.72
2.79
5,355
2
180.00
10.73
360
—
—
—
—
—
—
—
—
—
—
—
—
—
—
—
—
—
—
—
—
8,525
1,482
5.75
—
—
—
—
107
1.80
6.87
193
596
3.10
2.96
1,848
776
11.91
2.84
9,240
20
93.00
5.54
1,860
—
—
—
—
—
—
—
—
—
—
—
—
—
—
—
—
—
—
—
—
13,140
1,499
8.77
—
—
—
—
64
2.15
8.22
139
500
3.60
3.43
1,800
1,254
12.00
2.86
15,048
103
61.85
3.69
6,371
0.1
575.00
8.57
63
—
—
—
—
—
—
—
—
—
—
—
—
—
—
—
—
23,420
1,921
12.19
—
—
—
—
32
2.00
7.63
65
463
3.00
2.86
1,388
1,649
12.85
3.06
21,190
333
54.41
3.24
18,135
0.25
225.00
3.35
56
—
—
—
—
—
—
—
—
—
—
—
—
—
—
—
—
40,833
2,477
16.48
—
—
—
—
23
1.95
7.44
44
260
2.85
2.72
741
1,498
5.31
1.27
7,955
974
16.11
0.96
15,691
7
100.35
1.50
697
—
—
—
—
—
—
—
—
—
—
—
—
—
—
—
—
25,130
2,762
9.10
—
—
—
—
15
2.00
7.63
30
187
2.56
2.45
479
958
2.39
0.57
2,295
1,800
7.39
0.44
13,310
103
51.94
0.77
5,371
—
—
—
—
—
—
—
—
—
—
—
—
—
—
—
—
21,485
3,064
7.01
—
—
—
—
—
—
—
—
145
2.40
2.29
348
835
2.00
0.48
1,670
2,100
6.51
0.39
13,671
460
2,600
0.39
11,960
0.1
405.00
3.02
41
0.1
600.00
2.24
60
—
—
—
—
—
—
—
—
27,750
3,540
7.84
—
—
—
—
—
—
—
—
100
2.30
2.19
230
615
1.80
0.43
1,107
1,750
5.80
0.35
10,150
1,300
16.00
0.24
20,800
4
155.70
1.16
623
5
325.00
1.21
1,625
0.1
700.00
1.30
70
—
—
—
—
34,605
3,774
9.17
—
—
—
—
—
—
—
—
45
2.25
2.15
101
350
1.65
0.39
578
1,700
5.25
0.31
8,925
2,100
10.00
0.15
21,001
45
65.00
0.48
2,925
80
140.00
0.52
11,200
5
300.00
0.56
1,350
—
—
—
—
46,080
4,325
10.66
1991 1992 1993 1994 1995 1996 1997 1998 1999 2000 2001
—
—
—
—
—
—
—
—
25
2.20
2.10
55
250
1.55
0.37
388
1,480
4.90
0.29
7,252
2,800
7.25
0.11
20,300
125
33.00
0.25
4,125
375
73.00
0.27
27,375
15
155.00
0.29
2,325
0.1
700.00
0.65
70
61,890
5,070
12.21
2002
—
—
—
—
—
—
—
—
10
2.25
2.15
23
125
1.50
0.36
188
1,200
4.75
0.28
5,700
3,000
6.75
0.10
20,250
100
24.00
0.18
2,400
1,100
40.00
0.15
44,000
65
94.00
0.18
6,110
12
350.00
0.33
4,200
82,870
5,612
14.7718838E Source: ICE, "Memory 1997"
Figure 2-2. DRAM Market Forecast

It appears the overall DRAM market stabilized in the latter half of 1996 and into 1Q97. While themarket did stabilize, ICE forecasts further erosion of the market in 1997, but at a much moregradual pace.
The total DRAM market for the period 1992-2002 is shown in Figure 2-4. Following four years ofoutstanding growth, the long-anticipated “recovery” in the market hit in 1996. ICE forecasts thatit will take the DRAM market a few more years (to the year 2000) to be at least the size it was in1995. From 1997 to the year 2002, ICE forecasts the DRAM market to have a cumulative averageannual growth rate of 31 percent.
Excess capacity will remain a fact of life for the DRAM suppliers in 1997. The potential for pricewars will continue as companies seek to grow or maintain their share of the market. As the decadecloses, however, ICE believes DRAM supply and demand will be better balanced. Early into the2000’s, ICE forecasts that demand will once again outstrip supply, causing the market to grow atan accelerated pace.
The DRAM Market
INTEGRATED CIRCUIT ENGINEERING CORPORATION2-4
DollarsUnitsASP
Mill
ion
s o
f U
nit
s, D
olla
rs
AS
P (
$)
20881ASource: ICE, "Memory 1997"
0
2,000
4,000
6,000
8,000
10,000
12,000
14,000
1Q974Q963Q962Q961Q964Q953Q952Q951Q954Q943Q942Q941Q940.00
2.00
4.00
6.00
8.00
10.00
12.00
14.00
16.00
18.00
20.00
4,432
417
10.63
5,365
460
11.66
6,277
502
12.50
7,346
542
13.55
8,015
578
13.87
9,545
602
15.86
10,805
626
17.26
12,468
671
18.58
9,969
629
15.85
5,946
630
9.44
4,570
743
6.15
4,645
760
6.11
4,582
789
5.81
Market ($M)
Units (M)
ASP ($)
Quarter/Year
Figure 2-3. Quarterly DRAM Market

Displayed in Figure 2-5 is the DRAM market by density. In terms of dollar volume, the 16Mbitdensity was the largest in 1996 and is forecast to remain the biggest market in 1997 and 1998.However, ICE believes that market demand for the 64Mbit generation will develop in 1997 andgrow rapidly to challenge the 16Mbit market beginning in 1998. Meanwhile, the 4Mbit density isforecast to quietly slip closer to the obsolete phase in the product lifecycle—a distant “memory”of a grand time in the DRAM market.
DRAM UNIT SHIPMENTS
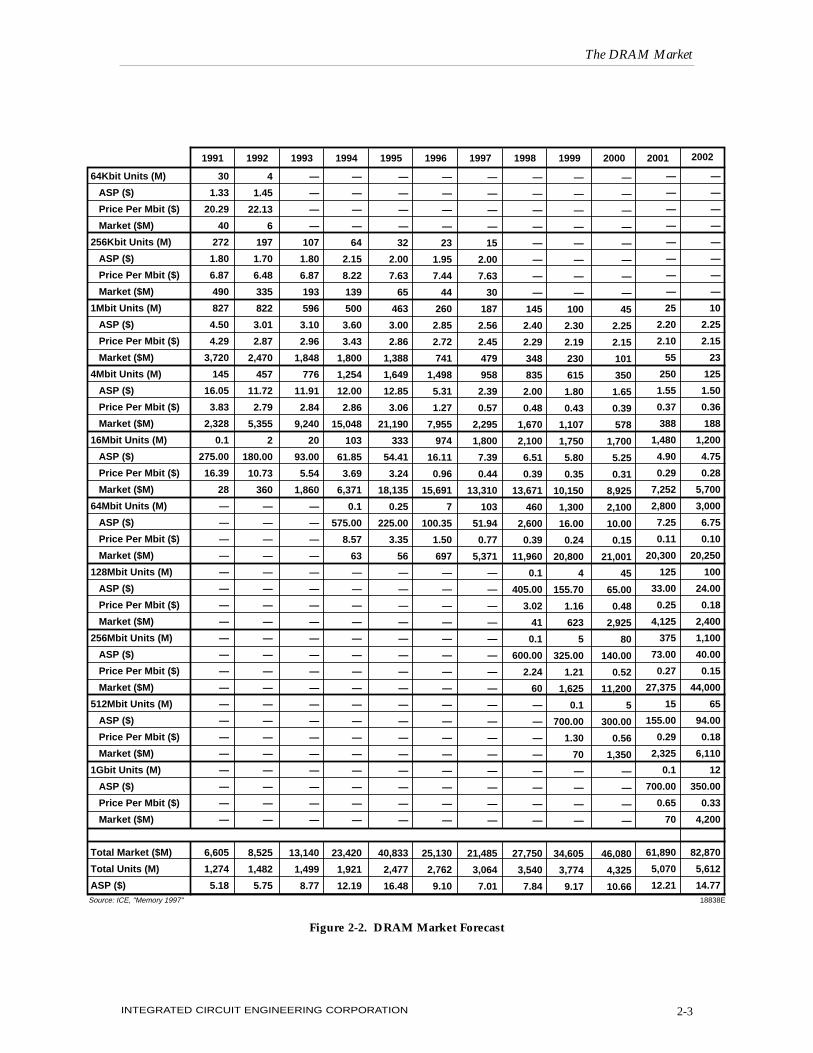
Shown in Figure 2-6 are quarterly DRAM shipments beginning in 1994 and continuing through1Q97. During the 13-quarter span, total DRAM shipments increased 89 percent. 4Mbit devices,which accounted for 61 percent of total shipments in 1Q94, represented 36 percent of shipmentsin 1Q97. Meanwhile, shipments of DRAMs with densities greater than 4Mbit grew rapidly inthe last three quarters shown. In 1Q97, these devices accounted for 57 percent of total DRAMunit shipments.
The DRAM Market
INTEGRATED CIRCUIT ENGINEERING CORPORATION 2-5
Do
llars
(M
illio
ns)
Per
cen
t C
han
ge
Year
18857ESource: ICE, "Memory 1997"
0
10,000
20,000
30,000
40,000
50,000
60,000
70,000
80,000
90,000
20022001200019991998199719961995199419931992
–40
–20
0
20
40
60
80
Total Market ($M)
Percent Change
8,525
29
13,140
54
23,420
74
40,833
74
25,130
–38
21,485
–15
27,750
29
34,605
25
46,080
33
61,890
34
82,870
34
Total Market
Percent Change
Figure 2-4. DRAM Market Growth

Total DRAM unit shipments for the 1992-2002 time period are displayed in Figure 2-7. With theexception of 1993 when units increased a mere one percent, shipments of DRAMs grew wellthrough the first part of the 1990’s. From 1997-2002 units shipments are forecast to average annualgrowth of 13 percent.
DRAM shipments by density are graphed in Figure 2-8. Despite its dwindling market size, 4Mbitunits continued to be a popular selection among system designers in 1996—and for good reason.Although they started 1996 priced around $11.50, 4Mbit DRAMs ended the year priced at $2.55!
The DRAM Market
INTEGRATED CIRCUIT ENGINEERING CORPORATION2-6
0
10,000
20,000
30,000
40,000
50,000
60,000
70,000
80,000
90,000
������������������������������������������������������������������������������������������������������������������������������������������������������������������������������������������������������������������������������������������������������������������������������������������������������������������������������������������������������������������������������������������������������������������������������������������������������������������������������������������������������������������������������������������������������������������������������������������������������������������������������������������������������������������������������������������������������������������������������������������������������������������������������������������������������������������������������������������������������������������������������������������������������������������������������������������������������������������������������������������������������������������������������������������������������������������������������������������������������������������������������������������������������������������������������������������������������������������������������������������������������������������
������������������������������������������������������������������������������������������������������������������������������������������������������������������������������������������������������������������������������������������������������������������������������������������������������������������������������������������������������������������������������������������������������������������������������������������������������������������������������������������������������������������������
����������������������������������������������������������������������������������������������������������������������������������������������������������������������������������������������������������������������������������������������������������������������������������������������������������������������������������������������������������������������������������������������������������������������������������������������������������
������������������������������������������������������������������������������������������������������������������������������������������������������������������������������������������������������������������������������������������������������������������������������������������������������������������������������������������������������������������������������������������
������������������������������������20022001200019991998199719961995199419931992
Year
Do
llars
(M
illio
ns)
20880BSource: ICE, "Memory 1997"
64Kbit
256Kbit
1Mbit
4Mbit
16Mbit
64Mbit
128Mbit
256Mbit
512Mbit
1Gbit
Total Market ($M)
—
—
23
188
5,700
20,250
2,400
44,000
6,110
4,200
82,870
6
335
2,470
5,355
360
—
—
—
—
—
8,525
—
193
1,848
9,240
1,860
—
—
—
—
—
13,140
—
139
1,800
15,048
6,371
63
—
—
—
—
23,420
—
65
1,388
21,190
18,135
56
—
—
—
—
40,834
—
44
741
7,955
15,691
697
—
—
—
—
25,128
—
30
479
2,295
13,310
5,371
—
—
—
—
21,485
—
—
348
1,670
13,671
11,960
41
60
—
—
27,750
—
—
230
1,107
10,150
20,800
623
1,625
70
—
34,605
—
—
101
578
8,925
21,001
2,925
11,200
1,350
—
46,080
—
—
55
388
7,252
20,300
4,125
27,375
2,325
70
61,890
������
������
���
���
���
����
������
Figure 2-5. Dollar Volume of Select DRAM Densities
With low pricing, designers employed these devices in great numbers in their systems.Consumers, who long awaited to upgrade the memory in their PCs also took advantage of thetremendously lower prices for 4Mbit DRAMs. As a result, unit shipments at this density remainedwell over one billion pieces during 1996.
A big jump in 16Mbit shipments is forecast for 1997. Nearly all the major Japanese and Koreanvendors ramped their output of this density to supply the world’s needs.
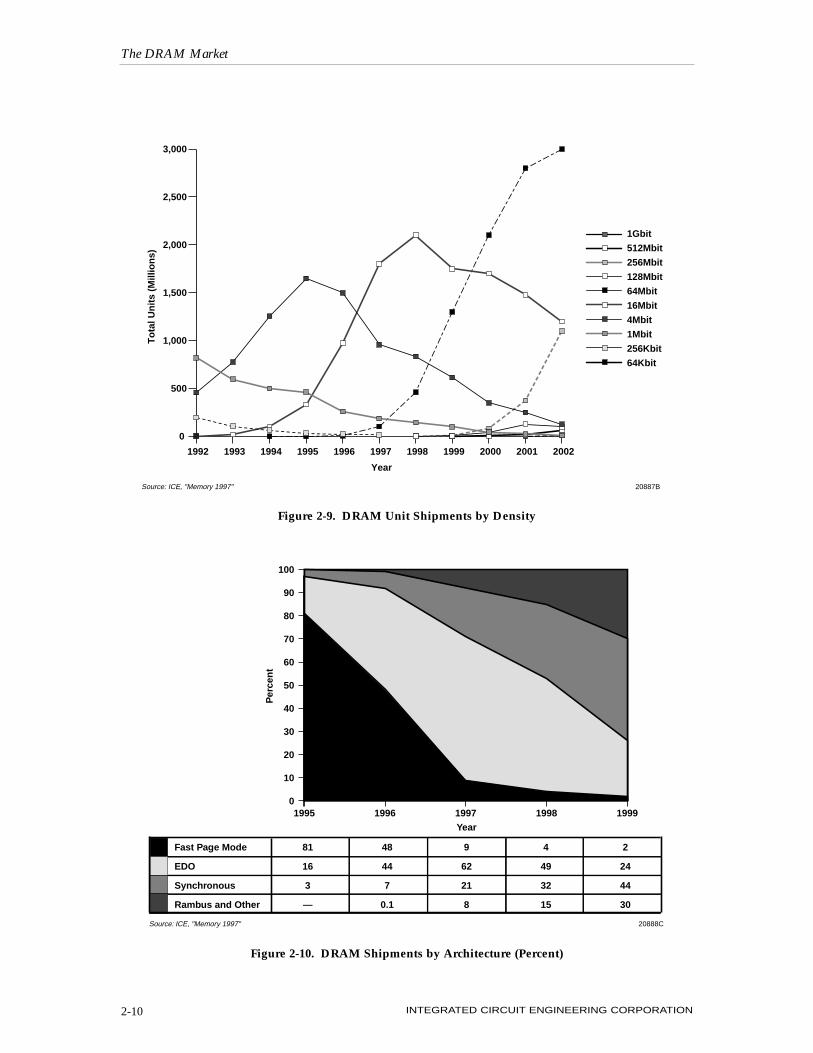
Figure 2-9 provides a look at the typical lifecycle curve for DRAM unit shipments. The 1Mbit den-sity took a long, slow decline on its way out of the market spotlight after peaking in 1991. 4Mbitshipments peaked in 1995, more than doubling the highest yearly 1Mbit output. Perhaps morethan any other generation to date, 4Mbit DRAMs enjoyed more time in the “spotlight,” which isthe mature/saturation phase of the product lifecyle.
16Mbit devices ramped up in 1996 and will be followed by the 64Mbit generation in 1997/1998.ICE forecasts that shipments of 16Mbit DRAMs will peak in 1998 and that 64Mbit devices will topout early in the next century. Whether by a few hundred million or several hundred million units,each successive DRAM generation ships more than its predecessor.
The DRAM Market
INTEGRATED CIRCUIT ENGINEERING CORPORATION 2-7
0
100
200
300
400
500
600
700
800
���������������������������������������1Q974Q963Q962Q961Q964Q953Q952Q951Q954Q943Q942Q941Q94
Quarter/Year
20
135
253
9
417
17
128
292
23
460
14
122
335
31
502
12
115
375
40
542
11
124
393
50
578
8
122
407
65
602
7
114
417
88
626
6
76
388
160
629
6
103
432
130
671
5
68
365
192
630
6
62
406
268
743
5
54
340
361
760
5
52
284
448
789
≤256Kbit
1Mbit
4Mbit
≥4Mbit
Total Units (M)
Un
its
(Mill
ion
s)
20885ASource: ICE, "Memory 1997"
���������
Figure 2-6. Quarterly DRAM Shipments by Density

Unit Shipments by Architecture
Until recently, all DRAMs were made using the same fast-page mode (FPM) architecture.However, FPM devices can no longer keep pace with faster microprocessors, and, consequently,hamper overall system performance.
As a result of FPM DRAM’s inability to keep pace with high-speed microprocessors, and sincealmost three-fourths of all DRAMs wind up in PC systems with high-speed microprocessors,DRAM architectures have changed. Though there are numerous revolutionary and evolutionaryalternatives (reviewed in Section 7), three main architectures emerged that appear likely to con-tend for the largest share of 1997 and 1998 DRAM shipments. Figure 2-10 shows the three—extended data out (EDO) DRAM, synchronous DRAM (SDRAM), and Rambus DRAM—and howICE believes the market will be divided among these different architectures in the coming years.
The DRAM Market
INTEGRATED CIRCUIT ENGINEERING CORPORATION2-8
Total Units (M)
Percent Change
5,612
11
1,482
16
1,499
1
1,921
28
2,477
29
2,762
11
3,064
11
3,540
16
3,774
7
4,325
15
5,070
17
Year
Un
its
(Mill
ion
s)
Per
cen
t C
han
ge
0
1,000
2,000
3,000
4,000
5,000
6,000
200220012000199919981997199619951994199319920
5
10
15
20
25
30
20006CSource: ICE, "Memory 1997"
Total Units (M)
Percent Change
Figure 2-7. DRAM Unit Shipments

Most leading DRAM manufacturers curtailed production of their fast-page mode DRAMs in 1995and 1996 and now manufacture DRAMs based on EDO and SDRAM technology. EDO is a rea-sonably cheap and easy upgrade from fast page mode DRAMs. They represented a marginalimprovement over fast-page mode devices. While useful, the market for these devices was short-lived. Furthermore, the investment required to make further marginal performance gains in EDOmemory has made it impractical to continue using it in new PC platforms. As a result, the indus-try witnessed the transition from EDO to synchronous DRAM in 1996.
Initially, SDRAMs were tagged with a 10-15 percent price premium compared to a similarly pack-aged and configured EDO DRAM. That price premium will be essentially non-existent by thesecond half of 1997.
The DRAM Market
INTEGRATED CIRCUIT ENGINEERING CORPORATION 2-9
0
1,000
2,000
3,000
4,000
5,000
6,000
������������������������������������������������������������������������������������������������������������������������������������������������������������������������������������������������������������������������������������������������������������������������������������������������������������������������������������������������������������������������������������������������������������������������������������������������������������������������������������������������������������������������������������������������������������������������������������������������������������������������������������������������������������������������������������������������������������������������������������������������������������������������������������������������������������������������������������������������������������������������������������������������������������������������������������������������������������������������������������������������������������������������������������������������������������������������������������������������������������������������������������������������������������������������������������������������������������������������������������������������������������������������������������������������������������
������������������������������������������������������������������������������������������������������������������������������������������������������������������������������������������������������������������������������������������������������������������������������������������������������������������������������������������������������������������������������������������������������������������������������������������������������������������������������������������������������������������������������������������������������������������������������������������������������������������������������������������������������������������������������������������������������������������������������������������������������������������������������������������������������������������������
������������������������������������������������������������������������������������������������������������������������������������������������������������������������������������������������������������������������������������������������������������������������������������������������������������������������������������������������������������������������������������������������������������������������������������������������������������������������������������������������������������������������������������������������������������������������������������������������������������������������������������������������������������������������������������������������������������������������������������������
������������������������������������������������������������������������������������������������������������������������������������������������������������������������������������������������������������������������������������������������������������������������������������������������������������������������������������������������������������������������������������������������������������������������������������������������������������������������������������������������������������������������
������������������������������������������������������������������������
20022001200019991998199719961995199419931992Year
Un
its
(Mill
ion
s)
20886BSource: ICE, "Memory 1997"
64Kbit
256Kbit
1Mbit
4Mbit
16Mbit
64Mbit
128Mbit
256Mbit
512Mbit
1Gbit
Total Market (M)
—
—
10
125
1,200
3,000
100
1,100
65
12
5,612
4
197
822
457
2
—
—
—
—
—
1,482
—
107
596
776
20
—
—
—
—
—
2,981
—
64
500
1,254
103
0.1
—
—
—
—
1,921
—
32
463
1,649
333
0.3
—
—
—
—
2,477
—
23
260
1,498
974
7
—
—
—
—
2,762
—
15
187
958
1,800
103
—
—
—
—
3,063
—
—
145
835
2,100
460
0.1
0.1
—
—
3,540
—
—
100
615
1,750
1,300
4
5
0.1
—
3,774
—
—
45
350
1,700
2,100
45
80
5
—
4,325
—
—
25
250
1,480
2,800
125
375
15
0.1
5,070
������
������
���
���
���
����
������
Figure 2-8. Unit Volume of Select DRAM Densities
The DRAM Market
INTEGRATED CIRCUIT ENGINEERING CORPORATION2-10
0
500
1,000
1,500
2,000
2,500
3,000
20022001200019991998199719961995199419931992
Year
To
tal U
nit
s (M
illio
ns)
20887BSource: ICE, "Memory 1997"
1Gbit
512Mbit
256Mbit
128Mbit
64Mbit
16Mbit
4Mbit
1Mbit
256Kbit
64Kbit
Figure 2-9. DRAM Unit Shipments by Density
Figure 2-10. DRAM Shipments by Architecture (Percent)
Fast Page Mode
EDO
Synchronous
Rambus and Other
81
16
3
—
48
44
7
0.1
9
62
21
8
4
49
32
15
2
24
44
30
0
10
20
30
40
50
60
70
80
90
100
19991998199719961995
Per
cen
t
Year
Source: ICE, "Memory 1997" 20888C
The transition from EDO to SDRAMs may be a bumpy one for suppliers and buyers alike. Forsuppliers, the process of converting today’s DRAM fabs to manufacture SDRAMs has been some-what difficult, which may delay the supply of parts just as demand is heating up. Meanwhile,some memory IC buyers indicated that initial qualification of an SDRAM vendor was difficult,apparently since SDRAM specifications varied from vendor to vendor. These are problems thatwill undoubtedly be resolved with time, but which initially made for a less-than-ideal transitionto SDRAMs.
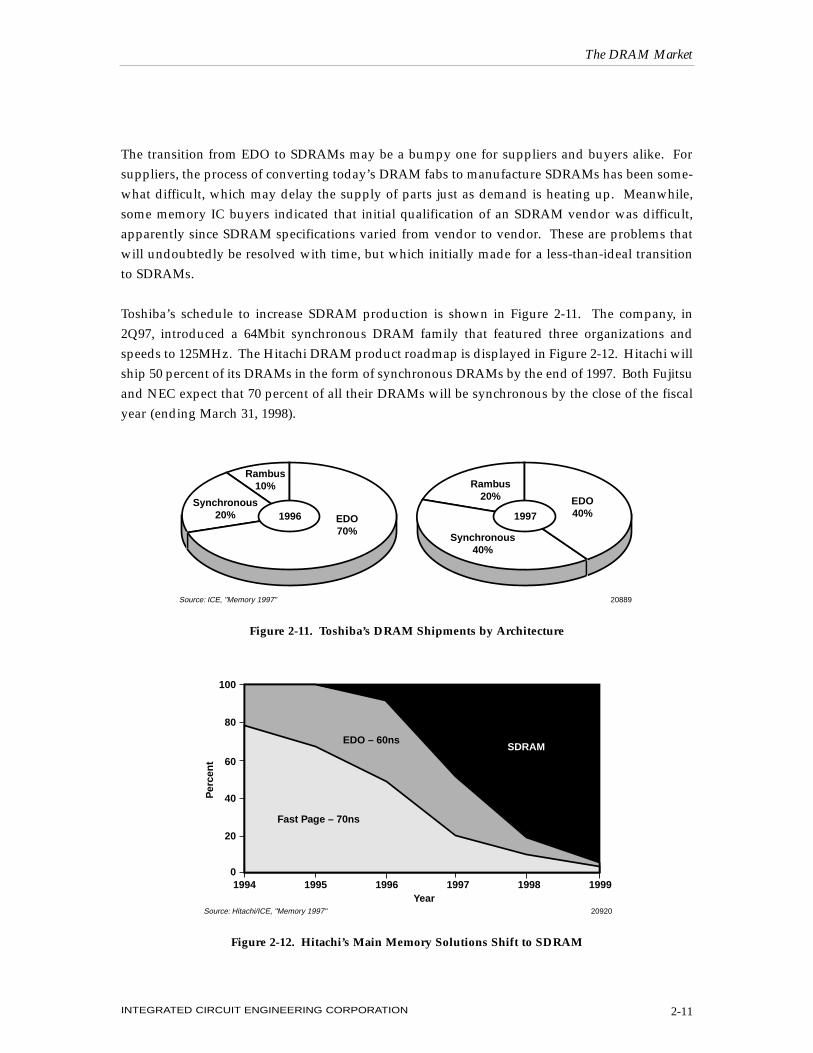
Toshiba’s schedule to increase SDRAM production is shown in Figure 2-11. The company, in2Q97, introduced a 64Mbit synchronous DRAM family that featured three organizations andspeeds to 125MHz. The Hitachi DRAM product roadmap is displayed in Figure 2-12. Hitachi willship 50 percent of its DRAMs in the form of synchronous DRAMs by the end of 1997. Both Fujitsuand NEC expect that 70 percent of all their DRAMs will be synchronous by the close of the fiscalyear (ending March 31, 1998).
The DRAM Market
INTEGRATED CIRCUIT ENGINEERING CORPORATION 2-11
Rambus10%
Synchronous20% EDO
70%
20889Source: ICE, "Memory 1997"
1996
Rambus20%
Synchronous40%
EDO40%1997
Figure 2-11. Toshiba’s DRAM Shipments by Architecture
Figure 2-12. Hitachi’s Main Memory Solutions Shift to SDRAM
100
80
60
40
20
01994 1995 1996 1997 1998 1999
Year
Per
cen
t
Source: Hitachi/ICE, "Memory 1997" 20920
Fast Page – 70ns
EDO – 60nsSDRAM
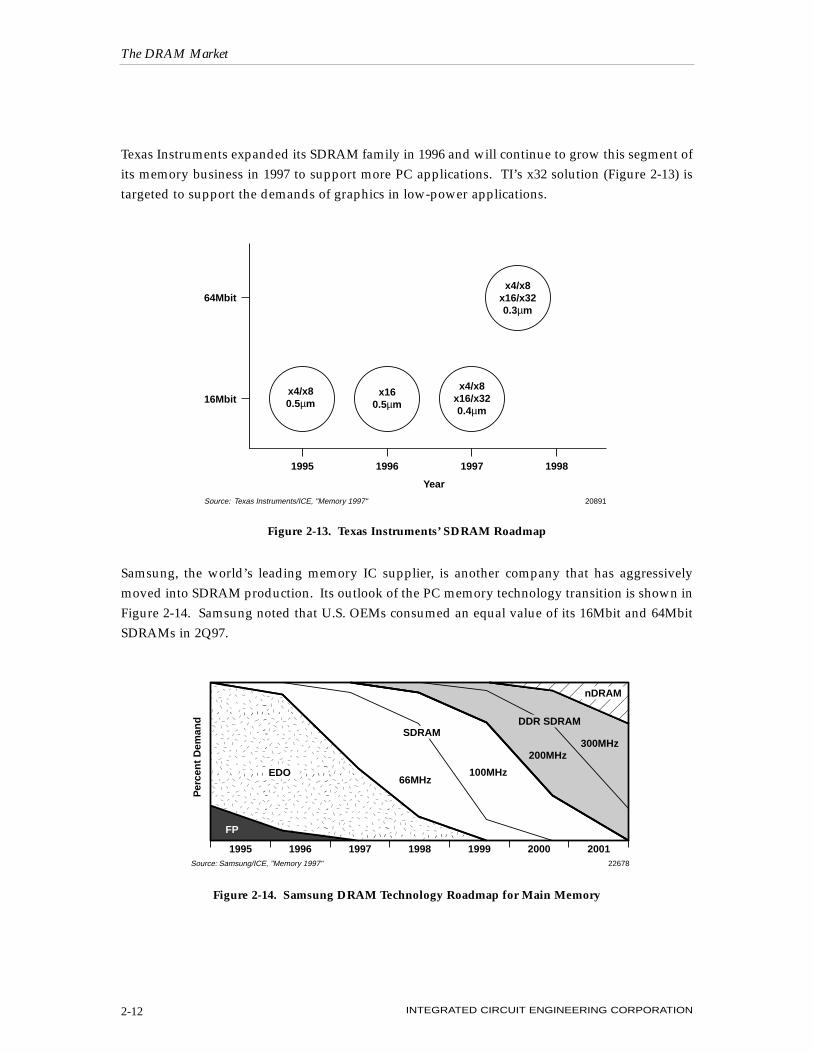
Texas Instruments expanded its SDRAM family in 1996 and will continue to grow this segment ofits memory business in 1997 to support more PC applications. TI’s x32 solution (Figure 2-13) istargeted to support the demands of graphics in low-power applications.
Samsung, the world’s leading memory IC supplier, is another company that has aggressivelymoved into SDRAM production. Its outlook of the PC memory technology transition is shown inFigure 2-14. Samsung noted that U.S. OEMs consumed an equal value of its 16Mbit and 64MbitSDRAMs in 2Q97.
The DRAM Market
INTEGRATED CIRCUIT ENGINEERING CORPORATION2-12
20891Source: Texas Instruments/ICE, "Memory 1997"
64Mbit
16Mbitx4/x80.5µm
x160.5µm
x4/x8x16/x320.4µm
x4/x8x16/x320.3µm
1995 1996
Year
1997 1998
Figure 2-13. Texas Instruments’ SDRAM Roadmap
Figure 2-14. Samsung DRAM Technology Roadmap for Main Memory��������������������
������������������
FP
EDO
SDRAM
66MHz100MHz
DDR SDRAM
200MHz300MHz
nDRAM
1995
Per
cen
t D
eman
d
1996 1997 1998 1999 2000 2001Source: Samsung/ICE, "Memory 1997" 22678

Beyond SDRAMs, Samsung is promoting double data rate (DDR) SDRAM, which doubles thetransfer rate of information compared to a standard SDRAM (which transfers almost twice as muchdata as an EDO DRAM device, Figure 2-15). Samsung believes the DDR SDRAM technology willextend the life of synchronous memory into the 300MHz range, thus directly competing with theRambus DRAM and perhaps delaying the day when vendors have to embrace a new architecture.
In 1996, it became obvious that standard SDRAMs would not be able to perform to the 1.5Gbit to3.0Gbit/second system bandwidth necessary to provide realistic 3D graphics and DVD process-ing. The Rambus DRAM (RDRAM) provides that solution. This technology provides a wide pathfor fast data transfer between the memory and the processing segments of a system.
Rambus licensed the top five DRAM manufacturers (and several others) to use its technology. Thecompany charges a flat “engineering fee” to customize its interface to a memory vendor’s exist-ing product. Vendors then pay royalties based upon the actual selling price of the Rambus DRAM.
Rambus scored a major win when it announced in 1Q97 that Intel would adopt the RambusDRAM architecture as its next-generation main-memory technology for PCs. If all goes accordingto Intel’s plan, Rambus DRAMs will begin to appear in high-end PCs in 1999 (Figure 2-16).
DRAM AVERAGE SELLING PRICES
The DRAM average selling price (ASP) from 1992 through 2002 is shown in Figure 2-17. Limitedproduction capacity and strong demand kept ASPs rising quickly during the first part of thedecade. To the contrary, added worldwide production capacity (i.e., greater supply) led to a crashin the DRAM ASP in 1996. ICE forecasts that an overcapacity condition will continue through1997, which will lead to further erosion of average selling prices. Demand should begin to matchsupply in 1998 and then gradually out-grow supply through the year 2002. Accordingly, DRAMASPs are forecast to climb during this time.
The DRAM Market
INTEGRATED CIRCUIT ENGINEERING CORPORATION 2-13
22679Source: Samsung/ICE, "Memory 1997"
Bu
s C
lock
Sp
eed
(M
Hz)
175
150
125
100
75
50
25
0
1989 1991 1993 1995 1997 1999 2001
Fast Page(300Mbits/s)
EDO(500Mbits/s)
SDRAM(>500-800Mbits/s)
DDR SDRAM II(1.0-2.4Gbits/s)
Figure 2-15. Samsung Promotes DDR SDRAM to Match Bus Clock

The DRAM Market
INTEGRATED CIRCUIT ENGINEERING CORPORATION2-14
�����������������������������������
��������������������
High EndDesktop
VolumeDesktop
Low CostDesktop
1994 20001995 1999199819971996
FP EDO66MHzSDRAM
100MHzSDRAM
DirectRDRAM
Source: Intel/Rambus/ICE, "Memory 1997" 22680
Figure 2-16. Intel’s Outlook for PC Platform Memory
Figure 2-17. DRAM Average Selling Price
0.00
2.00
4.00
6.00
8.00
10.00
12.00
14.00
16.00
18.00
20022001200019991998199719961995199419931992–50
–40
–30
–20
–10
0
10
20
30
40
50
60
Year
20022DSource: ICE, "Memory 1997"
Total ASP ($)
Percent Change
14.77
21
5.75
11
8.77
52
12.19
39
16.48
35
9.10
–45
7.01
–23
7.84
12
9.17
17
10.66
16
12.21
15
AS
P (
$)
Per
cen
t C
han
ge
Total ASP (S)
Percent Change
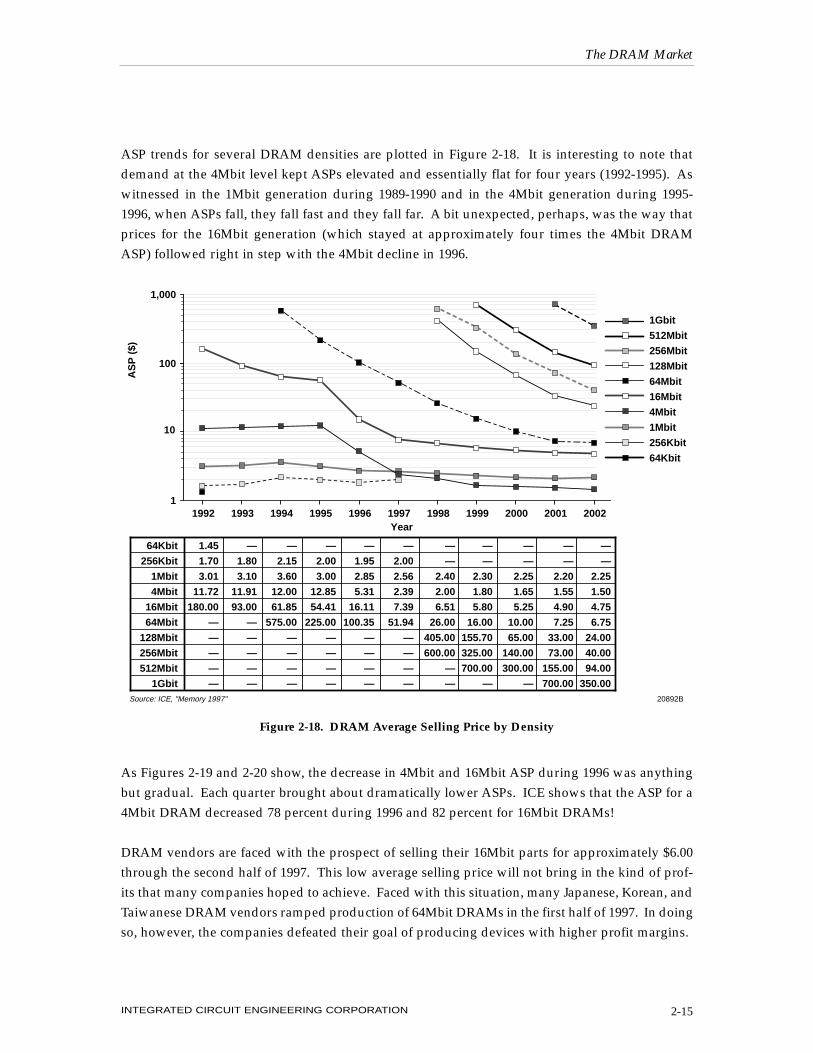
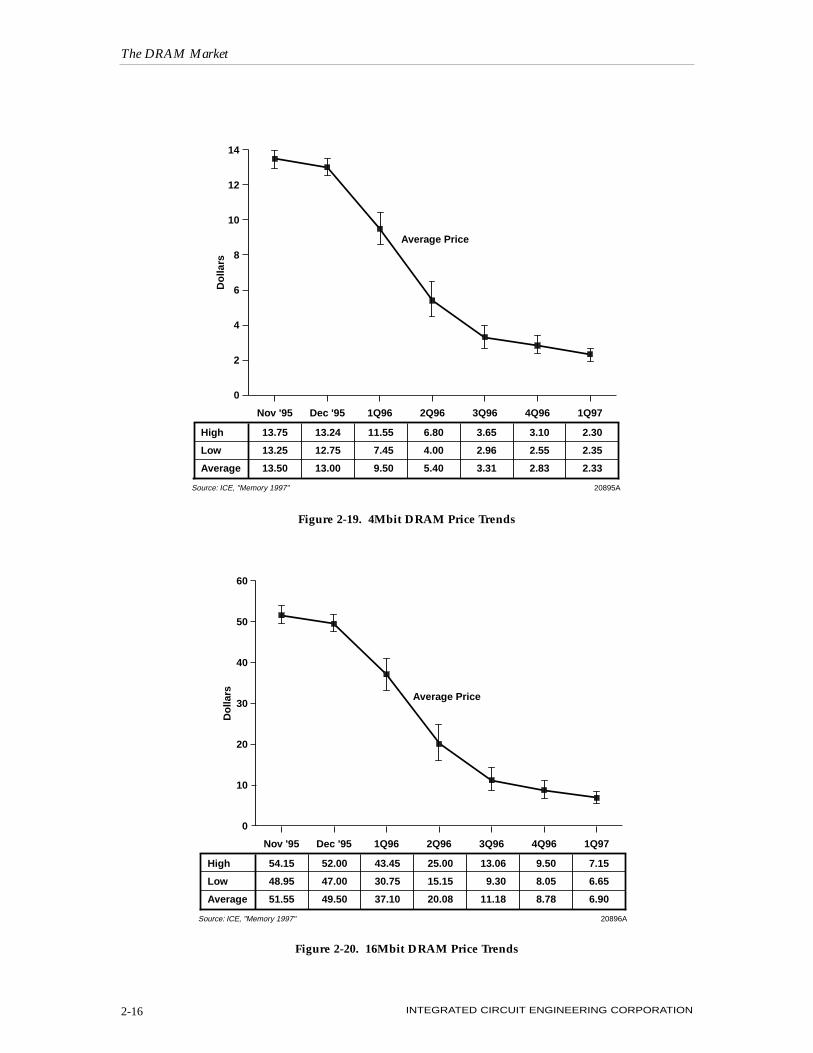
ASP trends for several DRAM densities are plotted in Figure 2-18. It is interesting to note thatdemand at the 4Mbit level kept ASPs elevated and essentially flat for four years (1992-1995). Aswitnessed in the 1Mbit generation during 1989-1990 and in the 4Mbit generation during 1995-1996, when ASPs fall, they fall fast and they fall far. A bit unexpected, perhaps, was the way thatprices for the 16Mbit generation (which stayed at approximately four times the 4Mbit DRAMASP) followed right in step with the 4Mbit decline in 1996.
As Figures 2-19 and 2-20 show, the decrease in 4Mbit and 16Mbit ASP during 1996 was anythingbut gradual. Each quarter brought about dramatically lower ASPs. ICE shows that the ASP for a4Mbit DRAM decreased 78 percent during 1996 and 82 percent for 16Mbit DRAMs!
DRAM vendors are faced with the prospect of selling their 16Mbit parts for approximately $6.00through the second half of 1997. This low average selling price will not bring in the kind of prof-its that many companies hoped to achieve. Faced with this situation, many Japanese, Korean, andTaiwanese DRAM vendors ramped production of 64Mbit DRAMs in the first half of 1997. In doingso, however, the companies defeated their goal of producing devices with higher profit margins.
The DRAM Market
INTEGRATED CIRCUIT ENGINEERING CORPORATION 2-15
Year
20892BSource: ICE, "Memory 1997"
64Kbit
256Kbit
1Mbit
4Mbit
16Mbit
64Mbit
128Mbit
256Mbit
512Mbit
1Gbit
1.45
1.70
3.01
11.72
180.00
—
—
—
—
—
—
1.80
3.10
11.91
93.00
—
—
—
—
—
—
2.15
3.60
12.00
61.85
575.00
—
—
—
—
—
2.00
3.00
12.85
54.41
225.00
—
—
—
—
—
1.95
2.85
5.31
16.11
100.35
—
—
—
—
—
2.00
2.56
2.39
7.39
51.94
—
—
—
—
—
—
2.40
2.00
6.51
26.00
405.00
600.00
—
—
—
—
2.30
1.80
5.80
16.00
155.70
325.00
700.00
—
—
—
2.25
1.65
5.25
10.00
65.00
140.00
300.00
—
—
—
2.20
1.55
4.90
7.25
33.00
73.00
155.00
700.00
—
—
2.25
1.50
4.75
6.75
24.00
40.00
94.00
350.00
20021992 1993 1994 1995 1996 1997 1998 1999 2000 2001
AS
P (
$)
1
10
100
1,000
1Gbit
512Mbit
256Mbit
128Mbit
64Mbit
16Mbit
4Mbit
1Mbit
256Kbit
64Kbit
Figure 2-18. DRAM Average Selling Price by Density
The DRAM Market
INTEGRATED CIRCUIT ENGINEERING CORPORATION2-16
0
2
4
6
8
10
12
14
13.75
13.25
13.50
13.24
12.75
13.00
11.55
7.45
9.50
6.80
4.00
5.40
3.65
2.96
3.31
3.10
2.55
2.83
2.30
2.35
2.33
Do
llars
Nov '95 Dec '95 1Q96 2Q96 3Q96 4Q96 1Q97
High
Low
Average
20895ASource: ICE, "Memory 1997"
Average Price
Figure 2-19. 4Mbit DRAM Price Trends
0
10
20
30
40
50
60
54.15
48.95
51.55
52.00
47.00
49.50
43.45
30.75
37.10
25.00
15.15
20.08
13.06
9.30
11.18
9.50
8.05
8.78
7.15
6.65
6.90
Do
llars
Nov '95 Dec '95 1Q96 2Q96 3Q96 4Q96 1Q97
High
Low
Average
20896ASource: ICE, "Memory 1997"
Average Price
Figure 2-20. 16Mbit DRAM Price Trends

64Mbit DRAM ASPs followed the same path as 4Mbit and 16Mbit generations before them. At thebeginning of 1996, 64Mbit DRAMs sold for $250. By the end of the year, they sold for $90. In1Q97, the devices were offered for $60, and in 2Q97, the prices had dropped to less than $40. Asof 2Q97, there was more 64Mbit product than the niche application of high-performance work-stations could absorb.
ICE believes the DRAM buyers’ market will continue throughout 1997. Plenty of fab capacity willkeep prices flat or slightly down on all densities of DRAM during the upcoming year.
DRAM BIT VOLUME
DRAM bit volume is provided in Figure 2-21. The DRAM bit volume forecast provides a clear indi-cation that the DRAM market will remain vibrant through the year 2002. There will be demand formore bits. Annual bit volume growth from 1997 through the year 2002 is forecast to average 69 per-cent, with 64Mbit and 256Mbit devices serving as the backbone for that growth (Figure 2-22).
The DRAM Market
INTEGRATED CIRCUIT ENGINEERING CORPORATION 2-17
0
100,000
200,000
300,000
400,000
500,000
600,000
200220012000199919981997199619951994199319920
10
20
30
40
50
60
70
80
90
100
Bit
s x
1012
Per
cen
t C
han
ge
Year
Total Bit Volume
Percent Change
2,864
85
4,243
48
7,536
78
13,019
73
23,370
80
41,363
77
69,797
69
121,219
74
200,896
66
339,411
69
578,476
70
20894CSource: ICE, "Memory 1997"
Bit VolumePercent Change
Figure 2-21. DRAM Bit Volume

Much of the bit volume growth is due to the continued expansion of the PC industry. As noted inFigure 2-23, PC unit growth has been around 20 percent since about 1992. What is more interest-ing to note is the amount of DRAM used for main memory on the average new system. From amere 4Mbytes in 1991 to 20Mbytes in 1996 to a forecast of 32Mbytes in 1997, the amount of PCmain memory has increased eight-fold in six years. Price declines and new software capabilities(Netscape, Windows NT, etc.) contributed to the higher memory content.
The DRAM Market
INTEGRATED CIRCUIT ENGINEERING CORPORATION2-18
Year
20882BSource: ICE, "Memory 1997"
0.3
52
862
1,917
34
—
—
—
—
—
—
28
625
3,255
336
—
—
—
—
—
—
17
524
5,260
1,728
7
—
—
—
—
—
8
485
6,916
5,592
17
—
—
—
—
—
6
273
6,284
16,341
466
—
—
—
—
—
4
196
4,020
30,204
6,939
—
—
—
—
—
—
152
3,502
35,232
20,870
13
27
—
—
—
—
105
2,579
29,360
87,242
537
1,342
54
—
—
—
47
1,468
28,521
140,929
6,040
21,475
2,416
—
—
—
26
1,049
24,830
187,905
16,777
100,633
8,053
107
—
—
10
524
20,133
201,327
13,422
295,279
34,897
12,885
1992 1993 1994 1995 1996 1997 1998 1999 2000 2001 2002
Bit
s x
1012
0.10
1.00
100.00
10.00
1,000.00
10,000.00
100,000.00
1,000,000.00
64Kbit
256Kbit
1Mbit
4Mbit
16Mbit
64Mbit
128Mbit
256Mbit
512Mbit
1Gbit
1Gbit
512Mbit
256Mbit
128Mbit
64Mbit
16Mbit
4Mbit
1Mbit
256Kbit
64Kbit
Figure 2-22. DRAM Bit Volume by Density
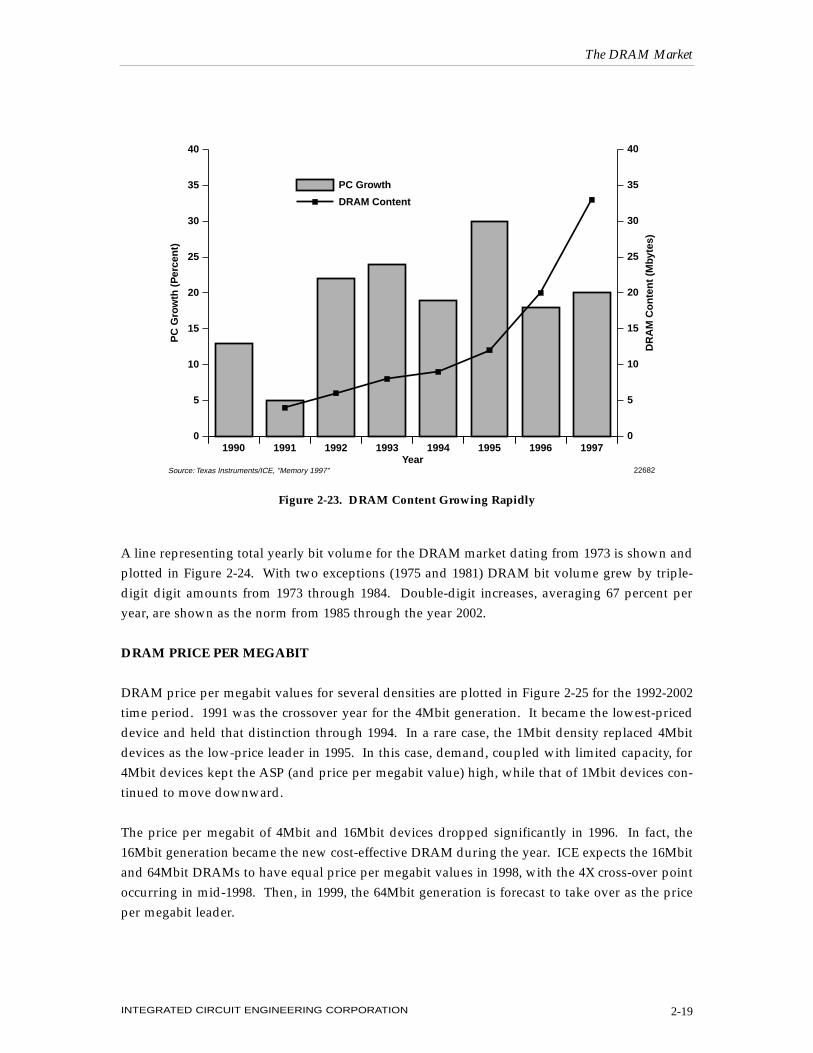
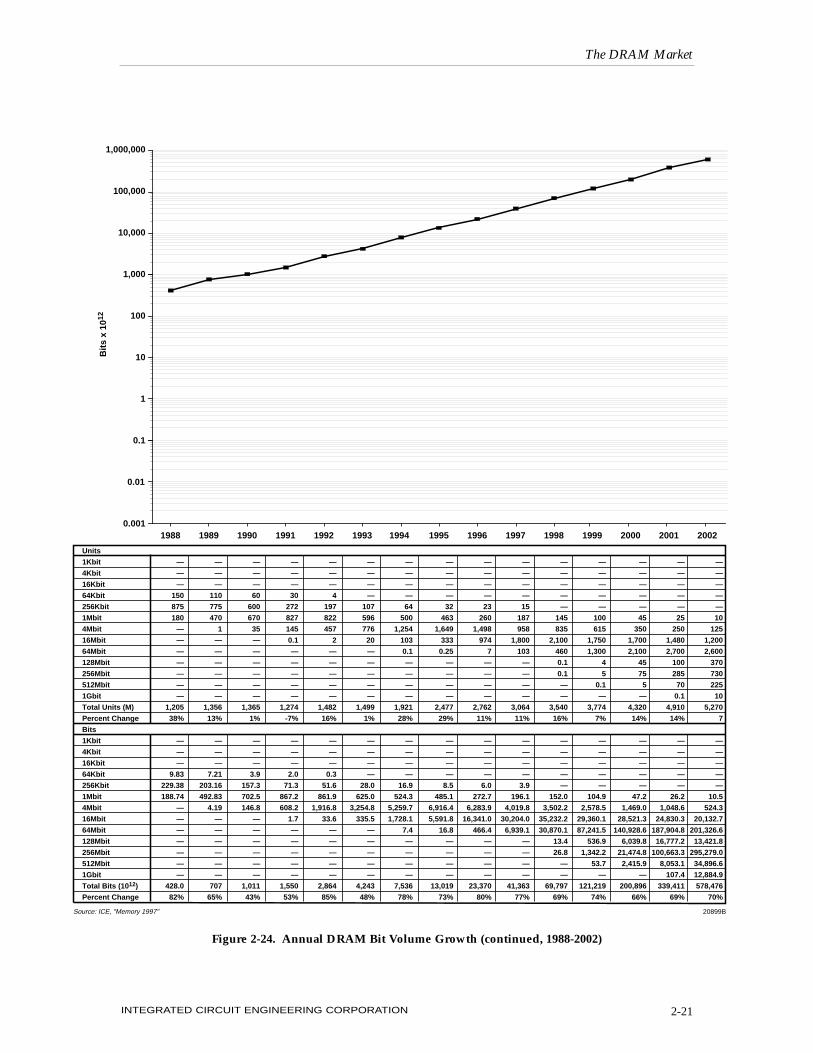
A line representing total yearly bit volume for the DRAM market dating from 1973 is shown andplotted in Figure 2-24. With two exceptions (1975 and 1981) DRAM bit volume grew by triple-digit digit amounts from 1973 through 1984. Double-digit increases, averaging 67 percent peryear, are shown as the norm from 1985 through the year 2002.
DRAM PRICE PER MEGABIT
DRAM price per megabit values for several densities are plotted in Figure 2-25 for the 1992-2002time period. 1991 was the crossover year for the 4Mbit generation. It became the lowest-priceddevice and held that distinction through 1994. In a rare case, the 1Mbit density replaced 4Mbitdevices as the low-price leader in 1995. In this case, demand, coupled with limited capacity, for4Mbit devices kept the ASP (and price per megabit value) high, while that of 1Mbit devices con-tinued to move downward.
The price per megabit of 4Mbit and 16Mbit devices dropped significantly in 1996. In fact, the16Mbit generation became the new cost-effective DRAM during the year. ICE expects the 16Mbitand 64Mbit DRAMs to have equal price per megabit values in 1998, with the 4X cross-over pointoccurring in mid-1998. Then, in 1999, the 64Mbit generation is forecast to take over as the priceper megabit leader.
The DRAM Market
INTEGRATED CIRCUIT ENGINEERING CORPORATION 2-19
0
5
10
15
20
25
30
35
40
199719961995199419931992199119900
5
10
15
20
25
30
35
40
Year
PC
Gro
wth
(P
erce
nt)
DR
AM
Co
nte
nt
(Mby
tes)
PC Growth
DRAM Content
Source: Texas Instruments/ICE, "Memory 1997" 22682
Figure 2-23. DRAM Content Growing Rapidly

The DRAM Market
INTEGRATED CIRCUIT ENGINEERING CORPORATION2-20
20898ASource: ICE, "Memory 1997"
1973 1974 1975 1976 1977 1978 1979 1980 1981 1982 1983 1984 1985 1986
Bit
s x
1012
0.001
0.01
0.1
1
10
100
1,000
10,000
100,000
1,000,000
8
—
—
—
—
—
—
—
—
—
—
—
—
8
—
0.0082
—
—
—
—
—
—
—
—
—
—
—
—
0.0082
—
21
—
—
—
—
—
—
—
—
—
—
—
—
21
163%
0.0215
—
—
—
—
—
—
—
—
—
—
—
—
0.0215
163%
19
3
—
—
—
—
—
—
—
—
—
—
—
22
5%
0.0195
0.0123
—
—
—
—
—
—
—
—
—
—
—
0.0317
48%
13
24
—
—
—
—
—
—
—
—
—
—
—
37
68%
0.0133
0.0983
—
—
—
—
—
—
—
—
—
—
—
0.112
252%
10
50
2
—
—
—
—
—
—
—
—
—
—
62
68%
0.0102
0.2048
0.0328
—
—
—
—
—
—
—
—
—
—
0.248
122%
5
67
17
—
—
—
—
—
—
—
—
—
—
89
44%
0.0051
0.2744
0.2785
—
—
—
—
—
—
—
—
—
—
0.558
125%
1
70
71
—
—
—
—
—
—
—
—
—
—
142
60%
0.0010
0.2867
1.1633
—
—
—
—
—
—
—
—
—
—
1.5
160%
1
31
184
1
—
—
—
—
—
—
—
—
—
217
53%
0.0010
0.1270
3.0147
0.0655
—
—
—
—
—
—
—
—
—
3.2
121%
1
15
230
11
—
—
—
—
—
—
—
—
—
257
18%
0.0010
0.0614
3.7683
0.7209
—
—
—
—
—
—
—
—
—
4.6
42%
—
10
240
100
—
—
—
—
—
—
—
—
—
350
36%
—
0.0410
3.9322
6.5536
—
—
—
—
—
—
—
—
—
10.5
131%
—
5
220
330
2
—
—
—
—
—
—
—
—
557
59%
—
0.0205
3.6045
21.6269
0.5243
—
—
—
—
—
—
—
—
25.8
145%
—
—
120
820
40
—
—
—
—
—
—
—
—
980
76%
—
—
1.966
53.740
10.486
—
—
—
—
—
—
—
—
66.2
157%
—
—
35
500
240
—
—
—
—
—
—
—
—
775
-21%
—
—
0.573
32.768
62.915
—
—
—
—
—
—
—
—
96.3
45%
—
—
10
380
520
4
—
—
—
—
—
—
—
914
18%
—
—
0.164
24.904
136.315
4.194
—
—
—
—
—
—
—
165.6
72%
1987
—
—
—
150
680
45
—
—
—
—
—
—
—
875
-4%
—
—
—
9.83
178.26
47.19
—
—
—
—
—
—
—
235.3
42%
Units
1Kbit
4Kbit
16Kbit
64Kbit
256Kbit
1Mbit
4Mbit
16Mbit
64Mbit
128Mbit
256Mbit
512Mbit
1Gbit
Total Units (M)
Percent Change
Bits
1Kbit
4Kbit
16Kbit
64Kbit
256Kbit
1Mbit
4Mbit
16Mbit
64Mbit
128Mbit
256Mbit
512Mbit
1Gbit
Total Bits (1012)
Percent Change
Figure 2-24. Annual DRAM Bit Volume Growth (1973-1987)
The DRAM Market
INTEGRATED CIRCUIT ENGINEERING CORPORATION 2-21
20899BSource: ICE, "Memory 1997"
1988 1989 1990 1991 1992 1993 1994 1995 1996 1997 1998 1999 2000 2001
Bit
s x
1012
0.001
0.01
0.1
1
10
100
1,000
10,000
100,000
1,000,000
Units
1Kbit
4Kbit
16Kbit
64Kbit
256Kbit
1Mbit
4Mbit
16Mbit
64Mbit
128Mbit
256Mbit
512Mbit
1Gbit
Total Units (M)
Percent Change
Bits
1Kbit
4Kbit
16Kbit
64Kbit
256Kbit
1Mbit
4Mbit
16Mbit
64Mbit
128Mbit
256Mbit
512Mbit
1Gbit
Total Bits (1012)
Percent Change
—
—
—
150
875
180
—
—
—
—
—
—
—
1,205
38%
—
—
—
9.83
229.38
188.74
—
—
—
—
—
—
—
428.0
82%
—
—
—
110
775
470
1
—
—
—
—
—
—
1,356
13%
—
—
—
7.21
203.16
492.83
4.19
—
—
—
—
—
—
707
65%
—
—
—
60
600
670
35
—
—
—
—
—
—
1,365
1%
—
—
—
3.9
157.3
702.5
146.8
—
—
—
—
—
—
1,011
43%
—
—
—
30
272
827
145
0.1
—
—
—
—
—
1,274
-7%
—
—
—
2.0
71.3
867.2
608.2
1.7
—
—
—
—
—
1,550
53%
—
—
—
4
197
822
457
2
—
—
—
—
—
1,482
16%
—
—
—
0.3
51.6
861.9
1,916.8
33.6
—
—
—
—
—
2,864
85%
—
—
—
—
107
596
776
20
—
—
—
—
—
1,499
1%
—
—
—
—
28.0
625.0
3,254.8
335.5
—
—
—
—
—
4,243
48%
—
—
—
—
64
500
1,254
103
0.1
—
—
—
—
1,921
28%
—
—
—
—
16.9
524.3
5,259.7
1,728.1
7.4
—
—
—
—
7,536
78%
—
—
—
—
32
463
1,649
333
0.25
—
—
—
—
2,477
29%
—
—
—
—
8.5
485.1
6,916.4
5,591.8
16.8
—
—
—
—
13,019
73%
—
—
—
—
23
260
1,498
974
7
—
—
—
—
2,762
11%
—
—
—
—
6.0
272.7
6,283.9
16,341.0
466.4
—
—
—
—
23,370
80%
—
—
—
—
15
187
958
1,800
103
—
—
—
—
3,064
11%
—
—
—
—
3.9
196.1
4,019.8
30,204.0
6,939.1
—
—
—
—
41,363
77%
—
—
—
—
—
145
835
2,100
460
0.1
0.1
—
—
3,540
16%
—
—
—
—
—
152.0
3,502.2
35,232.2
30,870.1
13.4
26.8
—
—
69,797
69%
—
—
—
—
—
100
615
1,750
1,300
4
5
0.1
—
3,774
7%
—
—
—
—
—
104.9
2,578.5
29,360.1
87,241.5
536.9
1,342.2
53.7
—
121,219
74%
—
—
—
—
—
45
350
1,700
2,100
45
75
5
—
4,320
14%
—
—
—
—
—
47.2
1,469.0
28,521.3
140,928.6
6,039.8
21,474.8
2,415.9
—
200,896
66%
—
—
—
—
—
25
250
1,480
2,700
100
285
70
0.1
4,910
14%
—
—
—
—
—
26.2
1,048.6
24,830.3
187,904.8
16,777.2
100,663.3
8,053.1
107.4
339,411
69%
2002
—
—
—
—
—
10
125
1,200
2,600
370
730
225
10
5,270
7
—
—
—
—
—
10.5
524.3
20,132.7
201,326.6
13,421.8
295,279.0
34,896.6
12,884.9
578,476
70%
Figure 2-24. Annual DRAM Bit Volume Growth (continued, 1988-2002)

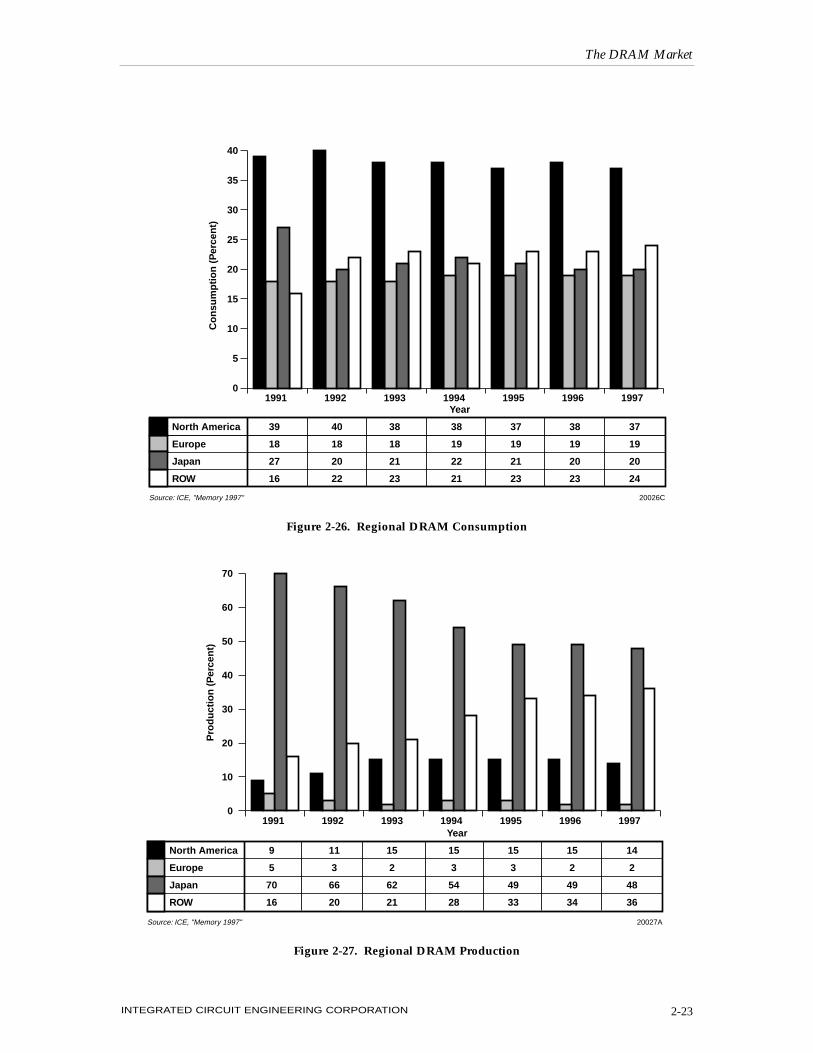
DRAM CONSUMPTION AND PRODUCTION
Throughout the 1990’s, the North American region has been the DRAM consumption leader(Figure 2-26). In 1996, it had 38 percent of the DRAM market. Consumption of DRAMs in theROW region (Asia-Pacific countries excluding Japan) first surpassed Japan’s consumption in 1992.Strong consumer electronic consumption in the developing economies of the region along withPC-related work (assembly, packaging, test) will lead to greater consumption in this region.
Although its marketshare dropped considerably since 1991, DRAM production has remainedfirmly in the hands of Japanese companies (Figure 2-27). The biggest threat to Japan’s productionlead comes from the ROW region (specifically, Korea), which continued to build more facilities athome and abroad to harvest additional marketshare.
The DRAM Market
INTEGRATED CIRCUIT ENGINEERING CORPORATION2-22
Year
20883BSource: ICE, "Memory 1997"
22.13
6.48
2.87
2.79
10.73
—
—
—
—
—
—
6.87
2.96
2.84
5.54
—
—
—
—
—
—
8.22
3.43
2.86
3.69
8.57
—
—
—
—
—
7.63
2.86
3.06
3.24
3.35
—
—
—
—
—
7.44
2.72
1.27
0.96
1.50
—
—
—
—
—
7.63
2.45
0.57
0.44
0.77
—
—
—
—
—
—
2.29
0.48
0.39
0.39
3.02
2.24
—
—
—
—
2.19
0.43
0.35
0.24
1.16
1.21
1.30
—
—
—
2.15
0.39
0.31
0.15
0.48
0.52
0.56
—
—
—
2.10
0.37
0.29
0.11
0.25
0.27
0.29
0.65
—
—
2.15
0.36
0.28
0.10
0.18
0.15
0.18
0.33
Pri
ce P
er M
bit
($)
1Gbit
512Mbit
256Mbit
128Mbit
64Mbit
16Mbit
4Mbit
1Mbit
256Kbit
64Kbit
64Kbit
256Kbit
1Mbit
4Mbit
16Mbit
64Mbit
128Mbit
256Mbit
512Mbit
1Gbit
20021992 1993 1994 1995 1996 1997 1998 1999 2000 20010.10
1.00
10.00
100.00
Figure 2-25. DRAM Price Per Mbit by Density
The DRAM Market
INTEGRATED CIRCUIT ENGINEERING CORPORATION 2-23
0
5
10
15
20
25
30
35
40
1997199619951994199319921991Year
Co
nsu
mp
tio
n (
Per
cen
t)
North America
Europe
Japan
ROW
39
18
27
16
40
18
20
22
38
18
21
23
38
19
22
21
37
19
21
23
38
19
20
23
37
19
20
24
20026CSource: ICE, "Memory 1997"
Figure 2-26. Regional DRAM Consumption
0
10
20
30
40
50
60
70
1997199619951994199319921991Year
Pro
du
ctio
n (
Per
cen
t)
North America
Europe
Japan
ROW
9
5
70
16
11
3
66
20
15
2
62
21
15
3
54
28
15
3
49
33
15
2
49
34
14
2
48
36
20027ASource: ICE, "Memory 1997"
Figure 2-27. Regional DRAM Production

Projecting out current trends in regional production through the year 2002, it appears that ROW-based manufacturers could very well be supplying a greater percentage of DRAMs to the world-wide market than their Japanese counterparts (Figure 2-28). World-class manufacturing prowess,generally lower labor costs, supportive governments, and a desire to quickly be a major player inthe microelectronics industry are factors that will contribute to the growth in DRAM productionin the ROW region.
DRAM SALES LEADERS
Shown in Figure 2-29 are the leading DRAM suppliers for 1996. As noted in the chart, no vendorwas spared from the huge decline in the DRAM market. Texas Instruments’ DRAM sales weredown 50 percent in 1996, while Samsung managed to control the bleeding with “only” a 26 per-cent decline in its DRAM sales for 1996. For most, the decline in DRAM revenue nearly matchedthat of the DRAM market itself (-38 percent).
Topping the list of DRAM suppliers was Samsung. Although its DRAM sales were down 26 per-cent in 1996, it easily remained the world’s leading supplier of DRAMs and showed no sign ofrelinquishing that position.
The DRAM Market
INTEGRATED CIRCUIT ENGINEERING CORPORATION2-24
0
10
20
30
40
50
60
70
200220012000199919981997199619951994199319921991
Japan
ROW
Year
Mar
kets
har
e (P
erce
nt)
Japan
ROW
70
16
66
20
62
21
54
28
49
33
49
34
48
36
44
40
42
42
40
44
40
45
46
38
20884ASource: ICE, "Memory 1997"
Figure 2-28. ROW to Overtake Japan in DRAM Production
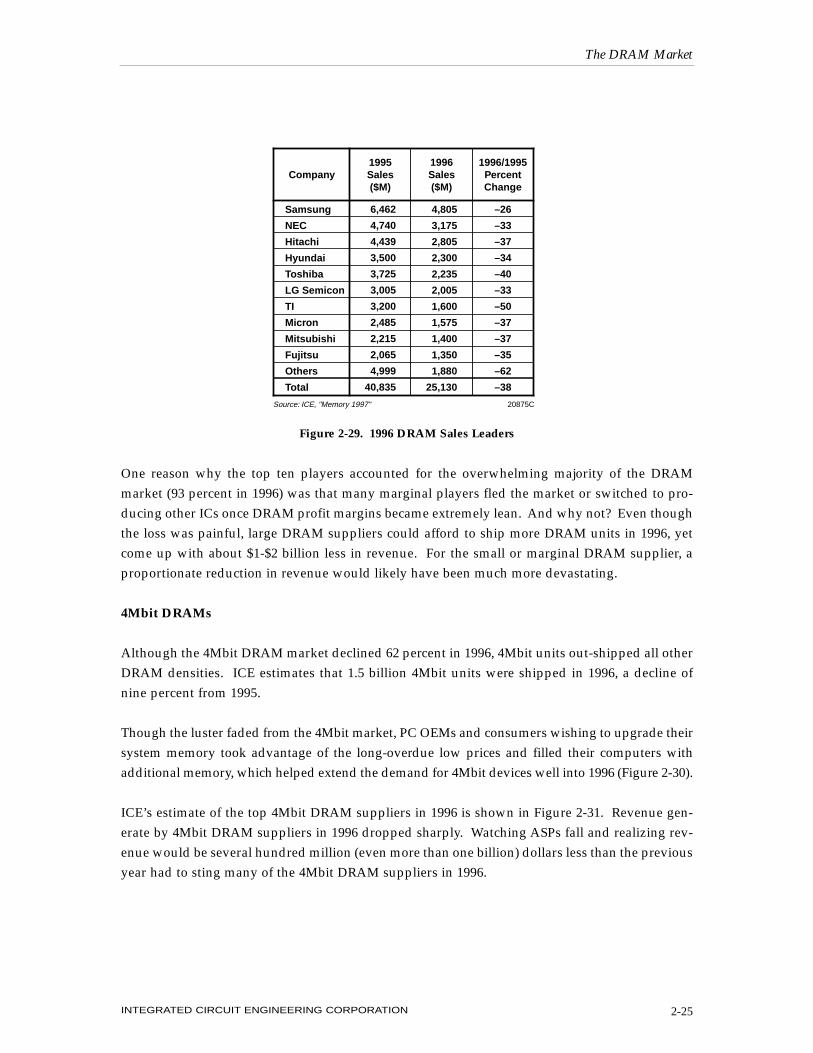
One reason why the top ten players accounted for the overwhelming majority of the DRAMmarket (93 percent in 1996) was that many marginal players fled the market or switched to pro-ducing other ICs once DRAM profit margins became extremely lean. And why not? Even thoughthe loss was painful, large DRAM suppliers could afford to ship more DRAM units in 1996, yetcome up with about $1-$2 billion less in revenue. For the small or marginal DRAM supplier, aproportionate reduction in revenue would likely have been much more devastating.
4Mbit DRAMs
Although the 4Mbit DRAM market declined 62 percent in 1996, 4Mbit units out-shipped all otherDRAM densities. ICE estimates that 1.5 billion 4Mbit units were shipped in 1996, a decline ofnine percent from 1995.
Though the luster faded from the 4Mbit market, PC OEMs and consumers wishing to upgrade theirsystem memory took advantage of the long-overdue low prices and filled their computers withadditional memory, which helped extend the demand for 4Mbit devices well into 1996 (Figure 2-30).
ICE’s estimate of the top 4Mbit DRAM suppliers in 1996 is shown in Figure 2-31. Revenue gen-erate by 4Mbit DRAM suppliers in 1996 dropped sharply. Watching ASPs fall and realizing rev-enue would be several hundred million (even more than one billion) dollars less than the previousyear had to sting many of the 4Mbit DRAM suppliers in 1996.
The DRAM Market
INTEGRATED CIRCUIT ENGINEERING CORPORATION 2-25
20875CSource: ICE, "Memory 1997"
Samsung
NEC
Hitachi
Hyundai
Toshiba
LG Semicon
TI
Micron
Mitsubishi
Fujitsu
Others
Total
4,805
3,175
2,805
2,300
2,235
2,005
1,600
1,575
1,400
1,350
1,880
25,130
–26
–33
–37
–34
–40
–33
–50
–37
–37
–35
–62
–38
1995Sales($M)
1996/1995PercentChange
6,462
4,740
4,439
3,500
3,725
3,005
3,200
2,485
2,215
2,065
4,999
40,835
1996Sales($M)
Company
Figure 2-29. 1996 DRAM Sales Leaders
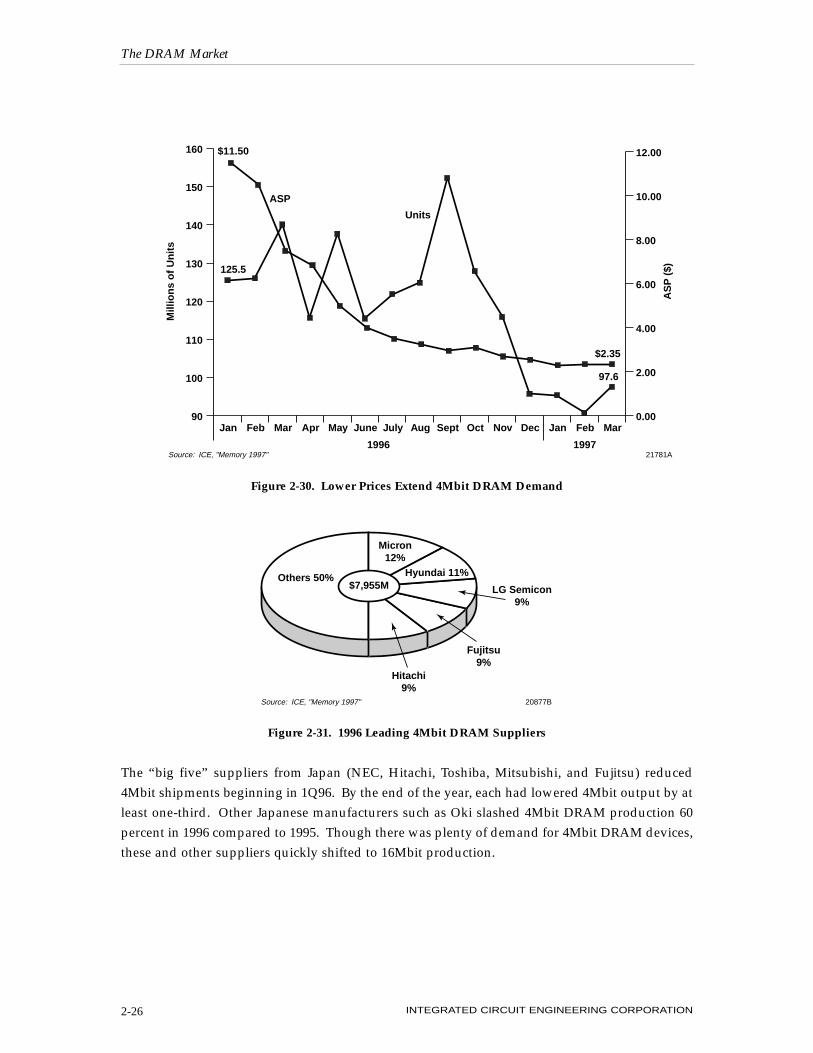
The “big five” suppliers from Japan (NEC, Hitachi, Toshiba, Mitsubishi, and Fujitsu) reduced4Mbit shipments beginning in 1Q96. By the end of the year, each had lowered 4Mbit output by atleast one-third. Other Japanese manufacturers such as Oki slashed 4Mbit DRAM production 60percent in 1996 compared to 1995. Though there was plenty of demand for 4Mbit DRAM devices,these and other suppliers quickly shifted to 16Mbit production.
The DRAM Market
INTEGRATED CIRCUIT ENGINEERING CORPORATION2-26
Source: ICE, "Memory 1997" 21781A
90
100
110
120
130
140
150
160
MarFebJanDecNovOctSeptAugJulyJuneMayAprMarFebJan0.00
2.00
4.00
6.00
8.00
10.00
12.00
1996 1997
AS
P (
$)
Mill
ion
s o
f U
nit
s
Units
ASP
$11.50
125.5
97.6
$2.35
Figure 2-30. Lower Prices Extend 4Mbit DRAM Demand
Figure 2-31. 1996 Leading 4Mbit DRAM Suppliers
$7,955M
Source: ICE, "Memory 1997" 20877B
Others 50%
Micron12%
Hyundai 11%
LG Semicon9%
Fujitsu9%
Hitachi9%
16Mbit DRAMs
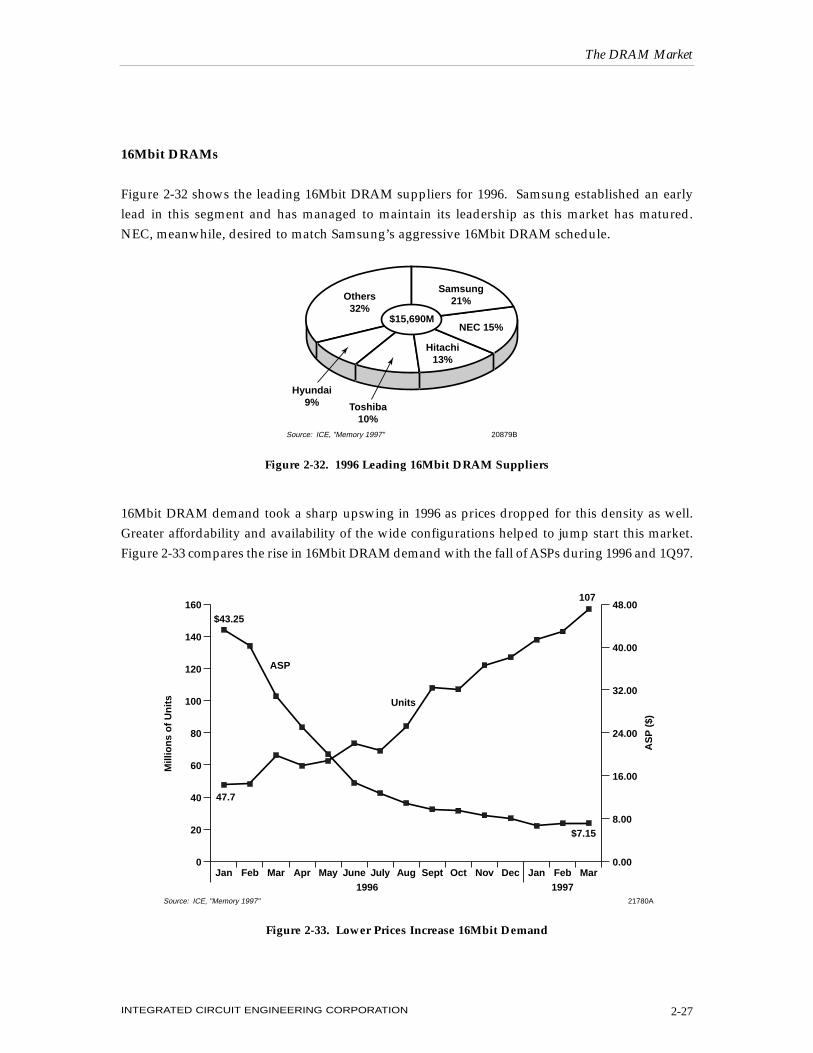
Figure 2-32 shows the leading 16Mbit DRAM suppliers for 1996. Samsung established an earlylead in this segment and has managed to maintain its leadership as this market has matured.NEC, meanwhile, desired to match Samsung’s aggressive 16Mbit DRAM schedule.
16Mbit DRAM demand took a sharp upswing in 1996 as prices dropped for this density as well.Greater affordability and availability of the wide configurations helped to jump start this market.Figure 2-33 compares the rise in 16Mbit DRAM demand with the fall of ASPs during 1996 and 1Q97.
The DRAM Market
INTEGRATED CIRCUIT ENGINEERING CORPORATION 2-27
$15,690M
Source: ICE, "Memory 1997" 20879B
Others32%
Samsung21%
NEC 15%
Toshiba10%
Hitachi13%
Hyundai9%
Figure 2-32. 1996 Leading 16Mbit DRAM Suppliers
Figure 2-33. Lower Prices Increase 16Mbit Demand
Mill
ion
s o
f U
nit
s
AS
P (
$)
Source: ICE, "Memory 1997" 21780A
ASP
Units
$43.25
$7.15
107
47.7
0
20
40
60
80
100
120
140
160
MarFebJanDecNovOctSeptAugJulyJuneMayAprMarFebJan0.00
8.00
16.00
24.00
32.00
40.00
48.00
1996 1997

With the rapid decline of 16Mbit ASPs, Korean DRAM vendors capped or reduced their output of16Mbit devices in the first half of 1997 by as much as 30 percent. In 2Q97, Samsung reduced itsmonthly 16Mbit output from 18 million units to 16 million. A few Japanese suppliers (NEC,Toshiba, Oki, et al) took similar action. Prices fell so far that the business was no longer profitableand threatened their ability to invest in future products.
Despite the slim profit margins, talk of reduced output, and the move to the 64Mbit generation,production of 16Mbit DRAMs began in earnest in Taiwan during 4Q96. Nan Ya Technologystarted volume shipments of a 16Mbit (4Mbit x 4) EDO DRAM family from its new 200mm fab.The devices were manufactured using 0.4µm technology. The company plans additional configu-rations for 1997. Although it obtained its technology from Oki and will produce DRAMs for theJapanese company, Nan Ya will also sell its products on the merchant market using its own logo.
Taiwan’s Powerchip Semiconductor also initiated 16Mbit EDO DRAM production in 1996.Powerchip, formed in late 1994, obtained its 16Mbit and 64Mbit DRAM technology fromMitsubishi. It will sell 50 percent of its output to the Japanese company, with the remainder ded-icated to several Taiwanese-based firms.
Hyundai is bullish on the synchronous DRAM market and in 4Q96 released its 16Mbit SDRAM.Configured in x16, x8, or x4 versions, the device is expected to help improve Pentium Pro perfor-mance by as much as 20 percent compared to conventional EDO DRAM. Hyundai planned toexpand its SDRAM product line in 1H97 with the introduction of a 64Mbit SDRAM.
To cut production costs, several Taiwan-based DRAM suppliers shifted their 16Mbit productionlines to 0.35µm process technology in 2Q97. Among the companies moving to the finer processgeometry were TI-Acer, Vanguard International, United Semiconductor, Mosel-Vitelic, andPowerchip Semiconductor.
In another cost-cutting move, Fujitsu accelerated its drive to shrink 16Mbit DRAM size in orderto lower its production costs. The company currently manufactures 60mm-square chips usinga 0.36µm process. It hopes to reduce that to a 40mm-square chip using a 0.28µm process byearly 1998.
Some DRAM suppliers looked to more lucrative opportunities such as combining memory andlogic on a single chip. Though there are several crucial technology and manufacturing hurdles toovercome, the idea of memory and logic on one chip is intriguing to OEMs and suppliers.Immediate benefits of incorporating both technologies on one chip include higher bandwidth(great for graphics applications) and the obvious board space savings. Section 7 (DRAMTechnology) and Section 11 (Embedded Memory) further discuss the concept of DRAM and logicon the same chip.
The DRAM Market
INTEGRATED CIRCUIT ENGINEERING CORPORATION2-28
Additional company and product highlights surrounding the 16Mbit DRAM market are listedbelow.
Fujitsu
Announced that it would rely on Taiwan Semiconductor Manufacturing Company (TSMC inHsinchi, Taiwan) for as much as 40 percent of its 16Mbit DRAM production. Fujitsu said it willlower its own 16Mbit production by 15 percent and concentrate its own resources on 64Mbitproduction.
Hitachi
In response to the glut in the DRAM market, Hitachi underwent one of the most aggressive prod-uct restructurings of any Japanese chip maker. It shifted its production of 16Mbit DRAMs in Kofu,Japan, to flash memory devices. That move followed the news from 1Q97 to kill a joint-ventureDRAM fab in Malaysia with LG Semicon and an announcement in December, 1996 to re-open aclosed 16Mbit DRAM fab to make SH MPUs instead.
Of the 16Mbit DRAM devices Hitachi offers, approximately 40 percent are supplied by LGSemicon of Korea.
Intel
Intel announced in 1Q97 that it took an equity position in a $1.3 billion memory fab being built inAustin, Texas, by Samsung. In exchange for its equity position, Intel will be guaranteed an undis-closed number of wafers from the facility, which is expected to produce 16Mbit and 64MbitDRAMs using sub-0.5µm technology.
Mitsubishi
Mitsubishi officials displayed a 16Mbit device built using silicon-on-insulator (SOI) wafers. Thecompany claims that its new 16Mbit DRAM on SOI, slated for sampling in 1998, has the accessspeed of a 64Mbit device built on a standard silicon wafer. It should be noted that SOI startingwafers are three to five times more costly than standard silicon wafers.
NEC
Although unit demand is strong, NEC realizes that the market for 16Mbit devices will have a hardtime recovering from its 1H97 levels. As a result, NEC announced it would trim 16Mbit DRAMoutput 20 percent by the end of fiscal 1997 (March 31, 1998).
The DRAM Market
INTEGRATED CIRCUIT ENGINEERING CORPORATION 2-29
Oki
Oki invested $700 million to build a 16Mbit/64Mbit DRAM production facility in the U.S. The0.35µm 200mm wafer processing line will be located in Oregon.
Toshiba
Toshiba off-loaded a small portion of its 16Mbit DRAM production to Taiwan-based WinbondCorporation, which also expects to make 64Mbit DRAM for Toshiba. Additionally, the companylowered its own 16Mbit DRAM output by 15 percent in 1Q97.
64Mbit DRAMs
64Mbit DRAMs arrived on the market in volume in the first half of 1996—a time when overallDRAM prices were dropping quickly. With hopes of capturing some of the hefty profits that eludedthe 16Mbit generation, several companies disclosed plans to ramp up 64Mbit DRAM production.
With many companies jumping into the lucrative 64Mbit DRAM market, an oversupply situationwas created, which defeated DRAM manufacturers’ goal of producing chips with higher profitmargins. Once again, DRAM vendors deprived each other of the high margins they came toexpect at the beginning of the DRAM product life cycle.
The rapid drop in average selling price is premature for this new-generation of devices. From apricing standpoint, the 1997 market for 64Mbit devices is forecast to remain very fragile.Producers will try to maintain higher prices, but there could well be dissension among the ranks,which may result in even lower prices by the end of 1997.
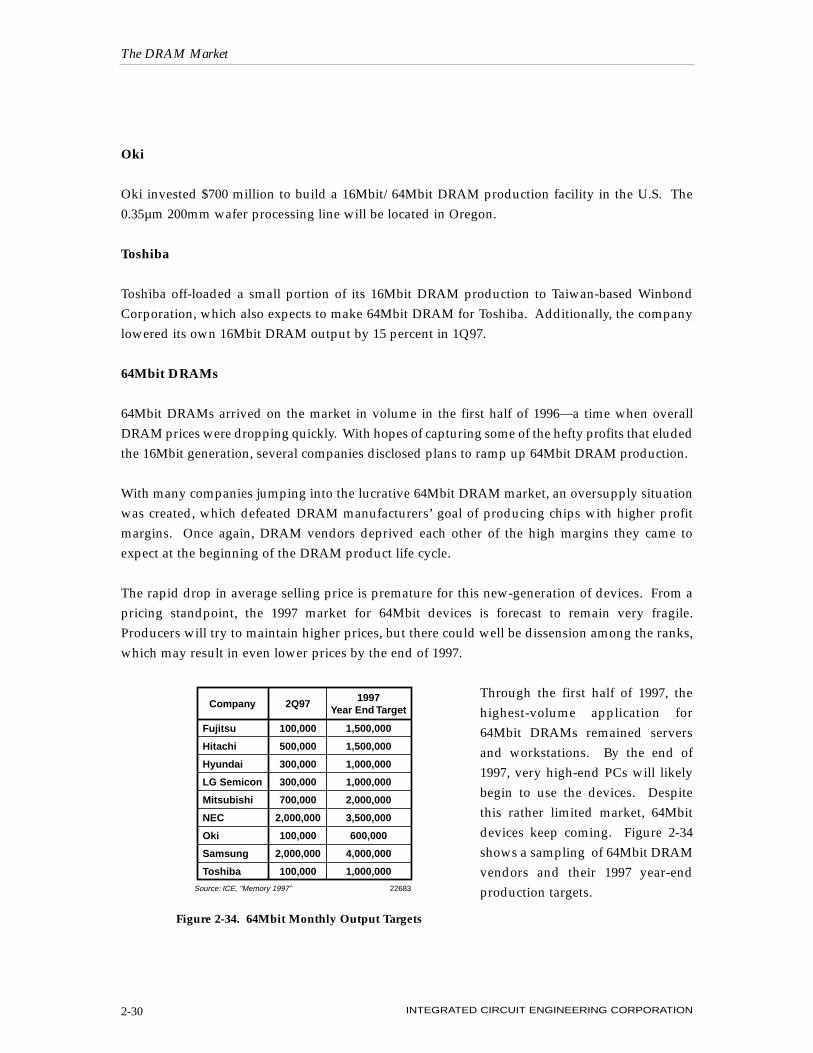
Through the first half of 1997, thehighest-volume application for64Mbit DRAMs remained serversand workstations. By the end of1997, very high-end PCs will likelybegin to use the devices. Despitethis rather limited market, 64Mbitdevices keep coming. Figure 2-34shows a sampling of 64Mbit DRAMvendors and their 1997 year-endproduction targets.
The DRAM Market
INTEGRATED CIRCUIT ENGINEERING CORPORATION2-30
Company 2Q971997
Year End Target
Fujitsu
Hitachi
Hyundai
LG Semicon
Mitsubishi
NEC
Oki
Samsung
Toshiba
100,000
500,000
300,000
300,000
700,000
2,000,000
100,000
2,000,000
100,000
1,500,000
1,500,000
1,000,000
1,000,000
2,000,000
3,500,000
600,000
4,000,000
1,000,000
Source: ICE, "Memory 1997" 22683
Figure 2-34. 64Mbit Monthly Output Targets
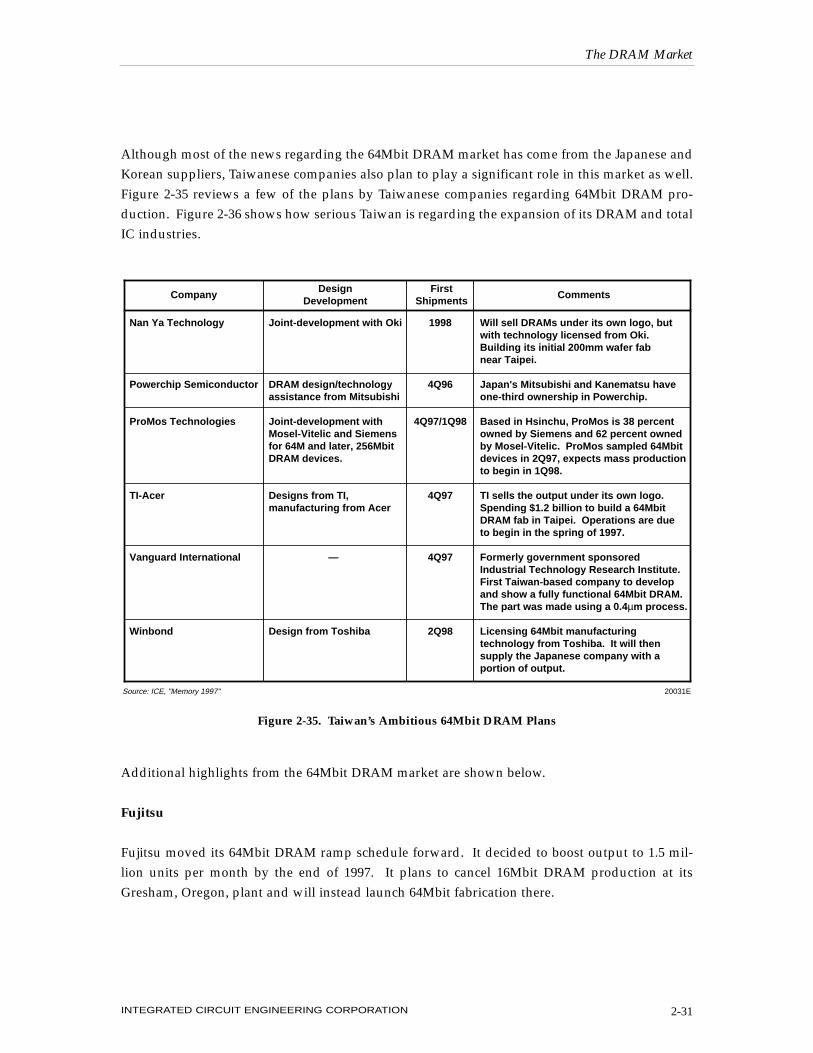
Although most of the news regarding the 64Mbit DRAM market has come from the Japanese andKorean suppliers, Taiwanese companies also plan to play a significant role in this market as well.Figure 2-35 reviews a few of the plans by Taiwanese companies regarding 64Mbit DRAM pro-duction. Figure 2-36 shows how serious Taiwan is regarding the expansion of its DRAM and totalIC industries.
Additional highlights from the 64Mbit DRAM market are shown below.
Fujitsu
Fujitsu moved its 64Mbit DRAM ramp schedule forward. It decided to boost output to 1.5 mil-lion units per month by the end of 1997. It plans to cancel 16Mbit DRAM production at itsGresham, Oregon, plant and will instead launch 64Mbit fabrication there.
The DRAM Market
INTEGRATED CIRCUIT ENGINEERING CORPORATION 2-31
CompanyDesign
DevelopmentFirst
ShipmentsComments
Will sell DRAMs under its own logo, butwith technology licensed from Oki.Building its initial 200mm wafer fabnear Taipei.
Japan's Mitsubishi and Kanematsu haveone-third ownership in Powerchip.
Based in Hsinchu, ProMos is 38 percentowned by Siemens and 62 percent ownedby Mosel-Vitelic. ProMos sampled 64Mbit devices in 2Q97, expects mass productionto begin in 1Q98.
TI sells the output under its own logo.Spending $1.2 billion to build a 64MbitDRAM fab in Taipei. Operations are dueto begin in the spring of 1997.
Formerly government sponsoredIndustrial Technology Research Institute.First Taiwan-based company to developand show a fully functional 64Mbit DRAM.The part was made using a 0.4µm process.
Licensing 64Mbit manufacturingtechnology from Toshiba. It will thensupply the Japanese company with aportion of output.
1998
4Q96
4Q97/1Q98
4Q97
4Q97
2Q98
Joint-development with Oki
DRAM design/technologyassistance from Mitsubishi
Joint-development withMosel-Vitelic and Siemensfor 64M and later, 256MbitDRAM devices.
Designs from TI,manufacturing from Acer
—
Design from Toshiba
Nan Ya Technology
Powerchip Semiconductor
ProMos Technologies
TI-Acer
Vanguard International
Winbond
20031ESource: ICE, "Memory 1997"
Figure 2-35. Taiwan’s Ambitious 64Mbit DRAM Plans
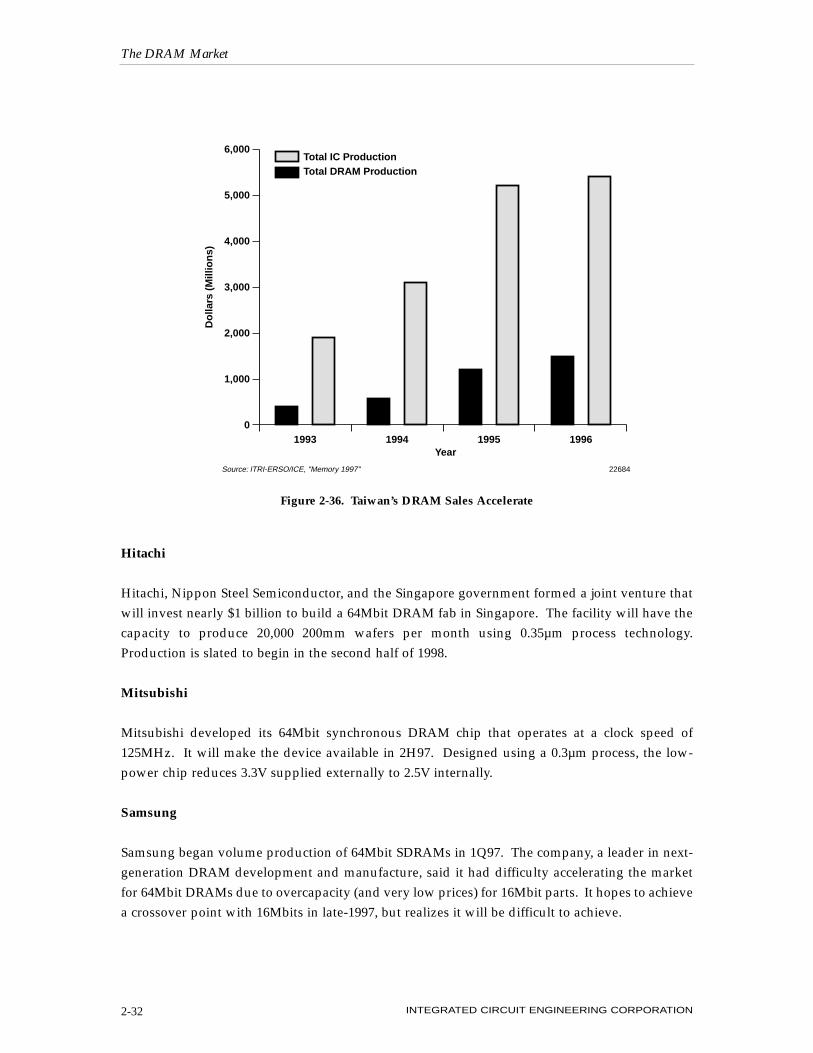
Hitachi
Hitachi, Nippon Steel Semiconductor, and the Singapore government formed a joint venture thatwill invest nearly $1 billion to build a 64Mbit DRAM fab in Singapore. The facility will have thecapacity to produce 20,000 200mm wafers per month using 0.35µm process technology.Production is slated to begin in the second half of 1998.
Mitsubishi
Mitsubishi developed its 64Mbit synchronous DRAM chip that operates at a clock speed of125MHz. It will make the device available in 2H97. Designed using a 0.3µm process, the low-power chip reduces 3.3V supplied externally to 2.5V internally.
Samsung
Samsung began volume production of 64Mbit SDRAMs in 1Q97. The company, a leader in next-generation DRAM development and manufacture, said it had difficulty accelerating the marketfor 64Mbit DRAMs due to overcapacity (and very low prices) for 16Mbit parts. It hopes to achievea crossover point with 16Mbits in late-1997, but realizes it will be difficult to achieve.
The DRAM Market
INTEGRATED CIRCUIT ENGINEERING CORPORATION2-32
0
1,000
2,000
3,000
4,000
5,000
6,000
1996199519941993Year
Do
llars
(M
illio
ns)
Total IC ProductionTotal DRAM Production
Source: ITRI-ERSO/ICE, "Memory 1997" 22684
Figure 2-36. Taiwan’s DRAM Sales Accelerate
Toshiba
On the heels of Intel’s equity investment announcement with Samsung, Toshiba also started nego-tiations with Samsung about acquiring a 20 percent stake in the Korean company’s new Austin,Texas, DRAM fab. If the deal goes through, Toshiba would get 20 percent of the 64Mbit DRAMsproduced at the Samsung fab.
Toshiba also announced, along with its joint-venture DRAM partner Motorola, that it would post-pone by more than one year the construction of a 64Mbit DRAM production facility at its TohokuSemiconductor operation. Although Toshiba has not ruled out giving up 64Mbit DRAM produc-tion at the joint venture, it and Motorola may not be able to launch volume production whendemand for the devices peaks.
Additionally, Toshiba rolled out its first 64Mbit SDRAM parts in 2Q97. Three configurations varyin speed from 83MHz to 125MHz.
128Mbit DRAM
In 2Q97, at least five DRAM suppliers declared their intentions to manufacture 128Mbit DRAMsin order to delay the heavy costs associated with developing 256Mbit devices. Further, the groupbelieves they can provide customers with a cost-effective means to meet growing system memoryrequirements.
Rather than jumping from the 64Mbit generation straight to 256Mbit devices, Samsung, NEC,Texas Instruments, Fujitsu, Hyundai, and a handful of other leading DRAM suppliers haveplanned a generational “half-step” with 128Mbit DRAM products. Driving the move to the128Mbit density is industry concern over investment in 256Mbit DRAM technology after suffer-ing through tremendous DRAM price declines during the past year. Also, computer manufactur-ers including IBM and Compaq called for a transitional density to satisfy memory granularityissues as PC main memory swells to 64Mbytes.
NEC expects to have samples of a 128Mbit SDRAM ready in the first half of 1998. Likewise,Fujitsu is working on a 128Mbit SDRAM and expects to have engineering samples available in1Q98. Hyundai, also, plans to introduce its 128Mbit device in 1H98 when it shrinks its 75Mbit partto a 0.25µm process.
Texas Instruments plans to introduce its 128Mbit device in mid-1999. TI believes that the 256Mbitchip will be too expensive to bring to market until after the year 2000 and is therefore concentrat-ing on the 128Mbit DRAM. TI will use the same 0.18µm process it expects to use for its 256Mbitchip. Samsung plans to stick with its 1999 volume production plans for 256Mbit devices and willbuild 128Mbit parts only to address a temporary need.
The DRAM Market
INTEGRATED CIRCUIT ENGINEERING CORPORATION 2-33

Toshiba gave the go-ahead to develop a 128Mbit SDRAM but actual development work had notstarted as of 2Q97. Hitachi’s preliminary decision was to forego 128Mbit development because itfelt its DRAM product portfolio was bloated. Other suppliers, including Micron and LG Semicon,have yet to decide whether to pursue the 128Mbit generation or move on directly to 256Mbitdevices.
256Mbit DRAMs
256Mbit DRAMs have been developed by a few manufacturers. NEC shipped samples of its256Mbit DRAM in 1996. The company initially forecasted that commercial production of thedevices would begin in 1998. That date has since been pushed out to late 1999 or 2000.
Samsung sampled its 256Mbit part in 1996. Meanwhile, Fujitsu announced that it developed a256Mbit SDRAM and plans to start sample shipments in 1998. Its chip was designed using a0.28µm process.
Toshiba also plans to launch 256Mbit DRAM production in 1998. It plans to make its devices atits new facility in Oita, Japan, using 0.25µm process technology.
Gigabit DRAMs
It may be several years before the devices can be easily purchased, but for memory manufactur-ers, the era of the gigabit DRAM is at hand. In 4Q96, Samsung announced it fabricated a 1GbitDRAM on “laboratory silicon,” claiming to be the first company to do so. The company investedmore than $250 million to develop the device, which was built using 0.18µm technology.Evaluation samples of its chip are expected to appear in 1997. The 500mm-square IC uses a spe-cial 32-bank synchronous technology to accelerate the chip’s processing speed, estimated at 31ns,and to permit burst transfer rates as high as one gigabit per second. At the 1996 Cymer Seminar,Samsung provided a review of its DRAM roadmap through the 16Gbit generation (Figure 2-37).
The DRAM Market
INTEGRATED CIRCUIT ENGINEERING CORPORATION2-34
First Production
First Working Die
Design Rule (Microns)
Required Overlay (nm)
Die Size (sq. mm)
Stepper Field Size (mm)
2001
1998
0.18
50
780
26 x 30
2004
1999
0.13
40
938
26 x 36
2007
2002
0.10
20
1,144
26 x 44
1Gbit 4Gbit 16Gbit
Source: Samsung/1996 Crymer Seminar/ICE, "Memory 1997" 22685
Figure 2-37. Samsung’s Gigabit DRAM Roadmap

At NEC, researchers rejected Samsung’s 1Gbit leadership stance. The Japanese company stated itearlier developed a prototype and expected to ship evaluation devices to customers in 1997.Moreover, it claimed engineering samples would be ready for delivery by the year 2000.
Memory powerhouses Hitachi, Mitsubishi, and Texas Instruments announced in 1Q97 that theywould cooperate in the development of 1Gbit DRAMs. The immediate purpose of the venturewas to share technology, research and development of process and design capabilities, and theproduction of prototype chips.
The venture will compete with a joint-development team involving four of the world’s leading ICmanufacturers—IBM, Motorola, Siemens, and Toshiba. Together, the companies pooled their con-siderable resources in an effort to design, develop, and bring 1Gbit DRAMs to market (if only insample form) by the year 2000.
It should be noted that Toshiba, in 2Q97, reviewed its role in the venture and recalled to Japan 70engineers working on the project. The company claimed there was no rupture in the relationshipbut that it had to re-examine the 1Gbit effort before further committing to the venture.
At the next level, NEC reportedly prototyped a 4Gbit DRAM device that measured 986mm-square(compared to 100mm-square for a 1995/1996 16Mbit DRAM), or approximately one-and-a-quarterinches on a side. To achieve the die size, NEC adopted an advanced 0.15µm process CMOS process.
The 4Gbit DRAM can store 47 minutes of full-motion video, six hours of audio data, or the com-plete works of William Shakespeare 64 times over. NEC, which spent more than $160 million ondevelopment, plans to invest another $645 million of R&D before mass production is launched.Sample shipments are slated for 2000.
Hyundai also started on the long road to 4Gbit DRAM output. It signed a joint developmentagreement with Eaton Semiconductor Equipment Operations to develop the tools needed to make4Gbit DRAM devices. The company stated that it did not expect 4Gbit DRAM devices to be avail-able until 2010 when it would implement a 0.07µm process technology.
The DRAM Market
INTEGRATED CIRCUIT ENGINEERING CORPORATION 2-35