NextGen Drainage Solutions. History Of Tile Drainage NextGen Drainage Solutions.
Upload
howard-wilkinsCategory
view
219download
2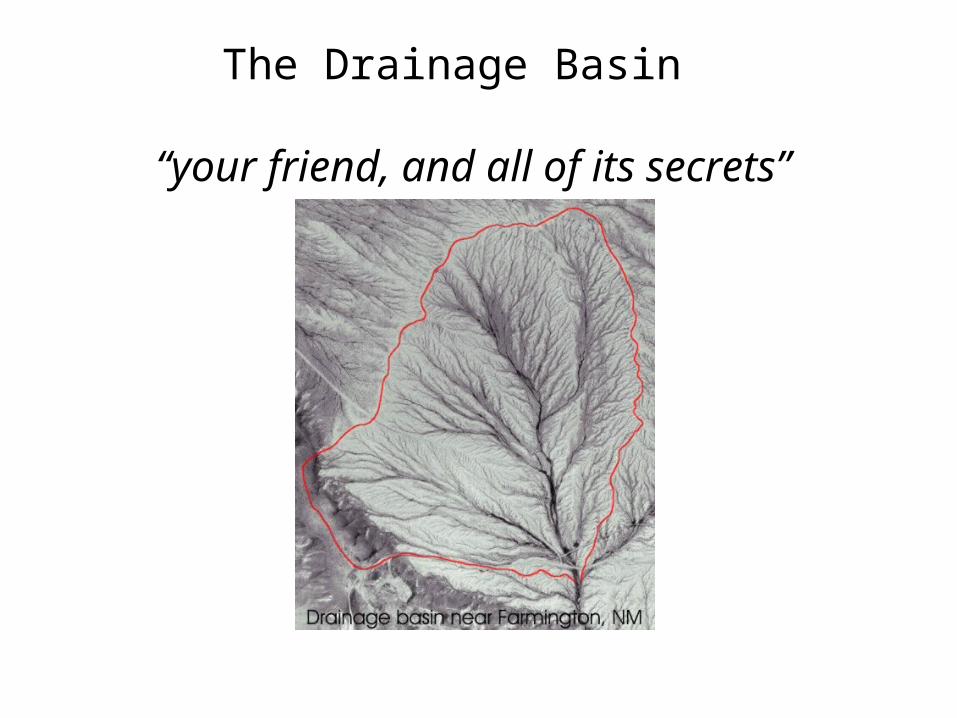
The Drainage Basin
“your friend, and all of its secrets”
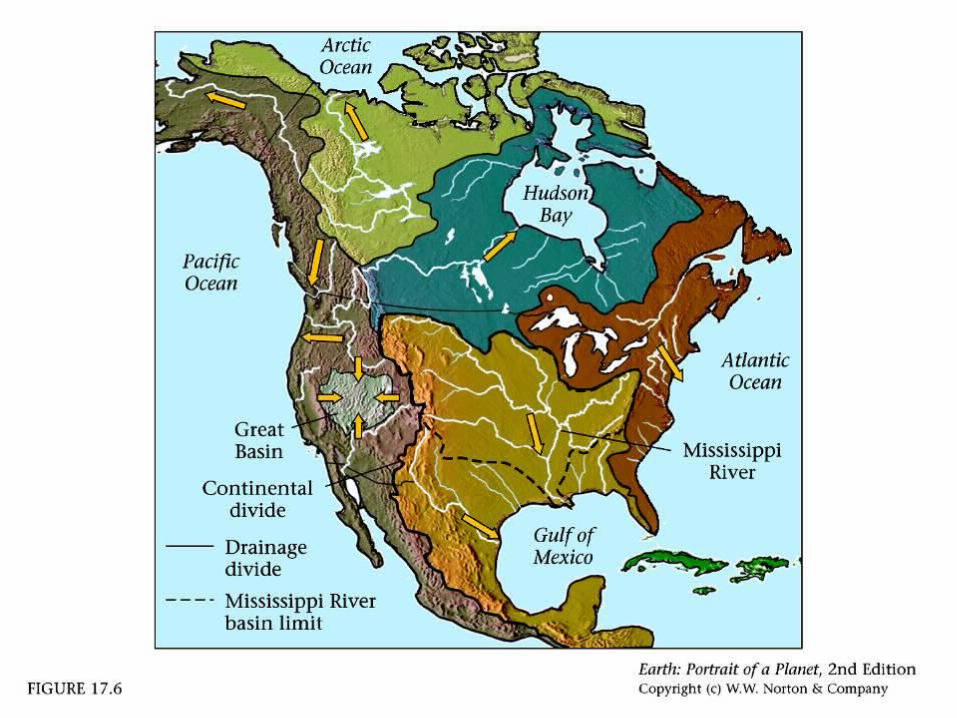
I. Introduction--two general relationships realized concerning drainage basins
I. Introduction--two general relationships realized concerning drainage basins
* streams form their valleys in which they flow
I. Introduction--two general relationships realized concerning drainage basins
* streams form their valleys in which they flow* every river consists of a major stream that is fed by a number of mutually adjusted branches that diminish in size away from the main stem.
I. IntroductionII. Slope Hydrology and Runoff Generation
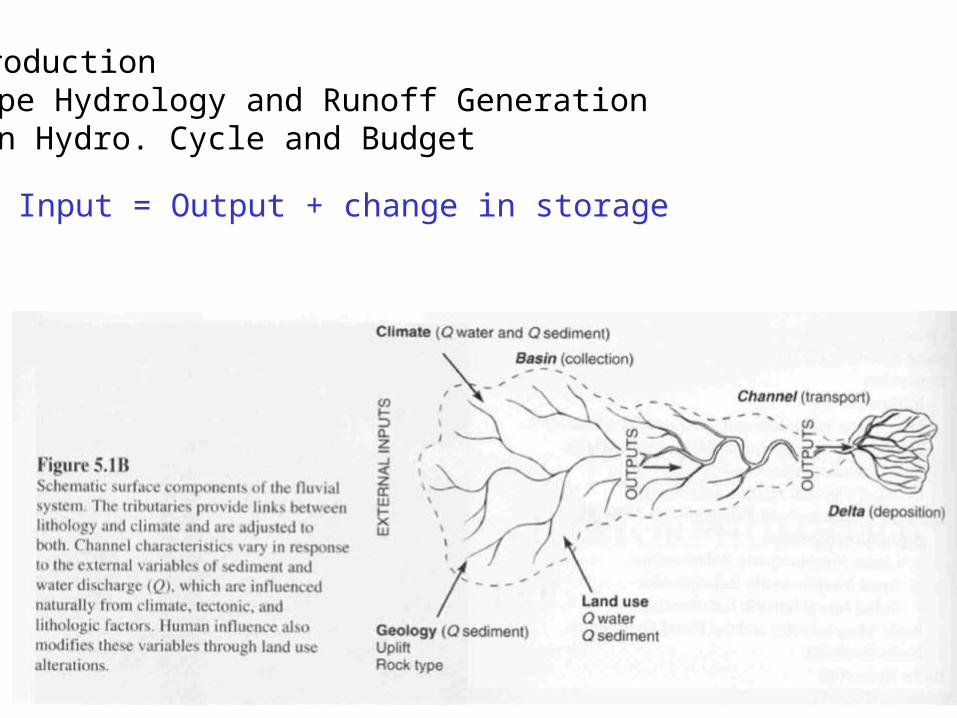
I. IntroductionII. Slope Hydrology and Runoff GenerationA. Basin Hydro. Cycle and Budget
Input = Output + change in storage
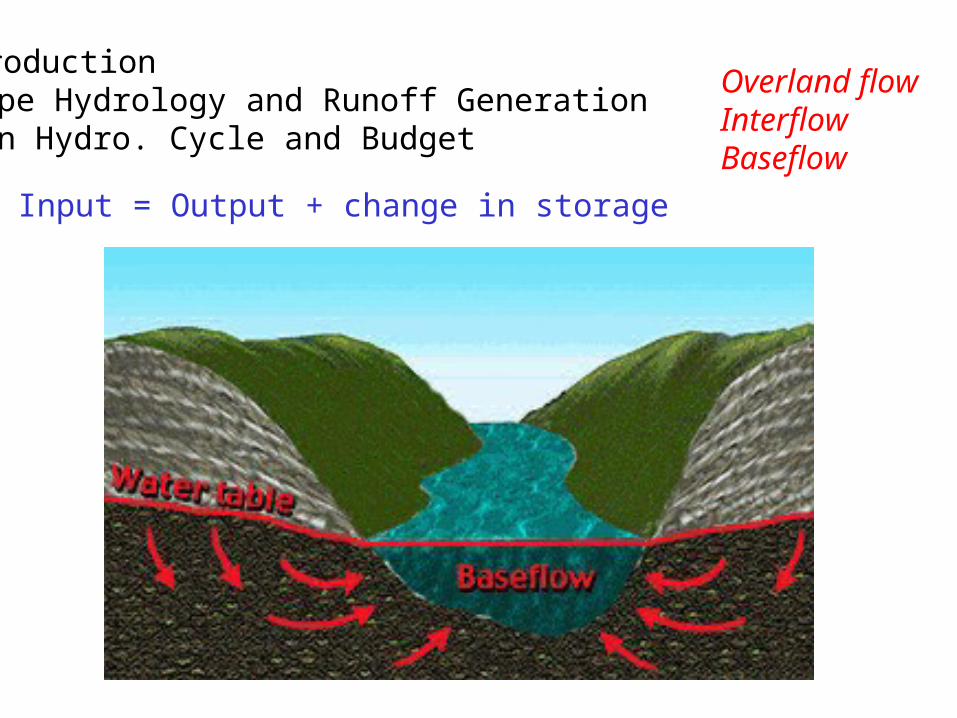
I. IntroductionII. Slope Hydrology and Runoff GenerationA. Basin Hydro. Cycle and Budget
Input = Output + change in storage
Overland flowInterflowBaseflow
I. IntroductionII. Slope Hydrology and Runoff GenerationA. Basin Hydro. Cycle and BudgetB. The Storm Hydrograph
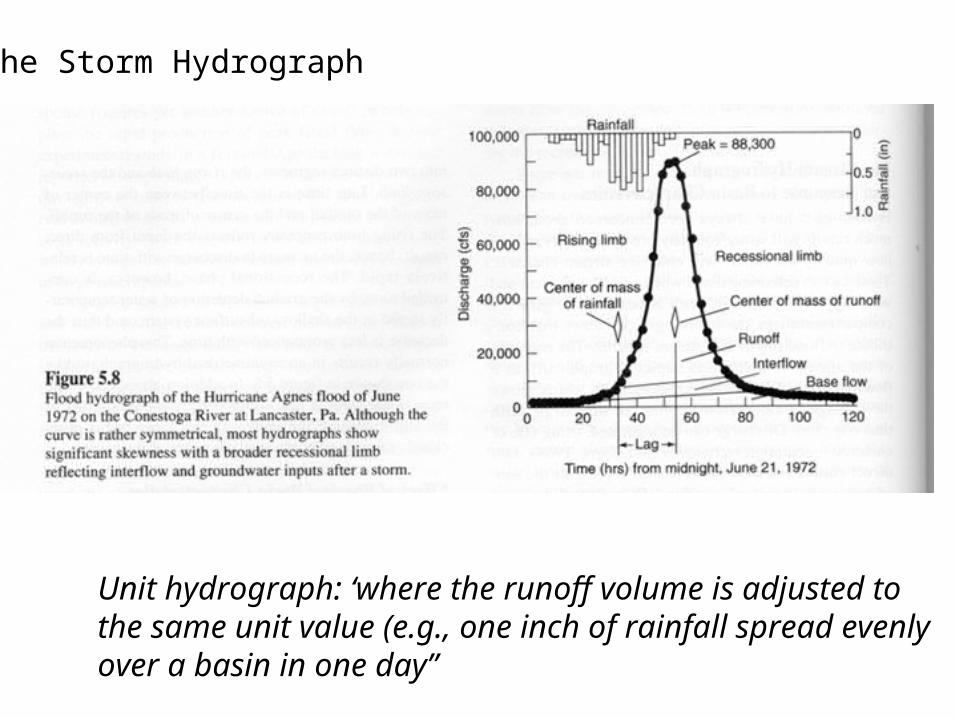
B. The Storm Hydrograph
Unit hydrograph: ‘where the runoff volume is adjusted tothe same unit value (e.g., one inch of rainfall spread evenly over a basin in one day”
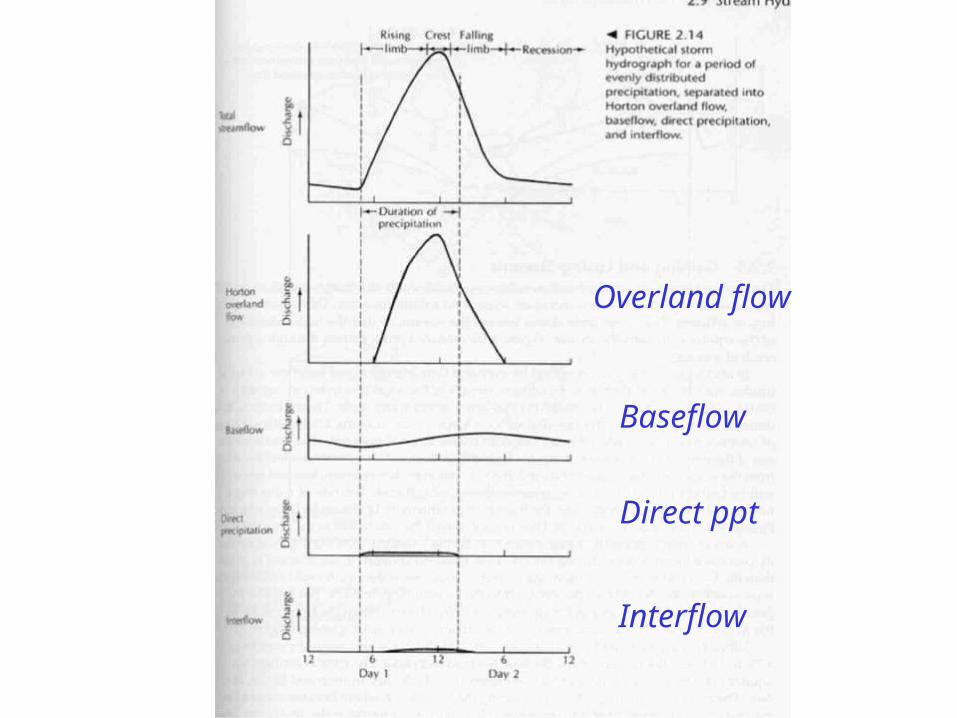
Overland flow
Baseflow
Direct ppt
Interflow


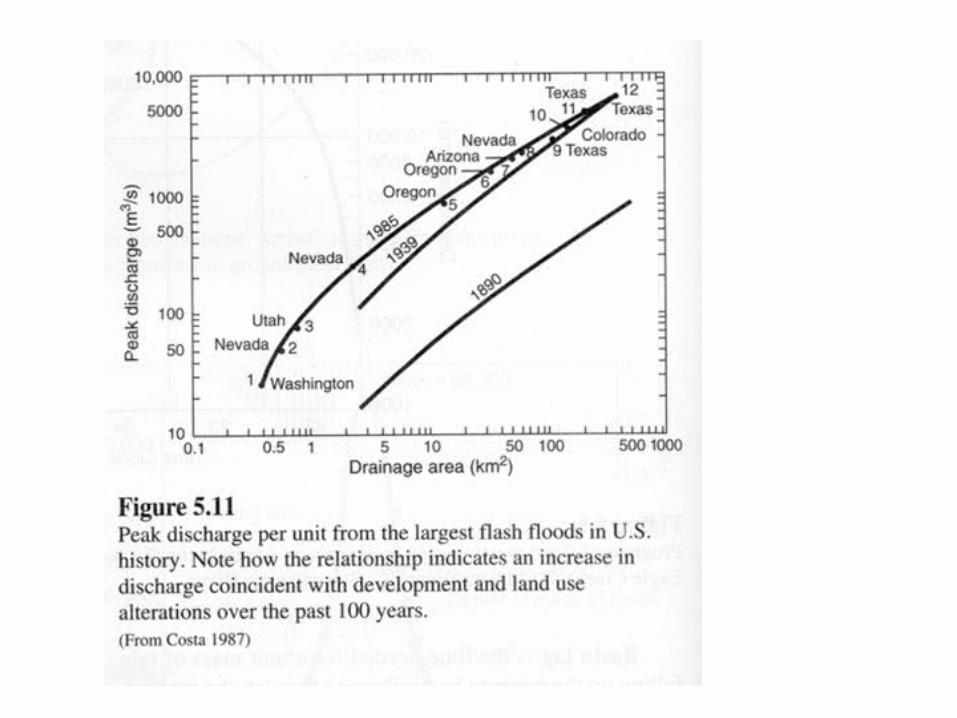
Basin Area
Discharge
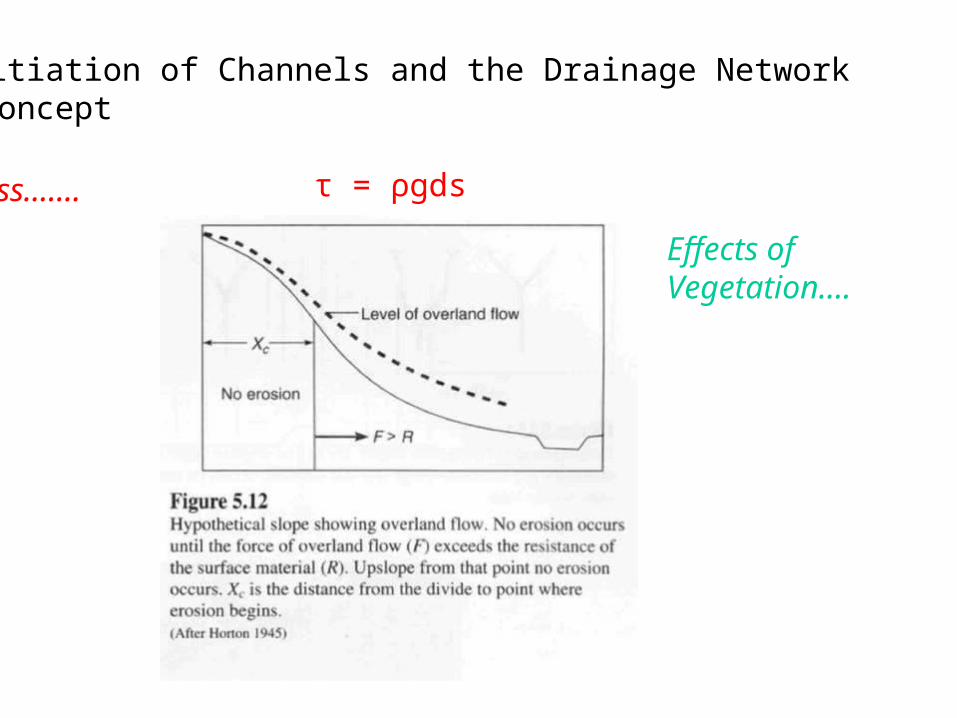
III. Initiation of Channels and the Drainage NetworkA. The concept

III. Initiation of Channels and the Drainage NetworkA. The concept
Shear stress…….
III. Initiation of Channels and the Drainage NetworkA. The concept
Shear stress…….
Effects of Vegetation….
τ = ρgds
III. Initiation of Channels and the Drainage NetworkA. The concept
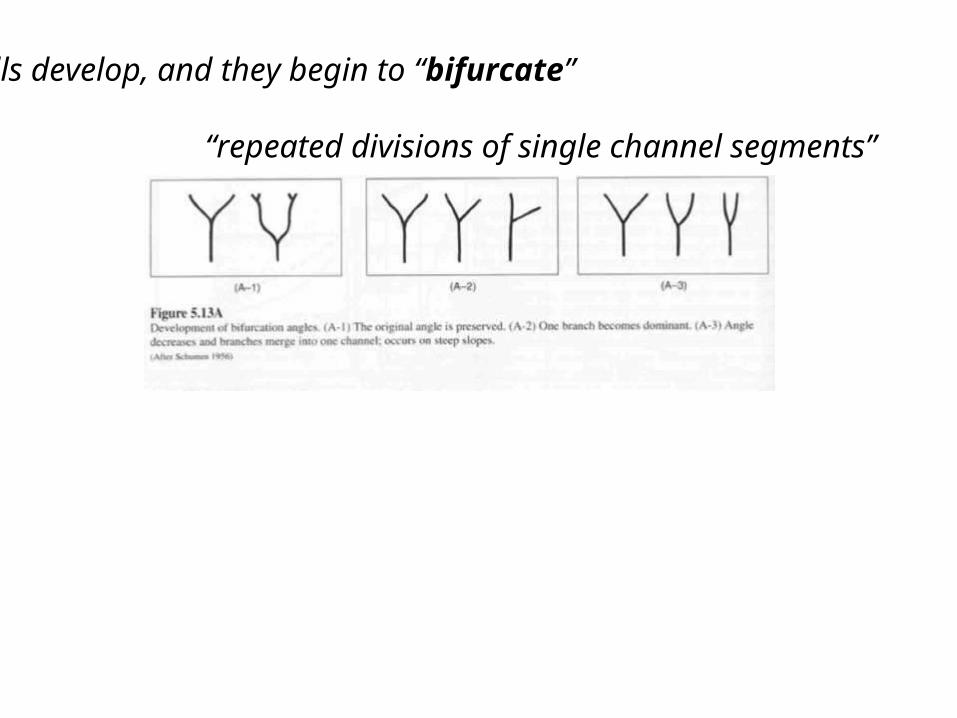
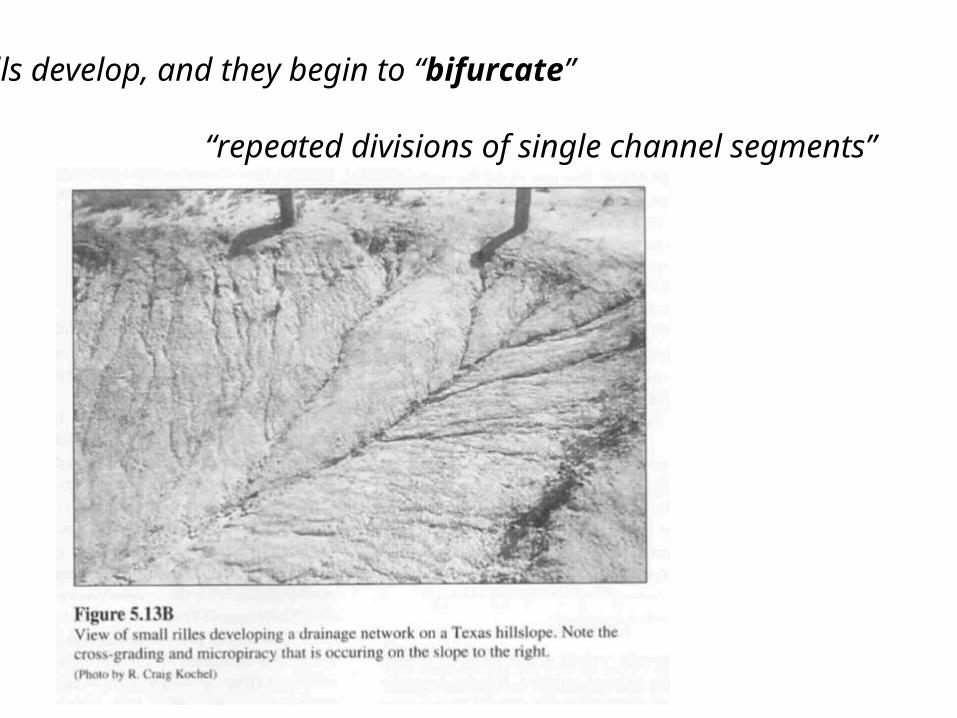
Rills develop, and they begin to “bifurcate”
“repeated divisions of single channel segments”
Rills develop, and they begin to “bifurcate”
“repeated divisions of single channel segments”
Rills develop, and they begin to “bifurcate”
“repeated divisions of single channel segments”
III. Initiation of Channels and the Drainage NetworkB. Basin Morphometry
refers to the geometry of the basin
B. Basin Morphometryrefers to the geometry of the basin
Drainage Compositionrefers to the distinct fabric of the drainage basin
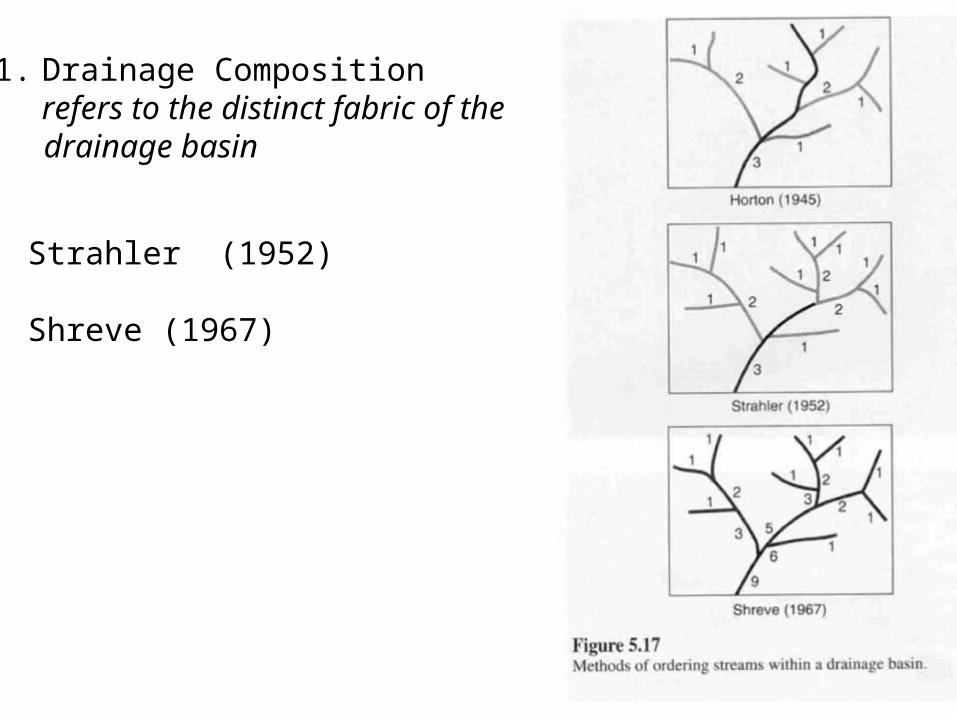
1. Drainage Compositionrefers to the distinct fabric of the
drainage basin
Strahler (1952)
Shreve (1967)
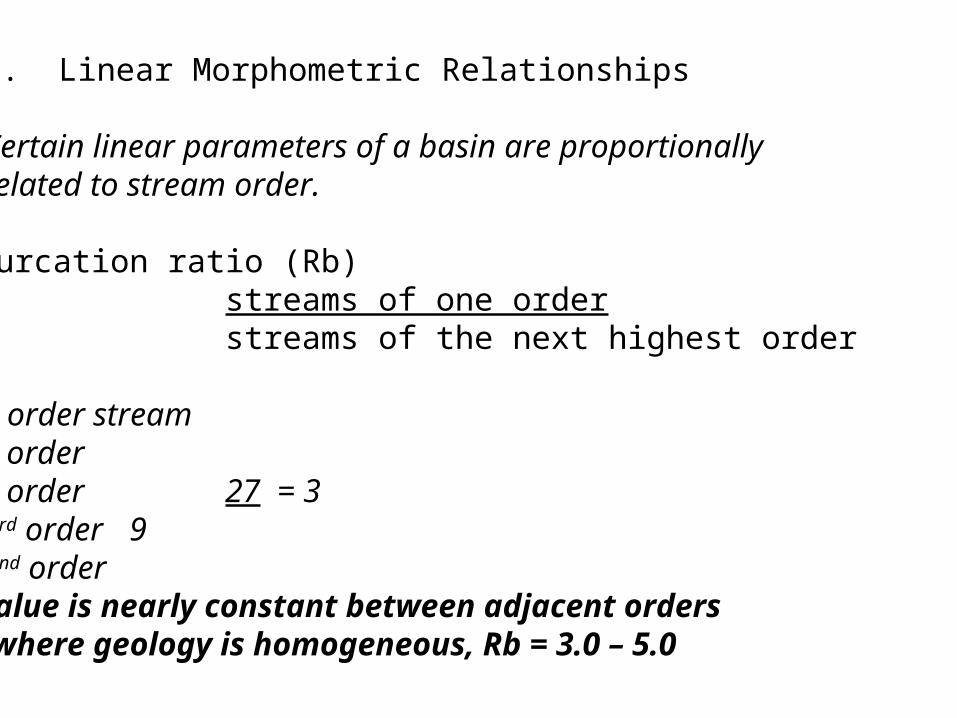
2. Linear Morphometric Relationships
Certain linear parameters of a basin are proportionallyrelated to stream order.
a. Bifurcation ratio (Rb)streams of one orderstreams of the next highest order
2. Linear Morphometric Relationships
Certain linear parameters of a basin are proportionallyrelated to stream order.
a. Bifurcation ratio (Rb)streams of one orderstreams of the next highest order
Ex: 1 6th order stream3 5th order9 4th order 27 = 327 3rd order 981 2nd order
Ratio value is nearly constant between adjacent ordersAND….where geology is homogeneous, Rb = 3.0 – 5.0


2. Linear Morphometric Relationships
Certain linear parameters of a basin are proportionallyrelated to stream order.
b. Length ratio ave length of streams of one order ave length streams of the next highest order
Can be used to determine the average length of streams inan unmeasured order.

3. Aerial Morphometric Relationships
a. Drainage density (Dd) total length of streams in basin basin area
Reflects the interaction between geology and climate
In general….
4. Relief Morphometric Relationships
a. Relief Highest elevation – lowest elevation
Reflects the vertical dimensions of drainage basin
Includes factors of gradient and elevation
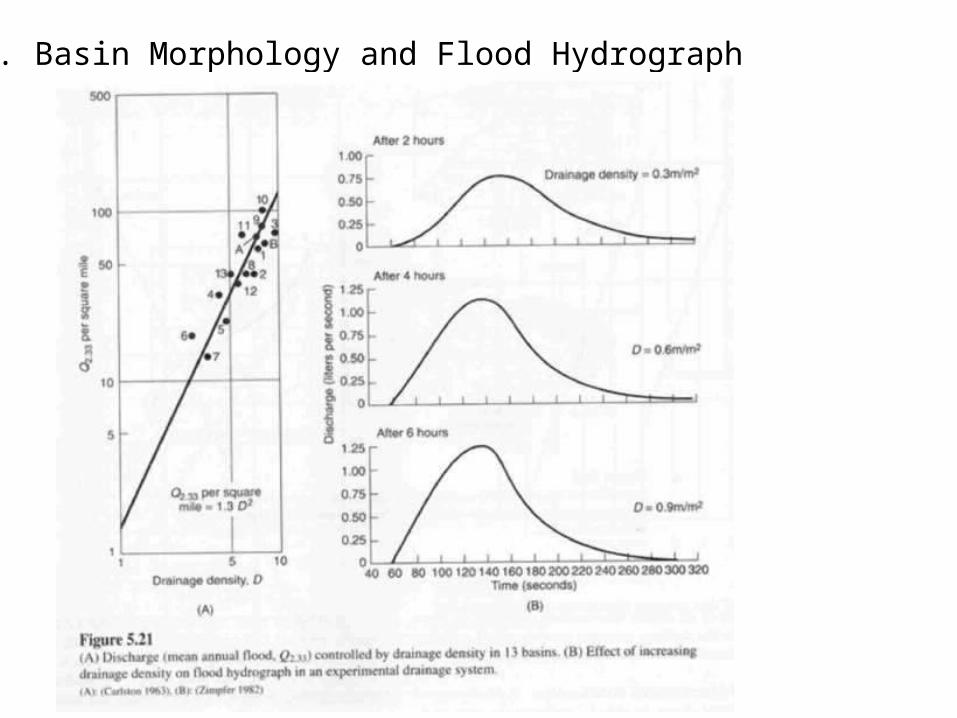
IV. Basin Morphology and Flood Hydrograph

IV. Basin Morphology and Flood Hydrograph
V. Basin Evolution and Denudation
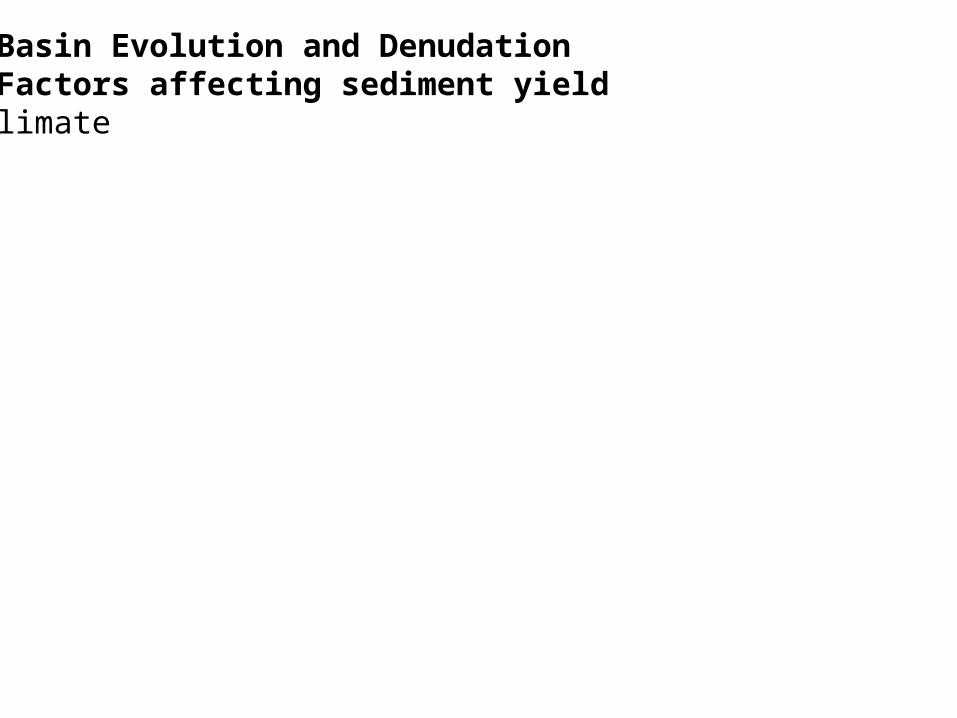
V. Basin Evolution and DenudationA. Factors affecting sediment yield* climate

V. Basin Evolution and DenudationA. Factors affecting sediment yield* climate
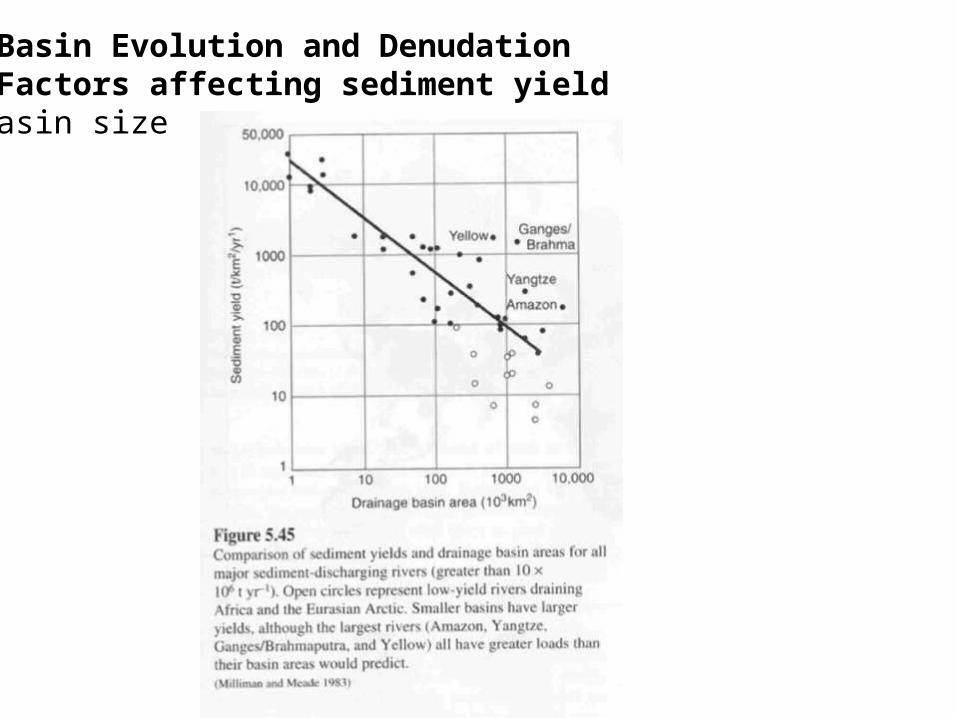
V. Basin Evolution and DenudationA. Factors affecting sediment yield* basin size
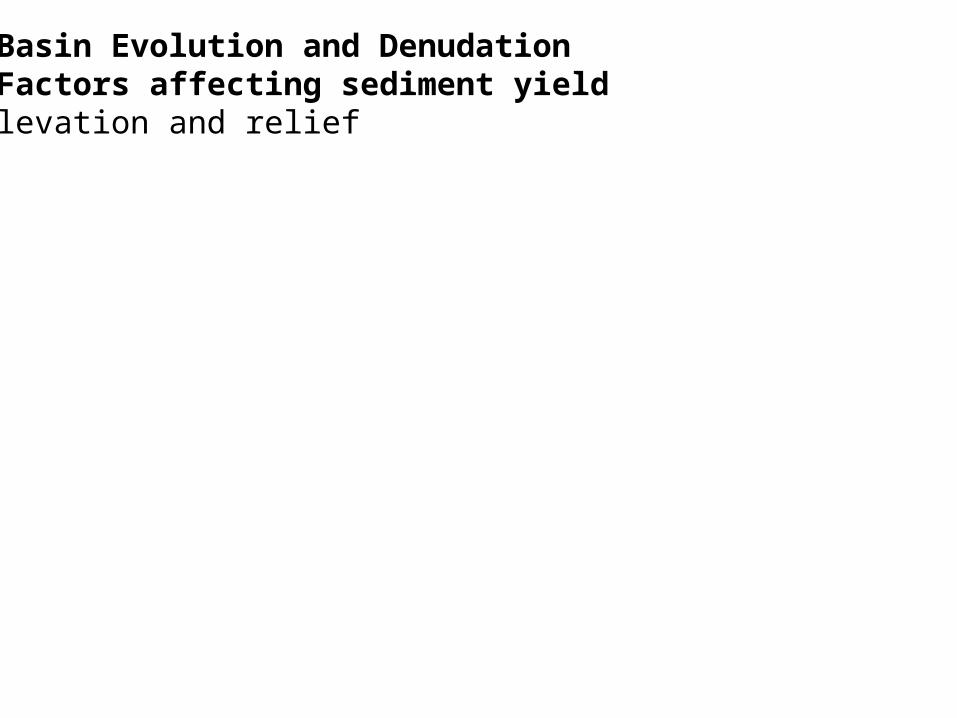
V. Basin Evolution and DenudationA. Factors affecting sediment yield* elevation and relief
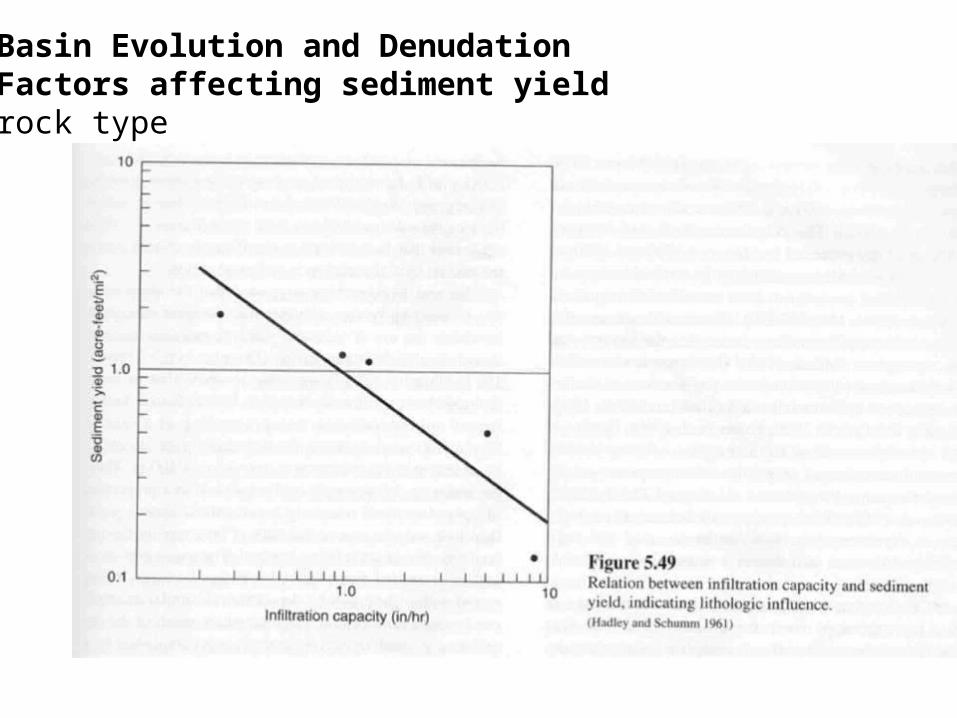
V. Basin Evolution and DenudationA. Factors affecting sediment yield* rock type
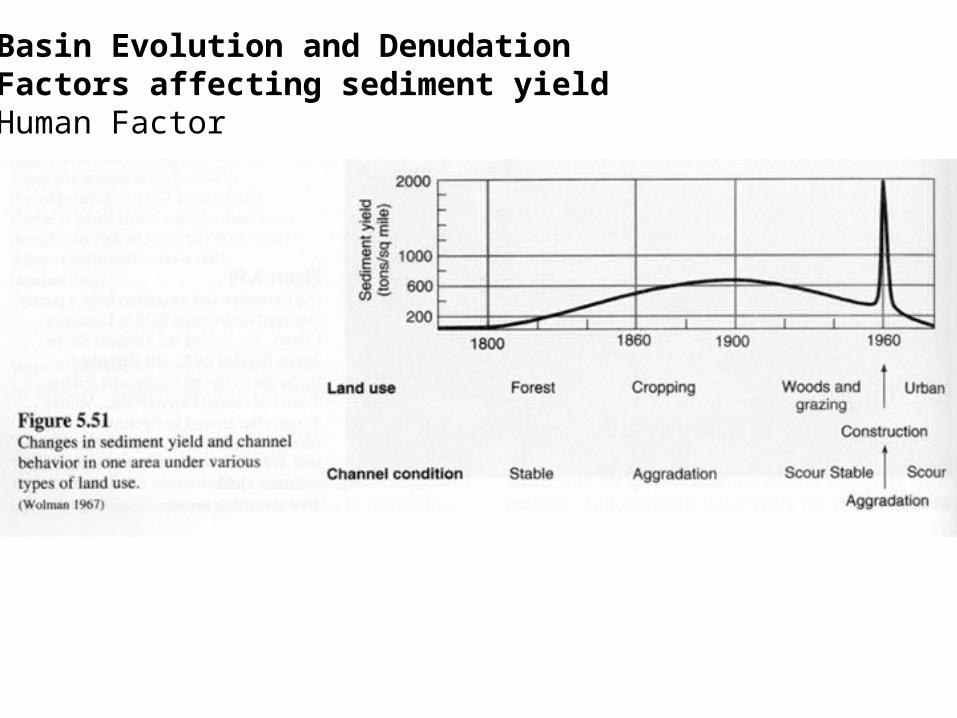
V. Basin Evolution and DenudationA. Factors affecting sediment yield* Human Factor

V. Basin Evolution and DenudationA. Factors affecting sediment yield* Human Factor
V. Basin Evolution and DenudationA. Factors affecting sediment yieldB. How do basins erode (denute?)
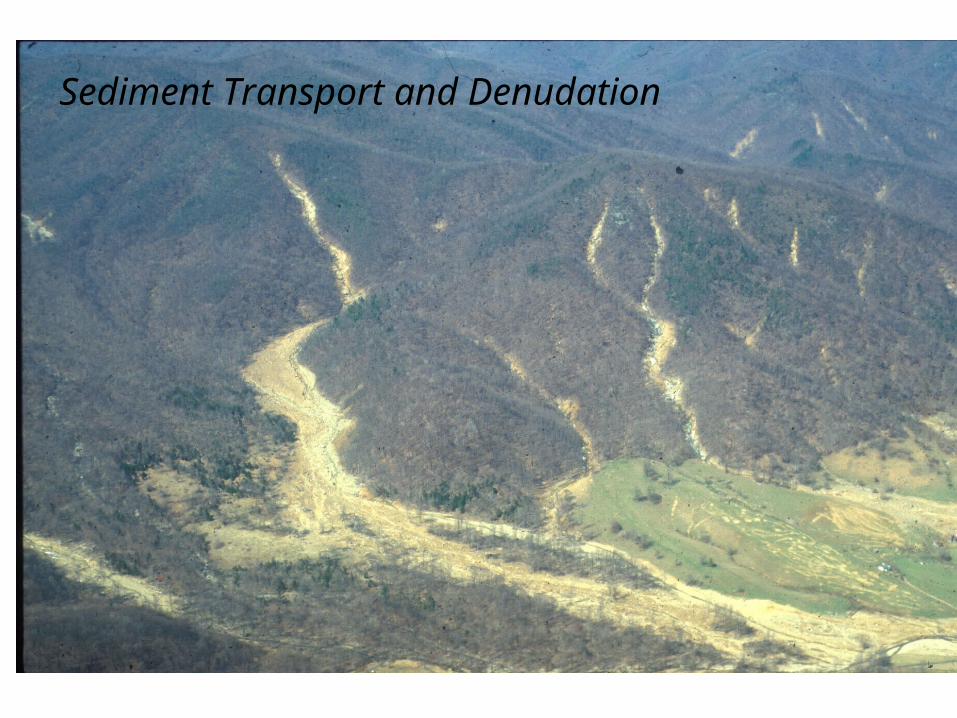
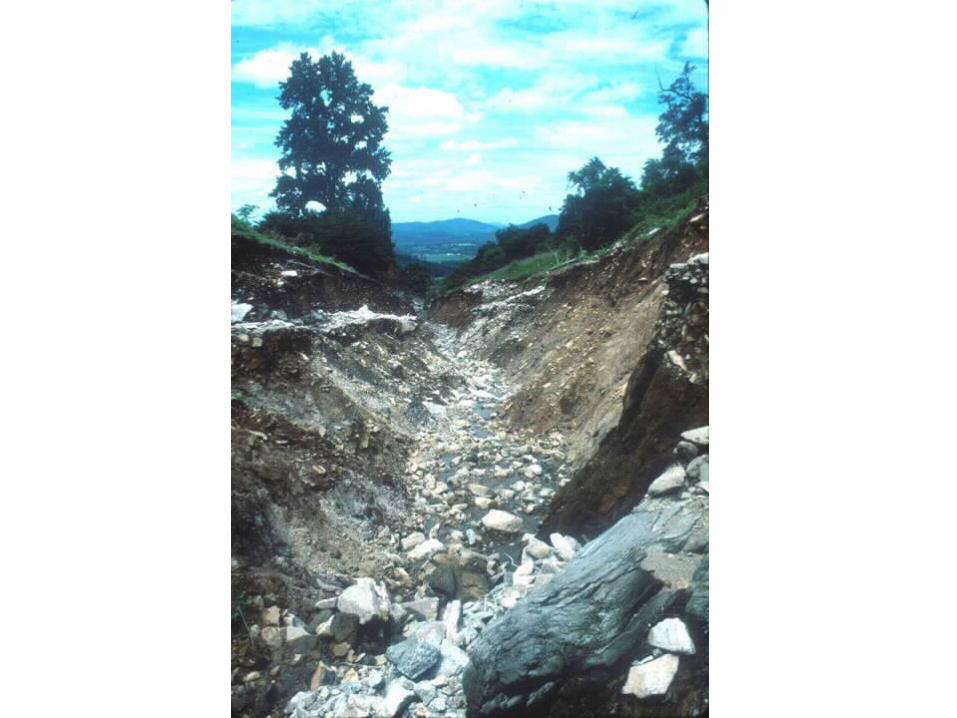
Sediment Transport and Denudation

0.398 km2
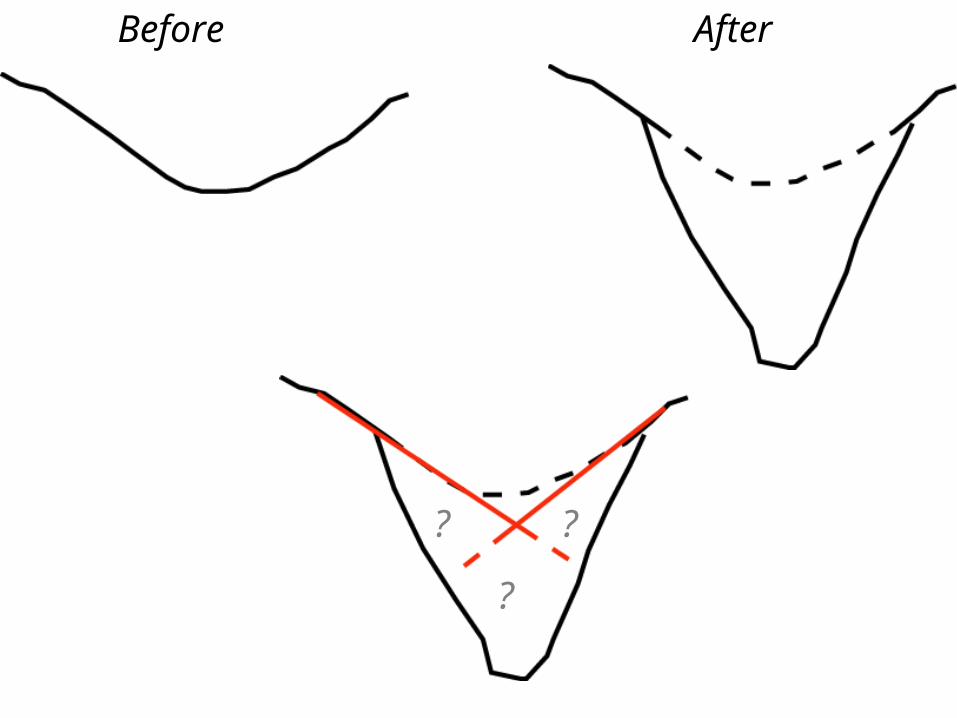
Before After
? ?
?
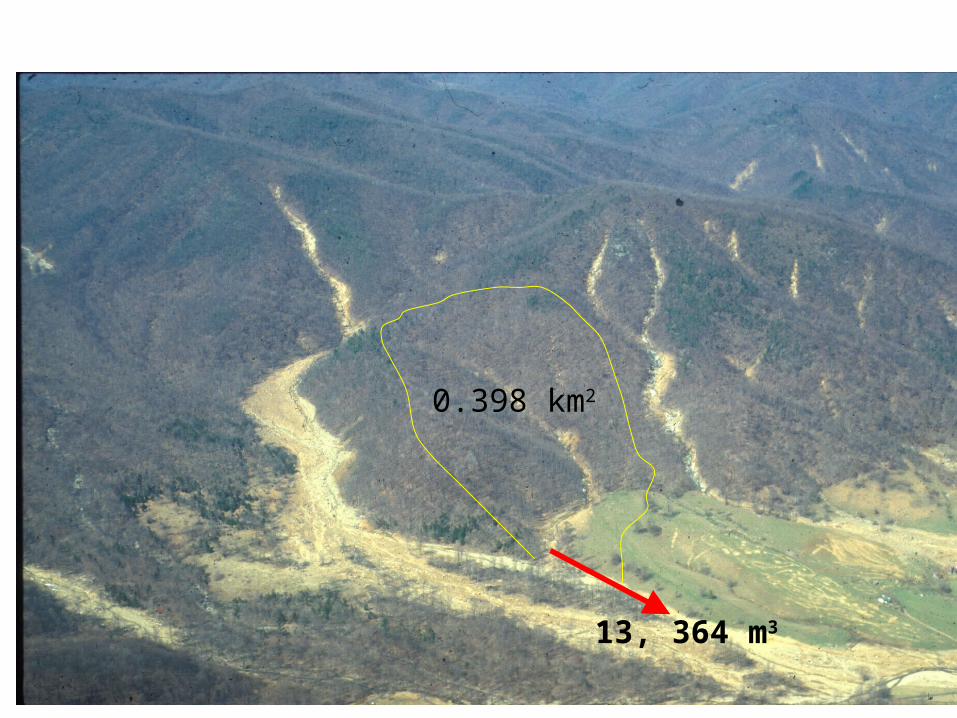
13, 364 m3
0.398 km2
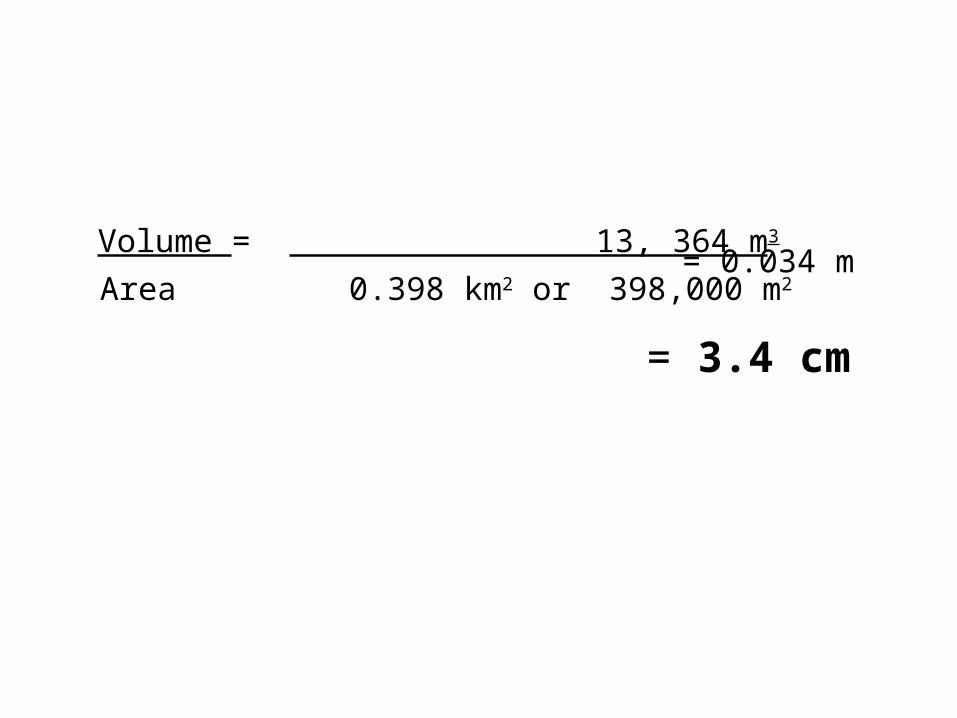
Volume = 13, 364 m3
Area 0.398 km2 or 398,000 m2 = 0.034 m
= 3.4 cm
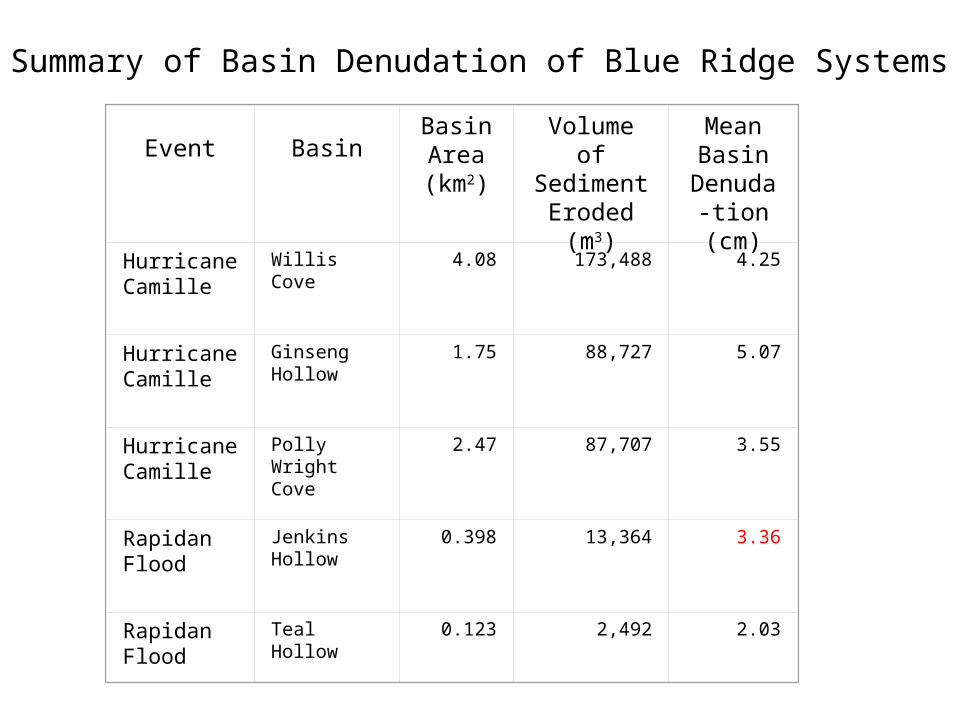
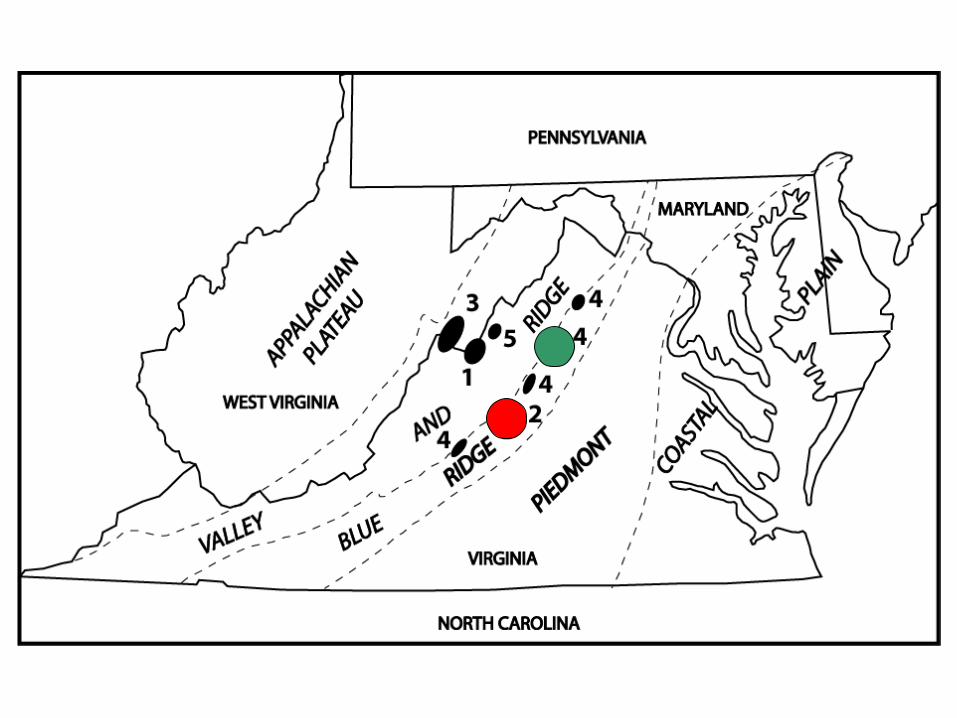
Summary of Basin Denudation of Blue Ridge Systems
Event
BasinBasin Area (km2)
Volume ofSediment Eroded
(m3)
Mean Basin
Denuda-tion (cm)
HurricaneCamille
Willis Cove
4.08 173,488 4.25
HurricaneCamille
Ginseng Hollow
1.75 88,727 5.07
HurricaneCamille
Polly Wright Cove
2.47 87,707 3.55
Rapidan Flood
Jenkins Hollow
0.398 13,364 3.36
Rapidan Flood
Teal Hollow 0.123 2,492 2.03
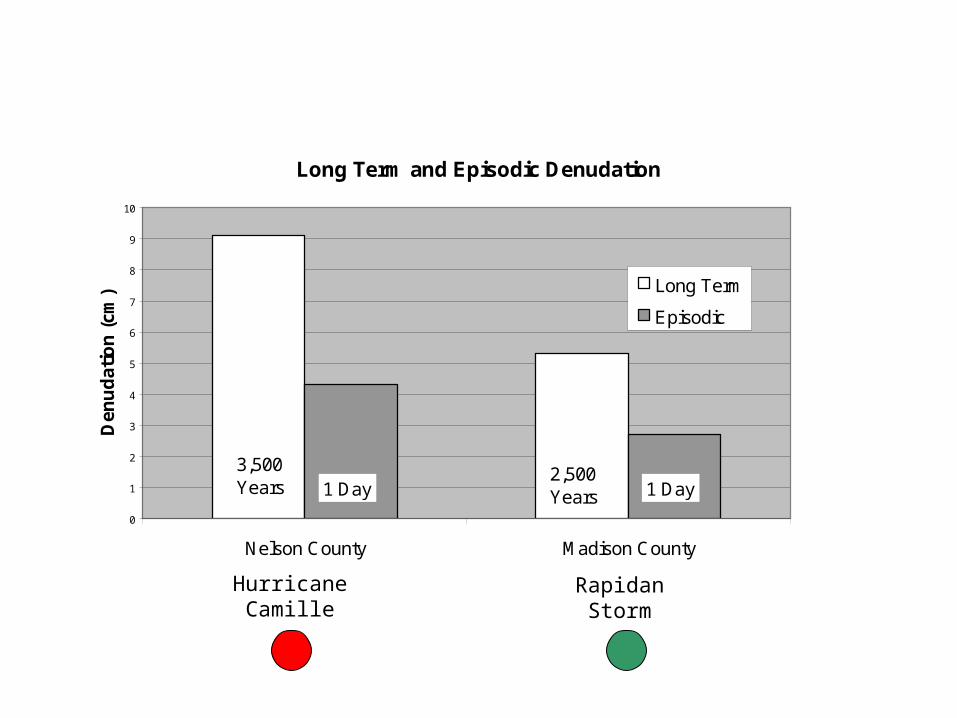
Long Term and Episodic Denudation
0
1
2
3
4
5
6
7
8
9
10
Nelson County Madison County
Den
ud
atio
n (
cm) Long Term
Episodic
3,500 Years 1 Day
2,500Years 1 Day
HurricaneCamille
RapidanStorm
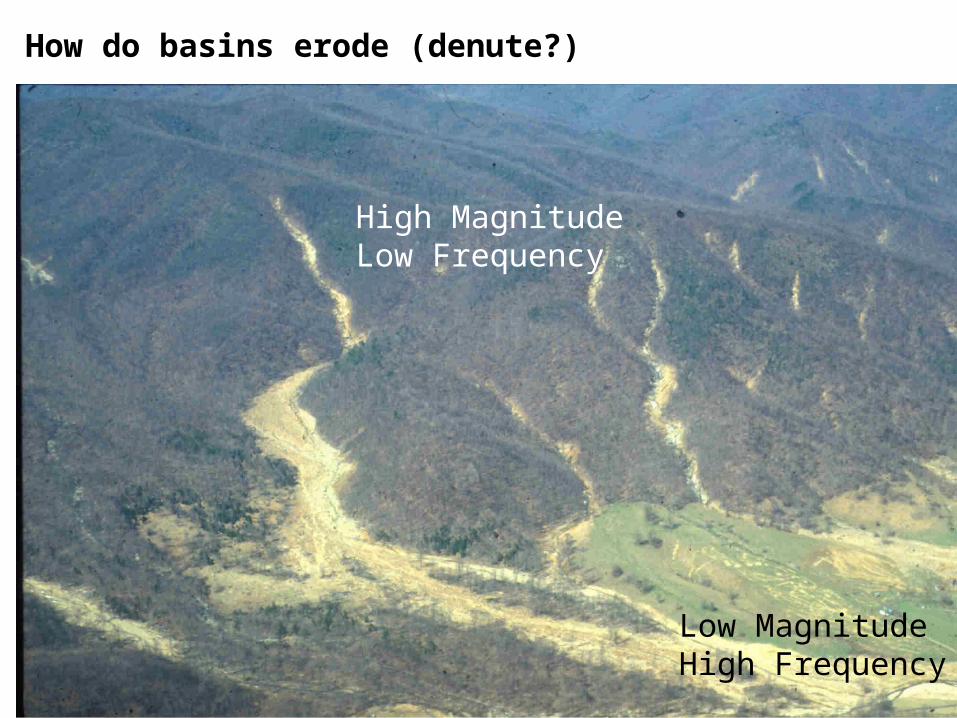
B. How do basins erode (denute?)
High MagnitudeLow Frequency
Low MagnitudeHigh Frequency
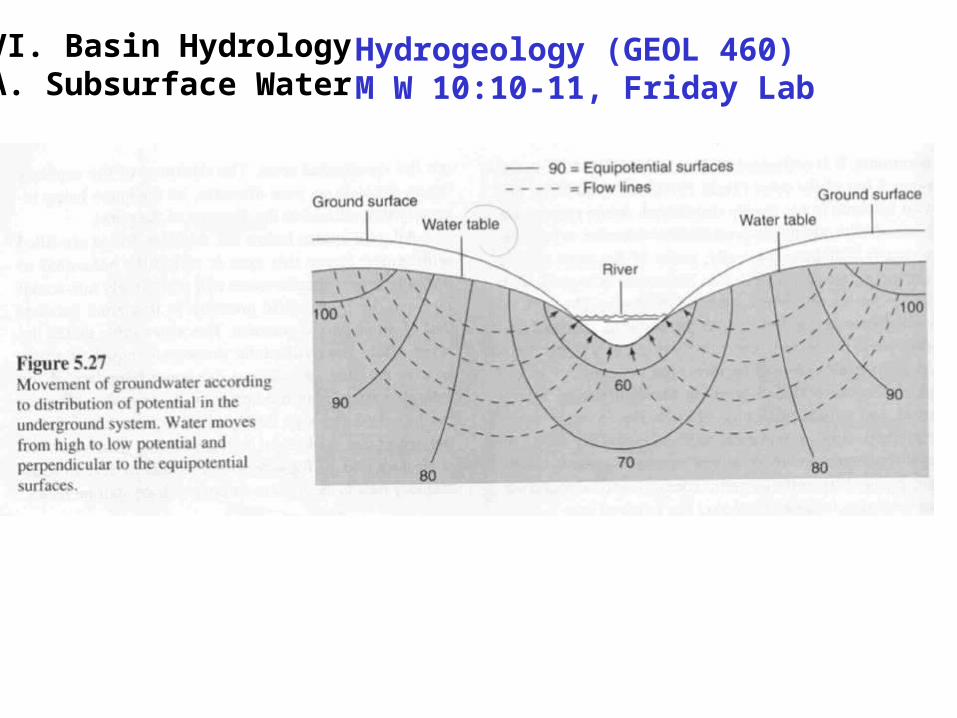
VI. Basin HydrologyA. Subsurface Water
Hydrogeology (GEOL 460)M W 10:10-11, Friday Lab
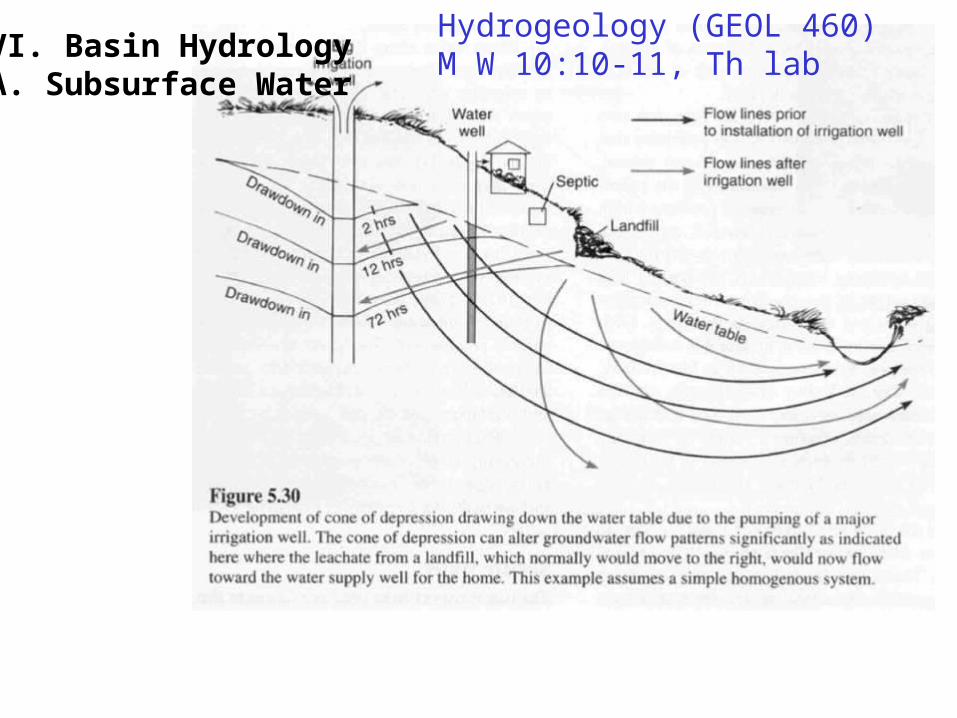
VI. Basin HydrologyA. Subsurface Water
Hydrogeology (GEOL 460)M W 10:10-11, Th lab
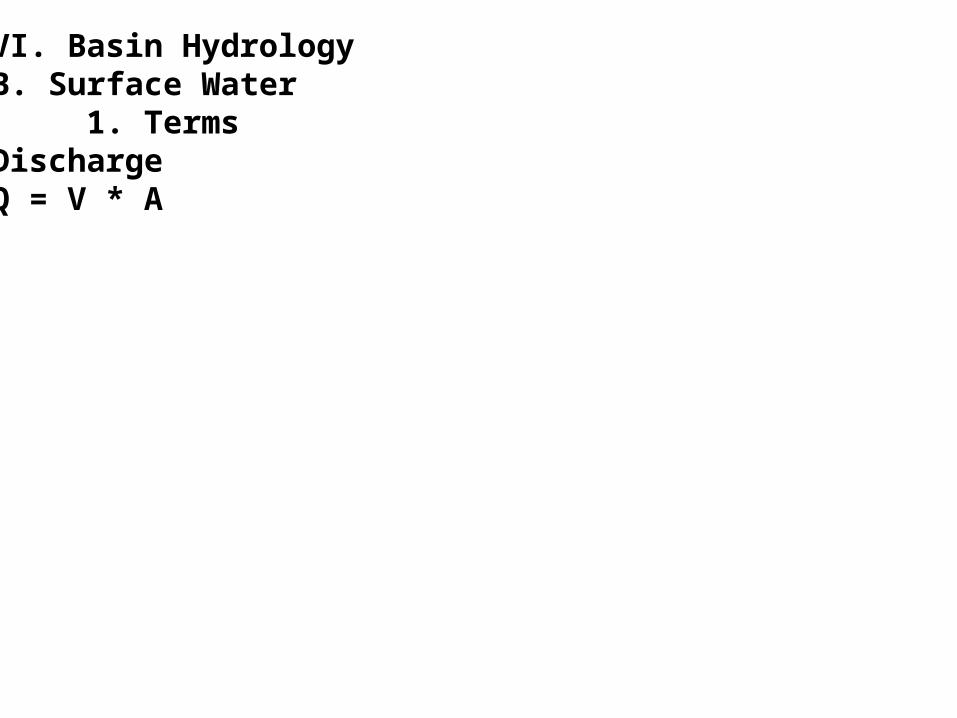
VI. Basin HydrologyB. Surface Water 1. TermsDischargeQ = V * A
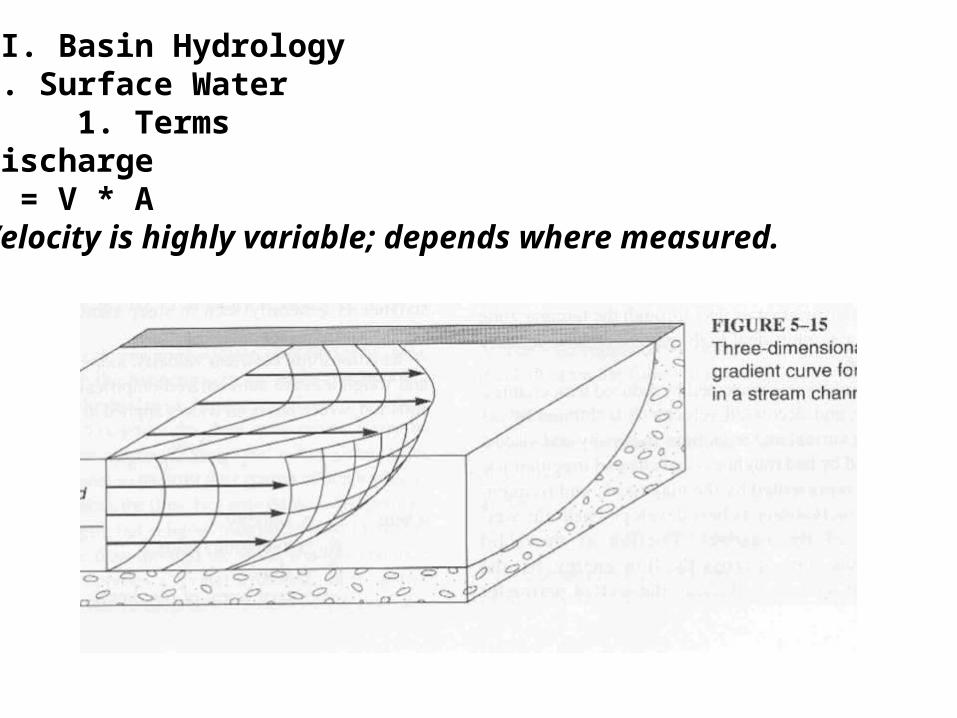
VI. Basin HydrologyB. Surface Water 1. TermsDischargeQ = V * AVelocity is highly variable; depends where measured.

Velocity is highly variable; depends where measured.
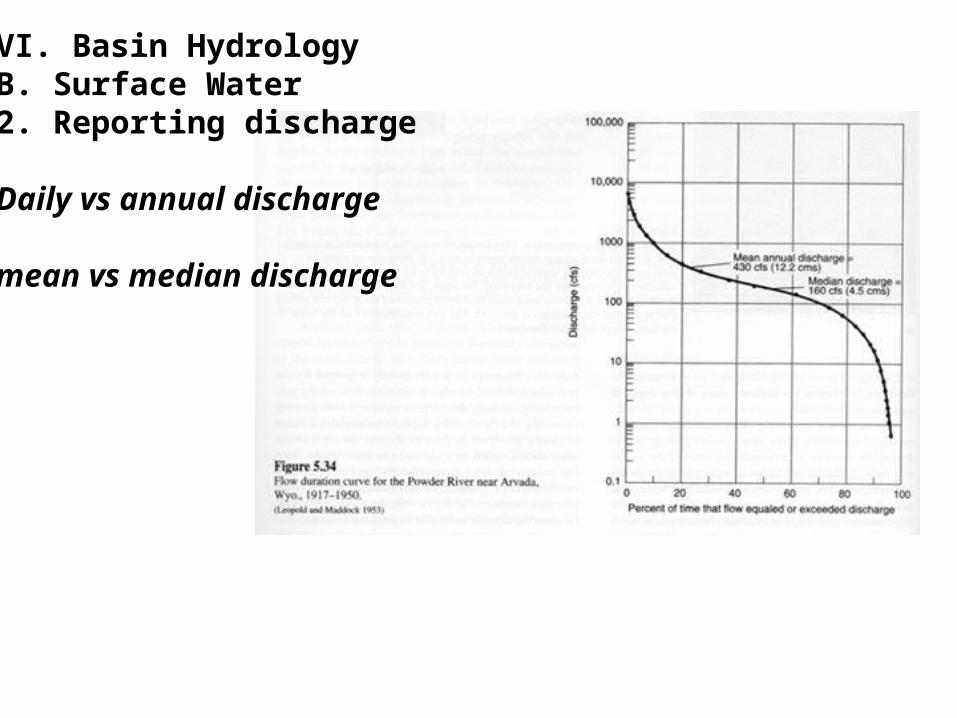
VI. Basin HydrologyB. Surface Water2. Reporting discharge Daily vs annual discharge
mean vs median discharge

3. Flood Frequency
y = 1708.5Ln(x) + 1705.1
0
1000
2000
3000
4000
5000
6000
7000
8000
9000
10000
1 10 100
RI (yrs)
Dis
char
ge
(cfs
)

What does this mean???
y = 1708.5Ln(x) + 1705.1
0
1000
2000
3000
4000
5000
6000
7000
8000
9000
10000
1 10 100
RI (yrs)
Dis
char
ge
(cfs
)

What does this mean???
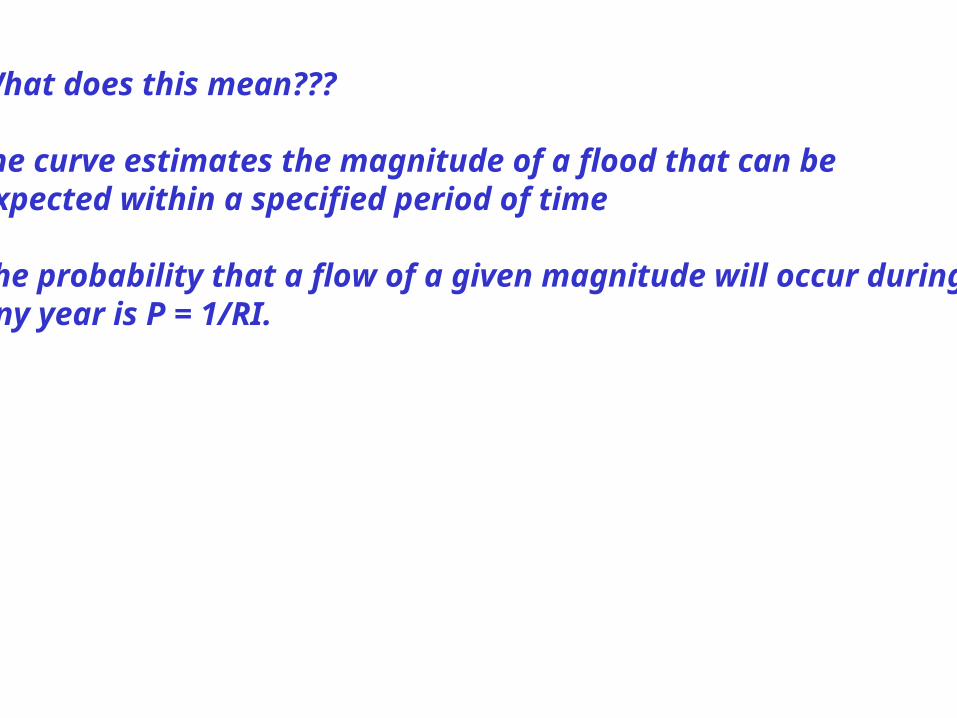
the curve estimates the magnitude of a flood that can be expected within a specified period of time
What does this mean???
the curve estimates the magnitude of a flood that can be expected within a specified period of time The probability that a flow of a given magnitude will occur during any year is P = 1/RI.

What does this mean???
the curve estimates the magnitude of a flood that can be expected within a specified period of time The probability that a flow of a given magnitude will occur during anyyear is P = 1/RI. EX: a 50 year flood has a 1/50, or a 2 percent chance of occurring
in any given year

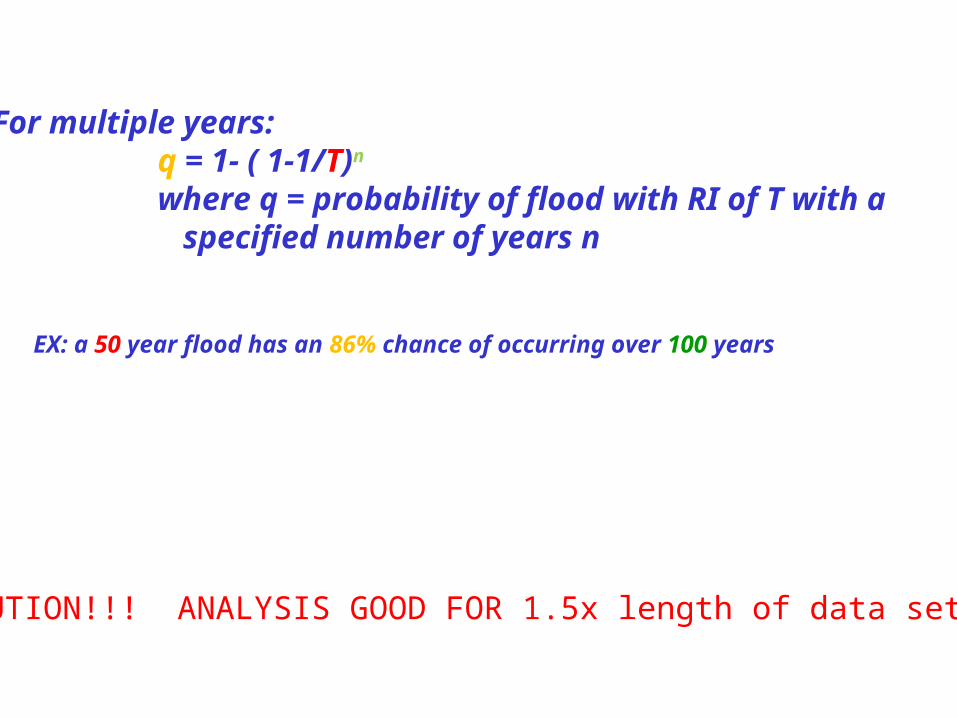
For multiple years: q = 1- ( 1-1/T)n
where q = probability of flood with RI of T with a specified number of years n
For multiple years: q = 1- ( 1-1/T)n
where q = probability of flood with RI of T with a specified number of years n
EX: a 50 year flood has an 86% chance of occurring over 100 years
CAUTION!!! ANALYSIS GOOD FOR 1.5x length of data set
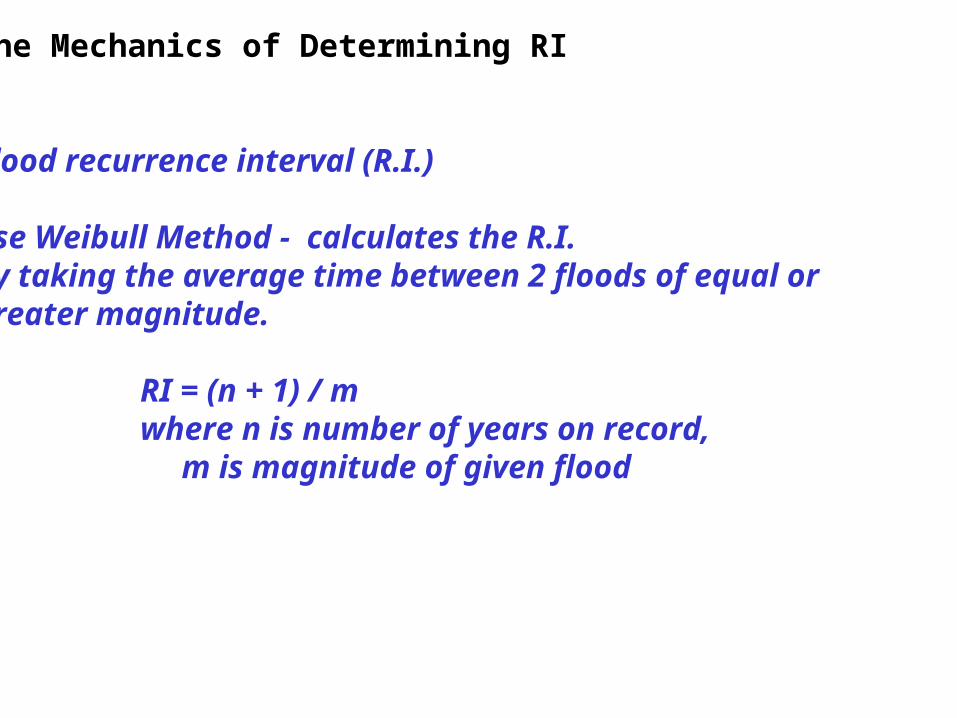
The Mechanics of Determining RI
Flood recurrence interval (R.I.)
use Weibull Method - calculates the R.I. by taking the average time between 2 floods of equal or greater magnitude.
RI = (n + 1) / m where n is number of years on record, m is magnitude of given flood
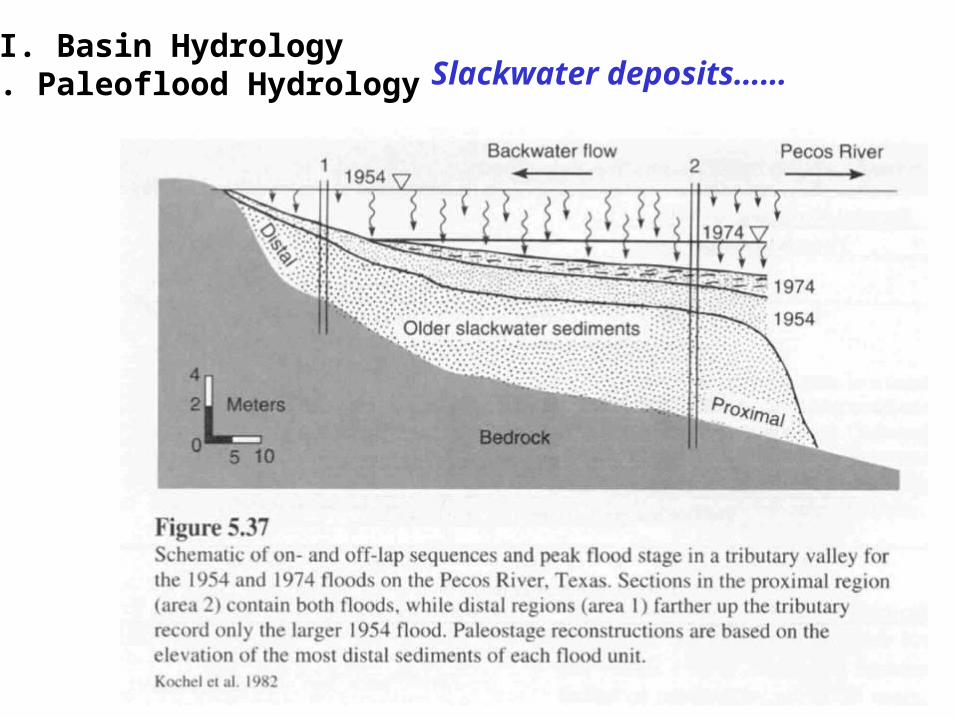
VI. Basin HydrologyC. Paleoflood Hydrology Slackwater deposits……

VI. Basin HydrologyC. Paleoflood Hydrology Which one is right????
“carbon is your friend”