The Dragon Spreads its Wings over Asia - colliers.com · Within Asia, Hong Kong (USD 6.9 billion),...
22
China’s “One Belt One Road” The Dragon Spreads its Wings over Asia Colliers Radar Property Research | Asia 6 March 2018
Transcript of The Dragon Spreads its Wings over Asia - colliers.com · Within Asia, Hong Kong (USD 6.9 billion),...
China’s “One Belt One Road”The Dragon Spreads its Wings over Asia
Colliers RadarProperty Research | Asia6 March 2018

2 The Dragon Spreads its Wings over Asia | 6 March 2018 | Property | Colliers International
Andrew Haskins Executive Director | Research | Asia
Terry Suen Senior Manager | Research | Asia
Chinese investment in Asian property
assets rose 34% in 2017, with interest
focused on Hong Kong, Singapore and
Japan. Looking ahead over five years,
we think China's ambitious "One Belt,
One Road" project, coupled with the firm
Chinese economy and RMB strength,
will drive Chinese investment in
emerging SE and South Asian markets.
OBOR investment will be led by big
infrastructure projects. Such projects will
stimulate growth in wealth, enhancing
existing investment possibilities. Most
SE Asian property markets have long-
run attractions, with Indonesia and the
Philippines standing out. Shortage of
stock suggests development projects
with local partners will be key to market
access, with opportunities centred in
industrial and residential property.
Executive Summary Despite capital controls, total Chinese investment in
overseas property assets reached an all-time high of
USD39.5 billion in 2017, up by 8% over 2016. Chinese
investment in Asian property assets grew 34% to
USD12.5 billion, and was focused on Hong Kong, Japan and Singapore. Chinese interest in Hong Kong will
probably moderate in 2018, but we think it will stay high
in Singapore where the office and residential markets
have entered a multiyear upcycle. Singapore remains
one of our preferred Asian investment property markets.
Looking ahead over five years, China's ambitious "One
Belt, One Road" project, coupled with the firm Chinese economy and RMB strength, ought to drive Chinese
investment in emerging South East and South Asian
markets. Large-scale investment in central Asian
markets should come later. OBOR investment will be led
by big infrastructure projects usually handled by state-owned groups. Such projects should stimulate growth in
wealth in cities and regions along the project’s chief
corridors, enhancing existing investment opportunities.
South East Asian countries mostly look attractive for
property investment, although Indonesia perhaps stands
out for long-term growth potential and the Philippines for breadth of development opportunities. Shortage of
quality property stock suggests that development
projects with local partners will generally represent the
most effective strategy for accessing the markets. We
expect these projects to target industrial and residential
property in particular.
While the OBOR project covers India and the country has huge long-run growth potential, Chinese capital is
unlikely to be a driving force in India for political reasons.
Pakistan is a big beneficiary of OBOR infrastructure
investment, but it is too early to consider this country as
a major investment destination.
Chinese property investment in US, Europe, and Asia (USD billions)
Source: Real Capital Analytics (property transactions greater than USD10 million including land sites; estimates by Colliers International
0.0
2.0
4.0
6.0
8.0
10.0
12.0
14.0
16.0
18.0
2012 2013 2014 2015 2016 2017 2018 2019 2020
United States Europe Asia

3 The Dragon Spreads its Wings over Asia | 6 March 2018 | Property | Colliers International
Contents
Contents ............................................. 3
Chinese interest shifting to Asian property .............................................. 4
Economic and political factors explain interest in property abroad ........................... 4
Chinese investment shifts from US to Asia and Europe ................................................... 4
OBOR infrastructure project to drive further Chinese investment in Asia ... 6
Vision of "One Belt, One Road" ................... 6
Six infrastructure corridors ........................... 7
Present state of investment in SE and South Asia .......................................... 8
Investment from China ................................. 8
Investment from Japan................................. 9
Investment from South Korea ...................... 9
SE, South Asia views: economy, infrastructure, property market ....... 10
Hong Kong .................................................. 10
Singapore .................................................... 10
Indonesia..................................................... 12
Philippines................................................... 13
Vietnam ....................................................... 14
Thailand ...................................................... 16
Myanmar ..................................................... 18
Malaysia ...................................................... 19
India ............................................................ 19
Pakistan ...................................................... 21

4 The Dragon Spreads its Wings over Asia | 6 March 2018 | Property | Colliers International
Chinese interest
shifting to Asian
property
Economic and political factors explain interest in property abroad
China has become an increasingly important player in global property markets. According to Real Capital
Analytics (RCA), probably the most widely accepted data
source for large property transactions, outbound Chinese
real estate investment reached an all-time high of
USD39.5 billion in 2017. This represented a seven-fold
increase from 2012 and an 8% rise over 2016.
The motivation for Chinese investors to acquire overseas
property assets reflects both economic and political
factors. Between 2012 and 2016, real GDP growth in
China slowed from 7.8% to 6.7%, although growth
picked up to 6.9% in 2017. Over this period Chinese enterprises faced a highly competitive business
environment in their domestic market, and searching for
attractive investment opportunities became gradually
more difficult. Some enterprises will have concluded that
buying overseas property provided an appealing investment option to obtain a high rate of return.
More importantly, perhaps, China accumulated a large
current account surplus, and the country's foreign
exchange reserves peaked at USD3.9 trillion in 2014. At
this point the Chinese government promoted a "going
out" policy intended to encourage Chinese sovereign
funds and state-owned enterprises to expand foreign
activities in areas such as resources, infrastructure and offshore financing. This encouragement was linked to a
policy of internationalisation of the renminbi (RMB) and a
desire to improve the image of Chinese enterprises
through the establishment of regional headquarters
overseas. At the same time, releasing a portion of domestic capital for investment in foreign countries
served as a strategy to reduce excess speculative
activity in the domestic equity and real estate markets.
An additional factor underlying heavy Chinese
investment abroad was the weakening of the RMB between 2014 and 2016. In our opinion, the importance
of this factor cannot be understated. Over that three-year
period, the RMB weakened by 12.8% against the US
dollar (meaning, to state the situation in reverse, that the
US dollar strengthened by 14.7% against the RMB).
While a weak currency in a given country makes buying overseas assets more expensive, it provides a powerful
incentive to do so, since enterprises in that country will
conclude that they can preserve the value of their capital
by investing abroad. We think that Chinese enterprises
invested heavily in US assets in particular over 2014-2016 in the expectation of continuing RMB depreciation.
Chinese investment shifts from US to Asia and Europe
The flood of capital outside China so concerned the
Chinese authorities that they imposed restrictions on investment abroad in late 2016. Despite these controls,
as we have seen, Chinese investment in foreign property
assets reached a record level of USD39.5 billion in 2017.
However, the composition of overseas investment has
Source: Source: Real Capital Analytics (property transactions greater than USD10 million including land sites; estimates by Colliers International
Figure 1: Chinese property investment in US, Europe and Asia (USD billions)
0.0
2.0
4.0
6.0
8.0
10.0
12.0
14.0
16.0
18.0
2012 2013 2014 2015 2016 2017 2018 2019 2020
United States Europe Asia

5 The Dragon Spreads its Wings over Asia | 6 March 2018 | Property | Colliers International
changed. As shown in Figure 1 above, according to
RCA, Chinese investment in US property assets dropped
64% in 2017 from 2016, to USD5.9 billion. Conversely,
Chinese investment in Asian property assets increased 34% to USD12.5 billion, while Chinese investment in
European property assets surged 336% to USD18.7
billion. Investment in both Asia and Europe was up
fourfold compared to the recent low point in 2014.
However, the investment in Europe was swollen by one very large deal: the purchase by China Investment
Corporation (CIC) for USD14.4 billion of Logicor, a
company with a big portfolio of logistics properties.
Excluding this deal, Chinese investment in European
property assets would have been roughly flat last year.
In our view, the changed focus of Chinese investment
activity reflects the new situation of robust economic
growth in China and currency strength. In 2017, real
GDP growth accelerated in China for the first time in
several years, although growth will probably moderate to
about 6.4% in 2018. Healthy economic growth and lower concerns about Chinese financial stability have driven a
sharp recovery in the RMB. Since the start of 2017, the
RMB has strengthened by 9.9% against the US dollar
(i.e. the US dollar has weakened by 9.0% against the
RMB). More recently, the RMB has also rallied against the basket of currencies used by the People's Bank of
China in setting exchange rates. We expect the RMB to
stay strong, and accept Oxford Economics' forecast of
an exchange rate of USD1=RMB6.20 by end-2018.1
Figure 2: USD versus RMB: start-2014 to now
Source: Bloomberg
In simple terms, we believe that Chinese enterprises are
now investing abroad for the opposite reason from the
period 2014-2016: the economy and the currency are
strong, so they feel that they can afford to do so. Since
1 Source: Oxford Economics, Country Economic Forecast, China (13
February 2018)
their key motive is no longer to preserve the value of
their capital, it is natural that they should have shifted
focus away from the US, which is traditionally perceived
as the world's safest investment market.
That said, Chinese investment in Asia in 2017 was
heavily focused on reasonably safe "gateway" markets.
Within Asia, Hong Kong (USD 6.9 billion), Japan (USD
2.3 billion), and Singapore (USD 2.1 billion) were the top
three destinations for Chinese property capital in 2017. Together, these three markets accounted for over 90%
of total Chinese investment in Asia of USD12.5 billion.
Hong Kong alone accounted for 55%, partly due to
heavy investment in undeveloped land sites.
Chinese interest in undeveloped land sites in Hong Kong appears to have cooled significantly, although interest in
completed buildings remains high. It therefore seems
reasonable to expect Chinese investment in Hong Kong
to decline moderately in 2018. At the same time, we
should acknowledge persistent anecdotal evidence that
the Chinese authorities have recently discouraged state-owned enterprises from active outbound investment
except in connection with the "One Belt, One Road"
(OBOR) initiative. OBOR investment is likely to take time
to build up.
For these reasons, we assume that aggregate Chinese investment in other Asian property markets will decline
by 10% in 2018, from USD12.5 billion to USD11.2 billion
(see Figure 1 above). Among the gateway markets, we
expect Chinese interest to stay high in Singapore in
particular, where we believe that the underlying office and residential markets have entered a multiyear
upcycle. Over 2019 and 2020, we assume that
aggregate Chinese investment in other Asian property
markets will increase as demand for assets in "One Belt,
One Road" countries starts to strengthen.
6.0
6.1
6.2
6.3
6.4
6.5
6.6
6.7
6.8
6.9
7.0
01/0
1/20
14
03/1
0/20
14
05/1
5/20
14
07/2
2/20
14
09/2
6/20
14
12/0
3/20
14
02/0
9/20
15
04/1
7/20
15
06/2
6/20
15
09/0
2/20
15
11/1
2/20
15
01/2
0/20
16
04/0
5/20
16
06/1
5/20
16
08/2
2/20
16
11/0
7/20
16
01/1
3/20
17
03/2
9/20
17
06/1
2/20
17
08/1
7/20
17
10/3
1/20
17
01/0
8/20
18
6 The Dragon Spreads its Wings over Asia | 6 March 2018 | Property | Colliers International
OBOR
infrastructure
project to drive
further Chinese
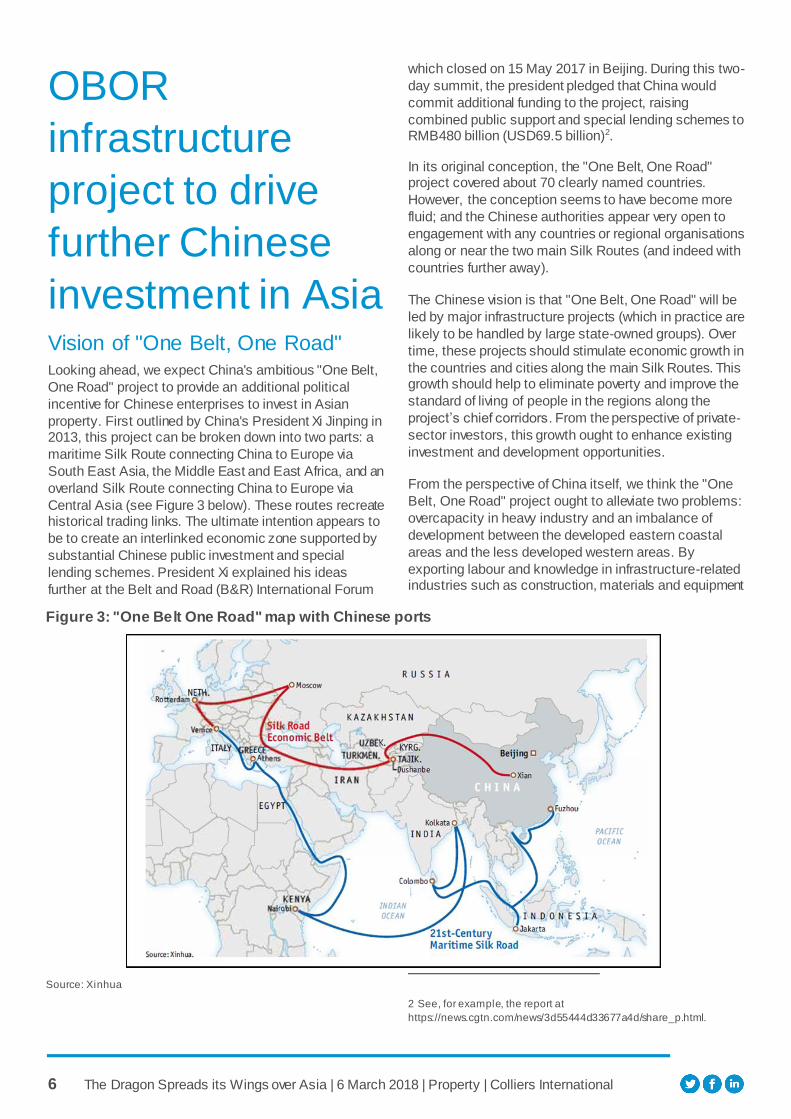
investment in Asia Vision of "One Belt, One Road" Looking ahead, we expect China's ambitious "One Belt,
One Road" project to provide an additional political
incentive for Chinese enterprises to invest in Asian
property. First outlined by China's President Xi Jinping in 2013, this project can be broken down into two parts: a
maritime Silk Route connecting China to Europe via
South East Asia, the Middle East and East Africa, and an
overland Silk Route connecting China to Europe via
Central Asia (see Figure 3 below). These routes recreate historical trading links. The ultimate intention appears to
be to create an interlinked economic zone supported by
substantial Chinese public investment and special
lending schemes. President Xi explained his ideas
further at the Belt and Road (B&R) International Forum
which closed on 15 May 2017 in Beijing. During this two-
day summit, the president pledged that China would
commit additional funding to the project, raising
combined public support and special lending schemes to RMB480 billion (USD69.5 billion)2.
In its original conception, the "One Belt, One Road" project covered about 70 clearly named countries.
However, the conception seems to have become more
fluid; and the Chinese authorities appear very open to
engagement with any countries or regional organisations
along or near the two main Silk Routes (and indeed with
countries further away).
The Chinese vision is that "One Belt, One Road" will be
led by major infrastructure projects (which in practice are
likely to be handled by large state-owned groups). Over
time, these projects should stimulate economic growth in
the countries and cities along the main Silk Routes. This growth should help to eliminate poverty and improve the
standard of living of people in the regions along the
project’s chief corridors. From the perspective of private-
sector investors, this growth ought to enhance existing
investment and development opportunities.
From the perspective of China itself, we think the "One
Belt, One Road" project ought to alleviate two problems:
overcapacity in heavy industry and an imbalance of
development between the developed eastern coastal
areas and the less developed western areas. By
exporting labour and knowledge in infrastructure-related industries such as construction, materials and equipment
2 See, for example, the report at
https://news.cgtn.com/news/3d55444d33677a4d/share_p.html.
Figure 3: "One Belt One Road" map with Chinese ports
Source: Xinhua
7 The Dragon Spreads its Wings over Asia | 6 March 2018 | Property | Colliers International
and self-developed technology, the project should help
soak up the products of surplus capacity and raise economic output and prosperity in western China.
Geographically, western China is closest to central Asian countries. Although a desire to boost prosperity in
western China seems to have been one of the original
motives behind "One Belt, One Road", we have argued
consistently (see, e.g., our report "Asian Investment
Property: A Tale of Three Cities and New Markets", 14
September 2017) that Chinese investment activity inspired by the project would focus on South East and
South Asia over the next five years or so. This is
because countries in this region are mostly more
developed than those in central Asia. This report
therefore concentrates on South East and South Asia.
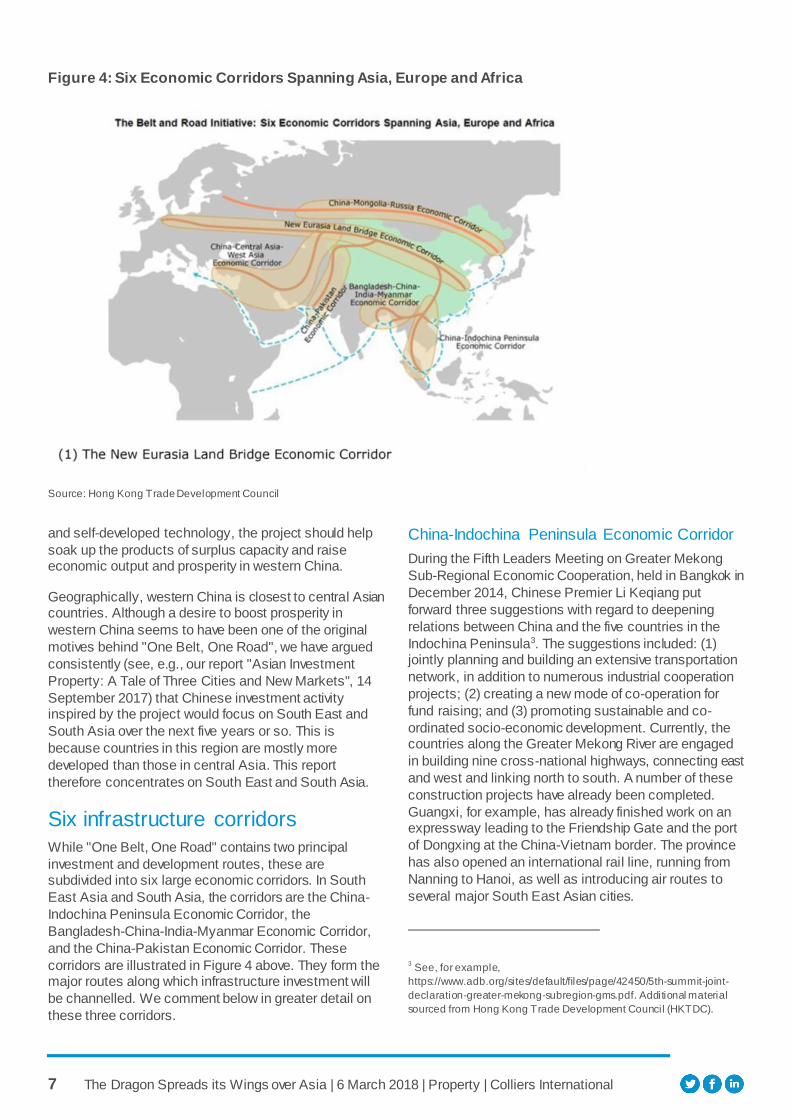
Six infrastructure corridors
While "One Belt, One Road" contains two principal
investment and development routes, these are subdivided into six large economic corridors. In South
East Asia and South Asia, the corridors are the China-
Indochina Peninsula Economic Corridor, the
Bangladesh-China-India-Myanmar Economic Corridor,
and the China-Pakistan Economic Corridor. These
corridors are illustrated in Figure 4 above. They form the major routes along which infrastructure investment will
be channelled. We comment below in greater detail on
these three corridors.
China-Indochina Peninsula Economic Corridor
During the Fifth Leaders Meeting on Greater Mekong
Sub-Regional Economic Cooperation, held in Bangkok in
December 2014, Chinese Premier Li Keqiang put
forward three suggestions with regard to deepening
relations between China and the five countries in the
Indochina Peninsula3. The suggestions included: (1) jointly planning and building an extensive transportation
network, in addition to numerous industrial cooperation
projects; (2) creating a new mode of co-operation for
fund raising; and (3) promoting sustainable and co-
ordinated socio-economic development. Currently, the countries along the Greater Mekong River are engaged
in building nine cross-national highways, connecting east
and west and linking north to south. A number of these
construction projects have already been completed.
Guangxi, for example, has already finished work on an expressway leading to the Friendship Gate and the port
of Dongxing at the China-Vietnam border. The province
has also opened an international rail line, running from
Nanning to Hanoi, as well as introducing air routes to
several major South East Asian cities.
3 See, for example,
https://www.adb.org/sites/default/files/page/42450/5th-summit-joint-
declaration-greater-mekong-subregion-gms.pdf. Additional material
sourced from Hong Kong Trade Development Council (HKTDC).
Figure 4: Six Economic Corridors Spanning Asia, Europe and Africa
Source: Hong Kong Trade Development Council
8 The Dragon Spreads its Wings over Asia | 6 March 2018 | Property | Colliers International
Bangladesh-China-India-Myanmar Economic Corridor
In a series of meetings during Premier Li Keqiang’s visit
to India in May 2013, China and India jointly proposed
the building of the Bangladesh-China-India-Myanmar
Economic Corridor4. In December 2013, the Bangladesh-China-India-Myanmar Economic Corridor Joint Working
Group convened its first meeting in Kunming5 in Yunnan
Province. Official representatives from the four countries
conducted detailed discussions regarding the
development prospects, priority areas of co-operation and co-operation mechanisms for the economic corridor.
They also reached broad consensus on cooperation in
areas such as transportation infrastructure, investment
and commercial circulation, and people-to-people
connectivity. The four parties agreed the Bangladesh-China-India-Myanmar Economic Corridor joint study
programme, establishing a mechanism for promoting co-
operation among the four governments.
China-Pakistan Economic Corridor
The concept of the China-Pakistan Economic Corridor was first raised by Premier Li Keqiang during his visit to
Pakistan in May 2013. At the time, the objective was to
build an economic corridor running from Kashgar, in
China's north-western Xinjiang province, to Pakistan’s
Gwadar Port on the country's south coast. As of now, the
two governments have mapped out a long-term plan for building highways, railways, oil and natural gas pipelines
and optic fibre networks along this corridor. According to
a joint declaration issued by China and Pakistan in
Islamabad in April 2015, the two countries will promote
key co-operation projects, including Phase II of the upgrading and renovation of the Karakoram Highway
(the Thakot-Havelian section), an expressway at the east
bay of Gwadar Port, a new international airport, an
expressway from Karachi to Lahore (the Multan-Sukkur
section), the Lahore rail transport orange line, the Haier-Ruba economic zone, and the China-Pakistan cross-
national optic fibre network6.
In the country sections in the second half of this report,
we comment further on how major infrastructure projects
along the six main corridors of the "One Belt, One Road
project" will affect the countries concerned.
4 See http://mea.gov.in/bilateral-documents.htm?dtl/21723/Joint
+Statement+on+the+State+Visit+of+Chinese++Li+Keqiang+to+India.
5 See http://www.indiandefencereview.com/spotlights/bangladesh-
china-india-and-myanmar-economic-corridor-ushering-a-new-era-of-
interconnectedness/. Additional material sourced from HKTDC.
6 See http://china-trade-research.hktdc.com/business-news/article/The-
Belt-and-Road-Initiative/The-Belt-and-Road-
Initiative/obor/en/1/1X000000/1X0A36B7.htm. See also information
from the China Pakistan Economic Corridor website at
http://cpec.gov.pk/.
Present state of
investment in SE
and South Asia
Investment from China
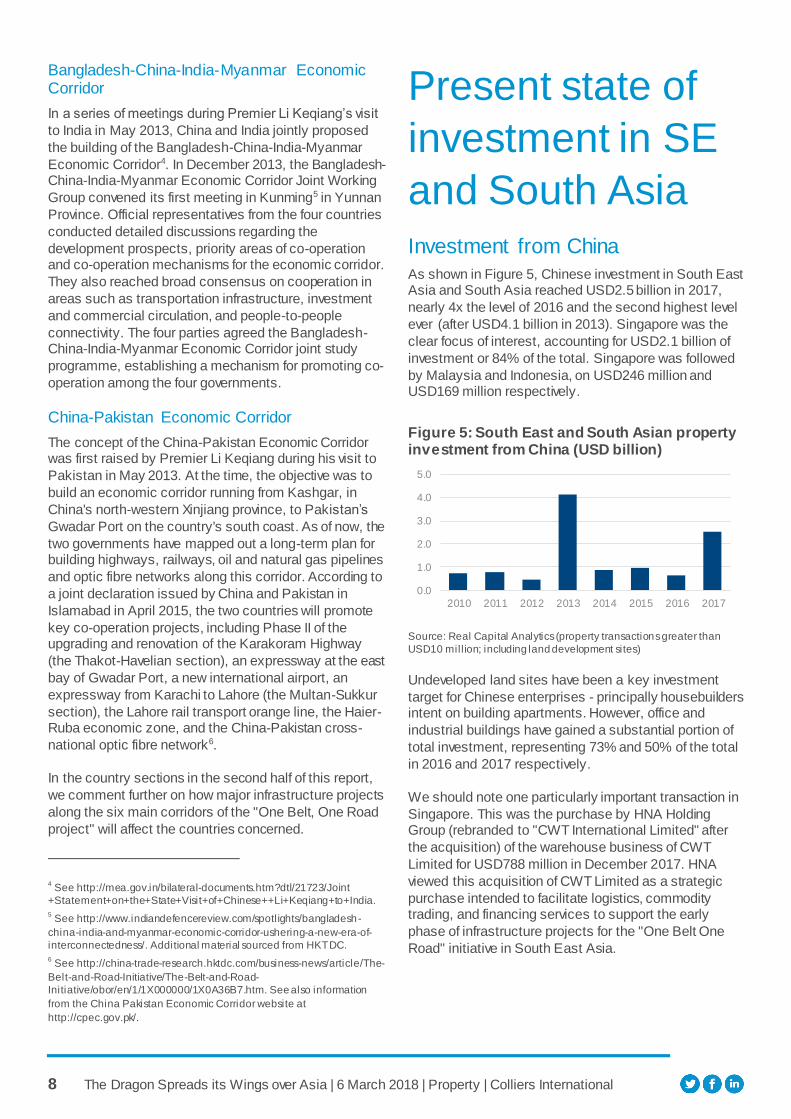
As shown in Figure 5, Chinese investment in South East Asia and South Asia reached USD2.5 billion in 2017,
nearly 4x the level of 2016 and the second highest level
ever (after USD4.1 billion in 2013). Singapore was the
clear focus of interest, accounting for USD2.1 billion of
investment or 84% of the total. Singapore was followed
by Malaysia and Indonesia, on USD246 million and USD169 million respectively.
Figure 5: South East and South Asian property investment from China (USD billion)
Source: Real Capital Analytics (property transactions greater than
USD10 mill ion; including land development sites)
Undeveloped land sites have been a key investment
target for Chinese enterprises - principally housebuilders intent on building apartments. However, office and
industrial buildings have gained a substantial portion of
total investment, representing 73% and 50% of the total
in 2016 and 2017 respectively.
We should note one particularly important transaction in
Singapore. This was the purchase by HNA Holding Group (rebranded to "CWT International Limited" after
the acquisition) of the warehouse business of CWT
Limited for USD788 million in December 2017. HNA
viewed this acquisition of CWT Limited as a strategic
purchase intended to facilitate logistics, commodity trading, and financing services to support the early
phase of infrastructure projects for the "One Belt One
Road" initiative in South East Asia.
0.0
1.0
2.0
3.0
4.0
5.0
2010 2011 2012 2013 2014 2015 2016 2017
9 The Dragon Spreads its Wings over Asia | 6 March 2018 | Property | Colliers International
Investment from Japan
With encouragement from the Japanese government, Japanese firms have been actively investing in
infrastructure projects and acquiring new businesses in
South East Asia. According to the ASEAN Secretariat7,
inbound foreign direct investment (i.e. across all asset
classes) in ASEAN countries from Japan amounted to USD11.5 billion in 2016, followed by Hong Kong (USD
9.8 billion), China (USD9.7 billion), and South Korea
(USD5.7 billion).
According to RCA, Japanese property investment in
South East Asia reached USD1.4 billion in 2017, having
increased for three consecutive years. Given faster economic growth and the expansion of the middle class
in the region, Japanese investors have participated in
the land sales market for both apartment and
commercial development projects in South East Asia.
Although Singapore is the destination that has attracted the highest level of Japanese outbound investment,
anecdotal evidence suggests that Japanese investors
have also been reasonably active in Indonesia,
Malaysia, Thailand and Vietnam.
Figure 6: South East and South Asian property investment from Japan (USD billion)
Source: Real Capital Analytics (property transactions greater than
USD10 mill ion; including land development sites)
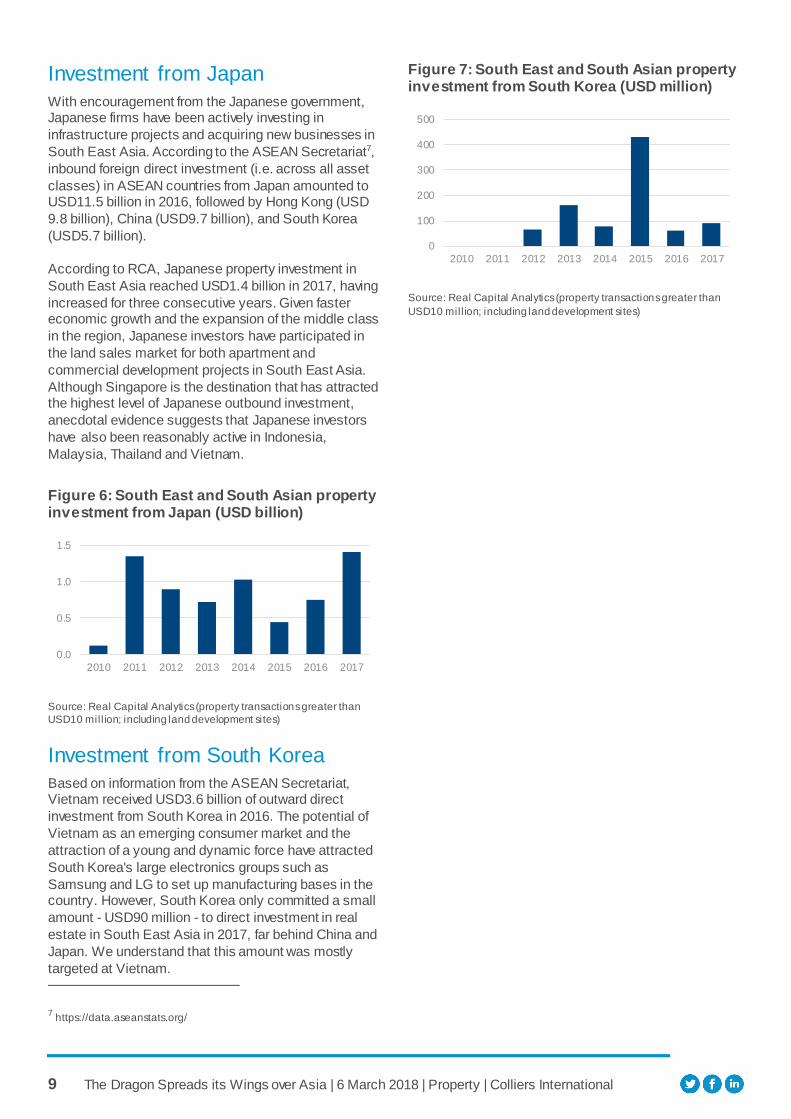
Investment from South Korea
Based on information from the ASEAN Secretariat, Vietnam received USD3.6 billion of outward direct
investment from South Korea in 2016. The potential of
Vietnam as an emerging consumer market and the
attraction of a young and dynamic force have attracted
South Korea's large electronics groups such as
Samsung and LG to set up manufacturing bases in the country. However, South Korea only committed a small
amount - USD90 million - to direct investment in real
estate in South East Asia in 2017, far behind China and
Japan. We understand that this amount was mostly
targeted at Vietnam.
7 https://data.aseanstats.org/
Figure 7: South East and South Asian property investment from South Korea (USD million)
Source: Real Capital Analytics (property transactions greater than
USD10 mill ion; including land development sites)
0.0
0.5
1.0
1.5
2010 2011 2012 2013 2014 2015 2016 2017
0
100
200
300
400
500
2010 2011 2012 2013 2014 2015 2016 2017

10 The Dragon Spreads its Wings over Asia | 6 March 2018 | Property | Colliers International
SE, South Asia
views: economy,
infrastructure,
property market In the following section of this report, we discuss prospects for countries in South East and South Asia
under three headings: economy, infrastructure and
property market. We consider specific investment or
development opportunities in the various countries under
"property market". Where we lack sufficient information, we omit discussion.
Although Hong Kong and Singapore do not necessarily
fall directly within the "One Belt, One Road" initiative, we
have included discussion of the economic situation and
the property market in both territories for two reasons.
Firstly, they have become important as destinations for Chinese investment capital and because. Secondly,
Singapore is the economic and financial hub of South
East Asia, which clearly is included within "One Belt,
One Road".
Hong Kong
Economy
Figure 8: Hong Kong economic snapshot
Hong Kong
Population (million) 7.3
GDP per capita (USD) 38,525
Real GDP grow th 2017 est. 3.7%
Real GDP grow th 2018 est. 3.0%
Real GDP grow th 2020 est. 2.2%
ST interest rate 2017 0.9%
ST interest rate 2020 2.8%
Real interest rate 2017 -0.6%
Real interest rate 2020 0.7%
Political situation Stable
Source: Oxford Economics, political assessment by Colliers
International
Economic prospects for Hong Kong strengthened
markedly over 2017, and remain bright. The territory
achieved real GDP growth of about 3.7% in 2017, and we regard Oxford Economics' growth forecasts for 2018-
2020 as conservative. Hong Kong's interest rates are
effectively tied to US interest rates through the currency
peg, and so are clearly set to rise steadily from now.
Nevertheless, we assume that Hong Kong will continue
to enjoy negative (i.e. inflation-adjusted) real interest rates until H2 2019 or even early 2020. Only a much
faster rate of growth is likely to dent confidence in the
territory's property market significantly. Given a stable
political situation, we remain positive about Hong Kong.
Property market
Figure 9: Hong Kong property market snapshot
Hong Kong
Grade A off ice market size ('000 sq m) 6,768
Grade A off ice yield 2.6%
Industrial market size ('000 sq m) 21,044
Industrial yield 3.7%
Total property investment USD42.2 billion
Completed building investment USD20.9 billion
Source: Real Capital Analytics (property transactions greater than
USD10 mill ion), Colliers
As an urban centre, Hong Kong was the most active real
estate market in Asia in 2017, recording USD20.9 billion
of commercial property transactions and total property transactions (including undeveloped land sites) of
USD42.2 billion. Given robust demand from Chinese
buyers and wealthy local investors, commercial property
prices have reached high levels. Both the office property
yield and industrial property yield look low at first sight on
2.6% and 3.7%, respectively. However, as noted faster economic growth and persistent negative real interest
rates should support Hong Kong's property market.
Singapore
Economy
Figure 10: Singapore economic snapshot
Singapore
Population (million) 5.6
GDP per capita (USD) 52,963
Real GDP grow th 2017 3.5%
Real GDP grow th 2018 est. 3.1%
Real GDP grow th 2020 est. 2.6%
ST interest rate 2017 1.0%
ST interest rate 2020 2.6%
Real interest rate 2017 0.5%
Real interest rate 2020 0.8%
Political situation Very stable
Source: Oxford Economics, political assessment by Colliers
International
11 The Dragon Spreads its Wings over Asia | 6 March 2018 | Property | Colliers International
After a few years of stagnation, the Singapore economy
rebounded sharply in 2017. This was reflected in strong
conditions in the investment property market and a pick-
up in office rents late in the year. Looking forward, export growth and manufacturing activity may slow modestly
over 2018 if Chinese import demand cools and global
electronics demand moderates; on the other hand,
service sector growth should pick up as the recovery
broadens to more domestic sectors. Given a very stable political situation, from a strategic perspective we
continue to regard Singapore as one of the most
attractive investment destinations in Asia.
Figure 11: Singapore property market snapshot
Singapore
Premium/Gd. A off ice mkt size ('000 sq m) 2,258
Premium and Grade A off ice yield 3.4%
Industrial market size ('000 sq m) 48,445
Industrial yield 6.0%
Total property investment USD21.0 billion
Completed building investment USD15.0 billion
Source: Real Capital Analytics (property transaction greater than
USD10 mill ion), Colliers
Property market
We expect Singapore's property market to stay buoyant
in 2018, supported by a broadening GDP growth and an
expected multi-year recovery in the underlying office and residential markets. Physical supply in office, residential
and industrial sectors is also easing from the oversupply
situation of past years. Capital flows should continue to
be strong as we expect interest rates hikes to be benign
and yield spreads are relatively attractive. Barring
external shocks, we expect rents and prices in general in 2018 to improve over 2017. Indeed, we have recently
raised our forecast for Premium and Grade A office
growth in Singapore in 2018 to 10-12%. This is one of
our highest forecasts for office markets in Asia.
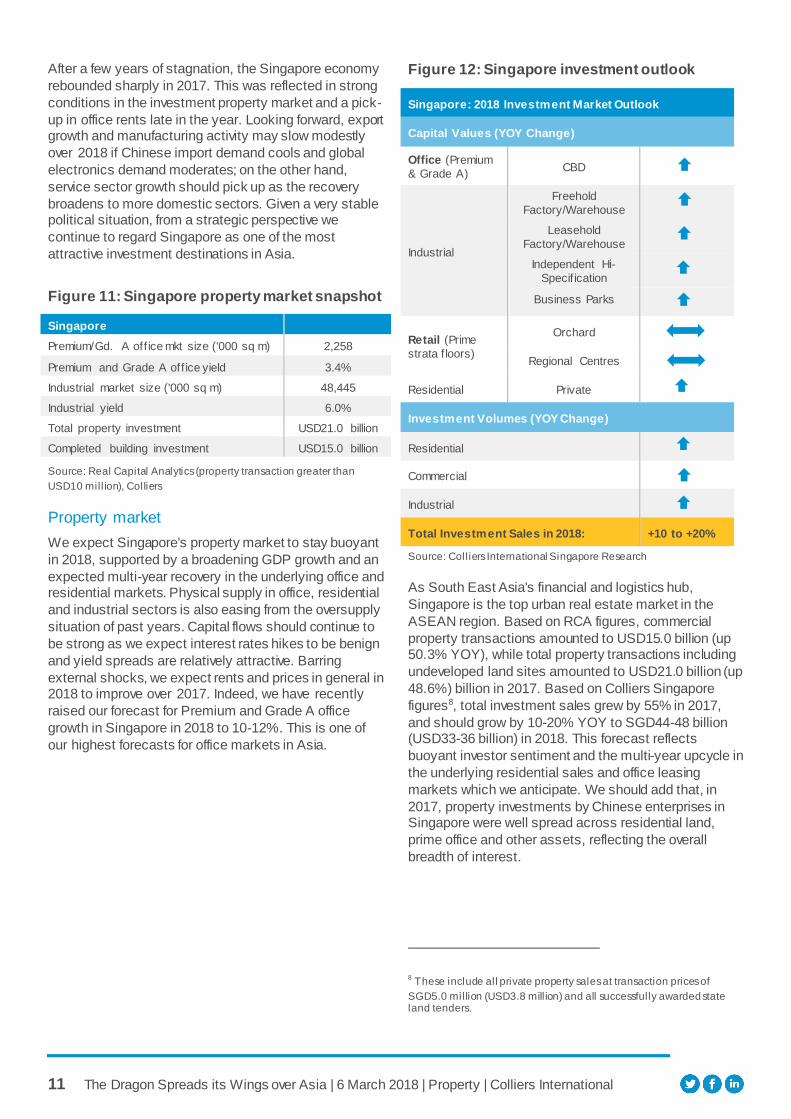
Figure 12: Singapore investment outlook
Singapore: 2018 Investment Market Outlook
Capital Values (YOY Change)
Office (Premium
& Grade A) CBD
Industrial
Freehold
Factory/Warehouse
Leasehold
Factory/Warehouse
Independent Hi-
Specif ication
Business Parks
Retail (Prime
strata f loors)
Orchard
Regional Centres
Residential Private
Investment Volumes (YOY Change)
Residential
Commercial
Industrial
Total Investment Sales in 2018: +10 to +20%
Source: Colliers International Singapore Research
As South East Asia's financial and logistics hub,
Singapore is the top urban real estate market in the
ASEAN region. Based on RCA figures, commercial
property transactions amounted to USD15.0 billion (up 50.3% YOY), while total property transactions including
undeveloped land sites amounted to USD21.0 billion (up
48.6%) billion in 2017. Based on Colliers Singapore
figures8, total investment sales grew by 55% in 2017,
and should grow by 10-20% YOY to SGD44-48 billion (USD33-36 billion) in 2018. This forecast reflects
buoyant investor sentiment and the multi-year upcycle in
the underlying residential sales and office leasing
markets which we anticipate. We should add that, in
2017, property investments by Chinese enterprises in Singapore were well spread across residential land,
prime office and other assets, reflecting the overall
breadth of interest.
8 These include all private property sales at transaction prices of
SGD5.0 million (USD3.8 mill ion) and all successfully awarded state land tenders.
12 The Dragon Spreads its Wings over Asia | 6 March 2018 | Property | Colliers International
Indonesia
Economy
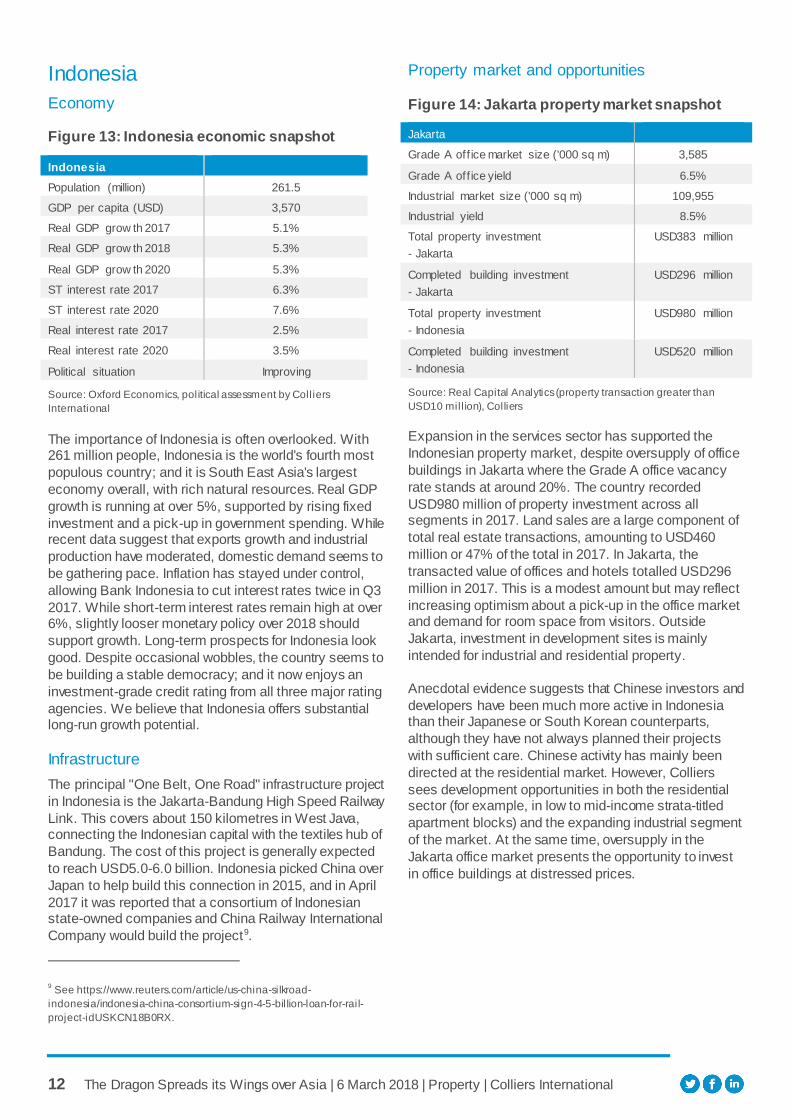
Figure 13: Indonesia economic snapshot
Indonesia
Population (million) 261.5
GDP per capita (USD) 3,570
Real GDP grow th 2017 5.1%
Real GDP grow th 2018 5.3%
Real GDP grow th 2020 5.3%
ST interest rate 2017 6.3%
ST interest rate 2020 7.6%
Real interest rate 2017 2.5%
Real interest rate 2020 3.5%
Political situation Improving
Source: Oxford Economics, political assessment by Colliers
International
The importance of Indonesia is often overlooked. With 261 million people, Indonesia is the world's fourth most
populous country; and it is South East Asia's largest
economy overall, with rich natural resources. Real GDP
growth is running at over 5%, supported by rising fixed
investment and a pick-up in government spending. While recent data suggest that exports growth and industrial
production have moderated, domestic demand seems to
be gathering pace. Inflation has stayed under control,
allowing Bank Indonesia to cut interest rates twice in Q3
2017. While short-term interest rates remain high at over 6%, slightly looser monetary policy over 2018 should
support growth. Long-term prospects for Indonesia look
good. Despite occasional wobbles, the country seems to
be building a stable democracy; and it now enjoys an
investment-grade credit rating from all three major rating
agencies. We believe that Indonesia offers substantial long-run growth potential.
Infrastructure
The principal "One Belt, One Road" infrastructure project
in Indonesia is the Jakarta-Bandung High Speed Railway
Link. This covers about 150 kilometres in West Java, connecting the Indonesian capital with the textiles hub of
Bandung. The cost of this project is generally expected
to reach USD5.0-6.0 billion. Indonesia picked China over
Japan to help build this connection in 2015, and in April
2017 it was reported that a consortium of Indonesian state-owned companies and China Railway International
Company would build the project9.
9 See https://www.reuters.com/article/us-china-silkroad-
indonesia/indonesia-china-consortium-sign-4-5-bil lion-loan-for-rail-
project-idUSKCN18B0RX.
Property market and opportunities
Figure 14: Jakarta property market snapshot
Jakarta
Grade A off ice market size ('000 sq m) 3,585
Grade A off ice yield 6.5%
Industrial market size ('000 sq m) 109,955
Industrial yield 8.5%
Total property investment
- Jakarta
USD383 million
Completed building investment
- Jakarta
USD296 million
Total property investment
- Indonesia
USD980 million
Completed building investment
- Indonesia
USD520 million
Source: Real Capital Analytics (property transaction greater than
USD10 mill ion), Colliers
Expansion in the services sector has supported the
Indonesian property market, despite oversupply of office
buildings in Jakarta where the Grade A office vacancy
rate stands at around 20%. The country recorded
USD980 million of property investment across all segments in 2017. Land sales are a large component of
total real estate transactions, amounting to USD460
million or 47% of the total in 2017. In Jakarta, the
transacted value of offices and hotels totalled USD296
million in 2017. This is a modest amount but may reflect
increasing optimism about a pick-up in the office market and demand for room space from visitors. Outside
Jakarta, investment in development sites is mainly
intended for industrial and residential property.
Anecdotal evidence suggests that Chinese investors and
developers have been much more active in Indonesia than their Japanese or South Korean counterparts,
although they have not always planned their projects
with sufficient care. Chinese activity has mainly been
directed at the residential market. However, Colliers
sees development opportunities in both the residential sector (for example, in low to mid-income strata-titled
apartment blocks) and the expanding industrial segment
of the market. At the same time, oversupply in the
Jakarta office market presents the opportunity to invest
in office buildings at distressed prices.

13 The Dragon Spreads its Wings over Asia | 6 March 2018 | Property | Colliers International
Philippines
Economy
Figure 15: Philippines economic snapshot
Philippines
Population (million) 103.5
GDP per capita (USD) 2,951
Real GDP grow th 2017 6.7%
Real GDP grow th 2018 6.4%
Real GDP grow th 2020 5.6%
ST interest rate 2017 2.6%
ST interest rate 2020 4.3%
Real interest rate 2017 -0.6%
Real interest rate 2020 0.3%
Political situation Mixed
Source: Oxford Economics, political assessment by Colliers
International
Estimated real GDP growth of 6.4% for 2018 in the Philippines is similar to China and Vietnam. While export
growth will probably slow this year, household
consumption should grow strongly, benefiting from
recent tax reform. Looking further ahead, the
government has ambitious plans for infrastructure investment which should provide a major impetus to the
broader economy. Inflation is under control and so
interest rates should not rise too fast; indeed, by 2020
the Philippines could well have the lowest or equal
lowest real interest rates in Asia. This provides a favourable background for strength in the property
market. However, the political situation is mixed: the
country continues to grapple with armed insurgencies,
and the current administration is regarded as volatile.
Infrastructure
Although the Philippines does not lie directly on the two
major routes in China’s "One Belt, One Road" initiative,
there appears to be plenty of room for cooperation that
would benefit the country. For example, in March 2018,
the Philippines and China exchanged letters regarding
the feasibility studies for two major infrastructure projects10. The first was the Panay-Guimaras-Negros
Bridges Project in the Visayas region of the central
Philippines, expected to cost around USD2.0 billion. The
second was the Davao City Expressway Project,
intended to mitigate congestion around Davao City on the island of Mindanao in the southern Philippines.
10 See http://www.manilatimes.net/ph-loop-chinas-one-belt-one-road-
routes/351147/.
In addition, in December 2017 the governor of Batangas
province signed a memorandum of understanding (MoU)
with the Chinese company Teamrise Group for the
development of projects that would promotion tourism, food security, and air and cargo transportation in the
province11. The MOU covers the development of the
Batangas Access Zone, sea ports and terminals
expansion, and a food terminal project on a 29-hectare
property. Batangas is located in the Calabarzon region of the Philippines' main island of Luzon, and is one of the
most popular tourist destinations near Metro Manila.
The administration of President Duterte has made
infrastructure projects in the Philippines a priority.
Moreover, relations between the Philippines and China have clearly improved under the present administration.
It therefore seems reasonable to expect cooperation
between the two countries under the aegis of "One Belt,
One Road" to strengthen further in the future.
The ushering in of the "golden age of infrastructure"
lends support to the government's decentralisation push which should unlock land values in areas outside of
Metro Manila and stimulate business activities in the
countryside. Given this background, Colliers Philippines
recommends that developers focus on the thriving
opportunities outside of the country's capital12.
Property market and opportunities
Figure 16: Manila property market snapshot
Manila
Grade A off ice market size ('000 sq m) 4,267
Grade A off ice yield 6.1%
Industrial market size ('000 sq m) 40,453
Industrial yield n/a
Total property investment
- Manila
USD320 million
Completed building investment
- Manila
USD70 million
Total property investment
- Philippines
USD736 million
Completed building investment
- Philippines
USD70 million
Source: Real Capital Analytics (property transaction greater than
USD10 mill ion), Colliers
11 As reported at https://www.rappler.com/business/191440-batangas-
chinese-teamrise-develop-airport-seaport-railway.
12 See Colliers Philippines' report "Philippines, Top 10 Predictions
2018" (21 December 2017).
14 The Dragon Spreads its Wings over Asia | 6 March 2018 | Property | Colliers International
Although the Philippines is a relatively small property
market, the country's services sector is benefiting from
the continuing high growth which is driving demand for
office space. Purchases of land sites dominated the property investment market in 2017, reaching USD667
million or over 90% of the total property transactions
according to RCA. In Manila, site development has been
targeted mainly at office and apartment property.
So far, the most tangible impact of Chinese investment interest in the Philippines has been the spread of online
gaming companies coming from China. Online gaming
companies took up a very substantial amount of office
space in Manila in 2017. Most estimates suggest that
about one-third of total leasing transactions came from online gaming, with each tenant taking between10,000
and 30,000 square metres per transaction. The strong
demand for office space from online gaming companies
has also had an impact on residential leasing for
developments close to where those companies are
located (e.g. Makati CBD, and the Bay Area).
Another sector that has benefited from mainland
Chinese demand is tourism. China is now the second
largest source of tourists in the Philippines. As such,
Chinese brands such as Jinjiang Hotels are being rolled
out aggressively across the country.
Looking ahead, we would highlight four opportunities for
long-run investment and development potential in the
Philippines. For further details, please see Colliers
Philippines' report "Philippines, Top 10 Predictions 2018"
(21 December 2017).
> Residential market outside Metro Manila. Both
national and local developers have been active in
addressing the rising demand for residential projects
in major urban areas in Luzon (outside Metro
Manila), Visayas, and Mindanao. The improvement
of road networks and expansion of airports envisaged under the present administration's push to
improve infrastructure should further unlock land
values in these areas, making them more feasible for
residential projects.
> Industrial park developments north of Luzon. The north and central parts of the main island of Luzon
are becoming increasingly viable as industrial hubs.
Interesting evidence of this increased viability comes
from the commitment by China's Xu Liang Drag to
Group to develop a 3,000 hectare mixed-use special economic zone in Pangasinan, about 210 km north
of Metro Manila13.
13 See https://business.mb.com.ph/2017/07/07/chinese-build-giant-
ecozone-in-pangasinan/.
> Townships outside Metro Manila. Colliers Philippines
expects developers to pursue satellite communities
both in and outside Metro Manila. Townships offer a
better value proposition (live-work-play-shop lifestyle) than standalone projects since they offer
mixed-use developments. We think this feature
makes integrated townships a more attractive option
for investors. Further, we see developers pursuing
township projects in areas outside Metro Manila such as Cavite, Laguna, Bulacan, Pampanga, Cebu,
and Davao over the near to medium term as land
values are unlocked by expansion of road networks.
> Resort-oriented hotels across the country. Colliers
Philippines believes that the development of 3- and 4-star hotels in resort destinations will be more
visible over the next two to three years. Colliers
believes that among the most attractive locations for
these developments are Cebu, Bacolod, Iloilo,
Palawan, Davao, and Bohol.
Vietnam
Economy
Figure 17: Vietnam economic snapshot
Vietnam
Population (million) 94.5
GDP per capita (USD) 2,131
Real GDP grow th 2017 6.8%
Real GDP grow th 2018 6.4%
Real GDP grow th 2020 6.2%
ST interest rate 2017 6.3%
ST interest rate 2020 6.5%
Real interest rate 2017 2.5%
Real interest rate 2020 2.5%
Political situation Stable
Source: Oxford Economics, Colliers International
Growth in Vietnam has benefited from renewed vigour in
manufacturing exports and an increase in the
government's credit growth target which should support
investment. Vietnam remains one of Asia's faster-
growing emerging markets, with real GDP likely to expand by about 6.4% in 2018. Population growth is now
slowing, but its peak of 1.2% over 1999-2008 means the
workforce is still growing14. Risks include the authorities'
relatively poor record in managing inflation and high
outstanding aggregate credit levels. Real interest rates
14 See Oxford Economics, "Country Economic Forecast: Vietnam" (8
November 2017).
15 The Dragon Spreads its Wings over Asia | 6 March 2018 | Property | Colliers International
are higher than in many other Asian markets. Overall the
political situation appears reasonably stable.
Infrastructure
Vietnam lies directly along the "Maritime Silk Road" link
from China to the Middle East and Europe, and is widely
perceived as a country which would benefit from large-
scale infrastructure upgrades. So far, the focus of
discussion of Vietnam in the context of "One Belt, One
Road" appears to be the construction of an expanded port at Haiphong City, the leading seaport in northern
Vietnam about 90 kilometres from the capital Hanoi.
Haiphong would be the terminus of an envisaged
Kunming-Lao Cai-Hanoi-Haiphong Corridor, which
appears to be a sub-corridor of the China-Indochina Peninsula Economic Corridor.
The estimated cost of construction of a new port at
Haiphong is USD 1.2 billion. Phase One consists of
actual construction work on the port, managed by the
Vietnam Marine Administration. Phase Two consists of a joint venture between a number of Vietnamese and
Japanese enterprises and will involve the construction of
two wharves with a total length of 750 metres, giving the
port the capacity to service 100,000-tonne container
ships. Once fully operational, the facility should form part
of a direct trade link, connecting China and Vietnam's northern region with the US and European markets.15
China is also playing a role in the development of
Vietnam's railway infrastructure. To this end, it was
reported in April 2017 that China Railway Sixth Group
Company had been awarded a contract to construct the Cat Linh-Ha Dong urban railway project in Hanoi. China
has provided most of the USD550 million funding for this
project through preferential credit loans of RMB1.2 billion
(USD189 million at the current exchange rate), and
through another USD250 million in concessional loans.
Another "One Belt, One Road" project that was on the
agenda at a summit in Beijing in September 2016
between the Chinese and Vietnamese prime ministers
was a standard gauge upgrade to the rail link between
Lao Cai on Vietnam's border with China's Yunnan
province and Hanoi and Haiphong. Once completed, this link would allow greater trade volumes to be carried
along the line to the Haiphong Port. In other words, this
rail link would be a vital element of the Kunming-Lao Cai-
Hanoi-Haiphong Corridor mentioned above.
15 Source for the information on Haiphong Port and much of the
discussion on infrastructure in Vietnam: http://economists-pick-
research.hktdc.com/business-news/article/International-Market-
News/China-and-Vietnam-s-Ambitions-Converge-in-BRI-Infrastructure-
Projects/imn/en/1/1X000000/1X0A9HQV.htm.
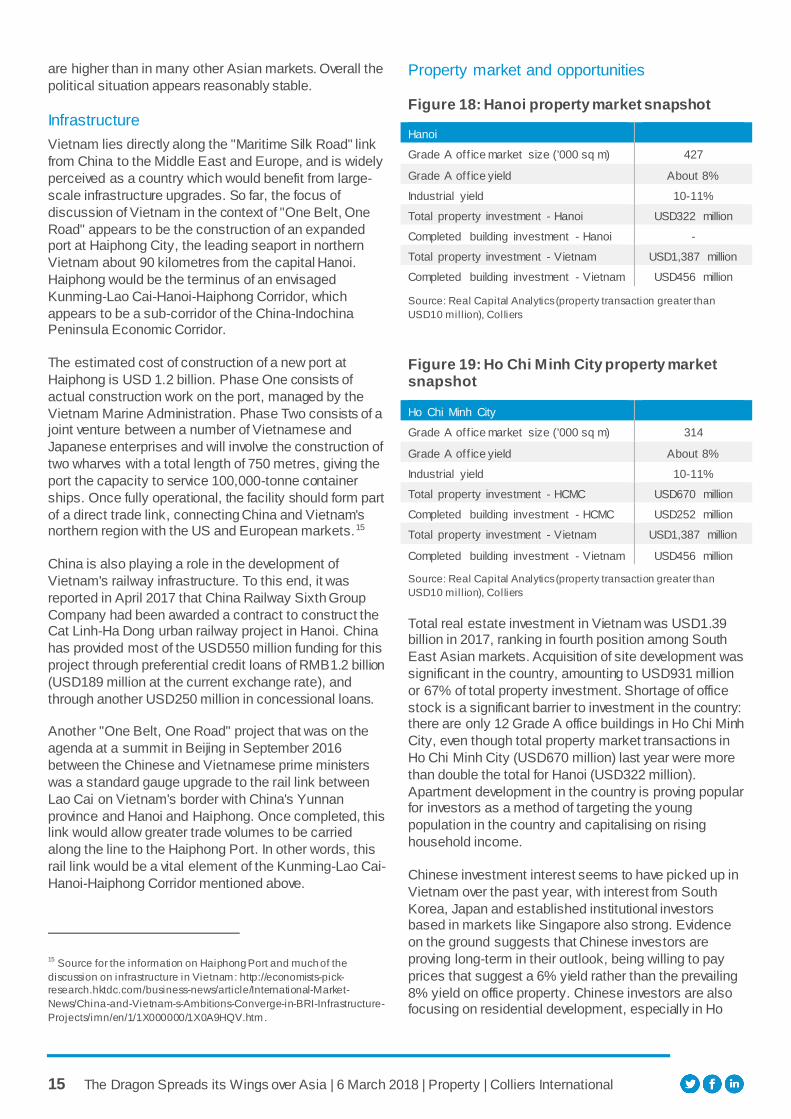
Property market and opportunities
Figure 18: Hanoi property market snapshot
Hanoi
Grade A off ice market size ('000 sq m) 427
Grade A off ice yield About 8%
Industrial yield 10-11%
Total property investment - Hanoi USD322 million
Completed building investment - Hanoi -
Total property investment - Vietnam USD1,387 million
Completed building investment - Vietnam USD456 million
Source: Real Capital Analytics (property transaction greater than
USD10 mill ion), Colliers
Figure 19: Ho Chi Minh City property market snapshot
Ho Chi Minh City
Grade A off ice market size ('000 sq m) 314
Grade A off ice yield About 8%
Industrial yield 10-11%
Total property investment - HCMC USD670 million
Completed building investment - HCMC USD252 million
Total property investment - Vietnam USD1,387 million
Completed building investment - Vietnam USD456 million
Source: Real Capital Analytics (property transaction greater than
USD10 mill ion), Colliers
Total real estate investment in Vietnam was USD1.39 billion in 2017, ranking in fourth position among South
East Asian markets. Acquisition of site development was
significant in the country, amounting to USD931 million
or 67% of total property investment. Shortage of office
stock is a significant barrier to investment in the country: there are only 12 Grade A office buildings in Ho Chi Minh
City, even though total property market transactions in
Ho Chi Minh City (USD670 million) last year were more
than double the total for Hanoi (USD322 million).
Apartment development in the country is proving popular for investors as a method of targeting the young
population in the country and capitalising on rising
household income.
Chinese investment interest seems to have picked up in
Vietnam over the past year, with interest from South
Korea, Japan and established institutional investors based in markets like Singapore also strong. Evidence
on the ground suggests that Chinese investors are
proving long-term in their outlook, being willing to pay
prices that suggest a 6% yield rather than the prevailing
8% yield on office property. Chinese investors are also focusing on residential development, especially in Ho
16 The Dragon Spreads its Wings over Asia | 6 March 2018 | Property | Colliers International
Chi Minh City. In contrast, South Korean and Japanese
investors seem more interested in infrastructure projects.
Investors potentially interested in Vietnam should note
that regulations affecting the property market have been liberalised recently. Foreigners cannot buy land, but they
can buy property. It is no longer a requirement to have a
joint venture with a local partner. Sale and leaseback
transactions are now possible. Colliers sees particular
opportunities in industrial development projects, relating to factory relocation and similar purposes.
Thailand
Economy
Figure 20: Thailand economic snapshot
Thailand
Population (million) 66.2
GDP per capita (USD) 5,978
Real GDP grow th 2017 3.8%
Real GDP grow th 2018 3.2%
Real GDP grow th 2020 3.0%
ST interest rate 2017 1.6%
ST interest rate 2020 2.9%
Real interest rate 2017 0.9%
Real interest rate 2020 0.9%
Political situation Uncertain
Source: Oxford Economics, Colliers Thailand, political assessment by
Colliers International
Thailand has grown more slowly than other South East Asian nations in recent years, affected partly by political
divisions which have resulted in military take-overs. Real
GDP growth reached 3.9% in 2017, led by strength in
exports; however, government investment and private
consumption were lacklustre. Exports growth may well
moderate this year if Chinese imports demand slows. Consumer spending and investment growth are unlikely
to offset any such slowdown because growth remains
concentrated in urban areas and large companies. More
positively, pressure from the government and large
exporters for the Bank of Thailand to dampen the strong baht suggests that interest rates will stay low at least
over 2018. Looking ahead, Thailand's record of modest
budget deficits and low overall debt level should support
investment confidence. On the other hand, the deferral
of elections to 2019 by the ruling military authorities will reinforce the sense of political uncertainty.
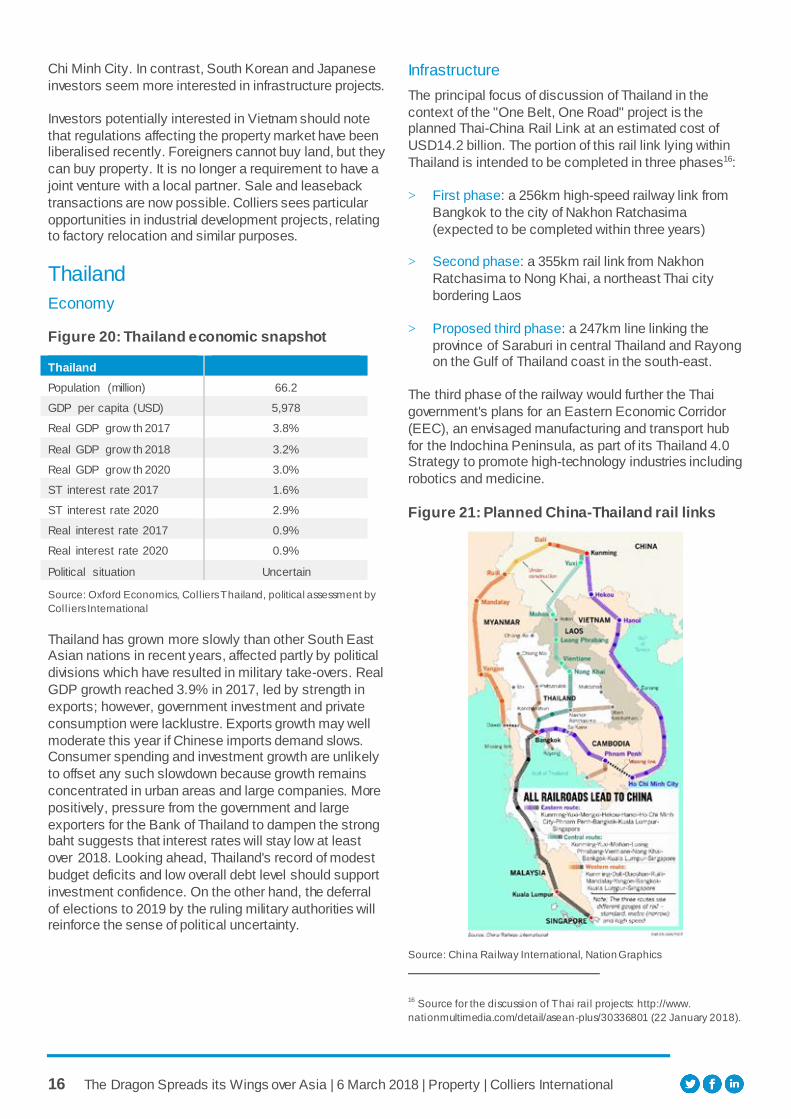
Infrastructure
The principal focus of discussion of Thailand in the
context of the "One Belt, One Road" project is the planned Thai-China Rail Link at an estimated cost of
USD14.2 billion. The portion of this rail link lying within
Thailand is intended to be completed in three phases16:
> First phase: a 256km high-speed railway link from
Bangkok to the city of Nakhon Ratchasima
(expected to be completed within three years)
> Second phase: a 355km rail link from Nakhon
Ratchasima to Nong Khai, a northeast Thai city
bordering Laos
> Proposed third phase: a 247km line linking the
province of Saraburi in central Thailand and Rayong on the Gulf of Thailand coast in the south-east.
The third phase of the railway would further the Thai
government's plans for an Eastern Economic Corridor
(EEC), an envisaged manufacturing and transport hub
for the Indochina Peninsula, as part of its Thailand 4.0 Strategy to promote high-technology industries including
robotics and medicine.
Figure 21: Planned China-Thailand rail links
Source: China Railway International, Nation Graphics
16 Source for the discussion of Thai rail projects: http://www.
nationmultimedia.com/detail/asean-plus/30336801 (22 January 2018).

17 The Dragon Spreads its Wings over Asia | 6 March 2018 | Property | Colliers International
Completion of the Thai-China Rail Link depends on
extension of the project across Laos. Construction of the
section in this country has already begun, and Thailand
and Laos have reportedly agreed to use standard railway gauge to complete what is expected to be the busiest
railway route in South East Asia in the future. However,
one problem is that the Thailand-China train would have
a maximum operational speed of 250kph, whereas
Laos’s trains could not move faster than 150kph.
In the future, it is envisaged that the Thai-China Rail Link
would be connected to Kuala Lumpur in Malaysia and
Singapore, and also to Ho Chi Minh City in southern
Vietnam. However, the latter plan requires construction
of a railway linking Cambodia's capital Phnom Penh with southern Vietnam. For the moment this is a missing link
in the grand scheme.
Property market and opportunities
Figure 22: Bangkok property market snapshot
Bangkok
Grade A off ice market size ('000 sq m) 2,303
Grade A off ice yield 6.5%
Industrial market size ('000 sq m) 761
Industrial yield 5-7%
Total property investment
- Bangkok
USD1,404 million
Completed building investment
- Bangkok
USD759 million
Total property investment
- Thailand
USD1,565 million
Completed building investment
- Thailand
USD864 million
Source: Real Capital Analytics (property transaction greater than
USD10 mill ion), Colliers
According to RCA, Thailand ranked as South East Asia's
third largest investment property market in 2017 after
Singapore and Malaysia, recording USD1.6 billion of
total property investment and USD0.9 billion of
investment in completed buildings in 2017. As shown in Figure 22, Bangkok accounted for USD1.4 billion of the
total property transactions and USD0.8 billion of the
completed building investment. Hotel properties have
been active as the country is a very popular tourist
destination. The land sales market is another option to invest in the country's apartment and commercial
property, especially warehouse and shopping centres.
As is true for the Philippines, Chinese tourists have
made a significant impact on Thailand and its economy.
Visitors to Thailand in 2017 amounted to 35 million
people, of which total 30% or over 10 million came from
China. It is worth noting that there are now many direct
flights connecting Thailand and China, reducing journey
times to five or six hours. Consequently, Thailand hosts
large numbers of Chinese people, not just tourists, but also retiree migrants, scholarship students and investors.
There are numerous other factors that make Thailand an
attractive target market for Chinese investment - and,
indeed, investment in general. Perhaps the most
important is the fact that Thailand allows foreign buyers direct freehold ownership of property. This stands in
contrast to China, where there is no freehold ownership.
In addition, prices of residential property are much lower
in Thailand than in mainland China. Thailand's CBD
condominiums and resort properties must look like a downright bargain for homebuyers from mainland China.
Evidence on the ground suggests that Chinese property
hunters are looking to buy middle-class and upper-
middle-class condominiums in Bangkok, as well as
condominiums in Pattaya and Chiang Mai. They also
appear interested in resort properties in Phuket and Ko Samui.
Chinese and other foreign investors interested in
Thailand's real estate market probably think first and
foremost of condominiums, resort properties, hotels and
infrastructure projects. In practical terms it is usually easiest to engage in projects through joint ventures with
Thai listed companies or other local partners which
require capital to expand businesses quickly, whether
condominium projects or hotel/resort developments. To
date, Colliers is aware of 16 well-known Chinese companies investing significantly in Thailand's real
estate market.
18 The Dragon Spreads its Wings over Asia | 6 March 2018 | Property | Colliers International
Myanmar
Figure 23: Myanmar economic snapshot
Myanmar
Population (million) 52.9
GDP per capita (USD) 1,295
Real GDP grow th 2017 7.1%
Real GDP grow th 2018 7.6%
Real GDP grow th 2020 7.2%
ST interest rate 2017 10.0%
ST interest rate 2020 10.0%
Real interest rate 2017 1.1%
Real interest rate 2020 3.9%
Political situation Uncertain
Source: Oxford Economics, political assessment by Colliers
International
Myanmar is in an early stage of liberalisation and reform,
and the authorities are steadily improving standards from a low base. Real GDP growth is running at about 7.5%
YOY, driven in part by a recovery in the agricultural
sector. This ranks joint with India as the highest among
major Asian markets. However, economic problems in
Myanmar include a sizable current account deficit and high CPI inflation of around 9%. These problems are
reflected in high policy interest rates. Concern about the
government's treatment of minorities and the continuing
influence of the military may affect Myanmar's reputation
as an investment destination over time.
Infrastructure
China's principal infrastructure project in Myanmar so far
is its involvement as, we understand, a 70% stakeholder
in the KyaukPhyu Special Economic Zone in Rakhine
State (formerly Arakan State) in north-west Myanmar17.
The establishment of this zone was first approved in December 2015, when the Myanmar government
awarded the development contract to a consortium of
five Chinese companies and one Thai company, with the
Beijing-based China International Trust and Investment
Corporation (CITIC) heading operations.
Initially, this project consisted of a deep-water port, an
industrial park and a residential zone. Subsequently, its
remit was extended, with an oil pipeline and power-
generation facilities added into the mix. Once completed,
the deep-water port is expected to have an annual throughput of 7.8 million tonnes of bulk cargo and 4.9
17 http://economists-pick-research.hktdc.com/business-
news/article/International-Market-News/China-Set-to-Confirm-70-
Stake-in-Major-Myanmar-based-BRI-
Project/imn/en/1/1X000000/1X0ABQ9L.htm
million TEU containers. However, the construction of the
port alone is expected to take 20 years and to be divided
across four development phases.
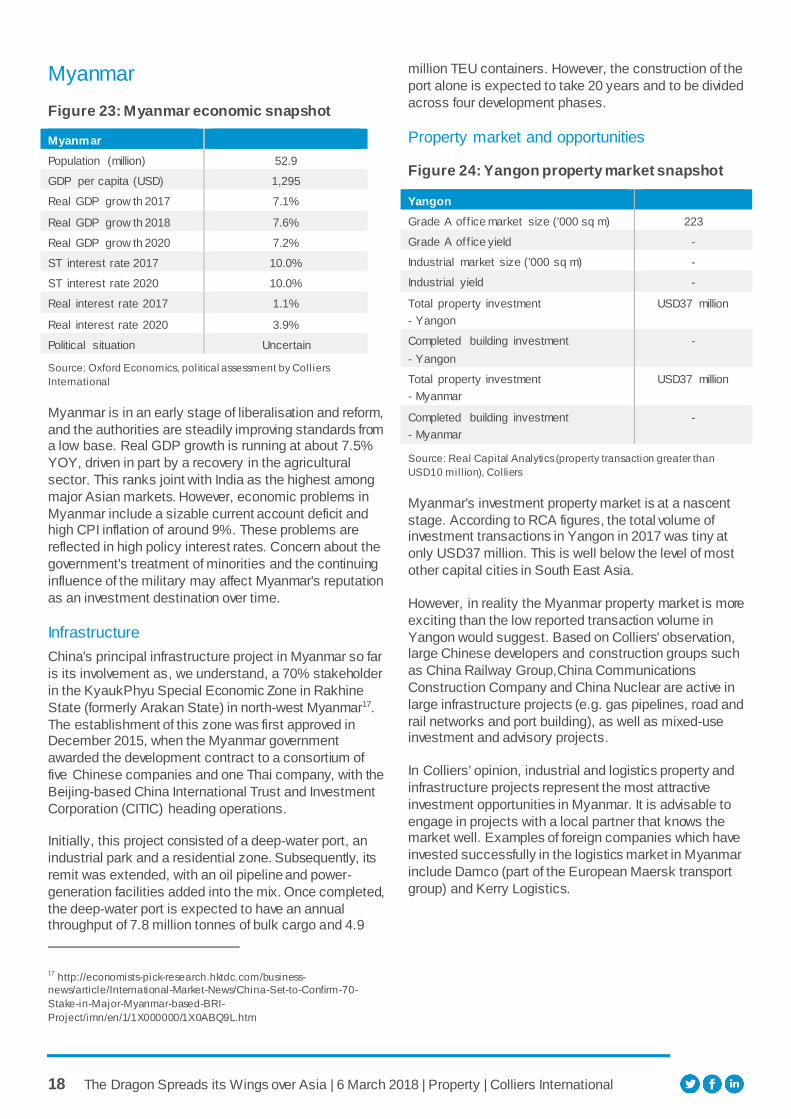
Property market and opportunities
Figure 24: Yangon property market snapshot
Yangon
Grade A off ice market size ('000 sq m) 223
Grade A off ice yield -
Industrial market size ('000 sq m) -
Industrial yield -
Total property investment
- Yangon
USD37 million
Completed building investment
- Yangon
-
Total property investment
- Myanmar
USD37 million
Completed building investment
- Myanmar
-
Source: Real Capital Analytics (property transaction greater than
USD10 mill ion), Colliers
Myanmar's investment property market is at a nascent
stage. According to RCA figures, the total volume of investment transactions in Yangon in 2017 was tiny at
only USD37 million. This is well below the level of most
other capital cities in South East Asia.
However, in reality the Myanmar property market is more
exciting than the low reported transaction volume in
Yangon would suggest. Based on Colliers' observation, large Chinese developers and construction groups such
as China Railway Group,China Communications
Construction Company and China Nuclear are active in
large infrastructure projects (e.g. gas pipelines, road and
rail networks and port building), as well as mixed-use investment and advisory projects.
In Colliers' opinion, industrial and logistics property and
infrastructure projects represent the most attractive
investment opportunities in Myanmar. It is advisable to
engage in projects with a local partner that knows the market well. Examples of foreign companies which have
invested successfully in the logistics market in Myanmar
include Damco (part of the European Maersk transport
group) and Kerry Logistics.
19 The Dragon Spreads its Wings over Asia | 6 March 2018 | Property | Colliers International
Malaysia
Infrastructure
China' s principal involvement in infrastructure in
Malaysia is through the East Coast Rail Link. A 700km
rail line is being built by the China Communications
Construction Company (CCCC), the state-owned
infrastructure development group, at an estimated cost of about USD13 billion. The East Coast Rail Link is one
of the key planks in Malaysia's bid to rejuvenate the
economy of the eastern part of peninsular Malaysia.
It is believed that East Coast Rail Link will be operational
by July 2024, ultimately connecting Port Klang on the west coast, the country's largest container port, with
Kuala Lumpur, the Malaysian capital, while servicing
several urban centres and ports along the eastern
seaboard. The northernmost terminal of the line will be
Pengkalan Kubor, a town on the Thai-Malaysia border18.
One of the beneficiaries of the new railway route will be Kuantan, the state capital of Pahang and the site of the
country's most significant east coast port. The port,
which offers strategic access to the South China Sea, is
currently undergoing a major upgrade. This will double
its capacity to 52 million freight weight tonnes (FWT) and allow the largest container ships to berth.
China is also involved in the upgrading of Kuantan Port.
The redevelopment work is being headed by the
Kuantan Port Consortium, a joint venture between IJM
Corporation Berhad, one of Malaysia's leading construction groups, and Beibu Gulf Holding (Hong
Kong), a subsidiary of Guangxi Beibu Gulf International
Port Group, a large Chinese port development and
management specialists. At present, ownership of the
consortium is split on a 60:40 basis in favour of IJM. In
addition, China and Malaysia are jointly developing the China-Kuantan Industrial Park Special Economic Zone
as a hub for power generation, energy-saving initiatives,
environmental technologies and similar fields.
Besides CCCC and Guangxi Beibu Gulf International
Port Group, Chinese groups such as Agile and Country Garden are known to be involved in mixed-use
development projects in Malaysia.
18 Source on Malaysia infrastructure projects: http://service-industries-
research.hktdc.com/business-news/article/International-Market-
News/BRI-Backing-Boosts-Malaysia-s-Rail-Infrastructure-
Redevelopment/imn/en/1/1X3PJ3K7/1X0ACMRF.htm.
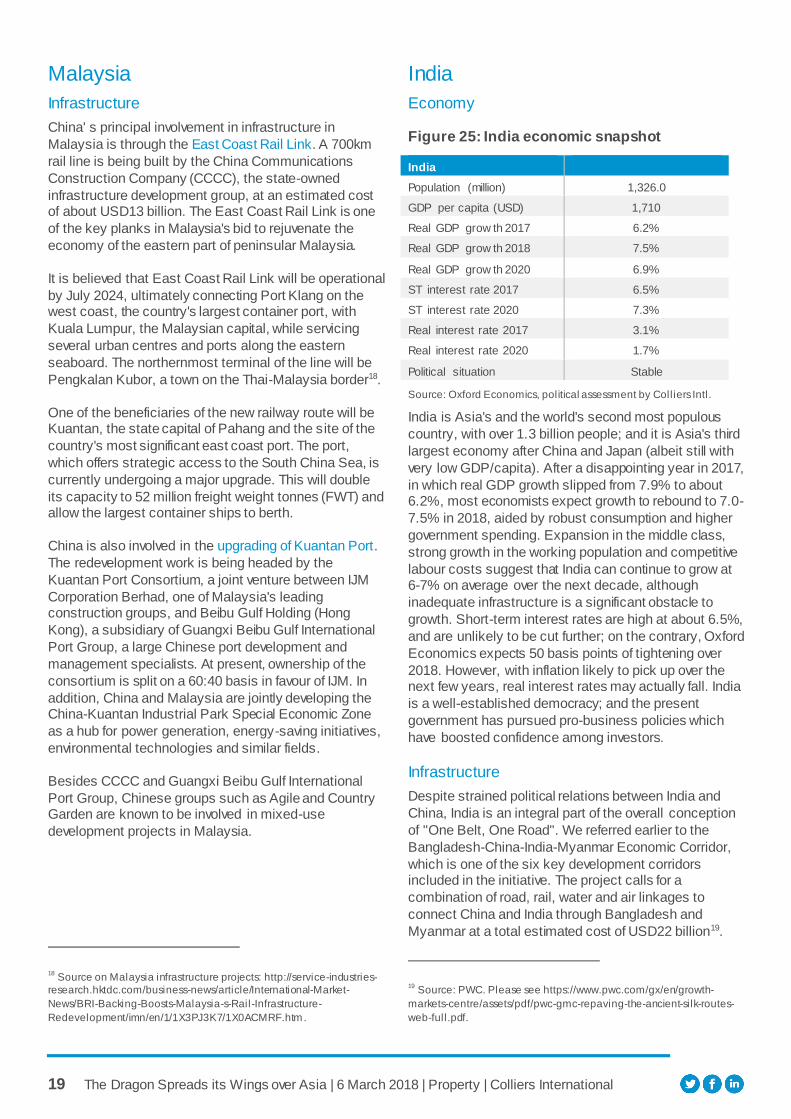
India
Economy
Figure 25: India economic snapshot
India
Population (million) 1,326.0
GDP per capita (USD) 1,710
Real GDP grow th 2017 6.2%
Real GDP grow th 2018 7.5%
Real GDP grow th 2020 6.9%
ST interest rate 2017 6.5%
ST interest rate 2020 7.3%
Real interest rate 2017 3.1%
Real interest rate 2020 1.7%
Political situation Stable
Source: Oxford Economics, political assessment by Colliers Intl.
India is Asia's and the world's second most populous
country, with over 1.3 billion people; and it is Asia's third
largest economy after China and Japan (albeit still with
very low GDP/capita). After a disappointing year in 2017,
in which real GDP growth slipped from 7.9% to about 6.2%, most economists expect growth to rebound to 7.0-
7.5% in 2018, aided by robust consumption and higher
government spending. Expansion in the middle class,
strong growth in the working population and competitive
labour costs suggest that India can continue to grow at 6-7% on average over the next decade, although
inadequate infrastructure is a significant obstacle to
growth. Short-term interest rates are high at about 6.5%,
and are unlikely to be cut further; on the contrary, Oxford
Economics expects 50 basis points of tightening over
2018. However, with inflation likely to pick up over the next few years, real interest rates may actually fall. India
is a well-established democracy; and the present
government has pursued pro-business policies which
have boosted confidence among investors.
Infrastructure
Despite strained political relations between India and
China, India is an integral part of the overall conception
of "One Belt, One Road". We referred earlier to the
Bangladesh-China-India-Myanmar Economic Corridor,
which is one of the six key development corridors included in the initiative. The project calls for a
combination of road, rail, water and air linkages to
connect China and India through Bangladesh and
Myanmar at a total estimated cost of USD22 billion19.
19 Source: PWC. Please see https://www.pwc.com/gx/en/growth-
markets-centre/assets/pdf/pwc-gmc-repaving-the-ancient-silk-routes-
web-full.pdf.

20 The Dragon Spreads its Wings over Asia | 6 March 2018 | Property | Colliers International
The proposed corridor would cover 1.65 million square
kilometres, encompassing an estimated 440 million
people in China's Yunnan province, Bangladesh,
Myanmar, and West Bengal in eastern India. Specifically, the planning calls for the construction of a
road route from Kunming in China's Yunnan Province via
Mandalay in Myanmar and Sylhet (Jalalabad) and Dhaka
in Bangladesh to Kolkata in West Bengal. It also calls for
the development of land and sea linkages to connect Mandalay (and therefore ultimately Kunming) with
Kolkata over the Bay of Bengal. The first meeting of
senior officials from the various countries involved to
discuss this project was held in 2013.
Property market and opportunities
Figure 26: India: major urban market snapshots
Bangalore
Grade A off ice market size ('000 sq m) 12,818
Grade A off ice yield 7.5%-8.5%
Industrial market size ('000 sq m) -
Industrial yield 8%-9%
Total property investment - Bangalore USD439 million
Completed building investment -
Bangalore
USD360 million
Total property investment - India USD5,057 million
Completed building investment - India USD3,627 million
Source: RCA (property transactions over USD10 mill ion), Colliers
Mumbai
Grade A off ice market size ('000 sq m) 11,557
Grade A off ice yield 7.5%-8.5%
Industrial market size ('000 sq m) -
Industrial yield 8%-9%
Total property investment - Mumbai USD488 million
Completed building investment - Mumbai USD183 million
Total property investment - India USD5,057 million
Completed building investment - India USD3,627 million
Source: RCA (property transactions over USD10 mill ion), Colliers
National Capital Region
Grade A off ice market size ('000 sq m) 9,815
Grade A off ice yield 7.5%-8.5%
Industrial market size ('000 sq m) 9,290
Industrial yield 8%-9%
Total property investment - NCR USD452 million
Completed building investment - NCR USD373 million
Total property investment - India USD5,057 million
Completed building investment - India USD3,627 million
Source: RCA (property transactions over USD10 mill ion), Colliers
According to RCA, real estate investment transaction
volume in India in 2017 reached USD5.1 billion for all
property assets (including land sites) and USD3.6 billion
for completed buildings. While investors and developers have shown high demand for land sites to develop
residential, office and industrial property, transactions of
completed buildings were more than double the level of
2016. We see this as a sign that India is at last starting
to mature as an investment property market.
By market segment, transactions of office, retail, and
industrial property were active, reaching USD1.58 billion,
USD0.93 billion and USD0.58 billion respectively in
2017. By city, real estate transaction volumes in
Mumbai, Bangalore, and the National Capital Region (Delhi, Gurgaon, Noida and the surrounding area) stood
at USD0.49 billion, USD0.44 billion and USD0.45 billion
respectively.
India is one of the few Asian markets where investment
interest from Chinese enterprises seems to have abated
over the past year. In 2016 and 2017, there were numerous reports of large investment plans by Chinese
companies in India. For example, one of the world’s
leading engineering machinery manufacturers, China’s
Sany Heavy Industry was reportedly planning to make
an investment of USD9.8 billion in India, while several other Chinese companies — Pacific Construction, China
Fortune Land Development and Dalian Wanda — were
said to be planning investments of more than USD5.0
billion. Most of these plans appear to be still at the draft
stage. Other developers such as Country Garden which appeared to be optimistic about India a year or two ago
appear to be going slowly in their decision-making
processes.
As was probably also true in the case of the US, in
India's case we suspect that Chinese enterprises have
heeded their authorities' injunction to be careful about excess investment. This may reflect the fact that India is
one of the Asian nations most cautious about "One Belt
One Road". India appears to see the objectives of the
project as partly mercantilist; and it is known to be
concerned about heavy Chinese infrastructure investment in the country's traditional rival, Pakistan.
These concerns may well take time to abate, and so we
think that Chinese capital is unlikely to be a driving force
in the Indian market despite its undoubted long-run
growth potential.
Even if Chinese interest has lessened, India is far too
important a market to ignore. Looking ahead, and on an
infrastructure-related note, we would point in particular to
the investment and development opportunities likely to
be provided by industrial property in India. Over 2018, we expect higher trade flows and e-commerce should
continue driving demand for industrial and logistics
21 The Dragon Spreads its Wings over Asia | 6 March 2018 | Property | Colliers International
space property in China, Hong Kong, Singapore and
India. While the industrial property market in India is still
at a nascent stage, we expect industrial space to emerge
as next organised property asset class in the country, giving a decentralisation push which should unlock land
values in areas outside major cities and stimulate
business activity20.
Pakistan
Infrastructure
Pakistan has been perhaps the most optimistic supporter
of China's "One Belt, One Road"; and the China-
Pakistan Economic Corridor (CPEC) is a core component of the plan. The CPEC extends from
Kashgar in Xinjiang in north-west China to southern
Pakistan’s Gwadar Port, situated on the Arabian Sea at
the country's Balochistan province. Gwadar Port also lies
along the ocean route connecting China with Myanmar,
India and Pakistan.
The CPEC is a hugely ambitious project which entails
the construction of roads, railways, tunnels, power
projects, ports and other infrastructure across Pakistan.
The connections to China pass through some of the
most difficult terrain in the world in the Karakoram range of mountains. Nevertheless, so far, aggregate financing
for projects included in the CPEC has reached USD62
billion21, and important elements of the corridor plan are
already operational. Notably, the Karakoram Highway
already exists, although CEPC planning calls for the highway to be widened and for connected highways to
be upgraded including the Karachi-Lahore section22.
Gwadar Port, likewise, is already functioning. However,
an important element of the CPEC plan is the
construction of an expanded port. This will be located
near a 2,282 acre (9.2 million square metre) free trade area in Gwadar which is being modelled on the lines of
China's Special Economic Zones. The swathe of land to
be used for the new port was handed to China Overseas
Port Holding Company in November 2015 as part of a
43-year lease, while construction of the project began in June 201623.
20 See Colliers' Top Ten predictions for Asian property in 2018 at
http://apacpropertyoutlook.colliers.com.au/asia.
21 See http://www.dnaindia.com/world/report-china-s-cpec-
investmentin-pakistan-reaches-usd-62-billion-2398542.
22 See also PWC report at https://www.pwc.com/gx/en/growth-markets-
centre/assets/pdf/pwc-gmc-repaving-the-ancient-silk-routes-web-
full.pdf.
23 See https://en.wikipedia.org/wiki/
Gwadar_Port#Gwadar_Port_as_a_means_to_circumvent_the_Straits_
of_Malacca
Pakistan is not only one of the biggest beneficiaries of
the "One Belt, One Road" project. It is also the world's
fifth most populous country, with a population of about
210 million, and a rapidly expanding middle class. Oxford Economics sees real GDP growth of 5.5% in
201824. However, Pakistan also suffers from political
instability, insurrections and political tensions with India.
Despite the country's long-run growth potential, most
property investors and developers outside the country are therefore unlikely to make significant commitments to
Pakistan for some years yet.
24 Oxford Economics: Country Economic Forecast, Pakistan" (5
February 2018).
Primary Authors:
Andrew HaskinsExecutive Director | Research | Asia+852 2822 [email protected]
Terry SuenSenior Manager | Research | Asia+852 2822 [email protected]
$2.6billion in annual revenue
2billion square feet under management
15,000professionals and staff
Copyright © 2018 Colliers International.
The information contained herein has been obtained from sources deemed reliable. While every reasonable effort has been made to ensure its accuracy, we cannot guarantee it. No responsibility is assumed for any inaccuracies. Readers are encouraged to consult their professional advisors prior to acting on any of the material contained in this report.
About Colliers International GroupColliers International Group Inc. (NASDAQ and TSX: CIGI) is an industry-leading global real estate services company with 15,000 skilled professionals operating in 68 countries. With an enterprising culture and significant employee ownership, Colliers professionals provide a full range of services to real estate occupiers, owners and investors worldwide. Services include strategic advice and execution for property sales, leasing and finance; global corporate solutions; property, facility and project management; workplace solutions; appraisal, valuation and tax consulting; customised research; and thought leadership consulting.
Colliers professionals think differently, share great ideas and offer thoughtful and innovative advice that help clients accelerate their success. Colliers has been ranked among the top 100 global outsourcing firms by the International Association of Outsourcing Professionals for 12 consecutive years, more than any other real estate services firm.
For the latest news from Colliers, visit Colliers.com/Asia or follow us on Twitter: @Colliers and LinkedIn.
United States: 153Canada: 29Latin America: 24Asia Pacific: 79EMEA: 111
396 of�ices in68 countries on6 continents


![Korea Fintech Industry & Fintech Center Korea · [7/30, 2015 ] Alibaba Samsung GM Electronics 201.6 billion USD 155.5 billion USD 50.6 billion USD $111.8 billion 2018 $ 9.3 billion](https://static.fdocuments.net/doc/165x107/5f07c81f7e708231d41eb72b/korea-fintech-industry-fintech-center-korea-730-2015-alibaba-samsung.jpg)