“THE DRAGON GOES SHOPPING – “THE DRAGON GOES SHOPPING – A Look at China ’s Imports ” C....
25
“ “ THE DRAGON GOES SHOPPING – THE DRAGON GOES SHOPPING – A Look at China ’s Imports ” A Look at China ’s Imports ” C. Donald Brasher, Jr. C. Donald Brasher, Jr. Global Trade Information Services, Inc. Global Trade Information Services, Inc. (The following presentation was developed from official merchandise trade data through calendar year 2004. The charts also indicate trend lines for future years based upon historical data. This should not be confused with a projection or forecast of future trade. )
-
Upload
marcia-dawson -
Category
Documents
-
view
236 -
download
0
Transcript of “THE DRAGON GOES SHOPPING – “THE DRAGON GOES SHOPPING – A Look at China ’s Imports ” C....
“ “THE DRAGON GOES SHOPPING – THE DRAGON GOES SHOPPING – A Look at China ’s Imports ”A Look at China ’s Imports ”
C. Donald Brasher, Jr.C. Donald Brasher, Jr.
Global Trade Information Services, Inc.Global Trade Information Services, Inc.
(The following presentation was developed from official merchandise trade data through calendar year 2004. The charts also indicate trend lines for future years based upon historical data. This should not be confused
with a projection or forecast of future trade. )
April 26, 2005
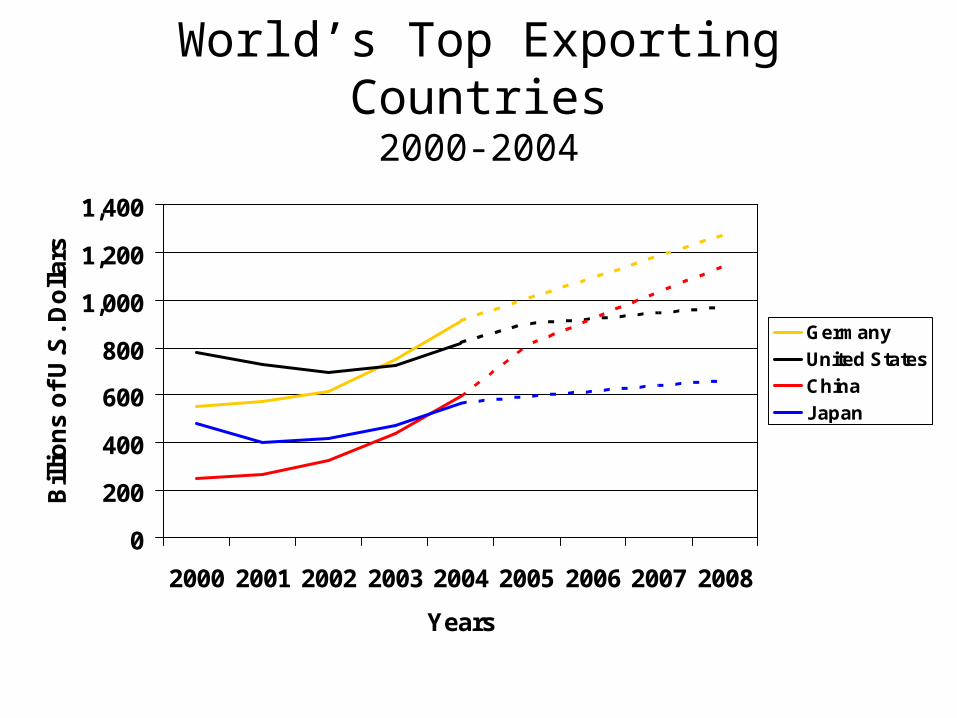
World’s Top Exporting Countries2000-2004
0
200
400
600
800
1,000
1,200
1,400
2000 2001 2002 2003 2004 2005 2006 2007 2008
Years
Bil
lio
ns
of
U.S
. D
oll
ars
Germany
United States
China
Japan
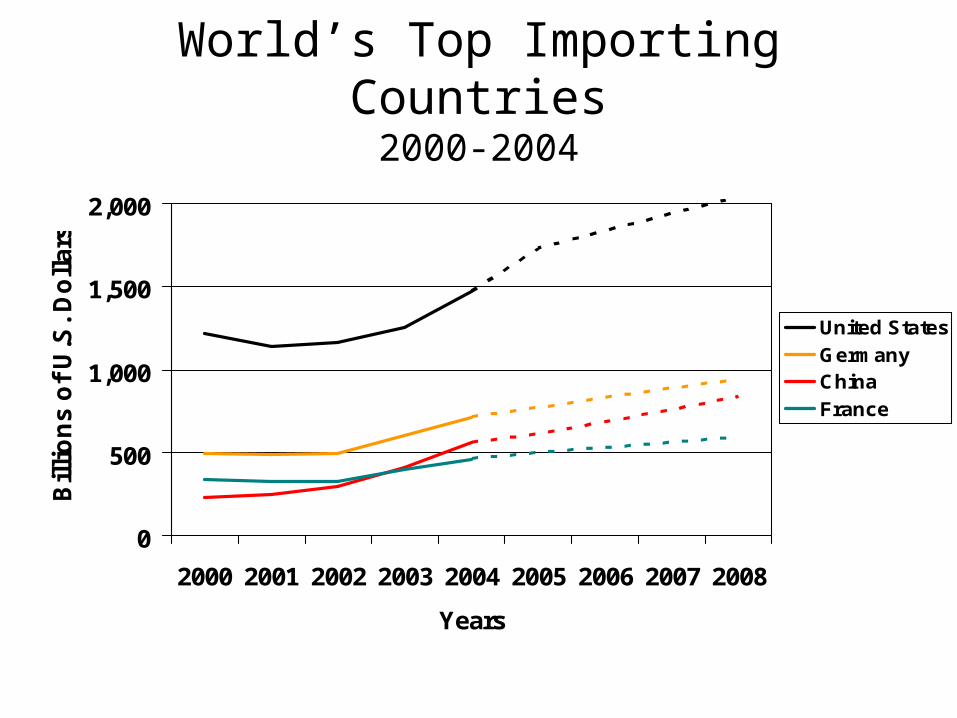
World’s Top Importing Countries2000-2004
0
500
1,000
1,500
2,000
2000 2001 2002 2003 2004 2005 2006 2007 2008
Years
Bil
lio
ns o
f U
.S.
Do
llars
United States
GermanyChina
France

U.S. Exports for Selected Countries2000-2004
0
50
100
150
200
250
300
2000 2001 2002 2003 2004 2005 2006 2007 2008
Years
Bil
lio
ns
of
U.S
. D
oll
ars
Canada
Mexico
Japan
United Kingdom
China
Germany
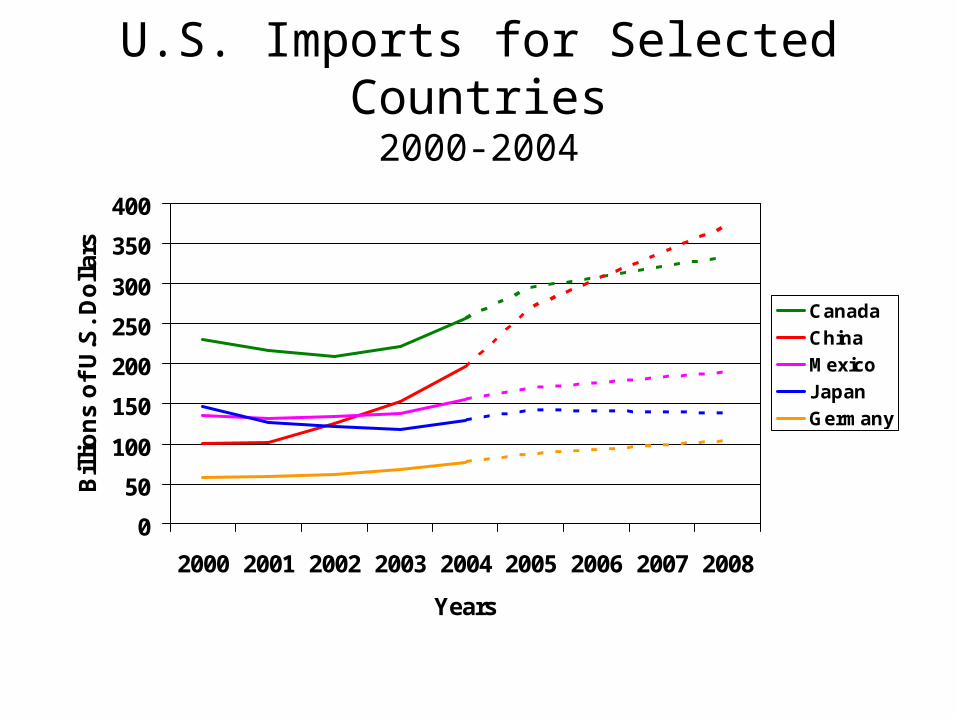
U.S. Imports for Selected Countries2000-2004
0
50
100
150
200
250
300
350
400
2000 2001 2002 2003 2004 2005 2006 2007 2008
Years
Bil
lio
ns
of
U.S
. D
oll
ars
Canada
China
Mexico
Japan
Germany
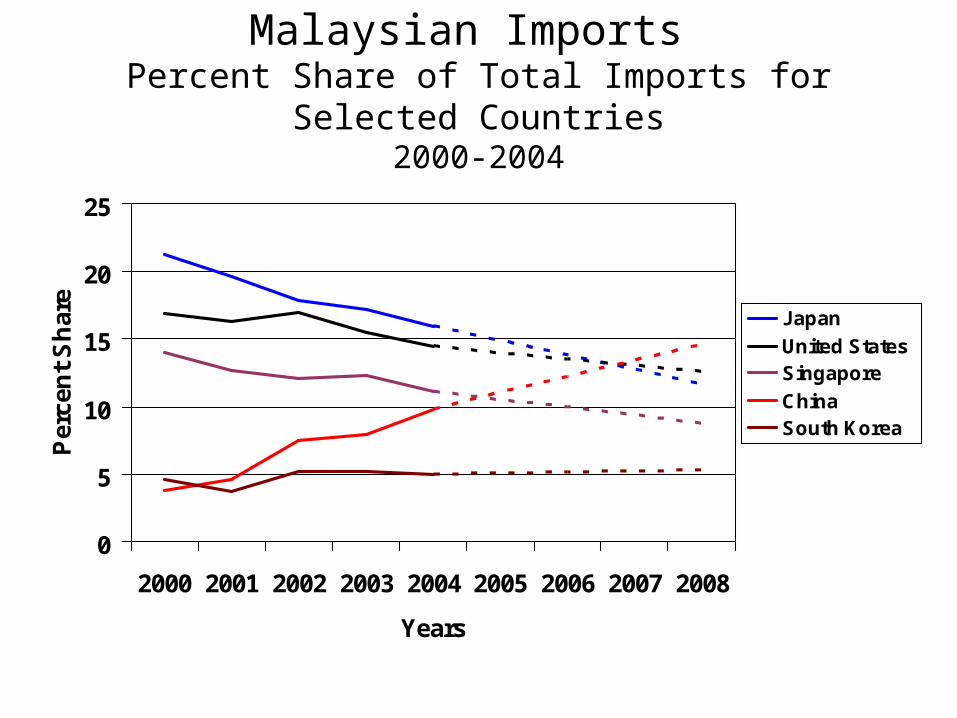
Malaysian Imports Percent Share of Total Imports for Selected Countries
2000-2004
0
5
10
15
20
25
2000 2001 2002 2003 2004 2005 2006 2007 2008
Years
Per
cen
t S
har
e
Japan
United States Singapore
ChinaSouth Korea

Australian Imports Percent Share of Total Imports for Selected Countries
2000-2004
0
5
10
15
20
25
2000 2001 2002 2003 2004 2005 2006 2007 2008
Years
Pe
rce
nt
Sh
are
United States
China
Japan
Germany
United Kingdom
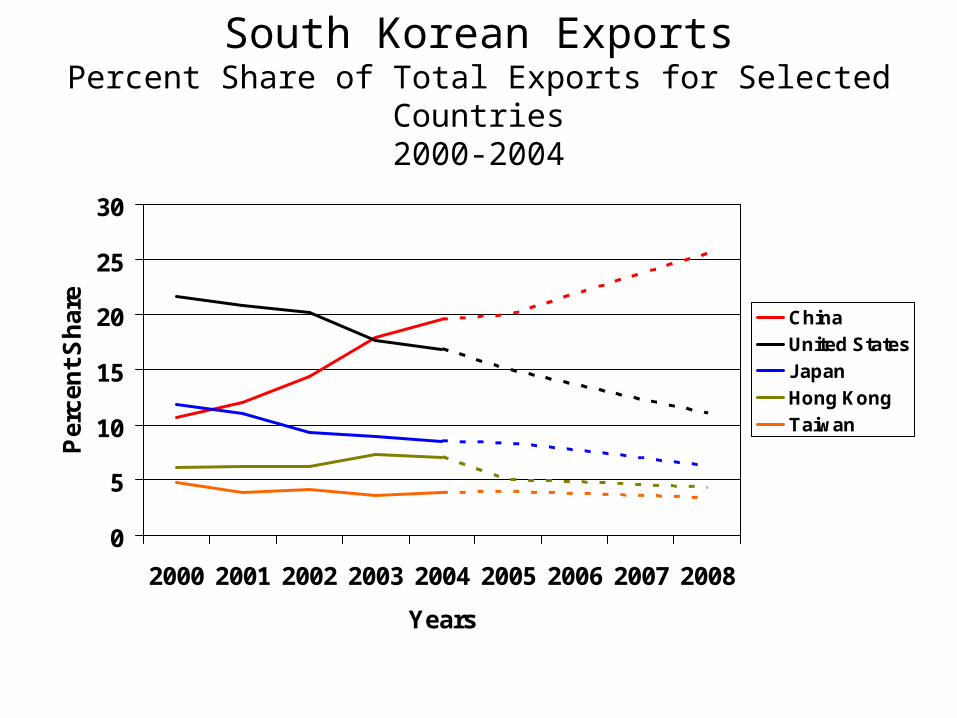
South Korean ExportsPercent Share of Total Exports for Selected Countries
2000-2004
0
5
10
15
20
25
30
2000 2001 2002 2003 2004 2005 2006 2007 2008
Years
Pe
rce
nt
Sh
are
China
United States
Japan
Hong Kong
Taiwan

Japanese Imports Percent Share of Total Imports for Selected Countries
2000-2004
0
5
10
15
20
25
30
2000 2001 2002 2003 2004 2005 2006 2007 2008
Years
Pe
rce
nt
Sh
are China
United States
South Korea
Australia
Indonesia

Japanese Exports Percent Share of Total Exports for Selected Countries
2000-2004
0
5
10
15
20
25
30
35
2000 2001 2002 2003 2004 2005 2006 2007 2008
Years
Pe
rce
nt
Sh
are United States
China
South Korea
Taiwan
Hong Kong
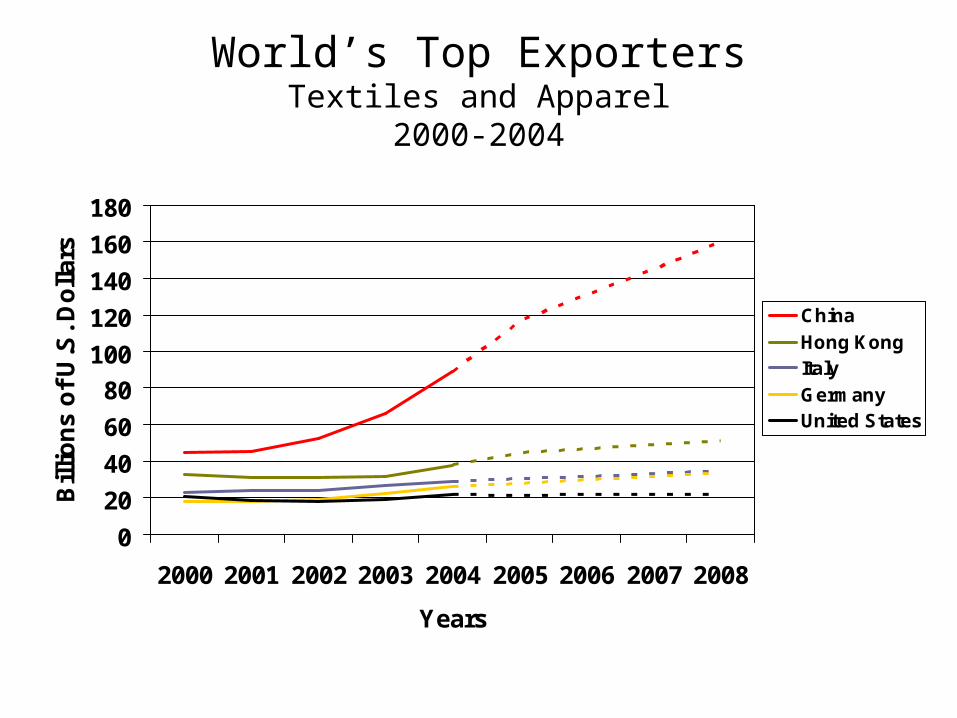
World’s Top ExportersTextiles and Apparel
2000-2004
0
20
40
60
80
100
120
140
160
180
2000 2001 2002 2003 2004 2005 2006 2007 2008
Years
Bil
lio
ns
of
U.S
. D
oll
ars
China
Hong KongItaly
GermanyUnited States
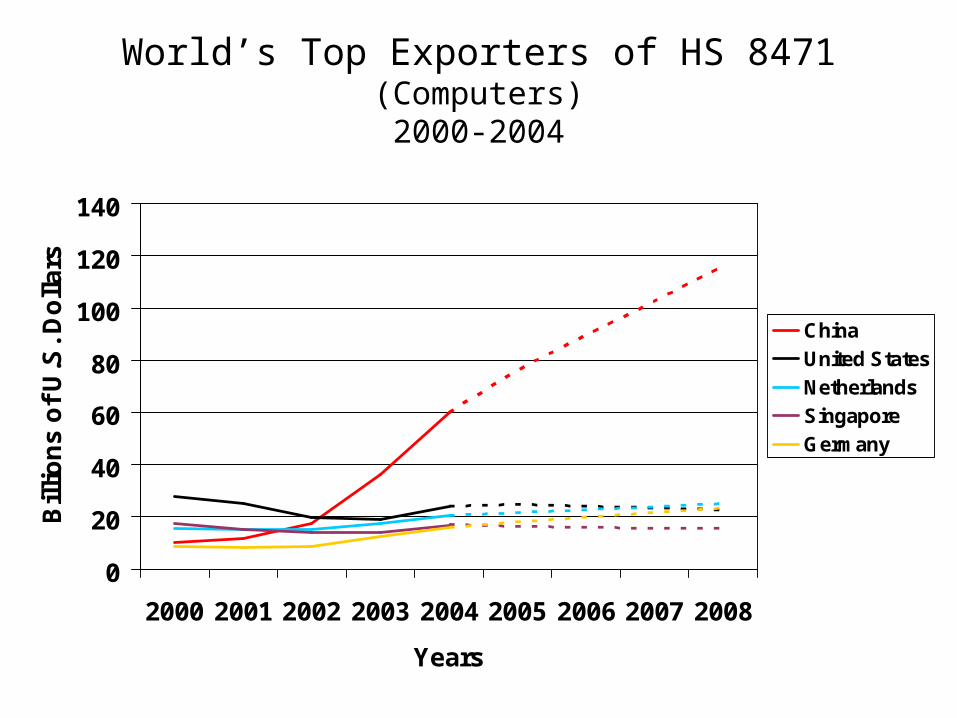
World’s Top Exporters of HS 8471(Computers)2000-2004
0
20
40
60
80
100
120
140
2000 2001 2002 2003 2004 2005 2006 2007 2008
Years
Bil
lio
ns
of
U.S
. D
oll
ars
China
United States
Netherlands
Singapore
Germany

World’s Top Importers of HS 72(Iron and Steel)
2000-2004
0
10
20
30
40
50
60
70
80
2000 2001 2002 2003 2004 2005 2006 2007 2008
Years
Bil
lio
ns
of
U.S
. D
oll
ars
China
United States
Germany
Italy

World’s Top Importers of HS 8542(Electric Integrated Circuits and Micro-Assemblies)
2000-2004
0
20
40
60
80
100
120
140
2000 2001 2002 2003 2004 2005 2006 2007 2008
Years
Bil
lio
ns
of
U.S
. D
oll
ars
China
Singapore
Hong Kong
Taiwan

World’s Top Importers of HS 2709(Petroleum Oils, Oils from Bituminous Minerals, Crude)
2000-2004
0
50
100
150
200
250
2000 2001 2002 2003 2004 2005 2006 2007 2008
Years
Billio
ns o
f U
.S. D
ollars
United States
Japan
China
South Korea
Germany
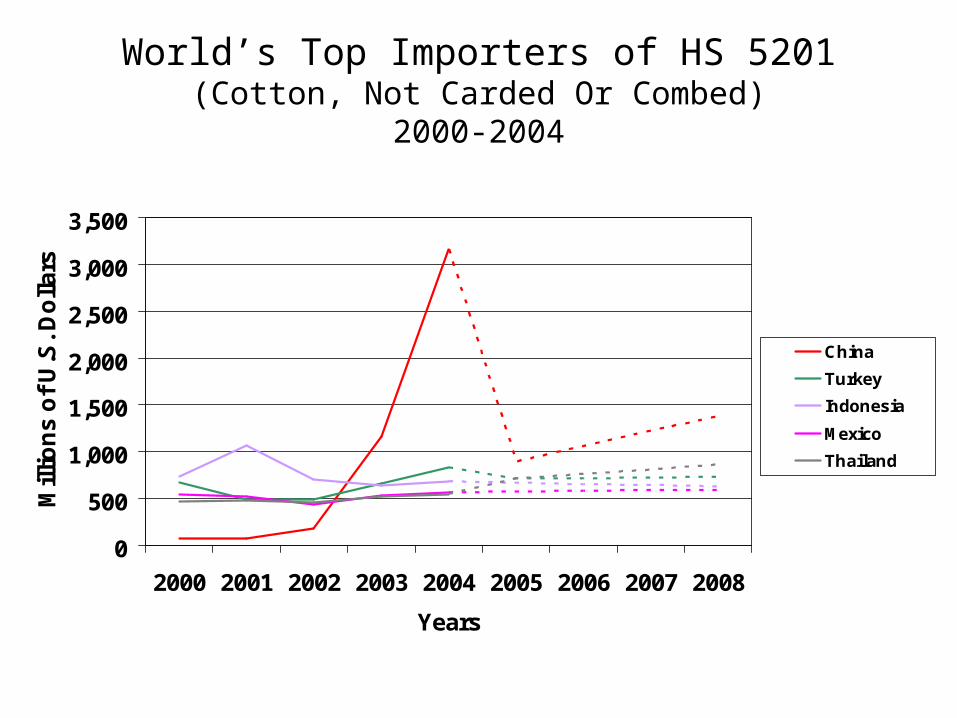
World’s Top Importers of HS 5201(Cotton, Not Carded Or Combed)
2000-2004
0
500
1,000
1,500
2,000
2,500
3,000
3,500
2000 2001 2002 2003 2004 2005 2006 2007 2008
Years
Millio
ns o
f U
.S. D
ollars
China
Turkey
Indonesia
Mexico
Thailand

China Imports of HS 5201(Cotton, Not Carded Or Combed)
2000-2004
0
200
400
600
800
1,000
1,200
1,400
1,600
1,800
2,000
2000 2001 2002 2003 2004 2005 2006 2007 2008
Years
Mil
lio
ns
of
U.S
. D
oll
ars
United States
Uzbekistan
Australia
Burkina Faso
Benin
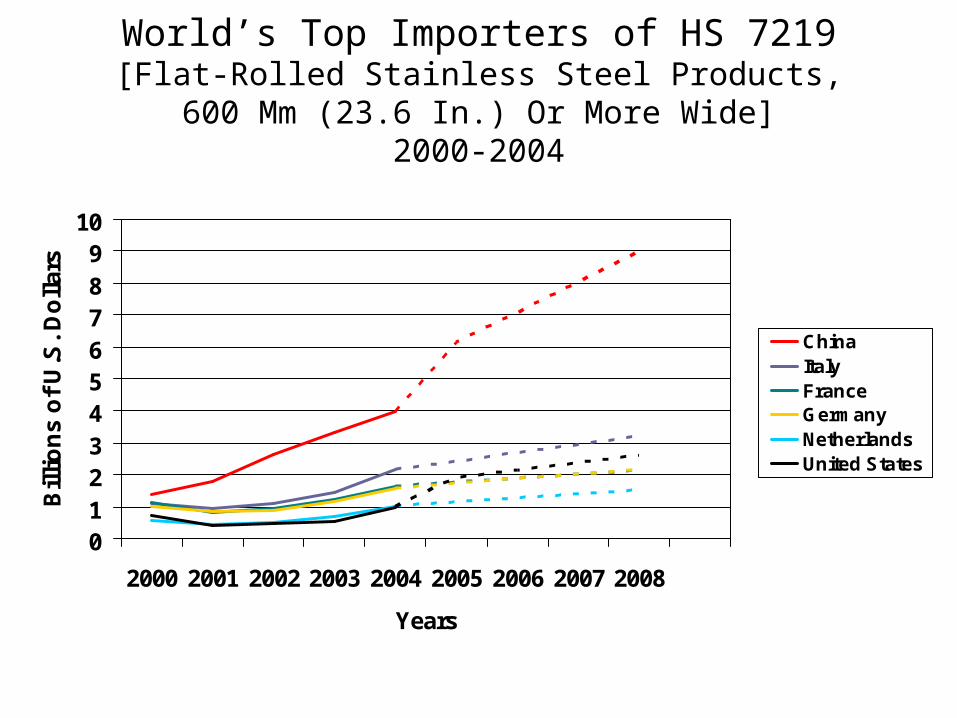
World’s Top Importers of HS 7219[Flat-Rolled Stainless Steel Products,
600 Mm (23.6 In.) Or More Wide]2000-2004
0123456789
10
2000 2001 2002 2003 2004 2005 2006 2007 2008
Years
Bil
lio
ns
of
U.S
. D
oll
ars
ChinaItalyFranceGermanyNetherlandsUnited States

China Imports of HS 7219[Flat-Rolled Stainless Steel Products,
600 Mm (23.6 In.) Or More Wide]2000-2004
0
500
1,000
1,500
2,000
2,500
3,000
3,500
2000 2001 2002 2003 2004 2005 2006 2007 2008
Years
Mil
lio
ns
of
U.S
. D
oll
ars
South Korea
Taiwan
Japan
India
Italy
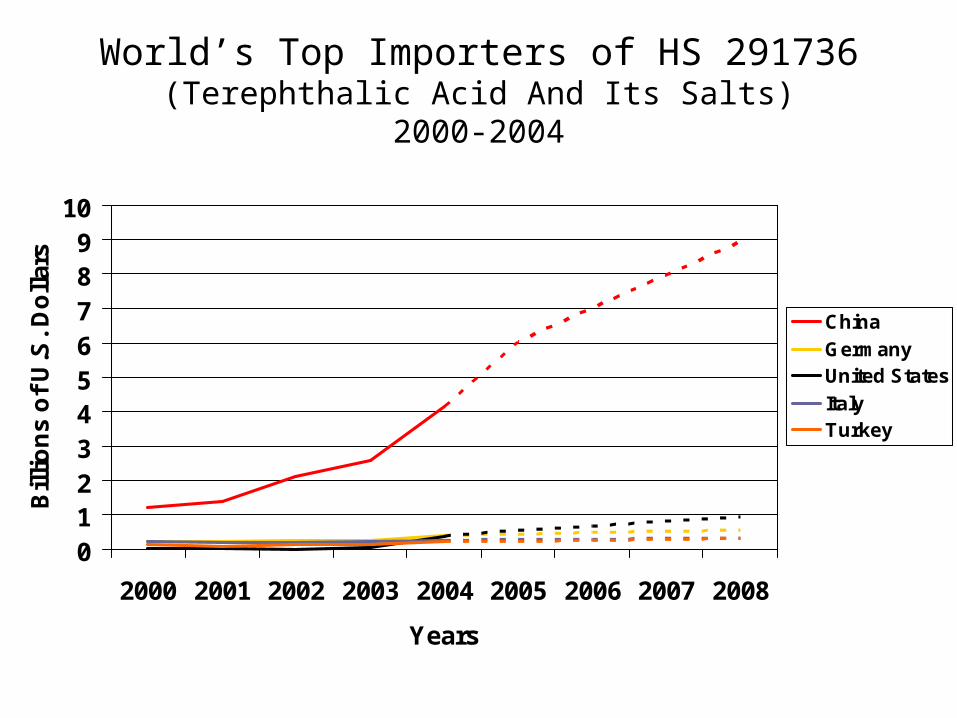
World’s Top Importers of HS 291736(Terephthalic Acid And Its Salts)
2000-2004
0123456789
10
2000 2001 2002 2003 2004 2005 2006 2007 2008
Years
Bil
lio
ns
of
U.S
. D
oll
ars
China
GermanyUnited States
ItalyTurkey
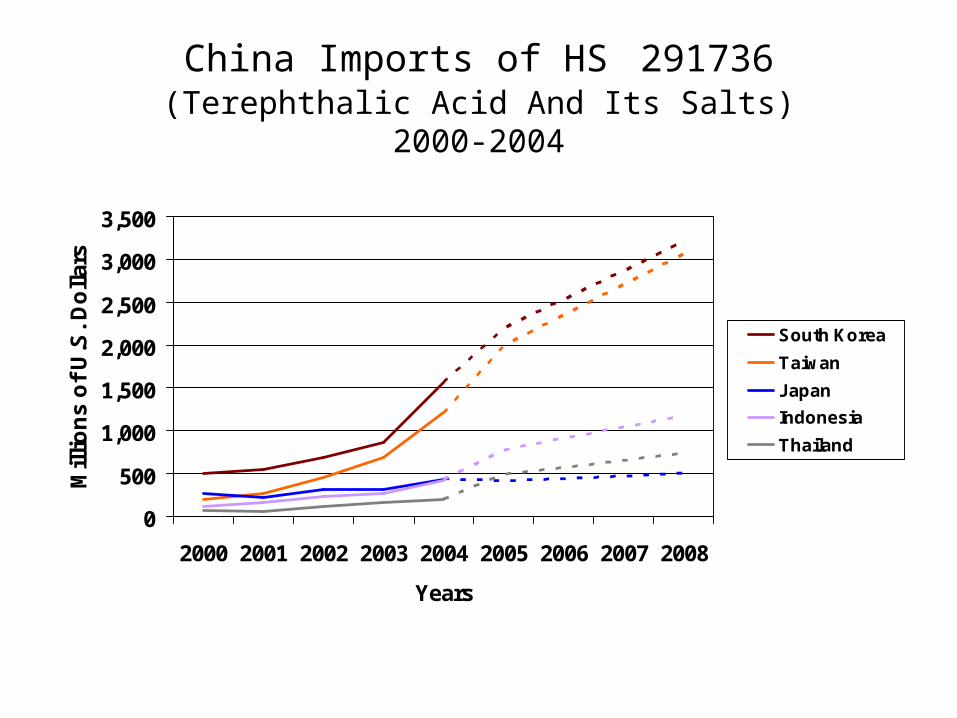
China Imports of HS 291736(Terephthalic Acid And Its Salts)
2000-2004
0
500
1,000
1,500
2,000
2,500
3,000
3,500
2000 2001 2002 2003 2004 2005 2006 2007 2008
Years
Mil
lio
ns
of
U.S
. D
oll
ars
South Korea
Taiwan
Japan
Indonesia
Thailand
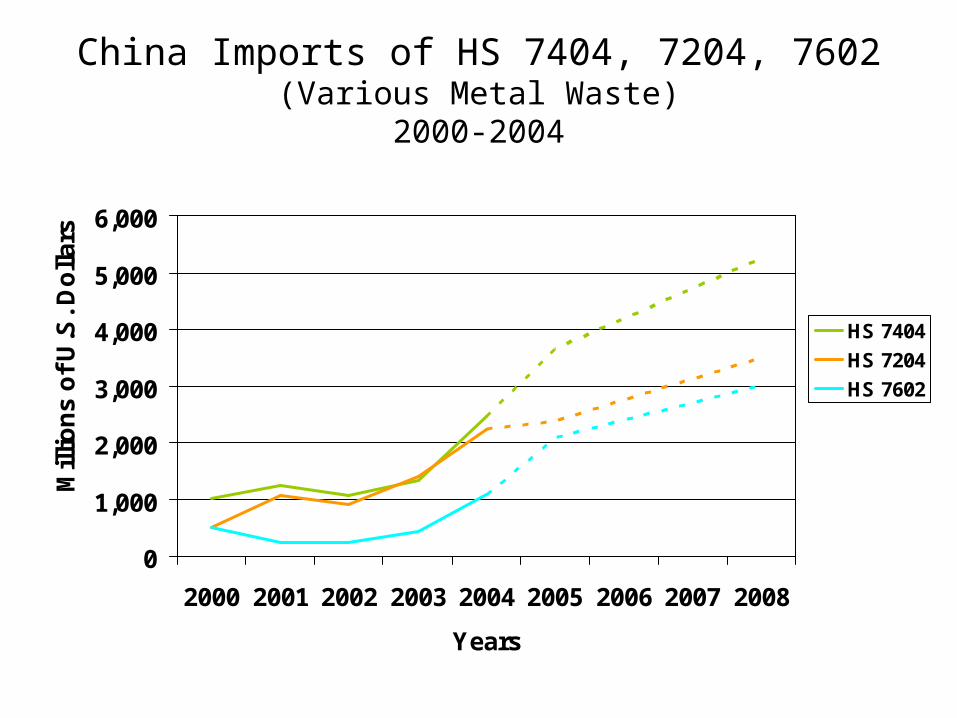
China Imports of HS 7404, 7204, 7602(Various Metal Waste)
2000-2004
0
1,000
2,000
3,000
4,000
5,000
6,000
2000 2001 2002 2003 2004 2005 2006 2007 2008
Years
Mil
lio
ns
of
U.S
. D
oll
ars
HS 7404
HS 7204
HS 7602

China Imports of HS 7204(Ferrous Waste And Scrap;
Remelting Scrap Ingots Of Iron Or Steel)2000-2004
0
200
400
600
800
1,000
1,200
1,400
1,600
2000 2001 2002 2003 2004 2005 2006 2007 2008
Years
Mil
lio
ns
of
U.S
. D
oll
ars
United States
Japan
Hong Kong
Kazakhstan
Russia
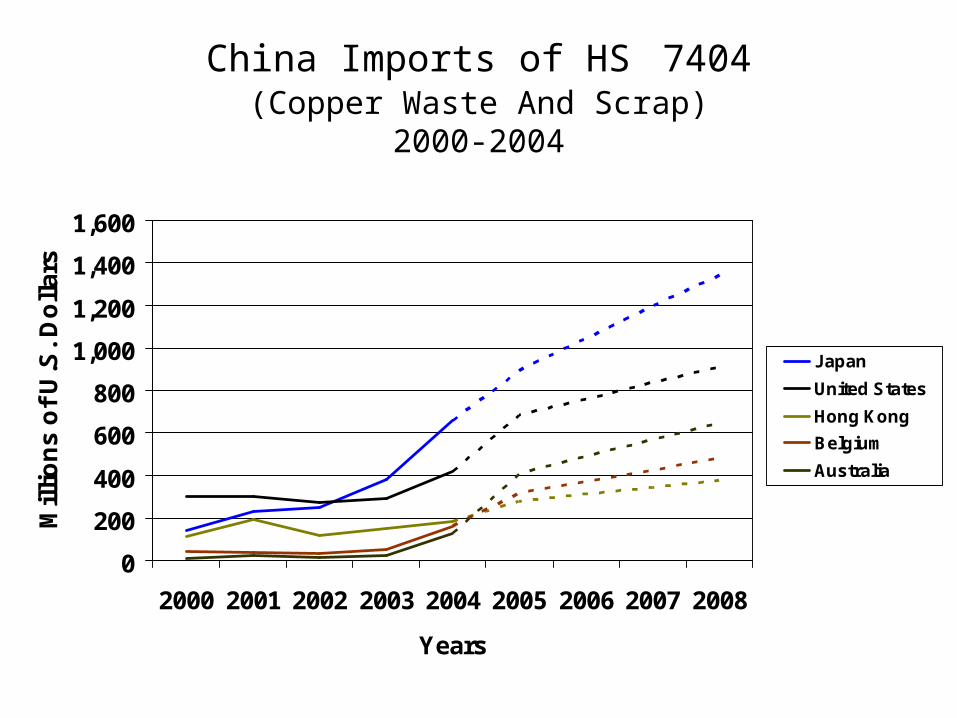
China Imports of HS 7404(Copper Waste And Scrap)
2000-2004
0
200
400
600
800
1,000
1,200
1,400
1,600
2000 2001 2002 2003 2004 2005 2006 2007 2008
Years
Mil
lio
ns
of
U.S
. D
oll
ars
Japan
United States
Hong Kong
Belgium
Australia
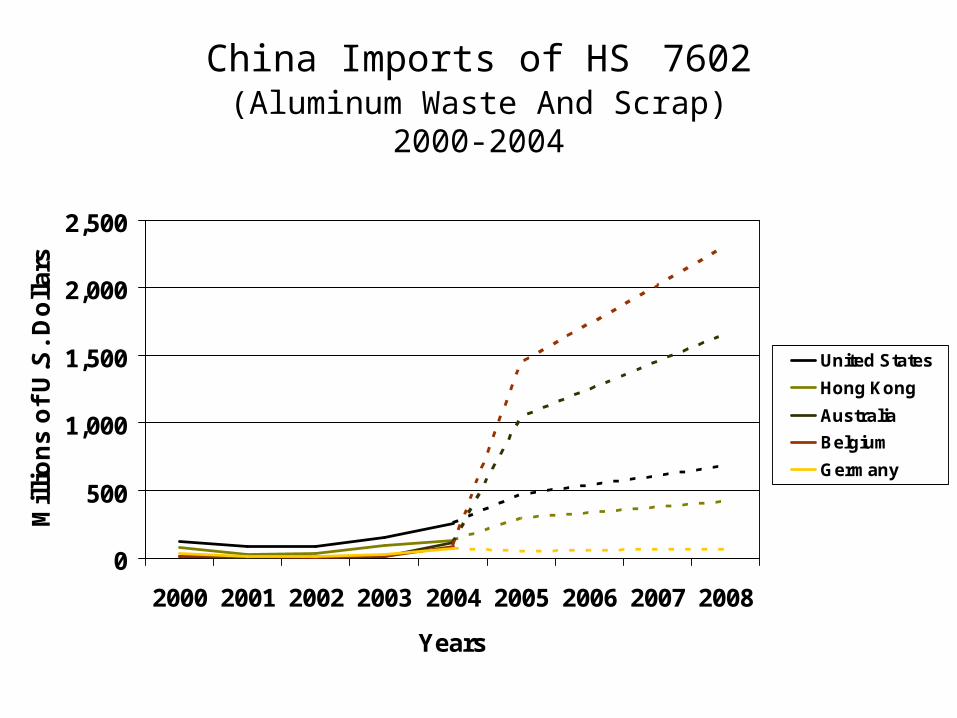
China Imports of HS 7602(Aluminum Waste And Scrap)
2000-2004
0
500
1,000
1,500
2,000
2,500
2000 2001 2002 2003 2004 2005 2006 2007 2008
Years
Mil
lio
ns
of
U.S
. D
oll
ars
United States
Hong Kong
Australia
Belgium
Germany


![Mad-Sad-Glad Libs The Mermaid goes shopping€¦ · The [ _____ ] mermaid [ _____ ] towards the [ _____ ] pirate ship, that [ _____ ] had capsized.](https://static.fdocuments.net/doc/165x107/5f77d60ee3c9a1577d70234f/mad-sad-glad-libs-the-mermaid-goes-shopping-the-mermaid-towards.jpg)