The Dragon Economy slows - implications for the UK & the world economy
11
The Dragon Economy slows - Implications for the UK & the world economy Marcus Wright RBS Economics August 2015
-
Upload
rbs-economics -
Category
Economy & Finance
-
view
212.519 -
download
0
Transcript of The Dragon Economy slows - implications for the UK & the world economy

The Dragon Economy slows - Implications for the UK & the world economy
Marcus Wright RBS Economics August 2015
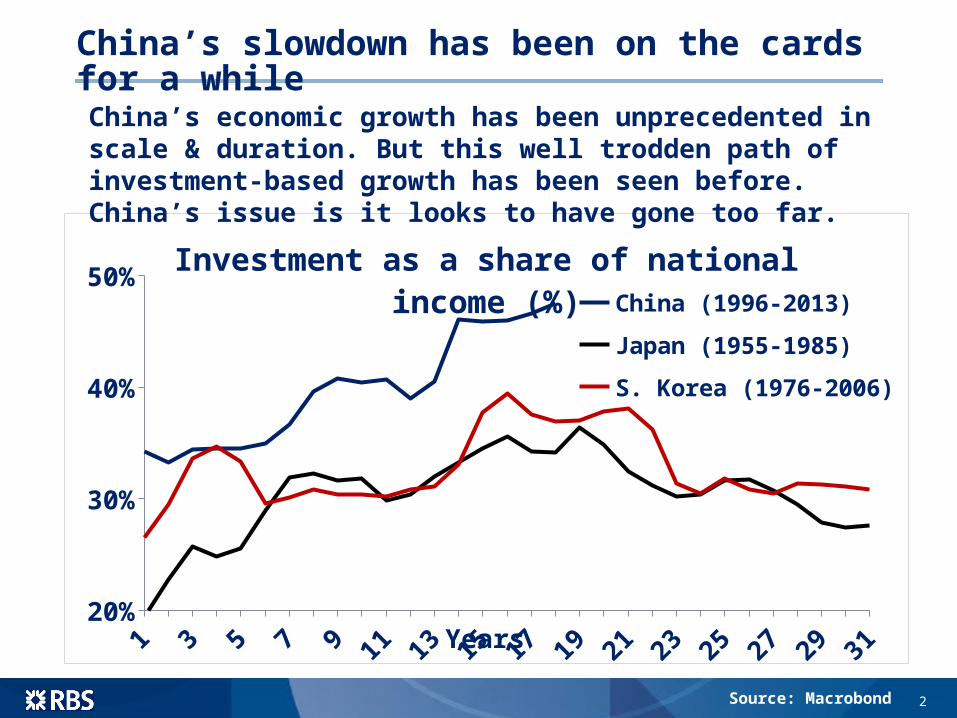
China’s slowdown has been on the cards for a while
2
1 3 5 7 9 11 13 15 17 19 21 23 25 27 29 3120%
30%
40%
50%Investment as a share of national income (%)
China (1996-2013)
Japan (1955-1985)
S. Korea (1976-2006)
Years
Source: Macrobond
China’s economic growth has been unprecedented in scale & duration. But this well trodden path of investment-based growth has been seen before. China’s issue is it looks to have gone too far.

1. Downward pressure on growth
2. Depressed rates of world trade growth
The China checklist – what’s happening?
5. Strained financial links to China
4. Global interest rates likely lower for longer
3. Downward pressure on inflation
?6. An all-out credit crunch in China
?

China’s growth is slowing fast, however you measure it
4Source: Bloomberg, Macrobond, RBS Economics
1997 2000 2003 2006 2009 2012 20150
5
10
15
20
GDP Growth Proxy - Y/Y ChangeGDP Y/Y Change
China appears to be slowing more than the headline figures suggest. The growth prospects of commodity producing countries & other emerging markets with close ties to China have been damaged.

A big reason why world trade is so bad right now
5
1995 1998 2001 2004 2007 2010 2013-30%
-20%
-10%
0%
10%
20%
30%
40%Emerging Asia Import Volume
(% Y/Y Change)
Asian Financial Crisis
Post-Tech Bubble Slowdown Global Finan-
cial Crisis
China induced slowdown?
Source: Netherlands CPB

Yuan devaluation - the cherry on the disinflationary sundae
6Source: Macrobond, BIS
• Yuan devaluation has grabbed the headlines recently. But it is not yet the big story.
• China has been exporting disinflation for a while now. And it is becoming more and more of an influence on world prices.
China
Brazil
India
Malaysia
South Africa
-30 50
Emerging Market Currencies
Increasingly 'under-valued'
Increasingly 'over-valued'
1971-85 1986-98 1999-20130
20406080
Causes of Inflation Variability in Advanced Economies (%)
Common factor Chinese export prices

Global interest rates lower for longer
7
Turkey (Jan-14)Denmark (Apr-11)Eurozone (Apr-11)
N. Zealand (Jun-10)N.Zealand (Mar-14)
Sweden (Jul-10)Chile (Jun-10)
Hungary (Nov-10)Poland (Jan-11)
Korea (Jul-10)Australia (Oct-09)
Israel (Aug-09)Norway (Nov-09)
Iceland (Sep-11)Canada (Jun-10)
477
915
1719
2122
24252526
3855
Number of months from 1st rate hike to first rate cut
All of these OECD central banks have raised rates since the financial crisis. All have had to lower them again.
Source: Bloomberg, Macrobond

Greece has grabbed all the headlines. It shouldn’t.
8
2005 2007 2009 2011 2013 -
500
1,000 Global Banking Sector Exposure
to Greece and China ($ Bn)
GreeceChina
Source: BIS, Macrobond
China
US
Ireland
Spain
-100% 0% 100% 200% 300% 400%
Change in UK financial sector exposure
(2009 - 2015)• While the UK has
decreased its financial exposure to most countries since the crisis, loans to China have sky-rocketed.
• The world’s attention has been focussed on Greece. But the world’s banking sector is 17 times more exposed to China. And that is before we count exposure to Hong Kong.

An impending credit crunch?
9
China’s banking sector is sitting on problem loans far in excess of official figures. Other countries’ experiences suggests it could be in for something worse than a slowdown.
Indon. - 1997
US - 2009
Japan - 1992
S. Korea - 1997
UK - 2009
Sweden - 1990
China - 2014
Thailand - 1997
Ire - 2007
0%
40%
80%
120%
24% 32%42% 42%
52%60%
82%
104% 105%Rise in private sector credit as % of GDP in the six years to.....
Source: Macrobond, IMF

Follow us on Twitter
10
@RBS_Economicshttps://twitter.com/rbs_economics
Or visit us online

11
Disclaimer
This material is published by The Royal Bank of Scotland plc (“RBS”), for information purposes only and should not be regarded as providing any specific advice. Recipients should make their own independent evaluation of this information and no action should be taken, solely relying on it. This material should not be reproduced or disclosed without our consent. It is not intended for distribution in any jurisdiction in which this would be prohibited. Whilst this information is believed to be reliable, it has not been independently verified by RBS and RBS makes no representation or warranty (express or implied) of any kind, as regards the accuracy or completeness of this information, nor does it accept any responsibility or liability for any loss or damage arising in any way from any use made of or reliance placed on, this information. Unless otherwise stated, any views, forecasts, or estimates are solely those of RBS’s RBS Economics Department, as of this date and are subject to change without notice. The classification of this document is PUBLIC. The Royal Bank of Scotland plc. Registered in Scotland No. 90312. Registered Office: 36 St Andrew Square, Edinburgh EH2 2YB. The Royal Bank of Scotland plc is authorised by the Prudential Regulation Authority and regulated by the Financial Conduct Authority and the Prudential Regulation Authority. © Copyright 2015 The Royal Bank of Scotland Group plc. All rights reserved