The Dragon Daily - НАШІ ГРОШІ
12
RESEARCH Ukraine THE DRAGON DAILY June 9, 2020 RESEARCH: Andriy Bespyatov, CFA ([email protected]) EQUITY SALES: Andriy Dmytrenko (+380 44) 490 7122, 281 2722 FIXED INCOME SALES: Konstantin Kucherenko (+380 44) 499 9550, 281 2716 CONTACT DETAILS: Dragon Capital Investments, 36D Saksahanskoho, 01 033 Kyiv, Ukraine TEL.: (+380 44) 490 7120 WEBSITE: www.dragon-capital.ua wц4 TRADERS’ VIEW Fixed income: The sovereign started the day by continuing Friday's move higher, with some prices +0.5-1pt by mid-day. Then the best bids pulled out as it seemed that profit-taking came in, and the market closed unchanged in the long end (while belly bonds outperformed). Quasi-sovereigns and corporates were indicated slightly stronger; a few trades were reported in DTEK in the 57-59 area. Equities: The local market was closed yesterday due to a public holiday, with investors focusing on foreign-listed names. FXPO had a volatile session, trading between GBp 190.1-209.6 and up 8.8% intra-day but finishing 0.3% lower at GBp 192.2. MHP dipped by 0.3%, KER closed 0.9% down at PLN 42.65, and AST (+0.3%) was the only stock to buck the trend. The broader KP- Dragon index thus lost 0.8% on the day. Stronger Asian markets and global equity futures point to a higher opening in Ukraine today. NEWS HEADLINES NBU reserves down 1.3% m-o-m to $25.4bn in May; hryvnia within UAH 26.5-27.0:USD DTEK — Reports weak 1Q20 financials, outlines restructuring proposal Ukreximbank — Books net profit in April BEST & WORST PERFORMERS MOST ACTIVE BY VOLUME Company Close* Chg. (1d; %) Vol.** ($ ‘000) BEST PERFORMERS Enwell Energy £0.158 3.6% 33.5 Astarta Holding zł16.45 0.3% 59.0 Centrenergo ₴6.900 0.0% 2.0 WORST PERFORMERS JKX Oil & Gas £0.200 (1.0%) 306.0 Kernel Holding zł42.25 (0.9%) 1,139.5 AgroGeneration €0.107 (0.9%) 30.2 Company Close* Chg. (1d; %) Vol.** ($ ‘000) Ferrexpo £1.922 (0.3%) 11,167.5 Kernel Holding zł42.25 (0.9%) 1,139.5 JKX Oil & Gas £0.200 (1.0%) 306.0 Astarta Holding zł16.45 0.3% 59.0 Enwell Energy £0.158 3.6% 33.5 AgroGeneration €0.107 (0.9%) 30.2 Agroton zł3.600 (3.2%) 18.5 MHP (LSE) $5.980 (0.3%) 14.9 COVID-19 CASES IN UKRAINE Total Active Recovered Died Cases 27,856 14,634 12,412 810 1d change +394 +164 +217 +13 FIXED INCOME EQUITIES Index UX KP-Dragon Index close 1,352.4 1,506.7 Daily change 0.0% (0.8%) YTD change (10.9%) (11.3%) Trading volume ($m)* 0.00 12.44 MC ($m)* 3,786 254 Note: *total turnover for the UX and KP-Dragon component stocks, respectively F/X MARKET Currency UAH:USD UAH:EUR Market rate* 26.600 30.034 Daily change 0.3% 0.3% YTD change (10.6%) (11.1%) Note: *UAH:EUR is based on UAH:USD market rate and respective cross rates Notes: *all closing prices are for the previous trading day and shown in the listing currency, as well as respective price changes; ₴ stands for Ukrainian hryvnia; **daily trading volumes reported by the UX are shown for domestically listed stocks. Sources: Dragon Capital, UX, Bloomberg 0 100 200 300 400 500 600 700 200 400 600 800 1,000 1,200 1,400 9-Mar 26-Mar 14-Apr 1-May 20-May 8-Jun EMBI+ Ukraine spread (lhs) Premium to EMBI+ spread (rhs) 1,100 1,250 1,400 1,550 1,700 1,850 0 10 20 30 40 50 19-Dec 20-Jan 17-Feb 16-Mar 13-Apr 11-May 8-Jun Volume in stocks, UX ($ '000; lhs) KP-Dragon Index (rhs) 24.0 25.0 26.0 27.0 28.0 29.0 26.0 27.0 28.0 29.0 30.0 31.0 32.0 9-Mar 26-Mar 14-Apr 1-May 20-May 8-Jun UAH:EUR (market, lhs) UAH:$ (market, rhs)
Transcript of The Dragon Daily - НАШІ ГРОШІ

RESEARCH
Ukraine
THE DRAGON DAILY June 9, 2020
RESEARCH: Andriy Bespyatov, CFA ([email protected])
EQUITY SALES: Andriy Dmytrenko (+380 44) 490 7122, 281 2722 FIXED INCOME SALES: Konstantin Kucherenko (+380 44) 499 9550, 281 2716
CONTACT DETAILS: Dragon Capital Investments, 36D Saksahanskoho, 01 033 Kyiv, Ukraine
TEL.: (+380 44) 490 7120 WEBSITE: www.dragon-capital.ua
wц4
TRADERS’ VIEW
Fixed income: The sovereign started the day by continuing Friday's move higher, with some prices +0.5-1pt by mid-day. Then the best bids pulled out as it seemed that profit-taking came in, and the market closed unchanged in the long end (while belly bonds outperformed). Quasi-sovereigns and corporates were indicated slightly stronger; a few trades were reported in DTEK in the 57-59 area.
Equities: The local market was closed yesterday due to a public holiday, with investors focusing on foreign-listed names. FXPO had a volatile session, trading between GBp 190.1-209.6 and up 8.8% intra-day but finishing 0.3% lower at GBp 192.2. MHP dipped by 0.3%, KER closed 0.9% down at PLN 42.65, and AST (+0.3%) was the only stock to buck the trend. The broader KP-Dragon index thus lost 0.8% on the day. Stronger Asian markets and global equity futures point to a higher opening in Ukraine today.
NEWS HEADLINES
NBU reserves down 1.3% m-o-m to $25.4bn in May; hryvnia within UAH 26.5-27.0:USD
DTEK — Reports weak 1Q20 financials, outlines restructuring proposal
Ukreximbank — Books net profit in April
BEST & WORST PERFORMERS MOST ACTIVE BY VOLUME
Company Close* Chg.
(1d; %) Vol.** ($ ‘000)
BEST PERFORMERS
Enwell Energy £0.158 3.6% 33.5
Astarta Holding zł16.45 0.3% 59.0
Centrenergo ₴6.900 0.0% 2.0
WORST PERFORMERS
JKX Oil & Gas £0.200 (1.0%) 306.0
Kernel Holding zł42.25 (0.9%) 1,139.5
AgroGeneration €0.107 (0.9%) 30.2
Company Close* Chg.
(1d; %) Vol.** ($ ‘000)
Ferrexpo £1.922 (0.3%) 11,167.5
Kernel Holding zł42.25 (0.9%) 1,139.5
JKX Oil & Gas £0.200 (1.0%) 306.0
Astarta Holding zł16.45 0.3% 59.0
Enwell Energy £0.158 3.6% 33.5
AgroGeneration €0.107 (0.9%) 30.2
Agroton zł3.600 (3.2%) 18.5
MHP (LSE) $5.980 (0.3%) 14.9
COVID-19 CASES IN UKRAINE
Total Active Recovered Died
Cases 27,856 14,634 12,412 810
1d change +394 +164 +217 +13
FIXED INCOME
EQUITIES
Index UX KP-Dragon
Index close 1,352.4 1,506.7
Daily change 0.0% (0.8%)
YTD change (10.9%) (11.3%)
Trading volume ($m)* 0.00 12.44
MC ($m)* 3,786 254
Note: *total turnover for the UX and KP-Dragon component stocks, respectively
F/X MARKET
Currency UAH:USD UAH:EUR
Market rate* 26.600 30.034
Daily change 0.3% 0.3%
YTD change (10.6%) (11.1%)
Note: *UAH:EUR is based on UAH:USD market rate and respective cross rates
Notes: *all closing prices are for the previous trading day and shown in the listing currency, as well as respective price changes; ₴ stands for Ukrainian hryvnia; **daily trading volumes reported by the UX are shown for domestically listed stocks. Sources: Dragon Capital, UX, Bloomberg
0100200300400500600700
200
400
600
800
1,000
1,200
1,400
9-Mar 26-Mar 14-Apr 1-May 20-May 8-Jun
EMBI+ Ukraine spread (lhs)
Premium to EMBI+ spread (rhs)
1,100
1,250
1,400
1,550
1,700
1,850
0
10
20
30
40
50
19-Dec 20-Jan 17-Feb 16-Mar 13-Apr 11-May 8-Jun
Volume in stocks, UX ($ '000; lhs) KP-Dragon Index (rhs)
24.0
25.0
26.0
27.0
28.0
29.0
26.0
27.0
28.0
29.0
30.0
31.0
32.09-Mar 26-Mar 14-Apr 1-May 20-May 8-Jun
UAH:EUR (market, lhs)
UAH:$ (market, rhs)

The Dragon DAILY Page 2 June 9, 2020
ECONOMY & POLITICS
News: NBU gross foreign reserves declined by 1.3% m-o-m (-$0.3bn) to $25.4bn in May after rising
by 3.1% in April, remaining up 0.3% (+$0.1bn) YTD and up 31% (+$6.0bn) y-o-y. End-May reserves
were equivalent to an est. 4.3 months of 12-month trailing goods and services imports, being an est.
$1.2bn below the lower bound of the 2020E aggregate reserve adequacy metric (ARA).
The hryvnia inched up by 0.4% m-o-m to UAH 26.85:USD on the interbank market in May (+5.1%
from a low of UAH 28.2:USD on Mar. 2, but -11.5% YTD) and appreciated by another 0.9% to UAH
26.6:USD in the first week of June. (NBU, UkrDealing)
Dragon view: The latest reserves reading was in line with our estimate and the Bloomberg
consensus forecast. The m-o-m drop in May primarily reflected $1.1bn of external debt
repayments, including a $1.0bn US-guaranteed Eurobond. These outflows were partially
offset by $0.7bn of F/X purchases (virtually in line with April) aimed at curbing appreciation
pressure on the currency, which had reemerged following a wave of panic F/X buying in
March. In addition, reserves were supported by a $73m revaluation gain (according to the
NBU) and an est. $51m net sale of domestic F/X bonds. On a YTD basis, reserves got a boost
from a EUR 1.25bn sovereign Eurobond placement in January, $0.5bn net domestic F/X bond
sale in 5M20, and $0.4bn transfer of government F/X leftovers to the NBU from state-owned
Oschadbank. This fully offset an est. $2.9bn of gross external debt repayments, including the
$1.0bn U.S. guarantee, $0.6bn to the IMF, an est. $0.9bn of coupons on sovereign debt, and
$0.5bn of other external amortizations. The central bank was steadily buying F/X in April and
May after selling a massive $2.2bn in March, thus cutting its net F/X sale YTD to a tiny $63m.
As we wrote before, the currency’s quick stabilization and reversal from the March weakness
reflected a significant improvement in banking system parameters, with virtually zero deposit
outflows, and a sharp rebound in the merchandise trade balance, from deficit to surplus, in
April. We recently improved our end-2020 currency forecast to UAH 28.0:USD (-5.0% from
current level and -15% y-o-y) from UAH 30-35:USD expected before. The projected mild
weakening by year-end reflects our view that in the absence of foreign inflows into UAH
bonds, the trade balance will slip back into deficit on a seasonal drop in grain exports,
softening terms of trade, and recovery in manufactured imports as Ukraine continues to exit
the quarantine imposed in mid-March. Expecting further gradual import recovery, we see the
hryvnia weaken further to UAH 29.5:USD by end-2021 (-5.1% y-o-y). We estimate NBU
reserves will rise to $28.0bn by end-2020 and $29.5bn in 2021, driven by government external
borrowings, reaching the lower bound of the IMF’s aggregate adequacy metric (est. $26.6bn
for 2020E) for the first time in a decade.
Olena Bilan, [email protected]
NBU reserves down 1.3% m-o-m
to $25.4bn in May; hryvnia
within UAH 26.5-27.0:USD
NBU International Reserves ($bn) UAH:USD Spot (Interbank Market) Note: *equiv. to gross international reserves net of IMF loans and NBU swaps with other central banks; **IMF’s ARA metrics is based on exports, broad money, scheduled
external debt amortizations and other external liabilities; Dragon Capital estimate for 2020. Sources: NBU, UkrDealing, IMF, Dragon Capital estimates
0
1
2
3
4
5
6
7
8
0
5
10
15
20
25
30
35
40
May
-13
Nov-1
3
May
-14
Nov-1
4
May
-15
Nov-1
5
May
-16
Nov-1
6
May
-17
Nov-1
7
May
-18
Nov-1
8
May
-19
Nov-1
9
May
-20
IMF loans & NBU swaps ($bn; lhs)Net reserves* ($bn; lhs)Gross reserves (months of imports; rhs)
3 months of imports adequacy threshold (rhs)
Lower bound of IMF's ARA Metric**
23
24
25
26
27
28
29
Jan
Feb
Mar Apr
May Jun Jul
Aug
Sep
Oct
Nov
Dec
2017 2018 2019 2020

The Dragon DAILY Page 3 June 9, 2020
CORPORATES
News: DTEK published its condensed financial and operating results for 1Q20, reporting ROM coal
production of 5.7 Mt (-1% q-o-q and -4% y-o-y) and electricity generation of 5.1 TWh (-10% q-o-q and
-38% y-o-y). The average electricity tariff was down 7% q-o-q and 31% y-o-y to UAH 1.33/kWh. Coal
imports stood at 64 kt (-78% q-o-q and -90% y-o-y).
Total sales fell 22% q-o-q and 56% y-o-y to $510m, with EBITDA of $73m (+33% q-o-q, -74% y-o-y),
and a net loss of $299m (vs. $175m loss in 4Q19 and $151m net income in 1Q19).
Net operating cash flow shrank 41% q-o-q and 14% y-o-y to $60m, investment cash outflow was down
54% q-o-q and 68% y-o-y to $24m, and financing cash flow stood was close to zero (vs. outflows of
$74m in 1Q19 and $51m in 4Q19). Total debt stood at $1.9bn (+2% q-o-q and -1% y-o-y), with net
debt unchanged at $1.9bn and implying an annualized Debt/EBITDA of 6.5x (vs. 8.5x in 4Q19 and
1.7x in 1Q19) and Net Debt/EBITDA of 6.4x (vs. 1.7x in 1Q19). Cash balances were up 276% q-o-q to
$42m (-42% y-o-y).
Separately, DTEK outlined its debt restructuring proposal. The company expects 2020 EBITDA at
$175m, followed by recovery to $447m in 2021 on stronger coal prices and improved market conditions
in Ukraine. To address its ongoing liquidity crisis, the company is preparing restructuring terms which
envisage preserving the outstanding principal, extending its maturity with regular amortizations,
aligning cash interest expenses with cash flows, with excess cash redistributed as cash sweep, and
simplifying the capital structure by repaying DTEK Oil & Gas maturities over time.
On a conference call, management reported end-May cash of $26m and a current cash burn rate of
around $10m per month. The company restarted its Pavlohrad Coal mine in mid-May and expect to
restarts another mining unit, Dobropillya Coal, by July. DTEK expects no improvement in operating or
financial performance in 2H20. (Company).
Dragon view: DTEK suffered a liquidity crunch in 4Q19-1Q20 on a sharp drop in domestic
electricity prices and an unprecedented slide in thermal power generation due to unusually
warm temperatures and shifts in the structure of domestic power generation. Although 1Q20
EBITDA increased q-o-q, this was due mostly to non-cash items, while operating cash flow
before working capital charges fell 30% to $77m. The working capital charge was close to zero
in 1Q20 as growth in receivables and inventories was offset by prepayments and an increase
in payables.
Electricity prices remained depressed in April and May, with day-ahead market quotes
averaging UAH 1.2/kWh. But thermal power production (by DTEK, Centrenergo [Under
Review] and Donbasenergo [Not Rated]) rebounded by almost a third in May after the
government revised demand-supply balances for the power market by cutting the production
share of nuclear power plants and effectively increasing thermal GenCos’ share to 30%.
Meanwhile, the weakness in electricity demand became less pronounced in May as domestic
coronavirus containment measures started to be relaxed and industrial demand recovered. In
May, steel production jumped by 21% m-o-m, adding to power demand recovery.
The outline of DTEK’s restructuring proposal was generally in line with market expectations,
including no principal haircut and interest payments adjusted to cash flows. Also, the
involvement of DTEK Oil & Gas in the restructuring was previously rumored but not
officially confirmed. DTEK Oil & Gas is the largest private gas producer in Ukraine with close
to 1.7 bcm of annual gas production and beneficial geological conditions. Still, the recent drop
in gas prices hit its financial performance (we estimate its annual EBITDA in the order of
$150m at current gas prices), limiting its ability to prepay receivables to DTEK Energy. Still,
potential recovery in gas prices in 2021 should help the company start repaying the
receivables ahead of their scheduled 2023-2024 maturities.
See table on next page
Dennis Sakva, [email protected]
DTEK — Reports weak 1Q20
financials, outlines restructuring
proposal
Issue DTEKUA 10.75 24
Price 55.0/60.0
Yield 29.45%/26.49%

The Dragon DAILY Page 4 June 9, 2020
CORPORATES
1Q19 4Q19 1Q20
Change Change
(%; q-o-q) (%; y-o-y)
Production indicators
G-grade coal (kt) 5,721 5,908 5,667 (4%) (1%)
Electricity generation (GWh) 8,233 5,671 5,121 (10%) (38%)
Average tariff (UAH/kWh0 1.93 1.42 1.33 (7%) (31%)
Coal imports (kt) 618 292 64 (78%) (90%)
Quarterly financials
Sales ($m) 1,163 658 510 (22%) (56%)
EBITDA ($m) 286 56 75 33% (74%)
Net income ($m) 151 (175) (299) 71% (299%)
EBITDA margin (%) 24.6% 8.6% 14.6% 6.1pp (10.0pp)
Net margin (%) 13.0% (26.5%) (58.6%) (32.1pp) (71.6pp)
Operating cash flow ($m) 70 103 60 (41%) (14%)
Investing cash flow ($m) (74) (51) (24) (54%) (68%)
Financing cash flow ($m) (56) (59) (0) (99%) (99%)
Total Debt ($m) 1,964 1,911 1,941 2% (1%)
Net Debt ($m) 1,893 1,900 1,899 (0%) 0%
Cash ($m) 72 11 42 276% (42%)
Debt/EBITDA (annualized) 1.7 8.5 6.5
Net Debt/EBITDA (annualized) 1.7 8.4 6.4
DTEK Financial Results Sources: Company, Dragon Capital estimates
News: According to provisional NBU data, state-owned Ukreximbank booked net profit of UAH 0.6bn
($22m) in April, up from a net loss of UAH 2.6bn ($98m) in March and cutting the 4M20 net loss to
UAH 1.7bn ($65m). Total assets inched up 0.1% y-o-y to UAH 150bn, while customer deposits
declined 1.9% y-o-y to UAH 83bn. (Bank)
Dragon view: The rebound in net profitability in April was fueled by a UAH 0.9bn
revaluation gain following a UAH 3.4bn revaluation loss in March (and UAH 4.3bn in 1Q20),
caused by a sharp 12% m-o-m hryvnia depreciation. Meanwhile, net interest income fell 60%
m-o-m and 79% y-o-y to UAH 25m, while net fee income dropped 24% m-o-m and 33% y-o-y
to UAH 55m, as the bank kept a number of its branches closed during the lockdown and
overall economic activity was subdued. But administrative expenses also declined, -27% and
-37% m-o-m to UAH 179m in April. The positive April result was also helped by a UAH 0.1bn
release of provisions (and UAH 0.5bn in 4M20).
The outlook for the rest of the year remains dependent on the economic fallout from the
coronavirus pandemic. While deposit outflows have thus far been much lighter than in the
previous crisis episodes of 2008 and 2014, the potential negative impact on asset quality is
likely to materialize in the coming months (on top of still high pre-2014 NPLs), though it
might be better than initially expected, as was the case with deposit dynamics in March-April.
Ukreximbank is also expected to be involved in state-sponsored lending programs intended
to spur the economy. Recently, the bank provided a UAH 5.8bn tranche out of UAH 19bn in
infrastructure financing for state road agency Ukravtodor (via purchase of the state-
guaranteed local bonds to be refinanced with NBU). Projects like this would support the
bank’s operating income during the downturn.
Andriy Bespyatov, [email protected]
Ukreximbank — Books net
profit in April
EXIMUK 16.5 21 AR5071923
EXIMUK 9.625 22 UV3117719
EXIMUK Float 23 UV3120846
EXIMUK 9.75 25 UV3121018
EXIMUK 9.95 29 ZQ5133629

The Dragon DAILY Page 5 June 9, 2020
FIXED INCOME: SOVEREIGN EUROBONDS
Ukrainian Eurobonds Bid 1) Ask 1) YTM (bid)1)
YTM (ask)1)
Price chg. (1d)2)
Mod. dur.2)
Spread Coupon (%)
Period Maturity
date Issued
($m)4)
Outstanding ($m)
Rating 5) (bp)3)
Ukraine 20 100.25 101.25 6.48% 2.12% 0.00 0.2 631 7.75% S/A 9/1/2020 1,780 1,365 Caa1u/B/B
Ukraine 21 102.75 103.50 5.39% 4.76% 0.00 1.1 518 7.75% S/A 9/1/2021 1,409 1,409 Caa1u/B/B
Ukraine 22 104.25 105.25 5.68% 5.21% 0.25 2.0 547 7.75% S/A 9/1/2022 1,384 1,384 Caa1u/B/B
Ukraine 23 105.50 106.50 5.85% 5.52% 0.50 2.8 557 7.75% S/A 9/1/2023 1,355 1,355 Caa1u/B/B
Ukraine 24 109.50 110.50 6.04% 5.75% 0.75 3.0 561 8.99% S/A 2/1/2024 750 750 -/B/B
Ukraine 24 106.25 107.25 6.05% 5.79% 0.75 3.5 562 7.75% S/A 9/1/2024 1,339 1,339 Caa1u/B/B
Ukraine 25 106.75 107.75 6.21% 6.00% 0.75 4.2 578 7.75% S/A 9/1/2025 1,329 1,329 Caa1u/B/B
Ukraine 26 107.75 108.75 6.23% 6.04% 0.75 4.9 579 7.75% S/A 9/1/2026 1,318 1,318 Caa1u/B/B
Ukraine 26 (EUR) 103.25 104.25 6.09% 5.89% 0.50 4.6 667 6.75% A 6/20/2026 1,000 1,000 -/B/B
Ukraine 27 107.00 108.00 6.52% 6.35% 0.50 5.4 565 7.75% S/A 9/1/2027 1,307 1,307 Caa1u/B/B
Ukraine 28 117.75 118.75 6.92% 6.78% 0.75 5.9 606 9.75% S/A 11/1/2028 1,600 1,600 -/B/B
Ukraine 30 (EUR) 89.50 90.50 5.83% 5.68% 0.00 7.4 615 4.375% A 1/27/2030 1,250 1,250 -/B/B
Ukraine 32 105.25 106.25 6.71% 6.59% 0.00 7.7 585 7.375% S/A 9/25/2032 3,000 3,000 -/B/B
GDP Warrants 93.00 95.00 - - 0.00 - - - A - 3,239 3,239 -
Notes: 1) estimated market price and YTM; 2) based on bid price; 3) spread to comparable UST, based on bid price; 4) notional amount for GDP warrants; 5) Moody’s/S&P/Fitch. Sources: Bloomberg, Dragon Capital
Ukrainian Eurobond Prices (Bid) Ukrainian Eurobond YTMs (Bid) Ukrainian Sovereign Yield Curves (Bid)
Source: Dragon Capital
CORPORATE AND MUNICIPAL EUROBONDS
Issue Bid 1) Ask 1) YTM (bid)1)
YTM (ask)1)
Price chg. 1d 2)
Mod. dur.2)
Spread (bp)2,3)
Coupon (%)
Coupon period
Maturity Issued ($m)
Outstanding ($m)
Rating 4)
CORPORATES
Avangard 18 5.00 10.00 - - 0.00 - - 10.00% S/A 10/29/2018 200 214 -/-/WD
DTEK 24 55.00 60.00 29.45% 26.49% 0.00 2.5 2,901 10.75% Q 12/31/2024 1,344 1,344 -/-/C
DTEK Renewables 24 (EUR) 82.00 87.00 14.60% 12.79% 2.00 3.2 1,522 8.50% S/A 11/12/2024 325 325 -/(P)B-/B
Interpipe 24 92.00 97.00 12.72% 11.14% 0.00 3.2 1,229 10.25% S/A 12/31/2024 309 211 -/-/-
Kernel Holding 22 103.50 105.50 6.46% 5.20% 0.50 1.5 624 8.75% S/A 1/31/2022 500 500 -/B/BB-
Kernel Holding 24 98.00 101.00 7.04% 6.22% 1.00 3.7 661 6.50% S/A 10/17/2024 300 300 -/B/BB-
Metinvest 23 95.50 97.50 9.58% 8.75% 1.50 2.4 930 7.75% S/A 4/23/2023 945 505 -/B *-/BB-
Metinvest 25 (EUR) 86.50 88.50 9.23% 8.67% 2.50 3.9 983 5.625% S/A 6/17/2025 300 300 -/B *-/BB-
Metinvest 26 93.00 95.00 10.11% 9.63% 2.00 4.4 967 8.50% S/A 4/23/2026 648 648 -/B *-/BB-
Metinvest 29 89.00 91.00 9.55% 9.21% 2.00 6.3 869 7.75% S/A 10/17/2029 500 500 -/B *-/BB-
MHP 24 102.50 104.50 7.01% 6.43% 0.50 3.3 657 7.75% S/A 5/10/2024 500 500 -/B/B+
MHP 26 100.50 102.50 6.84% 6.43% 0.50 4.7 641 6.95% S/A 4/3/2026 550 550 -/B/B+
MHP 29 93.50 95.50 7.22% 6.91% 0.50 6.7 636 6.25% S/A 9/19/2029 350 350 -/B/B+
Mriya Farming 25 2.00 6.00 - - 0.00 - - 2.00% Q 12/31/2025 208 99 -/-/-
Naftogaz 22 99.00 101.00 7.89% 6.85% 0.00 1.9 768 7.375% S/A 7/19/2022 335 335 -/-/B
Naftogaz 24 (EUR) 97.00 99.00 8.00% 7.41% 0.50 3.2 865 7.125% A 7/19/2024 600 600 -/-/B
Naftogaz 26 96.00 98.00 8.44% 8.03% 1.00 4.9 801 7.625% S/A 11/8/2026 500 500 -/-/B
Notes: 1) estimated prices and YTM; 2) based on bid price; 3) spread to comparable UST if OAS is unavailable; 4) Moody’s/S&P/Fitch. Sources: Bloomberg, Dragon Capital
70.0
80.0
90.0
100.0
110.0
120.0
9-Mar 26-Mar 14-Apr 1-May 20-May 8-Jun
Ukraine 2020 (7.75%)Ukraine 2027 (7.75%)
0.0%
5.0%
10.0%
15.0%
20.0%
25.0%
9-Mar 26-Mar 14-Apr 1-May 20-May 8-Jun
Ukraine 2020 (7.75%)
Ukraine 2027 (7.75%)
4.0%
6.0%
8.0%
10.0%
12.0%
0 1 2 3 4 5 6 7 8 9
Latest 1 month ago
3 months agoYTM (%)
Duration

The Dragon DAILY Page 6 June 9, 2020
CORPORATE AND MUNICIPAL EUROBONDS (CONT’D)
Issue Bid 1) Ask 1) YTM (bid)1)
YTM (ask)1)
Price chg. 1d 2)
Mod. dur.2)
Spread (bp)2,3)
Coupon (%)
Coupon period
Maturity Issued ($m)
Outstanding ($m)
Rating 4)
CORPORATES
Ukrainian Railway 21 100.50 102.50 9.14% 6.42% 0.50 0.7 893 9.875% S/A 9/15/2021 500 200 -/CCC/B *-
Ukrainian Railway 24 97.50 99.50 8.99% 8.39% 0.50 3.3 856 8.25% S/A 7/9/2024 595 595 -/-/B *-
Ukrlandfarming 18 5.00 10.00 - - 0.00 - - 10.875% S/A 3/26/2018 500 543 -/NR/WD
VF Ukraine 25 98.00 100.00 6.70% 6.20% 0.00 3.9 627 6.20% S/A 2/11/2025 500 497 -/B/B
BANKS
Oschadbank 23 101.50 103.50 8.25% 6.83% 0.00 1.3 804 9.375% S/A 3/10/2023 700 210 Caa1/-/B
Oschadbank 25 102.00 104.00 8.69% 7.79% 0.50 2.1 847 9.625% S/A 3/20/2025 500 250 Caa1/-/B
Privatbank 18 25.00 35.00 - - 0.00 - - 10.25% S/A 1/23/2018 200 160 WR/-/WD
Privatbank 18 25.00 35.00 - - 0.00 - - 10.875% S/A 2/28/2018 175 175 WR/-/WD
Privatbank 21 5.00 40.00 - - 0.00 - - 11.00% S/A 2/9/2021 220 220 -/-/-
Ukreximbank 21 (UAH) 100.00 103.00 17.05% 12.34% 0.00 0.6 580 16.50% S/A 3/2/2021 150 150 -/-/Bemr
Ukreximbank 22 101.50 103.50 8.18% 6.33% 0.00 1.0 797 9.625% S/A 4/27/2022 750 250 Caa1/-/B
Ukreximbank 23 95.00 100.00 11.67% 7.62% 0.00 0.2 926 8.75% 5) S/A 2/9/2023 125 63 Caa2/-/CCC *+
Ukreximbank 25 101.50 103.50 8.75% 7.48% 0.00 1.5 854 9.75% S/A 1/22/2025 600 600 Caa1/-/B
Ukreximbank 29 98.00 102.00 10.52% 9.38% 0.00 3.5 1,009 9.95% S/A 11/14/2029 100 100 -/-/-
MUNIS City of Kyiv 22 92.00 97.00 12.76% 9.40% 0.00 1.5 1,255 7.50% S/A 12/15/2022 115 115 -/-/B
Notes: 1) estimated prices and YTM; 2) based on bid price; 3) spread to comparable UST if OAS is unavailable; 4) Moody’s/S&P/Fitch; 5) floating rate at 6M USD Libor + 7%. Sources: Bloomberg, Dragon Capital
TREASURIES: PRIMARY AUCTIONS
Latest primary T-Bill auctions ISIN Maturity W. avg. yield Vol. placed (UAH m)1) Vol. placed ($ m)1) Vol. placed (€ m)1)
June 2, 2020 UA4000209381 May-19, 21 10.86% 1,429
June 2, 2020 UA4000209373 Feb-24, 21 10.89% 700
June 2, 2020 UA4000209225 Nov-25, 20 10.11% 500
June 2, 2020 UA4000198873 Aug-19, 20 9.84% 500
May 26, 2020 UA4000209381 May-19, 21 10.97% 348
Note: 1) placement volume at nominal value and in respective issuance currency (UAH, USD or EUR). Source: Finance Ministry
SECONDARY MARKET BENCHMARKS
ISIN Maturity Duration Latest price (bid/ask)1)
YTM 2)
Latest 1 week ago 1 month ago 3 months ago
REGULAR BONDS
12M UA4000203723 24-Mar-21 0.71 104.6/106.3 12.0%/9.8% 12.5%/10.0% 13.5%/11.0% 18.0%/15.0%
2Y UA4000204002 11-May-22 1.61 109/111.1 12.0%/10.8% 12.8%/11.5% 14.5%/12.0% 18.0%/15.0%
5Y UA4000204150 26-Feb-25 3.26 115/119.7 12.0%/10.8% 12.8%/11.5% 14.5%/12.0% 18.0%/15.0%
USD-DENOMINATED UA4000204069 3-Jun-21 - - - - - 5.0%/2.0%
Notes: 1) market prices net of accrued coupon, % of par; 2) effective yield based on bid/ask prices. Sources: Finance Ministry, Dragon Capital
Gov’t Bond Redemption Schedule (UAH m)
Treasury Historical YTMs (secondary market)
Treasury Yield Curves (secondary market)
Sources: Finance Ministry, Dragon Capital
0
5,000
10,000
15,000
20,000
10-Ju
n, 2
018
-Jun,
20
08-Ju
l, 20
09-Ju
l, 20
22-Ju
l, 20
29-Ju
l, 20
05-Au
g, 2
006
-Aug,
20
13-Au
g, 2
019
-Aug,
20
20-Au
g, 2
023
-Sep,
20
30-Se
p, 2
015
-Oct,
20
21-O
ct, 2
018
-Nov
, 20
19-N
ov, 2
0
10.0%
15.0%
20.0%
25.0%
30.0%
17-Jan 14-Feb 13-Mar 10-Apr 8-May 5-Jun
12M
2Y
5Y
10.0%
12.0%
14.0%
16.0%
18.0%
12M 2Y 5Y
Latest 1 week ago 1 month ago
The Dragon DAILY Page 7 June 9, 2020
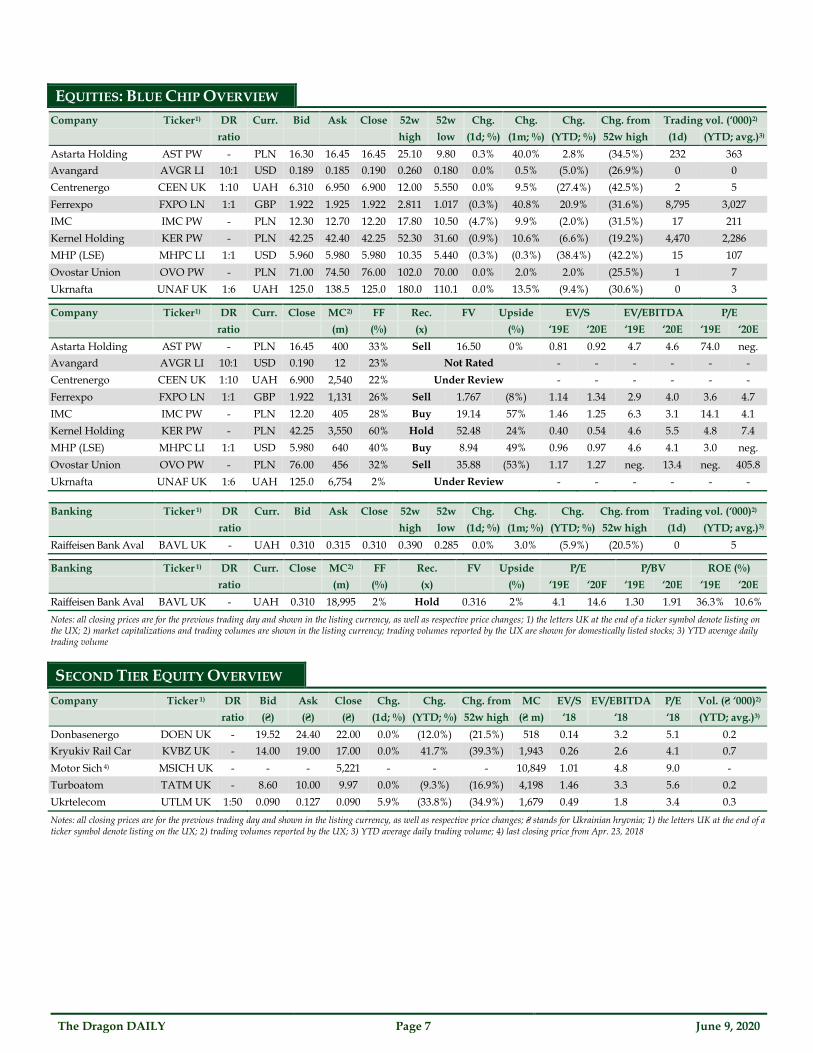
EQUITIES: BLUE CHIP OVERVIEW
Company Ticker 1) DR Curr. Bid Ask Close 52w 52w Chg. Chg. Chg. Chg. from Trading vol. (‘000)2)
ratio high low (1d; %) (1m; %) (YTD; %) 52w high (1d) (YTD; avg.)3)
Astarta Holding AST PW - PLN 16.30 16.45 16.45 25.10 9.80 0.3% 40.0% 2.8% (34.5%) 232 363
Avangard AVGR LI 10:1 USD 0.189 0.185 0.190 0.260 0.180 0.0% 0.5% (5.0%) (26.9%) 0 0
Centrenergo CEEN UK 1:10 UAH 6.310 6.950 6.900 12.00 5.550 0.0% 9.5% (27.4%) (42.5%) 2 5
Ferrexpo FXPO LN 1:1 GBP 1.922 1.925 1.922 2.811 1.017 (0.3%) 40.8% 20.9% (31.6%) 8,795 3,027
IMC IMC PW - PLN 12.30 12.70 12.20 17.80 10.50 (4.7%) 9.9% (2.0%) (31.5%) 17 211
Kernel Holding KER PW - PLN 42.25 42.40 42.25 52.30 31.60 (0.9%) 10.6% (6.6%) (19.2%) 4,470 2,286
MHP (LSE) MHPC LI 1:1 USD 5.960 5.980 5.980 10.35 5.440 (0.3%) (0.3%) (38.4%) (42.2%) 15 107
Ovostar Union OVO PW - PLN 71.00 74.50 76.00 102.0 70.00 0.0% 2.0% 2.0% (25.5%) 1 7
Ukrnafta UNAF UK 1:6 UAH 125.0 138.5 125.0 180.0 110.1 0.0% 13.5% (9.4%) (30.6%) 0 3
Company Ticker 1) DR Curr. Close MC 2) FF Rec. FV Upside EV/S EV/EBITDA P/E
ratio (m) (%) (x) (%) ‘19E ‘20E ‘19E ‘20E ‘19E ‘20E
Astarta Holding AST PW - PLN 16.45 400 33% Sell 16.50 0% 0.81 0.92 4.7 4.6 74.0 neg.
Avangard AVGR LI 10:1 USD 0.190 12 23% Not Rated - - - - - -
Centrenergo CEEN UK 1:10 UAH 6.900 2,540 22% Under Review - - - - - -
Ferrexpo FXPO LN 1:1 GBP 1.922 1,131 26% Sell 1.767 (8%) 1.14 1.34 2.9 4.0 3.6 4.7
IMC IMC PW - PLN 12.20 405 28% Buy 19.14 57% 1.46 1.25 6.3 3.1 14.1 4.1
Kernel Holding KER PW - PLN 42.25 3,550 60% Hold 52.48 24% 0.40 0.54 4.6 5.5 4.8 7.4
MHP (LSE) MHPC LI 1:1 USD 5.980 640 40% Buy 8.94 49% 0.96 0.97 4.6 4.1 3.0 neg.
Ovostar Union OVO PW - PLN 76.00 456 32% Sell 35.88 (53%) 1.17 1.27 neg. 13.4 neg. 405.8
Ukrnafta UNAF UK 1:6 UAH 125.0 6,754 2% Under Review - - - - - -
Banking Ticker 1) DR Curr. Bid Ask Close 52w 52w Chg. Chg. Chg. Chg. from Trading vol. (‘000)2)
ratio high low (1d; %) (1m; %) (YTD; %) 52w high (1d) (YTD; avg.)3)
Raiffeisen Bank Aval BAVL UK - UAH 0.310 0.315 0.310 0.390 0.285 0.0% 3.0% (5.9%) (20.5%) 0 5
Banking Ticker 1) DR Curr. Close MC 2) FF Rec. FV Upside P/E P/BV ROE (%)
ratio (m) (%) (x) (%) ‘19E ‘20F ‘19E ‘20E ‘19E ‘20E
Raiffeisen Bank Aval BAVL UK - UAH 0.310 18,995 2% Hold 0.316 2% 4.1 14.6 1.30 1.91 36.3% 10.6%
Notes: all closing prices are for the previous trading day and shown in the listing currency, as well as respective price changes; 1) the letters UK at the end of a ticker symbol denote listing on the UX; 2) market capitalizations and trading volumes are shown in the listing currency; trading volumes reported by the UX are shown for domestically listed stocks; 3) YTD average daily trading volume
SECOND TIER EQUITY OVERVIEW
Company Ticker 1) DR Bid Ask Close Chg. Chg. Chg. from MC EV/S EV/EBITDA P/E Vol. (₴ ‘000)2)
ratio (₴) (₴) (₴) (1d; %) (YTD; %) 52w high (₴ m) ‘18 ‘18 ‘18 (YTD; avg.)3)
Donbasenergo DOEN UK - 19.52 24.40 22.00 0.0% (12.0%) (21.5%) 518 0.14 3.2 5.1 0.2
Kryukiv Rail Car KVBZ UK - 14.00 19.00 17.00 0.0% 41.7% (39.3%) 1,943 0.26 2.6 4.1 0.7
Motor Sich 4) MSICH UK - - - 5,221 - - - 10,849 1.01 4.8 9.0 -
Turboatom TATM UK - 8.60 10.00 9.97 0.0% (9.3%) (16.9%) 4,198 1.46 3.3 5.6 0.2
Ukrtelecom UTLM UK 1:50 0.090 0.127 0.090 5.9% (33.8%) (34.9%) 1,679 0.49 1.8 3.4 0.3
Notes: all closing prices are for the previous trading day and shown in the listing currency, as well as respective price changes; ₴ stands for Ukrainian hryvnia; 1) the letters UK at the end of a ticker symbol denote listing on the UX; 2) trading volumes reported by the UX; 3) YTD average daily trading volume; 4) last closing price from Apr. 23, 2018

The Dragon DAILY Page 8 June 9, 2020
FOREIGN EXCHANGES
Company Ticker Curr. Close Chg. Chg. MC 1) FF Vol.1,2) Rec. FV Upside EV/EBITDA P/E
(1d; %) (YTD; %) (m) (%) (1d; ‘000) (x) (%) ‘19E ‘20E ‘19E ‘20E
AgroGeneration ALAGR FP EUR 0.107 (0.9%) 83.6% 10 37% 27 Not Rated - - - -
Agroton AGT PW PLN 3.600 (3.2%) (2.7%) 78 49% 73 Not Rated - - - -
Astarta Holding AST PW PLN 16.45 0.3% 2.8% 400 33% 232 Sell 16.50 0% 4.7 4.6 74.0 neg.
Avangard AVGR LI USD 0.190 0.0% (5.0%) 12 23% 0 Not Rated - - - -
DUPD DUPD LN GBP 0.109 0.0% 1.4% 12 53% 0 Not Rated - - - -
Enwell Energy ENW LN GBP 0.158 3.6% (24.8%) 51 61% 26 Not Rated - - - -
Ferrexpo FXPO LN GBP 1.922 (0.3%) 20.9% 1,131 26% 8,795 Sell 1.767 (8%) 2.9 4.0 3.6 4.7
IMC IMC PW PLN 12.20 (4.7%) (2.0%) 405 28% 17 Buy 19.14 57% 6.3 3.1 14.1 4.1
JKX Oil & Gas JKX LN GBP 0.200 (1.0%) (18.4%) 33 22% 241 Not Rated - - - -
Kernel Holding KER PW PLN 42.25 (0.9%) (6.6%) 3,550 60% 4,470 Hold 52.48 24% 4.6 5.5 4.8 7.4
KSG Agro KSG PW PLN 1.250 0.0% 6.8% 19 35% 8 Not Rated - - - -
MHP (LSE) MHPC LI USD 5.980 (0.3%) (38.4%) 640 40% 15 Buy 8.94 49% 4.6 4.1 3.0 neg.
Milkiland MLK PW PLN 0.470 2.2% 6.8% 15 21% 2 Not Rated - - - -
Ovostar Union OVO PW PLN 76.00 0.0% 2.0% 456 32% 1 Sell 35.88 (53%) neg. 13.4 neg. 405.8
Ukrproduct UKR LN GBP 0.057 1.3% 91.5% 2 28% 0 Not Rated - - - -
Notes: all closing prices are for the previous trading day; 1) market capitalization and trading volumes are shown in the listing currency; 2) companies whose trading volumes are marked as OTC are traded mostly over-the-counter and their exchange turnover is insignificant
UKRAINIAN STOCK PERFORMANCE
Performance of KP-Dragon Index Stocks (1-month)
Note: all stocks valued in USD. Source: Dragon Capital
Performance of KP-Dragon Index Stocks (YTD) Note: all stocks valued in USD. Source: Dragon Capitals
50.3%
44.7%
19.5%
18.7%
18.0%
14.5%
9.5%
7.1%
(0.3%)
(0.7%)
(10%) 0% 10% 20% 30% 40% 50% 60%
Astarta Holding
Ferrexpo
KP-Dragon
Kernel Holding
IMC
Ukrnafta
Ovostar Union
Centrenergo
MHP
Raiffeisen Bank Aval
20.9%
2.8%
2.0%
(2.0%)
(6.6%)
(11.3%)
(17.9%)
(21.0%)
(36.6%)
(38.4%)
(50%) (40%) (30%) (20%) (10%) 0% 10% 20% 30%
Ferrexpo
Astarta Holding
Ovostar Union
IMC
Kernel Holding
KP-Dragon
Raiffeisen Bank Aval
Ukrnafta
Centrenergo
MHP

The Dragon DAILY Page 9 June 9, 2020
STOCK INDEX COMPARISON
Index Country Close Chg. (1d; %) Chg. (1w; %) Chg. (1m; %) Chg. (YTD; %)
KP-Dragon Ukraine 1,506.7 (0.8%) 1.8% 19.5% (11.3%)
UX Ukraine 1,352.4 0.0% (1.1%) 5.6% (10.9%)
MSCI Ukraine 28.2 (0.8%) 0.8% 12.3% (21.2%)
IBOV Brazil 97,645 5.2% 22.1% 43.5% (30.4%)
SOFIX Bulgaria 466 (0.3%) 2.5% 8.1% (17.4%)
SHCOMP China 2,938 0.4% 1.6% 1.5% (5.2%)
CROBEX Croatia 1,661 0.3% 3.4% 12.0% (18.3%)
PX Czech Republic 963 0.5% 8.2% 16.8% (16.9%)
EURO STOXX 50 EU 3,366 (0.5%) 11.0% 20.5% (9.6%)
BUX Hungary 38,198 0.5% 9.4% 16.1% (19.7%)
BSE SENSEX 30 India 34,371 0.4% 3.4% 8.7% (21.3%)
NIKKEI 225 Japan 23,178 2.8% 4.4% 13.1% (1.5%)
WIG-20 Poland 1,841 0.0% 7.1% 22.5% (17.2%)
BET-10 Romania 8,849 0.0% 3.6% 9.7% (11.7%)
RTS Russia 1,289 0.2% 3.3% 13.4% (16.8%)
ISE National-100 Turkey 109,637 (0.4%) 2.5% 17.3% (16.0%)
FTSE 100 UK 6,473 (0.0%) 6.9% 12.1% (17.8%)
S&P 500 USA 3,232 1.2% 5.8% 10.3% 0.0%
MSCI FM
485.7 1.3% 2.5% 7.5% (17.1%)
MSCI FM CEE CIS 403.2 0.1% 5.6% 14.0% (10.8%)
MSCI EMEA
215.9 0.4% 5.2% 13.7% (19.3%)
WIG CEE 1,160.4 1.4% 6.2% 14.3% (3.5%)
Notes: all percent changes are in USD terms except for the UX, which are UAH-based. Sources: UX, Bloomberg, Dragon Capital
COMMODITIES
Commodity Description Price Chg. Chg. Chg. Chg. Chg.
($) (1d; %) (1w; %) (1m; %) (YTD; %) (52w; %)
Wheat ($/t) UkrAgroConsult (3rd grade; FOB)* 222.0 - 0.0% (1.8%) 3.3% 7.8%
CBOT (futures) 187.9 (0.7%) (0.7%) (3.4%) (8.5%) 1.4%
Corn ($/t)
UkrAgroConsult (feed grain)* 197.0 - 0.0% 1.6% 13.3% 16.0%
CBOT (futures) 131.4 0.8% 3.2% 4.6% (13.9%) (19.7%)
UkrAgroConsult (feed grain, FOB)* 180.0 - 0.0% 4.7% 2.3% 0.0%
Sunflower oil ($/t) UkrAgroConsult (spot)* 700.0 - 0.0% 4.8% 1.4% 9.8%
Sugar ($/t)
LIFFE white sugar (futures) 387.3 (1.4%) 6.2% 11.3% 7.8% 14.7%
NYBOT raw cane sugar (futures) 263.3 (0.7%) 8.5% 16.0% (11.0%) (4.5%)
APK Inform (spot)* 356.4 - 0.0% 4.7% (2.4%) (9.2%)
Gas ($/tcm) Germany NCG natural gas (1-m forward) 62.28 (9.4%) 33.1% (12.7%) (56.6%) (56.4%)
Crude oil ($/bbl) ICE Brent Futures 40.80 (3.5%) 6.5% 31.7% (38.2%) (35.5%)
Hot rolled steel ($/t) Steel CIS export price (spot)* 391.3 - 6.5% 11.0% (15.4%) (19.3%)
Iron ore ($/t) Iron ore fines (CFR China; spot) 105.67 4.9% 5.2% 19.3% 14.7% 5.0%
Thermal coal ($/t) ARA steam coal (CIF; 1-m forward) 47.80 0.2% 8.6% 8.0% (11.2%) (11.3%)
Notes: *updated weekly
Ukrainian oil ($/bbl) April 7 Chg. prev.
(%) Chg.
(YTD; %) 52-w high 52-w low Brent
Prem./(Disc.) to Brent
Latest auction $21.7 (65.7%) (65.7%) $67.5 $21.7 $31.9 (31.8%)
Sources: Bloomberg, Dragon Capital

The Dragon DAILY Page 10 June 9, 2020
MONEY MARKETS
3-m 6-m 12-m
LIBOR ($) 0.313% 0.481% 0.634%
Exchange rates Latest Chg.
(1d; %) Chg.
(YTD; %)
Market (UAH:USD) 26.6000 0.0% (10.6%)
Official (UAH:USD) 26.6005 0.4% (11.0%)
Market (UAH:EUR)1) 30.0341 0.0% (11.1%)
Official (UAH:EUR) 30.1477 (0.5%) (12.4%)
Interest rates 2) Bid Ask Chg.
(YTD; %)2) YTD low 2) YTD high 2)
Overnight 5.75% 7.50% (5.38%) 5.50% 12.50%
1 week 5.88% 8.75% (5.79%) 5.67% 12.50%
2 weeks 7.17% 9.83% (5.33%) 6.63% 13.50%
1 month 8.33% 11.67% (4.50%) 7.50% 14.00%
UAH:USD Exchange Rate
UAH:USD Non-Deliverable Forwards
UAH:EUR Exchange Rate
Interbank Interest Rate Development Notes: 1) UAH:EUR market rate is based on UAH:USD market rate and USD:EUR cross rate; 2) KIEIBOR; YTD absolute change in bid yield, YTD bid low and YTD bid high. Sources: NBU, Bloomberg, Dragon Capital
MACROECONOMIC INDICATORS
Year 2016 2017 2018 2019 2020E 2021F
Real GDP Growth (y-o-y; %) 2.4% 2.5% 3.4% 3.2% (7.2%) 4.3%
Nominal GDP ($bn) 93 112 131 154 138 145
Real Industrial Growth (y-o-y; %) 4.0% 1.1% 3.0% (0.5%) (7.5%) 4.7%
Consumer Price Index (e-o-p; %) 12.4% 13.7% 9.8% 4.1% 4.4% 5.7%
Combined Fiscal Balance* (% of GDP) (2.3%) (2.4%) (2.2%) (2.2%) (7.6%) (4.0%)
Total Public Debt (% of GDP) 80.9% 71.8% 60.9% 50.3% 67.2% 66.1%
NBU Gross Reserves ($bn) 15.5 18.8 20.8 25.3 28.0 29.5
C/A Balance (% of GDP) (1.4%) (2.2%) (3.3%) (0.9%) 1.0% (1.4%)
UAH:USD (official; e-o-p) 27.19 28.07 27.69 23.69 28.00 29.50
UAH:USD (official; e-o-p; y-o-y %) (11.7%) (3.1%) 1.4% 16.9% (15.4%) (5.1%)
UAH:USD (official; average) 25.55 26.59 27.20 25.80 26.80 28.50
UAH:USD (official; average; y-o-y %) (14.5%) (3.9%) (2.2%) 5.4% (3.7%) (6.0%)
Note: *the combined fiscal balance includes balances of the general government (central budget, local budgets and Pension Fund) and (2009 onwards) Naftogaz Ukrainy but excludes bank recapitalization costs. Sources: State Statistics Committee, Finance Ministry, NBU, Dragon Capital estimates and forecasts
24.0
25.0
26.0
27.0
28.0
29.09-Mar 26-Mar 14-Apr 1-May 20-May 8-Jun
UAH:$ (official)
UAH:$ (market)
23.0
25.0
27.0
29.0
31.0
33.0
1M 3M 6M 9M 12M
Latest 1 month ago
3 months ago 6 months ago
26.0
27.0
28.0
29.0
30.0
31.0
32.09-Mar 26-Mar 14-Apr 1-May 20-May 8-Jun
UAH:EUR (official)
UAH:EUR (market)
5.0%
6.0%
7.0%
8.0%
9.0%
10.0%
11.0%
12.0%
6-Mar 25-Mar 13-Apr 30-Apr 20-May 8-Jun
O/N 1w 1m

The Dragon DAILY Page 11 June 9, 2020
CALENDAR OF EVENTS
Date Company/Sector Event
June 9 Economy Inflation for May
June 9 Economy Loans and deposits as of end-May
June 11 Economy NBU discount rate review
June 17 Economy Agriculture for May and 5M20
June 19 Economy GDP (revised) and sector breakdown for 1Q20
June 22 Economy MPC minutes
June 22 Economy Retail trade for May and 5M20
June 22 Economy Transportation for 5M20
June 23 Economy Industrial production for May and 5M20
June 25-30 Economy Budget data for 5M20
June 25-30 Economy Public debt as of end-May
Sources: Companies, Dragon Capital
RECENT RESEARCH REPORTS
Date Company/Market Title
June 1 Ukraine Strategy Weekly Domestic Mood Remains Positive
June 1 Ukrainian Bonds Weekly Overview
May 28 Ukraine Macro Outlook Exiting Lockdown Cautiously Positive
May 25 Ukraine Strategy Weekly Watching Stage 2 of Lockdown Exit; Neutral on Equities
May 25 Ukrainian Bonds Weekly Overview
May 19 Ukreximbank Update Following 2019 Results
May 18 Ukraine Strategy Weekly Waiting for IMF funding; Positive Outlook on Equities
May 18 Ukrainian Bonds Weekly Overview
May 12 Ukrainian Bonds Weekly Overview
May 6 Ukraine Food & Agriculture 2020 Grain Harvest Update (field trip notes)
The Dragon DAILY Page 12 June 9, 2020
Dragon Capital Investments 36D Saksahanskoho
01 033 Kyiv, Ukraine Tel.: +380 44 490 7120 Fax: +380-44 490 7121
Dragon Capital (Cyprus) Limited 16 louniou 1943, building No. 9
2nd floor, office 202 Limassol 3022, Cyprus
Tel: +357 25 376 300, Fax: +357 25 376 301
DISCLAIMER: This report has been prepared by Dragon Capital for information purposes only and is not an offer or solicitation to deal in any security. The opinions, forecasts and estimates in this report reflect our good-faith judgment as of the date of publication, and may change without notice. Although the information in this report comes from sources we believe to be reliable, and although we have made every effort to ensure its accuracy at the time of publication, we make no warranty, express or implied, of this report's usefulness in predicting the future performance, or in estimating the current or future value, of any security. Nor should this report be regarded as a complete description of the securities or markets referred to herein. Any opinions expressed herein may differ from opinions on the same subject expressed by other business departments of Dragon Capital as a result of employing different assumptions or methodology. Any investment decision made on the basis of this report shall be made at the investor's sole discretion, and under no circumstances shall Dragon Capital or any of its employees or related parties be liable in any way for any action, or failure to act, by any party, on the basis of this report. Nor shall Dragon Capital or any of its employees or related parties be liable in any way for any loss or damages arising from such action or failure to act. Dragon Capital does and seeks to do business with companies covered in its research reports. Investors should therefore be aware of a potential conflict of interest. Additional information on securities or companies discussed in this report is available upon request. This report, or any part of it, may not be reproduced without the prior written permission of Dragon Capital; when quoting, referencing Dragon Capital is required. This report is intended for distribution in the United States solely to “major U.S. institutional investors”, as defined in Rule 15a-6 under the U.S. Securities Exchange Act of 1934, and may not be furnished to any other person in the United States. Each major U.S. institutional investor that receives a copy of this research report by its acceptance hereof represents and agrees that it shall not distribute or provide this research report to any other person. Any U.S. person receiving this report that desires to effect transactions in any security discussed in this report should effect transactions through Auerbach Grayson & Company Inc. Auerbach Grayson & Company Inc. is a U.S. broker dealer and is a member of the FINRA. Otherwise, by accepting this report, the U.S. person confirms that it will not trade in securities discussed in the report, will not recommend any other person to invest into such securities and will not distribute the report to any other person. This report is distributed in the U.S. solely to “major institutional investors” as defined in Rule 15a-6 of the U.S. Securities Exchange Act of 1934. Each U.S. recipient by its acceptance hereof warrants that it is a “major institutional investor” and understands the risks involved in dealing in securities or any financial instrument and shall not distribute nor provide this document, or any part thereof, to any other person.
Auerbach Grayson & Company Inc.,
25 West 45th Street, Floor 16, New York, NY 10036
Telephone: 212-557-4444, 800-31-WORLD
Fax: 212-557-9066
This report has been prepared by the correspondent of Auerbach Grayson & Company Incorporated named above on the date listed above. We are distributing this report in the U.S. and accept responsibility for its content subject to the terms as set within the report. Any U.S. person receiving this report and wishing to effect transactions in any security discussed herein should do so only with a representative of Auerbach Grayson & Company Incorporated. Additional information on securities or companies discussed herein is available on request.