The Downstream Economic Impacts of Palm Oil...
29
- 1 - The Downstream Economic Impacts of Palm Oil Exports May 2016
-
Upload
truongthien -
Category
Documents
-
view
212 -
download
0
Transcript of The Downstream Economic Impacts of Palm Oil...

- 1 -
The Downstream Economic
Impacts of Palm Oil Exports
May 2016

Europe Economics is registered in England No. 3477100. Registered offices at Chancery House, 53-64 Chancery Lane, London WC2A 1QU.
Whilst every effort has been made to ensure the accuracy of the information/material contained in this report, Europe Economics assumes no
responsibility for and gives no guarantees, undertakings or warranties concerning the accuracy, completeness or up to date nature of the
information/analysis provided in the report and does not accept any liability whatsoever arising from any errors or omissions.
© Europe Economics. All rights reserved. Except for the quotation of short passages for the purpose of criticism or review, no part may be used or
reproduced without permission.

Contents
1 Executive Summary ....................................................................................................................................................... 1
2 Introduction .................................................................................................................................................................... 4
3 The Palm Oil Supply Chain ......................................................................................................................................... 6
3.1 Refineries and processors ................................................................................................................................... 8
3.2 Food manufacturers ............................................................................................................................................. 8
3.3 Feed manufacturers .............................................................................................................................................. 8
3.4 Other product manufacturers ........................................................................................................................... 8
3.5 Electricity generators ........................................................................................................................................... 9
3.6 Biodiesel makers ................................................................................................................................................... 9
3.7 Freight transportation providers....................................................................................................................... 9
3.8 Wholesalers and retailers ................................................................................................................................. 10
3.9 Legal, financial and other service providers.................................................................................................. 10
4 Analysing the Impact of Traded Palm Oil .............................................................................................................. 11
4.1 Input-Output analysis ......................................................................................................................................... 12
4.2 Application to palm oil ...................................................................................................................................... 13
5 Results ............................................................................................................................................................................ 15
5.1 Overall results ..................................................................................................................................................... 15
5.2 Sector breakdown .............................................................................................................................................. 19
6 Conclusions .................................................................................................................................................................. 20
Appendix A: Input-Output Analysis .................................................................................................................................. 22
Background ................................................................................................................................................................... 22
Change in final demand .............................................................................................................................................. 23
Change in supply ......................................................................................................................................................... 23
Direct, indirect and induced effects ....................................................................................................................... 24
Estimating policy relevant multipliers ..................................................................................................................... 24
Sources of data ............................................................................................................................................................ 25


Executive Summary
- 1 -
1 Executive Summary
Palm oil plays an important role in the global economy. While its impacts on exporting countries are
obvious, the scale and importance to importing countries are often neglected. In 2013-2014, global imports
of palm oil (mostly from Malaysia and Indonesia) amounted to over 52m tonnes. Europe Economics was
asked by the Malaysian Palm Oil Council to study the scale and the importance of the downstream
industries associated with palm oil imports.
Palm oil is part of a complex supply chain due to its diverse usage, from edible oil to cleaning products to
biodiesel. It is used by both large multinational companies such as Wilmar and IOI and small SMEs in a
broad range of sectors. The top importing countries in 2013-2014 are India, China, the Netherlands,
Germany and the United States. Together, they account for 46 per cent of the total palm oil imports by
value in 2013-2014.
Our key findings are that palm oil imports made a substantial contribution to the world economy, based on
2013-2014 figure, including:
The around $44bn of traded palm oil was associated with an indirect contribution to value added in
downstream industries of nearly $17bn; or an indirect and induced contribution to GDP of nearly
$39bn. The total is equivalent to the GDP of Kuala Lumpur.
Palm oil is associated with 1.9m jobs in downstream industries and 2.9m jobs including the impact of a
resulting rise in demand. The total is just less than twice the population of Kuala Lumpur.
We observe large impacts in larger economies. China ranked the highest in terms of the indirect and
induced contribution to GDP and India ranked the highest in terms of the indirect and induced contribution
to employment. This reflects that: a) most value added comes in the manufacture of final food products and
their distribution to final consumers; and b) money earned by workers and investors is more likely to be
spent on goods and services made in the same country. In addition, employment impacts vary substantially
depending on the labour intensity of economic activities.
The sectors where the contribution to GDP was the largest relate to the production of food. However
there are also significant contributions to the wider agriculture sector. Other sectors involved in the supply
chain such as hotels and restaurants sector also see significant additional activity.
While this report does not address the question of what might happen if palm oil imports were to be
restricted thanks to some policy change or other exogenous shock, it does establish the importance of the
product in the world economy. As an affordable and available primary input for a wide range of industries
palm oil is associated with substantial downstream economic activity in many countries around the world.
The results reinforce the conclusion that imports of palm oil are important, on an at least somewhat similar
scale, to the importer as well as the exporter.
The different estimates are given in full in Table 1.1.

Executive Summary
- 2 -
Table 1.1: Indirect and induced contribution of traded palm oil, 2013-14
Total
imports, $m
Indirect impact
on value added,
$m
Indirect impact on
employment, 000s
Indirect and
induced impact
on GDP, $m
Indirect and
induced impact on
employment, 000s
AUS 116 82 1 280 2
AUT 0 35 1 60 1
BEL 151 92 1 109 1
BGR 27 12 2 15 2
BRA 449 168 13 957 45
CAN 81 94 1 262 3
CHN 6,826 4,173 681 7,265 929
CYP 1 2 0 4 0
CZE 27 28 1 38 1
DEU 1,553 581 10 1,220 17
DNK 105 55 1 97 1
ESP 647 249 4 789 11
EST 0 2 0 2 0
FIN 0 20 0 50 1
FRA 167 143 2 443 5
GBR 555 289 5 929 12
GRC 97 31 1 123 2
HUN 2 15 1 17 1
IDN 73 106 17 209 29
IND 7,514 1,406 780 2,836 1,134
IRL 82 49 1 52 1
ITA 1,113 401 7 1,533 18
JPN 671 570 8 2,911 38
KOR 519 265 11 415 14
LTU 0 3 0 3 0
LUX 0 5 0 3 0
LVA 0 3 0 4 0
MEX 539 197 15 486 26
MLT 0 1 0 1 0
NLD 2,701 476 5 568 6
POL 76 70 4 139 6
PRT 24 25 1 75 2
ROU 18 24 3 55 4
RUS 656 257 30 564 41
SVK 0 8 0 9 0
SVN 0 4 0 6 0
SWE 120 76 1 149 1
TUR 643 226 12 560 22
TWN 190 46 2 61 2
USA 1,611 1,209 14 6,599 62
RoW 16,688 5,081 298 8,922 411
Total 44,043 16,576 1,932 38,821 2,852
EU 7,468 2,697 49 6,494 94

Executive Summary
- 3 -

Introduction
- 4 -
2 Introduction
The importance of trade in palm oil to the economies in which it is produced has been the subject of
considerable study. Global imports of palm oil (mostly from Malaysia and Indonesia) amounted to over 52m
tonnes at a market value we estimate at over $44bn.1 According to the WWF, in 2010-2011, India was the
largest importer of palm oil, using 7m tonnes, which was equivalent to 14 per cent of the world’s palm oil.
China was the second largest importer, using 6m tonnes, equivalent to 12 per cent of the world’s total.2 By
2013, EU, India and China accounted for almost 60 per cent of worldwide imports.3 The sector is a major
employer. In Malaysia around 491,000 were estimated to work on the oil palm plantations in 2012, both
Malaysians and many migrant workers.
There are a number of major firms. The largest is Sime Darby, which has been estimated to account for
around 5 per cent of global crude palm oil output. There are also a large number of smallholders, around
300,000, who are estimated to account for 39 per cent of Malaysia’s total production. Some of the
multinational big companies are vertically integrated, which means their businesses covers multiple parts of
the palm oil supply chain mentioned below. For instance, Wilmar and IOI are not only own plantation but
produce oleochemicals.
Palm oil is used in the production of a wide range of goods and services from food products like crisps and
biscuits to household goods, such as washing powder, to health and beauty products. It is used as a source
of energy (in the production of biodiesel or in electricity generation). A wide range of firms are involved
from those transporting the palm oil; to refiners and other processors; to manufacturers producing goods
for consumption; to the supermarkets and other retailers who sell those final goods.
Palm oil offers two obvious qualities as a raw material: it is affordable and it is available. Global production
of palm oil has increased considerably more than the production of other oils and fats. World exports
almost quadrupled from 1997-98 to 2012-13, whereas exports of other major oils and fats only increased
by around fifty per cent over the same period. Proponents also claim that the oil has phyto-chemical
properties which make it particularly suitable for food preparation.
The immediate production of raw palm oil is only likely to be a small part of its total economic impact.
Most of the value added in the complex supply chains by which palm oil is used to satisfy the final consumer
will occur in the manufacturing of products, their distribution to those consumers and the delivery of
services using those products. This is the case for many raw materials, but the diffuse downstream impacts
are rarely well-understood.
In order to improve the understanding of the role of traded palm oil, the Malaysian Palm Oil Council asked
Europe Economics to study the scale and importance of the downstream industries associated with palm oil
imports. This study therefore addresses the question: what is the contribution of the use of palm oil to
GDP and employment in the countries to which it is imported? And what further contributions to GDP and
employment might be expected to result from the factors of production in those industries spending the
incomes derived from that economic activity?
1 ISTA Mielke GmbH, Oil world, (Jan-Dec 2013). 2 WWF 3 Duncan Brack, Adelaide Glover and Laura Wellesley Energy, Environment and Resources (Jan 2016) – Agricultural
Commodity Supply Chains Trade, Consumption and Deforestation
https://www.chathamhouse.org/sites/files/chathamhouse/publications/research/2016-01-28-agricultural-commodities-
brack-glover-wellesley.pdf

Introduction
- 5 -
Impacts included or excluded are set out in Figure 2.1. The purple boxes indicate activity largely occurring
in the producing countries; pink boxes indicate activity largely occurring in the importing countries; and
grey boxes indicate activity where there is no direct data on the location. The shaded boxes indicate
activity which is included in our results.
It is important to note that our results are not intended to capture what might happen in the absence of
palm oil or in the event that its use was restricted in some way. That would depend on the extent to which
those industries were able to use other inputs and the extent to which they had to pay higher prices in
order to do so, and would require further research.
Understanding the forward linkages of the industry is instead an invaluable first step in understanding the
wider significance of palm oil imports. It illustrates the scale of the industrial activity at stake. In an earlier
report, Europe Economics studied those economic impacts in the EU and its Member States. In this report,
using new sources and an updated method, we extend that analysis to all of the major world economies.
Figure 2.1: The palm oil supply chain and the scope of the study

The Palm Oil Supply Chain
- 6 -
3 The Palm Oil Supply Chain
It is first important to note that while we will generally refer to palm oil as shorthand in this report. The
sector actually exports three commodities produced as part of the same agricultural process:
Palm oil. This is the oil produced by the pressing of the fruit of the oil palms and the most valuable
product produced by the raw palm oil industry (the other commodities can be understood as by-
products). The fat is less saturated than that in palm kernel oil. It is used in the manufacture of food and
in a range of other industrial uses.
Palm kernel oil. This is the oil produced by the pressing of the kernel (seed) of the same fruit after the
palm oil has been extracted. It is more commonly used in commercial cooking.
Palm kernel meal, or palm kernel cake, is the third product to be produced from the oil palm fruit and
is comprised of the remaining kernel material. It is mostly used as a constituent in animal feed.
The following figure provides a stylised representation of the palm oil supply chain (see Figure 3.1). 4,5
4 This figure is taken from Duncan Brack, Adelaide Glover and Laura Wellesley Energy, Environment and Resources
(Jan 2016) – Agricultural Commodity Supply Chains Trade, Consumption and Deforestation, see
https://www.chathamhouse.org/sites/files/chathamhouse/publications/research/2016-01-28-agricultural-
commodities-brack-glover-wellesley.pdf 5 A report for the British Government’s Department for Environment, Food and Rural Affairs (DEFRA) examined
the palm oil supply chain in the UK. That research identified an enormous range of different sectors in which palm
oil, palm kernel oil or palm kernel meal is used. See
http://randd.defra.gov.uk/default.aspx?Module=More&Location=None&ProjectID=17170.

The Palm Oil Supply Chain
- 7 -
Figure 3.1 Palm oil supply chain
Source: See https://www.chathamhouse.org/sites/files/chathamhouse/publications/research/2016-01-28-agricultural-commodities-brack-glover-wellesley.pdf
There are also a number of other industries which contribute to the production of products using palm oil,
though they may not physically encounter the commodity, such as financial and professional services firms
supporting food manufacturers.
We treat the firms which form part of the downstream palm oil industry as broadly fitting under nine
categories: refineries and processors; food manufacturers; feed manufacturers; other product
manufacturers; electricity generators; biodiesel makers; freight transportation providers; retailers; and
service providers.
Beyond that, a great many other firms either act as suppliers or intermediate consumers to those
industries. Manufacturers produce vehicles which are used by haulage firms to move goods made with palm
oil. Airlines use cleaning products produced using palm oil when preparing planes to transport passengers.
All of this should be included in the quantitative estimates provided later in this report.

The Palm Oil Supply Chain
- 8 -
3.1 Refineries and processors
These include edible oil refineries and oleochemical plants. Those plants process crude palm oil for use by
other industries.
3.2 Food manufacturers
The principal final use of palm oil is in food products. Palm oil is the most popular edible oil in India. It has
also gained popularity as a cooking oil. In Pakistan, palm oil accounts for 85 per cent of imports of edible oil
for domestic consumption.6 There is also growing demand for palm oil in many sub-Saharan African
countries. In addition, in China, 70 per cent of palm oil is used as edible oil in the instant noodle industry.7
It is estimated that instant noodles consumption was almost 103bn packets in 2014, and palm oil accounts
for about 20 per cent of each serving. Lastly, around 60 per cent of EU palm oil consumption was
accounted for outside the energy sector in 2012 (that ratio is likely to be higher for other importers),
mainly by food though also including other products. Food uses include margarine and other spreads; frying
fats; food additives; bread; cakes and pastries; biscuits; snacks; confectionary; dairy and dairy replacements;
and prepared foods. Unilever is the largest international consumer of palm oil identified in a recent report
detailing use of palm oil.
3.3 Feed manufacturers
Palm oil is also found in food for livestock and household pets. The feed industry is estimated to account
for around 5 per cent of total palm oil use in the EU. In some cases, where imports are dominated by palm
kernel meal, that share is likely to be higher (e.g. Ireland). Crude palm oil is used as a fat supplement and
other oil palm derivatives (such as palm kernel meal) are used to supply other nutrition.
3.4 Other product manufacturers
Other products in which palm oil is used include cleaning products, soap, personal care products and
cosmetics. Cleaning products almost all include surfactants (wetting agents that lower the surface tension of
a liquid and surround and trap oily materials on surfaces) and those surfactants can be produced from
petrochemical (crude oil) or oleochemical (principally palm oil) sources. For a variety of reasons, including
the changing location of the global industry, the share of the global market supplied by oleochemicals has
been rising. In particular, WWF observed that although the domestic consumption of palm oil was low in
the United States, palm oil is gaining importance among US corporations due to their global role in the
food and personal care sectors. 8
6 Duncan Brack, Adelaide Glover and Laura Wellesley Energy, Environment and Resources (Jan 2016) – Agricultural
Commodity Supply Chains Trade, Consumption and Deforestation
https://www.chathamhouse.org/sites/files/chathamhouse/publications/research/2016-01-28-agricultural-commodities-
brack-glover-wellesley.pdf 7 WWF – Palm oil in China
http://wwf.panda.org/what_we_do/footprint/agriculture/palm_oil/solutions/responsible_purchasing/scorecard2011/mar
kets/profile/ 8 WWF – Palm oil in the US
http://wwf.panda.org/what_we_do/footprint/agriculture/palm_oil/solutions/responsible_purchasing/scorecard2011/mar
kets/us/

The Palm Oil Supply Chain
- 9 -
3.5 Electricity generators
A number of important international jurisdictions have targets for the proportion of energy consumption
that must come from renewable sources.9 Energy from palm oil can typically be counted towards such
targets (though some regulatory and reputational restrictions on its use have been imposed) alongside
other sources of energy from biomass such as wood. Whilst use of palm oil for electricity generation is
limited compared to food and other uses,10 use for electricity generation have increased significantly in
recent years.11
Biomass can be used either co-firing with coal in existing plants, in plants converted to burn biomass, or in
purpose-built biomass plants. Crude palm oil and a wide range of other products derived from the oil palm
(such as palm stearin) are used in energy generation.
3.6 Biodiesel makers
A number of international jurisdictions have targets for the proportion of transport energy that must come
from renewable sources.12 While less palm oil is consumed for the purposes of producing biodiesel than for
other purposes such as producing food, use for the production of biodiesel has increased sharply.13
As an affordable vegetable oil available on world markets, palm oil has been a significant part of the
increased use of biodiesel (now routinely blended into conventional motor fuel). Again regulatory and
reputational restrictions have limited its role, and other alternatives such as used cooking oil are
encouraged by policy in some countries (e.g. the United Kingdom).
Biodiesel targets have also meant that where biodiesel is produced from other products than palm oil, palm
oil use has increased to replace those other products in their more traditional uses. For example, in the
US, as more soya bean oil was diverted to biodiesel, palm oil imports have increased to fill the gap.14
3.7 Freight transportation providers
The substantial volumes of traded palm oil – over 52m tonnes in 2013/14 – means that the transport
requirements are substantial. This kind of trade in palm oil itself is only likely to constitute a small fraction
of the total transport requirement, however, as intermediate goods made using palm oil also need to be
transported between different firms in the supply chain and final products need to be distributed to final
consumers.
9 For example, in the EU, under Directive 2009/28/EC, 20 per cent of energy consumption must be supplied from
renewable sources by 2020. 10 For example, in the EU, around 10 cent of total palm oil consumption was for electricity generation in 2012. 11 For example, in the EU there was a rise in palm oil consumption for electricity generation from 420 thousand
tonnes in 2006 to 590 thousand tonnes in 2012 — an increase of some 40 per cent 12 For example, in the EU, under Directive 2009/28/EC, energy from renewable sources is required to reach 10 per
cent of the total in the transport sector by 2020. 13 In the EU, use for biodiesel increased by 365 per cent from 402 thousand tonnes in 2006 to 1.9m tonnes in 2012,
and now constitutes some 30 per cent of total palm oil use in the EU. 14 Duncan Brack, Adelaide Glover and Laura Wellesley Energy, Environment and Resources (Jan 2016) – Agricultural
Commodity Supply Chains Trade, Consumption and Deforestation
https://www.chathamhouse.org/sites/files/chathamhouse/publications/research/2016-01-28-agricultural-commodities-
brack-glover-wellesley.pdf

The Palm Oil Supply Chain
- 10 -
3.8 Wholesalers and retailers
With the substantial range of products in which palm oil is incorporated, many firms are involved in serving
them to customers. This includes supermarkets (several supermarkets are major consumers of palm oil
themselves for “own brand” products) but also smaller retailers and service companies such as contract
caterers and cleaning firms (who use products containing palm oil). Public sector organisations, such as
hospitals and prisons also supply palm oil-based products to their customers.
3.9 Legal, financial and other service providers
All of the other firms listed so far in this section will require support from a range of professional services
firms, including those providing legal, financial and accountancy services.

Analysing the Impact of Traded Palm Oil
- 11 -
4 Analysing the Impact of Traded Palm
Oil
The challenge in analysing the economic impact of palm oil in downstream industries is that palm oil is used
in a very large number of different products and a wide range of industries are involved in producing those
products (as set out in the last chapter). At the same time, the statistics on the use of palm oil around the
world are limited.
Statistics are available on the use of palm oil in different countries, however, and estimates for the value are
given in Figure 4.1. The total estimated value of the trade is $44bn.Total imports by value are dominated by
palm oil, 88 per cent of the total, with palm kernel oil (9 per cent) and palm kernel meal (4 per cent)
accounting for a smaller share of total trade.
Figure 4.1: Palm oil imports by type, 2013-14, $m
The value of total palm oil imports allocated by the major economies for which we have detailed industrial
statistics is given in Figure 4.2. The countries that import the most palm oil are India, China, the
Netherlands (though much of that palm oil may be processed and then used in manufacturing in other EU
Member States) and Germany. Palm oil imports are widely distributed across the world economy though,
including a substantial share in smaller economies (which are included under ‘Rest of World’ - RoW).
0
5,000
10,000
15,000
20,000
25,000
30,000
35,000
40,000
45,000
Palm oil imports, $m Palm kernel oil imports,
$m
Palm kernel meal
imports, $m
Import value, $m

Analysing the Impact of Traded Palm Oil
- 12 -
Figure 4.2: Total palm oil imports by country, 2013-14, $m
Our approach was to first estimate the value of the palm oil used (based on the December 2013 price) and
then estimate the forward linkages of that volume of primary supply, in appropriate sectors to match the
uses shown above, using Input-Output (I-O) analysis. We then estimated multipliers for policy relevant
variables, particularly value added (GDP) and employment.
4.1 Input-Output analysis
I-O analysis is a simple general-equilibrium model which links various sectors in the economy through fixed
linear relationships between the output of a sector and the inputs it requires from other sectors.
There are direct, indirect and induced effects. Direct effects occur in those sectors where consumption
increases. Indirect effects occur as other sectors adjust to increased demand for intermediate inputs.
Induced effects arise as the higher output boosts earnings for the various factors of production in the
sectors affected and the additional earnings are then spent.
The main attraction of I-O analysis is that fixed linear relationships make it possible to calculate the effects
of an increase in final demand for one sector on every other sector of the economy and on various
macroeconomic variables – GDP, employment, tax revenue, incomes and so on. Another interesting
feature is that ‘multipliers’ can easily be calculated. These multipliers indicate the percentage change in any
macroeconomic quantity (GDP, tax revenue, income, employment, etc.) as a result of a unit increase in final
demand for a particular sector.
There are two main well-rehearsed drawbacks of I-O analysis.
The reliance on fixed linear relationships assumes no change in production technologies. Consequently,
I-O is not accurate when analysing long-run effects. The results of I-O analyses should always be viewed
as rough approximations to true short-run effects.
0
2,000
4,000
6,000
8,000
10,000
12,000
14,000
16,000
18,000
AU
SA
UT
BEL
BG
RB
RA
CA
NC
HN
CY
PC
ZE
DEU
DN
KESP
EST FIN
FR
AG
BR
GR
CH
UN
IDN
IND
IRL
ITA
JPN
KO
RLT
ULU
XLV
AM
EX
MLT
NLD
PO
LPR
TR
OU
RU
SSV
KSV
NSW
ET
UR
TW
NU
SAR
oW
Total imports, $m

Analysing the Impact of Traded Palm Oil
- 13 -
I-O analysis only produces close approximations when economies are not close to full employment.
Close to full employment, the additional resources required to produce extra output would simply not
be available.
In the current case, however, those drawbacks are of limited importance as we are not seeking to establish
the impact of a certain exogenous change in demand, but instead to determine the linkages of an industry
and the scale of the downstream economic activity.
4.2 Application to palm oil
There were three challenges in applying I-O analysis in order to understand the forward linkages of the
palm oil industry:
Our exogenous variable is a volume of primary supply – the quantity of palm oil imported for various
uses – rather than a change in final demand.
There is no “palm oil” sector in the I-O tables. We therefore need to assign the palm oil to an
appropriate category.
We are interested in its linkages in the country to which palm oil is imported, rather than the
producing country. Our task was therefore to estimate only the indirect and induced effects.
4.2.1 Supply-driven Input-Output analysis
In order to model the downstream activities associated with a source of basic supply, we essentially had to
reverse the normal process by which I-O analysis is conducted. Instead of calculating fixed input coefficients
between different industries and using those to estimate the overall impact of a new vector for final
demand, we calculated fixed output coefficients and then applied those to a volume of output from certain
primary input sectors.
A concern about this approach might be that supply-driven I-O analysis of shocks lacks sound theoretical
foundations and is not recommended as a tool for understanding the impact of policy changes or other
exogenous shocks. However, in this case we are not attempting to estimate how much the economy might
grow or shrink in response to a supply shock. Rather, we are trying to estimate the scale of given linked
activities that are assumed stable. The theoretical foundation for such linkages can be seen as residing in the
I-O demand linkages, not supply linkages. Our use of supply linkages is not reflective of an assumed causal
mechanism (of doubtful validity). Instead, it can be seen as purely a calculation device to “reverse out” the
impact of the demand linkages that theory does supply.
Thus, the findings reported here show the scale of the current economic activity associated with the use of
palm oil as a primary input. They should not be taken as an estimate of the extent to which economic
activity might contract in the absence of palm oil. That would depend on the availability of other means of
supplying final demand and how any resulting increases in price might be passed on.
More detail on the technical process by which the estimates were produced is set out in the Appendix.
4.2.2 Input-Output categories
I-O tables used in this kind of analysis set out the flows of goods and services between different sectors,
and the value added by each sector, in the process of producing goods for final consumption. These tables
have a limited set of categories, however, as they are very data intensive to produce (particularly for large
geographical areas, in this case the world and individual member states).
In earlier research, we broke palm oil imports down based on three use cases: biodiesel production –
which was treated as analogous to output from mining and quarrying (i.e. oil and gas); electricity and heat

Analysing the Impact of Traded Palm Oil
- 14 -
generation – again treated as analogous to output from mining; and finally palm oil used for food and palm
kernel meal treated as products of agriculture.
The difference in the results is limited, however, and the same division is not possible at a global scale (the
use data is not available). In this report, we therefore treat palm oil simply as agricultural output (which will,
like other agricultural output, sometimes be used as a primary energy source — i.e. for biodiesel
production or in electricity generation). The category is therefore: “Agriculture, Hunting, Forestry and
Fishing”.
4.2.3 Imports
In order to account for the fact that we are studying the impacts of palm oil once it has been imported,
rather than domestic agricultural production, we have subtracted the direct effects (those which arise most
straightforwardly where a product is produced) from our estimates of the impact on production. The
resulting production estimates give the indirect effects or indirect plus induced effects, from which we can
obtain appropriate GDP and employment estimates.

Results
- 15 -
5 Results
5.1 Overall results
The results from our analysis show the significant downstream economic activity associated with palm oil
imports. In 2013-14, the around $44bn of traded palm oil was associated with an indirect contribution to
value added in downstream industries of nearly $17bn; or an indirect and induced contribution to GDP of
nearly $39bn. This GDP contribution was distributed as shown in Figure 5.1. Smaller economies such as
Pakistan, Bangladesh and countries in the Middle East are included in the Rest of the World (RoW)
category.
Figure 5.1: Traded palm oil, GDP impact by country, 2013-14
This also represented an indirect contribution to employment of nearly 2m jobs; or an indirect and induced
contribution to employment of nearly 3m jobs. This employment contribution was distributed as shown in
Figure 5.2.
0
1,000
2,000
3,000
4,000
5,000
6,000
7,000
8,000
9,000
10,000
AU
SA
UT
BEL
BG
RB
RA
CA
NC
HN
CY
PC
ZE
DEU
DN
KESP
EST FIN
FR
AG
BR
GR
CH
UN
IDN
IND
IRL
ITA
JPN
KO
RLT
ULU
XLV
AM
EX
MLT
NLD
PO
LPR
TR
OU
RU
SSV
KSV
NSW
ET
UR
TW
NU
SAR
oW
Indirect impact on value added, $m Indirect and induced impact on GDP, $m
Results
- 16 -
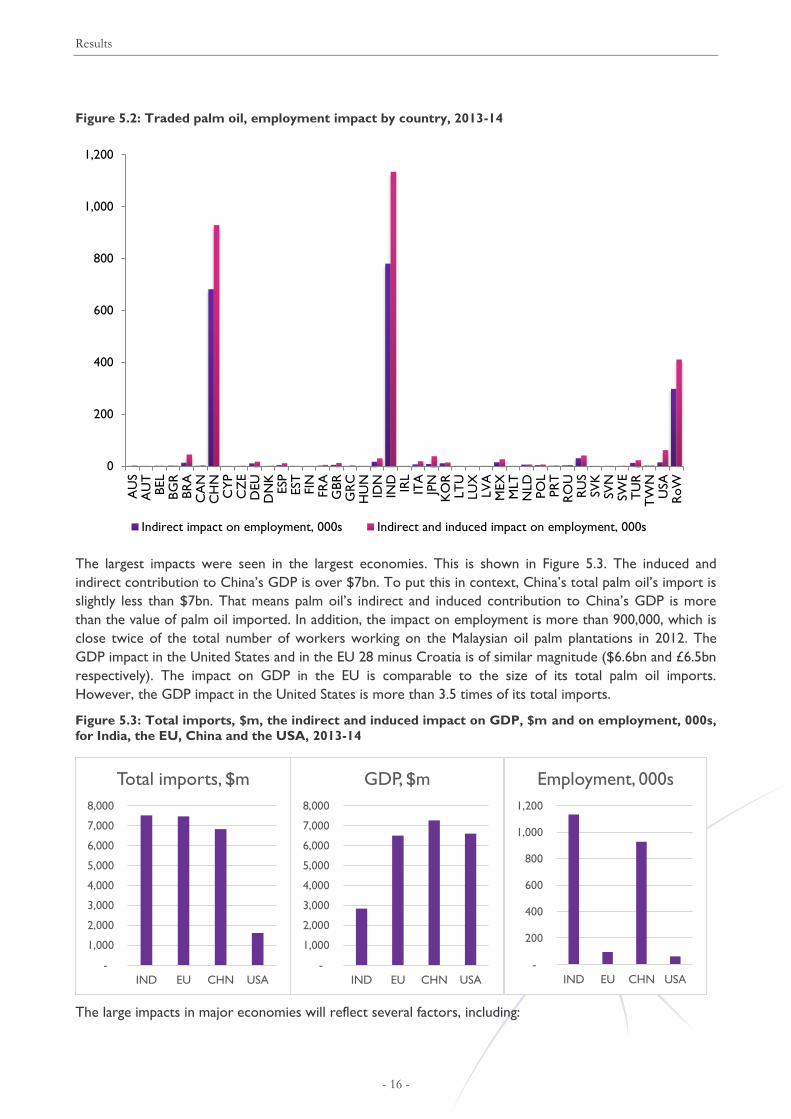
Figure 5.2: Traded palm oil, employment impact by country, 2013-14
The largest impacts were seen in the largest economies. This is shown in Figure 5.3. The induced and
indirect contribution to China’s GDP is over $7bn. To put this in context, China’s total palm oil’s import is
slightly less than $7bn. That means palm oil’s indirect and induced contribution to China’s GDP is more
than the value of palm oil imported. In addition, the impact on employment is more than 900,000, which is
close twice of the total number of workers working on the Malaysian oil palm plantations in 2012. The
GDP impact in the United States and in the EU 28 minus Croatia is of similar magnitude ($6.6bn and £6.5bn
respectively). The impact on GDP in the EU is comparable to the size of its total palm oil imports.
However, the GDP impact in the United States is more than 3.5 times of its total imports.
Figure 5.3: Total imports, $m, the indirect and induced impact on GDP, $m and on employment, 000s,
for India, the EU, China and the USA, 2013-14
The large impacts in major economies will reflect several factors, including:
0
200
400
600
800
1,000
1,200
AU
SA
UT
BEL
BG
RB
RA
CA
NC
HN
CY
PC
ZE
DEU
DN
KESP
EST FIN
FR
AG
BR
GR
CH
UN
IDN
IND
IRL
ITA
JPN
KO
RLT
ULU
XLV
AM
EX
MLT
NLD
PO
LPR
TR
OU
RU
SSV
KSV
NSW
ET
UR
TW
NU
SAR
oW
Indirect impact on employment, 000s Indirect and induced impact on employment, 000s
-
1,000
2,000
3,000
4,000
5,000
6,000
7,000
8,000
IND EU CHN USA
Total imports, $m
-
1,000
2,000
3,000
4,000
5,000
6,000
7,000
8,000
IND EU CHN USA
GDP, $m
-
200
400
600
800
1,000
1,200
IND EU CHN USA
Employment, 000s

Results
- 17 -
Most of the value created in these supply chains will come later in the supply chain (in the manufacture
of final food products and their distribution to consumers), which is more likely to occur in the larger
economies (rather than economies such as the Netherlands where palm oil is often first imported and
processed but then sold elsewhere as an intermediate good).
Larger economies will tend to capture more of the induced impacts, as money earned by the factors of
production in a larger economy is more likely to be spent on goods and services made in the same
country. This will particularly be the case in large economies with relatively low import penetration
(e.g. Japan or Italy).
Other differences will result from the labour intensity of economic activity in different countries. The
estimate for employment in India is higher than that in China (1.1m as compared to 900,000), for example,
despite a lower estimate for GDP. This suggests that the food sector in India is more labour-intensive and,
indeed, the food, beverages and tobacco sector employs around 400 workers per million dollars in value
added, against under 60 workers per million dollars in value added in China. For the same reason, we
observe the estimates for employment impacts in the United States and in the EU are much lower (around
62,000 and 94,000 respectively).
The different estimates are given in full in Table 5.1.

Results
- 18 -
Table 5.1: Indirect and induced contribution of traded palm oil, 2013-14
Total
imports, $m
Indirect impact
on value added,
$m
Indirect impact on
employment, 000s
Indirect and
induced impact
on GDP, $m
Indirect and
induced impact on
employment, 000s
AUS 116 82 1 280 2
AUT 0 35 1 60 1
BEL 151 92 1 109 1
BGR 27 12 2 15 2
BRA 449 168 13 957 45
CAN 81 94 1 262 3
CHN 6,826 4,173 681 7,265 929
CYP 1 2 0 4 0
CZE 27 28 1 38 1
DEU 1,553 581 10 1,220 17
DNK 105 55 1 97 1
ESP 647 249 4 789 11
EST 0 2 0 2 0
FIN 0 20 0 50 1
FRA 167 143 2 443 5
GBR 555 289 5 929 12
GRC 97 31 1 123 2
HUN 2 15 1 17 1
IDN 73 106 17 209 29
IND 7,514 1,406 780 2,836 1,134
IRL 82 49 1 52 1
ITA 1,113 401 7 1,533 18
JPN 671 570 8 2,911 38
KOR 519 265 11 415 14
LTU 0 3 0 3 0
LUX 0 5 0 3 0
LVA 0 3 0 4 0
MEX 539 197 15 486 26
MLT 0 1 0 1 0
NLD 2,701 476 5 568 6
POL 76 70 4 139 6
PRT 24 25 1 75 2
ROU 18 24 3 55 4
RUS 656 257 30 564 41
SVK 0 8 0 9 0
SVN 0 4 0 6 0
SWE 120 76 1 149 1
TUR 643 226 12 560 22
TWN 190 46 2 61 2
USA 1,611 1,209 14 6,599 62
RoW 16,688 5,081 298 8,922 411
Total 44,043 16,576 1,932 38,821 2,852
EU 7,468 2,697 49 6,494 94

Results
- 19 -
5.2 Sector breakdown
The induced impacts cannot be assigned to specific sectors, but represent an increase in demand across the
economy. The indirect impacts tend to occur:
In those sectors which also represent part of the food supply chain, e.g. the food sector, the
construction sector and the wider agricultural sector.
In those sectors that distribute palm oil products, e.g. hotels and restaurants, or public administration
and defence.
The breakdown for the fifteen most important categories can be seen in Table 5.2.
Table 5.2: Indirect contribution to value added, $m
Rank Sector Indirect impact on
value added, $m
1 Food, Beverages and Tobacco 4,568
2 Agriculture, Hunting, Forestry and Fishing 4,297
3 Hotels and Restaurants 1,502
4 Textiles and Textile Products 542
5 Construction 542
6 Public Admin and Defence; Compulsory Social Security 406
7 Renting of M&Eq and Other Business Activities 395
8 Wholesale Trade and Commission Trade, Except of Motor Vehicles and
Motorcycles 368
9 Health and Social Work 350
10 Wood and Products of Wood and Cork 319
11 Chemicals and Chemical Products 270
12 Other Community, Social and Personal Services 258
13 Education 240
14 Pulp, Paper, Paper , Printing and Publishing 239
15 Retail Trade, Except of Motor Vehicles and Motorcycles; Repair of
Household Goods 216

Conclusions
- 20 -
6 Conclusions
To put the economic impact of palm oil in context, the 2.9m employed in those downstream industries is
just less than twice the population of Kuala Lumpur. The GDP contribution from $44bn palm oil imports is
$39bn, which is similar to the GDP of Kuala Lumpur.
In Malaysia around 491,000 workers were involved in producing 19m tonnes of palm oil in 2012. In other
words, around 26 workers were employed for every thousand tonnes of palm oil produced that year.
Globally, our estimates suggest that nearly 2.9m jobs were associated with 52m tonnes of palm oil. In other
words, the indirect and induced contribution to employment was around 54 workers per thousand tonnes
of traded palm oil (the indirect impact alone is around 37 workers per thousand tonnes of traded palm oil).
These numbers are not directly comparable as they have not been calculated in the same way, and the
Malaysian figures likely do not include the induced impacts (the impacts of those workers spending the
income derived from involvement in palm oil).
That result does reinforce a simple intuitive conclusion, however: imports of palm oil are important, on an
at least somewhat similar scale, to the importer as well as the exporter.
While the importance of palm oil exports to the exporting economies are obvious, it is much easier for the
importance of palm oil imports to the global economy, diffused around the world; across a wide range of
industrial sectors; and in both large firms and a multitude of SMEs, to be ignored. This report will hopefully
help to correct that imbalance and illustrate the significance of the sector to importing economies.

Conclusions
- 21 -
Appendix

Appendix A: Input-Output Analysis
- 22 -
Appendix A: Input-Output Analysis
Background
Most Input-Output analysis is based upon the static input-output system developed by Wassily Leontief in
the 1930s. Leontief’s model is based upon fixed, linear production functions and sets out the output needed
from each industry in order to satisfy a given vector of final demand:
For illustrative purposes, assume that the economy has three sectors: agriculture, industry and services.
There are two factor inputs: labour and capital. The end uses for the products of each sector are
summarised in one quantity vector called final demand (in a more complicated model, this would be broken
down into household consumption expenditure, government consumption expenditure, gross fixed capital
formation and net exports).
In this simplistic model, the production of any sector can be looked at by use – the produce is used as
inputs by any or all of the three sectors, and is sold to final demand. The entire economy may be
summarised in the following three equations.
𝑋𝐴𝐴 + 𝑋𝐴𝐼 + 𝑋𝐴𝑆 + 𝑋𝐴𝐷 = 𝑋𝐴
𝑋𝐼𝐴 + 𝑋𝐼𝐼 + 𝑋𝐼𝑆 + 𝑋𝐼𝐷 = 𝑋𝐼
𝑋𝑆𝐴 + 𝑋𝑆𝐼 + 𝑋𝑆𝑆 + 𝑋𝑆𝐷 = 𝑋𝑆
Here:
Sectors are represented by the following subscripts: A = agriculture, I = industry, S = services;
𝑋𝑖𝑗 is the intermediate demand for the produce of sector 𝑖 by sector 𝑗, where 𝑖, 𝑗 ∈ {𝐴, 𝐼, 𝑆}; 𝑋𝑖𝐷 is the final demand for the produce of sector 𝑖; 𝑋𝑖 is the total production of sector 𝑖; and
all units are in money terms.
The assumption of fixed coefficients is interpreted in the following way. Take the industry sector. It needs
to use 𝑋𝐴𝐼 of the produce of the agriculture sector to produce 𝑋𝐼 of final produce. Consequently, it needs 𝑋𝐴𝐼
𝑋𝐼 worth of the agricultural produce to produce product worth one unit of currency. The assumption is
that 𝑎𝐴𝐼 is the fixed technical coefficient of intermediate consumption that provides one link between the
industry and agriculture sectors – regardless of the amount that the industry sector produces this
proportion would remain constant. Similar intermediate consumption coefficients may be calculated for
links between each pair of sectors.
𝑎𝑖𝑗 =𝑋𝑖𝑗
𝑋𝑗 𝑓𝑜𝑟 𝑖, 𝑗 = 𝐴, 𝐼, 𝑆
The system of equations can then be represented in terms of the fixed technical coefficients, the total
production of each sector and the final demand facing each sector as follows.
𝑎𝐴𝐴𝑋𝐴 + 𝑎𝐴𝐼𝑋𝐼 + 𝑎𝐴𝑆𝑋𝑆 + 𝑋𝐴𝐷 = 𝑋𝐴
𝑎𝐼𝐴𝑋𝐴 + 𝑎𝐼𝐼𝑋𝐼 + 𝑎𝐼𝑆𝑋𝑆 + 𝑋𝐼𝐷 = 𝑋𝐼
𝑎𝑆𝐴𝑋𝐴 + 𝑎𝑆𝐼𝑋𝐼 + 𝑎𝑆𝑆𝑋𝑆 + 𝑋𝑆𝐷 = 𝑋𝑆
Using matrix notation, this may be re-written as follows.

Appendix A: Input-Output Analysis
- 23 -
[
𝑎𝐴𝐴 𝑎𝐴𝐼 𝑎𝐴𝑆
𝑎𝐼𝐴 𝑎𝐼𝐼 𝑎𝐼𝑆
𝑎𝑆𝐴 𝑎𝑆𝐼 𝑎𝑆𝑆
] [𝑋𝐴
𝑋𝐼
𝑋𝑆
] + [𝑋𝐴𝐷
𝑋𝐼𝐷
𝑋𝑆𝐷
] = [𝑋𝐴
𝑋𝐼
𝑋𝑆
] ⇒ 𝑨 ⋅ 𝑿 + 𝑿𝑫 = 𝑿
Change in final demand
With this set up, it now becomes possible to analyse the effects on the economy when the final demand
changes for the produce of a certain sector. The problem is straightforward – we have a new set of final
demands 𝑋𝑖𝐷 (contained in the vector 𝑿𝑫) and a set of technical coefficients 𝑎𝑖𝑗 (which are contained in the
matrix 𝑨) that are known. We need to know what the total produce of each sector should now be, i.e. we
need to find the 𝑋𝑖s (contained in the vector 𝑿). In terms of the three-equation set up, the problem is
simple – there are three equations with three unknown variables to solve for. Simple algebraic manipulation
leads us to the new final outputs.
For computational reasons, it is easier to work with matrices, as in actual models the number of sectors is
much higher than three, and algebraic manipulation becomes harder. Thus, in matrix terms, the solution is
given by manipulation of the basic set-up equation.
𝑿 = (𝑰 − 𝑨)−𝟏 ⋅ 𝑿𝑫
Here
𝑰 is an identity matrix with 1 along the diagonal and 0 elsewhere; and
(𝑰 − 𝑨)−𝟏 is the inverse of the matrix (𝑰 − 𝑨)
There are a number of reservations over that approach, in particular:
The assumption of a fixed, linear production function excludes the possibility that firms can substitute
other inputs or that there are increasing or decreasing returns to scale.
The assumption that inputs can respond freely to final demand (the only exogenous variable) in the
model is only plausible if none of those inputs are scarce and the economy is therefore not close to full
employment.
However, demand-driven I-O analysis does provide an understanding of the backward linkages between
industries and, in the short-term, the demand-driven input-output approach also gives an understanding of
the likely effects of policies such as Keynesian stimulus programmes.
Change in supply
In the case of Palm Oil imports, we are not studying the effects of final demand, or changes in final demand,
but changes in supply from certain sectors. The supply-driven application of I-O analysis demands some
differences in approach and has a different set of limitations to demand-driven analysis.
There is a corresponding supply-driven quantity model analogous to the demand-driven model set out
above. The model uses output coefficients, which are distribution parameters products reflecting market
shares, rather than the input coefficients described above and used in demand-driven I-O analysis, which
reflect production functions or cost structures of activities. Those output coefficients are calculated by
dividing each entry of the input-output table by the corresponding row total.
An output coefficient model then takes the following form:
𝑩′ ⋅ 𝑿 + 𝒁𝑺 = 𝑿
(𝑰 − 𝑩′) ⋅ 𝑿 = 𝒁𝑺
𝑿 = (𝑰 − 𝑩′)−𝟏 ⋅ 𝒁𝑺 Here

Appendix A: Input-Output Analysis
- 24 -
𝑩′ is a transposed matrix of output coefficients for intermediates;
𝑰 is an identity matrix with 1 along the diagonal and 0 elsewhere; and
𝒁𝑺 is a new set of primary inputs or value added for intermediate sectors.
There are further limitations on the use of supply-driven I-O models though as they are often thought to
“lack a proper microeconomic foundation”. However that shortcoming mainly relates to studies of the
impacts of policy shocks, where a “straightforward use of the model” is seen as inappropriate. Even critical
analysis suggests that “using the supply-driven model as a descriptive device to indicate the strength of
forward linkages is justified”.
That is how we need to understand the results obtained in this study: as an indication of the forward
linkages of Palm Oil imports in European Member State economies; the scale of the economic activity
associated with Palm Oil imports as an input. Further research would be needed in order to understand the
impact of discrete policy changes; how the economic activity associated with Palm Oil imports might be
diminished by any attempts to restrict those imports.
Direct, indirect and induced effects
In I-O analysis, changes in macro variables are the result of three kinds of effect:
Direct effect: If a sector produces more output, either in response to final demand in a demand-driven
model or as an exogenous input in a supply-driven model. It results in additions to GDP, employment,
income, taxes, and other policy relevant variables, but we have subtracted that component in our
analysis as the direct effects of increase palm oil production will take place in the exporting countries,
not in the EU Member States which import the palm oil.
Indirect effect: These are caused by all sectors adjusting outputs to allow for an increase in demand for
intermediate inputs that would accompany any increase in output by any sector. The model described
above captures indirect effects and, as palm oil is best understood as a primary input, we are
particularly studying the forward linkages of the sector.
Induced effect: Increases in production mean increased incomes for those providing the factors of
production (investors providing capital; workers providing labour). As they spend those higher
incomes, that creates an increase in final demand and therefore a further increase in production.
Induced effects cannot be calculated using I-O tables because the household sector is regarded as
extraneous. We have calculated these effects indirectly using data on income multipliers. To do this, we
first estimated income multipliers based on savings and import rates. We then multiplied the GDP
effects (excluding induced effects) by the income multipliers to arrive at the total effects (including
induced effects). An economy-wide employment multiplier was used to estimate the resulting
employment. It should be noted that this analysis was conducted only at the country level, not at the
sector level.
Estimating policy relevant multipliers
Once the new total outputs have been calculated, the effects on several macro variables may be obtained:
GDP effects: As GDP is simply the sum total of all goods and services produced in the economy, the
new GDP is obtained by adding up all new total production figures for all sectors in the economy and
multiplying that by the proportion of output of each sector that represents value creation (the share of
value added in output).
Employment effects: To calculate these, one needs to multiply the change in output in each sector with
the number of employees it takes to produce one currency unit worth of produce. This is also a fixed
coefficient, and can be calculated using initial production and initial employment. Initial employment was
available from Eurostat based on the same NACE categories as the I-O tables. The induced effect was
estimated by multiplying the induced effect on GDP by the ratio of employment to GDP in each
Member State.

Appendix A: Input-Output Analysis
- 25 -
Sources of data
Three sources of data have been used in the compilation of this report:
Oil World is a specialist information provider, which provides a respected source of information about
the international oils and fats market. We have used data from Oil World for the volumes of each type
of palm oil being imported by different countries in 2013-14 and their prices.
The World Input-Output database, which provides a single Input-Output table for the world, in which
each of 35 sectors, in each of 40 countries (plus a Rest of World residual), is represented as a sector.
This means that cross-linkages where supply chains cross back and forth across national borders will be
captured in our results.
The World Bank World Development Indicators, which provided country-level statistics for GDP,
savings, imports, the size of the labour force and unemployment used in the calculation of induced
impacts.