The double burden of malnutrition in India: Trends and ...
14
RESEARCH ARTICLE The double burden of malnutrition in India: Trends and inequalities (2006–2016) Phuong Hong Nguyen ID 1 *, Samuel Scott 1 , Derek Headey 1 , Nishmeet Singh 1 , Lan Mai Tran 2 , Purnima Menon 1 , Marie T. Ruel 1 1 Poverty, Health and Nutrition Division, International Food Policy Research Institute, Washington, DC, United States of America, 2 FHI360, Hanoi, Vietnam * [email protected] Abstract Rapid urban expansion has important health implications. This study examines trends and inequalities in undernutrition and overnutrition by gender, residence (rural, urban slum, urban non-slum), and wealth among children and adults in India. We used National Family Health Survey data from 2006 and 2016 (n = 311,182 children 0-5y and 972,192 adults 15- 54y in total). We calculated differences, slope index of inequality (SII) and concentration index to examine changes over time and inequalities in outcomes by gender, residence, and wealth quintile. Between 2006 and 2016, child stunting prevalence dropped from 48% to 38%, with no gender differences in trends, whereas child overweight/obesity remained at ~7–8%. In both years, stunting prevalence was higher in rural and urban slum households compared to urban non-slum households. Within-residence, wealth inequalities were large for stunting (SII: -33 to -19 percentage points, pp) and declined over time only in urban non- slum households. Among adults, underweight prevalence decreased by ~13 pp but over- weight/obesity doubled (10% to 21%) between 2006 and 2016. Rises in overweight/obesity among women were greater in rural and urban slum than urban non-slum households. Within-residence, wealth inequalities were large for both underweight (SII -35 to -12pp) and overweight/obesity (+16 to +29pp) for adults, with the former being more concentrated among poorer households and the latter among wealthier households. In conclusion, India experienced a rapid decline in child and adult undernutrition between 2006 and 2016 across genders and areas of residence. Of great concern, however, is the doubling of adult over- weight/obesity in all areas during this period and the rise in wealth inequalities in both rural and urban slum households. With the second largest urban population globally, India needs to aggressively tackle the multiple burdens of malnutrition, especially among rural and urban slum households and develop actions to maintain trends in undernutrition reduction without exacerbating the rapidly rising problems of overweight/obesity. Introduction Urban expansion is occurring rapidly in many parts of the world. Whereas approximately 55% of the world’s population currently lives in urban areas, this figure is expected to rise to 60% in PLOS ONE PLOS ONE | https://doi.org/10.1371/journal.pone.0247856 February 25, 2021 1 / 14 a1111111111 a1111111111 a1111111111 a1111111111 a1111111111 OPEN ACCESS Citation: Nguyen PH, Scott S, Headey D, Singh N, Tran LM, Menon P, et al. (2021) The double burden of malnutrition in India: Trends and inequalities (2006–2016). PLoS ONE 16(2): e0247856. https:// doi.org/10.1371/journal.pone.0247856 Editor: Srinivas Goli, University of Western Australia, AUSTRALIA Received: August 18, 2020 Accepted: February 15, 2021 Published: February 25, 2021 Copyright: © 2021 Nguyen et al. This is an open access article distributed under the terms of the Creative Commons Attribution License, which permits unrestricted use, distribution, and reproduction in any medium, provided the original author and source are credited. Data Availability Statement: All relevant data are within the manuscript and its Supporting Information files. Funding: This research is funded by the Bill & Melinda Gates Foundation through POSHAN, led by International Food Policy Research Institute. The funders had no role in study design, data collection and analysis, decision to publish, or preparation of the manuscript. Competing interests: The authors have declared that no competing interests exist.
Transcript of The double burden of malnutrition in India: Trends and ...

RESEARCH ARTICLE
The double burden of malnutrition in India:
Trends and inequalities (2006–2016)
Phuong Hong NguyenID1*, Samuel Scott1, Derek Headey1, Nishmeet Singh1, Lan
Mai Tran2, Purnima Menon1, Marie T. Ruel1
1 Poverty, Health and Nutrition Division, International Food Policy Research Institute, Washington, DC,
United States of America, 2 FHI360, Hanoi, Vietnam
Abstract
Rapid urban expansion has important health implications. This study examines trends and
inequalities in undernutrition and overnutrition by gender, residence (rural, urban slum,
urban non-slum), and wealth among children and adults in India. We used National Family
Health Survey data from 2006 and 2016 (n = 311,182 children 0-5y and 972,192 adults 15-
54y in total). We calculated differences, slope index of inequality (SII) and concentration
index to examine changes over time and inequalities in outcomes by gender, residence, and
wealth quintile. Between 2006 and 2016, child stunting prevalence dropped from 48% to
38%, with no gender differences in trends, whereas child overweight/obesity remained at
~7–8%. In both years, stunting prevalence was higher in rural and urban slum households
compared to urban non-slum households. Within-residence, wealth inequalities were large
for stunting (SII: -33 to -19 percentage points, pp) and declined over time only in urban non-
slum households. Among adults, underweight prevalence decreased by ~13 pp but over-
weight/obesity doubled (10% to 21%) between 2006 and 2016. Rises in overweight/obesity
among women were greater in rural and urban slum than urban non-slum households.
Within-residence, wealth inequalities were large for both underweight (SII -35 to -12pp) and
overweight/obesity (+16 to +29pp) for adults, with the former being more concentrated
among poorer households and the latter among wealthier households. In conclusion, India
experienced a rapid decline in child and adult undernutrition between 2006 and 2016 across
genders and areas of residence. Of great concern, however, is the doubling of adult over-
weight/obesity in all areas during this period and the rise in wealth inequalities in both rural
and urban slum households. With the second largest urban population globally, India needs
to aggressively tackle the multiple burdens of malnutrition, especially among rural and
urban slum households and develop actions to maintain trends in undernutrition reduction
without exacerbating the rapidly rising problems of overweight/obesity.
Introduction
Urban expansion is occurring rapidly in many parts of the world. Whereas approximately 55%
of the world’s population currently lives in urban areas, this figure is expected to rise to 60% in
PLOS ONE
PLOS ONE | https://doi.org/10.1371/journal.pone.0247856 February 25, 2021 1 / 14
a1111111111
a1111111111
a1111111111
a1111111111
a1111111111
OPEN ACCESS
Citation: Nguyen PH, Scott S, Headey D, Singh N,
Tran LM, Menon P, et al. (2021) The double burden
of malnutrition in India: Trends and inequalities
(2006–2016). PLoS ONE 16(2): e0247856. https://
doi.org/10.1371/journal.pone.0247856
Editor: Srinivas Goli, University of Western
Australia, AUSTRALIA
Received: August 18, 2020
Accepted: February 15, 2021
Published: February 25, 2021
Copyright: © 2021 Nguyen et al. This is an open
access article distributed under the terms of the
Creative Commons Attribution License, which
permits unrestricted use, distribution, and
reproduction in any medium, provided the original
author and source are credited.
Data Availability Statement: All relevant data are
within the manuscript and its Supporting
Information files.
Funding: This research is funded by the Bill &
Melinda Gates Foundation through POSHAN, led by
International Food Policy Research Institute. The
funders had no role in study design, data collection
and analysis, decision to publish, or preparation of
the manuscript.
Competing interests: The authors have declared
that no competing interests exist.
2030 and 68% by 2050 [1]. Urban populations often grow faster than the capacity of cities to
support them, with slum populations increasing as a result, particularly in South Asia. An esti-
mated 881 million people worldwide lived in slums in 2014, and this number is projected to
increase to two billion in 2030 [2]. India has the second largest urban population in the world;
the proportion of India’s population living in urban areas is expected increased from 34% (460
million) in 2018 to 40% (607 million) in 2030 and 53% (876 million) in 2050 [1]. Several large
cities in India currently have more than 40% of their population residing in slums [3].
As the world’s population becomes more urbanized, many challenges related to the rapid
expansion of urban areas and the explosion of slums arise, including overcrowding, lack of
basic services, substandard housing, limited access to healthcare, unsafe water, and inadequate
sanitation [4]. Among the many health and nutrition challenges faced by urban dwellers, the
double burden of malnutrition–i.e. the coexistence of undernutrition and micronutrient defi-
ciencies and of overweight/obesity–is becoming a major public health concern globally and in
urban areas in particular [5, 6]. Urbanization is a strong driver of the double burden of malnu-
trition because it causes remarkable shifts in urban food systems (particularly the availability
of cheap ultra-processed food and beverages), in urban diets (convenient and processed
foods), and in lifestyles (lower levels of physical activity related to the labor-saving technolo-
gies, more sedentary work, more leisure, and motorized transportation) [5].
While many studies from low- and middle- income countries (LMICs) have reported mal-
nutrition disparities between socioeconomic groups or by urban–rural residence, very few
have examined the intersection between wealth and area of residence, and none have done so
in India (S1 Table in S1 File). Understanding inequalities in different forms of malnutrition
related to wealth status and residence is vital to identifying solutions to achieving equality, a
core cross-cutting theme of the Sustainable Development Goals.
In India, health has improved in recent decades, but progress has been uneven and inequi-
table. Maternal and child undernutrition disproportionately burdens the poor [7, 8], especially
the urban poor where undernutrition and other health conditions are worse than among their
wealthier counterparts [9, 10], and sometimes even worse than in rural areas [11]. Urban
slum-dwellers are among the most vulnerable population groups and face high mortality and
undernutrition, as well as limited access to maternal and child health care services [11, 12].
Furthermore, slum-dwellers are burdened by the low-quality of public service provision such
as access to water, sanitation, decent housing, and health insurance [13–15]. Despite these wid-
ening gaps, understanding inequalities in the different forms of malnutrition in India has not
received sufficient attention. Most health inequality studies used previous National Family
Health Survey (before 2006) and some used data on some select states, but no study to our
knowledge has examined trends and wealth inequalities within place of residence over time.
Our study aimed to fill this gap by analyzing trends and inequalities in child and adult under-
nutrition and overweight/obesity by gender, area of residence, and wealth in India from 2006
to 2016.
Methods
Data sources
We used data from two rounds of nationally representative surveys—the National Family
Health Surveys in 2005–2006 (NFHS-3) [16] and 2015–2016 (NFHS-4) [17]. Both surveys fol-
low a systematic, multi-stage stratified sampling design used in Demographic and Health Sur-
veys in many other countries. The first stage involved selection of primary sampling units (i.e.
villages in rural areas and Census Enumeration Blocks in urban areas) using probability pro-
portional to population size. The second stage involved the random selection of 22 households
PLOS ONE Trends and inequalities in double burden of malnutrition in India
PLOS ONE | https://doi.org/10.1371/journal.pone.0247856 February 25, 2021 2 / 14

from each primary sampling unit. These surveys gathered demographic, health and nutrition
data on 109,041 and 601,509 sample households, respectively. While NFHS-3 is representative
at the state level, NHFS-4 is representative at both state and district levels, and both surveys are
also representative at urban/rural levels. In this study, we used data from girls 0–59 mo
(n = 24,756 for 2006, 124,525 for 2016), boys 0–59 mo (n = 26,799 for 2006, 135,102 for 2016),
women 15–49 y (n = 118,474 for 2006, 667,258 for 2016) and men 15-54y (n = 74,338 for 2006,
112,122 for 2016) with available anthropometric measurements.
Outcomes
The outcomes of interest were anthropometric measures for girls, boys, women and men.
Children’s weight and length/height measurements were used to derive z-scores by comparing
each child’s anthropometric measurements to the WHO age- and gender-appropriate child
growth standards. Two indicators were calculated: length/height-for-age z-score (HAZ) and
body mass index-for-age z-score (BMIZ, using children’s weight and height for age). Stunting
was defined as HAZ< -2 and overweight as BMIZ>1. The height and weight measures of
women and men were used to calculate body mass index (BMI) in kg/m2. Underweight was
defined as BMI<18.5 kg/m2 and overweight as BMI�25 kg/m2. We use a combination of
overweight and obesity given extensive epidemiological research highlighting the risks of non-
communicable diseases associated with BMI�25 kg/m2 [18].
Definition of rural, urban slum and urban non-slum households
We compared outcomes in rural, urban slum and urban non-slum households. The urban and
rural clusters in NFHS were chosen using the classifications of the Census of India 2011 [19].
Urban areas were defined as Statutory Towns (including all places with a municipality, corpo-
ration, cantonment board or notified town area committee) and Census Town (including all
other places with a minimum population of 5,000; at least 75% of the male working population
engaged in non-agricultural pursuits; and a density of population of at least 400 persons/
square kilometer).
There is no agreement on how to define and hence identify a slum (S2 Table in S1 File).
After reviewing literature on slum definitions, we applied the UN-HABITAT definition [20,
21] which ascribes a household to a slum based on satisfying at least two of the following four
criteria: 1) overcrowding/insufficient living space (three or more people sharing a room), 2)
non-durable housing (if the wall, roof or floor of the house is built with unimproved materi-
als), 3) lack of access to improved and adequate safe drinking water, and 4) lack of access to
adequate sanitation facility. All these criteria applied for households defined as urban in NFHS
only. We compared the percentage of slum households using our definition to the percentage
of identified slums reported in NFHS-3 and NFHS-4 in 8 large cities and found similar results.
Wealth index
A wealth index was constructed using pooled data from 2006 and 2016 to compare wealth over
time. A principal component analysis was used to construct the index, which included house-
hold ownership of 17 assets (car, motorbike, bicycle, television, radio, computer, refrigerator,
mobile phone, watch, fan, bed, mattress, table, chair, pressure cooker, sewing machine, water
pump), livestock (cow, goat, chicken), house and land [22]. The first component derived from
the component scores explained ~80% of the variance and was then used to categorize wealth
into quintiles for urban slum, non-slum and rural separately; the lowest quintile (Q1) repre-
sents the poorest 20% and the highest quintile (Q5) represents the richest 20% of the pooled
population.
PLOS ONE Trends and inequalities in double burden of malnutrition in India
PLOS ONE | https://doi.org/10.1371/journal.pone.0247856 February 25, 2021 3 / 14

Data analysis
Descriptive analyses were used to summarize sample characteristics. Graphical methods were
used to visualize how stunting in children, underweight in adults, and overweight in both chil-
dren and adults differed by residential areas over time. These changes were examined using
absolute change, the percentage point (pp) difference between the two surveys. The statistical
significance of changes between 2006 and 2016 was tested using an adjusted Wald test.
To examine inequalities in the burden of malnutrition by wealth index within residential
areas, we first used equity plots disaggregated by residence and wealth quintile for each age/sex
group, to visualize the prevalence of outcomes in 2006 and 2016. We then examined absolute
and relative wealth inequalities for each outcome by residential area using the slope index of
inequality (SII) and the concentration index (CIX) [23, 24]. These two complex measures are
widely used to summarize health inequality in a series of subgroups such as wealth quintiles,
taking into account the entire distribution of outcomes over the five quintiles, and weighted by
the sample size of each quintile. SII represents the absolute difference (percentage points, pp)
in predicted values of outcomes between the two extremes of the wealth distribution (lowest
and highest wealth quintile). CIX is a relative measure of inequality; it is related to the Gini
coefficient and can be expressed in the form of a curve that ranks the sample wealth index on
the x-axis and plots cumulative health outcomes on the y-axis. Both SII and CIX take values
from -100 to +100, where positive values indicate the outcome is more prevalent among the
rich and negative values indicate the outcome is more prevalent among the poor. These two
inequality measures were also used to assess changes in inequalities over time. All analyses
were performed using Stata version 15.1. All models were adjusted for age, cluster sampling
design and survey sampling weights. Two-sided P<0.05 was used for statistical significance.
Ethics statement
This study was a secondary data analysis of NFHS data, which was approved by the institu-
tional review board of the International Institute of Population Sciences, India. All respon-
dents in the NFHS undergo an informed consent process for participation in the survey. The
enumerators read a detailed informed consent statement to the respondents, informing about
the survey, describing the procedure, and emphasizing the voluntary nature of participation.
Once the respondent agreed to participate in the survey, the interviewer signed the question-
naire to indicate that the informed consent statement had been read to the respondent.
Results
Sample characteristics
In 2006, two thirds of households lived in rural, 26% in non-slum and 7% in slum areas
(Table 1). As per survey design, the share of households in each residential area was similar
between 2006 and 2016. Most houses in rural clusters were built of non-durable material (71%
in 2006 and 57% in 2016), were crowded (42% in 2006 and 35% in 2016) and lacked an ade-
quate sanitation facility (77% in 2006 and 57% in 2016). The prevalence of insufficient living
space was highest for urban slum dwellers (~72% in both years). Wealth and living conditions
improved over time for all three residential areas.
Differences in stunting, underweight, and overweight/obesity by residential
area and time
Child stunting dropped by 10 percentage points (from 48% to 38%) over the 10-year period
from 2006 to 2016 (Table 2), with no statistically significant differences between boys and
PLOS ONE Trends and inequalities in double burden of malnutrition in India
PLOS ONE | https://doi.org/10.1371/journal.pone.0247856 February 25, 2021 4 / 14

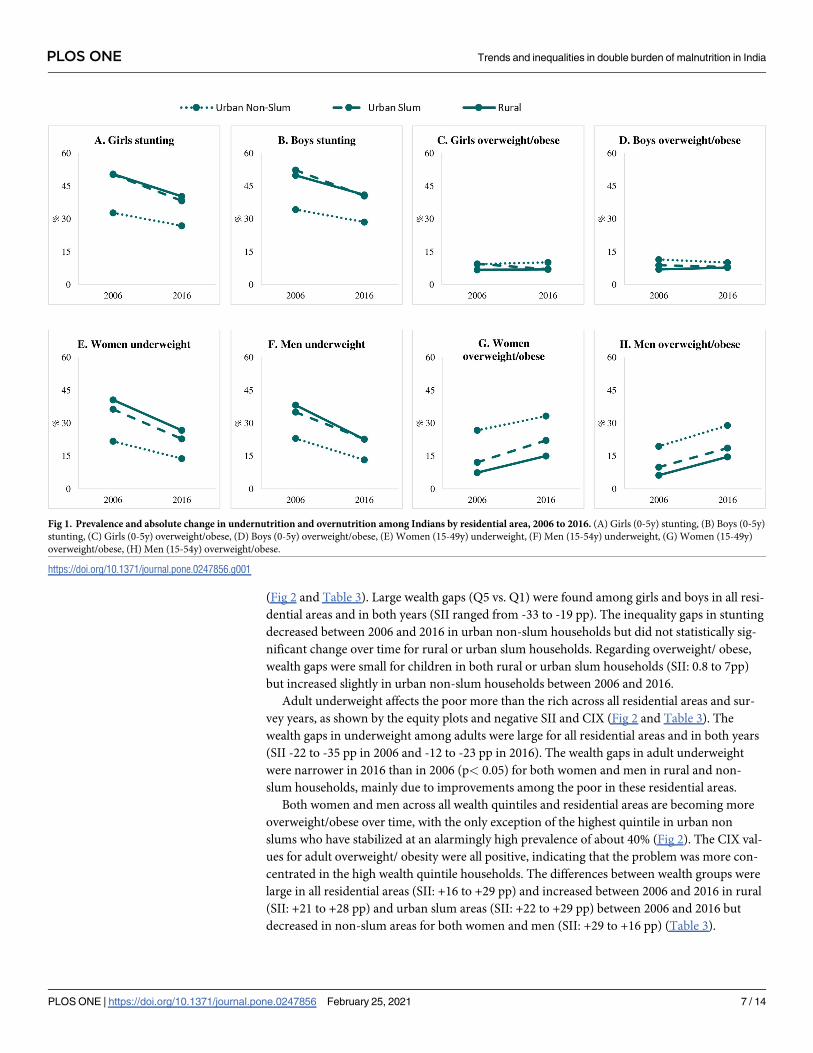
girls. The reduction in stunting was significantly higher among children from rural and urban
slum households (-9 to -12 pp, depending on area and sex) than among those in urban non-
slum households (-6 pp) (Fig 1 and Table 2). At both time points, stunting was similarly high
among children from rural and urban slum households (~50% in 2006 and ~40% in 2016), but
much lower among those from urban non-slums (33% in 2006 and 27% in 2016 for girls, 34%
in 2006 and 29% in 2016 for boys).
Overweight/obesity affected ~8% of children and did not change over time. Overweight/
obesity prevalence was slightly lower (by ~3–4 pp) in rural compared to slum and non-slum
households for both girls and boys.
The prevalence of underweight also declined markedly between 2006 and 2016, from 36%
to 23% among women and 34% to 20% among men (Fig 1 and Table 2). Larger declines were
observed among adults living in rural (14–16 pp), followed by urban slum (12–14 pp) and
non-slum dwellers (8–10 pp). By contrast, the prevalence of overweight/obesity in adults
almost doubled between 2006 and 2016 (from 10 to 21%) and the relative increases were
higher in adults from rural households (103–136%) compared to those from slum (83–88%)
and non-slum households (24–49%) (Table 2).
Table 1. Characteristics of households, girls, boys, women and men by survey round and residential area, India 2006 and 2016.
Overall By residential area
2006 2016 2006 2016
Rural Urban Slum Urban Non-Slum Rural Urban Slum Urban Non-Slum
Household level
Number of households 109,041 601,509 58,805 9,982 40,254 425,563 33,312 142,634
Share of households (%) 100.0 100.0 67.4 6.8 25.8 65.1 5.7 29.2
Non-durable housing1 (%) 53.9 41.8��� 71.1 a 67.8b 5.5c 57.1b 56.6b 6.0a
Lack of access to adequate sanitation facility2 (%) 58.4 41.7��� 76.5 b 73.8 b 7.1a 56.7b 57.5b 4.8a
Lack of access to safe drinking water3 (%) 12.4 10.6��� 15.6b 15.2b 3.3a 11.2c 26.9b 6.2a
Insufficient living space (%) 40.3 32.3��� 42.2c 71.8 b 26.9a 34.6c 71.5b 19.4a
Wealth index -0.5 0.05��� -0.88c -0.63b 0.51a -0.27c -0.05 b 0.80a
Girls 0–5 y
N 24,756 124,525 15,504 3,023 6,229 95,276 8,471 20,778
Age, mo 29.5 29.7 29.3 b 29.6a, b 30.1a 29.6 a 29.9a 30.0a
Boys 0–5 y
N 26,799 135,102 16,568 3,182 7,049 102,972 9,058 23,072
Age, mo 29.7 29.8 29.7 a 30.5 a 29.6a 29.5b 30.4a 30.4a
Women 15–49 y
N 118,474 667,258 63,786 11,561 43,127 470,341 40,829 156,088
Age, y 29.3 30.2��� 29.2 c 28.8b 30.0 a 30.0 c 29.5 b 31.0 a
Men 15–54 y
N 74,338 112,122 36,155 8,337 29,846 76,596 6,993 28,533
Age, y 31.1 31.9��� 31.1 a 30.8 a 31.0a 31.7c 31.1 b 32.3 a
1 A house is categorized as non-durable if the wall or the roof or the floor of the house is built with unimproved materials
2Unimproved sanitation facilities include—flush or pour-flush to elsewhere, pit latrine without slab or open pit, bucket, hanging toilet or hanging latrine, no facilities, or
bush or field
3Unimproved water sources include unimproved dug well, unprotected spring, cart with small tank/drum, bottled water, tanker-truck, surface water (river, dam, lake,
pond, stream, canal, irrigation channels)
��� Significant difference between 2006 and 2016, ��� p< 0.001a, b, cLabeled values in a row without a common superscript letter differ among urban non-slum, urban slum and rural, p< 0.05.
https://doi.org/10.1371/journal.pone.0247856.t001
PLOS ONE Trends and inequalities in double burden of malnutrition in India
PLOS ONE | https://doi.org/10.1371/journal.pone.0247856 February 25, 2021 5 / 14

Wealth inequality in stunting, underweight and overweight/obesity by
gender and residential area
Child stunting prevalence was higher among poorer compared to wealthier households across
all residential areas and survey years, as shown by the equity plots and negative SII and CIX
Table 2. Nutrition outcomes for children and adults by survey round and residential area, India 2006 and 2016.
Indicators Area Year Change
2006 2016 Absolute change
(2016–2006, pp)
Relative change
([2016–2006]/2006, %)
Children 0–5 y
Girls stunting1 Rural 50.5a 40.3 a -10.2��� a -20.2
Urban slum 50.3a 38.3 b -12.0��� a -23.9
Urban non-slum 32.8b 26.9 c -5.9��� b -18.0
All girls 47.6 37.5 -10.1��� -21.2
Boys stunting Rural 49.9 a 41.0 a -8.9��� a -17.8
Urban slum 52.3 a 40.5 a -11.8��� a -22.6
Urban non-slum 34.3 b 28.6 b -5.7��� b -16.6
All boys 47.5 38.4 -9.1��� -19.2
Girls overweight/ obese1 Rural 6.8 a 7.0 a 0.2 a 2.9
Urban slum 9.5 a 7.1 a -2.4� b -25.3
Urban non-slum 9.4 b 10.2 b 0.8 a 8.5
All girls 7.4 7.7 0.3 4.1
Boys overweight/ obese1 Rural 7.0 a 7.8 a 0.8� a 11.4
Urban slum 8.9 ab 8.1 a -0.8 ab -9.0
Urban non-slum 11.5 b 10.1 b -1.4 b -12.2
All boys 7.9 8.3 0.4 5.1
Adults 15–54 y
Women (15-49y) underweight1 Rural 40.6 a 26.7 a -13.9��� a -34.2
Urban slum 36.3 b 22.8 b -13.5��� a -37.2
Urban non-slum 21.7 c 13.8 c -7.9��� b -36.4
All women 35.6 22.9 -12.7��� -35.7
Men (15-54y) underweight1 Rural 38.2 a 22.6 a -15.6��� a -40.8
Urban slum 35.0 b 22.7 a -12.3��� b -35.1
Urban non-slum 23.0 c 13.2 b -9.8��� c -42.6
All men 33.8 19.8 -14.0��� -41.4
Women (15-49y) overweight/ obese1 Rural 7.4 a 15.0 a 7.6��� a 102.7
Urban slum 12.1 b 22.1 b 10.0��� b 82.6
Urban non-slum 26.7 c 33.2 c 6.5��� c 24.3
All women 12.5 20.5 8.0��� 64.0
Men (15-54y) overweight/ obese1 Rural 6.2 a 14.6 a 8.4��� a 135.5
Urban slum 9.9 b 18.6 b 8.7��� a 87.9
Urban non-slum 19.4 c 28.9 c 9.5��� a 49.0
All men 10.1 19.1 9.0��� 89.1
��� Significant difference between 2006 and 2016
�P<0.5, ��� P< 0.001a, b, cLabeled values in a column without a common superscript letter differ among urban non-slum, urban slum and rural within year, P< 0.05. All models controlled
for age, gender, cluster sampling design and survey sampling weights.
https://doi.org/10.1371/journal.pone.0247856.t002
PLOS ONE Trends and inequalities in double burden of malnutrition in India
PLOS ONE | https://doi.org/10.1371/journal.pone.0247856 February 25, 2021 6 / 14
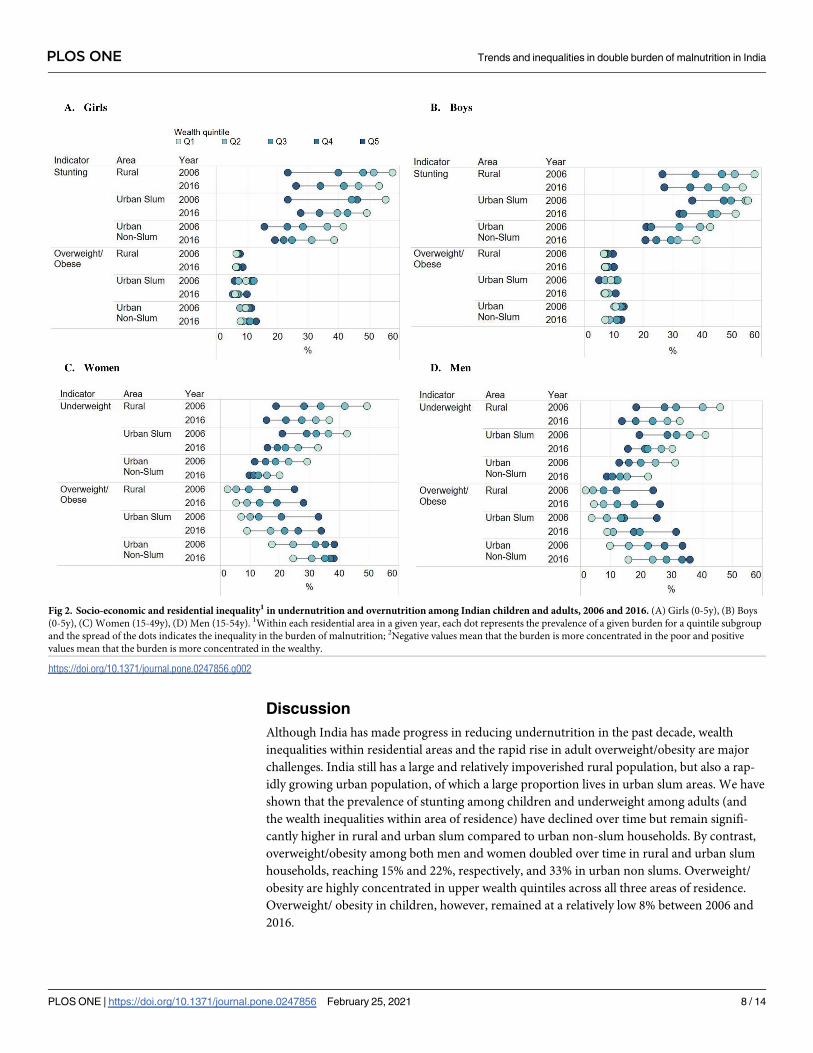
(Fig 2 and Table 3). Large wealth gaps (Q5 vs. Q1) were found among girls and boys in all resi-
dential areas and in both years (SII ranged from -33 to -19 pp). The inequality gaps in stunting
decreased between 2006 and 2016 in urban non-slum households but did not statistically sig-
nificant change over time for rural or urban slum households. Regarding overweight/ obese,
wealth gaps were small for children in both rural or urban slum households (SII: 0.8 to 7pp)
but increased slightly in urban non-slum households between 2006 and 2016.
Adult underweight affects the poor more than the rich across all residential areas and sur-
vey years, as shown by the equity plots and negative SII and CIX (Fig 2 and Table 3). The
wealth gaps in underweight among adults were large for all residential areas and in both years
(SII -22 to -35 pp in 2006 and -12 to -23 pp in 2016). The wealth gaps in adult underweight
were narrower in 2016 than in 2006 (p< 0.05) for both women and men in rural and non-
slum households, mainly due to improvements among the poor in these residential areas.
Both women and men across all wealth quintiles and residential areas are becoming more
overweight/obese over time, with the only exception of the highest quintile in urban non
slums who have stabilized at an alarmingly high prevalence of about 40% (Fig 2). The CIX val-
ues for adult overweight/ obesity were all positive, indicating that the problem was more con-
centrated in the high wealth quintile households. The differences between wealth groups were
large in all residential areas (SII: +16 to +29 pp) and increased between 2006 and 2016 in rural
(SII: +21 to +28 pp) and urban slum areas (SII: +22 to +29 pp) between 2006 and 2016 but
decreased in non-slum areas for both women and men (SII: +29 to +16 pp) (Table 3).
Fig 1. Prevalence and absolute change in undernutrition and overnutrition among Indians by residential area, 2006 to 2016. (A) Girls (0-5y) stunting, (B) Boys (0-5y)
stunting, (C) Girls (0-5y) overweight/obese, (D) Boys (0-5y) overweight/obese, (E) Women (15-49y) underweight, (F) Men (15-54y) underweight, (G) Women (15-49y)
overweight/obese, (H) Men (15-54y) overweight/obese.
https://doi.org/10.1371/journal.pone.0247856.g001
PLOS ONE Trends and inequalities in double burden of malnutrition in India
PLOS ONE | https://doi.org/10.1371/journal.pone.0247856 February 25, 2021 7 / 14
Discussion
Although India has made progress in reducing undernutrition in the past decade, wealth
inequalities within residential areas and the rapid rise in adult overweight/obesity are major
challenges. India still has a large and relatively impoverished rural population, but also a rap-
idly growing urban population, of which a large proportion lives in urban slum areas. We have
shown that the prevalence of stunting among children and underweight among adults (and
the wealth inequalities within area of residence) have declined over time but remain signifi-
cantly higher in rural and urban slum compared to urban non-slum households. By contrast,
overweight/obesity among both men and women doubled over time in rural and urban slum
households, reaching 15% and 22%, respectively, and 33% in urban non slums. Overweight/
obesity are highly concentrated in upper wealth quintiles across all three areas of residence.
Overweight/ obesity in children, however, remained at a relatively low 8% between 2006 and
2016.
Fig 2. Socio-economic and residential inequality1 in undernutrition and overnutrition among Indian children and adults, 2006 and 2016. (A) Girls (0-5y), (B) Boys
(0-5y), (C) Women (15-49y), (D) Men (15-54y). 1Within each residential area in a given year, each dot represents the prevalence of a given burden for a quintile subgroup
and the spread of the dots indicates the inequality in the burden of malnutrition; 2Negative values mean that the burden is more concentrated in the poor and positive
values mean that the burden is more concentrated in the wealthy.
https://doi.org/10.1371/journal.pone.0247856.g002
PLOS ONE Trends and inequalities in double burden of malnutrition in India
PLOS ONE | https://doi.org/10.1371/journal.pone.0247856 February 25, 2021 8 / 14
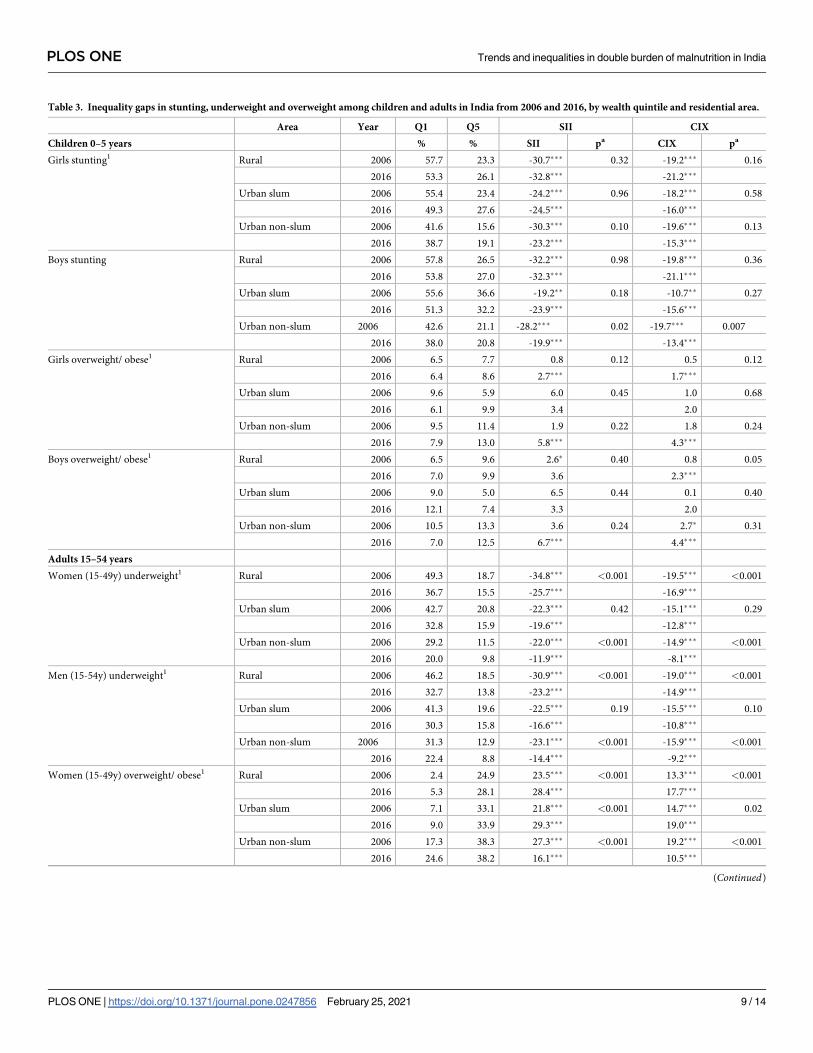
Table 3. Inequality gaps in stunting, underweight and overweight among children and adults in India from 2006 and 2016, by wealth quintile and residential area.
Area Year Q1 Q5 SII CIX
Children 0–5 years % % SII pa CIX pa
Girls stunting1 Rural 2006 57.7 23.3 -30.7��� 0.32 -19.2��� 0.16
2016 53.3 26.1 -32.8��� -21.2���
Urban slum 2006 55.4 23.4 -24.2��� 0.96 -18.2��� 0.58
2016 49.3 27.6 -24.5��� -16.0���
Urban non-slum 2006 41.6 15.6 -30.3��� 0.10 -19.6��� 0.13
2016 38.7 19.1 -23.2��� -15.3���
Boys stunting Rural 2006 57.8 26.5 -32.2��� 0.98 -19.8��� 0.36
2016 53.8 27.0 -32.3��� -21.1���
Urban slum 2006 55.6 36.6 -19.2�� 0.18 -10.7�� 0.27
2016 51.3 32.2 -23.9��� -15.6���
Urban non-slum 2006 42.6 21.1 -28.2��� 0.02 -19.7��� 0.007
2016 38.0 20.8 -19.9��� -13.4���
Girls overweight/ obese1 Rural 2006 6.5 7.7 0.8 0.12 0.5 0.12
2016 6.4 8.6 2.7��� 1.7���
Urban slum 2006 9.6 5.9 6.0 0.45 1.0 0.68
2016 6.1 9.9 3.4 2.0
Urban non-slum 2006 9.5 11.4 1.9 0.22 1.8 0.24
2016 7.9 13.0 5.8��� 4.3���
Boys overweight/ obese1 Rural 2006 6.5 9.6 2.6� 0.40 0.8 0.05
2016 7.0 9.9 3.6 2.3���
Urban slum 2006 9.0 5.0 6.5 0.44 0.1 0.40
2016 12.1 7.4 3.3 2.0
Urban non-slum 2006 10.5 13.3 3.6 0.24 2.7� 0.31
2016 7.0 12.5 6.7��� 4.4���
Adults 15–54 years
Women (15-49y) underweight1 Rural 2006 49.3 18.7 -34.8��� <0.001 -19.5��� <0.001
2016 36.7 15.5 -25.7��� -16.9���
Urban slum 2006 42.7 20.8 -22.3��� 0.42 -15.1��� 0.29
2016 32.8 15.9 -19.6��� -12.8���
Urban non-slum 2006 29.2 11.5 -22.0��� <0.001 -14.9��� <0.001
2016 20.0 9.8 -11.9��� -8.1���
Men (15-54y) underweight1 Rural 2006 46.2 18.5 -30.9��� <0.001 -19.0��� <0.001
2016 32.7 13.8 -23.2��� -14.9���
Urban slum 2006 41.3 19.6 -22.5��� 0.19 -15.5��� 0.10
2016 30.3 15.8 -16.6��� -10.8���
Urban non-slum 2006 31.3 12.9 -23.1��� <0.001 -15.9��� <0.001
2016 22.4 8.8 -14.4��� -9.2���
Women (15-49y) overweight/ obese1 Rural 2006 2.4 24.9 23.5��� <0.001 13.3��� <0.001
2016 5.3 28.1 28.4��� 17.7���
Urban slum 2006 7.1 33.1 21.8��� <0.001 14.7��� 0.02
2016 9.0 33.9 29.3��� 19.0���
Urban non-slum 2006 17.3 38.3 27.3��� <0.001 19.2��� <0.001
2016 24.6 38.2 16.1��� 10.5���
(Continued)
PLOS ONE Trends and inequalities in double burden of malnutrition in India
PLOS ONE | https://doi.org/10.1371/journal.pone.0247856 February 25, 2021 9 / 14
India’s progress in reducing stunting among children aged 0–59 months (48% to 38%)
likely reflects improvements in income and socioeconomic status, parental education, access
to health services and improvements in water and sanitation [25]. We now show that stunting
is almost as prevalent in urban slums as in rural households and, relative to these two areas,
lower in urban non-slum households. Between 2006 and 2016, wealth inequalities in stunting
declined in urban non-slum households but persisted in rural and urban slum households.
Our findings highlight the precarious health and nutrition conditions of children living in
poor urban households and call for renewed efforts to reduce inequalities in access to social
and health programs for both urban slum and rural households [11]. Strategies to improve
health and nutrition for urban slum households should be tailored to the specific needs of
these populations and should be mainstreamed in the implementation of the Sustainable
Development Goals and the New Urban Agenda [4].
Among adult men and women, we found large reductions in underweight from 2006 to
2016, especially in rural and urban slum areas, but a doubling in overweight/obesity over the
same period. This is consistent with the global trend observed in LMICs, where the prevalence
of underweight has declined substantially in the past few decades whereas rates of overweight/
obesity have increased [6]. We found an 8 pp increase in prevalence of overweight/obesity
among Indian women (from 12.5% to 20.5%), compared to 5.6 pp among adult women in
LMICs (from 24.4% to 30%) or 4.8 pp among adult women worldwide (from 34.4% to 39.2%)
[26]. In our study, the relative increase in overweight/obesity was greater in rural compared to
urban slum or urban non-slum households, a finding consistent with results from a previous
report for women in LMICs [27]. The highest prevalence of adult overweight/obesity in India
is currently found in urban non-slum households (at 33% for women and 29% for men) but, if
past trends continue, rural and urban slum dwellers will quickly catch up to their urban coun-
terparts. These findings point to the emergence of a significant double-burden of undernutri-
tion and overnutrition in both rural and urban slum areas.
We also found large but narrowing wealth inequalities over time in underweight prevalence
in all three residential areas, with similar patterns across adult men and women. India is
unusual, compared to other countries, in having a high prevalence of underweight among
both men and women, and a similar pattern emerging for overweight/obesity in 2016 which is
only slightly lower among men (e.g. 22% and 19% in women and men living in urban slums
and 33% and 29% respectively among those living in urban non-slums). Typically, overweight
prevalence is higher among women compared to men at early stages of the nutrition transition
[28, 29]; for example, women’s overweight prevalence in 2016 exceeds that of men’s by 16pp in
Africa (39% vs 23%) and by 13pp in LMICs (32% vs.19%) [26]. These differences are mainly
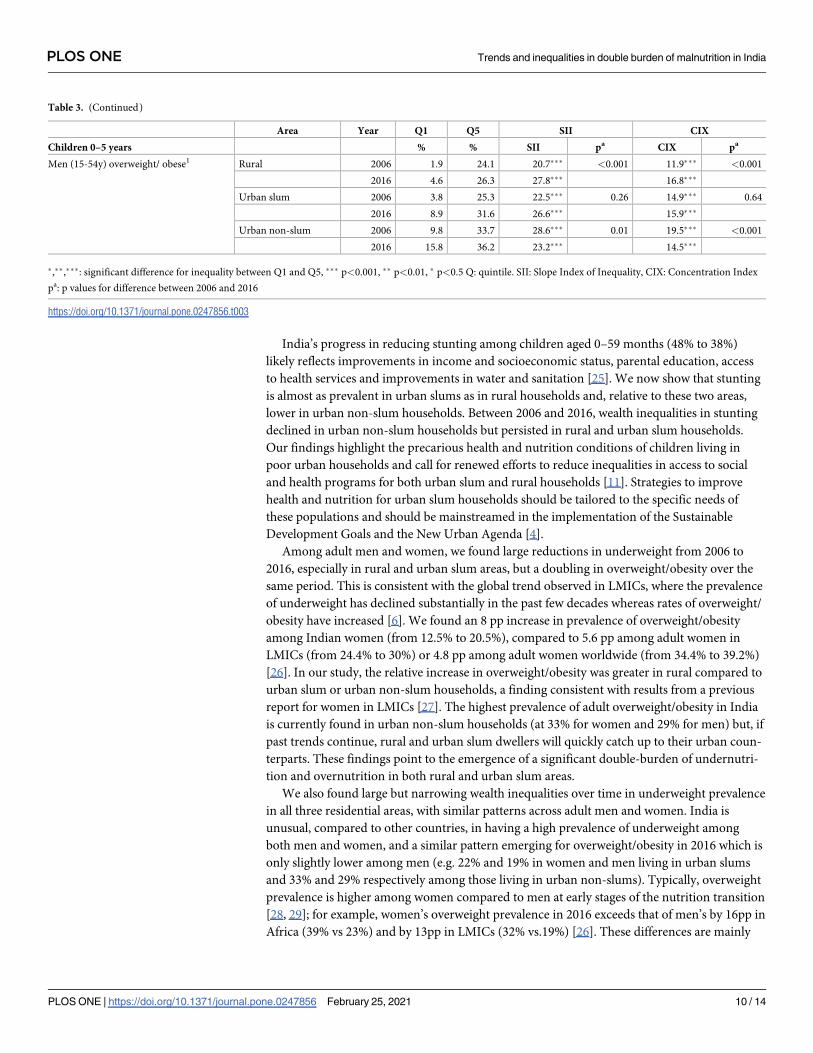
Table 3. (Continued)
Area Year Q1 Q5 SII CIX
Children 0–5 years % % SII pa CIX pa
Men (15-54y) overweight/ obese1 Rural 2006 1.9 24.1 20.7��� <0.001 11.9��� <0.001
2016 4.6 26.3 27.8��� 16.8���
Urban slum 2006 3.8 25.3 22.5��� 0.26 14.9��� 0.64
2016 8.9 31.6 26.6��� 15.9���
Urban non-slum 2006 9.8 33.7 28.6��� 0.01 19.5��� <0.001
2016 15.8 36.2 23.2��� 14.5���
�,��,���: significant difference for inequality between Q1 and Q5, ��� p<0.001, �� p<0.01, � p<0.5 Q: quintile. SII: Slope Index of Inequality, CIX: Concentration Index
pa: p values for difference between 2006 and 2016
https://doi.org/10.1371/journal.pone.0247856.t003
PLOS ONE Trends and inequalities in double burden of malnutrition in India
PLOS ONE | https://doi.org/10.1371/journal.pone.0247856 February 25, 2021 10 / 14

due to different contextual factors that drive gender differences in food consumption, physical
activity, sedentary lifestyles, and sociocultural preferences and beliefs [28, 29]. We do not find
any hypothesis to explain why women are not more overweight/obese than men in India.
While improvements in income and SES are key economic drivers of reductions in under-
weight among adults, these improvements are also contributing to the rapid rises in over-
weight/obesity [8, 30, 31]. A recent study in India showed that improvements in socio-
economic status between 2006 and 2016 explain 29% of the reduction in underweight and 46%
of the increase in overweight/obesity [8]. As incomes rise, people consume more diverse foods,
a positive change, but also increase their consumption of processed foods and meals consumed
away from home, thereby increasing their intake of energy, saturated fats and oils, added sug-
ars, and salt [6]. Urbanization and economic growth are also typically associated with reduc-
tions in physical activity at work, in daily commute, and in leisure [6], which exacerbate the
effects of increased energy consumption on overweight/obesity and diet-related non-commu-
nicable diseases.
India has a robust policy framework to address malnutrition in all forms [32]. Several evi-
dence-based nutrition interventions in the first 1000 days are delivered through a wide range
of national programs, including the Integrated Child Development Services, National Health
Mission, Mid-Day Meal Scheme, Targeted Public Distribution System, and National Food
Security Mission, among others. The 2017 National Nutrition Strategy [33] and POSHAN
Abhiyaan, India’s national nutrition mission launched in early 2018, provide an updated stra-
tegic framework for action to improve nutritional outcomes by holistically addressing the mul-
tiple determinants of malnutrition through cross-sectoral convergence and contextualized
planning at each level of the implementation process. Many policies and programs are heavily
focused on undernutrition and on the rural poor given the historically high rates of maternal
and child undernutrition especially in rural areas and the generally low prevalence of overnu-
trition. For example, early expansion of the National Rural Health Mission created more
opportunities in rural areas than in urban areas [34] and the ICDS platform has expanded
more in rural than urban areas between 2006 and 2016 [35]. It is now time for India to focus
on all forms of malnutrition and on tackling the unique nutrition and health problems and
inequalities of urban populations, especially those living in urban slums. New strategies need
to shift to a focus on all forms of malnutrition, including undernutrition and micronutrient
deficiencies as well as overnutrition (overweight and obesity and diet-related non-communica-
ble diseases). Such interventions–referred to as “double-duty actions” [36, 37] have the poten-
tial to simultaneously tackle multiple forms of malnutrition and also prevent unintended
negative consequences on overweight and obesity that has been shown to arise from programs
aimed at reducing food insecurity and undernutrition in countries undergoing a rapid nutri-
tion transition [38].
One potential limitation of this study relates to the definition of slums. Because there is no wide-
spread consensus on the definition of slums, we used a definition that bears similarities to many
others used in the empirical literature on slums, but we cannot rule out the possibility that our
results may be sensitive to the choice of definition. With our definition, we found that 5% of the
sample was classified as living in urban slum areas, which is consistent with the government esti-
mates of 5.4% [3]. However, there is still uncertainty surrounding the true population-level preva-
lence of slum dwellers, making it difficult to validate our definition. One advantage of the NHFS is
that it over-sampled slum areas of eight major cities, but it may have under-sampled slums in
other urban centers of India. Another limitation is that our child-level analysis is restricted to chil-
dren under five years old, whereas overweight prevalence may emerge in later childhood.
Due to the widespread burden of malnutrition and its importance for public health,
research in India has increasingly focused on this topic, but studies have typically examined
PLOS ONE Trends and inequalities in double burden of malnutrition in India
PLOS ONE | https://doi.org/10.1371/journal.pone.0247856 February 25, 2021 11 / 14

the effects of residential area [11, 39, 40] or socioeconomic status [30, 41, 42] separately. Our
study is novel in examining the evolution of the double burden of malnutrition across distinct
areas of residence and wealth quintiles within area. We use two rounds of large nationally rep-
resentative data sets to explore trends and inequalities for both undernutrition and overnutri-
tion for both children and adults. NFHS has several strengths in this regard, including
standard measures of anthropometry and consistent scope for SES measures through well-
established asset indices [22]. For inequality analyses, we used complex measures (SII and
CIX) that account for the overall frequency and change in the outcomes over time and include
weighting by sample size.
Conclusion
The profile of malnutrition in India is changing rapidly, with progress on several indicators of
undernutrition but rapidly rising rates of overweight/obesity, especially among adults. In addi-
tion to this double burden of malnutrition, India is characterized by significant health inequal-
ities across socioeconomic groups and areas of residence and has made very limited progress
in redressing these inequalities. The persistence of undernutrition alongside rising overweight/
obesity suggests that India needs to develop new nutrition strategies that prioritize double-
duty actions [36]. Potential interventions to consider in the Indian context include measures
to promote positive changes in diets and physical activity, interventions to stimulate the
demand for nutritious foods complemented by agri-food system innovation to increase their
affordability, and regulatory approaches to discourage production, marketing and consump-
tion of unhealthy, ultra-processed foods, beverages, and snacks. Future research should con-
sider the efficacy of double duty actions to address both undernutrition and overweight/
obesity and contextualize these actions to India’s diverse socioeconomic and environmental
circumstances.
Supporting information
S1 File.
(DOCX)
Author Contributions
Conceptualization: Phuong Hong Nguyen, Samuel Scott, Purnima Menon, Marie T. Ruel.
Data curation: Phuong Hong Nguyen, Nishmeet Singh, Lan Mai Tran, Marie T. Ruel.
Formal analysis: Phuong Hong Nguyen, Nishmeet Singh, Lan Mai Tran.
Funding acquisition: Purnima Menon.
Investigation: Phuong Hong Nguyen, Purnima Menon, Marie T. Ruel.
Methodology: Phuong Hong Nguyen, Derek Headey, Nishmeet Singh, Lan Mai Tran, Marie
T. Ruel.
Supervision: Marie T. Ruel.
Validation: Derek Headey, Lan Mai Tran.
Visualization: Phuong Hong Nguyen, Samuel Scott, Nishmeet Singh, Lan Mai Tran.
Writing – original draft: Phuong Hong Nguyen, Samuel Scott.
PLOS ONE Trends and inequalities in double burden of malnutrition in India
PLOS ONE | https://doi.org/10.1371/journal.pone.0247856 February 25, 2021 12 / 14

Writing – review & editing: Phuong Hong Nguyen, Samuel Scott, Derek Headey, Purnima
Menon, Marie T. Ruel.
References1. United Nations. Department of Economic and Social Affairs, Population Division. World Urbanization
Prospects: The 2018 Revision, Online Edition. 2018.
2. Lancet The. Health in slums: understanding the unseen. Lancet 2017; 389:478. https://doi.org/10.
1016/S0140-6736(17)30266-0 PMID: 28170319
3. Government of India: Slums in India. A statistical Compendium 2015. In. New Delhi, India: Government
of India. Ministry of Housing and Urban Porverty Alleviation. National Building Organisation; 2015.
4. Ezeh A, Oyebode O, Satterthwaite D, Chen YF, Ndugwa R, Sartori J, et al. The history, geography, and
sociology of slums and the health problems of people who live in slums. Lancet 2017; 389:547–558.
https://doi.org/10.1016/S0140-6736(16)31650-6 PMID: 27760703
5. Ruel MT, Garrett J, Yosef S, Olivier M: Urbanization, Food Security and Nutrition. In: Nutrition and
Health in a Developing World. Edited by de Pee S, Taren D, Bloem MW. Humana Press, Cham 2017.
6. Popkin BM, Corvalan C, Grummer-Strawn LM. Dynamics of the double burden of malnutrition and the
changing nutrition reality. Lancet 2020; 395:65–74. https://doi.org/10.1016/S0140-6736(19)32497-3
PMID: 31852602
7. Corsi DJ, Mejia-Guevara I, Subramanian SV. Risk factors for chronic undernutrition among children in
India: Estimating relative importance, population attributable risk and fractions. Soc Sci Med 2016;
157:165–185. https://doi.org/10.1016/j.socscimed.2015.11.014 PMID: 26625852
8. Young MF, Nguyen P, Tran LM, Avula R, Menon P. A Double Edged Sword? Improvements in Eco-
nomic Conditions over a Decade in India Led to Declines in Undernutrition as Well as Increases in Over-
weight among Adolescents and Women. J Nutr 2020; 150:364–372. https://doi.org/10.1093/jn/nxz251
PMID: 31618429
9. Arokiasamy P, Jain K, Goli S, Pradhan J. Health inequalities among urban children in India: a compara-
tive assessment of Empowered Action Group (EAG) and South Indian states. J Biosoc Sci 2013;
45:167–185. https://doi.org/10.1017/S0021932012000211 PMID: 22643297
10. Goli S, Doshi R, Perianayagam A. Pathways of economic inequalities in maternal and child health in
urban India: a decomposition analysis. PLoS One 2013; 8:e58573. https://doi.org/10.1371/journal.
pone.0058573 PMID: 23555587
11. Usmani G, Ahmad N. Health status in India: A study of urban slum and non-slum population. J Nurs Res
Pract 2018; 2:09–14.
12. Prakash R, Kumar A. Urban poverty and utilization of maternal and child health care services in India. J
Biosoc Sci 2013; 45:433–449. https://doi.org/10.1017/S0021932012000831 PMID: 23410254
13. Kusuma YS, Pal M, Babu BV. Health Insurance: Awareness, Utilization, and its Determinants among
the Urban Poor in Delhi, India. J Epidemiol Glob Health 2018; 8:69–76. https://doi.org/10.2991/j.jegh.
2018.09.004 PMID: 30859791
14. Goli S, Arokiasamy P, Chattopadhayay A. Living and health conditions of selected cities in India: Setting
priorities for the National Urban Health Mission. Cities 2011; 28:461–469.
15. Saroj S, Goli S, Rana M, Choudhary B. Availability, accessibility, and inequalities of water, sanitation,
and hygiene (WASH) services in Indian metro cities. Sustainable Cities and Society 2020; 1;
54:101878.
16. IIPS. International Institute for Population Sciences (IIPS) and Macro International. National Family
Health Survey (NFHS-3), 2005–06: India. Mumbai: IIPS. 2007.
17. IIPS. International Institute for Population Sciences and ICF. National Family Health Survey (NFHS-4),
2015–16: India. Mumbai: IIPS. 2017.
18. WHO Expert Consultation. Appropriate body-mass index for Asian populations and its implications for
policy and intervention strategies. Lancet 2004; 363:157–163. https://doi.org/10.1016/S0140-6736(03)
15268-3 PMID: 14726171
19. Census of India. Office of the Registrar General and Census Commissioner, Ministry of Home Affairs,
Government of India. Census of India. http://censusindia.gov.in/2011-Common/CensusData2011.html
2011.
20. UN-Habitat: The challenge of slums: global report on human settlements, 2003 / United Nations Human
Settlements Programme. Earthscan Publications Ltd. London and Sterling, VA; 2003.
21. Nolan LB. Slum Definitions in Urban India: Implications for the Measurement of Health Inequalities.
Popul Dev Rev 2015; 41:59–84. https://doi.org/10.1111/j.1728-4457.2015.00026.x PMID: 26877568
PLOS ONE Trends and inequalities in double burden of malnutrition in India
PLOS ONE | https://doi.org/10.1371/journal.pone.0247856 February 25, 2021 13 / 14
22. Filmer D, Pritchett LH. Estimating wealth effects without expenditure data—or tears: an application to
educational enrollments in states of India. Demography 2001; 38:115–132. https://doi.org/10.1353/
dem.2001.0003 PMID: 11227840
23. WHO: Handbook on health inequality monitoring with a special focus on low-and middle-income coun-
tries. Geneva: World Health Organization; 2013.
24. Barros AJ, Victora CG. Measuring coverage in MNCH: determining and interpreting inequalities in cov-
erage of maternal, newborn, and child health interventions. PLoS Med 2013; 10:e1001390. https://doi.
org/10.1371/journal.pmed.1001390 PMID: 23667332
25. Menon P, Headey D, Avula R, Nguyen PH. Understanding the geographical burden of stunting in India:
A regression-decomposition analysis of district-level data from 2015–16. Matern Child Nutr 2018; 14:
e12620. https://doi.org/10.1111/mcn.12620 PMID: 29797455
26. WHO: Global Health Observatory data repository. Prevalence of overweight among adults, BMI� 25,
age-standardized. In. https://apps.who.int/gho/data/view.main.BMI25AWBv?lang=en. Accessed April
12, 2020: World Health Organization; 2020.
27. Jaacks LM, Slining MM, Popkin BM. Recent underweight and overweight trends by rural-urban resi-
dence among women in low- and middle-income countries. J Nutr 2015; 145:352–357. https://doi.org/
10.3945/jn.114.203562 PMID: 25644358
28. Garawi F, Devries K, Thorogood N, Uauy R. Global differences between women and men in the preva-
lence of obesity: is there an association with gender inequality? Eur J Clin Nutr 2014; 68:1101–1106.
https://doi.org/10.1038/ejcn.2014.86 PMID: 24918120
29. Kanter R, Caballero B. Global gender disparities in obesity: a review. Adv Nutr 2012; 3:491–498.
https://doi.org/10.3945/an.112.002063 PMID: 22797984
30. Dutta M, Selvamani Y, Singh P, Prashad L. The double burden of malnutrition among adults in India:
evidence from the National Family Health Survey-4 (2015–16). Epidemiol Health 2019; 41:e2019050.
https://doi.org/10.4178/epih.e2019050 PMID: 31962037
31. Gouda J, Prusty RK. Overweight and obesity among women by economic stratum in urban India. J
Health Popul Nutr 2014; 32:79–88. PMID: 24847596
32. Vir S, Sreenath K, Bose V, Chauhan K, Mathur S, Menon S. Understanding the Landscape of National
Policies and Strategic Plans to Tackle Undernutrition in India: A Review. http://ebrary.ifpri.org/utils/
getfile/collection/p15738coll2/id/128090/filename/128301.pdf. 2013.
33. NITI Aayog. Nourishing Iindia. National Nutrition Strategy. Government of India. https://niti.gov.in/
writereaddata/files/document_publication/Nutrition_Strategy_Booklet.pdf. 2017.
34. Nandan D: National Rural Health Mission. In: Public Health Nutrition in Developing Countries. Edited by
Vir SC. India: Woodhead Pub. India Pvt. Limited; 2011: 1195–1213.
35. Chakrabarti S, Raghunathan K, Alderman H, Menon P, Nguyen P. India’s Integrated Child Development
Services programme; equity and extent of coverage in 2006 and 2016. Bull World Health Organ 2019;
97:270–282. https://doi.org/10.2471/BLT.18.221135 PMID: 30940984
36. Hawkes C, Ruel MT, Salm L, Sinclair B, Branca F. Double-duty actions: seizing programme and policy
opportunities to address malnutrition in all its forms. Lancet 2020; 395:142–155. https://doi.org/10.
1016/S0140-6736(19)32506-1 PMID: 31852603
37. WHO. Double-duty actions for nutrition. Policy Brief. https://apps.who.int/iris/bitstream/handle/10665/
255414/WHO-NMH-NHD-17.2-eng.pdf. Accessed July 19, 2020. 2020.
38. Hawkes C, Ruel MT, Salm L, Sinclair B, Branca F. Double-duty actions: seizing programme and policy
opportunities to address malnutrition in all its forms. Lancet 2019. https://doi.org/10.1016/S0140-6736
(19)32506-1 PMID: 31852603
39. Portner CC, Su YH. Differences in Child Health Across Rural, Urban, and Slum Areas: Evidence From
India. Demography 2018; 55:223–247. https://doi.org/10.1007/s13524-017-0634-7 PMID: 29192387
40. Vennu V, Abdulrahman TA, Bindawas SM. The Prevalence of Overweight, Obesity, Hypertension, and
Diabetes in India: Analysis of the 2015–2016 National Family Health Survey. Int J Environ Res Public
Health 2019; 16.
41. Corsi DJ, Subramanian SV. Socioeconomic Gradients and Distribution of Diabetes, Hypertension, and
Obesity in India. JAMA Netw Open 2019; 2:e190411. https://doi.org/10.1001/jamanetworkopen.2019.
0411 PMID: 30951154
42. Luhar S, Mallinson PAC, Clarke L, Kinra S. Trends in the socioeconomic patterning of overweight/obe-
sity in India: a repeated cross-sectional study using nationally representative data. BMJ Open 2018; 8:
e023935. https://doi.org/10.1136/bmjopen-2018-023935 PMID: 30344181
PLOS ONE Trends and inequalities in double burden of malnutrition in India
PLOS ONE | https://doi.org/10.1371/journal.pone.0247856 February 25, 2021 14 / 14