The document title is Arial, 28-point bold, italics. …© Copyright Datalogic 2007-2011 2...
56
© Copyright Datalogic 2007-2011 Datalogic Group STAR Conference 2011 – Milan March 23 rd , 2011
Transcript of The document title is Arial, 28-point bold, italics. …© Copyright Datalogic 2007-2011 2...

© Copyright Datalogic 2007-2011
Datalogic Group
STAR Conference 2011 – Milan
March 23rd, 2011

© Copyright Datalogic 2007-2011 22
DISCLAIMER
This document has been prepared by Datalogic S.p.A. (the "Company") for use during meetings with investors and financial analysts and is
solely for information purposes. The information set out herein has not been verified by an independent audit company.
Neither the Company nor any of its subsidiaries, affiliates, branches, representative offices (the “Group”), as well as any of their directors,
officers, employees, advisers or agents (the “Group Representatives”) accepts any responsibility for/or makes any representation or warranty,
express or implied, as to the accuracy, timeliness or completeness of the information set out herein or any other related information regarding
the Group, whether written, oral or in visual or electronic form, transmitted or made available.
This document may contain forward-looking statements about the Company and/or the Group based on current expectations and opinions
developed by the Company, as well as based on current plans, estimates, projections and projects of the Group. These forward-looking
statements are subject to significant risks and uncertainties (many of which are outside the control of the Company and/or the Group)
which could cause a material difference between forward-looking information and actual future results.
The information set out in this document is provided as of the date indicated herein. Except as required by applicable laws and regulations, the
Company assumes no obligation to provide updates of any of the aforesaid forward-looking statements.
Under no circumstances shall the Group and/or any of the Group Representatives be held liable (for negligence or otherwise)
for any loss or damage howsoever arising from any use of this document or its contents or otherwise in connection with the
document or the aforesaid forward-looking statements.
This document does not constitute an offer to sell or a solicitation to buy or subscribe to Company shares and neither this entire
document or a portion of it may constitute a recommendation to effect any transaction or to conclude any legal act of any kind whatsoever.
This document may not be reproduced or distributed, in whole or in part, by any person other than the Company.
By viewing and/or accepting a copy of this document, you agree to be bound by the foregoing limitations.

© Copyright Datalogic 2007-2011 33
THE GROUP
STRATEGIC GUIDELINES
FINANCIAL DATA
APPENDIX

© Copyright Datalogic 2007-2011 44
Bringing the Future
into Daily Life
4

© Copyright Datalogic 2007-2011
Global applications,
at any given moment
Paris, France 3.00 p.m.
over 53 million passengers and their
baggage are handled each year in the
Roissy Charles de Gaulle airport,
a challenge won for our identification
solutions
5

© Copyright Datalogic 2007-2011 6
Global applications,
at any given moment
Rome, Italy 10.00 a.m.
over 33 million passengers a year and
their baggage are handled by a baggage
tracking system at Fiumicino Airport,
a challenge won for our identification
solutions
6

© Copyright Datalogic 2007-2011 7
Global applications,
at any given moment
Toronto, Ontario, Canada 9.00 a.m.
over 10 billion letters and packages
are delivered annually to 31 million
Canadians by Canada Post,
excellent performance for our
scanners and camera systems
7

© Copyright Datalogic 2007-2011 8
Global applications,
at any given moment
9 major Cities in the U.S.A. 3.00 p.m.
over 360,000 trays per day are processed
by a state-of-the-art system at USPS
(United States Postal Service),
excellent performance for our 2D Imagers
8

© Copyright Datalogic 2007-2011 9
Global applications,
at any given moment
Isle of Man, 11.00 a.m.
several deliveries on behalf of several
major third party parcel carriers are made
by the Isle of Man post office every day,
our industrial PDAs allow all delivery
information to be accessed in real time,
streamlining the delivery process
9

© Copyright Datalogic 2007-2011 10
Global applications,
at any given moment
Milano, Italy 11.00 p.m.
no more baby swapping at the “Vittore
Buzzi” Children’s Hospital that has
chosen professional PDAs to read RFID
wristbands and ensure that every mom
gets her own baby,
a challenge won for our mobile
computers
10
© Copyright Datalogic 2007-2011 11
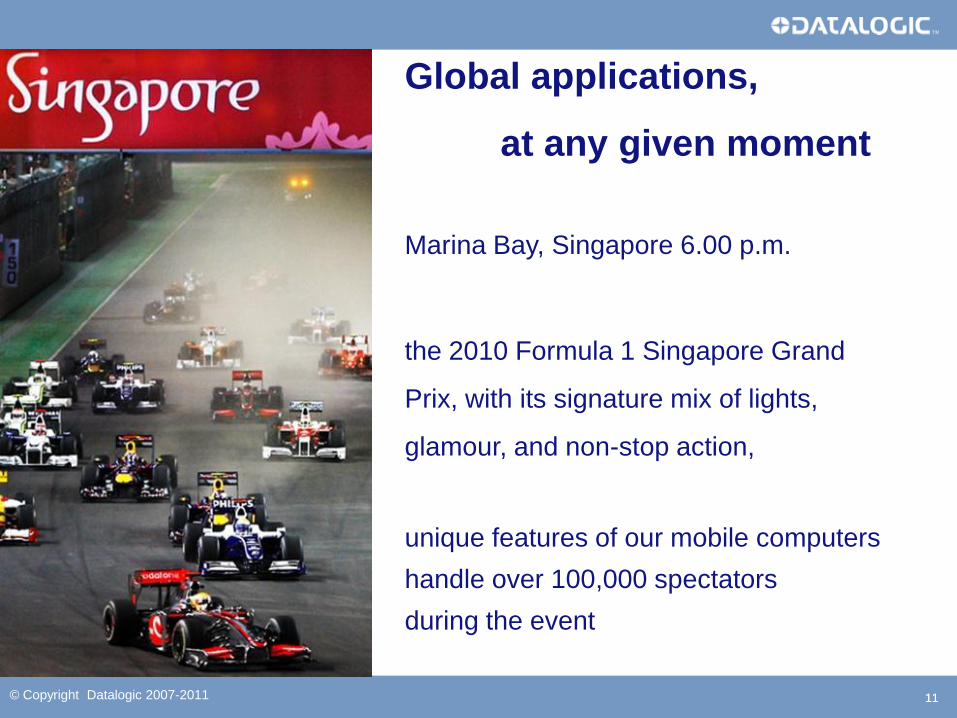
Global applications,
at any given moment
Marina Bay, Singapore 6.00 p.m.
the 2010 Formula 1 Singapore Grand
Prix, with its signature mix of lights,
glamour, and non-stop action,
unique features of our mobile computers
handle over 100,000 spectators
during the event
11
© Copyright Datalogic 2007-2011 12
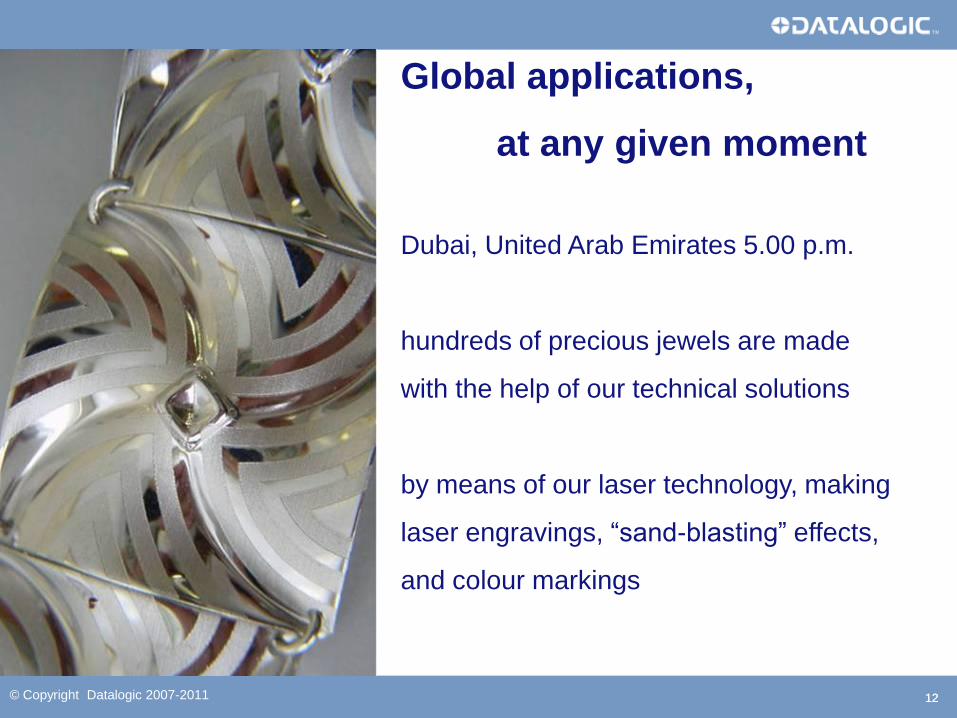
Global applications,
at any given moment
Dubai, United Arab Emirates 5.00 p.m.
hundreds of precious jewels are made
with the help of our technical solutions
by means of our laser technology, making
laser engravings, “sand-blasting” effects,
and colour markings
12

© Copyright Datalogic 2007-2011 13
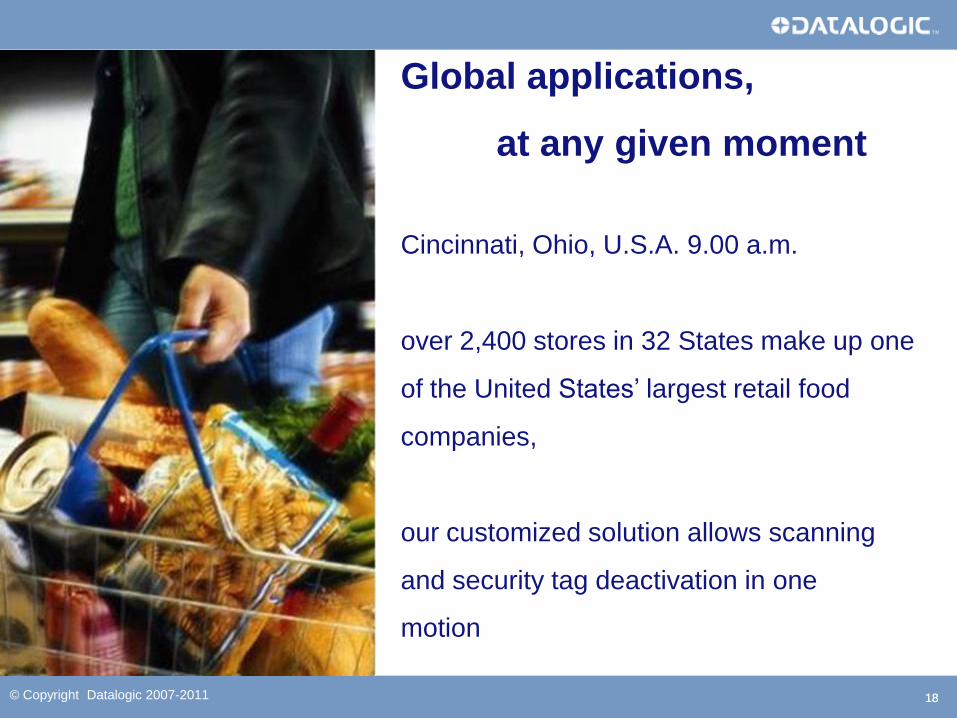
Global applications,
at any given moment
Jijona, Alicante, Spain 3.00 p.m.
every 20 minutes 33 pallets are loaded
onto trucks in the shipping area
of a consumer goods corporation,
0% error margin, thanks to our RFID
tags
13

© Copyright Datalogic 2007-2011 14
Global applications,
at any given moment
Cuautitlan, Mexico 8.00 a.m.
400,000 trucks and cars are produced
each year in one of the largest facilities of
an American automotive corporation,
just-in-time production method is
supported by our RFID products
14

© Copyright Datalogic 2007-2011 15
Global applications,
at any given moment
Sacramento, California 12.00 a.m.
no more missing labels for 8 million food
items per day in one of the major food
companies, Campbell Soup,
a challenge won by our identification
solutions
15

© Copyright Datalogic 2007-2011
Global applications,
at any given moment
Älmhult, Sweden 3.00 p.m.
180,000 cubic meters is the storage
volume of the world’s largest warehouse
of a famous Swedish furniture retailer,
this, and its furniture stores all over the world
result in success for our industrial handheld
readers, scanners and mobile computers
16

© Copyright Datalogic 2007-2011 17
Global applications,
at any given moment
Carteret, New Jersey, U.S.A. 9.00 a.m.
24 hours a day, 7 days a week in over
140 stores is the service offered by one of
the leading supermarket retailers of the
nation,
an efficient and effective front-end system
with our POS bar code scanners
17
© Copyright Datalogic 2007-2011 18
Global applications,
at any given moment
Cincinnati, Ohio, U.S.A. 9.00 a.m.
over 2,400 stores in 32 States make up one
of the United States’ largest retail food
companies,
our customized solution allows scanning
and security tag deactivation in one
motion
18

© Copyright Datalogic 2007-2011 19
Global applications,
at any given moment
Saint Tropez, France 12.00 a.m.
over 100 Casino Group stores use
the Shopevolution self-shopping
system
Shopevolution helps retailers
increase sales and decrease TCO
19

© Copyright Datalogic 2007-2011 20
Global applications,
at any given moment
Los Angeles, California 3.00 p.m.
scanning packaged goods, without having
to see the barcode, happens over a million
times a day with deployment of the
LaneHawk system in grocery stores,
reducing front end shrink and increasing
store profits
20
© Copyright Datalogic 2007-2011 2121
Worldwide leader in the Automatic Data Capture (ADC) and
Industrial Automation (IA) markets
Clear vision and strong commitment to create value
Solid financial structure and strong cash generation to
sustain future growth
Innovation and Research to beat the uncertain market
scenario
Growth potential in emerging markets
Experienced management team with proven capability in
company integration
Investment Highlights
21

© Copyright Datalogic 2007-2011 22
World-class producer of bar code readers, data
collection mobile computers, RFID and vision
systems
Datalogic offers innovative solutions for a
comprehensive range of applications in the
manufacturing, retail, transportation & logistics
markets
2010 Revenues at €393M of which 68% in the ADC
Market and 23% in the Industrial Automation
Market
Founded in 1972 in Bologna, Italy
Listed on the STAR Segment of the Italian Stock
Exchange since 2001
Over 2,000 employees
Direct presence in 30 countries worldwide selling
to +100 countries
+1,000 partners worldwide
Datalogic at a Glance
22

© Copyright Datalogic 2007-2011 2323
Completed transformation into
3 divisions: Scanning, Mobile,
and Automation
Acquisition of
Datasensor SpA
Listing on the Milan
Stock Exchange
Acquisition of Minec
AB (Sweden)
Acquisition of Laservall
SpA (AO, I)
Acquisition of Informatics
Inc. (TX, U.S.A.)
Acquisition of PSC Inc.
(OR, U.S.A.)
REVENUES: ~15% 2001-2010 CAGR
2010 SALES REVENUES (393 M Euro) UP BY 26% VS 2009
A History of Growth…
2001 2002 2003 20052004 2006 2007 2008 2009 2010
Acquisition of Evolution
Robotics Retail, USA

© Copyright Datalogic 2007-2011 24
Direct presence in 30 countries worldwide
7 Manufacturing Plants 9 R&D Centers
…with a Wide Geographical Footprint
2010 REVENUES – TOTAL €393M - BREAKDOWN BY AREA
EUROPE 40%
ITALY 11%
NORTH AMERICA 29%
ROW 7%
APAC 13%
24

© Copyright Datalogic 2007-2011 252525
Datalogic Group
AUTOMATIC DATA CAPTURE (ADC) MARKET INDUSTRIAL AUTOMATION MARKET BUSINESS DEVELOPMENT
Datalogic Scanning
HQ Eugene, OR, USA
B. Parnell - CEO
Datalogic Mobile
HQ Bologna, Italy
B. Parnell - CEO
Datalogic Automation
HQ Bologna, Italy
G. P. Fedrigo - CEO
Business Development
HQ Bologna, Italy
M. Sacchetto - CEO
Hand Held Scanners
BUSINESS UNIT
Retail POS Scanners
BUSINESS UNIT
Mobile Computers
BUSINESS UNIT
Identification
PRODUCT GROUP
Sensors
PRODUCT GROUP
Safety & Measurement
PRODUCT GROUP
Vision
PRODUCT GROUP
Laser Marking & Processing
BUSINESS UNIT
SMB Barcode Solutions
Informatics, Inc. USA
BUSINESS UNIT
Vision Systems
Evolution Robotics Retail Inc. USA
BUSINESS UNIT
Self Shopping Solutions - EBS
BUSINESS UNIT
25

© Copyright Datalogic 2007-2011 26
…leveraging strong commercial partnerships…
More than 1,000 partners worldwide
Longstanding relations with the biggest retailers, couriers and automotive manufacturers in the world
Over 360 installations of Self Shopping in Europe
Over 1,000 reading stations installed in more than 100 airports worldwide
…to better serve Global Clients
© Copyright Datalogic 2007-2010 26

© Copyright Datalogic 2007-2011 2727
Stock and Governance
Market Segment: STAR MTA
Ticker: DAL
Reuters Code: DAL.MI
Bloomberg Code: DAL IM
Number of Shares Outstanding: 58,446,491
Share Par-Value: € 0.52 each
SHAREHOLDERS’ STRUCTUREDATALOGIC PRICE PERFORMANCE
Price (March 18th ,2011): € 5.85
Market Cap (March 18th,2011): € 342 mln
Specialist: Intermonte SIM
Auditing Company: Ernst & Young
67.30%
17.37%
6.40%
6.90% 2.03%Hydra S.p.A.
Free Float
Tamburi Investment P.
Treasury Shares
D'Amico Società di Navigazione SPA
27
2.5
3.0
3.5
4.0
4.5
5.0
5.5
6.0
6.5
7.0
Dec 09
Jan 10
Feb 10
Mar 10
Apr 10
May 10
Jun 10
Jul 10
Aug 10
Sep 10
Oct 10
Nov 10
Dec 10
Jan 11
Feb 11
Mar 11
Datalogic FTSEMIB

© Copyright Datalogic 2007-2011 2828
THE GROUP
STRATEGIC GUIDELINES
FINANCIAL DATA
APPENDIX

© Copyright Datalogic 2007-2011
GLOBAL TRENDS
Technology shifts: analogue to digital; wireless technology
Globalization of the world economy
Increased focus on gaining efficiencies and cost reduction in supply chains
Greater safety and security concerns
2929
Reference Market Growth Trends
VALUE TO THE CUSTOMER
Better information, faster
Improved real time decision making
Operate more efficiently reducing operating expenses
Increase safety, security and compliance
Measurable, sustainable ROI
+8% average market growth* - 2010 through 2012
*Company’s estimates based on VDC 2010 (base year 2009) and other available data

© Copyright Datalogic 2007-2011
Factors driving demand:
shift to field mobility deployments
need to increase efficiency and overcome
scanning errors at the point of sale
growing list of emerging applications in the
government, healthcare and retail sectors
increased adoption of core retail automation
technologies in emerging country markets
enterprises require more data than ever to
effectively manage their supply chains
30
Source VDC 2010 (base year 2009)
ADC AVAILABLE MARKET
Worldwide Market Trend: ADC and IA
Very fragmented industry with potential
additional markets worth $2.7B
Factors driving demand:
increasing demand for traceability of processes
and goods
supply chain streamlining
new regulations (e.g. traceability, safety and
security)
increased adoption of technological solutions in
emerging markets
INDUSTRIAL AUTOMATION ADDRESSABLE
MARKET
$B
12.0% 10.7%
22.0% 20.5%
66.0%
68.8%
2009 2012E
POS RETAIL SCANNERS HAND HELD SCANNERS MOBILE COMPUTERS
3.6
2.9
CAGR 8%
19% 10%
41%19%
15%9%13%
8%12%
7%
47%
2009 2012E
IDENTIFICATION SENSOR
SAFETY VISION
LASERMARKING POTENTIAL ADDITIONAL MARKETS
2.3
5.6$B
CAGR 8%
2.9
2.7
30

© Copyright Datalogic 2007-2011 3131
Datalogic Positioning in ADC Available Market
2009 ADC Available Market: 9.8% Market Share
Datalogic market shares
POS Retail Scanners
#1 WW – 31.5% mkt share
Handheld Scanners
#1 in EMEA - 30.7% mkt share
#3 WW -15.9% mkt share
Mobile Computers
#4 in EMEA - 7.9% mkt share
#4 WW - 4.0% mkt share
2009 ADC Available Market including POS Retail Scanners, Hand Held Scanners and Mobile Computers (Hand Held
and PDA) segments
Source VDC 2010 (base year 2009)
2009 M
ark
et S
ha
re
$100 M $300 M $950 M
>30%
>10%
<2%
4%
$200 M
2009 Revenues
$50 M
31

© Copyright Datalogic 2007-2011 32
Datalogic Positioning in IA Available Market
2009 IA (Industrial Automation) Available Market:
3.7% Market Share
Datalogic market shares(*)
Industrial Stationary
Scanners
#2 in EMEA - 29% mkt share
#3 WW - 14.6% mkt share
2009 IA Available Market including Barcode Scanners, Imagers, RFID Industrial Readers and Tags, Photoelectric
Sensors, Safety Light Curtains, Smart Cameras/Vision Sensors and Low Power Lasermarking segments
Source (*) VDC 2010 - Market Researches and Datalogic Automation Management's Best Estimate
2009 M
ark
et S
ha
re 10%
>12%
5%
<2%
$50 M $100 M $200 M $300 M
2009 Revenues
32

© Copyright Datalogic 2007-2011
EFFICIENCY AND
PRODUCTIVITY
STRATEGIC
POSITIONING
3333
The Four Strategic Drivers
INNOVATION
Invest 7-8% in R&D to launch new products and platforms
Become a value-added solutions provider developing
software for intelligent products
Focus on Vision and Imaging technologies
25% of sales from new products (*)
Focus on two major markets:
Automatic Data Capture (ADC)
Industrial Automation (IA)
External growth through M&A activities, mainly in the
Industrial Automation market
INTERNATIONAL
EXPANSION
Expand emerging market (BRIC) presence through
strategic alliances and foreign investments
Increase penetration in large mature markets in North
America and Western Europe addressing High-End
products/solutions and higher technology businesses
World class performance through the global adoption of
best in class Supply Chain Management
Improve operational efficiency and leverage industrial
global footprint
Activate scale economies
(*) Sales derived from new products released during the past 2 calendar years divided by total sales

© Copyright Datalogic 2007-2011
22.3%
23.1%46.3%
8.5%3.7%
DL Mobile *
DL Automation
DL Scanning
Business Development
DL Spa
34
Strategic Positioning
WORLDWIDE MARKET SHARE
Focus on Automatic Data Capture (ADC) and Industrial Automation (IA) markets
Group reorganization by market from January 2011– ADC, IA and Business Development - to
meet customers’ needs more effectively and promptly
ADC: - Optimize distribution coverage through Datalogic Scanning and Datalogic Mobile joined efforts
- Exploit all the opportunities in the retail market
- Focus on verticals
IA: Address a huge market worth approx. $6B in 2012, focusing on Vision and Safety
Offering solutions to push clients to make new investments: from OPEX to CAPEX
Gained market shares, consolidating leadership in reference markets
31.8%30.6% 31.5%
12.3% 12.3%14.6%
2007 2008 2009
POS Retail Scanners Industrial Stationary Barcode Scanners
REVENUES BY DIVISION (**)
(*) Datalogic Mobile includes Enterprise Business Solutions BU
(**) % figures calculated on total net of adjustement
34

© Copyright Datalogic 2007-2011 35
International Expansion
In 2010 strong revenues growth in Asia
Pacific, + 63.5% and Rest of the World,
+58.7%
Boost revenues in emerging markets:
BRIC through new JVs and organic
growth
Drive above market revenue growth in
faster growing markets reinforcing local
distribution and local manufacturing
capacity (ie. Vietnam Plant)
Expand sales and distribution in large
strategic markets (North America and
Western Europe)
REVENUES GROWTH BY COUNTRY
12.5% 11.0%
41.7% 39.8%
30.0%
28.8%
9.6%
12.6%
6.2%
7.8%
2009 2010
Italy Europe North America Asia Pacific ROW
Mature
markets
+19%
Emerging
markets
+61%312
393
+26%
35

© Copyright Datalogic 2007-2011
Research & Development investments at > €26 million in 2010 or 7% on sales
+34 new products in 2010
A large and growing portfolio of 898 patents: +65 patents in 2010
9 Research & Development Centers
Leverage Evolution Robotics Retail innovative technological capability in the field of visual
pattern recognition to provide new solutions in retail and in the industrial focused businesses
Offering innovative solutions for a comprehensive range of applications in the manufacturing,
retail, transportation & logistics markets combining products, software and services
36
Innovation
PRODUCT INNOVATION PATENTS PORTFOLIO
10
4
12
9
20
12
69 8
32
17
23 23
11
85
6
21
45
11
3
6
108
21
01
01
32
4
0
4
0
3
23
13
17 16
22
14 13
16
23
35
27
33 34
1998 1999 2000 2001 2002 2003 2004 2005 2006 2007 2008 2009 2010
PRODUCT UPDATE NEW LINE OF PRODUCTS
BREAKTHROUGH INNOVATION TOTAL DEVELOPMENTS
36

© Copyright Datalogic 2007-2011 37
Efficiency and Productivity
Significant reduction of fixed cost structure, thus creating the basis for future growth
Continuous improvement in the trade working capital as result of rationalization of SKU’s and
inventory processes reengineering
Adopt best in class supply chain management to gain efficiency and leverage the industrial global
footprint
Fully leverage Vietnam factory capability and Asia supply chain
IMPROVEMENT OF TWC
6.2
38.1
2.0%
9.7%
2009 2010
EBITANR % on revenues
€mln
STRONG GROWTH OF EBITANR *
(*) Ordinary Operating Profit before non recurring costs/revenues and amortization of intangible assets from acquisition (EBITANR)
60.7
57.9
19.5%
14.8%
2009 2010
TRADE WORKING CAPITAL % on revenues
-4.5%
€mln
37

© Copyright Datalogic 2007-2011
19.7
49.8
60-65
6.3%
12.7%
14-15%
2009 2010 2011 2012E
EBITDA Ebitda Margin
CAGR >45%
€mln
312
393420-430
2009 2010 2011 2012E
€mln
3838
Group Three Year Plan Target
REVENUES GROWTH EBITDA GROWTH
CAGR 11%
2012 organic revenues target in the range of 420-430 million Euro, 2009-2012 CAGR
at 11%
Potential upside from external growth
2012 EBITDA target in the range of 60-65 million Euro, CAGR >45%
R&D investments between 7%-8% of revenues per year

© Copyright Datalogic 2007-2011
12.0%
-9.6%
14.0%
18%-20%
2008 2009 2010 2012E
100
25-35
21 85-90
2009 EVO Acquisition **
Cash Flow 2012E
3939
Group Three Year Plan Target
NFP* EVOLUTION ROE GROWTH
€mln
Strong cash generation and expected debt reduction
2010 NFP improved to - €76.5 million after €21 million for EVO acquisition
Investment in capex stable at around 2.5% of revenues per year
ROE target around 20%
*NFP gross of expected dividends ** Acquisition of Evolution Robotics Retail in July 2010

© Copyright Datalogic 2007-2011 4040
THE GROUP
STRATEGIC GUIDELINES
FINANCIAL DATA
APPENDIX
© Copyright Datalogic 2007-2011 414141
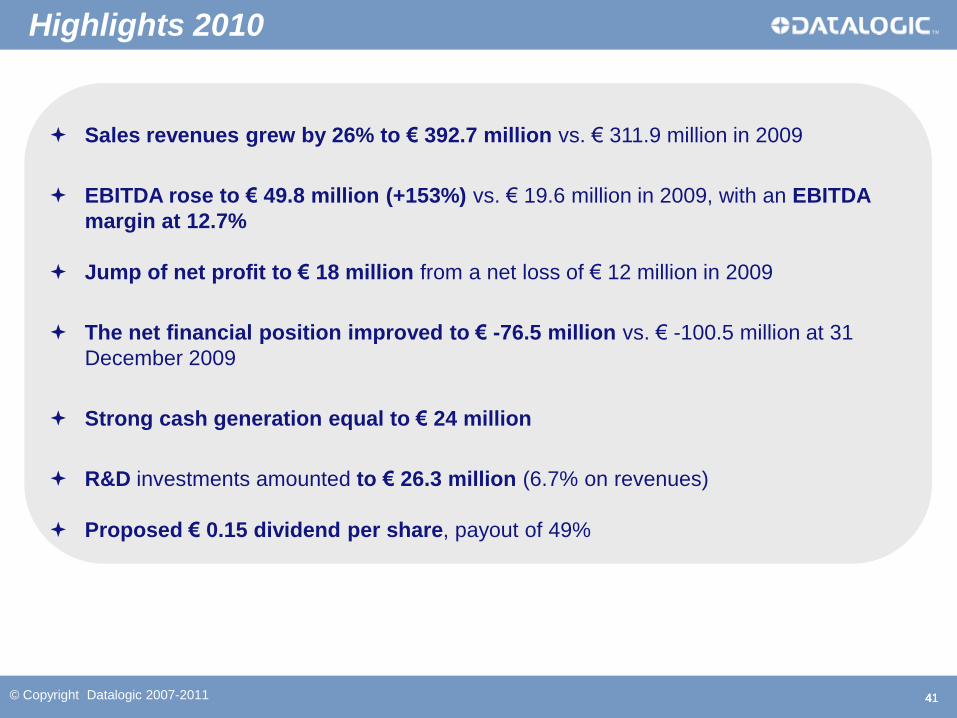
Sales revenues grew by 26% to € 392.7 million vs. € 311.9 million in 2009
EBITDA rose to € 49.8 million (+153%) vs. € 19.6 million in 2009, with an EBITDA
margin at 12.7%
Jump of net profit to € 18 million from a net loss of € 12 million in 2009
The net financial position improved to € -76.5 million vs. € -100.5 million at 31
December 2009
Strong cash generation equal to € 24 million
R&D investments amounted to € 26.3 million (6.7% on revenues)
Proposed € 0.15 dividend per share, payout of 49%
Highlights 2010

© Copyright Datalogic 2007-2011 42
73.1 76.0 76.0
86.9 89.5
101.3100.4
101.5
-0.5
4.3 7.18.8 10.6
15.3 12.9 10.9
-4.10.6
4.0 5.7 7.712.4 10 7.9
-0.7%
10.7%
Q1 09 Q2 09 Q3 09 Q4 09 Q1 10 Q2 10 Q3 10 Q4 10
Revenues EBITDA EBITANR EBITDA MARGIN
4242
Highlights 4Q 2010
€000 4Q2009 4Q2010 Var %
Revenues 86,845 101,513 16.9%
Gross Operating Margin (GOM) 36,752 45,561 24.0%
Ord. Operating Profit
(EBITANR*)5,641 7,943 40.8%
Operating Profit (EBIT) 4,799 7,396 54.1%
EBT 2,864 6,078 112.2%
Net Income 1,783 3,543 98.7%
EBITDA 8,754 10,932 24.9%
*Ebitanr: earnings before interest, taxes, acquisition and non recurring
€ mln
Quarterly Growth
Revenues growth continues at a strong pace, +17% YoY, thanks to marketing and commercial efforts
Costs in Q4 higher than the previous quarters due to the extraordinary devaluation of inventories and
the usual raise of the opex related to the closing of ordinary activities for the end of the year
R&D expenses increased by 27% to €7.3 mln (7.2% on revenues)
EBITDA increased by 24.9% despite higher costs
Jump of net profit to €3.5 mln from €1.8 mln in the quarter
Strong cash generation in the quarter thanks to a reduction in trade working capital

© Copyright Datalogic 2007-2011 4343
000€ 2009 % 2010 % Var %
Revenues 311,971 100.0% 392,742 100.0% 25.9%
COGS (181,602) -58.2% (213,546) -54.4%
Gross Operating Margin 130,369 41.8% 179,196 45.6% 37.5%
Other revenues 2,210 0.7% 2,142 0.5%
R&D (24,885) -8.0% (26,304) -6.7%
Distribution Costs (68,101) -21.8% (77,197) -19.7%
Administrative expenses (29,602) -9.5% (37,710) -9.6%
Other operating expenses (3,768) -1.2% (2,006) -0.5%
Total operating expenses and others (126,356) -40.5% (143,217) -36.5%
Ordinary Operating Profit (EBITANR) (*) 6,223 2.0% 38,121 9.7% 512.6%
Non recurring costs/rev (7,776) -2.5% 827 0.2%
Amort. Intang. Assets from acquis. (4,022) -1.3% (4,266) -1.1%
Operating Profit (EBIT) (5,575) -1.8% 34,682 8.8% n.a.
Financial (costs)/rev. (6,380) -2.0% (6,733) -1.7%
Results from equity investments (173) -0.1% 403 0.1%
Foreing exchange (costs)/rev. (709) -0.2% (170) 0.0%
EBT (12,837) -4.1% 28,182 7.2% n.a.
Taxes 673 0.2% (10,154) -2.6%
Net Income (12,164) -3.9% 18,028 4.6% n.a.
Depreciation (8,643) -2.8% (7,998) -2.0%
Amortization (4,768) -1.5% (3,640) -0.9%
EBITDA 19,634 6.3% 49,759 12.7% 153.4%
Exchange rate 1.3948 1.3257
(*) Ordinary Operating Profit before non recurring costs/revenues and amortization of intangible assets from acquisition (EBITANR)
2010 Consolidated P&L
© Copyright Datalogic 2007-2011
% figures calculated on total net of adjustment
22.3%
23.1%46.3%
8.5%
3.7%
DL Mobile
DL Automation
DL Scanning
Business Development
DL Spa
4444
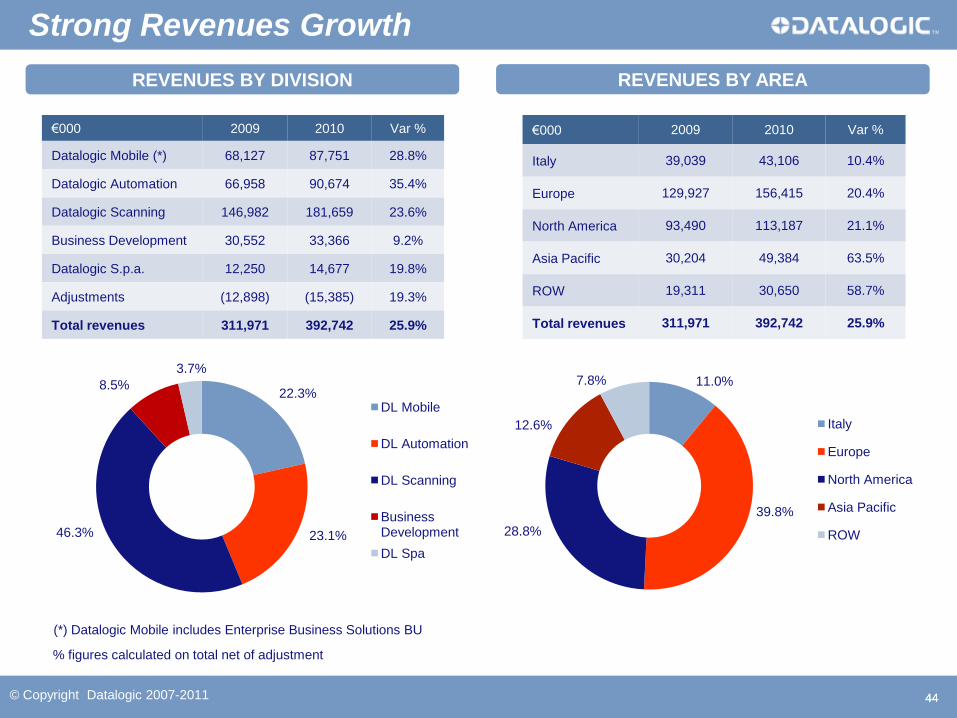
(*) Datalogic Mobile includes Enterprise Business Solutions BU
Strong Revenues Growth
REVENUES BY DIVISION REVENUES BY AREA
€000 2009 2010 Var %
Datalogic Mobile (*) 68,127 87,751 28.8%
Datalogic Automation 66,958 90,674 35.4%
Datalogic Scanning 146,982 181,659 23.6%
Business Development 30,552 33,366 9.2%
Datalogic S.p.a. 12,250 14,677 19.8%
Adjustments (12,898) (15,385) 19.3%
Total revenues 311,971 392,742 25.9%
€000 2009 2010 Var %
Italy 39,039 43,106 10.4%
Europe 129,927 156,415 20.4%
North America 93,490 113,187 21.1%
Asia Pacific 30,204 49,384 63.5%
ROW 19,311 30,650 58.7%
Total revenues 311,971 392,742 25.9%
11.0%
39.8%
28.8%
12.6%
7.8%
Italy
Europe
North America
Asia Pacific
ROW

© Copyright Datalogic 2007-2011 4545
(€mln)
Segment Reporting
REVENUES EBITDA
R&D COSTS TWC
(€mln)
(€mln) (€mln)
68 67
147
3112
312
88 91
182
3315
393
29%
36%
24%
9%
26%
Mobile Automation Scanning Business Development
DL SpA Total Group
2009 2010 YoY rev increase
5
(2)
84 5
20
10 11
22
3 4
50
12% 12% 12%
9%
13%
Mobile Automation Scanning Business Development
DL SpA Total Group
2009 2010 % on 2010 rev
68
11
0 0
25
67
12
1 0
267% 7% 7%
4%
7%
Mobile Automation Scanning Business Development
DL SpA Total Group
2009 2010 % on 2010 rev
14
21 21
3 2
61
9
20 21
4 4
58
10%
22%
12%11%
15%
Mobile Automation Scanning Business Development
DL SpA Total Group
2009 2010 % on 2010 rev

© Copyright Datalogic 2007-2011 46
6,223
- 18,681
47,855
7,842
-255
-11,788 -636
7,562 38,121
Act Dec '09 Price Vol. Sales/Mix New Prod. Exch rate € vs $
Oper Exp Business Development
Other Act Dec '10
46
(*) Ordinary Operating Profit before non recurring costs/revenues and amortization of intangible assets from acquisition (EBITANR)
Note:
The Exchange rate variance has been calculated on Sales/COGS/Operating expenses originally denominated in USD ($). The variance was the result of the
difference between Dec ’10 Actual (1,326) and Dec ’09 Actual (1,395) €/USD exchange rate.
Therefore, this variance does not include the exchange rate effect on competitive scenario.
For Informatics & Evolution Robotics Retail (Business Development) has been considered their overall impact on the EBITANR
(€000)Exch rate on sales + 7,107
Exch rate on DCOGS - 4,245
Exch rate on Op Exp - 3,117
Other revenues - 70
Other variable costs - 4,340
Direct Cogs + 11,972
Vol. sales/Mix +47,693
Service sales +162
EBITANR * - 2010 Actual vs. Last Year
© Copyright Datalogic 2007-2011 474747
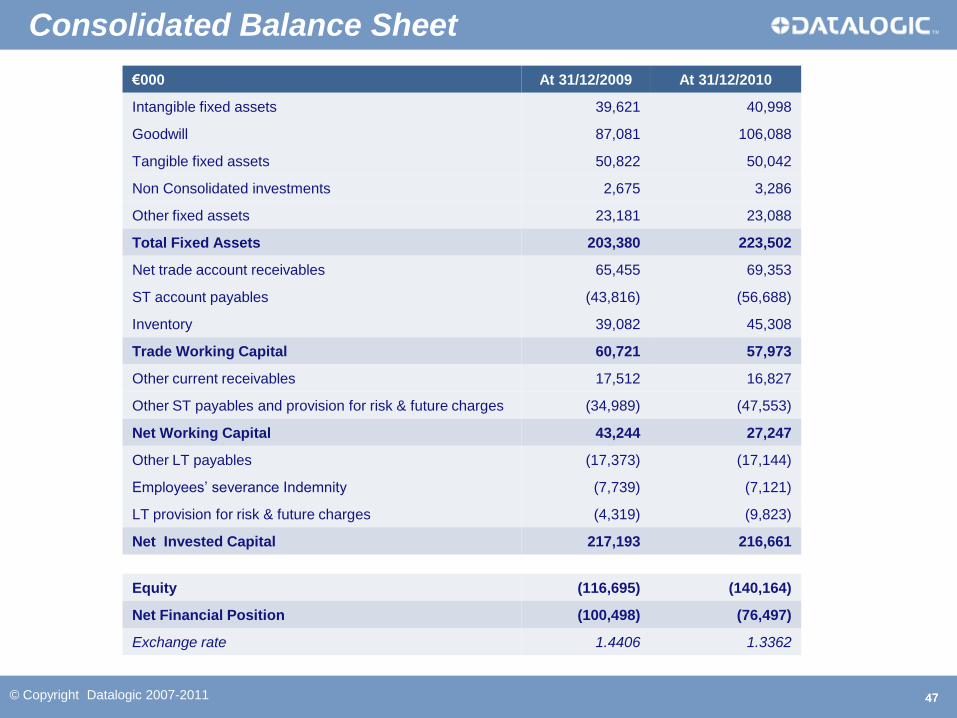
Consolidated Balance Sheet
€000 At 31/12/2009 At 31/12/2010
Intangible fixed assets 39,621 40,998
Goodwill 87,081 106,088
Tangible fixed assets 50,822 50,042
Non Consolidated investments 2,675 3,286
Other fixed assets 23,181 23,088
Total Fixed Assets 203,380 223,502
Net trade account receivables 65,455 69,353
ST account payables (43,816) (56,688)
Inventory 39,082 45,308
Trade Working Capital 60,721 57,973
Other current receivables 17,512 16,827
Other ST payables and provision for risk & future charges (34,989) (47,553)
Net Working Capital 43,244 27,247
Other LT payables (17,373) (17,144)
Employees’ severance Indemnity (7,739) (7,121)
LT provision for risk & future charges (4,319) (9,823)
Net Invested Capital 217,193 216,661
Equity (116,695) (140,164)
Net Financial Position (100,498) (76,497)
Exchange rate 1.4406 1.3362
© Copyright Datalogic 2007-2011 48
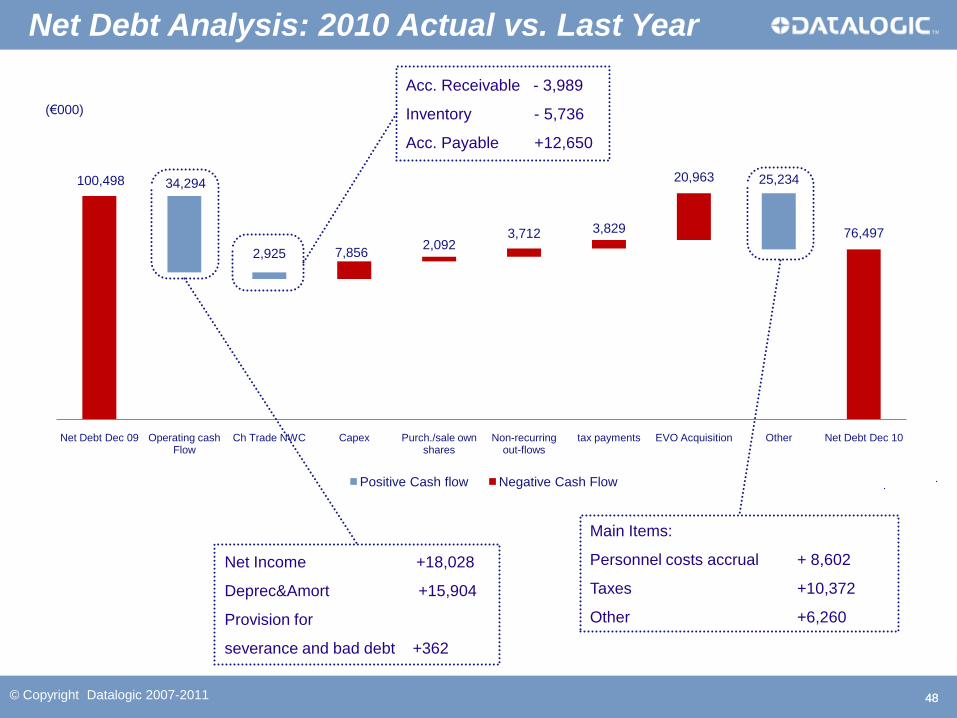
100,498 34,294
2,925 7,8562,092
3,712 3,829
20,963 25,234
76,497
Net Debt Dec 09 Operating cash Flow
Ch Trade NWC Capex Purch./sale own shares
Non-recurring out-flows
tax payments EVO Acquisition Other Net Debt Dec 10
Positive Cash flow Negative Cash Flow
48
(€000)
Acc. Receivable - 3,989
Inventory - 5,736
Acc. Payable +12,650
Net Income +18,028
Deprec&Amort +15,904
Provision for
severance and bad debt +362
Net Debt Analysis: 2010 Actual vs. Last Year
Main Items:
Personnel costs accrual + 8,602
Taxes +10,372
Other +6,260

© Copyright Datalogic 2007-2011 4949
THE GROUP
STRATEGIC GUIDELINES
FINANCIAL DATA
APPENDIX

© Copyright Datalogic 2007-2011 50
ADC Market: Datalogic Scanning Division
Handheld Scanners
#1 in EMEA, 30.7% mkt share
#3 Worldwide, 15.9% mkt share
POS Retail Scanners
#1 Worldwide, 31.5% mkt share
50
Source 2010 (base year 2009)
Over 5 million Datalogic handheld
scanners have been sold since 1998
and have been chosen by over
30,000 customers
Datalogic Magellan Scanner/Scales
have been installed by every one of
the Top Ten Retailers worldwide
Scanning Division: 181.4 M€ in 2010, 46% of Group Sales
50

© Copyright Datalogic 2007-2011 5151
Mobile Computers
#4 in EMEA, 7.9% mkt share
#4 Worldwide, 4.0% mkt share
Source 2010 (base year 2009)
ADC Market: Datalogic Mobile
Division
Mobile Division: 87.6M€ in 2010, 22% of Group Sales
Datalogic Mobile – EBS
Self Shopping Solutions
#2 Worldwide, 26.0% mkt share
Over 360 installations in Europe!
#1 in Italy with 145 installations
#1 in Belgium with 96 installations
#2 in France with 110 installations
A full range of professional mobile solutions dedicated to the main target
application fields: Warehousing, Field Force Automation and Retail In-Store
solutions
51
© Copyright Datalogic 2007-2011 5252
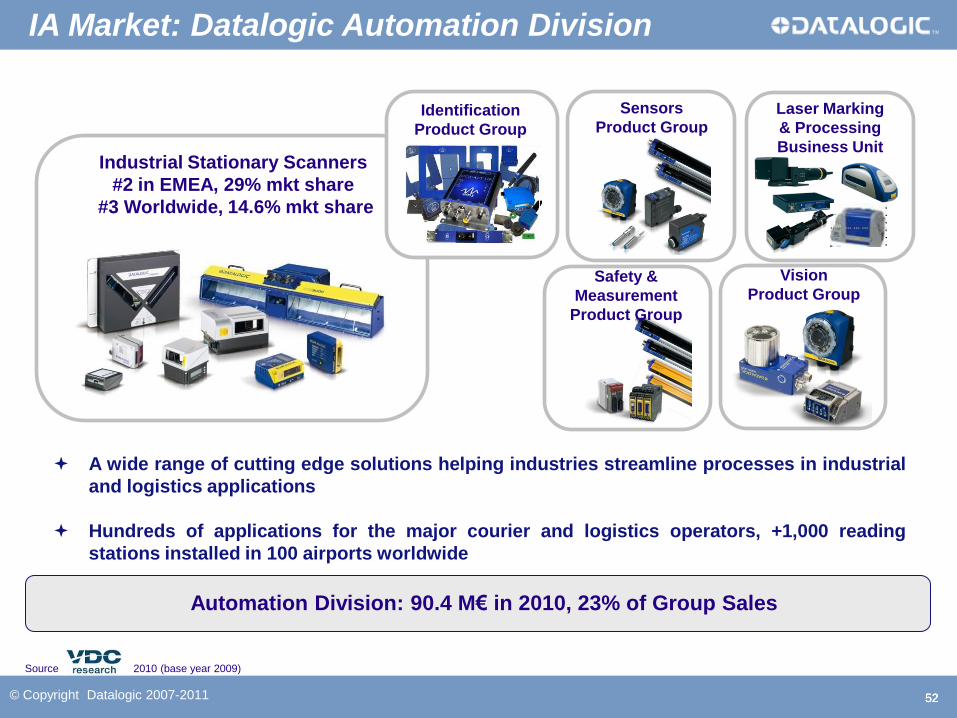
A wide range of cutting edge solutions helping industries streamline processes in industrial
and logistics applications
Hundreds of applications for the major courier and logistics operators, +1,000 reading
stations installed in 100 airports worldwide
Laser Marking
& Processing
Business Unit
Sensors
Product Group
Vision
Product GroupSafety &
Measurement
Product Group
Industrial Stationary Scanners
#2 in EMEA, 29% mkt share
#3 Worldwide, 14.6% mkt share
Identification
Product Group
IA Market: Datalogic Automation Division
Automation Division: 90.4 M€ in 2010, 23% of Group Sales
Source 2010 (base year 2009)
52

© Copyright Datalogic 2007-2011 5353
Business Development: Informatics
Complete Range of Easy-To-Use Barcoding Solutions
Barcoding solutions for the millions of Small – Medium Businesses
that increase productivity and profitability
Based in the US, serving over 275 thousand small and medium businesses!
Business Development (Informatics + EVO): 33.3 M€ in 2010, 9% of Group Sales
53

© Copyright Datalogic 2007-2011 5454
Scanning without using the barcode
Flagship products include LaneHawk BOB and LaneHawk InCart
Based in the US, serving over 1,200 grocery stores today
Over 14,000 lanes installed!
Business Development: Evolution Robotics Retail
July 1st, 2010 – Datalogic acquired 100% of Evolution Robotics Retail, Inc. (EVO) a
company located in California with unique expertise in visual pattern recognition
technology for use currently in retail loss prevention and productivity applications
54
© Copyright Datalogic 2007-2011 5555
Datalogic S.p.A.
Via Candini, 2
40012 Lippo di Calderara di Reno
Bologna – Italy
Tel. +39 051 3147011 – Fax +39 051 3147205
E-mail [email protected]
www.datalogic.com
This presentation contains statements that are neither reported financial results nor other historical information. These statements are forward-looking
statements. These forward-looking statements rely on a number of assumptions and are subject to a number of risks and uncertainties, many of which are
outside the control of Datalogic S.p.A., that could cause actual results to differ materially from those expressed in or implied by such statements, such as
future market conditions, currency fluctuations, the behavior of other market participants and the actions of governmental and state regulators
© 2011 Datalogic S.p.A. - All rights reserved. • Protected to the fullest extent under U.S. and international laws. • Copying, or altering of this document is
prohibited without express written consent from Datalogic S.p.A. Datalogic and the Datalogic logo are registered trademarks of Datalogic S.p.A. in many
countries, including the U.S.A. and the E.U. All other brand and product names may be trademarks of their respective owners.
Thank You!
.

© Copyright Datalogic 2007-2011 5656
We Welcome Your Questions!