THE DISTRIBUTION OF LOCAL FOOD THROUGH CONSUMER COOPERATIVES
97
THE DISTRIBUTION OF LOCAL FOOD THROUGH CONSUMER COOPERATIVES IN THE NORTHEAST A Thesis Presented by Marina S Michahelles to The Faculty of the Graduate College of The University of Vermont In Partial Fulfillment of the Requirements for the Degree of Master of Science Specializing in Community Development & Applied Economics May, 2008
Transcript of THE DISTRIBUTION OF LOCAL FOOD THROUGH CONSUMER COOPERATIVES

THE DISTRIBUTION OF LOCAL FOOD THROUGH CONSUMER COOPERATIVES IN THE NORTHEAST
A Thesis Presented
by
Marina S Michahelles
to
The Faculty of the Graduate College
of
The University of Vermont
In Partial Fulfillment of the Requirements for the Degree of Master of Science
Specializing in Community Development & Applied Economics
May, 2008

Accepted by the Faculty of the Graduate College, The University of Vermont, in partial fulfillment of the requirements for the degree of Master of Science, specializing in Community Development & Applied Economics.
Thesis Examination Committee: A
~ a n i p olodinsky, Ph.D.
I , Chairperson
Vice President for Research and Dean of Graduate Studies
Date:

ABSTRACT
There is growing consumer interest in locally produced food and farmers and retailers play an important part in this growing niche market. Up-to-date and reliable data are necessary to create efficient distribution lines, but there is currently a dearth of aggregate data available to assess the distribution channels of local foods. The research questions for this thesis are motivated by the potential for growth in the local food market, and a need to investigate the role of consumer co-ops in achieving that potential.
In Article 1, results from 67 surveys by consumer co-op managers and member-workers from the American Northeast are reported. A conservative estimate for the Northeast co-ops’ contribution to the local food market is $21,253,750 annually, an average of 17.2% of co-ops’ expenditure being spent on local food. Article 1 identifies the consistency with which various food categories are sourced locally by co-op, and identifies the reasons for and barriers to sourcing locally. An ordinary least squares model reveals that the average percent locally sourced by co-ops whose mission includes sourcing locally is 12.7-percent higher than those whose mission does not include sourcing locally. No difference in percent locally sourced is found between co-ops from different settings (urban, suburban, rural), or Cooperative Grocer ranking (large, medium, small).
Article 2 reports on the follow-up unstructured interviews with 58 co-op
managers and member-workers. The five principal barriers to sourcing locally – locating local producers, co-op cooperation, organic certification, competition, and distribution – are discussed and various solutions that co-op managers have implemented are described. It is argued that co-ops act as local food hubs in the local food market, providing local producers with a year-round outlet for their products. Alleviating the specific barriers to sourcing locally will allow co-ops to achieve their potential in that role. Overall, improved communication among co-ops and between co-ops and farmers can begin to address some barriers to sourcing locally. Further, other groups such as NOFA, regional localvore groups, state agricultural extension agencies, and others can continue to facilitate communication and share pertinent information.
It further suggests that filling some of the gaps can contribute to alleviating
barriers identified by co-op managers and member workers. If co-ops are interested in sourcing more of what they sell from local producers, using percent of expenditure locally sourced as a marker can be useful for setting specific goals, while addressing the barriers to sourcing locally can help co-ops and producers meet these goals.

ii
ACKNOWLEDGEMENTS
This project is the culmination of my two-year tenure at the University of Vermont, and
provides a smooth transition from my academic to my farming carrier. I first want to
thank my first friends in Vermont, Riva and Trevor. Although I broke our pact that we
would each finish in two years, I might have been even longer without you two gently
prodding me along. I am grateful to my Louis, who was able to distract me and help me
focus in almost equal measure; to my various parents and sibling for their ceaseless
support, encouragement, and helpful editing; and to my uncle Ricky for always asking
the difficult questions. Had I been able to keep to the plan of completing my thesis before
the growing season, Wendy Sue Harper would have been my committee chair-person
until the end; I am lucky to have had her on my committee for the time that I did. I am
immensely grateful to Amy Trubek for joining my committee so late in the process, and
found her enthusiasm for the topic encouraging. Jane Kolodinsky was always very
generous with her time, and offered clear and direct feedback on the endless drafts I
submitted. I finally want to thank my advisor Kathleen Liang for her guidance and
patience. She provided me with the necessary tools for conducting and completing my
research, and inspired me to push on at the moments when I wanted to throw my hands
up and say “%#&@ it!”

iii
TABLE OF CONTENTS
ACKNOWLEDGEMENTS................................................................................................ ii
LIST OF TABLES.............................................................................................................. v
LIST OF FIGURES ........................................................................................................... vi
1. INTRODUCTION .......................................................................................................... 1
1.1. Motivations and Objectives of the Study..................................................................... 3
2. GENERAL LITERATURE REVIEW............................................................................ 5
2.1. Local Food Movement Overview ................................................................................ 5
2.2. Finding local food........................................................................................................ 8
2.4. Consumer Demand..................................................................................................... 13
2.3. Defining Local Food.................................................................................................. 15
3. ARTICLE I: A QUANTITATIVE ANALYSIS OF FACTORS INFLUENCING
LOCAL FOOD PURCHASES BY CONSUMER COOPERATIVES ............................ 19
3.1. Background................................................................................................................ 19
3.2. Food Distribution Research ....................................................................................... 25
3.3. Conceptual Model...................................................................................................... 28

iv
3.4. Study objectives and Hypotheses............................................................................... 32
3.6. The Local Food Sourcing Model ............................................................................... 39
3.7. Results and Analysis .................................................................................................. 41
3.8. Conclusions................................................................................................................ 53
4. ARTICLE II: BARRIERS THAT INHIBIT CONSUMER CO-OPS FROM
ACHIEVING THEIR POTENTIAL IMPACT ON THE LOCAL FOOD MARKET IN
THE NORTHEAST.......................................................................................................... 56
4.1. Introduction................................................................................................................ 56
4.2. Background................................................................................................................ 56
4.3. Data ............................................................................................................................ 60
4.4. Results........................................................................................................................ 61
4.5. Discussion and Recommendations ............................................................................ 66
5. GENERAL CONCLUSIONS AND RECOMMENDATIONS.................................... 70
5.1. Opportunities for future research............................................................................... 74
THESIS REFERENCES................................................................................................... 76
Works Cited ...................................................................................................................... 76
Personal Communications Cited....................................................................................... 87
APPENDIX A. CONSUMER CO-OP SURVEY............................................................ 88

v
LIST OF TABLES
Table 1. Description of principal component extracted from reasons for sourcing locally
................................................................................................................................... 38
Table 2. Description of principal component extracted from barriers to sourcing locally38
Table 3. Variable definition and expected influence on dependent variable.................... 40
Table 4. Response rate for “other” local food attributes................................................... 44
Table 5. Response rate for other barriers to sourcing local food...................................... 45
Table 6. Results for the Frequency with which various local food types were sourced... 47
Table 7. Crosstabulation of cost as a barrier by setting .................................................... 48
Table 8. Results of OLS regression model ....................................................................... 50
Table 9. Total locally sourced and mean percent locally sourced: Rank by Setting ........ 52
Table 10. Response rate for other barriers to sourcing local food.................................... 60
Table 11. Results from follow-up interviews with co-op managers and member workers
................................................................................................................................... 62

vi
LIST OF FIGURES
Figure 1. Vermont local food marketing............................................................................. 9
Figure 2. Local food distribution through consumer co-ops............................................. 29
Figure 3. Co-op local sourcing conceptual model ............................................................ 30
Figure 4. Distribution of responses for the three top reasons for sourcing locally........... 43
Figure 5. Distribution of responses for the three top barriers to sourcing locally ............ 45

1
1. INTRODUCTION
“Locally produced” is the new hip food trend that offers farmers in the Northeast
a growing niche market (Ness, 2006). While farmers’ adoption of organic farming
practices may help to minimize damage done to the environment and may benefit our
health, many consumers are becoming more interested in the place of origin than the way
their food is produced. “Eat local” campaigns are being mounted both at the state level
and at the consumer level, emphasizing the economic, environmental, social, and health
benefits of supporting a local agriculture market. Although virtually all agriculture was
relatively locally-based less than a century ago, the U.S agricultural landscape has shifted
toward industrial scale and streamlined operations relying on large-scale distribution.
This has resulted in regions of the United States either completely abandoning agriculture
or otherwise specializing in a single commodity or product (Heffernan, 2000). Many
farmers in the Northeast find that the region has neither the climate nor the geographical
landscape to compete in large-scale agriculture; developing a local or regional market
may be the only solution (Pfeffer & Lapping, 1995).
The Northeast is characterized by relatively small farms, which are scattered
throughout the region. This poses a distribution problem that is not found in other parts
of the country where agriculture is more homogeneous in production, and is tailored to
the specifications of the distribution requirements (Zwart, 1996). Small-scale farmers are
often not able to produce the volume necessary to be competitive in the national

2
wholesale markets (Nakamoto, Halloran, Yanagida, & Leung, 1989), being constrained
by a geographic landscape that can limit the size and type of production. Eastwood, et al.
(2002) wrote: “Changing information technology, processing, wholesaling, and
transportation continue to favor larger market participants who benefit from the
specialized managerial coordination activities. Small volume growers have difficulty
meeting the purchasing requirements for many types of outlets. Part of the problem faced
by rural areas and smaller growers relates directly to market access.” In order for the
local food market to succeed and to grow into become something more than a niche
market, it is imperative that farmers be able to distribute their products cost-efficiently,
and to sell their products at a good price.
Sales of local foods have not been, until recently, through conventional retail
outlets, but through alternative markets. Direct sales from farmer to consumer at
farmer’s markets, farm stands, or Community Supported Agriculture farms have the
added social benefit of human interaction, bringing consumer and producer closer
together. Consumer cooperatives (co-ops) are also non-mainstream outlet opportunities
for farmers to sell locally produced foods year-round if supply allows; co-op members
and patrons shop for food and other goods there rain or shine. Co-ops serve as an
interesting type of retail outlet to study the local foods market because they are by
definition cooperatives of consumers, democratically managed, and what they carry for
sale is a reflection of the membership’s consumption preferences. For this reason,
consumer cooperatives serve as a good place to begin measuring sales of the local food

3
market in non-direct sale venues, as well as understanding the reasons for and barriers to
sourcing locally.
1.1. Motivations and Objectives of the Study
In order to measure ‘local food’ consumption, the distance between the point of
production and the point of sale (and eventually consumption) for each product must be
calculated. This is a monumental task for the data is not currently available. The
Vermont Sustainable Agriculture Council (V-SAC), however, is committed to measuring
the state of the local food market in Vermont in order to further promote the market and
to develop strategies to strengthen it. V-SAC, along with NOFA-VT, The Intervale
Foundation, Shelburne Farms, the FEED program, Agricultural Extension, and other
programs have pooled their resources to measure direct sales at farmers’ markets, CSA
farms, and farm stands. They are continuing their efforts by investigating non-direct
sales, and the Council asked me to look specifically at consumer co-ops’ contribution to
the local food market in Vermont. As other Northeastern states have similar agricultural
landscapes and distribution issues, I have extended the study to include consumer co-ops
from all the Northeastern states1 and the District of Columbia.
I am personally invested in this topic, as it pertains directly to what I do for a
living. As a commercial grower with a local market, it is in my best interest to
understand the different market options for the vegetables and flowers I grow. This
1 Northeastern states: ME, NH, VT, NY, MA, RI, CT, PA, DE, MD, WV, and VA.

4
study is designed not only to measure dollar transactions between farmers and consumer
co-ops – with and without middle-man distributors – but also to identify the existing
strengths of the farmer-co-op market, as well as its weaknesses. By identifying the
barriers that hinder farmers from selling to co-ops and that hinder co-ops from sourcing
locally, some recommendations can be made to help remove them and to facilitate the
distribution of local foods.
At the root of this study lies the following question:
Does a local food market offer viable marketing opportunities to local farmers?
In an attempt to find an answer, I further ask:
Is there a market demand for locally produced food? If so, for which products? In what
quantities? In what setting? And at what cost to the farmer and consumer?
The following section is a review of the literature on the local food movement in
the United States generally, and in the Northeast specifically. The three most common
approaches to defining the term “local food” are described, consumer demand for local
food is discussed, future prospects for the local food market are speculated upon, and the
methodology followed in this study is outlined.

5
2. GENERAL LITERATURE REVIEW
2.1. Local Food Movement Overview
The San Francisco Chronicle published that “’Locally grown’ is the hottest trend
in food right now” (Ness, 2006). Interest in local foods is increasing and farmers in the
Northeast are striving to meet the demand by expanding and diversifying their operations.
Pfeffer and Lapping (1995) explain that “[in] response to the farm crisis of the 1980s,
many farmers across the nation have begun developing alternative production systems
and farm enterprises that are less dependent on the highly specialized, government-
supported agricultural system. At one level, these alternative systems are more risky than
conventional operations, but a greater diversity of products that take advantage of market
niches and that offer premium prices helps compensate for the risks.” The local food
market offers farmers an alternative to the industrial-scale agriculture of commodities
that was spurred on by the so-called “Green Revolution” in the 1960s and 1970’s.
Consumers seek out ‘local food’ for reasons ranging from its freshness and taste,
(Govindasamy, Italia, & Adelaja, 2002; Lockeretz, 1986; Pirog, 2003, 2004) to more
intangible attributes such as its benefits in contributing to local economies (Hoffer, 2000;
Russo & McLaughlin, 1991; Wilkins, Bokaer-Smith, & Hilchey, 1996; Wilkins,
Bowdish, & Sobal, 2002), and food security (Kloppenburg, Hendrickson, & Stevenson,
1996; Wilkins et al., 2002). Others still are interested in buying local for the preservation
of cultural heritage, or for political expression, (Bellows & Hamm, 2001; Halweil, 2004;

6
J. Kolodinsky & Pelch, 1997; Pirog & Tyndall, 2000; Roininen, Arvola, & Lahteenmaki,
2006; Wilkins, 1996; Wilkins et al., 1996; Wilkins et al., 2002; Zepelda & Leviten-Reid,
2004).
Champions of the local food movement have come from many different
backgrounds. Environmental groups have pointed to the possible benefits of reducing a
region’s ecological footprint, including lower greenhouse gas emissions by reducing the
“food miles” from farmer to consumer. Pirog (2001) calculated that the average distance
traveled by produce consumed in the U.S. is 1,494 miles. Although it does not
automatically follow that local production of food results in sustainable and
environmentally sound practices on the farm, Gussow (1999) suggests that saving local
farmers from going into debt is a necessary step to reforming their practices. Schools
have used the local food movement as a tool to teach their students about nutrition,
culture, the environment, and food systems (Croom, 2005; "Educating about
Agriculture,"; "PLACE program,"; "Sustainable Schools Project,"; "The Burlington Food
Project,"; "Vermont Education for Sustainability,"; "Vermont Food Education Every
Day,").
The tourist industry and the business sector have found mutual interest in
supporting “buy local” campaigns, as the cannibalization of food retail stores’ markets by
superstores and national brand supermarkets provokes concern for the viability of their
local businesses (Artz & Stone, 2006). The top ten largest food and beverage
corporations account for over half the food retail sales in the country (Lyson & Green,

7
1999), while the top five alone control over 40-percent. Cargill and ADM control 75-
precent of the world’s grain trade, while IBP, ConAgra, Cargill and Farmland Industries
companies slaughter 87-percent of American beef (Heffernan, 2000) and these companies
integrate horizontally, as well as vertically, allowing them to gain greater control over the
entire sector. Con Agra, for example, “ranks in the top four firms in the processing of
beef, pork, broilers, sheep, turkeys, and seafood,” (Heffernan, 2000).
Buying locally produced food from local producers or retailers contributes to the
vitality of local areas (DuPuis & Goodman, 2005) and helps retain a sense of local culture
that is attractive to tourists. Conventional supermarkets are designed to be easily accessed
by large-scale distributors, bringing many of them outside of town centers (Norberg-
Hodge, Merrifield, & Gorelick, 2002). The construction of these markets requires more
roads and parking areas, and necessitates consumers driving to and from the stores to do
their shopping. However, marketing of local food often takes place in existing town
centers and has contributed to the revitalization of some down-town areas, (Coulson,
2005; Pothukuchi & Kaufman, 1999)
Policymakers are pushing to regionalize and localize food production for reasons
of security. A strong local food network can help mitigate widespread contamination,
like that of the 0157:H7 strain of E. coli in spinach that was spread through irrigation
water in September and October, 2006, and which resulted in 204 cases off illness, 31
cases of kidney failure, and three deaths (FDA, 2006). Diversity of crop and a
decentralized agricultural system decrease our vulnerability in the face of disease,
8
chemical contamination, or even biological warfare. People continue to find more
reasons to support the “local food” movement.
2.2. Finding local food
“Local food” has not made its way into the mainstream supermarkets – at least not
significantly so. Whole Foods is one of the few major supermarkets that seeks out local
sources of food products, and often provides biographies of the farmers as part of their
marketing technique (Ness, 2006). For the most part, however, consumers go to non-
conventional, or alternative food retail outlets to buy local food.
Producers employ a variety of strategies for marketing their products. Figure 1
illustrates the different direct and non-direct channels that connect local foods with
consumers. Research has tracked the recent growth of farmer’s markets and CSA farms
(Halweil, 2004; Hinrichs, 2000; Lass, Stevenson, Hendrickson, & Ruhf, 2003; Payne,
2002) and efforts have been made to measure these and other forms of directs sales of
local foods from farmers to consumer (Timmons, 2006). There is a need for a better
understanding of the non-direct channels (below the dotted line) in order to complete the
picture of local foods market.

9
Vermont
Producers
farm stands
farmers markets
retail from farm
CSA
Vermont
Consumers
Grocery
Restaurant
Institutional
Processors Wholesale
DIRECT
INDIRECT
Figure 1. Vermont local food marketing
Source: Adapted from Timmons (2006)
2.2.1. Direct Channels
Direct market channels for local foods between farmers and consumers represent
a significant portion of the local food market, and are key components of local food
systems (Hinrichs, 2000). They present consumers with the opportunity to interact with
the producer, and result in farmers retaining more of the food dollar (Russo &
McLaughlin, 1991). The principal direct sale outlets are farm stands, farmer’s markets,
and Community Supported Agriculture (CSA) farms. Consumers are attracted to these
types of retail outlets in part because they enjoy connecting directly to their food source
(J. Kolodinsky & Pelch, 1997).
In 2002, there were 3100 farmer’s markets in the U.S. (Russo and McLaughlin,
1991), more than double the number reported by USDA in 1992. Similarly, CSA farms

10
are gaining momentum; there were only two in the country in the mid 1980’s, and there
were more than 1000 at the turn of the millennium (Lass et al., 2003). Small-scale
farmers often use multiple market channels (Feenstra, Lewis, Hinrichs, Gillespie, &
Hilchey, 2003), and include activities like pick-your-own, farm tours, corn mazes,
festivals, or petting zoos.
2.2.2. Non-Direct Channels
Other local food consumers depend on non-direct food retail outlets such as
country stores, conventional supermarkets and groceries, or consumer cooperatives (co-
ops) to access local food. These outlets place one degree of separation or more between
farmers and consumers (Kotler & Armstrong, 2006), but help to remove the possible
barrier of inconvenience of searching for local foods, cited by many consumers
(Lockeretz, 1986). Some schools and institutions such as universities and hospitals have
initiated campaigns to source some of their cafeteria food locally for health reasons, but
also for economic reasons (Croom, 2005; Jordan, 2006; "Sustainable Schools Project,";
"The Burlington Food Project,"; Timmons, 2006). Many restaurants have found their
niche by sourcing high-end local foods (Strohbehn & Gregoire, 2003; "The Vermont
Fresh Network,"). While these consumers may not be shaking hands with the farmers
who produced their food, they can still benefit from the freshness and nutrition of the
local food, while contributing to their local economy and reducing dependence on fossil
fuels.

11
Some local food advocates agree that consumer co-ops are the primary
distribution centers for local foods (Buschett, 2006, Harrington, 2007). Farmers’
markets, farm stands, and CSA farms are generally open seasonally, while co-ops are
open year round and sell local and regional produce, fruits and nuts, meat, dairy, eggs,
grains, cheese, sweeteners, and many other value-added foods. The connection between
farms and consumer co-ops has contributed to the viability of some of the Northeast’s
small farming operations, and has provided opportunities for consumer co-ops to grow.
By definition, consumer co-ops are organizations of consumers. Co-ops have been
viewed as anomalies in the organizational world (Briscoe, 1971), and have been
described as “businesses with a conscience, a yardstick against which the services of
commercial stores can constantly be measured,” (Moyer, 1981). Some are modest groups
of people who meet on a regular basis to buy items in bulk at wholesale prices; these are
generally referred to as ‘buying clubs.’ Traditional consumer co-ops follow the
Rochedale model (Sommer, 1998), and are commercial markets with an elected board of
directors, through which members receive annual patronage dividends. The third kind of
consumer co-op is a participatory co-op, characterized by non-hierarchical management,
member participation in all aspects of running the operation, and concern for ecological
responsibility (Sommer, 1998). These co-ops first appeared in the 1960s, and were
patronized mainly by young people concerned about the quality of food in an
increasingly industrialized agriculture, nutrition, and ecology.
12
Consumer co-ops typically operate out of retail facilities and are open to the
general public, and they may provide special services, prices, or benefits to members
only. Co-ops offer a wide range of products and services aside from groceries, including
health and beauty products, dry cleaning, cooking and nutrition classes, house-wares,
food service and catering, gas stations, and more.
The definition of a consumer co-op from the Cooperative Grocer reads as follows:
“Cooperatives are member-owned, member-governed businesses that operate for the benefit of their members according to common principles agreed upon by the international cooperative community. In co-ops, members pool resources to bring about economic results that are unobtainable by one person alone. Most simply put, a cooperative is a business 1) voluntarily owned by the people who use it, and 2) operated for the benefit of its members. Regardless of the goods and services provided, co-ops aim to meet their members’ needs.”
What is significant here, for the purpose of this study, is that what is purchased by
the co-op, either for the exclusive use of its members if it is a buying club or a
participatory co-op, or for the community at large if it is a traditional consumer co-op,
reflects the consumer preferences of its members, and is not directly influenced by what
food manufacturers want to sell (Cotterill, 1986, 1997).
A ten-year study by Sommer (1998) investigated the motivations behind co-op
membership, compared co-op ideology, and examined social and managerial organization
of co-ops across the U.S. He found that the primary reason for shopping at co-ops was
the low prices, as the majority of food items were sold from bulk containers. The high
quality of food and the availability of natural foods were also important reasons. This is

13
consistent with what Wilkins (1996) found, and he also reported that co-op members’
preference for local and seasonal foods correlated with a concern for natural resources.
Zepeda and Leveiten-Reid (2004) recruited conventional food shoppers in
conventional supermarkets and organic food shoppers through a food co-op newsletter,
and compared their attitudes towards local foods. The authors found that all participants
were interested in the attributes associated with local foods – freshness and supporting
local farmers, among others, but that the co-op shoppers were more inclined to look for
the local label, and to look at origin labels. This is consistent with what Wilkins (2002)
suggested: that “one explanation for a greater awareness among co-op shoppers is that
interest in supporting local and small-scale agriculture through food choices may be a
motivating factor for shopping at a food cooperative.” Co-ops and other independent
groceries are able to source locally if there is consumer demand, whereas conventional
supermarkets are constrained to source what is available through the distributor.
2.4. Consumer Demand
For the success of the local food market, it is important to understand what
prompts consumers to consider local food items over their non-local equivalent. The
advertisement and psychology literature sheds some light on how to measure likelihood
of purchase. Respondents may be categorizes, or segmented according to demographics
or other attributes (Bredahl, Grunert, & Frewer, 1998). In the study described in the
previous section, Zepeda and Leveiten-Reid (2004) compared responses between two

14
distinct groups: conventional food shoppers and organic food shoppers. It has been
consistently found that consumers’ attitudes can influence their decision-making process
and therefore their behavior (Jordan, 2006; Kraus, 1995; Tregear, Kuznesof, & Moxey,
1998; Tregear & Ness, 2005).
Qualitative methods have been used to study consumer behavior as well.
Ethnographic Decision Models (EDMs) are a qualitative approach that “predict the
choices that people will make under certain specific circumstances.” Decision Tree
Modeling, a method of deducing a group’s common experience or knowledge that results
in that group development of a certain pattern – purchasing, or preference (Gladwin,
1989) – has been applied to research on retail store attributes influencing consumers’
decisions of where to shop (Arentze & Timmermans, 2005; Horowitz & Carson, 1991;
Kakoi & Saito, 2005). Identifying the attitude and decision criteria of consumer co-ops
with respect to local foods may reflect the general consumer attitude, and co-op sourcing
patterns may help as an indicator of local food market trends.
Although consumer interest may be present, and farmer production may respond to
the demand, without an adequate distribution the two cannot be linked. Consumer co-ops
are both retail centers, contending with the barriers and opportunities of the market, and
proxies of The Consumers – whose consumption preferences they reflect. One of the
aims of this study is to identify the barriers faced by farmers, regional distributors, and
consumer co-ops in terms of supplying, distributing, and sourcing local foods, while also
getting a sense of the potential of this growing market.

15
2.3. Defining Local Food
In order to collect consistent data, it is imperative to establish a definition of the
term “local food.” There is currently no official definition for “local food,” and
perceptions of the term vary greatly among people who seek local foods when shopping
for food (Bellows & Hamm, 2001; Roininen et al., 2006; Wilkins et al., 2002; Zepelda &
Leviten-Reid, 2004). The term is relative (Zepelda & Leviten-Reid, 2004) and lacks the
official standards that other food labels, such as organic, rBST-free, Fair Trade, or free-
range have that give consumers a clear idea of how the food was produced. “Local food”
has meant anything from ‘grown in the yard’ to ‘produced in the U.S.’ (Zepelda &
Leviten-Reid, 2004); “local food” only refers to a relative place of origin.
The three common approaches to defining local food are: 1. Geographical and
political boundaries; 2. Personal Experience; and 3. Bioregions and foodsheds.
2.3.1. Geographic and political boundaries
A common understanding of the term is food that comes from within the region,
the state, or local community. Results from 120 interviews with co-op and conventional
supermarket shoppers showed Wilkins et al. (2002) over half of respondents identified
the above definition in a forced-choice format, only 3-percent of respondents generated
that definition on their own in an open-ended question.
States find it beneficial to promote local food purchases, and many have state-run
“Buy Local” campaigns. Every state in the Northeast has such a campaign with slogans
such as Vermont’s “Buy Local, It’s Just That Simple” (VTDA, 2007), Maine’s “Get

16
Real, Get Maine”(MEDA, 2003), and New Jersey’s “Jersey Fresh” (NJDA, 2007). But
such boundaries seem particularly arbitrary when food produced on a state boarder
cannot be sold as local in the neighboring state.
Another approach is to consider a food produced within a certain radius of the
point of sale or consumption to be local. Pirog, van Pelt, Enshayan, & Cook (2001) found
that over a third of the Iowan shoppers he surveyed considered 25 miles or fewer to be
reasonable. A group of localvores has decided that 100 miles is a reasonable distance,
and have formed a so-called 100-mile club ("100-mile diet," 2007). The state of Vermont
requires that the “local food” label be for food grown within 30 miles of the point of sale,
while the label “native” can be used for food produced in the state, but beyond the 30-
mile radius (VTDA, 2007).
2.3.2. Personal Experience
Bloggers on the localvore websites (www.localvoreproject.org in Vermont) have shared
their various definitions for “local food.” Some have decided that local was anywhere
they could get to in a day’s bike ride, while for others it was two to three hours by car.
Some localvores limited themselves to what they could grow and what they could buy
from farmers they knew.
For many local food consumers, the interactions they have with farmers and other
community members help to define “local.” For these consumers, not only is the place of
origin important, but the relationship with the grower, whether it be at the farm stand, the

17
farmers’ market, or on the farm itself at a Community Supported Agriculture work day, is
necessary to create a sense of localness.
2.3.3. Bioregions and Foodsheds
Recently, local food enthusiasts and researchers have been considering bioregions
as “local” delineations, as well as foodsheds: “that sphere of land, people, and businesses
that provides a community or region with its food,” (Halweil, 2004). The concept of a
foodshed comes from environmental and ecological research on watersheds, which are
geographical areas encompassing networks of waterways from source to sink. Similarly,
a foodshed would be an area encompassing the entire distribution network of food items
from producer to consumer (Kloppenburg et al., 1996). By describing foodsheds, it is
possible to assess the food requirements of region in terms of the natural resources
available in that region.
While a clear definition of “local food” is lacking, there is general consensus that
the localness embodies more than place of origin when it comes to food; it might go as
far as to be instrumental in the maintenance of rural livelihood (DuPuis & Goodman,
2005). For the purpose of this study, however, “local food” was defined as having been
produced either within 30 miles of the point of purchase, or within the state – combining
Vermont’s definitions of local and native (VTDA, 2007).

18
The following chapters describe the methods used in this study, present the findings
analysis, discuss the results, and outline recommendations to consumer co-ops, farmers,
and local food advocates on ways to strengthen the local food market.

19
3. ARTICLE I: A QUANTITATIVE ANALYSIS OF FACTORS INFLUENCING
LOCAL FOOD PURCHASES BY CONSUMER COOPERATIVES
Many farmers and producers form strong ties with local consumers and receive
premium price for their products through local marketing of their products. Consumer
cooperatives (co-ops) play a role in the distribution of local food in the Northeast, and
may have a direct impact on the viability of many small farms. Benefits and barriers
exist for both farmers and co-ops that are engaged in the local food market. This study
explores the importance of the role played by co-ops in the local food market, and
investigates the effect that local food attributes and barriers to sourcing locally have on
co-ops’ sourcing of local food.
3.1. Background
The U.S. agricultural system is increasingly industrialized and designed for a
global market. Nearly every aspect of the food system is subject to consolidation, as the
largest commodity firms integrate vertically and horizontally, streamlining operations for
efficient large-scale production, processing, and distribution (Harris, Kaufman, Martinez,
& Price, 2002; Heffernan, 2000). This system, while benefiting from economies of scale
and Federal government subsidies at the commodity, as well as the transportation level,
has resulted in artificially low prices for consumers (Magdoff, Foster, & Buttel, 2000).
The effect on local and regional food systems is evident. The trend in recent decades has

20
been a decline of small family-owned farms and a virtual disappearance of local and
regional processing facilities as the more profitable large-scale processors have taken
control of the food system (Halweil, 2004).
In the last few years, however, out of concern for their health, their local
economy, food security and the environment, among other reasons, consumers have
grown interested in buying locally produced food. This has been manifest in an upsurge
of alternative food retail markets, including many direct sales markets such as
Community Supported Agriculture (CSA) farms and farmer’s markets. Consumer
cooperatives (co-ops), having recently played an important role in the building of the
organic food market (Bruschett, 2006), represent one of the possible local food sources
for consumers, especially when CSAs, farmer’s markets, and farm stands are closed for
the season. Local food has become such a significant part of agricultural marketing in
recent years that a series of bills have been introduced in Congress outlining strategies for
farmers to participate in local and regional markets (at the time of writing, an outline of
these bills was available online at www.farmandfoodproject.org). These, among others
included in the 2007 Farm Bill passed in the house with a vote of 231 to 191.
Local food has been the focus of much debate. Some proponents of local food
argue that its freshness renders it more nutritious, and therefore healthier. Many farm-to-
school programs have incorporated local agriculture modules into the schools’ curricula
to encourage children to eat more healthily (Croom, 2005; "Educating about
Agriculture,"; "PLACE program,"; "Sustainable Schools Project,"; "The Burlington Food

21
Project,"; "Vermont Food Education Every Day,"). While in the case of produce it may
be assumed that the time of harvest occurs when the fruit or vegetable is ripe (which is
often not the case when the produce is to be transported long distances), local food may
be produced conventionally, with the use of chemical pesticides – some residues of which
have been shown to be carcinogens (Reynolds et al., 2002).
Other local food enthusiasts seek out local foods to promote community and
economic development. In his book “Civic Agriculture: Reconnecting Farm, Food and
Community,” Lyson (2004) describes a 1946 study by Goldschmidt, commissioned by
the U.S. Senate. In this study, two California communities, “similar in population size,
shared value systems, and social customs” and both engaged in industrial agriculture,
were compared. The two communities differed in that one was made up of small-scale
farms and the other of fewer large-scale farms. The author observed that the large-scale
farming community had poorer schools, fewer parks and available social services, lower
living conditions, a more unstable population, and consisted primarily of wage-laborers
working for others. Lyson summarized that the differences between the two
communities in terms of their social and economic welfare were attributable to the
control workers had.
How much control agricultural workers have over their production continues to
have an effect on social and economic well-being. On average, in conventional food
production, producers have only a 10-cent return on every dollar spent by consumers,
while the remaining 90-cents goes towards packaging, shipping, and marketing (Halweil,

22
2004). Shuman (1998) suggests that supporting one’s local businesses, particularly local
agriculture, can be part of reclaiming control over local economies, while civic
engagement in agriculture can improve standards of living (Lyson, 2004).
Another important reason that some people choose local food over non-local food
is for its impact on the environment. The “organic” label, until recently was the more
powerful guarantee of sustainability on farms, but consumers have learned that,
especially on large-scale operations that replace pesticide-use with increased use of
tractors for cultivating, organic farms are not necessarily more sustainable than
conventional farms. Over-use of tractors results in soil compaction or erosion, and an
increase in on-farm use of fossil-fuel (Rigby & Caceres, 2001). Many local food activists
turn to sourcing their food locally in an effort to encourage more sustainable agricultural
practices on the farm, and especially to shorten the distance traveled by their food
(popularly called “food miles”); a direct measure to reduce CO2 emissions from food
transportation (Timmons, 2006). Over 60-percent of the energy expended in food
growing in the U.S. is from transportation (Heller & Keoleian, 2000), as food sold from a
U.S. supermarket has traveled an average of 1,495 miles (Pirog et al., 2001). This issue
may be one of the more fiercely contended, and is a central concern in this article.
It has been pointed out that the local food market requires that both producers and
consumers travel in order to distribute and purchase local goods. It is argued that having
multiple thousands of farmers driving vans and farm trucks – which are unlikely to be the
most efficient vehicles on the road – up to hundreds of miles to farmers’ markets every

23
day of the week results in higher greenhouse gas emissions than does the transport of
non-local goods from one side of the country or globe to another. While food miles are
relatively easy to calculate in the industrial food system, because data are available from
the distributors, it is almost impossible to measure the greenhouse gas emissions from
local food distribution because of the number of factors involved.
One of the attributes of a farmer’s market or a CSA farm is that consumers
participate in the experience of farming (Bruhn, Vossen, Chapman, & Vaupel, 1992; D.
Eastwood, Brooker, & Gray, 1999; Govindasamy et al., 2002; Jordan, 2006; J.
Kolodinsky & Pelch, 1997), and it serves not only as a source of food, but also
entertainment and social engagement. Were these local food outlets not available,
customers would of course purchase their food elsewhere, but might drive to another
location for their entertainment and social engagements, resulting in the same or greater
emission of greenhouse gasses overall.
There is little doubt that the local food market is growing. Not only are local food
sales increasing through alternative food retail outlets, such as CSA farms and farmer’s
markets, but conventional food retail outlets, including Whole Foods (Pollan, 2006) have
recognized and responded to the new demand. Even Wal-Mart, whose presence in
communities across the country is found to have a negative effect on the success of local
businesses (Artz & Stone, 2006), has recognized the economic benefits that sourcing
locally can have on the company’s profit margin. In Wal-Mart’s online fact sheet

24
publication on the company’s commitment to supporting sustainable agriculture2, one
reads the following in reference to locally grown food:
“Salute to America’s Farmers, launched in September 2006, is a year-long campaign to spotlight Wal-Mart’s long- standing commitment to purchase from local growers in support of locally grown agricultural products. Each month, Wal-Mart highlights four local growers, sharing their stories and demonstrating the commitment to local agriculture and farmers around the country.”
Further evidence of the growth potential of the local food market is in consumer
attitudes towards labeling. Pirog (2003 & 2004) found that his study participants
consistently responded more positively to “local” labels, and even “local – some
pesticides used,” than to “organic” labels that were without origin labels. As the organic
food sector has been the fastest growing food sector in the last decade, it could be that the
local food market will grow as quickly.
In light of this food trend’s growing popularity, if the distribution of local food is
in fact inefficient – as critiques of the trend suggest – it is necessary to improve the
system. This article begins to address local food distribution in the Northeast, where for
the most part, agriculture does not compete in the commodity market, and where the local
food market has grown significantly in recent years. In an effort to assess economic as
well as environmental sustainability of the local food market, this study targets consumer
co-ops to help identify both the reasons for and barriers to sourcing food locally.
2 This article can be found at: www.walmartfacts.com/FactSheets/652007_Sustainable _Agriculture.pdf

25
3.2. Food Distribution Research
The efficient and reliable distribution of food is central to a strong food system.
In the conventional food market, every aspect of food production and distribution is
followed closely and measured with the aim of increasing efficiency, and lowering costs.
There are few food distribution studies that look at organic food distribution (Pretty, Ball,
Lang, & Morison, 2005) and that discuss the cost of externalities such as pollution,
among other hidden costs, which are not accounted for in the price of goods found in
conventional food retail centers. For the most part, however, food distribution research
examines conventional food distribution systems, which are designed specifically to meet
distribution criteria.
The literature on conventional food distribution channels focuses on management
strategies (Cotterill, 1986, 1997; Kotler & Armstrong, 2006; Lyson & Raymer, 2000;
Narus & Anderson, 1996; Zwart, 1996), on transportation costs (Pretty et al., 2005), and
on marketing strategies and willingness to pay (Belcher, Germann, & Schmutz, 2007;
Maynard, Burdine, & Meyer, 2003; Narus & Anderson, 1996; Zepeda & Leviten-Reid,
2004). Willingness-to-pay studies have been important in helping to identify the product
attributes that appeal to consumers. Belcher et al. (2007), for example, found that
Canadian consumers were willing to pay a premium for beef that was high quality and
was raised in conditions that were not detrimental to the environment.
Two more models used in conventional food system studies are the Marketing
Channel Model and Supply Chain Management (SCM). The Marketing Channel Model

26
is often used by large-scale retail businesses, and involves a combination of input/output
analysis and marketing channel structure that describes how food flows in the market
place by calculating the quantities of utilization and waste in the marketing system.
Halldorsson and Arlbjorn (2005) describe a model that includes the areas of logistics,
operations management, marketing, and purchasing, among others, and describe SCM as
“fragmented and multidisciplinary” in nature. Reiner (2005) reviews SCM research and
concludes that empirical and simulation models, driven by quantitative data are
appropriate for the study of supply chain management. These studies are conducted with
conventional supermarkets, which are equipped to provide accurate and reliable
inventory data since streamlining the supply chain results in centralized operations and
bookkeeping. All these studies rely on inventory data provided by the distribution
centers as well as by the retail outlets.
In a study that compared modern and traditional food supply systems in Vietnam,
Cadilhon et al. (2006) used a combination of qualitative and quantitative approaches.
Interviews were conducted with supply chain stakeholders, and vegetable wholesalers
were surveyed. The authors observed that in both cases, supply chains were segmented,
and that while the modern food system was found to be more efficient and more
concerned with the quality of products, it was recommended that modern markets should
not replace traditional markets, which fulfill various other consumer needs not catered to
in the modern food system.

27
3.2.1. Local Food Distribution Research
There is a notable lack of research on the distribution of local food. This may be
from a dearth of available inventory and scanner data at alternative food outlets, as well
as a lack of centralized information regarding the many sources of local food. Whereas
the conventional market is closely monitored from source to sink, local food distribution
through alternative markets is decentralized and for the most part unmeasured.
Previous studies have identified food service providers’ perceived benefits and
obstacles in direct marketing, (Cottingham, Hovland, Lenon, Roper, & Techmann, 2000;
Gregoire, Arendt, & Strohbehn, 2005; Gregoire & Strohbehn, 2002b; Resources, 2003;
Strohbehn & Gregoire, 2003). Gregoire and Strohbehn (2002) used a combination of
semi-structured interviews and a paper survey to identify the barriers to and benefits of
sourcing locally. Initial interviews with food service administrators and coordinators
from a range of community and school-sizes served to develop a five-part survey. The
survey included Lykert-type 5-point scale ratings of twelve potential benefits and sixteen
potential barriers to sourcing locally. The remaining sections included open-ended
questions regarding current purchasing practices, demographic information, and
frequency of purchase for certain specific foods that could potentially be sourced locally.
The strongest perceived benefits were found to be engaging in good public
relations and aiding the local economy. Other strong benefits, which were identified as
the most important in communities of less than 1,000 inhabitants, were: being able to
purchase smaller quantities, fresher produce, and safer food. These findings are

28
consistent with consumer preference studies, which point to the same benefits of
purchasing local food (Govindasamy et al., 2002; Jordan, 2006; J. Kolodinsky & Pelch,
1997; Pirog, 2003, 2004; Wilkins et al., 1996; Wilkins et al., 2002; Zepeda & Leviten-
Reid, 2004).
The greatest perceived obstacles to sourcing locally were the unavailability of
local food year-round and the difficulty of finding adequate and consistent supplies.
These findings are supported in part by Cottingham et al. (2000) who stressed the
importance of growers and producers being able to provide a reliable supply of goods
year-round in order to compete with conventional suppliers. Other perceived obstacles
included dealing with multiple vendors, product cost, ordering methods, on-time
deliveries, and preparation and labor time, among others. Though no potential obstacles
were perceived to be “high obstacles,” all were rated as obstacles. The authors found no
difference in the rating of obstacles based on community size.
3.3. Conceptual Model
The local food network, depending considerably on personal interactions, lacks
both the infrastructure for the large-scale movement of food, and also the data to assess
the efficiency with which local food is currently distributed. This study pulls together
theory from general food distribution and evidence from studies on purchasing behavior
based on perceived food attributes and obstacles. This study adds to previous local food
studies by focusing on the role of consumer cooperatives (co-ops) in the local food

29
market; a retail outlet that has been little studied and that may play an important role in
the local food market. A simple model describes the different players and pathways
involved in local food distribution from producers to consumer.
Figure 1 illustrates these various pathways that locally or regionally produced food
can take from producer to consumer co-ops. Products may be:
1. Sold directly to consumer co-ops and delivered by the farmer;
2. Sold directly to the consumer coops but transported on the trucks of a distributor
for a fee;
3. Sold to a distributor who can store them, and who can sell them to consumer co-
ops;
4. Brought to a producer’s co-op and go through channels 1, 2, 3 or 5;
5. Sold to a processor and go through channels 1, 2 or 3.
Figure 2. Local food distribution through consumer co-ops
Producers
Processors
Distributors
Consumer Co-ops
Producer Co-ops

30
The contribution by co-ops in the Northeast is not known, nor is it known which
local products are likely to be purchased directly form the producer, to be distributed
regionally, or not produced for local markets at all. This paper begins to address vertical
collaboration between elements up and down the supply chain to the retail outlets, and
the model described below considers the economic and physical constraints that exist for
consumer co-ops with respect to sourcing local food.
Figure 2 illustrates the conceptual model upon which this research is based. Food
co-ops are organizations of consumers, and often act more directly on behalf of
consumers than more mainstream food retail outlets, which may have contractual
constraints. In this model, it is assumed that consumer demand (by co-op patrons) is
known to the co-ops themselves, and that co-ops purchase goods from their sources based
on demand. Depending on the size, membership, and structure of the co-op, it may be
run more like a conventional food retail outlet, or more like a buyer’s group.
Figure 3. Co-op local sourcing conceptual model
Source Co-ops
Attributes
Barriers

31
The sources in this model are the farms, processing facilities, producer co-ops, or
local food distributors that co-ops purchase local foods from. The large grey arrow and
the thin black arrows represent the transfer of local food by co-ops, as determined by
various attributes. One of the reasons outlined by the Northeast Organic Farm
Association (NOFA) for buying local foods is that farmers capture a greater portion of
the food dollar. Other attributes may include consumer demand, quality and abundance
of supply, price (Gregoire et al., 2005; Gregoire & Strohbehn, 2002b; USDA, 2001) as
well as proximity to farms – and diversity of farms, available infrastructure,
environmental benefits, broader economic benefits, and others. The strength of the
connection between the source and the co-ops is contingent on the strength of the
attributes, as is represented by the single large arrow, and the three thin arrows. Whether
one strong attribute is sufficient to provide the impetus for a co-op to purchase food
locally, or whether several attributes work simultaneously is not yet known.
The vertical black lines represent barriers for farmers and distributors to sell to co-
ops (line closer to source) and for co-ops to buy food from local sources (line closer to
co-ops). These barriers could include cost, consumer demand, quantity demanded,
infrastructure and logistics (trucks but no loading docks or vice versa, no storage space,
etc), dealing with multiple suppliers, and others (Gregoire et al., 2005; Gregoire &
Strohbehn, 2002b). By identifying the single most important attribute – or the best
combination of attributes – that allows co-ops to source locally, as well as the prevalent
barriers both for co-ops and for farms/distributors, it will be possible to make

32
recommendations to co-ops, farmers, distributors, and policy-makers, highlighting ways
to enhance the attributes, and alleviate the barriers where possible.
The following section describes how this model is implemented in a study of
consumer co-ops in the American Northeast.
3.4. Study objectives and Hypotheses
The objectives of this study are to:
• Identify the attributes of local food that encourage co-ops to source food locally;
• Identify barriers that prevent co-ops from sourcing local food, both directly from
farmers and through regional distributors;
• Identify specific products, or product types that are notably successful, abundant,
or absent in the local market;
• Measure the value of consumer co-ops’ contribution to the local food market.
The general hypothesis tested in this study is that the percent of each co-op’s
expenditure on local food is determined by an interaction between the perceived strength
of various local food attributes and the barriers to sourcing locally. Further, it is
hypothesized that co-op rank (small, medium, or large3), setting (urban, suburban, rural),
and whether sourcing locally was explicit in the co-op’s mission statement is related to
the percent sourced locally.
3 Cooperative Grocer Ranking: Small = <$1.2 million; Medium = <$8.5 million; Large = >$8.5 million, total sales.

33
The following section describes how these hypotheses were tested in a study of 67
northeastern consumer co-ops.
3.5. Methodology and Survey Design
Consumer cooperatives (co-ops) play an important role in the local food market in
the Northeast. By definition, co-ops are run democratically by their members, and what
they carry for sale, therefore, represents the tastes and preferences of their members.
Interest in local food has increased over the past few years (Ness, 2006), and co-ops may
be leading the charge with this food fad as they did with natural food and organics,
(Wilkins et al., 2002). The survey used in this study was designed to identify the
prevailing attribute - or group of attributes – of local food that motivates consumer co-ops
to seek out local sources of food, as well as the barriers co-ops are faced with when
sourcing locally. The surveys were followed up with conversations with co-op managers
and member workers, which did not follow a strict guideline. Data-collection, analysis
and results are presented in the following sections.
3.5.1. Data
The data set used in this analysis comes from a survey of managers and working
members of 67 consumer co-ops in the 13 northeastern states4. Co-ops were found
through various directories available online, including greenpeople.org and
4 Northeastern states: ME, NH, VT, NY, NJ, MA, RI, CT, PA, DE, MD, WV, and VA.

34
coopdirectory.org, as well as the National Co-op Directory published by George Keller.
Buying clubs5 were excluded from the sample, as were college-run co-ops, which were
not in operation at the time of data-collection. The survey was distributed through the
mail, e-mail, and conducted over the telephone to acquire the maximum response-rate.
Of the original list of 96 co-ops, 28 were no longer operating, or otherwise unreachable,
one was not yet in operation. The survey elicited a total of 67 usable responses.
The survey used in this study combined two Likert-type question sections with
demographic and descriptor questions. Background information was obtained from each
co-op, including physical size of the retail store and storage capacity, Cooperative Grocer
ranking6, and mission statement. In addition to demographic information and
descriptions of the co-op, managers and member workers were asked a combination of
Likert-type scale and open-ended questions regarding the reasons for sourcing locally as
well as the barriers. In the first section, respondents were asked to rate each listed local
food attribute on a scale of 1-5, 1 being a “very weak reason” for sourcing locally and
five being a “very strong reason” for sourcing locally. Similarly, in the second section
respondents were asked to rate the barriers to sourcing locally on a scale from 1-5, where
1 was a “very weak barrier” and 5 was a “very strong barrier”.
5 Buying club: Typically, these are composed of seven or more families who share the chores of collecting money from the member families, placing the order with the distributor, helping unload the truck when it arrives at the drop-off site and dividing up the individual orders. 6 Cooperative Grocer Ranking: Small = <$1.2 million; Medium = <$8.5 million; Large = >$8.5 million, total sales.

35
Likert-type scales are used in persuasion studies, and have been shown to be
reliable measurements of attitude (Edwards, 1957). Groups of related questions can be
reduced to several latent variables that represent each group by performing factor analysis
(Harmon & Maretzki, 2006; Jane Kolodinsky & Hogarth, 2001). These created variables
can later be used in regression analysis to identify relationships between the major
components of the different groups (in this research, the two groups are reasons for
sourcing locally and barriers to sourcing locally) and a given variable.
To identify the local food attributes and barriers to sourcing that should be
included in the survey, we turned to existing literature. The top reasons identified by a
2002 USDA survey of consumer co-op shoppers as well as the reasons identified by
Gregoire and Strohbehn (2002b) were used in the first Likert-type section.
Reasons for sourcing locally suggested in this survey included: - Consumer demand - Quality of local products - Supply of local products - Relationship with producers - Cost of local products - Ethical reasons - Political reasons - Environmental reasons
The possible barriers to sourcing locally were identified through several
preliminary telephone interviews with Vermont co-op managers, and were in keeping
with what Gregoire and Strohbehn (2002b) reported in their findings.
Barriers to sourcing locally used in this survey included:

36
- Consumer demand - Quality local products - Supply of local products - Infrastructure (distribution and logistics) - Cost of local products - Multiple vendors
Respondents were also given the opportunity to include attributes of local food
and barriers to sourcing locally that were not provided in the survey.
In a final section, co-op managers and member workers were asked to report how
frequently various local food items were sourced, what percentage of all food sourced
was local, and the number of local producers they sourced from. A list of food categories
was provided, and respondents were asked to identify whether each food type was
sourced “never”, “seldom”, seasonally” or “year-round”. The list of food categories
included:
-Fish -Nuts -Fruit -Vegetables -Milk -Meat -Other dairy (cheese, yogurt, butter) -Preserves (jam, pickles, canned goods, salsa) -Baked goods
For an example of the survey, see Appendix A.
The strength of each attribute and barrier was analyzed with the Statistical
Package for the Social Sciences (SPSS) 16.0. Cross-tabulations were conducted to
determine the relationship between co-ops of different states, Cooperative Grocer ranking

37
(large, medium, and small), and location (urban, suburban, or rural) differed in their
rating of reasons for, and barriers to sourcing locally; which local items are sourced and
with what frequency (never, seldom, seasonally, year-round); the percent of their total
expenditure spent on food sourced locally; and the number of local producers sourced
from.
Factor analysis was used to reduce the groups of eight local food attributes and six
barriers to sourcing locally into two sets of representative variables. Principal component
extraction with varimax rotation was used, and resulted in three local food attribute
components with initial Eigenvalues of 1 or greater, accounting for 73.9-percent of the
variance within the group. The Eigenvalues and what each component represents are
presented in Table 1.
The first component is most strongly correlated with “political” and “ethical”
reasons for sourcing locally; the second component is most strongly correlated with
“quality;” and the third component is most strongly correlated with “demand.”
Three components meeting the same criteria were created from the barriers to
sourcing locally, and these account for 70.5-percent of the variance within the group.
Each component was retained as a new variable, and used in a regression model to
explain the variance in percent locally sourced by consumer co-ops. The Eigenvalues and
what each component represents are presented in Table 2.

38
Table 1. Description of principal component extracted from reasons for sourcing locally
Component 1 2 3 Political/ Ethical Product Quality Consumer Demand
Eigenvalue % of variance Cumulative % of variance
3.220 40.25 40.25
1.549 19.35 59.613
1.139 14.239 73.852
Demand Quality Supply Relationship w/ producers Cost Ethical Political Environmental
-.152 .114 .021 .394 .285 .891 .911 .633
-.003 .892 .677 .237 .610 .168 .031 .509
.907 -.151 .414 .733 .283 .059 .043 -.026
Note: Extraction Method: Principal Component Analysis; Rotation Method: Varimax with Kaiser Normalization.
Table 2. Description of principal component extracted from barriers to sourcing locally
Component 1 2 3 Infrastructure/Cost Product Quality Multiple Vendors
Eigenvalue % of variance Cumulative % of variance
1.976 32.941 32.941
1.198 19.966 52.907
1.057 17.609 70.516
Demand Quality Supply Infrastructure Cost Multiple vendors
.121 -.004 .522 .802 .783 .348
.787
.837
.237
.266 -.132 .178
.047 -.019 -.655 -.020 .156 .784
Note: Extraction Method: Principal Component Analysis; Rotation Method: Varimax with Kaiser Normalization.

39
The first component is most strongly correlated with “infrastructure” and “cost”
reasons for sourcing locally; the second component is most strongly correlated with
“quality;” and the third component is most strongly correlated with “multiple vendors.”
3.6. The Local Food Sourcing Model
As described in Figure 2, the model tests whether reasons for and barriers to
sourcing locally have an effect on co-ops’ expenditure on local foods. Also included in
the model are co-op characteristics, such as setting (urban, suburban, rural), Cooperative
Grocer rank (small, medium, small), and whether sourcing locally is part of their mission
statement.
The regression model can be expressed as the following equation:
∏C1 = ß1PolEth + ß2Qual1 + ß3Demand + ß4InfraCost + ß5Qual2 + ß6Vendors + ß7RuralDUM + ß8UrbanDUM + ß9LargeDUM + ß10SmallDUM + ß11MissionDUM + e1,
where ∏ is the percent locally sourced for Co-op 1. The three components extracted
from the group of eight reasons for sourcing locally (see Table 1) are represented by
ß1PolEth, ß2Qual1, and ß3Demand. The three components extracted from the group of
six barriers to sourcing locally (see Table 2) are represented by ß4InfraCost, ß5Qual2, and
ß6Vendors. ß7RuralDUM and ß8UrbanDUM represent the dummy variables for the settings
rural and urban, respectively. ß9LargeDUM and ß10SmallDUM represent the dummy
variables for the Cooperative Grocer rankings large and small, respectively. Finally,

40
ß11MissionDUM represents the dummy variable for whether “local food” is specifically
mentioned in the co-op’s mission statement.
The null hypothesis for each variable is that the coefficient is not significantly
different from zero, meaning the variable has no impact on the dependent variable. The
alternative hypotheses are expressed in Table 3 below as expected signs. In other words,
this model tests whether these variables have an effect on how much co-ops are able to
source locally.
Table 3. Variable definition and expected influence on dependent variable
Variable Definition Expected Sign ∏C1 Percent locally sourced/ number of farms sourced
from Dependent
ß1PolEth Reasons Component 1: Political/Ethical + ß2Qual1 Reasons Component 2: Quality + ß3Demand Reasons Component 3: Demand + ß4InfraCost Barrier Component 1:
Infrastructure/Cost -
ß5Qual2 Barrier Component 2: Quality
-
ß6Vendors Barrier Component 3: Multiple vendors
-
ß7RuralDUM Rural dummy equals 1 if rural Control ß8UrbanDUM Urban dummy equals 1 if urban Control ß9LargeDUM Cooperative Grocer ranking Large dummy equals 1
if large Control
ß10SmallDUM Cooperative Grocer ranking Large dummy equals 1 if large
Control
ß11MissionDUM Mission dummy equals 1 if local foods are in the mission statement
+
41
Hypothesis: Based on the conceptual model (Figure 3), it is hypothesized that a
combination of reasons for sourcing locally (local food attributes), barriers to sourcing
locally, and co-op attributes (such as size, location, Cooperative Grocer ranking) will
determine what percent of a given co-op’s total food purchases will be from local
sources.
The following section presents the results and analysis of these procedures.
3.7. Results and Analysis
3.7.1. Descriptive Analysis
The survey introduced in the previous section produced 67 valid responses,
representing a census of consumer co-ops in 13 northeastern states7, excluding student-
run co-ops at colleges and universities, as well as buying clubs. The number of co-ops
per state ranges from one in Rhode Island, Connecticut, Delaware, and West Virginia to
thirteen and fifteen in Vermont and New York, respectively. The distribution of co-ops
between New England and non-New England states is 33 to 34. Half of all co-ops are
located in suburban areas, almost 36-percent are urban and just over 13-percent are in
rural settings. Fifty-two percent of co-ops are ranked Small by the Cooperative Grocer
7 Northeastern states: VT, ME, MA, NH, RI, CT, DE, NY, NJ, PA, MD, WV, VA.

42
standards8, 35-percent are ranked Medium, and 13-percent are ranked Large. Two-thirds
of all co-ops explicitly mention local foods in their mission statement.
On Average, co-ops in the northeast source a little over 17-percent of their food
products from local producers and regional distributors, and source from an average of 40
farms. An estimate of the value of the local food market through co-ops calculated based
on percent sourced locally and Cooperative grocer rankings is $21,253,750-worth of local
goods. This is a conservative estimate, and as many co-ops were unable to share specific
financial data a more exact calculation is not possible. It is estimated that thirteen
Vermont co-ops sell almost $4 million-worth of local food annually, which is particularly
significant when compared to the total in direct sales of local food – including all CSA
farms, farmer’s markets, and farm stands (over 200 local food outlets) – in the state,
which was $9.5 million, as reported in the 2002 Census of Agriculture.
Reasons for and barriers to sourcing locally:
The strongest reasons for sourcing locally are environmental concerns,
relationships with producers and ethical reasons (median score of 5, “very strong
reason”). In Figure 3, ratings are combined to create three groups “weak reason”
(combining “very weak” and “weak”), “neutral reason”, and “strong reason” (combining
“strong” and “very strong”). The figure illustrates the uniformity among co-op managers
8 Cooperative Grocer Ranking: Small = <$1.2 million total sales; Medium = <$8.5 million total sales; Large = >$8.5 million total sales.

43
in sourcing local food for these three attributes. The cost and the supply of local food are
the weaker reasons for sourcing locally.
Figure 4. Distribution of responses for the three top reasons for sourcing locally
Respondents were given the opportunity to write in any other reasons, or local
food attributes that led their co-op to source locally. These reasons, reported in Table 4,
are consistent with research on sourcing food locally (Gregoire & Strohbehn, 2002b)
identifies good public relations and aiding local economies among the top reasons. They
are also consistent with research on consumer co-ops, which reportes a strong concern for
the environment reflected in purchasing decisions (Sommer, 1998). No difference is
found between co-ops of different states, different sizes, different locations, or different
ranking in terms of their reasons for sourcing locally.

44
Table 4. Response rate for “other” local food attributes (N=47)
Reason for sourcing locally Percent Local economy 34.3 Community building 7.5 Freshness/health 3.0 Sustainability 7.5 Marketing 6.0 Preserving ag land, farmers 11.9
The two greatest barriers to sourcing locally are the limited supply of local goods
and distribution and logistics. The least problematic are consumer demand, i.e.,
consumers do not avoid local products, and the quality of goods, i.e., the quality is good
enough. As Figure 4 shows, the degree to which various potential barriers are
problematic varies more greatly than do the reasons for sourcing locally. No difference is
found, however, between co-ops of different states, different sizes, or different ranking in
terms of the barriers to sourcing locally, suggesting that these differences are based on
other factors. This is consistent with research by Gregoire and Strohbehn (2002) who
found no difference in obstacles to sourcing locally based on town-size.

45
Figure 5. Distribution of responses for the three top barriers to sourcing locally
Other barriers not included in the Likert scale but mentioned by respondents are
presented in Table 5.
Table 5. Response rate for other barriers to sourcing local food (N=44)
Reason for sourcing locally Percent Vendor coordination 16.4 Short season 14.9 Marketing 10.5 Unavailability 9.0 Vendor selection 4.5 Organic certification (lack) Selling out Price perception Competition with other retail
4.5 3
1.5 1.5

46
Considering that co-op managers seem to agree that there are strong positive
attributes to local food, and that the barriers are overall not very strong, it may be
surprising to see that as only an average of 17-percent, and as little as <1-percent of all
food sold in co-ops is sourced locally. “Supply of goods” is rated a 3, which is a
“neutral” response. Looking more closely at what items are and are not available locally
may shed light on this discrepancy.
What local food is sourced:
To identify the strengths and weaknesses of the local food market, a first
necessary step is to know what food types are currently being sourced, and which are not.
Some foods may simply not be produced where there is a demand for it. In other
instances both the local product and the demand for it exist, but the co-op manager may
not have identified a source.
Co-op managers were asked to report how frequently various food items were
sourced locally. Table 6 reports the results for what local foods were sourced by least to
most consistently. The lowest possible score was 0 (for never) and the highest possible
score was 3 (for year-round).

47
Table 6. Results for the Frequency with which various local food types were sourced
Category Mean Score Nuts 0.26 Fish 0.47 Preserves 1.91 Milk 2.0 Fruit 2.02 Produce 2.27 Other Dairy 2.27 Meat 2.3 Cheese 2.39 Baked Goods 2.67 Syrup/Honey 2.76 Eggs 2.85
The gap in sourcing locally due to seasonality, or general availability of local
products may have an effect on the overall percent a co-op is able to source locally.
When the products are not in season or are otherwise not available, co-ops must source
them through conventional distributors.
No difference is found between co-ops of different states, different sizes, different
location or different ranking in terms of what they source locally, and with what
frequency.
Correlations, however, do exist between several other variables. Co-operative
grocer rank is negatively correlated to town setting, meaning that “Large” co-ops are
located in more urban settings, while “small” co-ops are found in more rural areas.
Percent bought locally is positively correlated with number of local farms sourced from,

48
i.e. the more a co-op sources locally, the greater the number of farms sourced from, and
vice versa.
Statistical analyses were performed to determine the relationships between
different co-op characteristics, reasons for or barriers to, sourcing locally and the strength
of predictability of how much a given co-op will source locally based on the combination
of characteristics. The results from these are presented next.
3.7.2. Bi-variate analysis
Cross-tabulations with Chi-Square test of independence were conducted, using
Kendall’s Tau-b and Gamma as the measures of association, to identify any relationship
between State, Rank, or Setting (rural, suburban, urban) with reasons for, and barriers to
sourcing locally. Results suggest a significant relationship for the barrier
“Infrastructure,” and the barrier “Multiple Vendors” approaches significance. See Table
7 for cross-tabulation results.
Table 7. Cross-tabulation of cost as a barrier by setting (n=64)
Barrier Rural Suburban Urban Total Infrastructure Not problematic
Neutral Problematic
44.6% 66.7% 11.1%
38.2% 23.5% 38.2%
18.18% 18.18% 63.64%
29.2% 27.7% 43.1%
Chi-Sq: 1.236 Sig = 0.015
Total Count
9 34 22 65
Multiple Vendors Not problematic Neutral Problematic
66.7% 33.3% 0%
45.45% 39.4% 15.15%
36.36% 22.72% 40.9%
45.3% 32.8% 21.9%
Chi-Sq: 8.707 Sig = 0.069
Total 9 33 22 65

49
As the remaining tests failed to reject the null hypothesis, it may be suggested that
co-ops source locally for the same reasons, value the same local food attributes, and are
faced with similar barriers. This is consistent with previous research (Gregoire &
Strohbehn, 2002b) that shows that ratings of obstacles to sourcing locally as well as
amount sourced locally are not significantly different between communities of different
sizes.
3.7.3. Regression Analysis
Hypothesis: Based on the conceptual model (Figure 2), it is hypothesized that the
variation in consumer co-ops’ expenditure on local food is attributable in part to each co-
op’s perception of local food attributes as well as the barriers to sourcing locally, along
with various characteristics of the co-ops themselves.
The three components extracted from the eight reasons for sourcing locally –
representing Political/Ethical reasons, Quality, and Demand – and the three components
extracted from the six barriers to sourcing locally – representing Infrastructure, Quality,
and working with Multiple Vendors – are used in the regression analysis. Also included
are five dummy variables: rural setting, urban setting, high Cooperative Grocer ranking,
low Cooperative Grocer ranking, and whether local food was part of the co-op’s mission
statement.
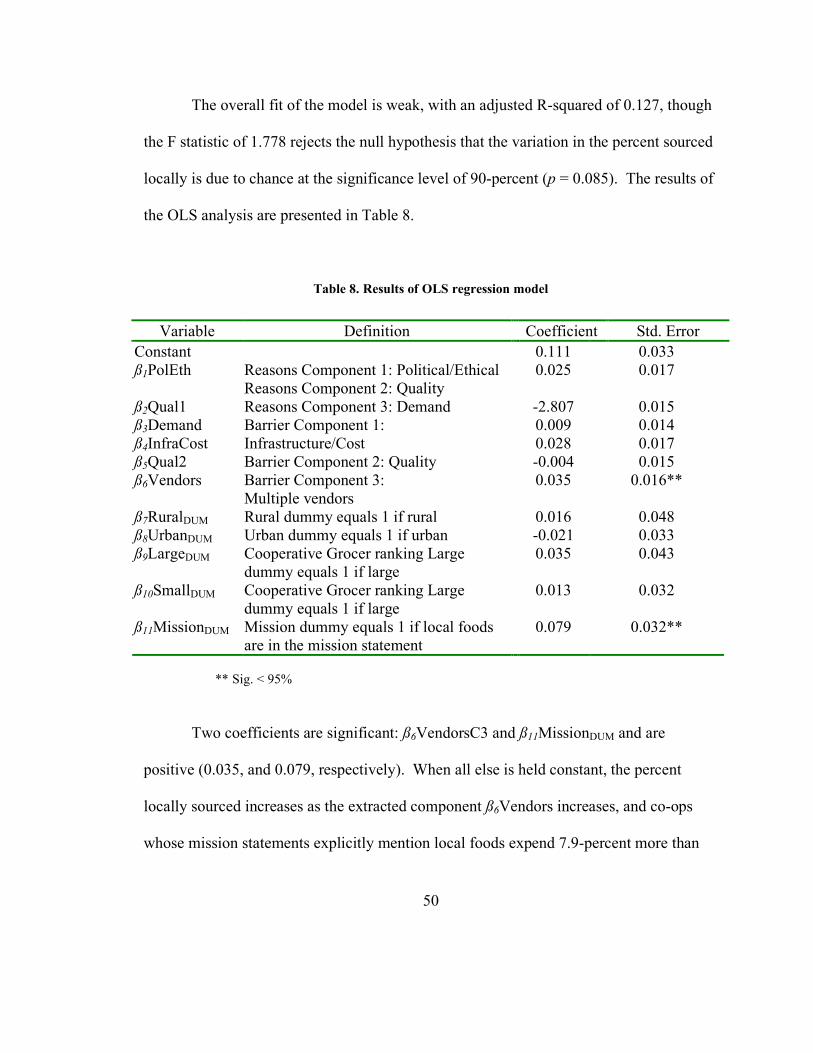
50
The overall fit of the model is weak, with an adjusted R-squared of 0.127, though
the F statistic of 1.778 rejects the null hypothesis that the variation in the percent sourced
locally is due to chance at the significance level of 90-percent (p = 0.085). The results of
the OLS analysis are presented in Table 8.
Table 8. Results of OLS regression model
** Sig. < 95%
Two coefficients are significant: ß6VendorsC3 and ß11MissionDUM and are
positive (0.035, and 0.079, respectively). When all else is held constant, the percent
locally sourced increases as the extracted component ß6Vendors increases, and co-ops
whose mission statements explicitly mention local foods expend 7.9-percent more than
Variable Definition Coefficient Std. Error Constant ß1PolEth ß2Qual1 ß3Demand ß4InfraCost ß5Qual2 ß6Vendors ß7RuralDUM ß8UrbanDUM ß9LargeDUM ß10SmallDUM ß11MissionDUM
Reasons Component 1: Political/Ethical Reasons Component 2: Quality Reasons Component 3: Demand Barrier Component 1: Infrastructure/Cost Barrier Component 2: Quality Barrier Component 3: Multiple vendors Rural dummy equals 1 if rural Urban dummy equals 1 if urban Cooperative Grocer ranking Large dummy equals 1 if large Cooperative Grocer ranking Large dummy equals 1 if large Mission dummy equals 1 if local foods are in the mission statement
0.111 0.025
-2.807 0.009 0.028 -0.004 0.035
0.016 -0.021 0.035
0.013
0.079
0.033 0.017
0.015 0.014 0.017 0.015
0.016**
0.048 0.033 0.043
0.032
0.032**

51
co-ops whose mission statements do not. It follows that a co-op’s intention to source
locally would result in higher percent sourced locally. It is less clear why as working
with multiple vendors is perceived as a greater and greater barrier, expenditure on local
food should also increase. This variable may be acting as a proxy for another variable
(number of farms sourced from, for example).
Table 2 outlines the expected signs for each coefficient. The three components
extracted from reasons for sourcing locally were expected to have positive signs,
meaning that expenditure on local food would increase as reasons were perceived to be
stronger. The results suggest the opposite is true in the case of quality. It may be that
other factors included in this component contribute to the impact this component has on
the dependent variable.
The three components extracted from the barriers to sourcing locally were
expected to have negative signs, meaning that expenditure on local food would decrease
as barriers became stronger. Table 8 shows that only Qual2 (quality) has a negative sign.
Both InfraCost (infrastructure and cost) and Vendors (working with multiple vendors)
result in positive signs. More research is necessary to account for these discrepancies as
well.
From this model we learn that, when all else is held constant, co-ops that have
adopted sourcing local food as part of their mission source 7.9-percent more from local
farms and producers than do co-ops that have no mention of local food in their mission
statement. A calculation of total local food sales through co-ops, based on co-op rank

52
and percent sourced locally, shows that the twenty-five co-ops that have not adopted local
foods in their missions sell $4,801,000-worth of local food annually9. A more accurate
estimate requires financial data from each co-op; such data were not available for this
study. A 7.9-percent increase in local food sales for this group of co-ops would result in
$379,279 more spent in the local food market annually. While this sum appears
insignificant in our multi-billion dollar food industry, even small changes in local
economies can have far-reaching effects (Hoffer, 2000).
Table 9 shows that co-ops found in the suburbs and urban areas, and that are
ranked medium and large by the Cooperative Grocer standard have the greatest economic
impact in terms of sourcing local food. A 7.9-percent increase in local food sales from
the four large co-ops alone would result in $255,170 more in local food sales annually.
Table 9. Total locally sourced and mean percent locally sourced: Rank by Setting (N=67)
Setting Mission?
Rank Small Medium Large
Rural Y N Suburban Y N Urban Y N
$105,000 17.5% (6) $25,000 25% (1) $165,000 18.3% (9) $90,000 12.9% (8) $135,000 19.3% (7) $28,000 9.3% (4)
$360,000 30% (1) $300,000 25% (1) $1,464,000 17.4% (7) $648,000 13.5% (4) $1,320,000 15.3% (7) $480,000 13.3% (3)
-- -- $8,330,000 32.7% (3) $2,550,000 10% (3) $4,675,000 27.5% (2) $680,000 8% (1)
9 For this calculation, the mean total sales is set at $100,000 for co-ops that rank small. The actual mean is not known as the data are missing. The calculation sets total sales at $1.2 million and $8.5 million for medium and larger co-ops, respectively. A more conservative estimate, based on a mean annual sale of $75,000, yields an annual total of local food sales at $4,765,250.

53
3.8. Conclusions
The regression model tested rejects the null hypothesis and supports the
hypothesis that the variation in consumer co-ops’ expenditure on local food is attributable
in part to each co-op’s perception of local food attributes as well as the barriers to
sourcing locally, along with various characteristics of the co-ops themselves. This
combination of factors explains 12.7-precent of the variation.
Although the regression model is weak, the lack of explanation may itself provide
some insight. The fact that the ratings for reasons for and barriers to sourcing locally do
not vary enough among co-ops of different rank, setting, or other characteristics to result
in statistically significant findings highlights the possibility that consumer co-ops source
locally for similar reasons, and are faced with similar barriers. Co-op managers and
member-workers agree with school foodservice providers (Gregoire & Strohbehn, 2002b)
and restaurant owners (Strohbehn & Gregoire, 2003) that there are benefits to sourcing
locally, which include protecting the environment, fostering good relationships with
producers, and supporting the local economy.
This is important for policy-makers who have recognized that the local food
market is well established and growing, and who are looking for ways to improve the
market. Education and research can reinforce the benefits and positive attributes of a
local and regional food system, while further research and collaboration among interest
54
groups can begin to address and alleviate the barriers to a viable and sustainable local
food system.
This model reveals that co-ops whose mission statement includes sourcing food
locally overall source 7.9-percent more from local sources than do co-ops without
sourcing local food as part of their mission. The 2002 USDA census reports that 94
percent of all farms are small or limited-resource farms that provide an average net
income of less than $25,000. Encouraging those co-ops that have not included sourcing
locally in their mission statement to do so may result in more local food being distributed
through co-ops. This can have a substantial impact on small farms in the region that
depend on direct and local sales as strategies to market their products.
Whether sourcing local food is part of a co-op’s mission does not appear to be
related to Cooperative Grocer rank or setting, so further study is necessary to better
understand why some co-ops are less committed than others to sourcing locally. Previous
studies have suggested that some barriers can be alleviated by fostering better
communication up and down the supply chain, and encouraging farmers to join forces for
the distribution of their products and to minimize transactions with the retail outlets (in
this case co-ops) by identifying one farmer to represent the group (Gregoire & Strohbehn,
2002b).
This study identified seasonality and the unavailability of products as barriers to
sourcing locally. Immediate steps can be taken to develop and implement season-
extension practices on-farm, organizing shared resources for preserving and storing food,

55
and to encourage the production of goods that are currently lacking in the local food
market: fish, nuts, and preserved food. Addressing the specific barriers to sourcing
locally may allow some of these co-ops to make it their mission to source more food
locally.
The quantitative analysis is useful to delineate the categories among the 67
consumer co-ops in the Northeast. Follow-up conversations with 58 co-op managers and
member-workers further describe the complexity of motivations for and barriers to
sourcing locally, and shed light on the varied experiences of sourcing local food. The
following section outlines the process and presents the analysis of the qualitative follow-
up interviews.

4. ARTICLE II: BARRIERS THAT INHIBIT CONSUMER CO-OPS FROM
ACHIEVING THEIR POTENTIAL IMPACT ON THE LOCAL FOOD MARKET
IN THE NORTHEAST
4.1. Introduction
Consumer cooperatives (co-ops) could become the necessary hub that the local
food market needs in order to grow. Managers and members of consumer co-ops are
aware of a positive impact that consumer co-ops – these “businesses with a conscience”
(Moyer, 1981) – have had on the organic food movement in recent decades and that they
may have a similar influence on the strength and viability of the local food market.
Consumer co-ops are among the direct and non-direct outlets for that many farmers
depend on to distribute their products. Co-op managers are responsive to the increase in
consumer demand for local products, and local farms are able to produce more, and yet
certain barriers prevent co-ops from sourcing locally as there is a demand for. This paper
investigates whether co-ops have reached their capacity in terms of sourcing locally, and
which barriers inhibit them from having a greater impact in the local food market.
4.2. Background
Consistently, reasons for sourcing food locally include care for the environment,
contributing and strengthening the local economy, and health – both of the on-farm
practices and of the food (Croom, 2005; Gregoire & Strohbehn, 2002a, 2002b; Halweil,

57
Prugh, & Worldwatch Institute., 2002; Roininen et al., 2006; Strohbehn & Gregoire,
2003). Barriers to sourcing from local producers include the availability of products
year-round, the consistency of product quality and packaging, multiplicity of vendors,
and variety of payment procedures (Gregoire & Strohbehn, 2002a, 2002b; Strohbehn &
Gregoire, 2003). Farmers and producers similarly have reasons to look for local markets,
and are faced with their own set of barriers, (Gregoire et al., 2005). By engaging in direct
marketing of products farmers can increase farms’ profit margins (Agriculture., 2001), as
well as provide their customers with a fresher, healthier product that has traveled only a
short distance. Barriers to engaging in the local market include among others: the lack of
dependable markets, limitations on pricing, and not being able to produce to quantity
required, (Gregoire et al., 2005; Gregoire & Strohbehn, 2002b).
While data on the reasons and barriers to sourcing locally exist for schools,
institutions, and restaurants, to date no published work has empirically assessed the
perceived benefits and barriers of sourcing locally from the perspective of consumer co-
ops. Studies have been conducted with co-op shoppers and members regarding the
attributes of local food (Brown, 2003; Bruhn et al., 1992), and these are consistent with
results regarding reasons for sourcing locally by schools, institutions, and restaurants.
Co-ops are unlike institutions and restaurants in that, by definition, they are
groups of consumers who make decisions through a democratic process. They typically
operate out of retail facilities and are open to the general public, and limiting their special
services, prices, or benefits to members only. Unlike conventional food retail outlets,
58
however, what the co-op purchases – either for the exclusive use of its members if it is a
buying club or a participatory co-op, or for the community at large if it is a traditional
consumer co-op – reflects the consumer preferences of its members, and is not directly
influenced by what food manufacturers want to sell (Cotterill, 1986, 1997). Co-ops
therefore serve a function by providing consumers with products that offer the desired
attributes: lower priced for bulk, environmentally or socially friendly (organic of fair
trade), or locally produced.
More and more, farmers are engaging in direct sales of their products by
participating in farmer’s markets or using the Community Supported Agriculture (CSA)
model. While some CSA farms offer winter shares, farmer’s markets close at the end of
October or in November, and do not start up again until the spring. Co-ops provide
farmers with a year-round outlet for their products, outlets that stay open even during
inclement weather, and whose patrons have a penchant for healthy, natural, and seasonal
foods (Sommer, 1998; Wilkins et al., 1996; Wilkins et al., 2002).
The first American consumer food co-op was established in 1822 in New York
City, and many more were created during the great depression (Zeuli & Cropp, 2004).
Today, consumer co-op membership, in the U.S., including buyer’s clubs, is estimated at
over 620,000 with a retail value of $600 million. There are 67 Consumer co-ops in the
Northeast10, excluding college campus-based student run co-ops, member-only co-ops,
and those who are open to non-members as well. A conservative estimate of annual
10 Northeastern states: ME, NH, VT, NY, NJ, MA, RI, CT, PA, DE, MD, WV, and VA.

59
expenditure on local food by these co-ops is $21,253,750, representing a little over 17-
percent of total food expenditure. While this may seem inconsequential within the
multi-billion dollar food system in the country, the impact on local economies and small-
scale regional agriculture could be great.
One of the strongest roles that co-ops can play in the local food market is that of
networking. Mark Goering of the Brattleboro VT co-op wrote about the shift in strategic
thinking that took place in 2002, wherein the co-op would no longer be thought of as
simply a retail store but as the community that encompasses it. Further, subsequent
meetings with neighboring co-ops brought about the notion that each of those co-ops was
an entire community as well. The final progression was to view all of those communities
as a single unit. Strengthening networks within communities and among co-ops offer
local producers expanding opportunity to grow the market through the sharing of
information and the fostering of relationships.
Are the barriers to sourcing locally preventing co-ops from fulfilling their
function as a hub for local food distribution? Can these barriers be alleviated, allowing
co-ops whose mission it is to source locally to do so efficiently, cost-effectively, and
sustainably? These were some of the questions asked of co-op managers and member-
workers in the Northeast.

60
4.3. Data
The data for this study are from descriptive interviews with consumer co-op
managers and member-workers in the American Northeast. These interviews were
conducted as follow-up to a survey of the 67 co-ops in the Northeast. It was found that
two-thirds of co-ops in the Northeast have made it part of their mission to sourcing food
locally, and that on average those co-ops expend 7.9-percent more on local food than co-
ops that have not adopted sourcing local food as part of their mission. The strongest
reasons for sourcing locally were environmental, relationships with producers and ethical,
whereas the greatest barriers to sourcing locally were the supply of goods, distribution
and logistics, and working with multiple vendors. In an open-ended section, respondents
reported that vendor co-ordination, the short growing season, marketing, and vendor
selection also prove to be important barriers. These are shown in Table 10.
Table 10. Response rate for other barriers to sourcing local food (N=44)
Reason for sourcing locally Percent Vendor coordination 16.4 Short season 14.9 Marketing 10.5 Unavailability 9.0 Vendor selection 4.5 Organic certification (lack) Selling out Price perception Competition with other retail
4.5 3
1.5 1.5

61
This study focuses on the follow-up interviews conducted with 58 self-selected
co-op managers and working-members from co-ops in the American Northeast.
Unstructured interviews were held over the telephone. The co-op managers and member-
workers who agreed to participate in this follow-up were asked to talk more specifically
about what the major barriers to sourcing locally were, and what steps had been taken to
alleviate these and other such barriers. Further, they were asked to describe the local
food trend as they had experienced it through their co-op and share any anecdotes they
thought might be relevant or useful.
4.4. Results
Local food is a topic that nearly every co-op manager or member-worker is eager
to discuss. Some were enthusiastic about the growing market, while others became
down-right animated while describing their most recent efforts to bring more local
products to their co-ops. Importantly, every single person said they would be happy to
source more from local farmers if they could.
When asked what prevented them from sourcing more, responses came in two
principal categories: what has not been problematic, and what has been a barrier.
Overall, eight themes emerge out of the follow-up interviews with the 58 co-op managers
and member-workers. What has not been a barrier: Interest in local food, Supply and
demand, Cost; and what has been a barrier: How to access local products, The question

62
of organics, Distribution, Competition, and Co-op cooperation. A summary of the
results from the follow-up interviews is presented in Table 11.
Table 11. Results from follow-up interviews with co-op managers and member workers
Topic Responses Is it a barrier?
Interest in local food
Interest in local food has emerged in the last few years and has recently picked up momentum. “It’s been a ten-year process, and the most rewarding part of my job.” “We were sourcing less than 1-percent locally seven years ago, and the most notable change has been in the last 10 years.” “Interest in local food has changed completely in the last two years. There was very little two years ago other than produce.”
No
Supply and demand
Co-op customers and members actively seek out local food. “Demand far outstrips supply.” “There is member support, and it’s become a new manager’s priority.” “Demand and interest are really there, especially in the cities.” “Customers want local food when it’s not in season. They’re expectations are sometimes unreasonable.”
No
Cost The relatively high cost of local products is not an issue when co-op customers understand where the discrepancies come from. “It doesn’t end up being a cost to the co-op, but the customer has to understand the true cost of food on the environment, transportation, workers, etc. Small natural retails cave in to pressure and artificially lower prices. We let customers make educated decisions.” “People want to support an artisan operation, something smaller. Not a factory farm. Not just for the product, but helping to sustain a producer in a direct way.”
No
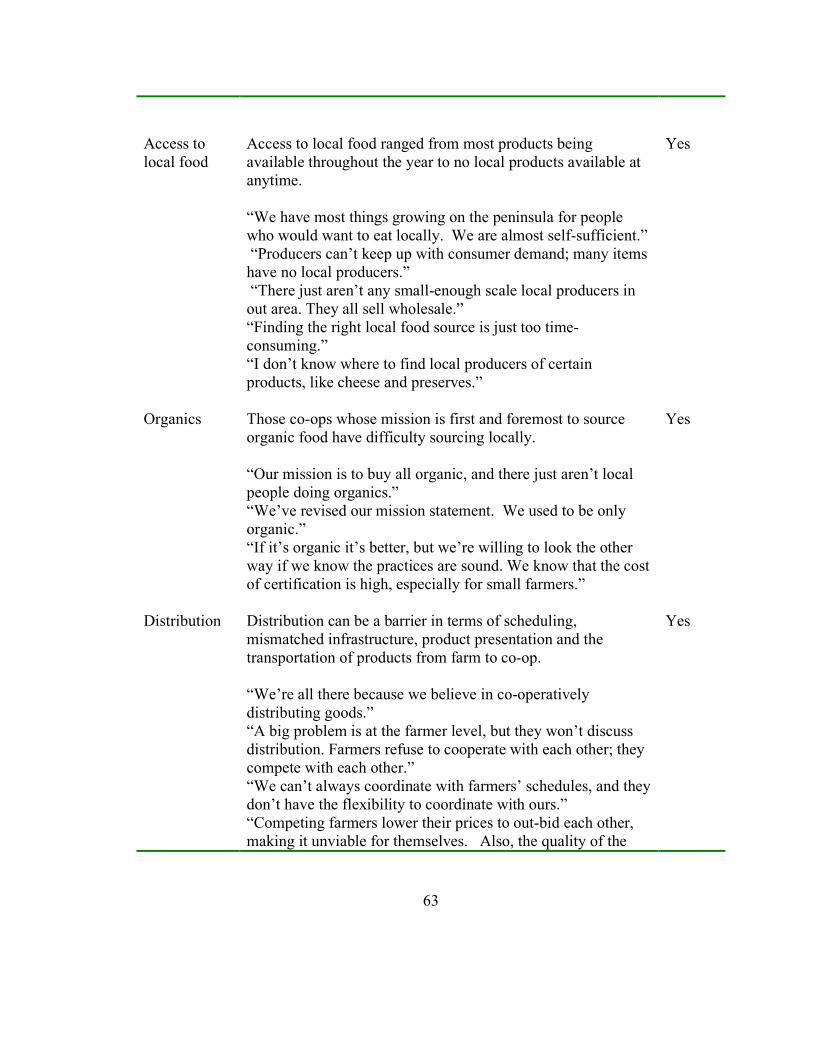
63
Access to local food
Access to local food ranged from most products being available throughout the year to no local products available at anytime. “We have most things growing on the peninsula for people who would want to eat locally. We are almost self-sufficient.” “Producers can’t keep up with consumer demand; many items have no local producers.” “There just aren’t any small-enough scale local producers in out area. They all sell wholesale.” “Finding the right local food source is just too time-consuming.” “I don’t know where to find local producers of certain products, like cheese and preserves.”
Yes
Organics Those co-ops whose mission is first and foremost to source organic food have difficulty sourcing locally. “Our mission is to buy all organic, and there just aren’t local people doing organics.” “We’ve revised our mission statement. We used to be only organic.” “If it’s organic it’s better, but we’re willing to look the other way if we know the practices are sound. We know that the cost of certification is high, especially for small farmers.”
Yes
Distribution Distribution can be a barrier in terms of scheduling, mismatched infrastructure, product presentation and the transportation of products from farm to co-op. “We’re all there because we believe in co-operatively distributing goods.” “A big problem is at the farmer level, but they won’t discuss distribution. Farmers refuse to cooperate with each other; they compete with each other.” “We can’t always coordinate with farmers’ schedules, and they don’t have the flexibility to coordinate with ours.” “Competing farmers lower their prices to out-bid each other, making it unviable for themselves. Also, the quality of the
Yes

64
products was decreasing because they had to cut costs.” “It’s difficult to get farmers to bring us their produce. It’s become member work.” “It’s difficult when farmers go from having a farm stand to wanting to bring everything to you. The quality is uneven.”
Competition Consumer co-ops compete with farmer’s markets, CSA farms, farm stands, as well as natural food grocers and larger food retail outlets like Whole Foods. “We compete with the same people we are trying to support.” (i.e. farmer’s markets, CSA farms, farm stands.) “Small producers are on their way out because grocers are out-priced by other bigger stores. And small farmers are priced-out from places like Whole Foods, which takes over the market.”
Yes
Co-op cooperation
There is a lack of cooperation among consumer co-ops and between co-ops and other organizations such as NOFA, localvore groups, and extension agencies. “We don’t talk to other co-ops.” “A huge problem is the lack of shared resources among co-ops, and also other organizations. It takes a lot of people who want to maintain their independence to let go.”
Yes

65
Overall, there was consensus among co-op managers that interest in local food
has blossomed in the last several years and continues to grow. While it may seem that
the higher cost of local food would be a deterrent for many co-op shoppers, it appears
that the campaign for organics has paved the way. Co-op patrons are willing to pay the
premium for a local product once they learn why there is such a discrepancy in cost. Co-
op workers are finding it both a chore and a pleasure to teach patrons about what is
available locally throughout the four seasons.
The principal barriers that were consistently discussed were access to local food,
the question of organics, distribution, and co-op cooperation. All co-ops agreed that due
to the short growing season, many local products were not accessible during the winter.
Most reported a lack of a particular type of product, and very few co-ops said that
virtually no local food was available. The question of organics came into play for several
consumer co-ops whose mission is to source exclusively organic products. Finding local
and organic can be problematic, and these co-ops are beginning to discuss whether local
should trump organic.
Various aspects of distribution were problematic for different co-ops. Some
struggle with scheduling, others with the inconsistency of product preparation, and still
others with actual infrastructure (i.e. having a loading doc that is impractical for farmers
delivering in pick-up trucks). Few co-ops had found solutions that resulted in time-
saving practices.

66
Only a handful of co-ops were in collaboration with each other, while the rest
worked independently of other co-ops. While it was evident that every co-op was in some
way an active member of it’s community, with few exceptions co-ops reported not
communicating regularly with other co-ops. The lack of shared resources among co-ops
was viewed as a barrier.
4.5. Discussion and Recommendations
Consumer co-ops are obvious candidates for acting as local food hubs. They are
independent from the mainstream food market and are not constrained to purchase from
one distributor. What they offer their members and other patrons reflects the values and
penchants of the members, which often translates into products that are healthy, natural,
and environmentally friendly. Co-op managers have been ahead of the local food curve,
picking up on consumer interest long before the likes of Whole Foods and Wal-Mart took
an interest.
In order for co-ops to maximize their impact as a local food hub, the barriers
described above – access to local food, co-op cooperation, the question of organics,
distribution, and competition – must be addressed as consumer education can only do so
much. The results lead us to make the following recommendations:
Interest in local food, Supply and demand, Cost
• Education: Why is buying local food good for the environment, local economies,
consumer health, and community development? What food is available at

67
different times of the year? What are the true costs of food, and how does the
pricing of local products reflect those?
Access to local food
• Network: Using the resources gathered by localvore groups, Slow Food and
NOFA chapters, co-op and agricultural extension agents, as well as
communication with other co-ops in the region cuts down on the time spent
researching local producers and strengthens connections between farmers and
local food outlets;
• Advertise: Publish a report or create a farmer-friendly web site that describes the
specifications of each co-op (i.e. loading doc, freezer and cooler capacity, storage
capacity, schedule), and what type of products each co-op is seeking to source.
The question of Organics vs. Local
• Education: What are the national and regional Organic standards? Who is the
state’s organic certifier? What is the cost to farmers? Can local but not organic be
fresher and better for the environment than organic and imported? Demonstrating
that the selected local farmers’ practices exceed organic standards, though they
may not be certified organic, may assuage co-op patrons’ concerns.
Distribution
• Organize local distribution: Provide vehicles to be shared by local producers, or to
be used by member workers who run the distribution (this service can be extended
to restaurants, schools, hospital and other grocers, as well, lowering the overhead

68
cost of distribution significantly). Provide community cold-storage for preserving
food, or on-site industrial kitchen for processing;
• Coach producers: Mentorship between farmers currently sourcing to co-op and
new farmers;
• Delegate: Establish annual producer’s meetings to establish who grows what for
the co-op. This limits how many farms the co-op can source from, but maximizes
gains for growers, and increases the quality of products;
Competition
• Network: Strengthening the networks between co-ops and producers allows co-
ops to share directly with farmers what consumers are looking for, from general
crops to specialty items. A reliable and broad network gives co-ops an edge on
conventional grocers that might be constrained to source from fewer larger
distributors;
• Promote local food: Host farmers’ markets or CSA pick-ups in the parking lots as
a way to raise awareness of local food, and provide a venue for customers to meet
the farmers. While this might cut into summer vegetable sales, it may overall
increase demand for local food throughout the year and bolster the local food
market overall.
Co-op cooperation
• Hold multi-co-op meetings: Several Vermont co-ops have recently met, and
Maine co-ops meet regularly to share ideas about co-op structure, where to source

69
local food from, and working with new and changing regulations. The synergy
between co-ops would have a greater effect on the overall local food market than
would co-ops acting independently;
• Create a forum: An online co-op forum could serve as a tool for sharing ideas,
anecdotes, and solutions to various problems that may arise.
The solutions that co-ops have found for scheduling deliveries, ensuring quality
and presentation of products, and facilitating the distribution must be shared. Existing
groups such as NOFA, regional and state localvores, agricultural extension offices, and
others should take an active role in disseminating this information, highlighting case
studies that can be used as models for other co-ops facing similar challenges, and
facilitating the sharing of information and resources among co-ops and farmers. Further
studies should be conducted to measure the growth of the local food market through co-
ops, and to measure the impact co-ops have on the viability of local agriculture. While
these barriers are still in place, consumer co-ops in the American Northeast will not be
able to perform their role as local food hubs to their maximum ability.

70
5. GENERAL CONCLUSIONS AND RECOMMENDATIONS
The local food market presents the Northeast with an opportunity to maintain and
reclaim some it its rural and family farms, while developing a more sustainable and
resilient locally based economy. Research on farm profitability in the region and factors
that contribute to or diminish profitability is therefore important to policy-makers,
producers, local food retail managers, and local food consumers alike. This study
addresses the general reasons for and barriers to sourcing locally, as identified by
consumer co-op managers and member workers.
The estimated contribution by consumer co-ops to the local food market suggests
two things: that it has a small, but important impact on the Northeastern economy; and
that it is worth improving the distribution process to benefit all those who participate in it.
In designing for a sustainable and viable local and regional food system, policy makers
and interest groups should remember these adages: Many hands make light work; Can’t
see the wood for the trees; The bigger they are, the harder they fall; Don’t put all your
eggs in one basket; and Waste not, want not.
Many hands make light work: A few co-op managers were concerned at the lack
of cooperation among neighboring co-ops and local or regional organizations. As one
manager put it: “A huge problem is the lack of shared resources among co-ops – as well
as other organizations.” One barrier may simply be that co-op member workers, farmers,
71
and existing organizations may not know how to access information provided by others.
Existing organizations, perhaps state extension agencies, could collect and distribute
pertinent information.
Co-ops interested in sourcing locally could provide the extension agencies with
their specifications overall and according to product type. These specifications could
include loading facility information, packaging, quantity, and quality requirements, and
details on any farmer-farmer mentorship program they have adopted. This way, farmers
and producers can self-select based on their own time-constraints and equipment. A
running list or map of current and past sources of local producers could allow farmers to
find out from each other whether a certain co-op would be a good match, and would
enable neighboring farmers to collaborate for distribution.
A few co-ops have taken it upon themselves to facilitate local distribution, and
have implemented creative and effective strategies. These co-ops should be recognized
as models to learn from, and improve upon.
The key lesson from this adage is that success comes from the bottom-up, and
everyone must participate. As David Holmgren (2002) writes, the ability to “create
systems that are closely integrated depends on a broad view of the range of jigsaw-like
lock-and-key relationships that characterize ecological and social communities. As well
as deliberate design, we need to foresee and allow for effective ecological and social
relationships that develop from self-organization and growth.”

72
Can’t see the wood for the trees; This adage reminds us that the closer we get to
the details, the more difficult it is to remember the broader picture. While this research
focuses principally on the role of consumer co-ops in the local food system, the broader
question is of local and regional food distribution in general. How do choices made to
improve distribution through co-ops effect the overall local food system? One co-op
manager talked about hosting the weekly farmer’s market in the co-op parking lot at the
expense of produce sales in the co-op, but for other less tangible benefits: consumer
education about local products and prices, local producer name recognition, local
producer community-building and collaboration, and diversity of market. Can mutually
beneficial solutions be found throughout the local food system?
The bigger they are, the harder they fall: The highest scoring reason for sourcing
locally is environmental concern, and in the open-ended question section co-op managers
mentioned food security as a priority as well. It is important in developing a food system
to consider the scale of operations in order to avoid potential disasters, similar to the E.
coli contamination of spinach in 2006. At the same time, it is important to remember to
design for a scale that is both effective and practical.
Waste not, want not: A sound local and regional distribution system is key in
becoming a less wasteful society. While the current local distribution system depends on
individual farmers to drive their own vehicles from one market to the next, some
solutions might include collaboration among producers for a more fuel-efficient shared
distribution. It is important to look at the successful aspects of the conventional food

73
distribution model, and incorporate those elements that are applicable. Sharing over-head
costs among farmers can contribute to greater farm viability. Among other possible
benefits, the efficient use of farm-equipment and distribution vehicles (i.e. making sure
distribution trucks are full both on the trip to and back from various markets) will further
cut down on costs, as well as non-renewable resources, and may lessen vehicle impact on
roads and highway systems over time.
Don’t put all your eggs in one basket: This final proverb reinforces the common
sense understanding that diversity is insurance against potential hazards of life and
markets. It is as important to producers to have relationships with a variety of potential
outlets for their products as it is for consumer co-ops and other local food vendors to be
connected with many producers in the network. Anything from crop-failure to bumper-
crops, form drought to blizzards can have an impact all aspects of production and
distribution. The conventional food system is analogous to the links of a chain; if one
connection is broken the chain is rendered useless. Creating a web of networks is better
for creating a resilient system, as it will not fail if the connection between two elements is
broken.
It is important to remember that, despite certain questions of sustainability, quality,
and healthiness, there are many lessons to be learned from observing the conventional
food distribution system. Aspects of local food distribution should be modeled on the
successes, efficiencies, and cost-effectiveness of conventional distribution, and yet be
appropriately flexible to respond to change.

74
5.1. Opportunities for future research
Consumer co-ops represent only a small portion of the independent grocery
market. Future studies could continue to measure the local food market in the region by
sampling other venues, such as country grocers, independent supermarkets, and even
franchised grocers. As consumer demand for local food increases, it will be to the benefit
of all constituents that common barriers be identified and alleviated. Given the nature of
consumer co-ops, it may be that some viable distribution models for them may not be
transferable to other types of venue.
Studies of the geographical distribution of local food sources and local food
outlets would show several things. First, policy-makers would be able to identify areas
that are relatively thick with local producers and local food outlets, as well as those areas
that have little local food activity. Second, research could be conducted to compare
clusters of local food activity, by demographic, social and economic characteristics.
Third, overall distribution schemes and models if compared might usefully identify the
strengths, weaknesses, opportunities and threats of each.
As Lyson (2004) points out, part of the difficulty in assessing the efficiency and
sustainability of a local food distribution system is that the units of measurement and the
scale of measurement differ within and across the economic and social dimensions. For
example, it is difficult to measure the effects of local food distribution on local farm
viability, local economic development, and community health simultaneously unless a

75
measurement exists for trade-offs. Future studies could look at any trade-off precedents
to develop a system of measurement to take into consideration these disparate and
relevant dimensions.
This study is only an early step in describing and measuring the local food
market. It identifies the reasons for and barriers to sourcing locally, but cannot go
further by suggesting specific distribution opportunities for all consumer co-ops. Deeper
analysis is necessary to identify the co-op characteristics that lend themselves to specific
distribution criteria. However, taking into account the overall local food environment
remains for a subsequent stage of research.

76
THESIS REFERENCES
Works Cited
100-mile diet. (2007). Retrieved July 15, 2007, 2007, from www.100milediet.org
Agriculture., U. S. D. o. (2001). Alternative enterprises for higher profits, healthier land.
Lincoln: Food Processing Center, University of Nebraska.
Arentze, T. A., & Timmermans, H. J. P. (2005). An analysis of context and constraints-
dependent shopping behaviour using qualitative decision principles. Urban
Studies, 42(3), 435-448.
Artz, G. M., & Stone, K. E. (2006). Analyzing the Impact of Wal-Mart Supercenters on
Local Food Store Sales. American journal of agricultural economics, 88, no. 5,
1296-1303.
Belcher, K. W., Germann, A. E., & Schmutz, J. K. (2007). Beef with environmental and
quietly attributes: Preferences of environmental group and general population
consumers in Saskatchewan, Canada. Agriculture and Human Values, 24(3), 333-
342.
Bellows, A. C., & Hamm, M. W. (2001). Local autonomy and sustainable development:
Testing import substitution in localizing food systems. Agriculture and Human
Values, 18, 271-284.

77
Bredahl, L., Grunert, K. G., & Frewer, L. J. (1998). Consumer attitudes and decision-
making with regard to genetically engeneered food products - A review of the
literature and a presentation of models for future research. Journal of Consumer
Policy, 21, 251-277.
Briscoe, R. (1971). Utopians in the marketplace. Harvard Business Review, 4-9.
Brown, C. (2003). Preferences for locally produced food: A study in Southeast Missouri.
American Journal of Alternative Agriculture, 18(4), 213-224.
Bruhn, C. M., Vossen, P. M., Chapman, E., & Vaupel, S. (1992). Consumer attitudes
toward locally grown produce. California Agriculture, 118, 433-438.
Cadilhon, J.-J., Moustier, P., Poole, N. D., Tam, P. T. G., & Fearne, A. P. (2006).
Traditional vs. modern food systems? Insight from vegetable supply chains to Ho
Chi Minh City (Vietnam). Development Policy Review, 24(1), 31-49.
Cotterill, R. W. (1986). Market power in the retail food industry: evidence from Vermont.
The Review of Economics and Statistics, 68(3), 379-386.
Cotterill, R. W. (1997). Food distribution systems of the future: Convergence towards the
US or UK model. Agribusiness, 13(2), 123-135.
Cottingham, J., Hovland, J., Lenon, J., Roper, T., & Techmann, C. (2000). Direct
marketing of farm produce and home goods [Electronic Version]. University of
Wisconsin Extension Publication [On-line] from
http://cf.uwex.edu/ces/pubs/pdf/A3602.pdf.
Coulson, A. (2005). Local food for thought. Earthwatch Radio.

78
Croom, E. A. (2005). Farm to school programs as leverage points to changing the school
food system. University of Vermont, Burlington, Vermont.
DuPuis, E. M., & Goodman, D. (2005). Should we go "home" to eat?: Toward a reflexive
politics of localism. Journal of rural studies, 21, 359-371.
Eastwood, D., Brooker, J., & Gray, M. (1999). Location and other market attributes
affecting farmers' market patronage: The case of Tennessee. Journal of Food
Distribution Research, 30(1), 63-72.
Eastwood, D. B., Brooker, J. R., Steglin, F., Woods, T., & Estes, E. (2002). A market
system approach to removing distribution barriers confronting small-volume fruit
and vegetable growers. Journal of Food Distribution Research, 33(1), 162.
Educating about Agriculture. Retrieved August 4th, 2007, 2007, from
http://www.ageducate.org/
Edwards, A. (1957). Techniques of Attitude Scale Construction. New York: Appleton,
Century and Crofits.
FDA. (2006). Nationwide E. Coli 0157:H7 Outbreak: Questions & Answers. Retrieved
August 4th, 2007, 2007, from
http://www.cfsan.fda.gov/~dms/spinacqa.html#howmany
Feenstra, G. W., Lewis, C. C., Hinrichs, C. C., Gillespie, G. W. J., & Hilchey, D. (2003).
Entrepreneurial outcomes and enterprise size in U.S. retail farmers' markets.
American Journal of Alternative Agriculture, 18(1), 46-55.

79
Gladwin, C. H. (1989). Ethnographic decision tree modeling. Newbury Park, Calif: Sage
Publications.
Govindasamy, R., Italia, J., & Adelaja, A. (2002). Farmers' Markets: Consumer trends,
preferences, and characteristics. Journal of Extension, 40(1), 1-7.
Gregoire, M. B., Arendt, S. W., & Strohbehn, C. H. (2005). Iowa producers' perceived
benefits and obstacles in marketing to local restaurants and institutional
foodservice operations [Electronic Version]. Journal of Extension, 43. Retrieved
September 20 2007 from http://www.joe.org/joe/2005february/rb1.shtml.
Gregoire, M. B., & Strohbehn, C. H. (2002a). Benefits and obstacles to purchasing food
from local growers and producers. Journal of Child Nutrition and Management
[On-Line], 26(1).
Gregoire, M. B., & Strohbehn, C. H. (2002b). Benefits and obstacles to purchasing from
local gorwers and producers [Electronic Version]. Journal of Child Nutrition and
Management [On-Line], 25. Retrieved September 2007 from
http://www.asfsa.org/childnutrition/jcnm/02spring/.
Gussow, J. D. (1999). Dietary guidelines for sustainability: Twelve years later. Journal of
nutrition education, 31(4), 194-200.
Halldorsson, A., & Arlbjorn, J. S. (2005). Research methodologoes in supply chain
management - What do we know? In H. Kotzab, S. Seuring, M. Muller & G.
Reiner (Eds.), Research Methodologies in Supply Chain Management. New York:
Physica-Verlag

80
Halweil, B. (2004). Eat here: Reclaiming homegrown pleasures in a global supermarket.
New York, New York: W.W. Norton & Company.
Halweil, B., Prugh, T., & Worldwatch Institute. (2002). Home grown : the case for local
food in a global market. Washington, DC: Worldwatch Institute.
Harmon, A., & Maretzki, A. (2006). Assessing food system attitudes among youth:
development and evaluation of attitide measures. Journal of nutrition education
and behavior, 38(2), 91-95.
Harris, M. J., Kaufman, P. R., Martinez, S. W., & Price, C. (2002). The U.S. Food
Marketing System 2002: U.S. Department of Agriculture.
Heffernan, W. D. (2000). Concentration of ownership and control in Agriculture. In F.
Magdoff, F. J. Bellamy & F. H. Buttel (Eds.), Hungry for Profit: The agribusiness
threat to farmers, food, and the environment. New York: Monthly Review Press.
Heller, M. C., & Keoleian, G. A. (2000). Life Cycle-Based Sustainability Indicators for
Assessment of
the U.S. Food System. Retrieved 10-12-04, from
http://css.snre.umich.edu/css_doc/CSS00-04.pdf
Hinrichs, C. C. (2000). Embeddedness and local food systems: notes on two types of
direct agricultural market. Journal of rural studies, 16(3), 295-303.
Hoffer, D. (2000). The leaky bucket: An analysis of Vermont's dependence on imports.
Burlington: Peace and Justice Center.

81
Holmgren, D. (2002). Permaculture principles and pathways beyond sustainability.
Hepburn, Victoria. Australia: Holmgren Design Services.
Horowitz, J. K., & Carson, R., T. (1991). A classification tree for predicting consumer
preferences for risk reduction. American journal of agricultural economics, 73(5),
1416-1421.
Jordan, H. L. (2006). Marketing local foods in a conventional setting. University of
Vermont, Burlington.
Kakoi, M., & Saito, S. (2005). Discovering rules to extract critical attributes of frequent
shoppers at urban commercial complexes using decision trees. Studies in Regional
Sciences, 35(1), 199-214.
Kloppenburg, J., Hendrickson, J., & Stevenson, G. W. (1996). Coming into the foodshed.
Agriculture and Human Values, 13(3), 33-42.
Kolodinsky, J., & Hogarth, J. (2001). The adoption of electronic banking technologies by
American consumers. Consumer Interests Annual, 47.
Kolodinsky, J., & Pelch, L. (1997). Factores influencing the decision to join a
Community Supported Agriculture (CSA) Farm. Journal of Sustainable
Agriculture, 10(2/3), 129-141.
Kotler, P., & Armstrong, G. (2006). Marketing channels and supply chain management.
In J. Shelstad (Ed.), Principles of Marketing (Vol. 11, pp. 358-393). Upper Saddle
River, New Jersey: Pearson Prentice Hall.

82
Kraus, S. J. (1995). Attitudes and the prediction of beavior: A meta-analysis of the
empirical literature. Personality and Social Psychology Bulletin, 21(1), 58-75.
Lass, D., Stevenson, J., Hendrickson, J., & Ruhf, K. (2003). CSA across the the nation:
Findings from the 1999 CSA survey. University of Wisconsin-Madison: Center
for Integrated Agricultural Systems.
Lockeretz, W. (1986). Urban consumers' attitudes towards locally grown produce.
American Journal of Alternative Agriculture, 1(2), 83-88.
Lyson, T. A. (2004). Civic Agriculture: Reconnecting farm, food, and community.
Medford, Massachusetts: Tufts University Press.
Lyson, T. A., & Green, J. (1999). The agricultural marketscape: A framework for
sustaining agriculture and communities in the Northeast. Journal of Sustainable
Agriculture, 15(2/3), 133-150.
Lyson, T. A., & Raymer, A. L. (2000). Stalking the wily multinational: Power and
control in the U.S. food system. Agriculture and Human Values, 17, 199-208.
Magdoff, F., Foster, J. B., & Buttel, F. H. (2000). An overview. In F. Magdoff, J. B.
Foster & F. H. Buttel (Eds.), Hungry for profit: The agribusiness threat to
farmers, food, and the environment (pp. 7-22). New York: Monthly Review Press.
Maynard, L. J., Burdine, K. H., & Meyer, A. L. (2003). Market potential for locally
produced meat products. Journal of Food Distribution Research, 34(2), 26-37.
MEDA. (2003). Get Real: Get Maine. Retrieved June 8, 2007, 2007, from
www.getrealmaine.com/

83
Moyer, G. (1981). Co-ops: Where people come before profits. Nutrition Action, 8-10.
Nakamoto, S., Halloran, J., Yanagida, J., & Leung, P. (1989). A market example and
economic evaluation of information and price uncertainty. Journal of Food
Distribution Research, 20(2), 55-62.
Narus, J. A., & Anderson, J. C. (1996). Rethinking distribution: Adaptive channels.
Harvard Business Review, 112-120.
Ness, C. (2006, Wednesday, July 26, 2006). Whole Foods, taking flak, thinks local. San
Francisco Chronicle.
Norberg-Hodge, H., Merrifield, T., & Gorelick, S. (2002). Bringing food economy home:
Local alternatives to global agribusiness. Bloomfield, CT: Kumarian Press, Inc.
Payne, T. (2002). U.S. farmers' markets-2000 A study of emerging trends. United States
Department of Agriculture: Marketing Service Branch.
Pfeffer, M. J., & Lapping, M. B. (1995). Prospects for a sustainable agriculture in the
Northeast's rural/urban fringe. Research in Rural Sociology and Development, 6,
67-93.
Pirog, R. (2003). Eco Label Value Assessment: Consumer and Food Business
Perceptions of Local Foods. Ames, IA: Leopold Center for Sustainable
Agriculture.
Pirog, R. (2004). Eco Label Value Assessment: Phase II Consumer Perceptions of Local
Foods. Ames, IA: Leopold Center for Sustainable Agriculture.

84
Pirog, R., & Tyndall, J. (2000). Comparing apples to apples: An Iowa perspective on
apples and local food systems. Ames, Iowa: Leopold Center for Sustainable
Agriculture, Iowa State University,.
Pirog, R., van Pelt, T., Enshayan, K., & Cook, E. (2001). Food, fuel and freeways:
Leopold Center for Sustainable Agriculture, Iowa University.
PLACE program. Retrieved August 4th, 2007, 2007, from http://www.uvm.edu/place/
Pollan, M. (2006). The omnivore's dilemma: A natural history of four meals. New York:
Thorndike Press.
Pothukuchi, K., & Kaufman, J. L. (1999). Placing the food system on the urban agenda:
The role of municipal institutions in food system planning. Agriculture and
Human Values, 16(2), 213-224.
Pretty, J. N., Ball, A. S., Lang, T., & Morison, J. I. L. (2005). Farm costs and food miles:
An assessment of the full cost of the UK weekly food basket [Electronic Version].
Journal of Food Policy. Retrieved March 1, 2007 from
http://www.essex.ac.uk/bs/staff/pretty/Pretty%20et%20al%20Food%20Policy%2
02005%20%20vol%2030%20%20pp1-20.pdf.
Reiner, G. (2005). Supply chain management research methodology using quantitative
models based on empirical data. In H. Kotzab, S. Seuring, M. Muller & G. Reiner
(Eds.), Research Methodologies in Supply Chain Management. New York:
Physica-Verlag

85
Resources, I. o. A. a. N. (2003). Approaching foodservice establishments with locally
grown products. Lincoln, NE: Food Processing Center, University of Nebraska.
Reynolds, P., Von Behren, J., Gunier, R., B, Goldberg, D., E, Hertz, A., & Harnly, M. E.
(2002). Childhood cancer and agricultural pesticide use: An ecologic study in
California. Environmental Health Perspectives, 110(3), 319-324.
Rigby, D., & Caceres, D. (2001). Organic farming and the sustainability of agricultural
systems. Agricultural Systems, 68, 21-40.
Roininen, K., Arvola, A., & Lahteenmaki, L. (2006). Exploring consumers' perceptions
of local food with two different qualitative techniques: Laddering and word
association Food quality and preference, 17(1-2), 20-30.
Russo, D. M., & McLaughlin, E. (1991). Farmer gets bigger share of food dollar. Cornell
Cooperative Extension, 9.
Shuman, M. H. (1998). Going Local. New York: The Free Press, a division of Simon &
Schuster.
Sommer, R. (1998). Shopping at the Co-op. Journal of Environmental Psychology, 18,
45-53.
Strohbehn, C. H., & Gregoire, M. B. (2003). Case studies of local food purchasing by
central Iowa restaurants and institutions. Foodservice research international,
14(1), 53-64.
Sustainable Schools Project. Retrieved August 4th, 2007, 2007, from
http://www.sustainableschoolsproject.org/

86
The Burlington Food Project. Retrieved August 4th, 2007, 2007
The Vermont Fresh Network. Retrieved August 6, 2007, 2007, from
http://www.vermontfresh.net/
Timmons, D. (2006). Measuring and understanding local foods: The case of Vermont.
University of Vermont, Burlington, Vermont.
Tregear, A., Kuznesof, S., & Moxey, A. (1998). Policy initiatives for regional foods:
Some insights from consumer research. Food Policy, 23(5), 383-394.
Tregear, A., & Ness, M. (2005). Discriminant analysis of consumer interest in buying
locally produced foods. Journal of Marketing management, 21, 19-35.
USDA, R. (2001). 2001 USDA Co-op survey on the way - brief article - statistical data
included. Retrieved March 28, 2007, 2007, from
http://findarticles.com/p/articles/mi_m0KFU/is_4_68/ai_79511983
Vermont Education for Sustainability. Retrieved August 4th, 2007, 2007, from
http://www.vtefs.org/
Vermont Food Education Every Day. Retrieved August 4th, 2007, 2007, from
http://www.vtfeed.org/
VTDA. (2007). Buy local: It's just that simple. Retrieved June 8, 2007, 2007, from
http://www.vermontagriculture.com/buylocal/
Wilkins, J. L. (1996). Seasonality, food origin, and food preference: a comparison
between food cooperative members and non-members. Journal of nutrition
education, 28(6), 329-337.

87
Wilkins, J. L., Bokaer-Smith, J., & Hilchey, D. (1996). Local foods and local agriculture:
A survey of attitudes among Northeastern consumers. Northeast Regional Food
Guide Project. Cornell University, Division of Nutritional Sciences.
Wilkins, J. L., Bowdish, E., & Sobal, J. (2002). Consumer perceptions of seasonal and
local foods: a study ina U.S. community. Ecology of food and nutrition, 41(5),
415-439.
Zepeda, L., & Leviten-Reid, C. (2004). Consumers' view on local food. Journal of Food
Distribution Research, 35(3), 1-6.
Zepelda, L., & Leviten-Reid, C. (2004). Consumers' view on local food. Journal of Food
Distribution Research, 35(3), 1-6.
Zeuli, K. A., & Cropp, R. (2004). A1457 Cooperatives: Principles and practices int he
21st century. Madison, WI: University of Wisconsin Extension.
Zwart, A. C. (1996). Models of marketing channel coordination in the food industry. In P.
E. Earl (Ed.), Management, marketing, and the competitive process. Brookfield:
Edward Elgar.
Personal Communications Cited
Bruscett, L. (2006, November 8). Co-op Development Institute, NH. Personal
communication with author. Harrington, J. (2007, February 12). Onion River Co-op General Manager. Personal communication with author.

88
APPENDIX A. CONSUMER CO-OP SURVEY
For the purpose of this survey, the definition of local food is food that comes from within the state, or
from within 30 miles of the store (based on VT definition of local and native). Co-op name: _____________________________________________________________ The location of your co-op is _____urban, _____suburban, or _____rural. Square feet of floor space: __________________________________________________ Square feet of freezer space: ________________________________________________ Square feet of cooler space: _________________________________________________ Your co-op mission statement: ______________________________________________ ________________________________________________________________________________________________________________________________________________ 1. What are your reasons for selling local food? Please rate your reasons from 1-5, 1 being a very weak reason and 5 being a very important reason, according to your co-op’s experience: Consumer demand Quality of local products Supply of local products Relationship with producers Cost of local products Ethical reasons Political reasons Environmental reasons Others (please specify) ______________________ ______________________
Very weak Very Important 1 2 3 4 5 1 2 3 4 5 1 2 3 4 5 1 2 3 4 5 1 2 3 4 5 1 2 3 4 5 1 2 3 4 5 1 2 3 4 5 1 2 3 4 5 1 2 3 4 5
2. What are the barriers you have faced in sourcing local food? Please rate them from 1-5, 1 being not at all problematic, and 5 being very problematic: Consumer demand Quality local products Supply of local products Infrastructure Cost of local products Multiple vendors Others (please specify) ______________________ ______________________
Not at all Very Problematic Problematic 1 2 3 4 5 1 2 3 4 5 1 2 3 4 5 1 2 3 4 5 1 2 3 4 5 1 2 3 4 5 1 2 3 4 5 1 2 3 4 5

89
3. Please identify how often you source the following local foods: Never Seldom Seasonally Year-round Fruit Nuts Produce Meat Fish Eggs Milk Cheese Other dairy Honey, maple syrup
Preserves Baked goods
**all information will remain confidential** 4. Approximately, what percentage of your 2006 food expenditure was for local food? 5. How many producers do you source local food from? _________ 6. What is your Cooperative Grocer ranking? Small (<$1.2 million) ______ Medium (< $8 million ______ Large (>$8 million) ________ Any further comments: ________________________________________________________________________________________________________________________________________________________________________________________________________________________________________________________________________________________________________________________________________________________
Thank you for your participation!
For questions, please contact Marina Michahelles:
Tel: 845-758-9961 Fax: 802-656-1423