
THE DISCRIMINATORY IMPACT OF UNION FRINGE BENEFIT...
28
THE DISCRIMINATORY IMPACT OF UNION FRINGE BENEFIT REQUIREMENTS ON NONUNION WORKERS UNDER GOVERNMENT-MANDATED PROJECT LABOR AGREEMENTS John R. McGowan Ph.D., CPA
Transcript of THE DISCRIMINATORY IMPACT OF UNION FRINGE BENEFIT...
THE DISCRIMINATORY IMPACT OF UNION
FRINGE BENEFIT REQUIREMENTS ON NONUNION
WORKERS UNDER GOVERNMENT-MANDATED
PROJECT LABOR AGREEMENTS
John R. McGowan Ph.D., CPA

THE DISCRIMINATORY IMPACT OF
UNION FRINGE BENEFIT REQUIREMENTS
ON NONUNION WORKERS UNDER
GOVERNMENT-MANDATED PROJECT
LABOR AGREEMENTS
John R. McGowan Ph.D., CPAProfessor of Accounting
Saint Louis University3674 Lindell Blvd.
St. Louis, MO 63108
[email protected](314) 221-5072
The views of this study are the author’s and do not necessarily represent those of Saint Louis University.

THE DISCRIMINATORY IMPACT OF UNION FRINGE BENEFIT REQUIREMENTS ON NONUNION WORKERS UNDER GOVERNMENT-MANDATED PROJECT LABOR AGREEMENTS
5
EXECUTIVE SUMMARY
The subject of project labor agreements (PLAs) has created much controversy in the
past few decades in public policy circles and in the construction industry. A recent
revival of the debate surrounding this contentious issue resulted from Executive
Order 13502, issued by President Barack Obama Feb. 6, 2009, which encourages
the use of PLAs on federal construction projects exceeding $25 million, as well as
repealed a previous executive order that prohibited PLAs on federal and federally-
assisted construction projects.
Numerous studies and white papers have evaluated the arguments in support of and
in opposition to PLAs. This report addresses an argument against PLAs that has
received little attention, but is a key reason why PLAs discourage competition from
nonunion contractors and harm the economic welfare of nonunion construction
employees.
This report examines the economic impact of the fringe benefit requirements
of typical government-mandated PLAs and concludes that these agreements
disproportionately harm nonunion contractors and employees.
As detailed in the following report, PLAs hurt nonunion employees by reducing
their take-home pay on “prevailing wage” government construction projects, and by
forcing them to give up such wages in favor of union benefit funds from which they
receive little or no benefit.
Nonunion employers likewise face increased and/or duplicative benefit costs under
government-mandated PLAs. The problem is particularly acute with regard to multi-
employer union pension plans in the construction industry, many of which are
severely underfunded. Contractors that are forced to participate in such plans may be
subjected to significant withdrawal liability at the conclusion of the PLA project.
THE DISCRIMINATORY IMPACT OF UNION FRINGE BENEFIT REQUIREMENTS ON NONUNION WORKERS UNDER GOVERNMENT-MANDATED PROJECT LABOR AGREEMENTS
6
The economic disadvantages faced by nonunion employees and employers related
to a PLA’s fringe benefit requirements explains why many nonunion construction
companies are discouraged from participating in the bidding process for
government-mandated, union-only PLA projects.
The key findings of the study are threefold. First, employees of nonunion contractors
who are forced to perform work under government-mandated PLAs on prevailing
wage construction projects suffer a reduction in their take-home pay that is
conservatively estimated at 20 percent. If PLAs were imposed on a significant
percentage of federal construction work, hundreds of millions of dollars of income
would be taken from nonunion workers and distributed to union pension funds,
which do not benefit nonunion workers. More specifically, lost wages for nonunion
construction workers range from $184 million to more than $613 million, depending
on the assumption made for companies executing contracts through PLAs.
Second, the study finds that nonunion contractors will be forced to pay extra costs—
in excess of 25 percent—to work under PLAs on federal construction projects. Had
Executive Order 13502 been in place in 2008, evidence is provided that these costs
would likely have ranged from $230 to $767 million per year. In total, the move to
PLAs could cost nonunion workers and their employers $414 million to more than
$1.38 billion annually.
Third, nonunion contractors will face increased and unnecessary exposure
to pension fund liability if they perform work under PLAs, including possible
withdrawal liability when the PLA project is completed.
THE DISCRIMINATORY IMPACT OF UNION FRINGE BENEFIT REQUIREMENTS ON NONUNION WORKERS UNDER GOVERNMENT-MANDATED PROJECT LABOR AGREEMENTS
7
OBJECTIVE
The first objective of this paper is to estimate the fringe benefit-related costs government-
mandated PLAs on federal construction projects will impose on both nonunion
construction employees and their employers as a result of President Obama’s Executive
Order 13502.
Because PLAs typically require contractors to participate in multi-employer pension
plans1, the second portion of this paper presents an explanation and discussion of
the withdrawal liability contractors are likely to face if they decide to terminate their
affiliation with a multi-employer (union) pension plan.
BACKGROUND
On Feb. 6, 2009, President Obama signed an executive order encouraging executive
agencies of the federal government to require every contractor or subcontractor on a
large-scale construction project to negotiate or become a party to a PLA with one or
more labor organizations. A PLA is a pre-hire collective bargaining agreement between
contractors and one or more unions that establishes the terms and conditions of
employment for a specific construction project.
Under government-mandated PLAs, all subcontractors are required to sign onto the labor
agreement as a condition of performing work on the project. Because PLAs typically
require employers to contribute to union fringe benefit trust funds—including poorly
performing multi-employer union pension funds—nonunion contractors and employees
have strongly criticized PLAs.
Nonunion employees argue that PLAs reduce their take-home pay because instead
of being paid fringe benefits in cash or via contributions into existing fringe benefit
1 Multi-employer pension plans cover workers from more than one employer. This is in contrast to the traditional company pension plan,
which covers workers from just one employer (single employer plans). Multi-employer pension plans have a specific definition under
the Labor Management Relations Act of 1947, known as the Taft-Hartley Act. Under Taft-Hartley, negotiating an employer contribution
as part of a labor-management agreement and placing it in a trust fund establishes a multiemployer pension plan. Then, labor
organizations bargain with additional employers to have workers covered by these plans.
Employer contributions, determined by collective bargaining, fund the multi-employer pension plans.
THE DISCRIMINATORY IMPACT OF UNION FRINGE BENEFIT REQUIREMENTS ON NONUNION WORKERS UNDER GOVERNMENT-MANDATED PROJECT LABOR AGREEMENTS
8
programs, PLAs require their employers to contribute to union benefit and pension plans
that employees will never benefit from unless they join a union and satisfy appropriate
vesting schedules.
Nonunion contractors maintain that PLAs increase their benefit costs because, under
typical PLAs, employers must make fringe benefit payments to union trust funds and
either reduce their employees’ take-home pay or duplicate their own costs of providing
such benefits to their employees in existing health care, retirement and vacation benefits.
Nonunion contractors also argue that by forcing contributions to poorly performing
union multi-employer pension plans, PLAs expose businesses to unknown liabilities
and additional costs. Contractors maintain that the additional fringe benefit costs and
concerns prevent them from offering customers the best bid at the best price.
Naturally, the question has arisen whether a government-mandated PLA discriminates
against and otherwise harms nonunion workers and contractors by imposing fringe
benefit costs on them from which they derive little or no actual benefit (i.e., the
government mandates taking something without just compensation). This paper attempts
to provide measurable data that can be used to answer this question. It is critical to
calculate the potential economic impact of government-mandated PLAs on nonunion
employers and employees in order to evaluate if Executive Order 13502 is sound public
policy. As demonstrated in this report’s findings, many nonunion contractors are placed
at a severe disadvantage when bidding on projects covered by such agreements because
PLAs significantly increase fringe benefit costs and PLAs reduce take-home pay of their
existing nonunion employees.
METHODOLOGY
Identifying Population of Federal Construction Spending That May Be Subject to PLAsThe first step in predicting the fringe benefit-related costs to employees and employers as
a result of President Obama’s Executive Order 13502 requires identifying a population
of construction contracts that likely will be subject to PLA mandates. Because it is
impossible to determine the population and value of future federal construction
contracts—and predict which contracts will be subject to government-mandated PLAs—
this report makes some factual assumptions to generate a model necessary to estimate
THE DISCRIMINATORY IMPACT OF UNION FRINGE BENEFIT REQUIREMENTS ON NONUNION WORKERS UNDER GOVERNMENT-MANDATED PROJECT LABOR AGREEMENTS
9
costs. This model uses 2008 federal construction spending data to give a sense of the
increased fringe benefit-related costs President Obama’s Executive Order 13502 would
have on federal construction spending (had it been in place in 2008).
The number of federal construction contracts exceeding $25 million awarded in 2008
was generated from the free searchable database at USAspending.gov.2 3 The category
of contracts listed in the USASpending.gov database with the highest probability of
affecting the construction industry is Construction of Structures and Facilities. Two
hundred and fifty-three contracts in this category meet the criteria of exceeding $25
million in 2008.4 The total amount of these 253 contracts is $28,876,358,458.5
In the proposed rule recently issued by the Federal Acquisition Regulation (FAR) Council,6
the Obama administration anticipates that only 10 percent of all federal construction
projects with costs exceeding $25 million will be subject to PLAs in the year following the
issuance of Executive Order 13502’s final rule. No explanation is given for how this figure
was arrived at, but the FAR Council uses it to estimate that there will be 30 construction
projects on which PLAs will be imposed. The total cost of the projects remains undefined,
as these are future projects, but the total value is likely to be in the billions of dollars.7
Because the 10 percent estimate is unexplained and potentially underestimated by the
proposed rule, alternative estimates are provided for measuring the effect of nonunion
contractors and their employees moving to PLA arrangements. This paper estimates
the effect of government-mandated PLAs on 15 percent, 30 percent and 50 percent of all
applicable federal construction projects.
2 USAspending.gov is a relaunch of www.fedspending.org. It provides citizens with easy access to government contracts, grants and other
award data.
3 Executive Order 13502 also applies to multiple contracts awarded for one construction project that combine to exceed $25 million, but
these contracts were left out of the computations because they were difficult to track depending on the type of project delivery method.
As a result, the numbers used in this study are very conservative.
4 While it is difficult to identify every federal construction project exceeding $25 million that would be subject to Executive Order 13502,
had it been in place in 2008, USAspending.gov is the best resource. The total dollar amount of federal construction contracts is likely
much greater than the one category (Construction of Structures and Facilities) examined in this study. There are other types of federal
contracts that fall under the use of PLAs that did not fall in this category. Therefore, the dollar value and number of contracts that might
be subject to Obama’s Executive Order is a conservative figure.
5 As noted, the FAR Councils’ proposed rule estimates a higher number of large federal construction projects (300) in the year following
implementation of the final rule under Executive Order 13502. With an estimated $140 billion invested in federal, state and local
construction projects as a result of the American Reinvestment and Recovery Act, an estimate of 300 projects exceeding $25 million is
likely far too conservative.
6 Federal Acquisition Regulation; FAR Case 2009–005, Use of Project Labor Agreements for Federal Construction Projects, Federal
Register/Vol. 74, No. 133/Tuesday, July 14, 2009/Proposed Rules.
7 According to USAspending.gov, the total cost of the 30 largest federal construction contracts awarded in 2008 exceeded $18 billion.
THE DISCRIMINATORY IMPACT OF UNION FRINGE BENEFIT REQUIREMENTS ON NONUNION WORKERS UNDER GOVERNMENT-MANDATED PROJECT LABOR AGREEMENTS
10
Calculating Labor Costs of Applicable Federal Construction Contracts The next step of the analysis includes a determination of the portion of each contract that
may be reasonably attributed to labor costs. A number of studies have determined that
the appropriate labor percentage on a construction contract is between 20 percent and
30 percent (Vedder, 2009).8 Accordingly, the average of 25 percent is used to calculate the
labor costs for each construction contract used in this study; therefore, the total labor
cost figure used in this study is $7,219,089,615 (28,876,358,458 x .25).
Determining Federal Construction Market Share of Nonunion ContractorsNext, in order to accurately measure the impact of President Obama’s Executive Order
13502 on nonunion employers and employees, it is necessary to determine the federal
construction market share of nonunion contractors. Bureau of Labor Statistics data
indicate that unions compose about 15 percent of the U.S. construction workforce.9
There is no government data indicating that union market share is larger on federal
construction projects. Therefore, an assumption is made that 85 percent of the workforce
is forced to adopt new fringe benefit rules and reduced take-home pay under PLAs.
Estimating Effect of PLAs on Nonunion Employees’ Take-Home Pay The next step in this study’s analysis includes conducting a detailed examination of the
effect PLAs are likely to have on nonunion employees’ take-home pay. This analysis—
which is both empirical and based on the specific experiences of construction contractors
that filed comments in the ongoing regulatory rulemaking proceess with regard to
Executive Order 13502—demonstrates that PLAs reduce nonunion workers’ take-home
wages by at least 20 percent. Even though some nonunion contractors report a reduction
of more than 20 percent in some cases, the 20 percent figure will be used for this study in
an effort to avoid exaggerating the effect of PLAs.
8 See also the U.S. Bureau of the Census, Census of Construction Industries, 1992, or the 1997 Statistical Abstract of the United States, p. 713.
9 2008 Union Membership Summary. Bureau of Labor Statistics. Jan. 28, 2009. http://www.bls.gov/news.release/union2.nr0.htm

THE DISCRIMINATORY IMPACT OF UNION FRINGE BENEFIT REQUIREMENTS ON NONUNION WORKERS UNDER GOVERNMENT-MANDATED PROJECT LABOR AGREEMENTS
11
Determining Average Fringe Benefit Costs to Nonunion Employers Under a PLA The final step in the analysis includes determining average fringe benefit costs that
nonunion employers must pay to union funds under a PLA. This will be calculated
through an examination of a sample of the following six unions: bricklayers, carpenters,
electricians, painters, plumbers and roofers. For the sake of simplicity, a nationwide
average is computed and used as the percentage of fringe benefit costs that must be paid
by nonunion employers to union benefit funds under PLAs. This average then will be
used to compute the windfall that flows to union fringe benefit funds from nonunion
employers when they move to PLA arrangements.
ANALYSIS
The Impact of Fringe Benefit Requirements on Nonunion Employees and EmployersTo measure the effect PLAs would have on nonunion workers’ take-home pay, nonunion
contractors were asked to provide actual data on the amount nonunion workers stand
to lose in take-home wages as a result of the use of PLAs on government projects. In
each case, nonunion workers’ take-home pay is reduced by at least 20 percent when their
employers enter into PLA arrangements.
The primary source of this reduction is the fact that the federal Davis-Bacon Act and
many state prevailing wage laws currently allow employers a credit for their fringe benefit
payments. Under each of these laws, employers are permitted to pay their employees
the cash equivalent to the costs of the prevailing fringe benefits, thereby increasing
employees’ take-home pay on government projects. However, when contractors sign PLAs
that require payment of union fringe benefits, the amount of workers’ take-home pay is
the difference between the gross amount and the fringe benefit amount paid to the union
shop. This amounts to a nearly 20 percent reduction in take-home pay.
THE DISCRIMINATORY IMPACT OF UNION FRINGE BENEFIT REQUIREMENTS ON NONUNION WORKERS UNDER GOVERNMENT-MANDATED PROJECT LABOR AGREEMENTS
12
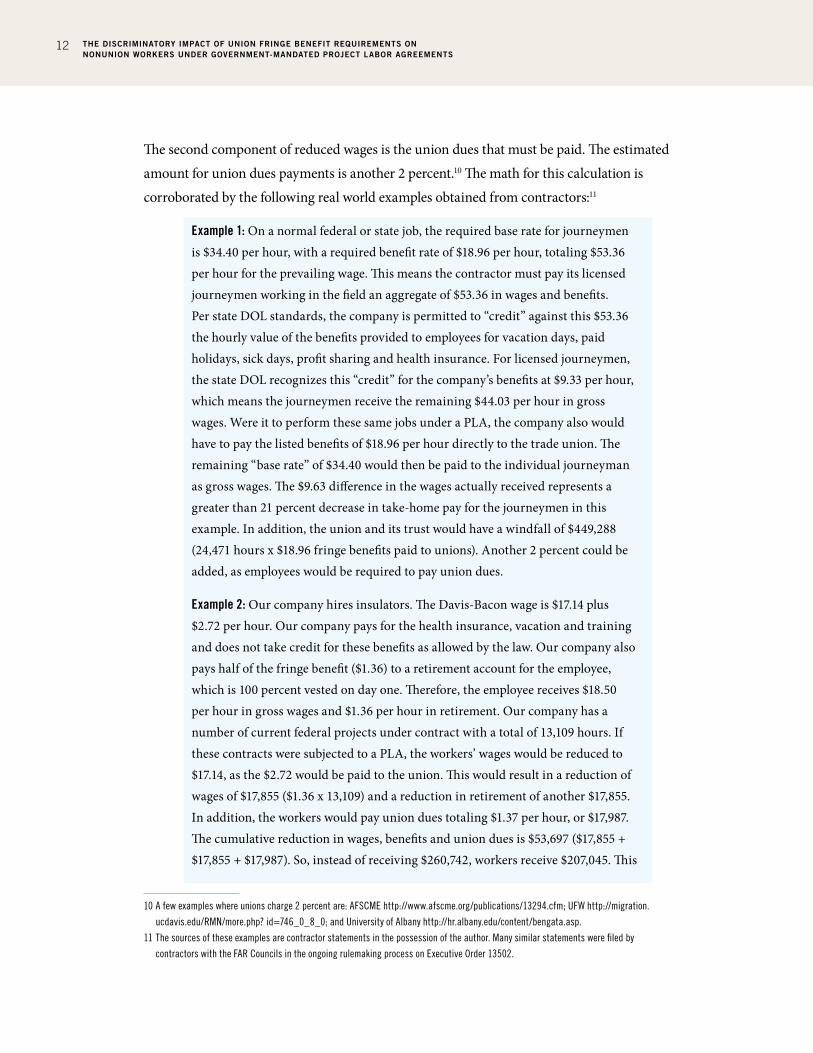
The second component of reduced wages is the union dues that must be paid. The estimated
amount for union dues payments is another 2 percent.10 The math for this calculation is
corroborated by the following real world examples obtained from contractors:11
Example 1: On a normal federal or state job, the required base rate for journeymen is $34.40 per hour, with a required benefit rate of $18.96 per hour, totaling $53.36 per hour for the prevailing wage. This means the contractor must pay its licensed journeymen working in the field an aggregate of $53.36 in wages and benefits. Per state DOL standards, the company is permitted to “credit” against this $53.36 the hourly value of the benefits provided to employees for vacation days, paid holidays, sick days, profit sharing and health insurance. For licensed journeymen, the state DOL recognizes this “credit” for the company’s benefits at $9.33 per hour, which means the journeymen receive the remaining $44.03 per hour in gross wages. Were it to perform these same jobs under a PLA, the company also would have to pay the listed benefits of $18.96 per hour directly to the trade union. The remaining “base rate” of $34.40 would then be paid to the individual journeyman as gross wages. The $9.63 difference in the wages actually received represents a greater than 21 percent decrease in take-home pay for the journeymen in this example. In addition, the union and its trust would have a windfall of $449,288 (24,471 hours x $18.96 fringe benefits paid to unions). Another 2 percent could be added, as employees would be required to pay union dues.
Example 2: Our company hires insulators. The Davis-Bacon wage is $17.14 plus $2.72 per hour. Our company pays for the health insurance, vacation and training and does not take credit for these benefits as allowed by the law. Our company also pays half of the fringe benefit ($1.36) to a retirement account for the employee, which is 100 percent vested on day one. Therefore, the employee receives $18.50 per hour in gross wages and $1.36 per hour in retirement. Our company has a number of current federal projects under contract with a total of 13,109 hours. If these contracts were subjected to a PLA, the workers’ wages would be reduced to $17.14, as the $2.72 would be paid to the union. This would result in a reduction of wages of $17,855 ($1.36 x 13,109) and a reduction in retirement of another $17,855. In addition, the workers would pay union dues totaling $1.37 per hour, or $17,987. The cumulative reduction in wages, benefits and union dues is $53,697 ($17,855 + $17,855 + $17,987). So, instead of receiving $260,742, workers receive $207,045. This
10 A few examples where unions charge 2 percent are: AFSCME http://www.afscme.org/publications/13294.cfm; UFW http://migration.
ucdavis.edu/RMN/more.php? id=746_0_8_0; and University of Albany http://hr.albany.edu/content/bengata.asp.
11 The sources of these examples are contractor statements in the possession of the author. Many similar statements were filed by
contractors with the FAR Councils in the ongoing rulemaking process on Executive Order 13502.
THE DISCRIMINATORY IMPACT OF UNION FRINGE BENEFIT REQUIREMENTS ON NONUNION WORKERS UNDER GOVERNMENT-MANDATED PROJECT LABOR AGREEMENTS
13
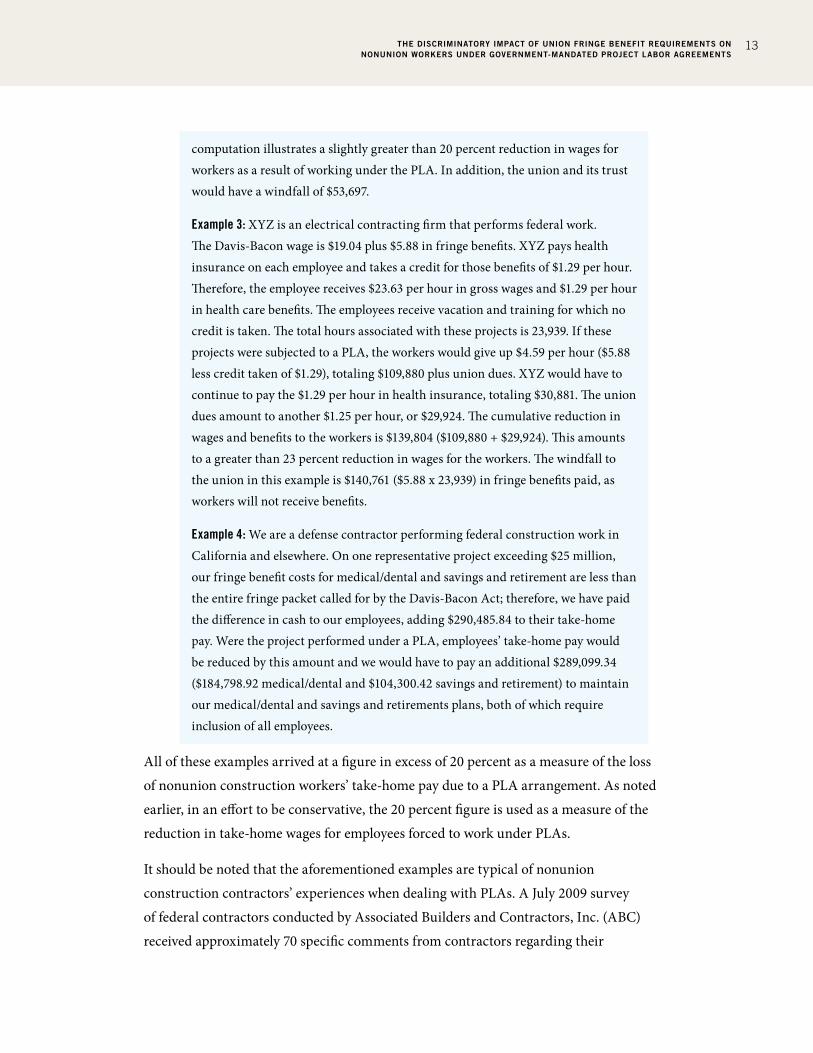
computation illustrates a slightly greater than 20 percent reduction in wages for workers as a result of working under the PLA. In addition, the union and its trust would have a windfall of $53,697.
Example 3: XYZ is an electrical contracting firm that performs federal work. The Davis-Bacon wage is $19.04 plus $5.88 in fringe benefits. XYZ pays health insurance on each employee and takes a credit for those benefits of $1.29 per hour. Therefore, the employee receives $23.63 per hour in gross wages and $1.29 per hour in health care benefits. The employees receive vacation and training for which no credit is taken. The total hours associated with these projects is 23,939. If these projects were subjected to a PLA, the workers would give up $4.59 per hour ($5.88 less credit taken of $1.29), totaling $109,880 plus union dues. XYZ would have to continue to pay the $1.29 per hour in health insurance, totaling $30,881. The union dues amount to another $1.25 per hour, or $29,924. The cumulative reduction in wages and benefits to the workers is $139,804 ($109,880 + $29,924). This amounts to a greater than 23 percent reduction in wages for the workers. The windfall to the union in this example is $140,761 ($5.88 x 23,939) in fringe benefits paid, as workers will not receive benefits.
Example 4: We are a defense contractor performing federal construction work in California and elsewhere. On one representative project exceeding $25 million, our fringe benefit costs for medical/dental and savings and retirement are less than the entire fringe packet called for by the Davis-Bacon Act; therefore, we have paid the difference in cash to our employees, adding $290,485.84 to their take-home pay. Were the project performed under a PLA, employees’ take-home pay would be reduced by this amount and we would have to pay an additional $289,099.34 ($184,798.92 medical/dental and $104,300.42 savings and retirement) to maintain our medical/dental and savings and retirements plans, both of which require inclusion of all employees.
All of these examples arrived at a figure in excess of 20 percent as a measure of the loss
of nonunion construction workers’ take-home pay due to a PLA arrangement. As noted
earlier, in an effort to be conservative, the 20 percent figure is used as a measure of the
reduction in take-home wages for employees forced to work under PLAs.
It should be noted that the aforementioned examples are typical of nonunion
construction contractors’ experiences when dealing with PLAs. A July 2009 survey
of federal contractors conducted by Associated Builders and Contractors, Inc. (ABC)
received approximately 70 specific comments from contractors regarding their
THE DISCRIMINATORY IMPACT OF UNION FRINGE BENEFIT REQUIREMENTS ON NONUNION WORKERS UNDER GOVERNMENT-MANDATED PROJECT LABOR AGREEMENTS
14
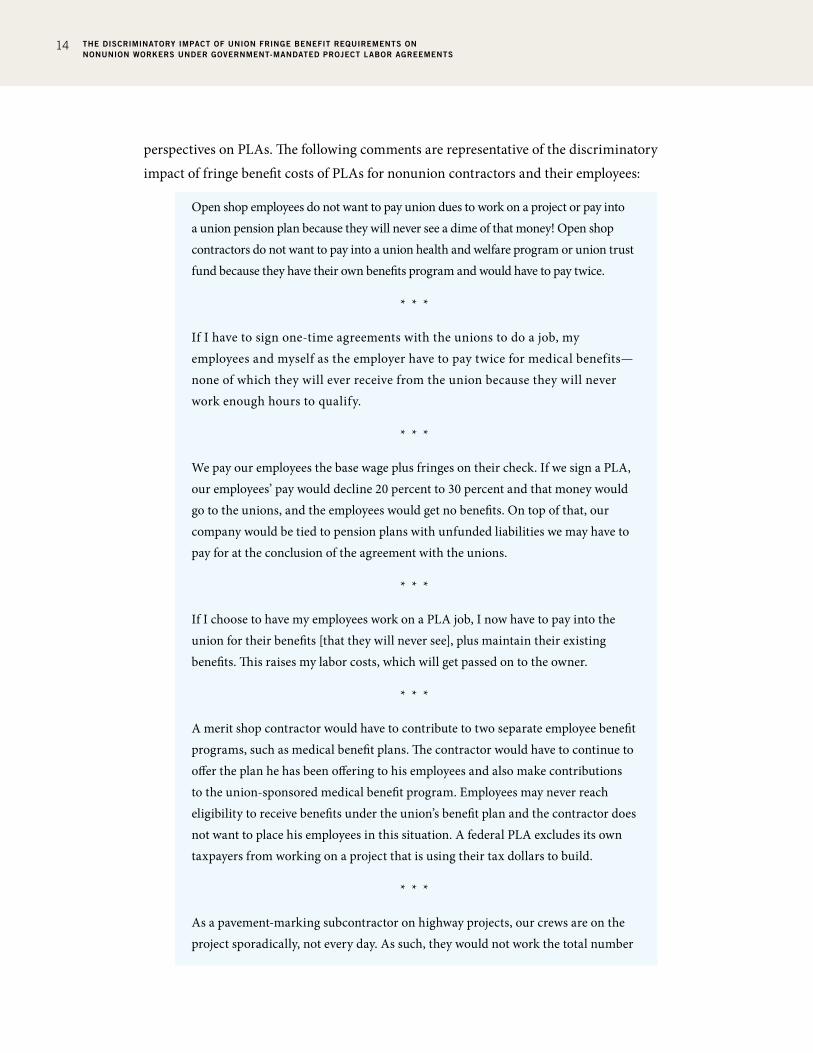
perspectives on PLAs. The following comments are representative of the discriminatory
impact of fringe benefit costs of PLAs for nonunion contractors and their employees:
Open shop employees do not want to pay union dues to work on a project or pay into a union pension plan because they will never see a dime of that money! Open shop contractors do not want to pay into a union health and welfare program or union trust fund because they have their own benefits program and would have to pay twice.
* * *
If I have to sign one-time agreements with the unions to do a job, my employees and myself as the employer have to pay twice for medical benefits—none of which they will ever receive from the union because they will never work enough hours to qualify.
* * *
We pay our employees the base wage plus fringes on their check. If we sign a PLA, our employees’ pay would decline 20 percent to 30 percent and that money would go to the unions, and the employees would get no benefits. On top of that, our company would be tied to pension plans with unfunded liabilities we may have to pay for at the conclusion of the agreement with the unions.
* * *
If I choose to have my employees work on a PLA job, I now have to pay into the union for their benefits [that they will never see], plus maintain their existing benefits. This raises my labor costs, which will get passed on to the owner.
* * *
A merit shop contractor would have to contribute to two separate employee benefit programs, such as medical benefit plans. The contractor would have to continue to offer the plan he has been offering to his employees and also make contributions to the union-sponsored medical benefit program. Employees may never reach eligibility to receive benefits under the union’s benefit plan and the contractor does not want to place his employees in this situation. A federal PLA excludes its own taxpayers from working on a project that is using their tax dollars to build.
* * *
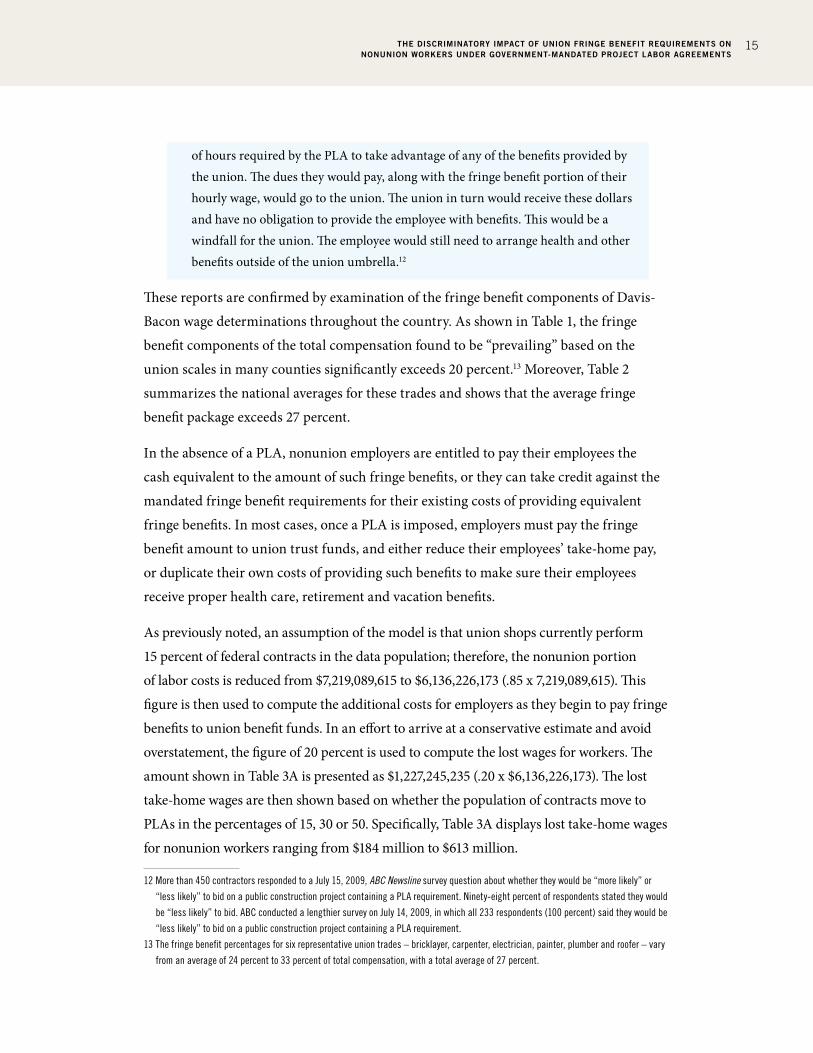
As a pavement-marking subcontractor on highway projects, our crews are on the project sporadically, not every day. As such, they would not work the total number
THE DISCRIMINATORY IMPACT OF UNION FRINGE BENEFIT REQUIREMENTS ON NONUNION WORKERS UNDER GOVERNMENT-MANDATED PROJECT LABOR AGREEMENTS
15
of hours required by the PLA to take advantage of any of the benefits provided by the union. The dues they would pay, along with the fringe benefit portion of their hourly wage, would go to the union. The union in turn would receive these dollars and have no obligation to provide the employee with benefits. This would be a windfall for the union. The employee would still need to arrange health and other benefits outside of the union umbrella.12
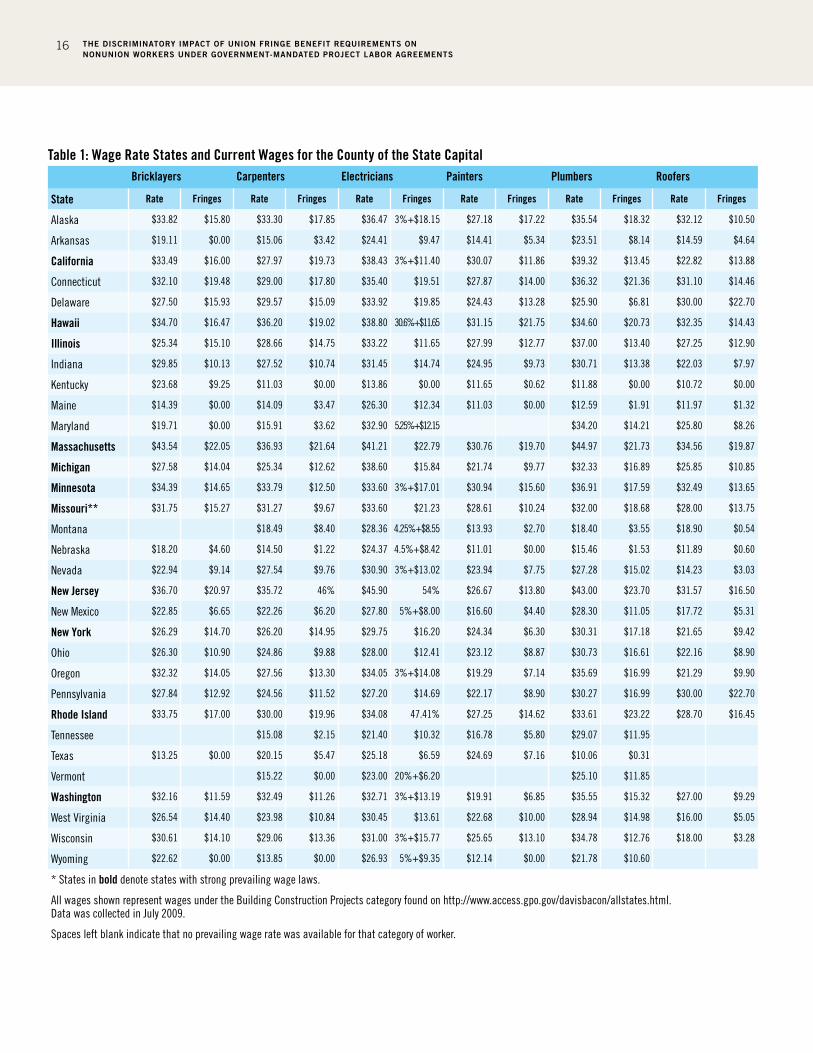
These reports are confirmed by examination of the fringe benefit components of Davis-
Bacon wage determinations throughout the country. As shown in Table 1, the fringe
benefit components of the total compensation found to be “prevailing” based on the
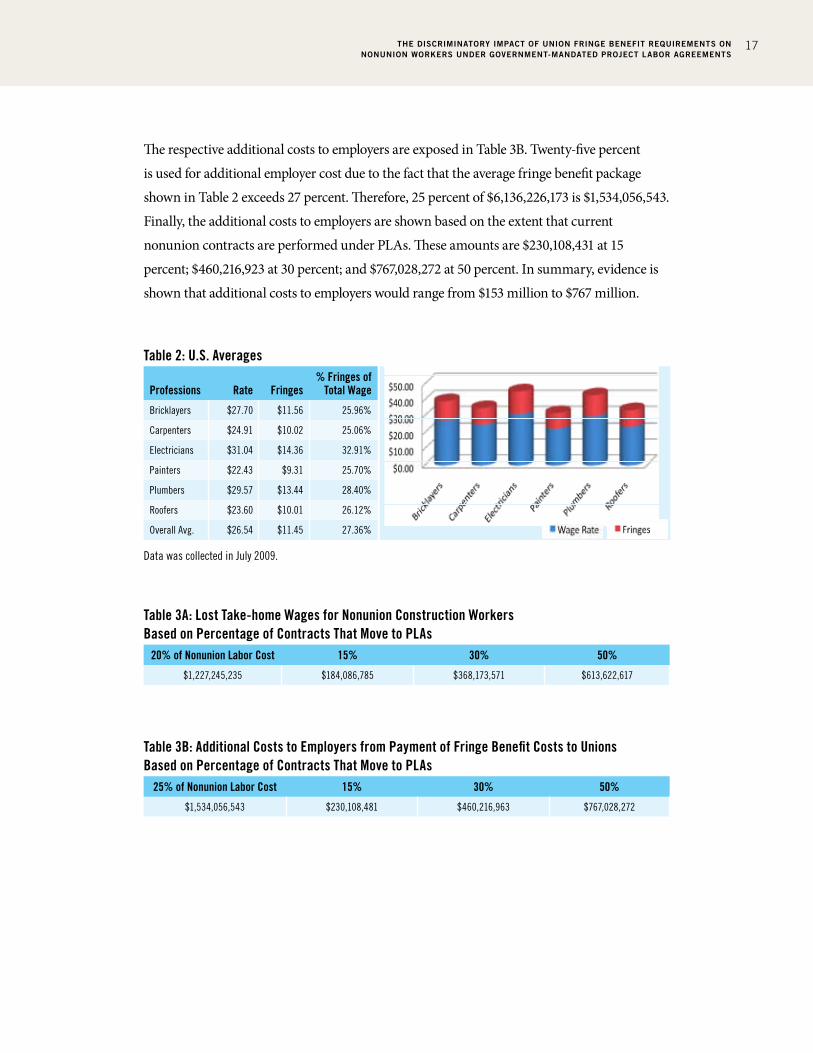
union scales in many counties significantly exceeds 20 percent.13 Moreover, Table 2
summarizes the national averages for these trades and shows that the average fringe
benefit package exceeds 27 percent.
In the absence of a PLA, nonunion employers are entitled to pay their employees the
cash equivalent to the amount of such fringe benefits, or they can take credit against the
mandated fringe benefit requirements for their existing costs of providing equivalent
fringe benefits. In most cases, once a PLA is imposed, employers must pay the fringe
benefit amount to union trust funds, and either reduce their employees’ take-home pay,
or duplicate their own costs of providing such benefits to make sure their employees
receive proper health care, retirement and vacation benefits.
As previously noted, an assumption of the model is that union shops currently perform
15 percent of federal contracts in the data population; therefore, the nonunion portion
of labor costs is reduced from $7,219,089,615 to $6,136,226,173 (.85 x 7,219,089,615). This
figure is then used to compute the additional costs for employers as they begin to pay fringe
benefits to union benefit funds. In an effort to arrive at a conservative estimate and avoid
overstatement, the figure of 20 percent is used to compute the lost wages for workers. The
amount shown in Table 3A is presented as $1,227,245,235 (.20 x $6,136,226,173). The lost
take-home wages are then shown based on whether the population of contracts move to
PLAs in the percentages of 15, 30 or 50. Specifically, Table 3A displays lost take-home wages
for nonunion workers ranging from $184 million to $613 million.
12 More than 450 contractors responded to a July 15, 2009, ABC Newsline survey question about whether they would be “more likely” or
“less likely” to bid on a public construction project containing a PLA requirement. Ninety-eight percent of respondents stated they would
be “less likely” to bid. ABC conducted a lengthier survey on July 14, 2009, in which all 233 respondents (100 percent) said they would be
“less likely” to bid on a public construction project containing a PLA requirement.
13 The fringe benefit percentages for six representative union trades – bricklayer, carpenter, electrician, painter, plumber and roofer – vary
from an average of 24 percent to 33 percent of total compensation, with a total average of 27 percent.
THE DISCRIMINATORY IMPACT OF UNION FRINGE BENEFIT REQUIREMENTS ON NONUNION WORKERS UNDER GOVERNMENT-MANDATED PROJECT LABOR AGREEMENTS
16
Table 1: Wage Rate States and Current Wages for the County of the State Capital Bricklayers Carpenters Electricians Painters Plumbers Roofers
State Rate Fringes Rate Fringes Rate Fringes Rate Fringes Rate Fringes Rate Fringes
Alaska $33.82 $15.80 $33.30 $17.85 $36.47 3%+$18.15 $27.18 $17.22 $35.54 $18.32 $32.12 $10.50
Arkansas $19.11 $0.00 $15.06 $3.42 $24.41 $9.47 $14.41 $5.34 $23.51 $8.14 $14.59 $4.64
California $33.49 $16.00 $27.97 $19.73 $38.43 3%+$11.40 $30.07 $11.86 $39.32 $13.45 $22.82 $13.88
Connecticut $32.10 $19.48 $29.00 $17.80 $35.40 $19.51 $27.87 $14.00 $36.32 $21.36 $31.10 $14.46
Delaware $27.50 $15.93 $29.57 $15.09 $33.92 $19.85 $24.43 $13.28 $25.90 $6.81 $30.00 $22.70
Hawaii $34.70 $16.47 $36.20 $19.02 $38.80 30.6%+$11.65 $31.15 $21.75 $34.60 $20.73 $32.35 $14.43
Illinois $25.34 $15.10 $28.66 $14.75 $33.22 $11.65 $27.99 $12.77 $37.00 $13.40 $27.25 $12.90
Indiana $29.85 $10.13 $27.52 $10.74 $31.45 $14.74 $24.95 $9.73 $30.71 $13.38 $22.03 $7.97
Kentucky $23.68 $9.25 $11.03 $0.00 $13.86 $0.00 $11.65 $0.62 $11.88 $0.00 $10.72 $0.00
Maine $14.39 $0.00 $14.09 $3.47 $26.30 $12.34 $11.03 $0.00 $12.59 $1.91 $11.97 $1.32
Maryland $19.71 $0.00 $15.91 $3.62 $32.90 5.25%+$12.15 $34.20 $14.21 $25.80 $8.26
Massachusetts $43.54 $22.05 $36.93 $21.64 $41.21 $22.79 $30.76 $19.70 $44.97 $21.73 $34.56 $19.87
Michigan $27.58 $14.04 $25.34 $12.62 $38.60 $15.84 $21.74 $9.77 $32.33 $16.89 $25.85 $10.85
Minnesota $34.39 $14.65 $33.79 $12.50 $33.60 3%+$17.01 $30.94 $15.60 $36.91 $17.59 $32.49 $13.65
Missouri** $31.75 $15.27 $31.27 $9.67 $33.60 $21.23 $28.61 $10.24 $32.00 $18.68 $28.00 $13.75
Montana $18.49 $8.40 $28.36 4.25%+$8.55 $13.93 $2.70 $18.40 $3.55 $18.90 $0.54
Nebraska $18.20 $4.60 $14.50 $1.22 $24.37 4.5%+$8.42 $11.01 $0.00 $15.46 $1.53 $11.89 $0.60
Nevada $22.94 $9.14 $27.54 $9.76 $30.90 3%+$13.02 $23.94 $7.75 $27.28 $15.02 $14.23 $3.03
New Jersey $36.70 $20.97 $35.72 46% $45.90 54% $26.67 $13.80 $43.00 $23.70 $31.57 $16.50
New Mexico $22.85 $6.65 $22.26 $6.20 $27.80 5%+$8.00 $16.60 $4.40 $28.30 $11.05 $17.72 $5.31
New York $26.29 $14.70 $26.20 $14.95 $29.75 $16.20 $24.34 $6.30 $30.31 $17.18 $21.65 $9.42
Ohio $26.30 $10.90 $24.86 $9.88 $28.00 $12.41 $23.12 $8.87 $30.73 $16.61 $22.16 $8.90
Oregon $32.32 $14.05 $27.56 $13.30 $34.05 3%+$14.08 $19.29 $7.14 $35.69 $16.99 $21.29 $9.90
Pennsylvania $27.84 $12.92 $24.56 $11.52 $27.20 $14.69 $22.17 $8.90 $30.27 $16.99 $30.00 $22.70
Rhode Island $33.75 $17.00 $30.00 $19.96 $34.08 47.41% $27.25 $14.62 $33.61 $23.22 $28.70 $16.45
Tennessee $15.08 $2.15 $21.40 $10.32 $16.78 $5.80 $29.07 $11.95
Texas $13.25 $0.00 $20.15 $5.47 $25.18 $6.59 $24.69 $7.16 $10.06 $0.31
Vermont $15.22 $0.00 $23.00 20%+$6.20 $25.10 $11.85
Washington $32.16 $11.59 $32.49 $11.26 $32.71 3%+$13.19 $19.91 $6.85 $35.55 $15.32 $27.00 $9.29
West Virginia $26.54 $14.40 $23.98 $10.84 $30.45 $13.61 $22.68 $10.00 $28.94 $14.98 $16.00 $5.05
Wisconsin $30.61 $14.10 $29.06 $13.36 $31.00 3%+$15.77 $25.65 $13.10 $34.78 $12.76 $18.00 $3.28
Wyoming $22.62 $0.00 $13.85 $0.00 $26.93 5%+$9.35 $12.14 $0.00 $21.78 $10.60
* States in bold denote states with strong prevailing wage laws.
All wages shown represent wages under the Building Construction Projects category found on http://www.access.gpo.gov/davisbacon/allstates.html. Data was collected in July 2009.
Spaces left blank indicate that no prevailing wage rate was available for that category of worker.
THE DISCRIMINATORY IMPACT OF UNION FRINGE BENEFIT REQUIREMENTS ON NONUNION WORKERS UNDER GOVERNMENT-MANDATED PROJECT LABOR AGREEMENTS
17
Table 2: U.S. Averages
Professions Rate Fringes% Fringes of
Total Wage
Bricklayers $27.70 $11.56 25.96%
Carpenters $24.91 $10.02 25.06%
Electricians $31.04 $14.36 32.91%
Painters $22.43 $9.31 25.70%
Plumbers $29.57 $13.44 28.40%
Roofers $23.60 $10.01 26.12%
Overall Avg. $26.54 $11.45 27.36%
Data was collected in July 2009.
Table 3A: Lost Take-home Wages for Nonunion Construction Workers Based on Percentage of Contracts That Move to PLAs
20% of Nonunion Labor Cost 15% 30% 50%
$1,227,245,235 $184,086,785 $368,173,571 $613,622,617
Table 3B: Additional Costs to Employers from Payment of Fringe Benefit Costs to UnionsBased on Percentage of Contracts That Move to PLAs
25% of Nonunion Labor Cost 15% 30% 50%
$1,534,056,543 $230,108,481 $460,216,963 $767,028,272
The respective additional costs to employers are exposed in Table 3B. Twenty-five percent
is used for additional employer cost due to the fact that the average fringe benefit package
shown in Table 2 exceeds 27 percent. Therefore, 25 percent of $6,136,226,173 is $1,534,056,543.
Finally, the additional costs to employers are shown based on the extent that current
nonunion contracts are performed under PLAs. These amounts are $230,108,431 at 15
percent; $460,216,923 at 30 percent; and $767,028,272 at 50 percent. In summary, evidence is
shown that additional costs to employers would range from $153 million to $767 million.
THE DISCRIMINATORY IMPACT OF UNION FRINGE BENEFIT REQUIREMENTS ON NONUNION WORKERS UNDER GOVERNMENT-MANDATED PROJECT LABOR AGREEMENTS
18
Potential Withdrawal Liability for EmployersA withdrawal liability arises if and when an employer decides to cease contributions
to a multi-employer pension plan,14 provided that certain conditions are met under the
Multi-Employer Pension Plan Amendments to ERISA. Employers may decide to leave a
multi-employer pension plan for any number of reasons, including bankruptcy, ceasing
operations, switching to nonunion employees, and/or choosing an alternate employee
benefits model with less expensive contribution amounts (See Binns 2009). The business
must then pay its “fair share” of any unfunded benefits to ensure the pension funds
remain financially stable and solvent. That “fair share” is known as withdrawal liability.
Withdrawal liabilities are often painful to employers because they can be a very large
dollar amount and may need to be paid in one lump-sum payment.
Employers that become signatory or otherwise bound to collective bargaining
agreements incorporating these defined benefit plans are obligated by the contract to
make contributions to the pension trust for the benefit of their employees.15 Over time,
employees’ rights to a future pension benefit become vested, meaning they have earned—
and cannot be deprived of—the promised pension benefit. The pension trust fund
employs actuaries who evaluate the plans’ promised future benefits against the assets
and income available to the trust to fund those future benefits. When a plan’s assets
and anticipated income (contributions and earnings) are equal to or greater than future
promised benefits, it is considered fully funded. However, when the assets and anticipated
income are insufficient to satisfy promised benefits, the plan is considered underfunded.
Impact of Economy on Multi-Employer Pension Plans For the 20-year period leading up to 2003, most multi-employer benefit plans
enjoyed positive financial results due to positive stock market results and increasing
contribution rates. Due to this profitability, benefits promised to employees rose and
employers were given time off from making full pension contributions. Plans initially
started to unravel during the 2002-2003 drop in the stock market, when the Dow Jones
dipped slightly below 8,000 from a high of 12,000. Some plans suffered losses of 30
14 Multi-employer pension plans are created and sponsored by a labor union in order to provide retirement income for workers who have
worked for multiple employers. This requires the union, the sponsor of the plan, to negotiate with each employer to join and contribute to
the fund. They are often called “Taft-Hartley plans,” and are managed by a board of trustees, which consists of an equal number of union
and employer representatives. The union negotiates with each employer and the board to determine contribution levels, and the board
determines the level of benefits and manages the fund. (Furchtgott-Roth and Brown, 2009)
15 Discussion in this section relies on an article by Ronald W. Brown, Esq. “Withdrawal Liability Is Back with a Vengeance.”
THE DISCRIMINATORY IMPACT OF UNION FRINGE BENEFIT REQUIREMENTS ON NONUNION WORKERS UNDER GOVERNMENT-MANDATED PROJECT LABOR AGREEMENTS
19
percent to 40 percent in the assets available for plan benefits. As a result, many defined
benefit plans became seriously underfunded. Fortunately, the market began recovering,
with the Dow exceeding 14,000 in 2008. Since then, however, the Dow has once again
dipped below 8,000 and placed even more pressure on defined benefit pension plans.16
While the Dow has recently risen above 10,000, pending demographic shifts and
problems with the Social Security trust fund will exacerbate the current problems with
defined benefit pension plans.
The problem with Social Security is that its finances are based on the relationship
between the number of workers paying taxes and the number of retirees receiving
benefits. Back in 1950, as the baby boom was just getting started, each retiree’s benefit
was divided among 16 workers. Taxes could be kept low. Today, that number has dropped
to 3.3 workers per retiree, and by 2025, it will reach—and remain at—about two workers
per retiree. Each married couple will have to pay, in addition to its own family’s expenses,
Social Security retirement benefits for one retiree. In order to pay promised benefits,
either taxes of some kind must increase or other government services must be cut.17
A recent study from the Bureau of National Affairs (BNA; Maresca 2009), reported that
multi-employer plans have become significantly underfunded across all industries, thus
threatening their long-term viability. To deal with these financial struggles, certain pension
plan trustees have agreed to allocate both employer pensions and health plan contributions
to cover pension plan obligations alone. In other cases, unions have agreed to sacrifice some
of the bargaining units’ entire wage increases to maximize pension plan contributions.
The Critical or Endangered Status of Construction Union Pension PlansAmong other things, the Pension Protection Act (PPA) of 2006 mandated that employees
be informed about whether their pension plans are adequately funded to pay current
and future pension benefits. The PPA requires companies to value the assets of the
pension plans on an actuarial basis yearly to ensure plans are funded adequately. If at
the beginning of the year the funded percentage of the pension plan is less than 80, the
plan is considered to be in an “endangered” status. Moreover, if at the beginning of the
16 See also Washington Examiner, June 7, 2009, “Almost Half of Top Unions Have Underfunded Pension Plans.” http://www.washingtonexaminer.
com/opinion/blogs/beltway-confidential/Almost-half-of-top-unions-have-underfunded-pension-plans--47162127.html
17 Social Security’s Problem, See http://socialsecurityreform.org/problem/index.cfmSocial.
THE DISCRIMINATORY IMPACT OF UNION FRINGE BENEFIT REQUIREMENTS ON NONUNION WORKERS UNDER GOVERNMENT-MANDATED PROJECT LABOR AGREEMENTS
20
year the funded percentage is less than 65, then the plan is considered to be in a “critical”
status. A plan also is considered critical if its level of contributions currently is—or is
projected to be in any of the next three plan years—less than the minimum contribution
amount required by the law for that year. If a pension plan falls into either a critical or
endangered status, the trustees of the plan are required to establish steps and benchmarks
for the pension plans to improve their funding status during a specified period of time.
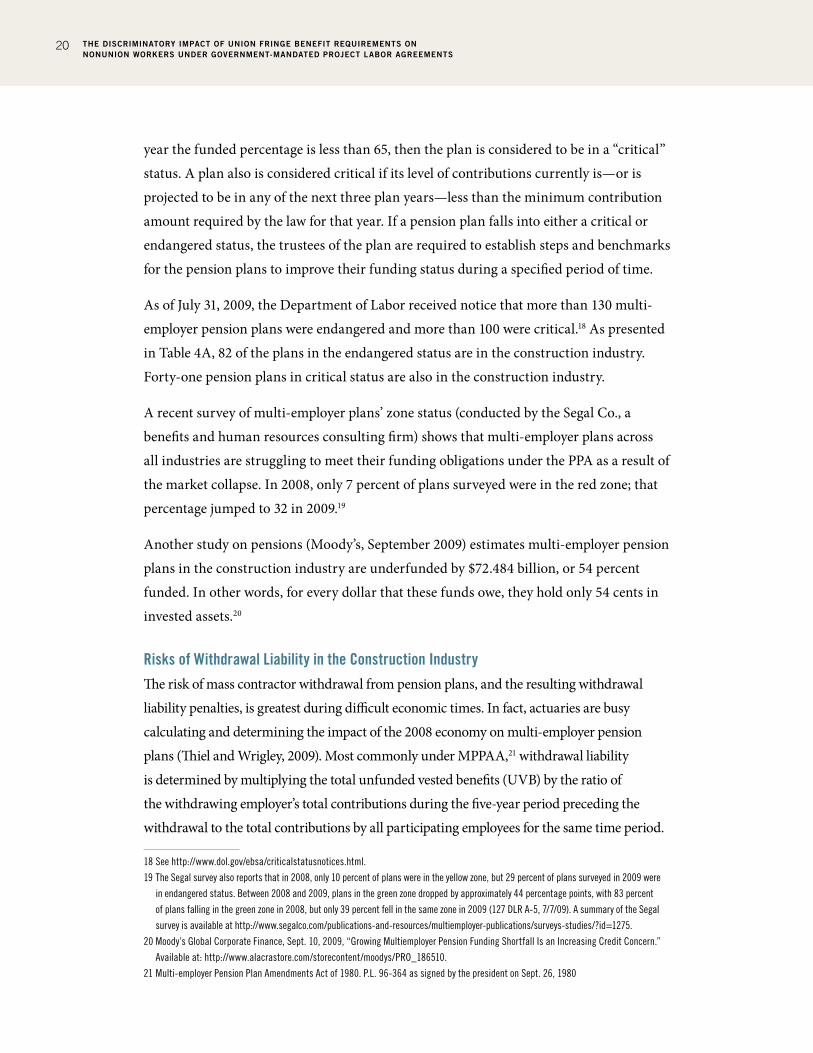
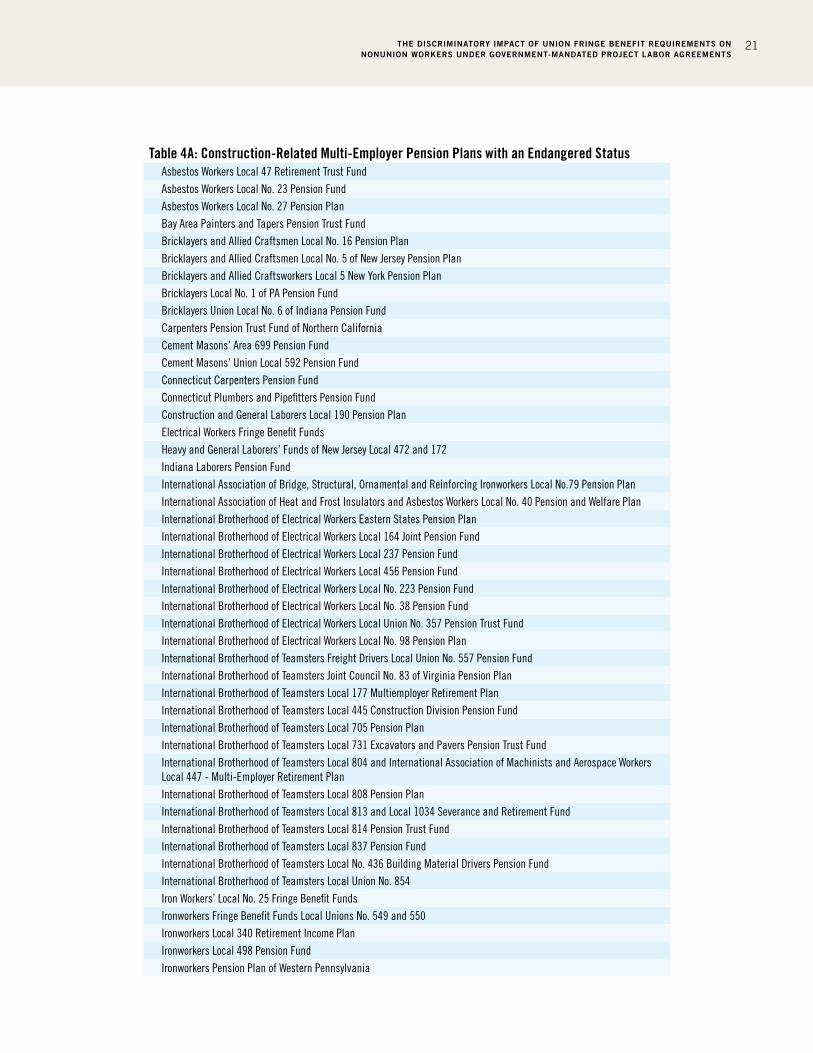
As of July 31, 2009, the Department of Labor received notice that more than 130 multi-
employer pension plans were endangered and more than 100 were critical.18 As presented
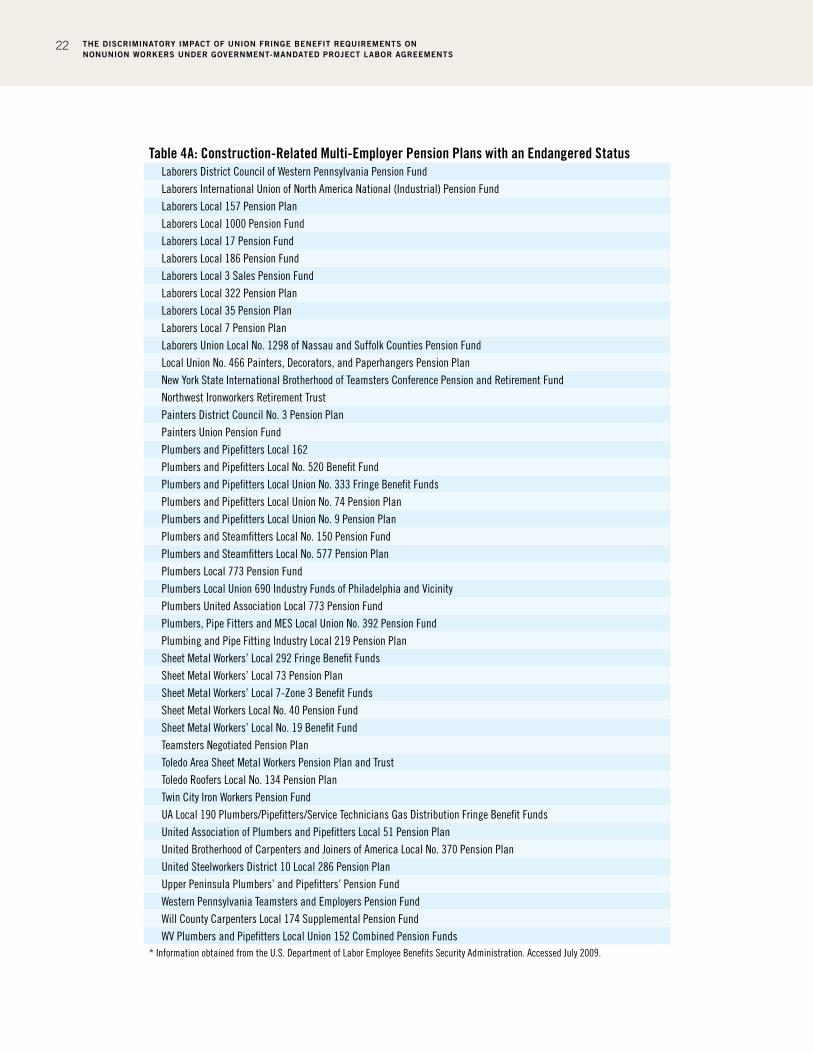
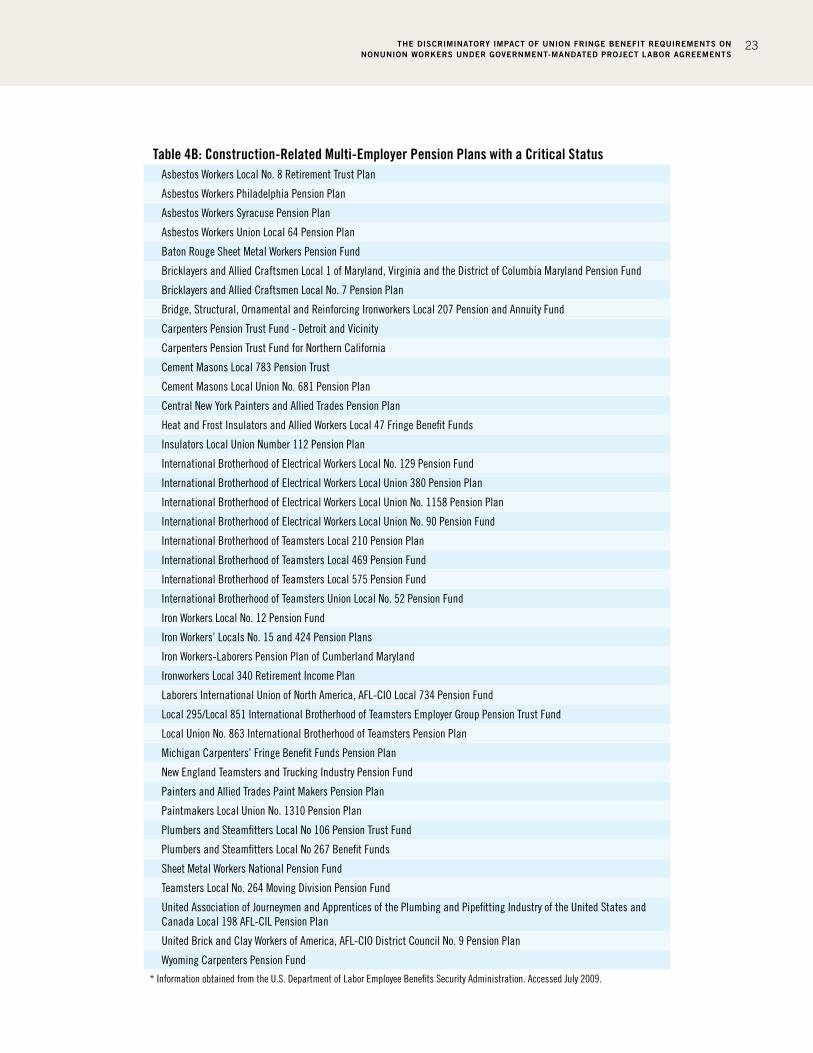
in Table 4A, 82 of the plans in the endangered status are in the construction industry.
Forty-one pension plans in critical status are also in the construction industry.
A recent survey of multi-employer plans’ zone status (conducted by the Segal Co., a
benefits and human resources consulting firm) shows that multi-employer plans across
all industries are struggling to meet their funding obligations under the PPA as a result of
the market collapse. In 2008, only 7 percent of plans surveyed were in the red zone; that
percentage jumped to 32 in 2009.19
Another study on pensions (Moody’s, September 2009) estimates multi-employer pension
plans in the construction industry are underfunded by $72.484 billion, or 54 percent
funded. In other words, for every dollar that these funds owe, they hold only 54 cents in
invested assets.20
Risks of Withdrawal Liability in the Construction IndustryThe risk of mass contractor withdrawal from pension plans, and the resulting withdrawal
liability penalties, is greatest during difficult economic times. In fact, actuaries are busy
calculating and determining the impact of the 2008 economy on multi-employer pension
plans (Thiel and Wrigley, 2009). Most commonly under MPPAA,21 withdrawal liability
is determined by multiplying the total unfunded vested benefits (UVB) by the ratio of
the withdrawing employer’s total contributions during the five-year period preceding the
withdrawal to the total contributions by all participating employees for the same time period.
18 See http://www.dol.gov/ebsa/criticalstatusnotices.html.
19 The Segal survey also reports that in 2008, only 10 percent of plans were in the yellow zone, but 29 percent of plans surveyed in 2009 were
in endangered status. Between 2008 and 2009, plans in the green zone dropped by approximately 44 percentage points, with 83 percent
of plans falling in the green zone in 2008, but only 39 percent fell in the same zone in 2009 (127 DLR A-5, 7/7/09). A summary of the Segal
survey is available at http://www.segalco.com/publications-and-resources/multiemployer-publications/surveys-studies/?id=1275.
20 Moody’s Global Corporate Finance, Sept. 10, 2009, “Growing Multiemployer Pension Funding Shortfall Is an Increasing Credit Concern.”
Available at: http://www.alacrastore.com/storecontent/moodys/PRO_186510.
21 Multi-employer Pension Plan Amendments Act of 1980. P.L. 96-364 as signed by the president on Sept. 26, 1980
THE DISCRIMINATORY IMPACT OF UNION FRINGE BENEFIT REQUIREMENTS ON NONUNION WORKERS UNDER GOVERNMENT-MANDATED PROJECT LABOR AGREEMENTS
21
Table 4A: Construction-Related Multi-Employer Pension Plans with an Endangered StatusAsbestos Workers Local 47 Retirement Trust FundAsbestos Workers Local No. 23 Pension FundAsbestos Workers Local No. 27 Pension PlanBay Area Painters and Tapers Pension Trust FundBricklayers and Allied Craftsmen Local No. 16 Pension PlanBricklayers and Allied Craftsmen Local No. 5 of New Jersey Pension PlanBricklayers and Allied Craftsworkers Local 5 New York Pension PlanBricklayers Local No. 1 of PA Pension FundBricklayers Union Local No. 6 of Indiana Pension FundCarpenters Pension Trust Fund of Northern CaliforniaCement Masons’ Area 699 Pension FundCement Masons’ Union Local 592 Pension FundConnecticut Carpenters Pension FundConnecticut Plumbers and Pipefitters Pension FundConstruction and General Laborers Local 190 Pension PlanElectrical Workers Fringe Benefit FundsHeavy and General Laborers’ Funds of New Jersey Local 472 and 172Indiana Laborers Pension FundInternational Association of Bridge, Structural, Ornamental and Reinforcing Ironworkers Local No.79 Pension PlanInternational Association of Heat and Frost Insulators and Asbestos Workers Local No. 40 Pension and Welfare PlanInternational Brotherhood of Electrical Workers Eastern States Pension PlanInternational Brotherhood of Electrical Workers Local 164 Joint Pension FundInternational Brotherhood of Electrical Workers Local 237 Pension FundInternational Brotherhood of Electrical Workers Local 456 Pension FundInternational Brotherhood of Electrical Workers Local No. 223 Pension FundInternational Brotherhood of Electrical Workers Local No. 38 Pension FundInternational Brotherhood of Electrical Workers Local Union No. 357 Pension Trust FundInternational Brotherhood of Electrical Workers Local No. 98 Pension PlanInternational Brotherhood of Teamsters Freight Drivers Local Union No. 557 Pension FundInternational Brotherhood of Teamsters Joint Council No. 83 of Virginia Pension PlanInternational Brotherhood of Teamsters Local 177 Multiemployer Retirement PlanInternational Brotherhood of Teamsters Local 445 Construction Division Pension FundInternational Brotherhood of Teamsters Local 705 Pension PlanInternational Brotherhood of Teamsters Local 731 Excavators and Pavers Pension Trust FundInternational Brotherhood of Teamsters Local 804 and International Association of Machinists and Aerospace Workers Local 447 - Multi-Employer Retirement PlanInternational Brotherhood of Teamsters Local 808 Pension PlanInternational Brotherhood of Teamsters Local 813 and Local 1034 Severance and Retirement FundInternational Brotherhood of Teamsters Local 814 Pension Trust FundInternational Brotherhood of Teamsters Local 837 Pension FundInternational Brotherhood of Teamsters Local No. 436 Building Material Drivers Pension FundInternational Brotherhood of Teamsters Local Union No. 854Iron Workers’ Local No. 25 Fringe Benefit FundsIronworkers Fringe Benefit Funds Local Unions No. 549 and 550Ironworkers Local 340 Retirement Income PlanIronworkers Local 498 Pension FundIronworkers Pension Plan of Western Pennsylvania
THE DISCRIMINATORY IMPACT OF UNION FRINGE BENEFIT REQUIREMENTS ON NONUNION WORKERS UNDER GOVERNMENT-MANDATED PROJECT LABOR AGREEMENTS
22
Table 4A: Construction-Related Multi-Employer Pension Plans with an Endangered StatusLaborers District Council of Western Pennsylvania Pension FundLaborers International Union of North America National (Industrial) Pension FundLaborers Local 157 Pension PlanLaborers Local 1000 Pension FundLaborers Local 17 Pension FundLaborers Local 186 Pension FundLaborers Local 3 Sales Pension FundLaborers Local 322 Pension PlanLaborers Local 35 Pension PlanLaborers Local 7 Pension PlanLaborers Union Local No. 1298 of Nassau and Suffolk Counties Pension FundLocal Union No. 466 Painters, Decorators, and Paperhangers Pension PlanNew York State International Brotherhood of Teamsters Conference Pension and Retirement FundNorthwest Ironworkers Retirement TrustPainters District Council No. 3 Pension PlanPainters Union Pension FundPlumbers and Pipefitters Local 162Plumbers and Pipefitters Local No. 520 Benefit FundPlumbers and Pipefitters Local Union No. 333 Fringe Benefit FundsPlumbers and Pipefitters Local Union No. 74 Pension PlanPlumbers and Pipefitters Local Union No. 9 Pension PlanPlumbers and Steamfitters Local No. 150 Pension FundPlumbers and Steamfitters Local No. 577 Pension PlanPlumbers Local 773 Pension FundPlumbers Local Union 690 Industry Funds of Philadelphia and VicinityPlumbers United Association Local 773 Pension FundPlumbers, Pipe Fitters and MES Local Union No. 392 Pension FundPlumbing and Pipe Fitting Industry Local 219 Pension PlanSheet Metal Workers’ Local 292 Fringe Benefit FundsSheet Metal Workers’ Local 73 Pension PlanSheet Metal Workers’ Local 7-Zone 3 Benefit FundsSheet Metal Workers Local No. 40 Pension FundSheet Metal Workers’ Local No. 19 Benefit FundTeamsters Negotiated Pension PlanToledo Area Sheet Metal Workers Pension Plan and TrustToledo Roofers Local No. 134 Pension PlanTwin City Iron Workers Pension FundUA Local 190 Plumbers/Pipefitters/Service Technicians Gas Distribution Fringe Benefit FundsUnited Association of Plumbers and Pipefitters Local 51 Pension PlanUnited Brotherhood of Carpenters and Joiners of America Local No. 370 Pension PlanUnited Steelworkers District 10 Local 286 Pension PlanUpper Peninsula Plumbers’ and Pipefitters’ Pension FundWestern Pennsylvania Teamsters and Employers Pension FundWill County Carpenters Local 174 Supplemental Pension FundWV Plumbers and Pipefitters Local Union 152 Combined Pension Funds
* Information obtained from the U.S. Department of Labor Employee Benefits Security Administration. Accessed July 2009.
THE DISCRIMINATORY IMPACT OF UNION FRINGE BENEFIT REQUIREMENTS ON NONUNION WORKERS UNDER GOVERNMENT-MANDATED PROJECT LABOR AGREEMENTS
23
Table 4B: Construction-Related Multi-Employer Pension Plans with a Critical StatusAsbestos Workers Local No. 8 Retirement Trust Plan
Asbestos Workers Philadelphia Pension Plan
Asbestos Workers Syracuse Pension Plan
Asbestos Workers Union Local 64 Pension Plan
Baton Rouge Sheet Metal Workers Pension Fund
Bricklayers and Allied Craftsmen Local 1 of Maryland, Virginia and the District of Columbia Maryland Pension Fund
Bricklayers and Allied Craftsmen Local No. 7 Pension Plan
Bridge, Structural, Ornamental and Reinforcing Ironworkers Local 207 Pension and Annuity Fund
Carpenters Pension Trust Fund - Detroit and Vicinity
Carpenters Pension Trust Fund for Northern California
Cement Masons Local 783 Pension Trust
Cement Masons Local Union No. 681 Pension Plan
Central New York Painters and Allied Trades Pension Plan
Heat and Frost Insulators and Allied Workers Local 47 Fringe Benefit Funds
Insulators Local Union Number 112 Pension Plan
International Brotherhood of Electrical Workers Local No. 129 Pension Fund
International Brotherhood of Electrical Workers Local Union 380 Pension Plan
International Brotherhood of Electrical Workers Local Union No. 1158 Pension Plan
International Brotherhood of Electrical Workers Local Union No. 90 Pension Fund
International Brotherhood of Teamsters Local 210 Pension Plan
International Brotherhood of Teamsters Local 469 Pension Fund
International Brotherhood of Teamsters Local 575 Pension Fund
International Brotherhood of Teamsters Union Local No. 52 Pension Fund
Iron Workers Local No. 12 Pension Fund
Iron Workers’ Locals No. 15 and 424 Pension Plans
Iron Workers-Laborers Pension Plan of Cumberland Maryland
Ironworkers Local 340 Retirement Income Plan
Laborers International Union of North America, AFL-CIO Local 734 Pension Fund
Local 295/Local 851 International Brotherhood of Teamsters Employer Group Pension Trust Fund
Local Union No. 863 International Brotherhood of Teamsters Pension Plan
Michigan Carpenters’ Fringe Benefit Funds Pension Plan
New England Teamsters and Trucking Industry Pension Fund
Painters and Allied Trades Paint Makers Pension Plan
Paintmakers Local Union No. 1310 Pension Plan
Plumbers and Steamfitters Local No 106 Pension Trust Fund
Plumbers and Steamfitters Local No 267 Benefit Funds
Sheet Metal Workers National Pension Fund
Teamsters Local No. 264 Moving Division Pension Fund
United Association of Journeymen and Apprentices of the Plumbing and Pipefitting Industry of the United States and Canada Local 198 AFL-CIL Pension Plan
United Brick and Clay Workers of America, AFL-CIO District Council No. 9 Pension Plan
Wyoming Carpenters Pension Fund
* Information obtained from the U.S. Department of Labor Employee Benefits Security Administration. Accessed July 2009.
THE DISCRIMINATORY IMPACT OF UNION FRINGE BENEFIT REQUIREMENTS ON NONUNION WORKERS UNDER GOVERNMENT-MANDATED PROJECT LABOR AGREEMENTS
24
For example, assume a single unionized construction company suffers a withdrawal liability
to the Laborers International Union pension plan. Further assume that the contractor’s
pension contributions for the five-year period before the sale amounted to $250,000, and
that total contribution by all employers was $250 million. The employer’s withdrawal liability
would be .001 times the total unfunded liability. If the total unfunded liability were $1 billion,
the individual contractor would owe $1 million in withdrawal liability.
The rules governing withdrawal liability for employers in the construction industry are
somewhat unique. In such cases, employers will not incur withdrawal liability unless
they (1) cease having an obligation to contribute to the fund, and (2) continue to engage
in the same business in the same geographic area covered by the plan. In other words, a
construction industry employer will not incur withdrawal liability if it goes out of business
or moves its business out of the geographic area covered by the plan; however, it will incur
withdrawal liability if it “goes nonunion” and continues operations in the area.22
Another example of increased employer contributions in the construction industry is discussed
in BNA (Maresca 2009). Due to the market collapse and sharp decline of activity in the building
and construction industry, many construction employers have withdrawn from multi-employer
funds and ceased building activity in the same area served by members of the multi-employer
fund. In these cases, employers were not subject to withdrawal liability. As a result, the long-
term viability of the plans from which they withdrew were put under increased pressure. When
several construction employers leave a multi-employer plan without incurring withdrawal
liability, contributions decline and the remaining plans could end up in the red zone. As a result,
these plans would have to comply with the PPA’s requirements for emerging from critical status.
Furthermore, when a construction employer goes bankrupt, a multi-employer plan looking
to collect from the employer is at a loss. The plan cannot collect money from the bankrupt
employer, nor would the plan have a claim in bankruptcy court, as there is no official liability.
The extent of withdrawal liability exposure for construction employers that sign union-
only PLAs has not been fully tested in litigation.23 Because of the significant risks and
substantial sums of money involved, however, nonunion contractors are reluctant to
incur the potential costs of participation in any underfunded union pension plan.
22 As one of numerous examples of such withdrawal liability being imposed on construction contractors, see, e.g., Technical Metallurgical Services, Inc. v. Plumbers and Pipefitters National Fund, 213 Fed. Appx. 268 (5th Cir. 2007) (upholding assessment of $125,336 in
withdrawal liability against a construction contractor who ceased making contributions to an underfunded pension fund).
23 See Northern New England Carpenters Pension Fund v. H.P. Cummings, 2003 WL 1856440 (D.Me., April 10, 2003), where the Carpenters Pension
Fund attempted to assess withdrawal liability against a former signatory to a PLA. A federal court affirmed an arbitrator’s holding that, because
the “jurisdiction” of a PLA was a particular project, subsequent work in the geographic area would not be “in the jurisdiction…” within the
meaning of 29 U.S.C. § 1383(b)(2) unless the contractor went back to perform work on the same site within five years.
THE DISCRIMINATORY IMPACT OF UNION FRINGE BENEFIT REQUIREMENTS ON NONUNION WORKERS UNDER GOVERNMENT-MANDATED PROJECT LABOR AGREEMENTS
25
CONCLUSION
For a variety of reasons, the execution of federal construction contracts through PLAs reduces
take-home pay for workers and substantially increase costs for nonunion employers. In
addition, nonunion employers may be exposed to significant withdrawal liability as a result of
being required to participate in a multi-employer (union) pension plan.
This paper provides evidence on the amounts of both lost take-home wages for nonunion
employees and additional costs to employers as a result of the adoption of PLAs.
Had President Obama’s Executive Order 13502 been in place in 2008, lost wages for
nonunion construction workers would have ranged from $184 million to more than $613
million, depending on the assumption made for companies executing contracts through
PLAs. Similarly, additional costs to nonunion employers would have ranged from $230
million to $767 million. In total, the move to PLAs would have cost nonunion workers
and their employers $414 million to more than $1.38 billion annually. In addition,
nonunion contractors may face significant exposure to withdrawal liability if they
participate in multi-employer pension plans imposed on them by PLAs.
This robust data and well-documented concerns about the impact of a PLA’s fringe
benefit requirement on nonunion employers and employees should be considered
carefully when evaluating whether Executive Order 13502 and government-mandated
PLAs are good public policy.
THE DISCRIMINATORY IMPACT OF UNION FRINGE BENEFIT REQUIREMENTS ON NONUNION WORKERS UNDER GOVERNMENT-MANDATED PROJECT LABOR AGREEMENTS
26
REFERENCES
Binns, E., “Liability can linger after multi-employer pensions,” St. Louis Business Journal,
February 27, 2009.
Brown, R.W., “Withdrawal Liability Is Back with a Vengeance” Cook Brown LLP, Winter
Spring 2007.
Furchtogott-Roth, Diana and Andrew Brown, “Comparing Union-Sponsored and Private
Pension Plans: How Safe are Workers’ Retirements?”Hudson Institute, September 2009.
www.hudson.org.
Maresca, M. Z., “Underfunded Multiemployer Plans Face Negotiation, Liability
Withdrawal Issues,” BNA’s Pension & Benefits Reporter; v36 p 498 Mar 3, 2009.
Theil, H.H., and K.J. Wrigley, “Stormy Withdrawal: A Perfect Storm Is Forming Over
an Often Lightly Regarded Financial Obligation-Withdrawal Liability,” St. Louis Small
Business Monthly, April 2009.
Vedder R., “Michigan’s Prevailing Wage Law and Its Effects on Government Spending
and Construction Employment,” Mackinac Center for Public Policy Report. 1999.