
The discovery of a conjugate system of ... - Science Advances · Avenue, Singapore 639798,...
9
EARTH SCIENCES 2017 © The Authors, some rights reserved; exclusive licensee American Association for the Advancement of Science. Distributed under a Creative Commons Attribution NonCommercial License 4.0 (CC BY-NC). The discovery of a conjugate system of faults in the Wharton Basin intraplate deformation zone Satish C. Singh, 1,2 * Nugroho Hananto, 3 Yanfang Qin, 1 Frederique Leclerc, 2 Praditya Avianto, 4 Paul E. Tapponnier, 2 Helene Carton, 1† Shengji Wei, 2 Adam B. Nugroho, 5 Wishnu A. Gemilang, 6 Kerry Sieh, 2 Sylvain Barbot 2 The deformation at well-defined, narrow plate boundaries depends on the relative plate motion, but how the deformation takes place within a distributed plate boundary zone remains a conundrum. This was confirmed by the seismological analyses of the 2012 great Wharton Basin earthquakes [moment magnitude (M w ) 8.6], which suggested the rupture of several faults at high angles to one another. Using high-resolution bathymetry and seismic reflection data, we report the discovery of new N294°E-striking shear zones, oblique to the plate fabric. These shear zones are expressed by sets of normal faults striking at N335°E, defining the direction of the prin- cipal compressional stress in the region. Also, we have imaged left-lateral strike-slip faults along reactivated N7°E- oriented oceanic fracture zones. The shear zones and the reactivated fracture zones form a conjugate system of faults, which accommodate present-day intraplate deformation in the Wharton Basin. INTRODUCTION Plate boundaries are the key elements of plate tectonics. There are three types of plate boundaries: convergent, divergent, and transform or strike-slip boundaries. The deformation along these plate bound- aries is controlled by the motion between the plates, evidenced by the occurrence of different types of earthquakes. For example, normal faulting earthquakes are generally produced at divergent plate bound- aries, whereas dominantly thrust earthquakes occur at convergent boundaries. Therefore, the nature of deformation along plate bound- aries is well understood, and the direction of maximum stress is more or less well defined. However, the deformation on plate boundaries sometimes induces stresses within a plate hundreds of kilometers away from the major plate boundaries, creating large-scale distributed de- formation zones. One of the largest diffuse deformation zones lies in the equatorial Indian Ocean, extending from the Chagos-Laccadive Ridge in the west to the Investigator Ridge in the east for more than 3000 km (1–7). Near the Chagos-Laccadive Ridge, the deformation is expressed as a north-south extension, whereas in the Central Indian Ocean Basin (4), west of the Ninety East Ridge, the deformation takes place along east-west–trending thrust faults related to the north-south compres- sion, resulting from the continental collision of India with Eurasia (8, 9). To the east of the Ninety East Ridge in the Wharton Basin, the deformation is suggested to take place along the north-south– trending reactivated fracture zones with left-lateral strike-slip motion (10, 11). This is due to both variable obliquity and rate of the sub- duction of the Indo-Australian composite plate beneath the Sunda plate in the Andaman-Sumatra region, creating a very large scale dif- fuse deformation zone in the Wharton Basin with poorly defined di- rection of maximum stress (6, 7, 12, 13). The Indo-Australian composite plate comprises the Indian, Capricorn, Australian, and Macquarie component of plates and multiple diffuse plate boundaries (2–5, 7). The presence of active deformation in the Wharton Basin was confirmed by the occurrence of a series of strike-slip earthquakes in 2012 starting on 10 January 2012 with a moment magnitude (M w ) 7.2 earthquake, followed by the 11 April 2012 twin events of M w 8.6 and M w 8.2 (14–20) (Fig. 1), the largest intraplate earthquakes ever observed on Earth. More recently, an M w 7.8 strike-slip earthquake occurred on 2 March 2016 (21) further south (~5°S). Although the foreshock of January 10 and the great aftershock of April 11 seem to have ruptured reactivated fracture zones (F6/F7) (22, 23), the seismological and geodetic inversions for the largest event of M w 8.6 require a complex faulting pattern with several faults, up to six, oblique to each other (14–18), requiring the existence of a new set of faults (Fig. 1 and fig. S1). However, the existing seismic and bathymetric data from the region have not shown the presence of any such faults ( 22–26). The lithosphere in this part of the Indian Ocean was created at the Wharton Spreading Centre. Seafloor spreading in the Indian Ocean initiated around 133 Ma, as India separated from Australia, with a spreading rate reaching 40 mm/year at 80 My and increasing to 150 mm/year at 67 My as India started to move rapidly north- ward (27, 28). As India started indenting Eurasia around 50 Ma, it slowed down to 50 mm/year at 45 My, and spreading ceased at 40 My when India and Australia became a single plate. The spreading ridge fabric (abyssal hill normal faults) is generally east-west, whereas the fracture zones are close to north-south. Present-day left-lateral motion along these reactivated fracture zones in the Wharton Basin is con- sistent with the increasing obliquity and decreasing convergence rate of the Indo-Australian plate from Java (orthogonal at 60 mm/year) in the east to Sumatra (54 mm/year) in the west, and nearly arc-parallel near the Andaman Islands (43 mm/year) (29, 30), leading to the re- activation of fracture zones capable of hosting great earthquakes. RESULTS In May 2015, high-resolution bathymetry and seismic reflection data were acquired on board the Schmidt Ocean Institute (SOI) 1 Equipe de Géosciences Marines, Institut de Physique du Globe de Paris (CNRS, Paris Diderot, Sorbonne Paris Cité), 1 rue Jussieu, 75238 Paris Cedex 05, France. 2 Earth Ob- servatory of Singapore, Nanyang Technological University, N2-01A-XX, 50 Nanyang Avenue, Singapore 639798, Singapore. 3 Research Center for Geotechnology, Indone- sian Institute of Sciences, Komplek LIPI Jl., Sangkuriang Bandung 40135, Indonesia. 4 Research Center for Oceanography, Indonesian Institute of Sciences, Jl Pasir Putih 1 Ancol Timur, Jakarta Utara 14430, Indonesia. 5 Technology Center for Marine Survey, Agency for the Assessment and Application of Technology, BPPT Gedung 1 Lantai 18 Jl. MH Thamrin No. 8, Jakarta Pusat 10340, Indonesia. 6 Research Institute for Coastal Resources and Vulnerability, Ministry of Marine and Fisheries, Jl. Padang-Painan km. 16, Bungus, Padang 25245, Indonesia. *Corresponding author. Email: [email protected] †Adjunct Research Scientist at the Lamont-Doherty Earth Observatory, Columbia Uni- versity, Palisades, NY 10964, USA. SCIENCE ADVANCES | RESEARCH ARTICLE Singh et al. Sci. Adv. 2017; 3 : e1601689 4 January 2017 1 of 8 on April 2, 2020 http://advances.sciencemag.org/ Downloaded from
Transcript of The discovery of a conjugate system of ... - Science Advances · Avenue, Singapore 639798,...
SC I ENCE ADVANCES | R E S EARCH ART I C L E
EARTH SC I ENCES
1Equipe de Géosciences Marines, Institut de Physique du Globe de Paris (CNRS, ParisDiderot, Sorbonne Paris Cité), 1 rue Jussieu, 75238 Paris Cedex 05, France. 2Earth Ob-servatory of Singapore, Nanyang Technological University, N2-01A-XX, 50 NanyangAvenue, Singapore 639798, Singapore. 3Research Center for Geotechnology, Indone-sian Institute of Sciences, Komplek LIPI Jl., Sangkuriang Bandung 40135, Indonesia.4Research Center for Oceanography, Indonesian Institute of Sciences, Jl Pasir Putih1 Ancol Timur, Jakarta Utara 14430, Indonesia. 5Technology Center for Marine Survey,Agency for the Assessment and Application of Technology, BPPT Gedung 1 Lantai 18Jl. MH Thamrin No. 8, Jakarta Pusat 10340, Indonesia. 6Research Institute for CoastalResources and Vulnerability, Ministry of Marine and Fisheries, Jl. Padang-Painan km.16, Bungus, Padang 25245, Indonesia.*Corresponding author. Email: [email protected]†Adjunct Research Scientist at the Lamont-Doherty Earth Observatory, Columbia Uni-versity, Palisades, NY 10964, USA.
Singh et al. Sci. Adv. 2017;3 : e1601689 4 January 2017
2017 © The Authors,
some rights reserved;
exclusive licensee
American Association
for the Advancement
of Science. Distributed
under a Creative
Commons Attribution
NonCommercial
License 4.0 (CC BY-NC).
Do
The discovery of a conjugate system of faults in theWharton Basin intraplate deformation zoneSatish C. Singh,1,2* Nugroho Hananto,3 Yanfang Qin,1 Frederique Leclerc,2 Praditya Avianto,4
Paul E. Tapponnier,2 Helene Carton,1† Shengji Wei,2 Adam B. Nugroho,5 Wishnu A. Gemilang,6
Kerry Sieh,2 Sylvain Barbot2
The deformation at well-defined, narrow plate boundaries depends on the relative plate motion, but how thedeformation takes place within a distributed plate boundary zone remains a conundrum. This was confirmed bythe seismological analyses of the 2012 great Wharton Basin earthquakes [moment magnitude (Mw) 8.6], whichsuggested the rupture of several faults at high angles to one another. Using high-resolution bathymetry andseismic reflection data, we report the discovery of new N294°E-striking shear zones, oblique to the plate fabric.These shear zones are expressed by sets of normal faults striking at N335°E, defining the direction of the prin-cipal compressional stress in the region. Also, we have imaged left-lateral strike-slip faults along reactivated N7°E-oriented oceanic fracture zones. The shear zones and the reactivated fracture zones form a conjugate system offaults, which accommodate present-day intraplate deformation in the Wharton Basin.
wn
on April 2, 2020
http://advances.sciencemag.org/
loaded from
INTRODUCTIONPlate boundaries are the key elements of plate tectonics. There arethree types of plate boundaries: convergent, divergent, and transformor strike-slip boundaries. The deformation along these plate bound-aries is controlled by the motion between the plates, evidenced bythe occurrence of different types of earthquakes. For example, normalfaulting earthquakes are generally produced at divergent plate bound-aries, whereas dominantly thrust earthquakes occur at convergentboundaries. Therefore, the nature of deformation along plate bound-aries is well understood, and the direction of maximum stress is moreor less well defined. However, the deformation on plate boundariessometimes induces stresses within a plate hundreds of kilometers awayfrom the major plate boundaries, creating large-scale distributed de-formation zones. One of the largest diffuse deformation zones lies inthe equatorial Indian Ocean, extending from the Chagos-Laccadive Ridgein the west to the Investigator Ridge in the east for more than 3000 km(1–7). Near the Chagos-Laccadive Ridge, the deformation is expressedas a north-south extension, whereas in the Central Indian Ocean Basin(4), west of the Ninety East Ridge, the deformation takes place alongeast-west–trending thrust faults related to the north-south compres-sion, resulting from the continental collision of India with Eurasia(8, 9). To the east of the Ninety East Ridge in the Wharton Basin,the deformation is suggested to take place along the north-south–trending reactivated fracture zones with left-lateral strike-slip motion(10, 11). This is due to both variable obliquity and rate of the sub-duction of the Indo-Australian composite plate beneath the Sundaplate in the Andaman-Sumatra region, creating a very large scale dif-
fuse deformation zone in the Wharton Basin with poorly defined di-rection of maximum stress (6, 7, 12, 13). The Indo-Australian compositeplate comprises the Indian, Capricorn, Australian, and Macquariecomponent of plates and multiple diffuse plate boundaries (2–5, 7).
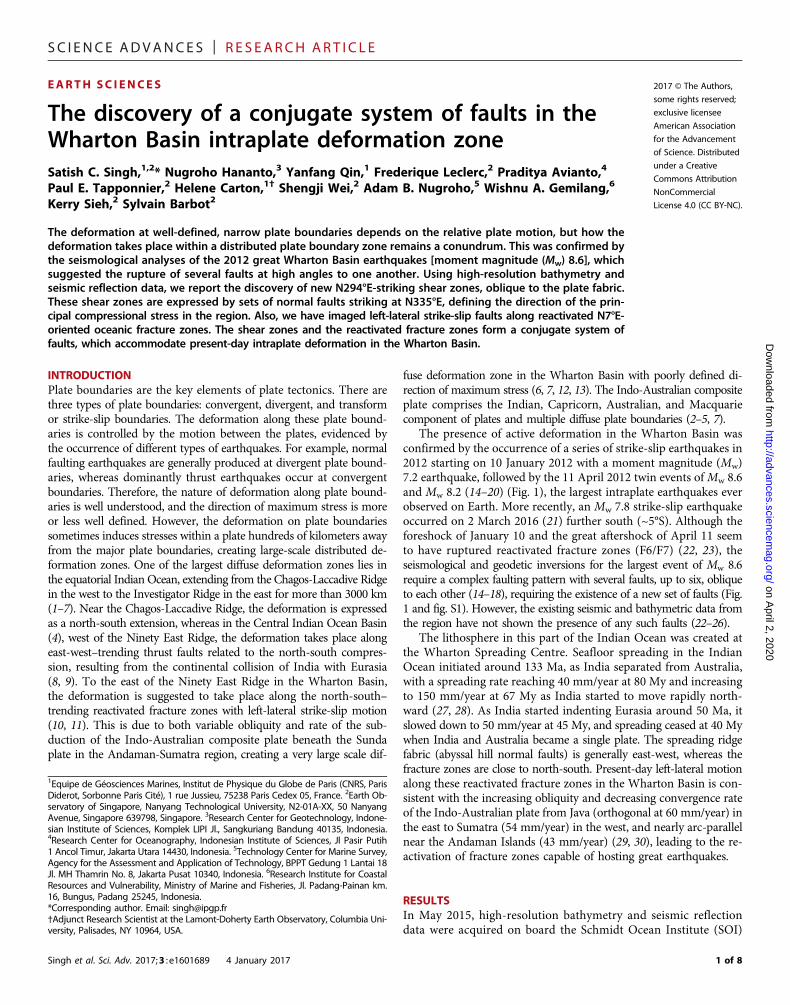
The presence of active deformation in the Wharton Basin wasconfirmed by the occurrence of a series of strike-slip earthquakes in2012 starting on 10 January 2012 with a moment magnitude (Mw)7.2 earthquake, followed by the 11 April 2012 twin events ofMw 8.6and Mw 8.2 (14–20) (Fig. 1), the largest intraplate earthquakes everobserved on Earth. More recently, an Mw 7.8 strike-slip earthquakeoccurred on 2 March 2016 (21) further south (~5°S). Although theforeshock of January 10 and the great aftershock of April 11 seemto have ruptured reactivated fracture zones (F6/F7) (22, 23), theseismological and geodetic inversions for the largest event of Mw 8.6require a complex faulting pattern with several faults, up to six, obliqueto each other (14–18), requiring the existence of a new set of faults (Fig.1 and fig. S1). However, the existing seismic and bathymetric data fromthe region have not shown the presence of any such faults (22–26).
The lithosphere in this part of the Indian Ocean was created atthe Wharton Spreading Centre. Seafloor spreading in the IndianOcean initiated around 133 Ma, as India separated from Australia,with a spreading rate reaching 40 mm/year at 80 My and increasingto 150 mm/year at 67 My as India started to move rapidly north-ward (27, 28). As India started indenting Eurasia around 50 Ma, itslowed down to 50 mm/year at 45 My, and spreading ceased at 40 Mywhen India and Australia became a single plate. The spreading ridgefabric (abyssal hill normal faults) is generally east-west, whereas thefracture zones are close to north-south. Present-day left-lateral motionalong these reactivated fracture zones in the Wharton Basin is con-sistent with the increasing obliquity and decreasing convergence rateof the Indo-Australian plate from Java (orthogonal at 60 mm/year) inthe east to Sumatra (54 mm/year) in the west, and nearly arc-parallelnear the Andaman Islands (43 mm/year) (29, 30), leading to the re-activation of fracture zones capable of hosting great earthquakes.
RESULTSIn May 2015, high-resolution bathymetry and seismic reflectiondata were acquired on board the Schmidt Ocean Institute (SOI)
1 of 8
SC I ENCE ADVANCES | R E S EARCH ART I C L E
on April 2, 2020
http://advances.sciencemag.org/
Dow
nloaded from
research vessel (R/V) Falkor in the epicentral region of the 2012 Mw
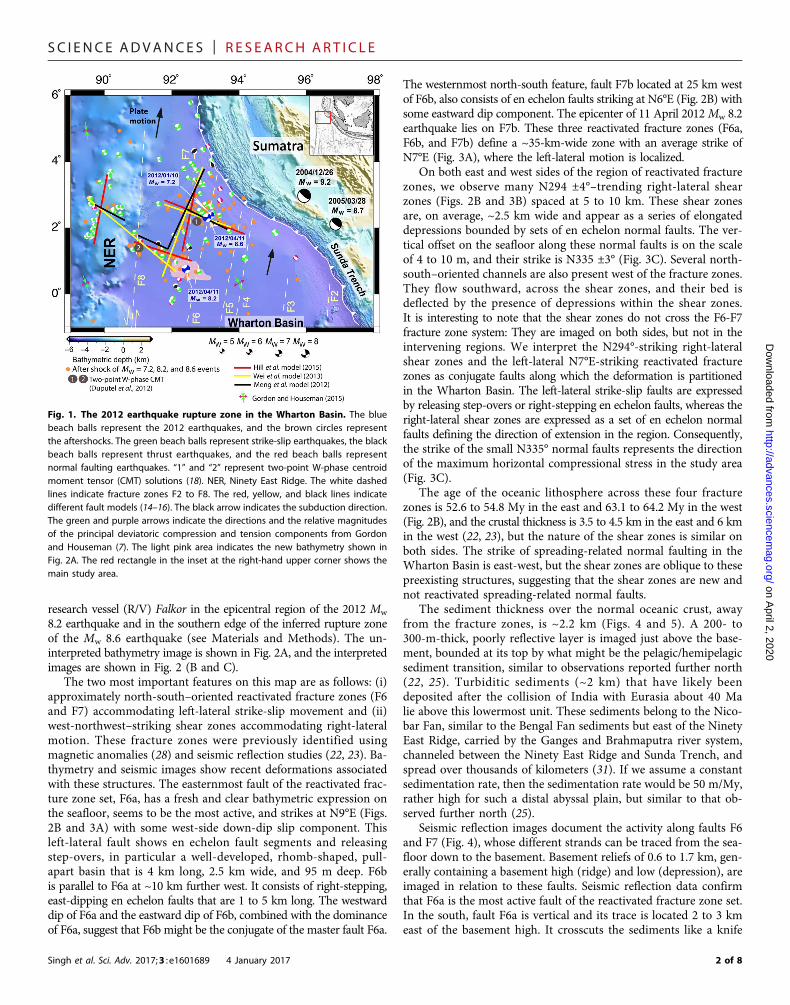
8.2 earthquake and in the southern edge of the inferred rupture zoneof the Mw 8.6 earthquake (see Materials and Methods). The un-interpreted bathymetry image is shown in Fig. 2A, and the interpretedimages are shown in Fig. 2 (B and C).
The two most important features on this map are as follows: (i)approximately north-south–oriented reactivated fracture zones (F6and F7) accommodating left-lateral strike-slip movement and (ii)west-northwest–striking shear zones accommodating right-lateralmotion. These fracture zones were previously identified usingmagnetic anomalies (28) and seismic reflection studies (22, 23). Ba-thymetry and seismic images show recent deformations associatedwith these structures. The easternmost fault of the reactivated frac-ture zone set, F6a, has a fresh and clear bathymetric expression onthe seafloor, seems to be the most active, and strikes at N9°E (Figs.2B and 3A) with some west-side down-dip slip component. Thisleft-lateral fault shows en echelon fault segments and releasingstep-overs, in particular a well-developed, rhomb-shaped, pull-apart basin that is 4 km long, 2.5 km wide, and 95 m deep. F6bis parallel to F6a at ~10 km further west. It consists of right-stepping,east-dipping en echelon faults that are 1 to 5 km long. The westwarddip of F6a and the eastward dip of F6b, combined with the dominanceof F6a, suggest that F6b might be the conjugate of the master fault F6a.
Singh et al. Sci. Adv. 2017;3 : e1601689 4 January 2017
The westernmost north-south feature, fault F7b located at 25 km westof F6b, also consists of en echelon faults striking at N6°E (Fig. 2B) withsome eastward dip component. The epicenter of 11 April 2012Mw 8.2earthquake lies on F7b. These three reactivated fracture zones (F6a,F6b, and F7b) define a ~35-km-wide zone with an average strike ofN7°E (Fig. 3A), where the left-lateral motion is localized.
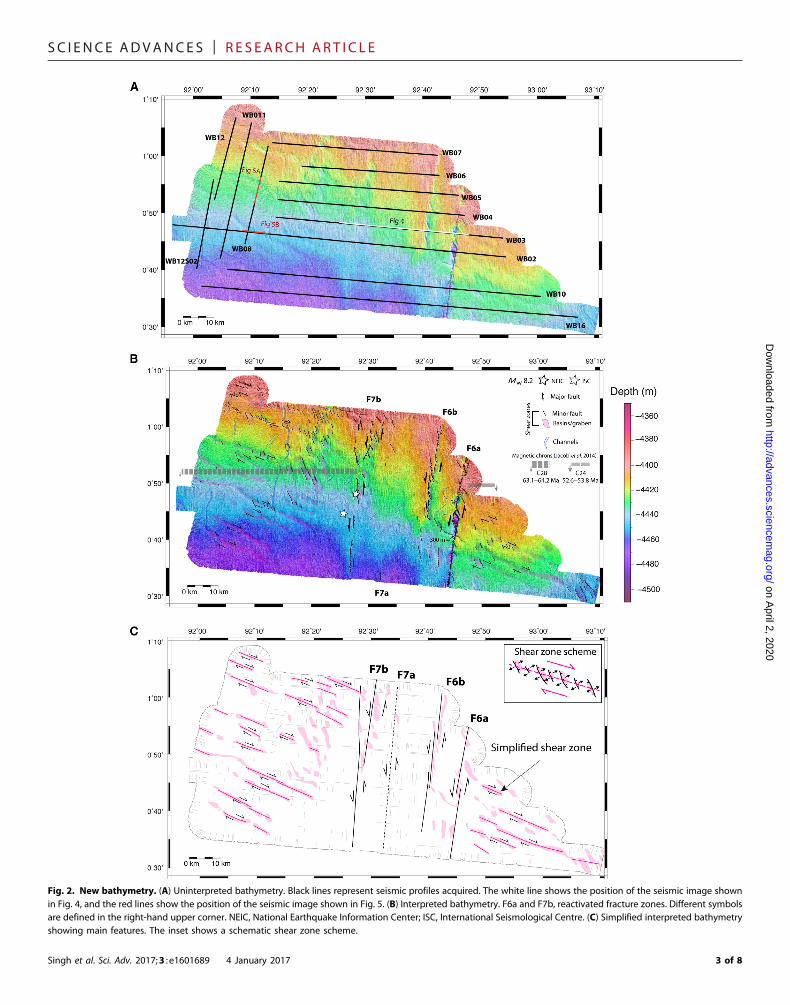
On both east and west sides of the region of reactivated fracturezones, we observe many N294 ±4°–trending right-lateral shearzones (Figs. 2B and 3B) spaced at 5 to 10 km. These shear zonesare, on average, ~2.5 km wide and appear as a series of elongateddepressions bounded by sets of en echelon normal faults. The ver-tical offset on the seafloor along these normal faults is on the scaleof 4 to 10 m, and their strike is N335 ±3° (Fig. 3C). Several north-south–oriented channels are also present west of the fracture zones.They flow southward, across the shear zones, and their bed isdeflected by the presence of depressions within the shear zones.It is interesting to note that the shear zones do not cross the F6-F7fracture zone system: They are imaged on both sides, but not in theintervening regions. We interpret the N294°-striking right-lateralshear zones and the left-lateral N7°E-striking reactivated fracturezones as conjugate faults along which the deformation is partitionedin the Wharton Basin. The left-lateral strike-slip faults are expressedby releasing step-overs or right-stepping en echelon faults, whereas theright-lateral shear zones are expressed as a set of en echelon normalfaults defining the direction of extension in the region. Consequently,the strike of the small N335° normal faults represents the directionof the maximum horizontal compressional stress in the study area(Fig. 3C).
The age of the oceanic lithosphere across these four fracturezones is 52.6 to 54.8 My in the east and 63.1 to 64.2 My in the west(Fig. 2B), and the crustal thickness is 3.5 to 4.5 km in the east and 6 kmin the west (22, 23), but the nature of the shear zones is similar onboth sides. The strike of spreading-related normal faulting in theWharton Basin is east-west, but the shear zones are oblique to thesepreexisting structures, suggesting that the shear zones are new andnot reactivated spreading-related normal faults.
The sediment thickness over the normal oceanic crust, awayfrom the fracture zones, is ~2.2 km (Figs. 4 and 5). A 200- to300-m-thick, poorly reflective layer is imaged just above the base-ment, bounded at its top by what might be the pelagic/hemipelagicsediment transition, similar to observations reported further north(22, 25). Turbiditic sediments (~2 km) that have likely beendeposited after the collision of India with Eurasia about 40 Malie above this lowermost unit. These sediments belong to the Nico-bar Fan, similar to the Bengal Fan sediments but east of the NinetyEast Ridge, carried by the Ganges and Brahmaputra river system,channeled between the Ninety East Ridge and Sunda Trench, andspread over thousands of kilometers (31). If we assume a constantsedimentation rate, then the sedimentation rate would be 50 m/My,rather high for such a distal abyssal plain, but similar to that ob-served further north (25).
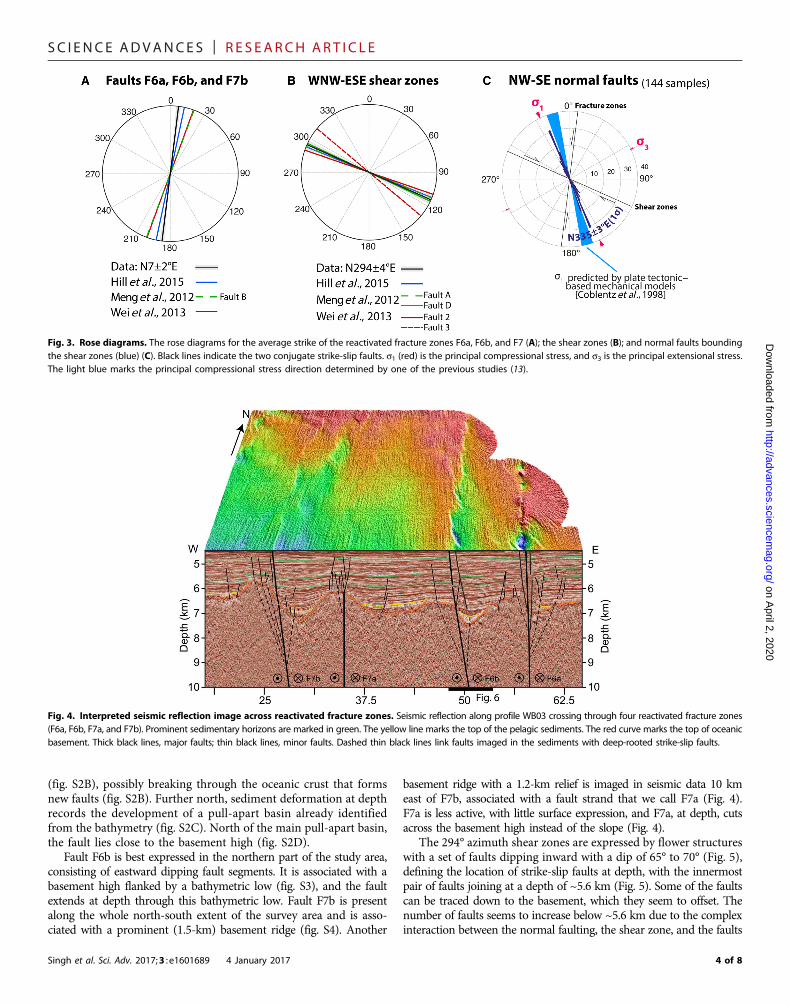
Seismic reflection images document the activity along faults F6and F7 (Fig. 4), whose different strands can be traced from the sea-floor down to the basement. Basement reliefs of 0.6 to 1.7 km, gen-erally containing a basement high (ridge) and low (depression), areimaged in relation to these faults. Seismic reflection data confirmthat F6a is the most active fault of the reactivated fracture zone set.In the south, fault F6a is vertical and its trace is located 2 to 3 kmeast of the basement high. It crosscuts the sediments like a knife
Fig. 1. The 2012 earthquake rupture zone in the Wharton Basin. The bluebeach balls represent the 2012 earthquakes, and the brown circles representthe aftershocks. The green beach balls represent strike-slip earthquakes, the blackbeach balls represent thrust earthquakes, and the red beach balls representnormal faulting earthquakes. “1” and “2” represent two-point W-phase centroidmoment tensor (CMT) solutions (18). NER, Ninety East Ridge. The white dashedlines indicate fracture zones F2 to F8. The red, yellow, and black lines indicatedifferent fault models (14–16). The black arrow indicates the subduction direction.The green and purple arrows indicate the directions and the relative magnitudesof the principal deviatoric compression and tension components from Gordonand Houseman (7). The light pink area indicates the new bathymetry shown inFig. 2A. The red rectangle in the inset at the right-hand upper corner shows themain study area.
2 of 8
SC I ENCE ADVANCES | R E S EARCH ART I C L E
on April 2, 2020
http://advances.sciencemag.org/
Dow
nloaded from
Fig. 2. New bathymetry. (A) Uninterpreted bathymetry. Black lines represent seismic profiles acquired. The white line shows the position of the seismic image shownin Fig. 4, and the red lines show the position of the seismic image shown in Fig. 5. (B) Interpreted bathymetry. F6a and F7b, reactivated fracture zones. Different symbolsare defined in the right-hand upper corner. NEIC, National Earthquake Information Center; ISC, International Seismological Centre. (C) Simplified interpreted bathymetryshowing main features. The inset shows a schematic shear zone scheme.
Singh et al. Sci. Adv. 2017;3 : e1601689 4 January 2017 3 of 8
SC I ENCE ADVANCES | R E S EARCH ART I C L E
on April 2, 2020
http://advances.sciencemag.org/
Dow
nloaded from
(fig. S2B), possibly breaking through the oceanic crust that formsnew faults (fig. S2B). Further north, sediment deformation at depthrecords the development of a pull-apart basin already identifiedfrom the bathymetry (fig. S2C). North of the main pull-apart basin,the fault lies close to the basement high (fig. S2D).
Fault F6b is best expressed in the northern part of the study area,consisting of eastward dipping fault segments. It is associated with abasement high flanked by a bathymetric low (fig. S3), and the faultextends at depth through this bathymetric low. Fault F7b is presentalong the whole north-south extent of the survey area and is asso-ciated with a prominent (1.5-km) basement ridge (fig. S4). Another
Singh et al. Sci. Adv. 2017;3 : e1601689 4 January 2017
basement ridge with a 1.2-km relief is imaged in seismic data 10 kmeast of F7b, associated with a fault strand that we call F7a (Fig. 4).F7a is less active, with little surface expression, and F7a, at depth, cutsacross the basement high instead of the slope (Fig. 4).
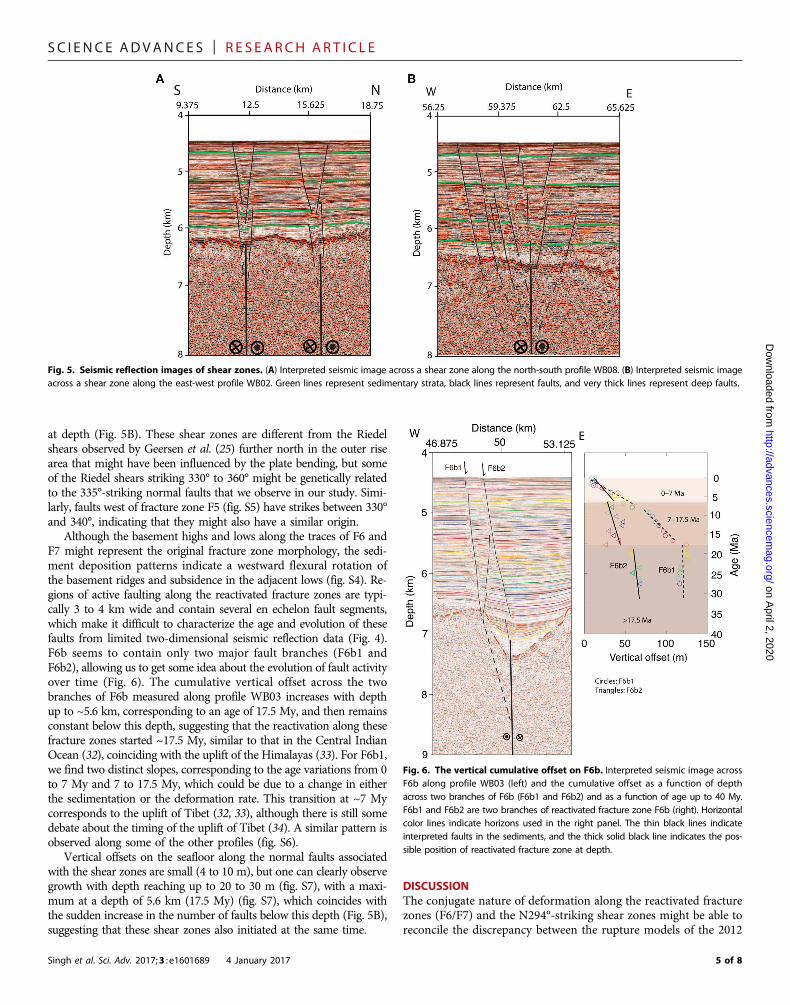
The 294° azimuth shear zones are expressed by flower structureswith a set of faults dipping inward with a dip of 65° to 70° (Fig. 5),defining the location of strike-slip faults at depth, with the innermostpair of faults joining at a depth of ~5.6 km (Fig. 5). Some of the faultscan be traced down to the basement, which they seem to offset. Thenumber of faults seems to increase below ~5.6 km due to the complexinteraction between the normal faulting, the shear zone, and the faults
Fig. 3. Rose diagrams. The rose diagrams for the average strike of the reactivated fracture zones F6a, F6b, and F7 (A); the shear zones (B); and normal faults boundingthe shear zones (blue) (C). Black lines indicate the two conjugate strike-slip faults. s1 (red) is the principal compressional stress, and s3 is the principal extensional stress.The light blue marks the principal compressional stress direction determined by one of the previous studies (13).
Fig. 4. Interpreted seismic reflection image across reactivated fracture zones. Seismic reflection along profile WB03 crossing through four reactivated fracture zones(F6a, F6b, F7a, and F7b). Prominent sedimentary horizons are marked in green. The yellow line marks the top of the pelagic sediments. The red curve marks the top of oceanicbasement. Thick black lines, major faults; thin black lines, minor faults. Dashed thin black lines link faults imaged in the sediments with deep-rooted strike-slip faults.
4 of 8
SC I ENCE ADVANCES | R E S EARCH ART I C L E
on April 2, 2020
http://advances.sciencemag.org/
Dow
nloaded from
at depth (Fig. 5B). These shear zones are different from the Riedelshears observed by Geersen et al. (25) further north in the outer risearea that might have been influenced by the plate bending, but someof the Riedel shears striking 330° to 360° might be genetically relatedto the 335°-striking normal faults that we observe in our study. Simi-larly, faults west of fracture zone F5 (fig. S5) have strikes between 330°and 340°, indicating that they might also have a similar origin.
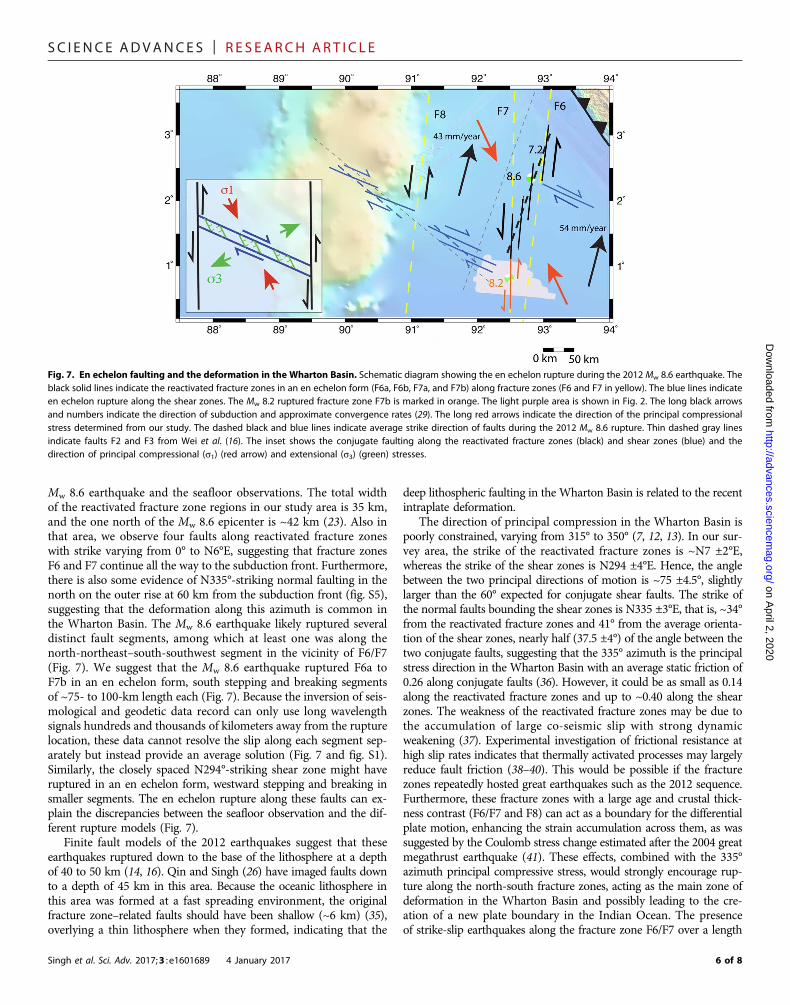
Although the basement highs and lows along the traces of F6 andF7 might represent the original fracture zone morphology, the sedi-ment deposition patterns indicate a westward flexural rotation ofthe basement ridges and subsidence in the adjacent lows (fig. S4). Re-gions of active faulting along the reactivated fracture zones are typi-cally 3 to 4 km wide and contain several en echelon fault segments,which make it difficult to characterize the age and evolution of thesefaults from limited two-dimensional seismic reflection data (Fig. 4).F6b seems to contain only two major fault branches (F6b1 andF6b2), allowing us to get some idea about the evolution of fault activityover time (Fig. 6). The cumulative vertical offset across the twobranches of F6b measured along profile WB03 increases with depthup to ~5.6 km, corresponding to an age of 17.5 My, and then remainsconstant below this depth, suggesting that the reactivation along thesefracture zones started ~17.5 My, similar to that in the Central IndianOcean (32), coinciding with the uplift of the Himalayas (33). For F6b1,we find two distinct slopes, corresponding to the age variations from 0to 7 My and 7 to 17.5 My, which could be due to a change in eitherthe sedimentation or the deformation rate. This transition at ~7 Mycorresponds to the uplift of Tibet (32, 33), although there is still somedebate about the timing of the uplift of Tibet (34). A similar pattern isobserved along some of the other profiles (fig. S6).
Vertical offsets on the seafloor along the normal faults associatedwith the shear zones are small (4 to 10 m), but one can clearly observegrowth with depth reaching up to 20 to 30 m (fig. S7), with a maxi-mum at a depth of 5.6 km (17.5 My) (fig. S7), which coincides withthe sudden increase in the number of faults below this depth (Fig. 5B),suggesting that these shear zones also initiated at the same time.
Singh et al. Sci. Adv. 2017;3 : e1601689 4 January 2017
DISCUSSIONThe conjugate nature of deformation along the reactivated fracturezones (F6/F7) and the N294°-striking shear zones might be able toreconcile the discrepancy between the rupture models of the 2012
Fig. 5. Seismic reflection images of shear zones. (A) Interpreted seismic image across a shear zone along the north-south profile WB08. (B) Interpreted seismic imageacross a shear zone along the east-west profile WB02. Green lines represent sedimentary strata, black lines represent faults, and very thick lines represent deep faults.
Fig. 6. The vertical cumulative offset on F6b. Interpreted seismic image acrossF6b along profile WB03 (left) and the cumulative offset as a function of depthacross two branches of F6b (F6b1 and F6b2) and as a function of age up to 40 My.F6b1 and F6b2 are two branches of reactivated fracture zone F6b (right). Horizontalcolor lines indicate horizons used in the right panel. The thin black lines indicateinterpreted faults in the sediments, and the thick solid black line indicates the pos-sible position of reactivated fracture zone at depth.
5 of 8
SC I ENCE ADVANCES | R E S EARCH ART I C L E
on April 2, 2020
http://advances.sciencemag.org/
Dow
nloaded from
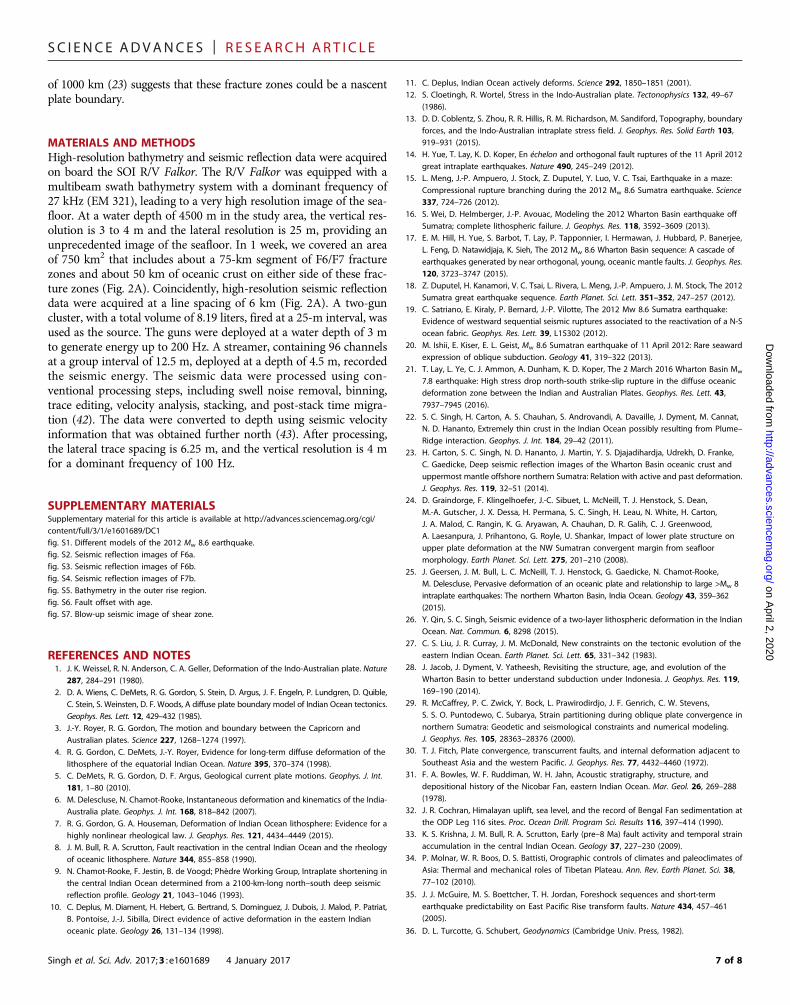
Mw 8.6 earthquake and the seafloor observations. The total widthof the reactivated fracture zone regions in our study area is 35 km,and the one north of the Mw 8.6 epicenter is ~42 km (23). Also inthat area, we observe four faults along reactivated fracture zoneswith strike varying from 0° to N6°E, suggesting that fracture zonesF6 and F7 continue all the way to the subduction front. Furthermore,there is also some evidence of N335°-striking normal faulting in thenorth on the outer rise at 60 km from the subduction front (fig. S5),suggesting that the deformation along this azimuth is common inthe Wharton Basin. The Mw 8.6 earthquake likely ruptured severaldistinct fault segments, among which at least one was along thenorth-northeast–south-southwest segment in the vicinity of F6/F7(Fig. 7). We suggest that the Mw 8.6 earthquake ruptured F6a toF7b in an en echelon form, south stepping and breaking segmentsof ~75- to 100-km length each (Fig. 7). Because the inversion of seis-mological and geodetic data record can only use long wavelengthsignals hundreds and thousands of kilometers away from the rupturelocation, these data cannot resolve the slip along each segment sep-arately but instead provide an average solution (Fig. 7 and fig. S1).Similarly, the closely spaced N294°-striking shear zone might haveruptured in an en echelon form, westward stepping and breaking insmaller segments. The en echelon rupture along these faults can ex-plain the discrepancies between the seafloor observation and the dif-ferent rupture models (Fig. 7).
Finite fault models of the 2012 earthquakes suggest that theseearthquakes ruptured down to the base of the lithosphere at a depthof 40 to 50 km (14, 16). Qin and Singh (26) have imaged faults downto a depth of 45 km in this area. Because the oceanic lithosphere inthis area was formed at a fast spreading environment, the originalfracture zone–related faults should have been shallow (~6 km) (35),overlying a thin lithosphere when they formed, indicating that the
Singh et al. Sci. Adv. 2017;3 : e1601689 4 January 2017
deep lithospheric faulting in the Wharton Basin is related to the recentintraplate deformation.
The direction of principal compression in the Wharton Basin ispoorly constrained, varying from 315° to 350° (7, 12, 13). In our sur-vey area, the strike of the reactivated fracture zones is ~N7 ±2°E,whereas the strike of the shear zones is N294 ±4°E. Hence, the anglebetween the two principal directions of motion is ~75 ±4.5°, slightlylarger than the 60° expected for conjugate shear faults. The strike ofthe normal faults bounding the shear zones is N335 ±3°E, that is, ~34°from the reactivated fracture zones and 41° from the average orienta-tion of the shear zones, nearly half (37.5 ±4°) of the angle between thetwo conjugate faults, suggesting that the 335° azimuth is the principalstress direction in the Wharton Basin with an average static friction of0.26 along conjugate faults (36). However, it could be as small as 0.14along the reactivated fracture zones and up to ~0.40 along the shearzones. The weakness of the reactivated fracture zones may be due tothe accumulation of large co-seismic slip with strong dynamicweakening (37). Experimental investigation of frictional resistance athigh slip rates indicates that thermally activated processes may largelyreduce fault friction (38–40). This would be possible if the fracturezones repeatedly hosted great earthquakes such as the 2012 sequence.Furthermore, these fracture zones with a large age and crustal thick-ness contrast (F6/F7 and F8) can act as a boundary for the differentialplate motion, enhancing the strain accumulation across them, as wassuggested by the Coulomb stress change estimated after the 2004 greatmegathrust earthquake (41). These effects, combined with the 335°azimuth principal compressive stress, would strongly encourage rup-ture along the north-south fracture zones, acting as the main zone ofdeformation in the Wharton Basin and possibly leading to the cre-ation of a new plate boundary in the Indian Ocean. The presenceof strike-slip earthquakes along the fracture zone F6/F7 over a length
Fig. 7. En echelon faulting and the deformation in the Wharton Basin. Schematic diagram showing the en echelon rupture during the 2012 Mw 8.6 earthquake. Theblack solid lines indicate the reactivated fracture zones in an en echelon form (F6a, F6b, F7a, and F7b) along fracture zones (F6 and F7 in yellow). The blue lines indicateen echelon rupture along the shear zones. The Mw 8.2 ruptured fracture zone F7b is marked in orange. The light purple area is shown in Fig. 2. The long black arrowsand numbers indicate the direction of subduction and approximate convergence rates (29). The long red arrows indicate the direction of the principal compressionalstress determined from our study. The dashed black and blue lines indicate average strike direction of faults during the 2012 Mw 8.6 rupture. Thin dashed gray linesindicate faults F2 and F3 from Wei et al. (16). The inset shows the conjugate faulting along the reactivated fracture zones (black) and shear zones (blue) and thedirection of principal compressional (s1) (red arrow) and extensional (s3) (green) stresses.
6 of 8
SC I ENCE ADVANCES | R E S EARCH ART I C L E
of 1000 km (23) suggests that these fracture zones could be a nascentplate boundary.
http://advaD
ownloaded from
MATERIALS AND METHODSHigh-resolution bathymetry and seismic reflection data were acquiredon board the SOI R/V Falkor. The R/V Falkor was equipped with amultibeam swath bathymetry system with a dominant frequency of27 kHz (EM 321), leading to a very high resolution image of the sea-floor. At a water depth of 4500 m in the study area, the vertical res-olution is 3 to 4 m and the lateral resolution is 25 m, providing anunprecedented image of the seafloor. In 1 week, we covered an areaof 750 km2 that includes about a 75-km segment of F6/F7 fracturezones and about 50 km of oceanic crust on either side of these frac-ture zones (Fig. 2A). Coincidently, high-resolution seismic reflectiondata were acquired at a line spacing of 6 km (Fig. 2A). A two-guncluster, with a total volume of 8.19 liters, fired at a 25-m interval, wasused as the source. The guns were deployed at a water depth of 3 mto generate energy up to 200 Hz. A streamer, containing 96 channelsat a group interval of 12.5 m, deployed at a depth of 4.5 m, recordedthe seismic energy. The seismic data were processed using con-ventional processing steps, including swell noise removal, binning,trace editing, velocity analysis, stacking, and post-stack time migra-tion (42). The data were converted to depth using seismic velocityinformation that was obtained further north (43). After processing,the lateral trace spacing is 6.25 m, and the vertical resolution is 4 mfor a dominant frequency of 100 Hz.
on April
nces.sciencemag.org/
SUPPLEMENTARY MATERIALSSupplementary material for this article is available at http://advances.sciencemag.org/cgi/content/full/3/1/e1601689/DC1fig. S1. Different models of the 2012 Mw 8.6 earthquake.fig. S2. Seismic reflection images of F6a.fig. S3. Seismic reflection images of F6b.fig. S4. Seismic reflection images of F7b.fig. S5. Bathymetry in the outer rise region.fig. S6. Fault offset with age.fig. S7. Blow-up seismic image of shear zone.
2, 2020
REFERENCES AND NOTES1. J. K. Weissel, R. N. Anderson, C. A. Geller, Deformation of the Indo-Australian plate. Nature287, 284–291 (1980).2. D. A. Wiens, C. DeMets, R. G. Gordon, S. Stein, D. Argus, J. F. Engeln, P. Lundgren, D. Quible,
C. Stein, S. Weinsten, D. F. Woods, A diffuse plate boundary model of Indian Ocean tectonics.Geophys. Res. Lett. 12, 429–432 (1985).
3. J.-Y. Royer, R. G. Gordon, The motion and boundary between the Capricorn andAustralian plates. Science 227, 1268–1274 (1997).
4. R. G. Gordon, C. DeMets, J.-Y. Royer, Evidence for long-term diffuse deformation of thelithosphere of the equatorial Indian Ocean. Nature 395, 370–374 (1998).
5. C. DeMets, R. G. Gordon, D. F. Argus, Geological current plate motions. Geophys. J. Int.181, 1–80 (2010).
6. M. Delescluse, N. Chamot-Rooke, Instantaneous deformation and kinematics of the India-Australia plate. Geophys. J. Int. 168, 818–842 (2007).
7. R. G. Gordon, G. A. Houseman, Deformation of Indian Ocean lithosphere: Evidence for ahighly nonlinear rheological law. J. Geophys. Res. 121, 4434–4449 (2015).
8. J. M. Bull, R. A. Scrutton, Fault reactivation in the central Indian Ocean and the rheologyof oceanic lithosphere. Nature 344, 855–858 (1990).
9. N. Chamot-Rooke, F. Jestin, B. de Voogd; Phèdre Working Group, Intraplate shortening inthe central Indian Ocean determined from a 2100-km-long north–south deep seismicreflection profile. Geology 21, 1043–1046 (1993).
10. C. Deplus, M. Diament, H. Hebert, G. Bertrand, S. Dominguez, J. Dubois, J. Malod, P. Patriat,B. Pontoise, J.-J. Sibilla, Direct evidence of active deformation in the eastern Indianoceanic plate. Geology 26, 131–134 (1998).
Singh et al. Sci. Adv. 2017;3 : e1601689 4 January 2017
11. C. Deplus, Indian Ocean actively deforms. Science 292, 1850–1851 (2001).12. S. Cloetingh, R. Wortel, Stress in the Indo-Australian plate. Tectonophysics 132, 49–67
(1986).13. D. D. Coblentz, S. Zhou, R. R. Hillis, R. M. Richardson, M. Sandiford, Topography, boundary
forces, and the Indo-Australian intraplate stress field. J. Geophys. Res. Solid Earth 103,919–931 (2015).
14. H. Yue, T. Lay, K. D. Koper, En échelon and orthogonal fault ruptures of the 11 April 2012great intraplate earthquakes. Nature 490, 245–249 (2012).
15. L. Meng, J.-P. Ampuero, J. Stock, Z. Duputel, Y. Luo, V. C. Tsai, Earthquake in a maze:Compressional rupture branching during the 2012 Mw 8.6 Sumatra earthquake. Science337, 724–726 (2012).
16. S. Wei, D. Helmberger, J.-P. Avouac, Modeling the 2012 Wharton Basin earthquake offSumatra; complete lithospheric failure. J. Geophys. Res. 118, 3592–3609 (2013).
17. E. M. Hill, H. Yue, S. Barbot, T. Lay, P. Tapponnier, I. Hermawan, J. Hubbard, P. Banerjee,L. Feng, D. Natawidjaja, K. Sieh, The 2012 Mw 8.6 Wharton Basin sequence: A cascade ofearthquakes generated by near orthogonal, young, oceanic mantle faults. J. Geophys. Res.120, 3723–3747 (2015).
18. Z. Duputel, H. Kanamori, V. C. Tsai, L. Rivera, L. Meng, J.-P. Ampuero, J. M. Stock, The 2012Sumatra great earthquake sequence. Earth Planet. Sci. Lett. 351–352, 247–257 (2012).
19. C. Satriano, E. Kiraly, P. Bernard, J.-P. Vilotte, The 2012 Mw 8.6 Sumatra earthquake:Evidence of westward sequential seismic ruptures associated to the reactivation of a N-Socean fabric. Geophys. Res. Lett. 39, L15302 (2012).
20. M. Ishii, E. Kiser, E. L. Geist, Mw 8.6 Sumatran earthquake of 11 April 2012: Rare seawardexpression of oblique subduction. Geology 41, 319–322 (2013).
21. T. Lay, L. Ye, C. J. Ammon, A. Dunham, K. D. Koper, The 2 March 2016 Wharton Basin Mw
7.8 earthquake: High stress drop north-south strike-slip rupture in the diffuse oceanicdeformation zone between the Indian and Australian Plates. Geophys. Res. Lett. 43,7937–7945 (2016).
22. S. C. Singh, H. Carton, A. S. Chauhan, S. Androvandi, A. Davaille, J. Dyment, M. Cannat,N. D. Hananto, Extremely thin crust in the Indian Ocean possibly resulting from Plume–Ridge interaction. Geophys. J. Int. 184, 29–42 (2011).
23. H. Carton, S. C. Singh, N. D. Hananto, J. Martin, Y. S. Djajadihardja, Udrekh, D. Franke,C. Gaedicke, Deep seismic reflection images of the Wharton Basin oceanic crust anduppermost mantle offshore northern Sumatra: Relation with active and past deformation.J. Geophys. Res. 119, 32–51 (2014).
24. D. Graindorge, F. Klingelhoefer, J.-C. Sibuet, L. McNeill, T. J. Henstock, S. Dean,M.-A. Gutscher, J. X. Dessa, H. Permana, S. C. Singh, H. Leau, N. White, H. Carton,J. A. Malod, C. Rangin, K. G. Aryawan, A. Chauhan, D. R. Galih, C. J. Greenwood,A. Laesanpura, J. Prihantono, G. Royle, U. Shankar, Impact of lower plate structure onupper plate deformation at the NW Sumatran convergent margin from seafloormorphology. Earth Planet. Sci. Lett. 275, 201–210 (2008).
25. J. Geersen, J. M. Bull, L. C. McNeill, T. J. Henstock, G. Gaedicke, N. Chamot-Rooke,M. Delescluse, Pervasive deformation of an oceanic plate and relationship to large >Mw 8intraplate earthquakes: The northern Wharton Basin, India Ocean. Geology 43, 359–362(2015).
26. Y. Qin, S. C. Singh, Seismic evidence of a two-layer lithospheric deformation in the IndianOcean. Nat. Commun. 6, 8298 (2015).
27. C. S. Liu, J. R. Curray, J. M. McDonald, New constraints on the tectonic evolution of theeastern Indian Ocean. Earth Planet. Sci. Lett. 65, 331–342 (1983).
28. J. Jacob, J. Dyment, V. Yatheesh, Revisiting the structure, age, and evolution of theWharton Basin to better understand subduction under Indonesia. J. Geophys. Res. 119,169–190 (2014).
29. R. McCaffrey, P. C. Zwick, Y. Bock, L. Prawirodirdjo, J. F. Genrich, C. W. Stevens,S. S. O. Puntodewo, C. Subarya, Strain partitioning during oblique plate convergence innorthern Sumatra: Geodetic and seismological constraints and numerical modeling.J. Geophys. Res. 105, 28363–28376 (2000).
30. T. J. Fitch, Plate convergence, transcurrent faults, and internal deformation adjacent toSoutheast Asia and the western Pacific. J. Geophys. Res. 77, 4432–4460 (1972).
31. F. A. Bowles, W. F. Ruddiman, W. H. Jahn, Acoustic stratigraphy, structure, anddepositional history of the Nicobar Fan, eastern Indian Ocean. Mar. Geol. 26, 269–288(1978).
32. J. R. Cochran, Himalayan uplift, sea level, and the record of Bengal Fan sedimentation atthe ODP Leg 116 sites. Proc. Ocean Drill. Program Sci. Results 116, 397–414 (1990).
33. K. S. Krishna, J. M. Bull, R. A. Scrutton, Early (pre–8 Ma) fault activity and temporal strainaccumulation in the central Indian Ocean. Geology 37, 227–230 (2009).
34. P. Molnar, W. R. Boos, D. S. Battisti, Orographic controls of climates and paleoclimates ofAsia: Thermal and mechanical roles of Tibetan Plateau. Ann. Rev. Earth Planet. Sci. 38,77–102 (2010).
35. J. J. McGuire, M. S. Boettcher, T. H. Jordan, Foreshock sequences and short-termearthquake predictability on East Pacific Rise transform faults. Nature 434, 457–461(2005).
36. D. L. Turcotte, G. Schubert, Geodynamics (Cambridge Univ. Press, 1982).
7 of 8

SC I ENCE ADVANCES | R E S EARCH ART I C L E
httD
ownloaded from
37. H. Noda, E. M. Dunham, J. R. Rice, Earthquake ruptures with thermal weakeningand the operation of major faults at low overall stress levels. J. Geophys. Res. 114,B07302 (2009).
38. G. Di Toro, T. Hirose, S. Nielsen, G. Pennacchioni, T. Shimamoto, Natural and experimentalevidence of melt lubrication of faults during earthquakes. Science 311, 647–649 (2006).
39. G. Di Toro, D. L. Goldsby, T. E. Tullis, Friction falls towards zero in quartz rock as slipvelocity approaches seismic rates. Nature 427, 436–439 (2004).
40. C. A. J. Wibberley, T. Shimamoto, Earthquake slip weakening and asperities explained bythermal pressurization. Nature 436, 689–692 (2005).
41. M. Delescluse, N. Chamot-Rooke, R. Cattin, L. Fleitout, O. Trubienko, C. Vigny, April 2012intra-oceanic seismicity off Sumatra boosted by the Banda-Aceh megathrust. Nature 490,240–244 (2012).
42. S. C. Singh, H. Carton, P. Tapponnier, N. D. Hananto, A. P. S. Chauhan, D. Hartoyo, M. Bayly,S. Moeljopronoto, T. Bunting, P. Christie, H. Lubis, J. Martin, Seismic evidence for brokenoceanic crust in the 2004 Sumatra earthquake epicentral region. Nat. Geosci. 1, 771–2781(2008).
43. Y. Qin, “Nature of subducting plate and its role on megathrust offshore Sumatra by usingadvanced analysis technique of long streamer data,” thesis, Institut de Physique du Globede Paris, France (2015).
Acknowledgments: The data were acquired on board the SOI R/V Falkor during the MegaTeraexperiment, which is an international project between the Earth Observatory of Singapore,the Indonesian Institute of Sciences, SOI, and Institut de Physique du Globe de Paris. We thank thecaptain and the team of R/V Falkor for their help and support during the experiment.Constructive reviews of R. Burgmann and J. Geersen were extremely useful. G. Housemanprovided the stress data shown in Fig. 1, and the seismologist colleagues provided their faultmodels shown in Fig. 1 and fig. S1. These are Institut de Physique du Globe de Paris publicationnumber 3793 and Earth Observatory of Singapore publication number 136. Funding: S.B. andP.E.T. were supported by the National Research Foundation of Singapore under theNational Research Foundation Fellowship scheme (National Research Fellow Awards
Singh et al. Sci. Adv. 2017;3 : e1601689 4 January 2017
No. NRF-NRFF2013-04) and by the Earth Observatory of Singapore, the National ResearchFoundation, and the Singapore Ministry of Education under the Research Centres ofExcellence initiative. The SOI provided the R/V Falkor for the experiment, and the EOSfunded the renting of the seismic equipment. Author contributions: S.C.S. designed theexperiment, led the data collection, supervised the processing and the project, and wrote thepaper. K.H. was the principal investigator of the project. S.B. contributed in writing of thepaper. N.H. co-led the experiment. Y.Q. processed the seismic reflection data andparticipated in writing the paper. P.A. led the processing of bathymetry data. F.L.participated in the interpretation of bathymetry and seismic reflection data along withP.E.T. and contributed in the writing of the paper; H.C., S.W., A.B.N., and W.A.G.participated in acquiring the data. Competing interests: The authors declarethat they have no competing interests. Data and materials availability: The rawdata are available at http://www.marine-geo.org/tools/new_search/index.php?&output_info_all=on&entry_id=FK150523, entitled “Processed ship-based GSF-FormatBathymetric Sonar Data (EM302) from the Sumatra-Andaman Subduction Zoneacquired during Falkor expedition FK150523 (2015),” Integrated Earth Data Applications(IEDA). doi: dx.doi.org/10.1594/IEDA/322349. Processed data can be obtained uponrequest. All data needed to evaluate the conclusions in the paper are present in thepaper and/or the Supplementary Materials. Additional data related to this paper may berequested from the authors.
Submitted 21 July 2016Accepted 28 November 2016Published 4 January 201710.1126/sciadv.1601689
Citation: S. C. Singh, N. Hananto, Y. Qin, F. Leclerc, P. Avianto, P. E. Tapponnier, H. Carton,S. Wei, A. B. Nugroho, W. A. Gemilang, K. Sieh, S. Barbot, The discovery of a conjugatesystem of faults in the Wharton Basin intraplate deformation zone. Sci. Adv. 3, e1601689(2017).
p://
8 of 8
on April 2, 2020
advances.sciencemag.org/
zoneThe discovery of a conjugate system of faults in the Wharton Basin intraplate deformation
Shengji Wei, Adam B. Nugroho, Wishnu A. Gemilang, Kerry Sieh and Sylvain BarbotSatish C. Singh, Nugroho Hananto, Yanfang Qin, Frederique Leclerc, Praditya Avianto, Paul E. Tapponnier, Helene Carton,
DOI: 10.1126/sciadv.1601689 (1), e1601689.3Sci Adv
ARTICLE TOOLS http://advances.sciencemag.org/content/3/1/e1601689
MATERIALSSUPPLEMENTARY http://advances.sciencemag.org/content/suppl/2016/12/30/3.1.e1601689.DC1
REFERENCES
http://advances.sciencemag.org/content/3/1/e1601689#BIBLThis article cites 41 articles, 8 of which you can access for free
PERMISSIONS http://www.sciencemag.org/help/reprints-and-permissions
Terms of ServiceUse of this article is subject to the
is a registered trademark of AAAS.Science AdvancesYork Avenue NW, Washington, DC 20005. The title (ISSN 2375-2548) is published by the American Association for the Advancement of Science, 1200 NewScience Advances
Copyright © 2017, The Authors
on April 2, 2020
http://advances.sciencemag.org/
Dow
nloaded from


![S. Suresh arXiv:1804.11020v2 [math.OC] 15 May 2018 · S. Suresh School of Computer Engineering, Nanyang Technological University, Singapore 639798 E-mail: ssundaram@ntu.edu.sg arXiv:1804.11020v2](https://static.fdocuments.net/doc/165x107/5f0275da7e708231d4045f49/s-suresh-arxiv180411020v2-mathoc-15-may-2018-s-suresh-school-of-computer.jpg)


![QNDE 2017 Xingfang Cai[1] and Zheng Fan[1], [1]School of Mechanical and Aerospace Engineering, Nanyang Technological University, 50 Nanyang Avenue, Singapore 639798 (213) In-situ acoustic](https://static.fdocuments.net/doc/165x107/5aafa60b7f8b9aa8438d928d/qnde-2017-xingfang-cai1-and-zheng-fan1-1school-of-mechanical-and-aerospace.jpg)