THE CARIBBEAN · Dionísio Pestana Chairman Group Pestana Fernando Pinto CEO TAP Air Portugal...
92
THE CARIBBEAN THE IMPACT OF TRAVEL &TOURISM ON JOBSANDTHE ECONOMY
-
Upload
phungnguyet -
Category
Documents
-
view
218 -
download
0
Transcript of THE CARIBBEAN · Dionísio Pestana Chairman Group Pestana Fernando Pinto CEO TAP Air Portugal...

THE CARIBBEANTHE IMPACT OFTRAVEL &TOURISM
ON JOBSANDTHE ECONOMY

CHAIRMAN:Vincent A WolfingtonChairmanCarey International Inc
VICE CHAIRMEN:Jean-Marc Espalioux Chairman of Management Board &CEOAccor
Jonathan S LinenVice ChairmanAmerican Express Company
EXECUTIVE COMMITTEE:Akbar Al BakerCEOQatar Airways
Peter ArmstrongPresident & CEORocky Mountaineer Railtours
David BabaiChairmanGullivers Travel Associates
Sebastián EscarrerVice ChairmanSol Meliá
Manuel Fernando Espirito SantoChairmanEspirito Santo Tourism
Edouard EttedguiGroup Chief ExecutiveMandarin Oriental Hotel Group
Maurice Flanagan CBEVice Chairman &Group PresidentThe Emirates Group
Michael FrenzelChairmanTUI AG
David House Group PresidentAmerican Express Company
Richard R KelleyChairmanOutrigger Enterprises Inc
Geoffrey J W KentChairman & CEOAbercrombie & Kent
J W Marriott JrChairman & CEOMarriott International Inc
David MichelsChief Executive Hilton Group plcHilton International
David MongeauVice ChairmanCIBC World Markets
Curtis NelsonPresident & COOCarlson Companies
Michael NessPresidentThe Travel Corporation
Richard NorthCEOInterContinental Hotels Group PLC
P R S OberoiChairmanThe Oberoi Group
Henry SilvermanChairman, CEO & PresidentCendant Corporation
Lalit SuriChairman & Managing DirectorBharat Hotels Ltd
Jonathan TischChairman & CEOLoews Hotels
GLOBAL MEMBERS:Giovanni AngeliniCEO & Managing DirectorShangri-La Hotels & Resorts
Gerard J ArpeyPresident & CEOAmerican Airlines
Ted BalestreriChairman & CEOCannery Row Company
Henrik BartlManaging DirectorHead of Specialized PropertyFinancingAareal Bank AG
Jürgen BaumhoffCEOQatar National Hotels Company
Gordon BethuneChairman of the Board & CEOContinental Airlines
Raymond BicksonManaging DirectorThe Taj Group of Hotels
Regis Bulot Chairman of the Board Relais & Chateaux
Marilyn Carlson NelsonChairman & CEOCarlson Companies
Alun CathcartChairmanAvis Europe Plc
U Gary CharlwoodFounder, Chairman & CEOUniglobe Travel (International) Inc
Jennie ChuaChairman & CEORaffles International Hotels & Resorts
David CliftonManaging DirectorEurope & AsiaInterval International
Fernando ConteChairman & CEOIberia,Airlines of Spain
Glen DavidsonSenior VP,Worldwide TravelInsurance & Related ServicesAmerican International Group Inc
Alain DemissyPresident of the ExecutiveCommitteeMondial Assistance Group
Rod EddingtonChief Executive British Airways plc
Rakesh GangwalChairman, President & CEOWorldspan
Laurence S GellerChairman & CEOStrategic Hotel Capital
Naresh GoyalChairman Jet Airways
Maurice H GreenbergChairman & CEOAmerican International Group Inc
Stelios Haji-IoannouChairman & FoundereasyGroup
James HensleyPresidentAllied Europe
James HoganPresident & Chief ExecutiveGulf Air
Stephen P HolmesVice Chairman Cendant Corporation
Raimund HoschPresident & CEOMesse Berlin GmbH
André JordanChairmanLusotur SA
Nuno Trigoso JordãoPresident & CEOSonae Turismo Gestão e Serviços
Sol KerznerChairman & CEOKerzner International Ltd
Nigel KnowlesManaging PartnerDLA
J T KuhlmanCEOOne&Only Resorts
Krishna KumarVice ChairmanThe Taj Group of Hotels
Hans LerchPresident & CEOKuoni Travel Holding Ltd
David LucasPresident & CEOBlue Wave Solutions
Manuel MartinPartnerCyberDodo Productions Ltd
Wolfgang MayrhuberCEOLufthansa German Airlines
Paul McManusPresident & CEOThe Leading Hotels of the World
Alan MulallyExecutive Vice PresidentThe Boeing Company
John M Noel President & CEOThe Noel Group
Tom NutleyChairmanReed Travel Exhibitions
Alan ParkerChief ExecutiveWhitbread PLC
Jean Gabriel PérèsPresident & CEOMövenpick Hotels & Resorts
Dionísio PestanaChairmanGroup Pestana
Fernando PintoCEOTAP Air Portugal
Wolfgang Prock-SchauerChief Executive OfficerJet Airways
David RadcliffeChief ExecutiveHogg Robinson plc
Kurt RitterPresident & CEORezidor SAS Hospitality
Peter RogersPresident & CEODiners Club International
Carl RudermanChairmanUniversal Media
Marty SalfenGeneral Manager, Global Travel & Transportation IndustryIBM
Bruno SchöpferChairman of the BoardMövenpick Hotels & Resorts
David ScowsillCEOOpodo
Robert SelanderPresident & CEOMasterCard International
Per SetterbergCEOGlobal Refund Group
Julian SparkesManaging Partner - Travel ServicesAccenture
Eric J SpeckExecutive Vice President& Chief Marketing OfficerSabre Holdings Corporation
Jean-Cyril SpinettaChairman & CEOAir France
David SteinChairmanThe Stein Group
Barry SternlichtChairman & CEOStarwood Hotels & Resorts
Ron StringfellowCEOTsogo Sun Group
Sultan Ahmed Bin SulayemExecutive ChairmanNakheel
Ian SwainPresidentSwain Tours
Kathleen TaylorPresidentWorldwide Business OperationsFour Seasons Hotels and Resorts
José Antonio TazónPresident & CEOAmadeus Global Travel Distribution
Jeffrey TofflerChairmanCoventry Partners
Mustafa TürkmenCEO & Managing DirectorEnternasyonal Tourism InvestmentsInc
Daniela WagnerManaging Director, InternationalOctopustravel.com
Peter C YesawichChairman & CEOYesawich, Pepperdine Brown & Russell
HONORARY MEMBERS:Lord Marshall of KnightsbridgeChairmanBritish Airways plc
Sir Frank Moore AOChairmanTaylor Byrne Tourism Group
Frank OlsonChairman of the BoardThe Hertz Corporation
Gérard PélissonCo-Chairman, Supervisory BoardAccor SA
Tommaso ZanzottoPresidentTZ Associates Ltd
CHAIRMAN EMERITUS:James D Robinson IIIGeneral PartnerRRE Ventures
IMMEDIATE PAST CHAIRMAN:Sir Ian ProsserRetired ChairmanInterContinental Hotels Group PLCWTTC Chairman (2001-2003)
FORMER CHAIRMEN:Harvey Golub Retired Chairman & CEO American Express CoWTTC Chairman (1996-2001)
Robert H BurnsChairmanRobert H Burns Holdings LimitedWTTC Chairman (1994-1996)
PRESIDENT:Jean-Claude Baumgarten
Correct as at 25 May 2004
©2004 WORLD TRAVEL & TOURISM COUNCIL1-2 QUEEN VICTORIA TERRACE.SOVEREIGN COURT.LONDON E1W 3HA. UNITED KINGDOMTEL: +44 (0) 870 727 9882 or + 44 (0) 207 481 8007 • FAX: +44 (0) 870 728 9882 or + 44 (0) 207 488 1008 • [email protected] • www.wttc.org

WTTC is delighted to have collaborated with the Caribbean Hotel
Association to produce this report, which presents the most
comprehensive analysis of the Tourism Satellite Account for the
Caribbean ever undertaken. It quantifies the impact of Travel & Tourism
on individual economies as well as on the region overall.
Undertaken by WTTC, together with our research partners Oxford
Economic Forecasting, this report quantifies all aspects of Travel &
Tourism demand, from personal consumption to business purchases,
capital investment, government spending and exports. It then translates
this information into economic concepts of production, such as gross
domestic product (GDP) and employment, which can be compared with
other industries and the economy as a whole to provide credible statistical
information that will assist in policy- and business decision-making.
Results demonstrate clearly that the Caribbean is the most tourism-
intensive region in the world. Travel & Tourism currently accounts for
14.8 per cent of total GDP and is expected to increase its share by almost
two percentage points to 16.5 per cent by 2014. Similarly, Travel &
Tourism in the Caribbean today generates 15.5 per cent of total
employment, and this is forecast to rise to 17.1 per cent by 2014. The
industry’s vital role as a generator of wealth and employment across all
parts of the region is indisputable. It also acts as a catalyst for growth in
other areas such as agriculture, construction and manufacturing, which
would decline if demand for Travel & Tourism were reduced.
This significant contribution should not be underestimated, but
neither should the industry’s potential for growth be taken for granted.
As illustrated in the Travel & Tourism Overview and Policy Framework
sections of this report, several important challenges continue to limit
the industry’s full potential for growth in the Caribbean, and these
must be addressed to ensure the long-term sustainable development of
Caribbean Travel & Tourism, with maximum benefits for all
stakeholders. Most importantly, these challenges include building
awareness of the industry’s contribution to the regional, national and
local economies with government officials and the broader general
public so as to help raise the level of support for the industry to that
which it deserves. Also critical is the development of a Caribbean
Tourism Strategic Plan that can be supported and implemented by a
strong public-private sector partnership to focus the vision on the
requirements for long-term growth and job creation.
In a departure from our normal practice of preparing our own
policy recommendations from scratch, this report builds on the
outstanding 2002 Caribbean Tourism Strategic Plan commissioned by
the Commonwealth Fund for Technical Co-operation Programme. We
believe that this document, with modest adjustments and updating,
would serve as a strong foundation for a collective regional vision of
Travel & Tourism in the Caribbean.
WTTC stands ready to support the immediate adoption and
implementation of this Plan, including the adjustments and updates
recommended in this report, as well as to assist in establishing the
Caribbean Tourism Strategy Committee that we have called for to guide
the process.
THE WORLD TRAVEL & TOURISM COUNCIL (WTTC) IS THE BUSINESSLEADERS’ FORUM FOR TRAVEL & TOURISM, WORKING WITHGOVERNMENTS TO RAISE AWARENESS OF THE IMPORTANCE OF THEWORLD’S LARGEST GENERATOR OF WEALTH AND JOBS.
With chief executives of more than 100 of the world’s leading companies in membership,WTTC has a unique mandate and overview on all matters related to success in Travel &Tourism.
The World Travel & Tourism Council would like to express its sincere gratitude to the many individuals and organizations that contributed their knowledge, insight anddata/information to the policy review effort.A complete list of contributors can also be found on the inside back cover.
Jean-Claude Baumgarten
President,World Travel & Tourism Council


EXECUTIVE SUMMARY____________________________________________________________________________ 4
FUTURE PROSPECTS _________________________________________________________________________________________ 7
REALIZING THE POTENTIAL__________________________________________________________________________________ 13
ECONOMIC IMPACT ________________________________________________________________________________________ 16
GROWTH___________________________________________________________________________________________________ 17
THE CARIBBEAN’S TRAVEL & TOURISMAN OVERVIEW OF CURRENT TRENDS AND DEVELOPMENTS__________________________________________________ 19
TRAVEL & TOURISM SATELLITE ACCOUNTTOURISM SATELLITE ACCOUNTING __________________________________________________________________________ 28
TSA CONCEPTS & STRUCTURE_______________________________________________________________________________ 30
TRAVEL & TOURISM’S ECONOMIC IMPACT ___________________________________________________________________ 34
TOTAL DEMAND _____________________________________________________________________________________________ 38
EMPLOYMENT _______________________________________________________________________________________________ 40
GROSS DOMESTIC PRODUCT ________________________________________________________________________________ 42
CAPITAL INVESTMENT ______________________________________________________________________________________ 44
PERSONAL & BUSINESS_______________________________________________________________________________________ 46
EXPORTS ____________________________________________________________________________________________________ 48
GOVERNMENT ______________________________________________________________________________________________ 50
THE POLICY FRAMEWORK ____________________________________________________________________ 53
APPENDIXSATELLITE ACCOUNT TABLES ________________________________________________________________________________ 70
CONTENTS

4
In 2004, the broader Travel & Tourism Economy is
expected to contribute 14.8 per cent of the
Caribbean’s GDP and account for 2.4 million jobs,
representing 15.5 per cent of total employment. Over
the next ten years,Travel & Tourism in the region is
forecast to achieve annualized real growth of 4.1 per
cent, in terms of GDP, and 2.8 per cent in terms of
Travel & Tourism employment. This would take the
share of GDP and employment to 16.5 and 17.1 per
cent respectively by 2014.
These are impressive figures. But even more
impressive is the fact that two of the 23 Caribbean
countries monitored by the World Travel & Tourism
Council (WTTC) and its research partner, Oxford
Economic Forecasting – the British Virgin Islands
and Antigua and Barbuda – owe more than 75 per
cent of their economies to Travel & Tourism. For
another four countries Travel & Tourism generates
between 50-75 per cent, and the respective shares are
25-50 per cent for a further ten countries, and 10 per
cent for three others. Only four Caribbean
economies – Martinique, Curaçao, Puerto Rico and
Haiti – owe less than 10 per cent of their economies
to Travel & Tourism.
Moreover, the individual and collective impact
could be even greater than forecast if the underlying
regional and national policy framework were
conducive to growth – ie if the regional authorities
and national governments created the underlying
conditions for investor confidence, dynamism and
sustainability. However, this depends on the
governments recognizing and supporting Travel &
Tourism as the Caribbean’s highest-priority industry
and employer, factoring it in to all policies and
decision-making.
To be fair, a number of Caribbean governments
have indeed recognized the importance of Travel &
Tourism, spending considerable time, effort and funds
to study, review, research, report on, and make
recommendations about various aspects of the
industry’s policy agenda. Sadly, implementation of
these reports, policy statements, strategies and
masterplans has proved a weak link in the process.As
a result, while much has been said – and very well
said – follow-through is frequently a key missing
ingredient.
Recent efforts – including the Strategic Plan
commissioned by the Commonwealth Fund for
Technical Co-operation Programme – augur well for
Travel & Tourism’s growth in the longer term,
THE IMPORTANCE OF TRAVEL & TOURISM TO THECARIBBEAN IS INDISPUTABLE. HOWEVER, THEINDUSTRY’S POTENTIAL IS A LONG WAY FROM BEINGFULLY TAPPED, AND BOTH GOVERNMENT ANDINDUSTRY WILL HAVE TO OVERCOME A NUMBER OFCHALLENGES TO ENSURE SUSTAINABLE LONG-TERMGROWTH.
EXECUTIVESUMMARY
While this Tourism Satellite Accounting research clearly identifies the economic intensity ofTravel & Tourism regionally and within many individual Caribbean countries, there is stillinsufficient awareness and understanding of the industry’s contribution – how it permeates thedepth and breadth of the general economy and overall fabric of Caribbean society. Thisapparent indifference to Travel & Tourism significantly detracts from the region's uniquecompetitive advantage that holds the promise of economic development and employmentcreation.

5
although there is still a long way to go before the
regional players are suitably organized to capitalize on
this basic first step.
WTTC recommends that, once the new
Secretary General of the Caribbean Tourism
Organization (CTO) takes office (following the
recently announced retirement of the existing
Secretary General), both the CTO and the
Caribbean Hotel Association (CHA) should jointly
convene a Caribbean Travel & Tourism Congress.
This in turn should be responsible for designing,
agreeing and setting up a permanent Caribbean
Tourism Strategy Committee that would establish,
implement and maintain an integrated Strategic Plan
for Caribbean Tourism.
The Strategy Committee should comprise the
most influential private sector CEOs and professional
tourism directors from all segments of the industry,
as well as public sector tourism ministers
representing the broadest possible range of tourism
destinations. This committee should be the region’s
most visible and public demonstration of public-
private sector partnership working hand in hand to
guarantee the sustainability of Travel & Tourism in
the Caribbean. It should also meet regularly, ensuring
frequent progress reviews of the Strategic Plan and its
objectives, making adjustments and enhancements as
required to meet its goals.
Although WTTC endorses and has adopted
almost all the comments and recommendations of the
2002 Strategic Plan, there is one significant part of the
Plan which it is not ready to endorse – the
recommendations associated with regional marketing.
During the 18 public and private sector focus group
meetings held by WTTC in nine destinations in the
Caribbean in preparation for this report, it became
quickly clear that the report’s recommendations
regarding regional marketing were not well received.
WTTC therefore recommends that this
proposal be sidelined for the time being – and until
such time as the Strategy Committee can review the
situation and develop an alternative proposal that will
be unanimously adopted. Until that time, the
Committee should focus on the components of the
Strategic Plan that have received broad endorsement,
and which will aid in establishing credibility and a
track record of success for this new effort.
The budget for this new effort organized by the
Strategy Committee is expected to be nominal at the
outset, but will require a funding mechanism that is
sustainable, flexible and acceptable to all players,
public and private. In this regard, the Committee
must use hindsight to understand why the previous
proposal, a US$20 cruise line passenger tax, was not
seen as equitable and politically sound. Instead, the
Committee should build a consensus around a
funding proposal that is acceptable to all stakeholders
– public and private, land-based, cruise and aviation,
small and large players, tourism-intensive and non-
tourism-intensive countries. The Committee will
only be seen as a focal point of industry co-operation
and advancement once it has finally achieved
consensus on a funding mechanism.
In preparation for this report, WTTC
undertook considerable research on trends and
developments affecting tourism in the Caribbean.
This included a ‘regional policy review’ involving –
as already indicated – 18 focus group meetings in
nine destinations over a two-week period, plus one
additional month of desk research. The effort was
designed to identify those policy issues that were
common to many of the individual countries, or that
required a regional approach and perspective.
Although we did not cover the entire
Caribbean region in our discussions, we were able to
study a broad spectrum of public and private sector
perspectives and interests. Additionally, because our
review was limited in duration and scope, we are the
first to acknowledge that WTTC is not in a position
to pontificate on the complete range of Caribbean
Travel & Tourism policy issues. Nevertheless, we
were able to confirm a number of major policy issues
that, because they were highlighted so frequently and
given such prominence by participants in the focus
groups, stood out clearly as being mission critical for
the Caribbean.
The Strategy Committee... should be the region's most visible and public demonstrationof public-private sector partnership working hand in hand to guarantee the sustainabilityof Travel & Tourism in the Caribbean.


7
RAISING AWARENESSTravel & Tourism is without question the foremost
export sector in the Caribbean and possesses the
inherent ability to diversify the Caribbean economy,
stimulate entrepreneurship, catalyse investment, create
large numbers of sustainable jobs and help social
development in local communities. However, the
impact of the industry is generally not understood by
public officials, the industry itself, or the communities
where it takes place.Among the issues identified in the
process of WTTC’s research, raising awareness of Travel
& Tourism’s role and contribution to Caribbean
countries is perhaps the most mission-critical issue that
faces the region because, by extension, its impact is all-
consuming.
The regional organizations and national
governments should undertake an industrial image
campaign to ensure that all public and private
stakeholders recognize Travel & Tourism’s full impact
across the national economy and the spin-off benefits
that filter down through all levels of the community.
The regional organizations – the Caribbean
Tourism Organization (CTO) and the Caribbean
Hotel Association (CHA) – should establish a Tourism
Economics SWOT Team to assist the different
Caribbean nations understand the full impact of Travel
& Tourism on their economies. This could be
facilitated through seminars and workshops involving
existing governments and every new government that
takes office.
WTTC commends the role played by the
Caribbean Media Exchange (CMEx) in spreading the
message of Travel & Tourism’s importance through the
media.Another approach to raising awareness should be
through the large army of Travel & Tourism employees
who can be ambassadors of Travel & Tourism’s
contribution throughout the broader economy. By
helping them understand the basics of Travel & Tourism
and how the flow of visitor revenues and spending
impacts their lives, they can better serve as emissaries to
the rest of the community to help spread the message
that Travel & Tourism is everybody’s business.
Most importantly, WTTC’s research identified an
almost universal call for a regional, national and local
public awareness campaign to inform and educate the
general public about the merits and impact of Travel &
Tourism in the Caribbean generally, as well as in
individual countries and local communities.
TOURISM PLANNINGLong-term planning at both the national and regional
levels is a prerequisite for generating investor
confidence and organizing the successful development
of Travel & Tourism in the Caribbean.
FUTURE PROSPECTSWHILE THE BASELINE FORECASTS FOR CARIBBEANTRAVEL & TOURISM OVER THE NEXT TEN YEARS AREGENERALLY POSITIVE,THEY NONETHELESS HIGHLIGHTA FEW WEAKNESSES THAT COULD HINDER TRAVEL &TOURISM’S GROWTH. WTTC ALSO MAINTAINS THEYMAY PREVENT THE CARIBBEAN ECONOMIES FROMATTAINING THEIR TRUE TRAVEL & TOURISMPOTENTIAL IN THE LONGER TERM.
At the same time, greater co-operation between all leading policy-makers – and the privatesector – as well as better management of tourism growth, could help the Caribbean countriesdo even better than the current forecasts suggest. This could help maximize the benefits andensure they are spread across all countries and islands in the region.
The following summary of the Policy Framework combines sections from the Strategic Plancommissioned by the Commonwealth Fund for Technical Co-operation Programme andadditional material prepared by WTTC.

8
WTTC applauds the efforts of those Caribbean
economies that have produced and maintained a
Tourism Strategic Plan or Masterplan, and we
encourage their continued perseverance and focused
attention on implementation of these Plans. As for
those economies that are still relying on spontaneous
or passive response to Travel & Tourism development,
we recommend the creation of a Tourism Masterplan
incorporated into a formal National Tourism Policy,
closely linked to the nation’s vision for the future.
In order to ensure greater support and
commitment from all stakeholders, governments
should strengthen their partnerships with the private
sector and local authorities through their respective
national tourism organizations (NTOs). Ideally, they
should also establish a Travel & Tourism Government
Advisory Council that provides direct private sector
input into mission-critical policy and decision-making
by the public sector with regard to Travel & Tourism.
On a regional basis, WTTC applauds the
Caribbean Tourism Strategic Plan produced in 2002
and recommends that it be updated and modified
(see detailed Policy Framework) so as to take account
of current circumstances and stakeholders’ views.
Formal agreement and implementation of the Plan
should be organized as soon as possible.
INDUSTRYMEASUREMENT
The Caribbean’s economic- and marketing-related
Travel & Tourism research and forecasting are
generally inadequate, both in terms of quality and
quantity.As a result, public sector analysis and related
policies tend to overlook or understate the impact of
the industry, or deal only with its smaller individual
components.
This TSA research, developed by WTTC and
OEF for the Caribbean, provides a significant tool for
planning and policy development. Updating the TSA
on an annual basis will help to ensure that adequate
data is available to factor Travel & Tourism into
economic and employment strategies. It will also
provide NTOs with hard economic data to provide
input into decisions regarding their marketing and
promotional efforts. This in turn will help raise
awareness among public and private sector
stakeholders of Travel & Tourism’s full impact across
the national economy – not just on hotels, restaurants
and retail business, but also on construction, real
estate, agriculture and other sectors.
A regional Tourism Forecasting Council (TFC)
could also be a useful tool for ensuring the credibility
of historical results and future demand forecasts.This
should be established along the same lines as
Australia’s successful TFC, in which all stakeholders
are well represented and confidentiality and trust are
present to encourage real private sector participation.
The Council would also anticipate future capital
investment and infrastructure needs, helping to
mitigate serious supply shortages or oversupply.
MARKETING ANDPROMOTION
Experience has shown that demand for any tourism
destination grows sharply if marketing and
promotions are well funded and effective. A
competitive, sustained promotional campaign has
been identified by a number of those who
participated in WTTC’s focus groups as important
for the Caribbean. Most importantly, the campaign
would promote the Caribbean brand, clarifying and
enhancing the region’s image in traditional and
emerging source markets.At the same time, it would
also raise awareness of the importance of Travel &
Tourism to the national and local economies, as well
as the spin-off to all the different stakeholders.
Public and private sector Caribbean
stakeholders in Travel & Tourism could learn some
valuable lessons from the successful brand campaigns
undertaken by the Pacific Asia Travel Association
(PATA). Its project Phoenix, PATA’s most successful
global consumer communications campaign to date,
was designed to re-invigorate Travel & Tourism after
the successive batterings the industry suffered over
the past few years as a result of terrorist attacks, wars
and the SARS outbreak.
Previous attempts to organize and establish a
regional marketing programme in the Caribbean
have failed for a number of reasons – not least the
need for, and easy access to, funding. Given the
circumstances, WTTC recommends that the
marketing initiative be presented as an addendum in
the Strategic Plan with consideration for possible
later implementation. This treatment would allow
the broader Travel & Tourism issues to become the
focus of the Strategic Plan, facilitate immediate
implementation of the Plan, provide a basis for
confidence building, and require significantly lower
funding.

9
HIV/AIDSTravel & Tourism companies and stakeholders in the
Caribbean must adopt a proactive approach to
addressing the problem of HIV/AIDS head on.There
is no doubt that HIV/AIDS will have an enormous
impact on the Caribbean and its people. Travel &
Tourism stakeholders should seek help and assistance
and follow celebrated examples of education and
HIV/AIDS management strategies, which can save a
large percentage of the workforce and mitigate the
impact of this horrific disease on the lives and well-
being of the region’s inhabitants. This is not only a
moral issue, but also one of survival.
NATURALENVIRONMENT
The quality and success of the Caribbean tourism
product is dependent, in large measure, on the
maintenance of a healthy and attractive natural
environment. In the Caribbean, there is a need for:
• Improved planning and management to increase
the technical expertise required in the areas of
pollution monitoring, coastal zone management, and
the preparation and evaluation of Environmental
Impact Assessments (EIAs);
• Increased regional co-operation and
collaboration;
• Higher standards of environmental quality;
• Conservation and sustainable use of natural
resources through participation in environmental
certification and rating programmes;
• Improvements in infrastructure across the
region, notably in utilities such as water and
electricity supply, and solid waste disposal;
• Greater clarity in land-use policy, containment
of the spiralling price of land, and better zoning on
the basis of maximizing economic returns;
• Incentives to mobilize the private sector to
invest in environmental improvements;
• Education and in-service training for a more
sustainable approach to tourism; and
• Crisis and disaster management to mitigate the
severe risk of natural and environmental disasters.
SAFETY, SECURITY AND HEALTH
Among the broad forces driving change in the
tourism industry today, traveller safety and health are
becoming two of the most influential. Crime,
harassment and other forms of anti-social behaviour,
along with hazardous and unhealthy facilities, are
some of the major threats – real or perceived – to the
development of the industry. Such problems frustrate
national and regional efforts to maintain the region’s
image as a safe, clean and hospitable tourism
destination.
COMMUNITYDEVELOPMENT
There is fairly widespread concern that the benefits
from tourism in the Caribbean might not be
reaching those who need them most and that, despite
the impressive growth statistics, tourism is not doing
as much as it could to relieve existing problems of
unemployment, poverty and social dislocation.
Travel & Tourism, as the region’s leading
industry, must be a key element of any national
strategy to alleviate poverty and build resilience and
sustainability into rural and urban communities.
Mechanisms to implement such policies must be
strong and well conceived.Attention must be focused
on identifying and applying the most appropriate
incentives and concessions, technical assistance and
training in business practices and regulations, capacity
building for community-based tourism projects,
development of strategic partnerships to support a
new agenda, and establishing pilot projects.
LINKAGES The ability and modalities to create linkages between
Travel & Tourism and the rest of the economy in the
Caribbean are well established, but the largest
weakness in the equation is in the implementation
and execution of the effort.WTTC recommends that
a dedicated effort and resources be organized by each
NTO or tourism ministry to guarantee a focused
approach to establishing effective linkages between
Travel & Tourism and the rest of the economy.
INVESTMENTBecause of the fundamental importance of tourism
to the economies of almost all Caribbean countries
and the well-being of their people, it is crucial to put
in place an operating climate that will encourage
growth and investment in the tourism sector. The
partnership challenge for governments, hotels and
other sub-sectors is to find ways of reducing operating

10
costs, thereby increasing profitability and subsequently
stimulating new investment to further expand the
industry and the taxes it generates.
There is also a need to examine the availability of
financing and to devise ways of improving access to
finance, especially for the small hotels sector and other
sectors such as tour operating, restaurants and
attractions. In particular, consideration needs to be
given to the creation of specialized financial
intermediaries to unlock the very considerable funds
tied up in Caribbean pension funds,national insurance
funds, insurance companies, etc and make them
available for investments in the hotel sector.
Incentive programmes have also been a limiting
factor as a result of onerous and difficult bureaucratic
barriers, red tape and the preferential treatment given
to foreign investors. In many cases, there is also a lack
of knowledge by the development agencies about
how Travel & Tourism functions, and so incentive
programmes have been misconstrued and misapplied.
WTTC calls on NTOs working with national
development agencies to produce a Travel & Tourism
Investment Strategy that addresses these issues. A
detailed ten-year plan that provides strategic guidance
and operational direction for the industry also needs
to be set up, and this should include ‘one-stop
shopping’ or ‘fast-track’ programmes to ease the
process of establishing new businesses.
TAXATIONThe tourism sector is perceived as an attractive tax
target for governments whose other tax sources are
coming under threat. In addition to taxes imposed by
Caribbean governments, tourists are also faced with an
array of travel-related taxes that are now arguably the
fastest-growing area of travel costs.
With such a narrow tax base (other than that of
the tourism sector), few governments can afford to
make drastic cuts in the taxation on tourism
establishments unless they are convinced that such
measures will be quickly offset by the stimulus
provided to sectoral growth and investment. This
makes it even more important that taxes that are
applied are equitable and, where possible,
hypothecated. One of the most contentious issues in
the region is the inequitable treatment of land-based
tourists compared with cruise passengers.The former
pay significant departure taxes while the latter pay
only a token port charge, if anything.
With this said, it is important that Caribbean
authorities recall the WTTC Principles and
Guidelines of Intelligent Taxation and refer to these
principles when they consider new taxes or
adjustments to existing tax structures.
AIR ACCESSAir lift is critical to the existence of the Caribbean
tourism industry. However, only a very small
proportion of tourism traffic that comes to the
region comes in aircraft owned by, or under the
control of, companies or states in the region.There is
a need for the creation of a viable Caribbean air
transport system to supplement the services being
provided by the external carriers and to guarantee
sustainability of air transport services for the region.
Regional carriers need to work more closely
together – both to provide point-to-point service
from some external markets to the region, and to
distribute that traffic to the smaller destinations
within the region, which would otherwise be
deprived of business.The Caribbean carriers should
be encouraged by specific policy incentives to return
to the blueprint for functional co-operation in
regional transport detailed in the 1993 CTO study, as
well as to rationalize services both with each other
and with external carriers in the context of new ‘hub
and spoke’ arrangements.
AIRPORT SAFETY AND SECURITY
Very few Caribbean countries currently meet the
ICAO safety oversight standards and have the
International Air Safety Assessment Programme
Category 1 classification. This is a serious
impediment for air access.The inclusion of Annex 17
into the Convention on International Civil Aviation,
which deals with aviation security, in the ICAO
Universal Safety Oversight Programme will impose
further obligations on states to significantly enhance
aviation safety to satisfy revised international
standards, including committing to providing
additional financial resources.
There is need to implement proposals for the
formation of a Regional Safety and Security
Oversight Authority to facilitate the cost-effective
attainment and maintenance of ICAO safety
oversight standards.

11
CRUISE TOURISMCruise tourism in the Caribbean has, over the past
decade, generally grown faster than land-based
tourism and this trend is likely to continue. However,
there is widespread concern within the Caribbean
tourism industry that there has been a lack of balance
until now between cruise tourism development and
that of land-based tourism. Moreover, the economic
contribution of cruise tourism to Caribbean
economies is arguably negligible.
The regional authorities, public and private
sector, should undertake to develop and agree a
regional cruise line strategy that addresses the
multitude of issues of concern to the industry, and
that could impact negatively on the well-being of
local people in the medium to longer term. These
include the possible implementation of cruise
passenger fees, and attitudes towards, and relations
with, the cruise lines. Other issues that need to be
addressed include infrastructure development, port
operation, carrying capacity, and port and destination
charges. Their rapid resolution could help pave the
way for a more harmonious and sustainable
relationship with land-based operators and NTOs.
TIMESHAREIt is imperative for the Caribbean countries to draw
up sound regulations for timeshare that protect the
consumer and allow legitimate developers to grow
their businesses.The cornerstone of these regulations
should be a cooling-off period to allow the consumer
time to think things over before a sale becomes final.
Additional mechanisms that protect the consumer’s
rights over the life of the ‘right to use’ programmes
must also be instituted. The Caribbean would be
well-advised to look closely at international best-
practice examples of regulatory law in developing its
timeshare structure.
INFORMATIONMANAGEMENT
In order to meet successfully the challenges from
competing destinations in other parts of the world,
the Caribbean needs to use the best available tools
and technology to manage, develop and market the
tourism industry. NTOs in the Caribbean, which
have in some cases been slow to respond to changes
in ways of doing business and of exploiting the
potential of new technologies such as the Internet,
must quickly become much more expert as
information managers.This will help ensure that they
have the facilities including the right personnel to
collect, store and disseminate comprehensive, high-
quality information about the region’s tourism
products.
HUMAN RESOURCEDEVELOPMENT
Tourism is a labour-intensive, quality-driven service
profession. It depends crucially on the skills level and
professionalism of the workforce to make the sector
productive and competitive. The human resources
requirements of the Travel & Tourism sector depend
on the existence of a systematic strategy and action
that are responsive to the needs of the industry and
relevant to national and regional experiences. In this
regard, Travel & Tourism – by its very nature –
requires greater flexibility of labour laws to
accommodate the seasonality, daily flows and
characteristics of an industry that operates on a 24-
hour daily/7-day weekly basis.
While a significant amount of tourism
education and training activity is currently being
provided throughout the region, much is still unco-
ordinated and fragmented. For this reason, CTO
spearheaded the setting up of the Caribbean Tourism
Human Resource Council (CTHRC) in 1997 to
serve as an overall co-ordinating agency for tourism
human resource development.
It should be noted that the CTHRC has not yet
found its stride – in fact, focus group participants said
that it has generated a lot of talk, but little action to
date. The success of the Council as a co-ordinating
agency depends on building strong partnerships with
key stakeholders, particularly CHA. In order to
achieve this, it must be equipped with the necessary
human and financial resources – in addition to
resources being provided by donors such as the
Canadian International Development Agency
(CIDA), for the development of a Tourism Learning
System, and the European Union, under the
Caribbean Regional Tourism Sector Development
Programme.


13
REALIZING THE POTENTIALIN ORDER TO ACHIEVE OR – EVEN BETTER – SURPASSTHE BASELINE FORECASTS, AND TO ENSURE THATFUTURE GROWTH IS SUSTAINABLE, CERTAIN KEYFACTORS NEED TO BE ASSURED.
These include a favourable government fiscal policy, a climate that is conducive to business –offering attractive incentives for investment – and sustained and effective marketing andpromotion, as well as environmentally friendly policies. Most importantly, clearly defined, long-term development plans must be drawn up to help guide regional, national and local public andprivate sector activities.These plans should be developed in consultation with all stakeholders,feeding from and back into a Caribbean Tourism Strategy and individual National TourismPolicies, and they should be disseminated as widely as possible.
Against this background WTTC – using as a base the CaribbeanTourism Strategy – has made certain policy recommendations to theCaribbean governments, detailed in this TSA report under thesection entitled The Policy Framework. These recommendationsare summarized below:
PLAN FOR THE FUTURE.■ Establish a regional Tourism Strategy Committee
to oversee and implement a regional Tourism
Strategic Plan to co-ordinate regional issues and
relationships between public and private sectors and
the individual Caribbean destinations.
■ Increase the influence and leadership of the
ministries of tourism, especially in tourism-intensive
economies, giving them greater authority at the
highest levels of government, and factoring the
industry’s needs into mainstream policies for
employment, trade, investment, education and
environmental protection.
■ Ensure region-wide development of national
tourism policies, which provides vision to individual
tourism masterplans, ensuring consultation with all
stakeholders – notably local authorities and the
private sector.
■ Establish a dedicated regional research unit to
monitor, anticipate and adapt to changing trends in
Travel & Tourism demand.
■ Anticipate future investment needs by producing
Travel & Tourism Investment Strategies in co-
operation between the national tourism organizations
(NTOs) and the national development agencies.
HIGHLIGHT THE STRATEGIC IMPORTANCE OF TRAVEL &TOURISM.■ Recognize Travel & Tourism’s impact – and its
potential future impact – across the wider economy,
as well as its strategic importance as a catalyst for
other industries and entrepreneurial activity.
■ Reflect Travel & Tourism in mainstream policies
for employment, trade, investment and education,
ensuring that the underlying policy framework is
conducive to sustainable growth.
■ Measure the economic impact of Travel & Tourism
by updating this Tourism Satellite Account (TSA)
annually and communicating results to all levels of
government, industry and local communities.
■ Convene a Caribbean Tourism Congress, bringing
together all Travel & Tourism stakeholders, to discuss
challenges and opportunities for the industry.
■ Undertake awareness building campaigns with
government officials, the media and the general
public to communicate the impact and linkages
between Travel & Tourism and the broader economy
and employment.

14
DEVELOP THE HUMAN CAPITAL REQUIRED FORGROWTH.
ENCOURAGE OPEN MARKETS AND SKIES AND REMOVEBARRIERS TO GROWTH.
■ Promote a positive image of the Travel &
Tourism industry among members of government,
in schools and with the public as a provider of
career opportunities, instead of just jobs, for all
Caribbeans.
■ Place education and training at the forefront of
Travel & Tourism development.
■ Ensure that formal education and vocational
training systems are adapted to the rapidly changing
human resource needs of the industry, covering a
variety of skills and customer service.
■ Recognize Travel & Tourism’s potential to provide
jobs for young people, first-time job seekers,
minority groups and retired people, or working
mothers looking for part-time employment.
■ Recognize that Travel & Tourism employment is
concentrated in small businesses and local
communities throughout the region.
■ Bridge the gap between the education authorities
and the industry, and establish public-private sector
liaison groups to plan ahead for the future human
resource development needs of the industry.
■ Progressively liberalize trade, transport and
communications through the World Trade
Organization’s General Agreement on Trade in
Services and regional trading regimes.
■ Open up air transport markets and expand liberal
aviation accords to attract new scheduled services,
and introduce new strategies and incentive schemes
to encourage regional operators.
■ Develop a regional cruise line strategy to address
the multitude of issues that have created negative
perceptions and operating conditions between the
cruise lines, destinations and land-based operators.
■ Reduce red tape and bureaucratic delays,
providing incentives and instilling confidence among
potential investors that they can generate adequate
returns on their investments.
■ Develop fiscal regimes that encourage tourism
growth, exports, investment, infrastructure, business
innovation and job creation.
■ Set up tourism investment facilitation agencies,
linked to the ministries of tourism, to act as a one-
stop shop for potential investors.
■ Establish sound regulations for timeshare that
protect the consumer and allow legitimate
developers to grow their businesses.
■ Treat Travel & Touism as the export industry it is
and apply the WTTC Principles of Intelligent
Taxation to all new and existing taxation proposals
that impact the industry.
■ Build safety and security provisions into regional,
national, and local strategies, and place special emphasis
on Travel & Tourism in overall policing strategies.
MATCH PUBLIC AND PRIVATE INFRASTRUCTURE TOCUSTOMER DEMAND.■ Expand infrastructure, including airports and cruise
port facilities, to anticipate projected demand, as well
as opening up new areas for tourism development.
■ Introduce new, expanded incentives for the
modernization of the Caribbean’s hotel
accommodation infrastructure.
■ Improve land-use planning and protection,
guarding against unsustainable real-estate development
that poses a threat to the image and quality of the
Caribbean as a destination, and discourages foreign
investment.
■ Introduce timely incentive schemes to attract
sustained capital investment from both domestic and
foreign sources.
■ Ensure that taxes collected on behalf of the
industry are re-invested in infrastructure
improvements, human resources and promotion.

15
FAVOUR TECHNOLOGICAL ADVANCEMENT.
■ Make Travel & Tourism a priority in helping
to introduce and apply IT systems and
telecommunications at a competitive pace across
the region.
■ Take the lead in promoting the use of technology
and developing e-marketing skills in Travel &
Tourism to achieve greater efficiencies and
effectiveness, as well as to ensure the industry
responds better to the needs of the changing
marketplace.
■ Establish clear policies and guidelines for planned
and sustainable tourism expansion across the region.
■ Address urgently the existing problems of water
supply, waste disposal and electrification, and
anticipate and plan ahead regarding the
development of consumption, waste and resource
utilization, in order to meet the projected growth in
Travel & Tourism demand while protecting natural
resources.
■ Promote the sustainable development of Travel &
Tourism as a policy across the entire industry/
region, not just as a policy for rural and nature-based
tourism.
■ Introduce pilot projects to evaluate and
demonstrate local sustainability.
■ Ensure that the socio-economic, cultural and
environmental benefits of Travel & Tourism are
spread equitably across the population in all parts of
the region, and recognize the need for local
community engagement and empowerment.
■ Develop and promote national heritage
designations with clearly defined criteria to support
quality.Accompany these with increased government
funding for the development and promotion of
identified areas of particular heritage value, focusing
on national and international designations.
PROMOTE RESPONSIBILITY IN NATURAL, SOCIALAND CULTURAL ENVIRONMENTS.
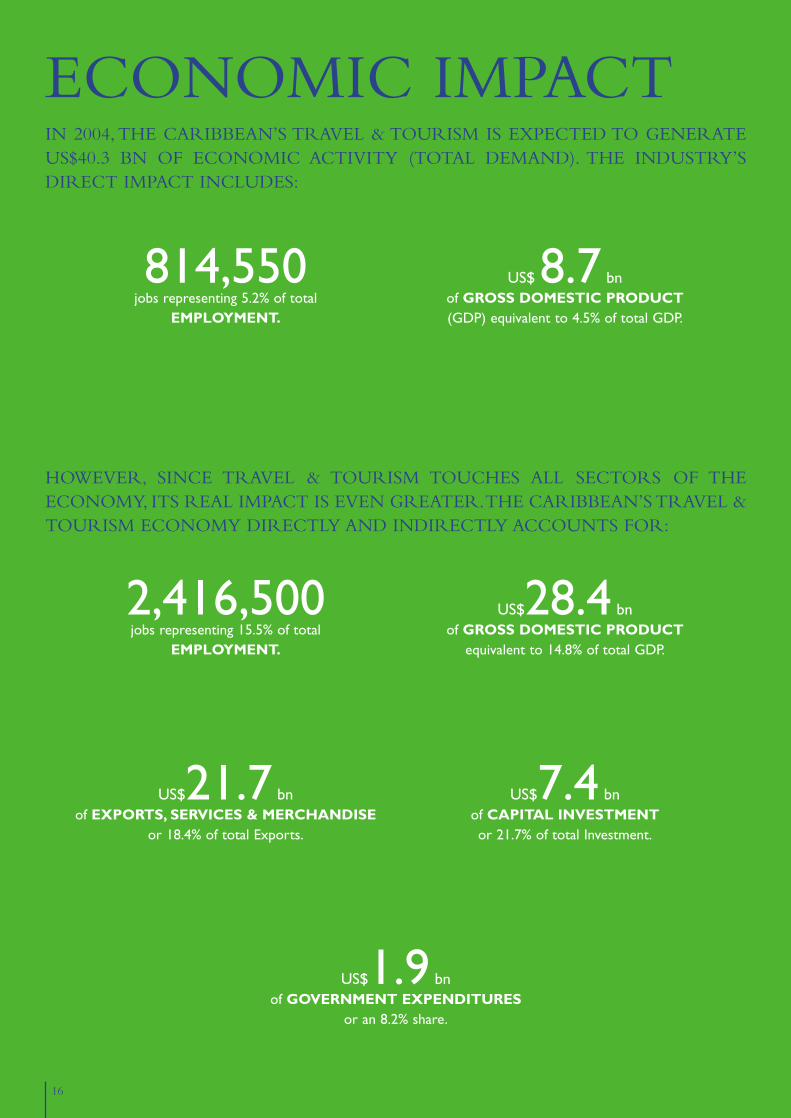
ECONOMIC IMPACTIN 2004, THE CARIBBEAN’S TRAVEL & TOURISM IS EXPECTED TO GENERATEUS$40.3 BN OF ECONOMIC ACTIVITY (TOTAL DEMAND). THE INDUSTRY’SDIRECT IMPACT INCLUDES:
HOWEVER, SINCE TRAVEL & TOURISM TOUCHES ALL SECTORS OF THEECONOMY, ITS REAL IMPACT IS EVEN GREATER.THE CARIBBEAN’S TRAVEL &TOURISM ECONOMY DIRECTLY AND INDIRECTLY ACCOUNTS FOR:
814,550jobs representing 5.2% of total
EMPLOYMENT.
US$ 8.7 bn of GROSS DOMESTIC PRODUCT (GDP) equivalent to 4.5% of total GDP.
2,416,500jobs representing 15.5% of total
EMPLOYMENT.
US$28.4 bn of GROSS DOMESTIC PRODUCT
equivalent to 14.8% of total GDP.
US$21.7 bn of EXPORTS, SERVICES & MERCHANDISE
or 18.4% of total Exports.
US$7.4 bn of CAPITAL INVESTMENTor 21.7% of total Investment.
US$1.9 bn of GOVERNMENT EXPENDITURES
or an 8.2% share.
16

17
GROWTHIN 2004 TRAVEL & TOURISM IN THE CARIBBEAN IS FORECAST TO SEE REALGROWTH OF 10.0% IN TOTAL TRAVEL & TOURISM DEMAND TO US$40.3 BNAND
OVER THE NEXT TEN YEARS, THE CARIBBEAN’S TRAVEL & TOURISM ISEXPECTED TO ACHIEVE ANNUALIZED REAL GROWTH OF:
4.4%in total TRAVEL & TOURISM GDP,
to US$18.4 bn in 2014 for the industry directly,and by 4.0% to US$58.5 bn for the Travel & Tourism Economy overall.
16.7%in TRAVEL & TOURISM
INDUSTRY EMPLOYMENT (direct impact only), to 814,550 jobs, and 12.5%
to 2,416,500 jobs in the Travel & Tourism Economyoverall (direct and indirect).
3.0%in TRAVEL & TOURISM EMPLOYMENT,
to 1,092,100 jobs directly in the industry,and 2.8% to 3,170,600 jobs in the
Travel & Tourism Economy overall in 2014.
4.0%in total
TRAVEL & TOURISM DEMAND,to US$81.9 bn in 2014.
14.9%in TRAVEL & TOURISM
INDUSTRY GDPto US$8.7 bn for the industry directly and 11.0%to US$28.4 bn for the Travel & Tourism Economy
overall (direct and indirect expenditures).
4.4%in VISITOR EXPORTS,
rising to US$40.7 bn by 2014.
3.1%in terms of
CAPITAL INVESTMENT,increasing to US$13.7 bn in 2014.
3.3%in terms of
GOVERNMENT EXPENDITURESto US$3.7 bn in 2014.


19
Return to healthy growth…After two disappointing years, the Caribbean recorded healthy growth
in both tourist arrivals and international tourism receipts in 2003.The
region’s 7.6 per cent increase in international arrivals was the third-
highest growth recorded by any world region or sub-region last year –
after South Asia and the Middle East. And preliminary indications from
the World Tourism Organization (WTO) suggest the Caribbean may
well have performed better in terms of tourism receipts (excluding
spending on transport).
…and the outlook is even brighterMore importantly, prospects for 2004 are even brighter. WTTC/OEF
forecasts point to a 17 per cent rise in visitor exports (international
tourism receipts including transport spend), and industry analysts are
projecting a double-digit increase in arrivals.
The reasons for the turnaround are not difficult to explain. Since
the events of 11 September 2001, the US market has increasingly seen
THE CARIBBEAN’S TRAVEL & TOURISMOVERVIEW OF RECENT TRENDS AND DEVELOPMENTS.
RECONFIRMING ITS APPEAL AS A WORLD TOURISM DESTINATION
the Caribbean as a safe and secure haven at a time when many parts of
the world pose real or perceived terrorism threats. At the same time,
many Americans are still also reluctant to travel further afield as they are
nervous about the hostile reception they feel they may receive from
some European and Asian nations as a result of the US Government’s
stance on Iraq.
For Europeans, on the other hand, more attractive prices and
greater value for money are almost certainly the major attraction of the
Caribbean thanks to the weaker US dollar, on which many Caribbean
currencies are based.The decline in demand from Europe in 2001 and
2002 was directly linked to perceived sharp price rises in the region.
A tourist’s paradiseDespite the downturn in 2001 and 2002, the tropical islands of the
Caribbean have long been seen as a paradise for tourists, and they have
increasingly become accessible to less affluent travellers. Stretching out
over an area of more than 2.5 million square kilometres – from the
THE BAHAMAS
CUBA
JAMAICA
HAITI
DOMINICAN REPUBLIC
CAYMAN ISLANDS
PUERTO RICO
VIRGIN ISLANDS (US & UK)
ANGUILLAANTIGUA
ANDBARBUDASAINT KITTS AND NEVIS
GUADELOUPE
DOMINICA
MARTINIQUE
SAINT LUCIABARBADOS
GRENADA
SAINT VINCENTAND THE
GRENADINESARUBANETHERLANDS ANTILLES
TRINIDADAND
TOBAGO
TURKS AND CAICOSISLANDS
BERMUDA
MONTSERRAT
St Croix
St ThomasSt John
TortolaVirgin Gorda
AnegadaSombrero
St Martin St Barthelemy
St Eustatius Barbuda
Antigua
St Kitts
Nevis
Trinidad
Tobago
St Vincet
Grenadines
Grande – Terre
Basse –Terre
Les Saintes Maria – Galante
CuracaoBonaire
Grand Cayman
Little Cayman Cayman Brac
Isla De La Juventud
Grand Bahama
Abaco
Eleuthera
Cat Island
Rum Cay
San Salvador
Long Island
GreatExuma
Andros
New Providence
Crooked Island
Acklins Mayaguana
Great Inagua
Little Inagua
Samana Cay
Long Cay
Turk Islands
Caicos Islands
Havana
Oranjestad
Nassau
Bridgetown
George Town
Roseau
St George’s
Basse-terre
Plymouth
Willemstad
San Juan
Castries
Port of Spain
Kingstown
Fort-de-France
Saint Johns
Basse-terre
Port-au-PrinceSanto Domingo
Kingston
20
Bahamas off the coast of Florida in the north (not taking account of
Bermuda, which is not strictly in the Caribbean) to Trinidad and
Tobago off the coast of South America in the south – the different
islands offer their own unique attractions and rich and colourful history.
The Caribbean boasts a wealth of resources that appeal to tourists
the world over – including spectacular scenery, exotic wildlife, cultural
diversity, and warm and friendly people. Some islands are best known
for their palm-fringed, white-sand beaches or spectacular mountain
ranges and volcanoes, others for their historical heritage reflected in
their fine colonial architecture. But among the islands’ major attractions
are the colourful festivals and carnivals, offering lots of live music and
dancing, guaranteeing that any holiday spent in the region is filled with
lively entertainment. In addition, sports enthusiasts know that every
imaginable outdoor activity is catered for.
Data definitionsThe geographic region covered by WTTC/OEF for the preparation of
this Tourism Satellite Account comprises 23 Caribbean individual
countries, including Bermuda. However, the data quoted in this Travel
& Tourism Overview reflects the Caribbean Tourism Organization’s
(CTO’s) definition of the region – ie 32 countries, among which
Belize and Mexico's Cancún and Cozumel. It should also be noted
that WTO data for the region excludes the Mexican Caribbean and
Belize.Although the differences in definition have a negligible impact
on overall trends, strict comparisons are not possible between different
sets of data.
RECENT TOURISM PERFORMANCEGrowth in tourism receipts is back on trackFrom 1990 to 2000 Caribbean tourism grew by close to 7 per cent a
year, in terms of international tourist receipts – well above the annual
average recorded worldwide. However, an increase of less than 1 per
cent in 2001, followed by a 3 per cent decline in 2002, pushed the
annual average down to 5.5 per cent. Preliminary estimates nonetheless
suggest that 2000’s record was easily surpassed last year, ensuring that
the Caribbean’s tourism revenue growth is now back on track.
The Dominican Republic attracts the highest share of receipts of
all Caribbean destinations, of some US$2.7 billion in 2002 – although
this represented a 2.2 per cent drop on 2001’s level. Puerto Rico, in
second position in the ranking, recorded a 9 per cent decline to US$2.5
billion and Cuba, in third place, fell by 3.5 per cent to US$1.6 billion.
But a number of destinations in the region – mostly among the smaller
islands – bucked the general trend in 2002 and recorded growth in
international tourism receipts. These included Trinidad and Tobago,
Curaçao, Grenada, and St Vincent and the Grenadines.
Average spend per tourist – or receipts per arrival – in the
Caribbean in 2002 was US$1,035, although higher than average
spending was recorded in the smaller islands such as the Netherlands
Antilles,Anguilla,Aruba, the Turks and Caicos and the US Virgin Islands.
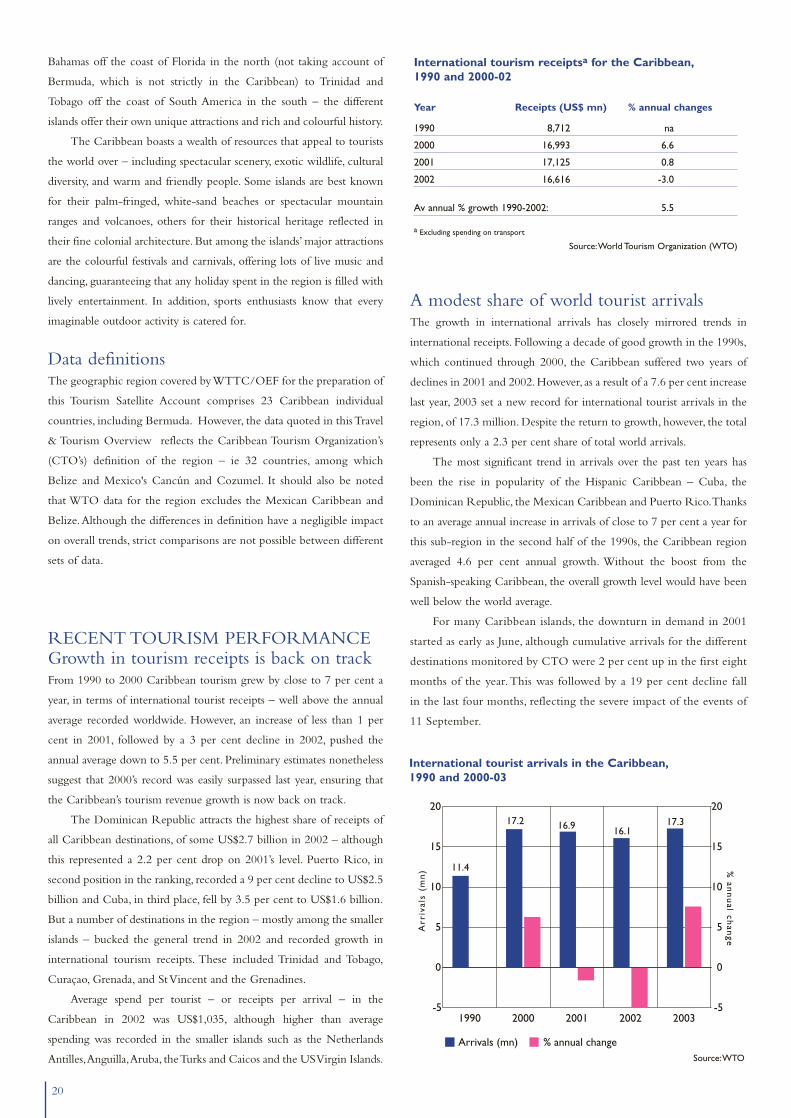
A modest share of world tourist arrivalsThe growth in international arrivals has closely mirrored trends in
international receipts. Following a decade of good growth in the 1990s,
which continued through 2000, the Caribbean suffered two years of
declines in 2001 and 2002.However, as a result of a 7.6 per cent increase
last year, 2003 set a new record for international tourist arrivals in the
region, of 17.3 million. Despite the return to growth, however, the total
represents only a 2.3 per cent share of total world arrivals.
The most significant trend in arrivals over the past ten years has
been the rise in popularity of the Hispanic Caribbean – Cuba, the
Dominican Republic, the Mexican Caribbean and Puerto Rico.Thanks
to an average annual increase in arrivals of close to 7 per cent a year for
this sub-region in the second half of the 1990s, the Caribbean region
averaged 4.6 per cent annual growth. Without the boost from the
Spanish-speaking Caribbean, the overall growth level would have been
well below the world average.
For many Caribbean islands, the downturn in demand in 2001
started as early as June, although cumulative arrivals for the different
destinations monitored by CTO were 2 per cent up in the first eight
months of the year. This was followed by a 19 per cent decline fall
in the last four months, reflecting the severe impact of the events of
11 September.
1990 2000 2001 2002 2003-5
0
5
10
15
20
-5
0
5
10
15
20
Arrivals (mn)
Arr
ival
s (m
n)
% annual change
% an
nu
al chan
ge
11.4
17.2 16.9 16.117.3
International tourist arrivals in the Caribbean,1990 and 2000-03
International tourism receiptsa for the Caribbean,1990 and 2000-02
Year Receipts (US$ mn) % annual changes
1990 8,712 na
2000 16,993 6.6
2001 17,125 0.8
2002 16,616 -3.0
Av annual % growth 1990-2002: 5.5
a Excluding spending on transport
Source:World Tourism Organization (WTO)
Source:WTO

21
Demand hit by a number of differentfactors…Individual destinations in the region were almost all affected, some
more acutely than others. The Dominican Republic maintained its
position as the most popular destination in the Caribbean, despite a
decrease of 6.6 per cent over the previous year.The Bahamas was the
hardest hit, with an aggregate decline in arrivals of over 33 per cent in
the last four months of the year. This was a clear reflection of the
destination’s heavy dependence on the US market.
Arrivals from Europe, which has been the fastest-growing source
for the Caribbean since the mid-1980s, recorded much less of a
downturn, according to CTO data. However, there were double-digit
declines to some of the Europeans’ most popular destinations in the
region – not to mention a 19 per cent drop from the German market
overall. But Europe’s 19 per cent increase to Cancún in 2001 helped to
compensate for the negative trends from Europe to other destinations
in the region.
…not least a perceived decline in value formoneyThe decline in stay-over holidays by Europeans intensified in 2002, and
the trend was clearly not linked to 11 September alone.The decline was
most marked for the lower-cost package holiday destinations such as the
Dominican Republic, highlighting the fact that the weak euro, together
with perceived high inflation, were among the major deterrents to
growth. Although higher-yield sectors of the market, as well as smaller
islands offering more upmarket products, continued to sell quite well in
2002, there were serious concerns that, at the more cost-conscious end
of the market, the Caribbean was losing its competitive edge in terms
of value for money.
Mixed performance across the region in2003Last year’s 7.6 per cent arrivals growth for the region masked some very
different results from one destination to another. Once again, the
Hispanic Caribbean islands turned in the best performances, with the
Dominican Republic recording a 17 per cent increase and Cuba
registering 13 per cent (to end-November). Cozumel was up nearly 35
per cent, albeit from a small base.
Some of the Dutch Caribbean islands also performed better than
average with Bonaire attracting 23 per cent growth and St Maarten 12
per cent. Nevertheless, there was a stagnation in demand for Aruba
and Saba recorded a 5 per cent decline. No up-to-date statistical
trends are available for the French overseas dominion/department
(DOM), Guadeloupe, but its sister DOM Martinique also suffered
from stagnating arrivals.
Growth varied sharply for the different British Caribbean islands.
Among the best performers were Antigua and Barbuda (+13 per cent),
St Lucia (+9 per cent) and Barbados and Jamaica (both up 7 per cent).
Stay-over arrivals in the Caribbean by destinationcountry, 2003
Destination Arrivals Overall Winter Summer
Dominican Republica 3,268,182 17.0 19.6 15.6
Cancúnb, Mexico 2,076,478 5.6 1.8 7.9
Bahamas 1,428,599 1.8 3.8 0.7
Jamaica 1,350,284 6.6 7.9 6.0
Puerto Ricob 1,324,968 3.5 5.1 2.5
Aruba 641,906 -0.1 -6.1 3.1
US Virgin Islands 618,703 3.5 -2.2 7.3
Barbados 531,211 6.7 8.0 6.0
Martinique 445,424 -0.6 2.2 -2.5
St Maartena 427,587 12.3 6.6 16.0
Cozumel, Mexico 304,233 34.6 44.7 28.5
Cayman Islands 293,515 -3.1 -3.4 -2.8
St Lucia 276,948 9.3 -1.7 16.4
Bermuda 256,563 -9.7 -9.5 -9.7
Curaçao 221,390 1.6 -6.0 5.7
Turks and Caicos Islands 163,584 6.5 10.1 4.3
Grenada 142,333 7.5 4.8 9.0
Guyana 100,911 -3.3 -16.8 3.5
St Vincent and Grenadines 78,535 1.2 -10.5 6.8
Dominica 72,948 8.7 8.1 9.0
Bonaire 64,176 23.2 25.7 22.0
Anguilla 46,915 7.1 -2.5 14.3
St Eustatius 10,788 10.3 14.9 8.3
Saba 10,260 -4.8 15.4 -12.7
Montserrat 8,375 -12.9 -21.1 -9.1
Cubaf 1,690,799 13.1 19.1 8.6
Trinidad and Tobagoe 334,811 5.6 5.9 5.4
British Virgin Islandsc 184,777 -4.3 0.2 -11.8
Antigua and Barbudaae 182,423 12.8 5.0 19.6
Belized 171,709 11.0 8.5 15.3
a Non-resident air arrivals b Non-resident hotel registrations only c Jan-Jul d Jan-Sep e Jan-Oct f Jan-Nov
Note: Data for 2004 was not available for Haiti or St Kitts and Nevis
Source: Caribbean Tourism Organization (CTO) from data supplied by member countries as at 26 April 2004
The most significant trend in arrivals overthe past ten years has been the rise inpopularity of the Hispanic Caribbean –Cuba, the Dominican Republic, theMexican Caribbean and Puerto Rico.

22
INTRA-CARIBBEAN TRAVEL The intra-Caribbean market currently represents less than 7 per cent of
total stay-over arrivals in the Caribbean, according to CTO. One of the
main deterrents to intra-regional growth is the inadequate air transport
network between the islands. But there has not been any serious, active
marketing and promotion until now to try to tap the market’s potential,
nor any real effort on the part of the public or private sectors to improve
intra-Caribbean transport links for locally based and non-Caribbean
tourists. But the market is considered to have good potential for growth
that could be better exploited.
INTERNATIONAL MARKETSCanada and Europe outperform the USmarketIn stark contrast with its performance in 2002, the US market recorded
increases every month last year with the exception of March and
September. This was a clear sign of recovery, although US arrivals
volume in 2003 was still well below its peak of three years earlier,
averaging around 4 per cent growth on 2002.
Canadian tourism demand bounced back to near pre-2001 levels.
A 27 per cent rise in winter arrivals was followed by an 11 per cent
increase in summer 2003.These increases combined translated into 21
per cent growth for the year overall.The main beneficiaries were Cuba
(+30 per cent) and the Dominican Republic (+32 per cent).
Tourist arrivals from Europe also rebounded in 2003, ending the
year up 12 per cent over 2002’s level.Winter arrivals rose by 7 per cent
over the previous year, but summer business was even better, recording
a 15 per cent increase.The Dominican Republic and Cuba generated
over two-thirds of the total European arrivals count, with Cancún,
Barbados and Jamaica accounting for a further 20 per cent. The main
winners out of Europe, in terms of percentage growth, were the
Dominican Republic, St Lucia, Curaçao and Bonaire.
A prime contributor to the revival of European demand for the
Caribbean in 2003 was Germany, which had suffered a major slump the
previous year and has been sluggish for a number of years. German air
passengers to the region declined as much as 25 per cent to 515,000 in
2002, according to data from the German airports association – largely
due to the withdrawal of cheap package holidays to the Dominican
Republic. While there was a general downturn in German outbound
travel demand, the Caribbean suffered more than most destinations. But
German tour operators claim that sales were well up in 2003 and are
bullish about prospects for this year.
Different islands attract different marketsNot surprisingly, while the USA is the major source of tourism for the
Caribbean and Europe accounts for around one in four arrivals, the
market breakdown is very different for individual destinations. The
USA, for example, dominates demand for Puerto Rico – accounting for
87 per cent of arrivals – the US Virgin Islands (80 per cent), Cancún (77
per cent), Jamaica (72 per cent) and the Bahamas (no market data
available for 2003). Europe, on the other hand, is the number one
market for Cuba (47 per cent), Barbados (44 per cent) and the
Dominican Republic (39 per cent) followed, in the case of Cuba, by
Canada (24 per cent).
CRUISINGA booming businessCruise passenger arrivals in the Caribbean have been far less affected by
the events of the last few years, starting with 11 September 2001. In
2002 they achieved a double-digit increase and continued to grow
sharply in 2003, with almost all countries achieving increases in
demand. Belize, which has been the fastest-growing cruise destination
in recent years, registered an increase of 80 per cent over 2002’s level.
The British Virgin Islands’ cruise arrivals were up by 57.3 per cent (for
the first seven months of the year) and cruise visitors to the Dominican
Republic rose by more than 61 per cent. Other strong performers were
Jamaica, Dominica and Antigua and Barbuda.
Aruba, Curaçao, St Vincent and the Grenadines and Trinidad and
Tobago, in contrast, recorded declines last year.And among the top five
cruise destinations in the Caribbean, the US Virgin Islands and Puerto
Rico – in fourth and fifth positions in the favourites ranking – achieved
only modest growth compared with their competitors.
Overall, these performances translated into a 10 per cent increase
in cruise passenger arrivals overall in the Caribbean in 2003.This was
largely in line with projections, since a number of destinations have
continued to improve their ports to accommodate increasing calls by
the newly launched larger vessels.
International tourist arrivals in leading Caribbeandestinationsa by main markets, 2003
Destination USA Canada Europe Other
Dominican Republicb 865,942 412,625 1,265,978 723,637
Cancúnc 1,590,204 139,285 255,828 91,161
Cubad na 395,170 789,791 505,838
Jamaica 968,688 95,265 218,500 67,831
Puerto Ricoc 1,152,747 13,627 29,965 128,629
Aruba 460,241 17,218 54,711 109,736
US Virgin Islandsc 496,357 4,809 7,756 114,799
Barbados 129,326 49,641 232,500 119,744
a Destinations attracting more than 500,000 international arrivals in 2003 b Non-resident air arrivals c Non-resident hotel registrations only d Jan-Nov – US arrivals included with ‘other’
Source: CTO
The USA is the major source of tourismfor the Caribbean and Europe accounts foraround one in four arrivals.

Given that the Caribbean attracts around 50 per cent of the world
cruise market, its contribution to overall tourism earnings is
nonetheless relatively insignificant – accounting for between 8-10 per
cent of international tourism receipts only. As explained in the Policy
section of this report, efforts to create a more sustainable playing field
by imposing some kind of passenger fees on cruise arrivals – stay-over
visitors are required to pay a departure tax – have so far failed.This is
largely due to the fact that a number of Caribbean governments fear
their destinations would simply be dropped by the big cruise
companies if these fees were imposed.
In addition, the Travel & Tourism industry is concerned that stay-
over tourism has been affected by the increased popularity of home
porting by US cruise lines, reducing possibilities for fly-drive options,
which encourage tourists to spend a few days in their cruise departure
or arrival country.
AIR ACCESSIncreased air capacity stimulates demandThe revival in Caribbean tourism has also brought a welcome
expansion of flight capacity into the region from the USA, Canada and
different European points. There is now increased competition, for
example, on the Amsterdam-St Maarten route. In addition to KLM and
the Curaçao airline DCA, the charter carrier Air Holland has also been
flying to the Dutch part of the island since last autumn, offering some
of the lowest fares available to the Caribbean.
23
Cruise passenger arrivals in the Caribbean by destinationcountry, 2003
Destination Arrivals % change on 2002
Bahamas 2,970,174 6.0
Cozumel, Mexico 2,708,913 15.6
Cayman Islands 1,818,979 15.5
US Virgin Islands 1,773,948 2.0
Puerto Rico 1,234,992 2.6
St Maarten 1,171,734 11.1
Jamaica 1,132,596 30.9
Belize 575,196 79.9
Barbados 559,122 5.6
Aruba 542,327 -6.8
Dominican Republic 398,263 61.3
St Lucia 393,240 1.6
Antigua and Barbuda 385,686 23.5
Curaçao 279,378 -12.4
Martinique 268,542 33.7
Bermuda 226,097 13.0
Dominica 177,044 29.4
Grenada 146,925 8.8
St Vincent and Grenadines 64,965 -7.6
Trinidad and Tobago 55,532 -7.5
British Virgin Islandsa 178,699 57.3
a Jan-Jul
Source: CTO from data supplied by member countries as at 26 April 2004
24
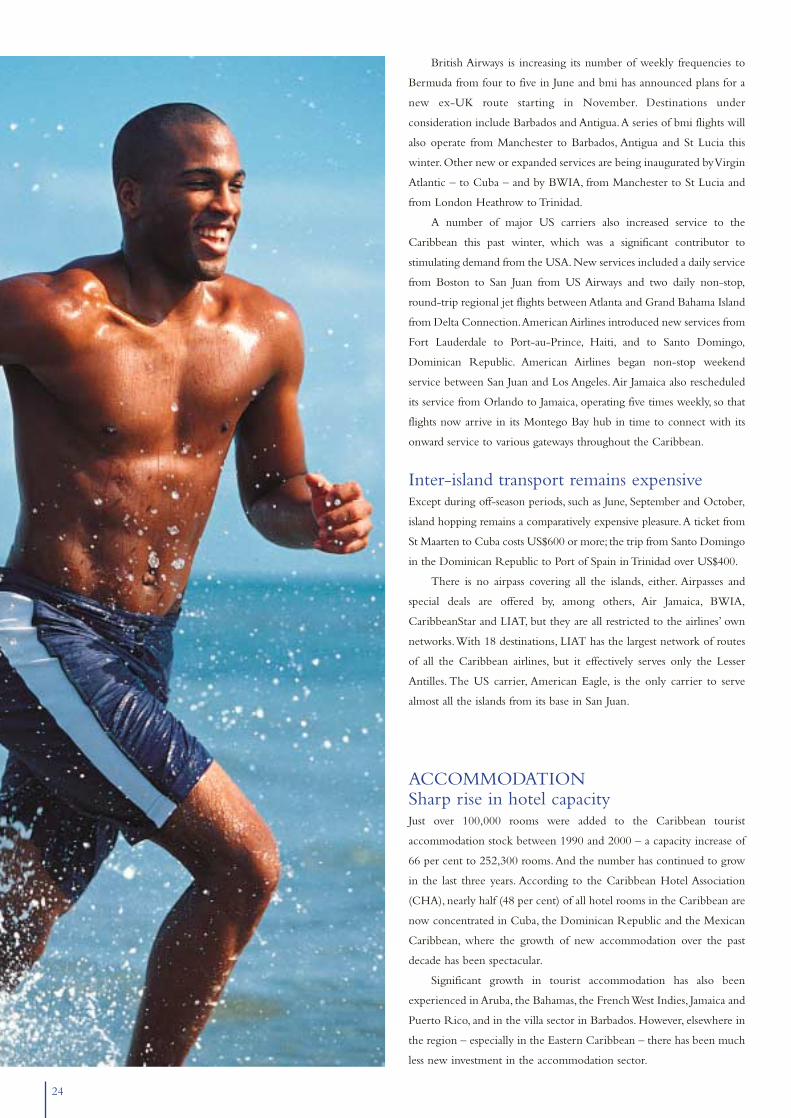
British Airways is increasing its number of weekly frequencies to
Bermuda from four to five in June and bmi has announced plans for a
new ex-UK route starting in November. Destinations under
consideration include Barbados and Antigua.A series of bmi flights will
also operate from Manchester to Barbados, Antigua and St Lucia this
winter.Other new or expanded services are being inaugurated by Virgin
Atlantic – to Cuba – and by BWIA, from Manchester to St Lucia and
from London Heathrow to Trinidad.
A number of major US carriers also increased service to the
Caribbean this past winter, which was a significant contributor to
stimulating demand from the USA.New services included a daily service
from Boston to San Juan from US Airways and two daily non-stop,
round-trip regional jet flights between Atlanta and Grand Bahama Island
from Delta Connection.American Airlines introduced new services from
Fort Lauderdale to Port-au-Prince, Haiti, and to Santo Domingo,
Dominican Republic. American Airlines began non-stop weekend
service between San Juan and Los Angeles.Air Jamaica also rescheduled
its service from Orlando to Jamaica, operating five times weekly, so that
flights now arrive in its Montego Bay hub in time to connect with its
onward service to various gateways throughout the Caribbean.
Inter-island transport remains expensiveExcept during off-season periods, such as June, September and October,
island hopping remains a comparatively expensive pleasure.A ticket from
St Maarten to Cuba costs US$600 or more; the trip from Santo Domingo
in the Dominican Republic to Port of Spain in Trinidad over US$400.
There is no airpass covering all the islands, either. Airpasses and
special deals are offered by, among others, Air Jamaica, BWIA,
CaribbeanStar and LIAT, but they are all restricted to the airlines’ own
networks.With 18 destinations, LIAT has the largest network of routes
of all the Caribbean airlines, but it effectively serves only the Lesser
Antilles. The US carrier, American Eagle, is the only carrier to serve
almost all the islands from its base in San Juan.
ACCOMMODATIONSharp rise in hotel capacityJust over 100,000 rooms were added to the Caribbean tourist
accommodation stock between 1990 and 2000 – a capacity increase of
66 per cent to 252,300 rooms.And the number has continued to grow
in the last three years. According to the Caribbean Hotel Association
(CHA), nearly half (48 per cent) of all hotel rooms in the Caribbean are
now concentrated in Cuba, the Dominican Republic and the Mexican
Caribbean, where the growth of new accommodation over the past
decade has been spectacular.
Significant growth in tourist accommodation has also been
experienced in Aruba, the Bahamas, the French West Indies, Jamaica and
Puerto Rico, and in the villa sector in Barbados. However, elsewhere in
the region – especially in the Eastern Caribbean – there has been much
less new investment in the accommodation sector.

25
CHA’s hotel membership (it also has 700 non-hotel Allied
members) is around 850, accounting for some 120,000 rooms. Of these
63 per cent of hotels and 41 per cent of rooms are located in the English
Caribbean.
A 1997 study estimated that the region would need investment of
some US$3-4 billion annually to meet the needs for growth of new
accommodation and attractions, as well as refurbishment of existing
facilities. However, the Caribbean experience in attracting investment
capital has been mixed. Some destinations have profited from very large
flows of foreign investment in the tourism sector. For others – the
majority – international inflows have been minimal. Efforts are now
being made by the European Union, among other aid donors, to
promote partnership and investment opportunities through programmes
such as PRO€INVEST – PROFIT in the Caribbean 2004.
New-found optimism among hoteliersMeanwhile, data from Smith Travel Research shows that, although the
crisis in tourism to the region is not yet fully over, the operating and
financial performance of Caribbean hotels has picked up strongly since
2003. Last year ended with an average room occupancy of 62.7 per cent
– up from 61.9 per cent in 2002, albeit down from the 2000 peak of
67.7 per cent.Average daily room rate was US$136.20 – only 3 per cent
down on 2000 – but revenue per available room (revpar) was still 10 per
cent off its peak.
CHA membershipa, 2003(%)
Caribbean region Hotels Rooms
English 63 41
Spanish 22 47
Dutch 8 9
French 7 3
a Membership comprising 856 hotels with some 120,000 rooms in total, as well as 700 Alliedmembers
Source: Caribbean Hotel Association (CHA)
ADR (US$) Revpar (US$) Occupancy (%)0
25
50
75
100
125
150
0
25
50
75
100
2000 2001 2002 2003
US$ %
occu
pan
cy
ADR = average daily room rate; Revpar = revenue per available room
Caribbean hotels' performance, 2000-03
Source: Smith Travel Research

26
All three measures showed significant improvement in the first
quarter of 2004, with occupancy reaching close to 76 per cent. In 2002,
the Caribbean had a total of 58 million roomnights available and
generated US$5 billion in revenues. Europe accounted for about one-
third of total roomnight sales.
While the Caribbean is perhaps best known as a destination for all-
inclusive holidays – it is the world leader by a very wide margin in
quantity and quality of all-inclusive resorts – the region has increasingly
diversified its accommodation product.This means that there are now
many more options available for independent travellers looking for
alternative holiday accommodation – from smaller, independently run
hotels to villas and timeshare.
Getting off the beaten track On islands such as the Bahamas, Barbados, Jamaica, Puerto Rico and St
Lucia, family-run and boutique hotels now have their own organization
to enable them to join forces to advertise abroad. Some 35 or so hotels
are part of the Insider Jamaica programme, designed to encourage
holidaymakers who want to avoid mass tourism to get to know the
country and the people.
Travellers who want to live like the locals can also try out Meet the
People programmes in Jamaica and in the Bahamas, as well as
Community Tourism on St Lucia, St Vincent, and Trinidad and Tobago.
Tourist boards and hotels distribute invitations to house parties and
barbecues, and to join locals to attend church or watch football and
cricket matches.
CURRENT PROSPECTSPositive image of ‘brand Caribbean’ augurswell for future growthDespite the lack of co-operative marketing and promotion of the
Caribbean in recent years, the region’s brand image is stronger than it
has been for some time and, as already indicated, this is due to a number
of different factors.The improving economies of key source markets, the
Caribbean’s image as a safe and secure haven far from threats of
terrorism that plague destinations in North America, Europe and other
parts of the world and, most importantly perhaps, the depreciation of
the US dollar – all have contributed to raising the Caribbean’s profile
and stimulating demand.
Moreover, the results of the WTTC/OEF research suggest that
prospects for growth over the foreseeable future are extremely bullish,
although certain challenges remain to be addressed. Admittedly,
destinations such as the Dominican Republic and Haiti may suffer
temporarily following the tragic floods in May this year. But experience
of similar natural disasters – and the Caribbean islands have had more
than their fair share off these – shows that any resulting downturn is
likely to be short-lived.
Preliminary indications suggest that large and small destinations in
the Caribbean – especially those with US dollar currencies – are very
much in demand this year. Only the French Antilles have experienced
a downturn because of the euro. CTO is currently projecting a growth
of 7 per cent in international tourist arrivals this year.
Future growth prospects will remain closely linked to the US
economy and Americans’ desire to travel abroad. As far as the
European market is concerned, the important question is whether the
region can remain competitive vis-à-vis new destinations such as
South Africa, or traditional Asian favourites like Thailand. For the
moment, the Caribbean is very much back in favour – helped, it is
true, by the weaker US dollar – but there are some concerns about
local unrest in some islands and its impact on tourists’ safety, and this
also needs to be addressed.
But the risk of price wars in the future…Another potential risk is that, as Cuba opens up as a holiday destination
for US travellers, creating a more competitive marketplace, the
temptation to resort to unhealthy rate cutting could intensify. Not only
will Cuba be seen as a novelty destination, but it is also cheap and, with
50,000 new beds scheduled to come on line on the island – more than
the current bed capacity of the whole English-speaking Caribbean –
other islands are sure to suffer.
…could undermine the sustainability ofCaribbean tourismThe Caribbean islands need to focus on the fact that, although
undercutting produces short-term gains, this would not be good for the
long-term sustainability of Caribbean tourism.Today’s tourists are also
increasingly sophisticated and demanding of quality, and any attempt to
reduce the level of service as a means of cutting costs is bound to have
a negative impact.
The Caribbean islands – especially Jamaica, Barbados and Aruba –
are considered to be the world leaders in sustainable tourism.Almost 40
per cent of the eco-certificates awarded by Green Globe, for example,
have so far gone to this region. So it is in the interests of all stakeholders
that they preserve this leadership.
The Caribbean’s image as a safe and securehaven far from threats of terrorism thatplague destinations in North America,Europe and other parts of the world and,most importantly perhaps, the depreciationof the US dollar – all have contributed toraising the Caribbean’s profile andstimulating demand.

27

28
Over the last three decades, countries have estimated the economic impact of Travel & Tourism through
a range of measures using a variety of definitions and methodologies. Such approaches have prevented
meaningful comparisons among nations. Even for the same nation over different periods of time, they
have frustrated business and government attempts to draw valid conclusions about the nature and course
of Travel & Tourism demand in national economies.This regime has obscured the substantial, positive
role the industry plays in national economies and has thwarted business and government attempts to
optimize economic programmes and policies.
The World Travel & Tourism Council (WTTC) recognized the dearth of crucial Travel & Tourism
intelligence from the time of its establishment in 1990 and it published the first detailed estimates of
world tourism’s economic impact that same year.
Since then WTTC has worked to improve its methodologies and to encourage individual countries
to enhance their measurement and understanding of tourism’s impact on their national economies.
Furthermore, in the spirit of joining forces to enhance world comprehension of the role of Travel &
Tourism in national economies,WTTC has strongly supported the programmes of the World Tourism
Organization (WTO) to improve tourism statistics worldwide.
WTTC’S RESEARCHWTTC and its economic/research partners – Oxford Economic Forecasting, (OEF), since 1999, and
Global Insight (previously known as DRI•WEFA), from 1990-1999 – have developed and published
research on the economic contribution of Travel & Tourism to the world, regional and national
economies.
Starting in 1990,WTTC’s research team has been working to develop practical, real-world models
to illustrate Travel & Tourism’s economic contribution based on the needs of private sector leaders, public
sector policy-makers and industry researchers, and on the interpretation of the system of national
accounts. The research is now firmly anchored in the international standard for tourism satellite
accounting that was developed by WTO, OECD and Eurostat, and approved by the United Nations
Statistical Commission in 2000. It was launched at the TSA Conference held in Vancouver in May 2001
and published as the Tourism Satellite Account: Recommended Methodological Framework (TSA:RMF) in 2001.
Since 1999,WTTC’s research has assumed the conceptual framework of the UN-approved standard
with a number of discretionary extensions, and it combines the most sophisticated economic modelling
and forecasts available with the most up-to-date, publicly available data to generate a comprehensive
implementation of Travel & Tourism satellite accounting.
This special simulated TSA for the Caribbean is the product of work commissioned by the
Caribbean Hotel Association (CHA). In carrying out the work, OEF has drawn extensively on the
methodology developed over the years by WTTC to develop TSAs as operational tools, and has worked
closely with CHA and its project steering committee to review the assumptions, models and results
produced by this excercise.
TRAVEL & TOURISMSATELLITE ACCOUNTTOURISM SATELLITE ACCOUNTING
THIS REPORT FOLLOWS THE CONCEPT OF SATELLITE ACCOUNTINGDEFINED IN THE TOURISM SATELLITE ACCOUNT: RECOMMENDEDMETHODOLOGICAL FRAMEWORK (TSA:RMF), AND DEVELOPED UNDERTHE AUSPICES OF THE WORLD TOURISM ORGANIZATION.

WTTC has endeavoured to implement and produce the
most comprehensive TSA provided for within the TSA:RMF
– by developing the narrow concept of the ‘Travel & Tourism
Industry’ in addition to the broader concept of the ‘Travel &
Tourism Economy’.WTTC advocates full implementation of
the TSA as defined in the TSA:RMF in order to achieve the
highest level of benefits for industry and governments.These
include:
■ A wealth of customer and consumer information on
tourism-related purchases (before, during and after trips –
whether domestic or international, imported or exported
– as well as services, durables and non-durables) that has
never been identified until now;
■ Comprehensive documentation and analysis of the full
tourism-product service chain and government’s ability
to deliver quality and timely service to visitors;
■ Linkages between Travel & Tourism and other sectors of
the economy such as agriculture and manufacturing to
illustrate the flow-through of spending;
■ Complete outlook for public works that benefit visitors
and Travel & Tourism companies in order to leverage
public sector plans and priorities for growth;
■ Focused opportunities for domestic production, as well
as incentives from the public sector, to aid in the growth
of businesses that help alleviate trade balance issues;
■ Demand- and supply-side information on employment
that allows for human resource planning and
development.
WTTC has worked towards developing a
comprehensive TSA – not because it is eager to exaggerate
the size of Travel & Tourism’s impact, but because the
information that can be garnered from the exercise by
governments and industry is crucial for making intelligent
and informed policy and business decisions.WTTC believes
that history will document its pioneering implementation of
the simulated TSA as one of the most important turning
points for Travel & Tourism’s long overdue economic
recognition.
In the WTTC research, no country receives special
treatment or favours. WTTC uses internationally available
data sources and the same scope of tourism satellite
accounting for all countries, as well as the same basic
assumptions through the same system of models. WTTC’s
TSA research utilizes a universal and internally consistent
modelling framework and generates harmonized results and
forecasts for 175 countries around the world. Details of the
methodology used by WTTC/OEF in its TSA research are
available on WTTC’s website (www.wttc.org).
29
0 500 1,000 1,500 2,000 2,500 3,000 3,500 4,000 4,500 5,000
US Virgin IslandsTrinidad and Tobago
St Vincent and the GrenadinesSaint Lucia
Saint Kitts and NevisPuerto RicoMartinique
JamaicaHaiti
GuadeloupeGrenada
Dominican RepublicDominicaCuraçao
CubaCayman Islands
British Virgin IslandsBermudaBarbadosBahamas
ArubaAntigua and Barbuda
Anguilla
Economy Industry
0 100 200 300 400 500 600 700 800US Virgin Islands
Trinidad and TobagoSt Vincent and the Grenadines
Saint LuciaSaint Kitts and Nevis
Puerto RicoMartinique
JamaicaHaiti
GuadeloupeGrenada
Dominican RepublicDominicaCuraçao
CubaCayman Islands
British Virgin IslandsBermudaBarbadosBahamas
ArubaAntigua and Barbuda
Anguilla
Economy Industry
Travel & Tourism Employment(‘000 Jobs)
Travel & Tourism Gross Domestic Product(1990 Constant US$ mn)
T&T ECONOMYDirect and indirectimpact of visitor activi-ties, capital investment,exports and governmentservices.
T&T INDUSTRYDirect impact of visitoractivity (transportation,accommodation, foodand beverage, recreation,entertainment and travelservices)
CARIBBEAN
WTTC’S APPROACH TO TOURISMSATELLITE ACCOUNTING

30
TSA CONCEPTS & STRUCTURE
T&TEconomy
Employment
2,416.5
Property
Taxes
PropertyTaxes
IndirectTaxes
Imports
11.9
PersonalIncome Taxes
Travel & Tourism Economy GDP(Direct and Indirect)
28.4
2004 (US$ bn, ‘000 of Jobs)
Travel & Tourism Taxes
OtherTaxes
OperatingSurplus -Subsidies
Indirect
Taxes
Comp.
T&T IndustryEmployment
814.6
Depreciation
Personal Travel & Tourism
8.0
Business Travel
1.3
GovernmentExpenditures(Individual)
0.6
VisitorExports
19.0
GovernmentExpenditures(Collective)
1.3
CapitalInvestment
7.4
Exports(Non-Visitor)
2.7
T&T Industry GDP (Indirect)10.6
Imports9.6
Travel & Tourism Economy Supply
40.3
Travel & Tourism Industry GDP (Direct Only)
8.7
Travel & Tourism Industry Supply
28.9
Travel & Tourism Economy Supply (Residual)
11.4
Travel & Tourism Demand
40.3
Travel & Tourism Consumption
28.9

31
Travel & Tourism Satellite Accounting research for the Caribbean
reflects a comprehensive simulation of the new international
standard adopted by the United Nations following the Enzo Paci
World Conference on the Economic Impact of Tourism (Nice,
France, June 1999), ten years of model development and TSA
experience by WTTC and Oxford Economic Forecasting (OEF), and
application of OEF’s latest macro-economic forecasts.
TSA Economic ConceptsThe Travel & Tourism Satellite Account is based on a ‘demand-side’
concept of economic activity, because the industry does not produce or
supply a homogeneous product or service like traditional industries
(agriculture, electronics, steel, etc). Instead, Travel & Tourism is an
industrial activity defined by the diverse collection of products (durables
and non-durables) and services (transportation, accommodations, food and
beverage, entertainment, government services, etc) that are delivered to
visitors.There are two basic aggregates of demand in the TSA:
I Travel & Tourism Consumption represents the value of
products and services that have been consumed by visitors. It is the
basic demand-side aggregate used to construct an explicitly defined
production-side ‘industry’ equivalent for comparison with all other
industries.Travel & Tourism Consumption includes:
• Personal Travel & Tourism, more formally known as
consumer expenditures, which captures spending by the
Caribbean’s residents on traditional Travel & Tourism services
(lodging, transportation, entertainment, meals, financial services,
etc) and goods (durable and nondurable) used for Travel &
Tourism activities.
• Business Travel by government and industry, which mirrors
Personal Travel & Tourism’s spending on goods and services
(transportation, accommodation, meals, entertainment, etc), but
represents intermediate inputs used in the course of business or
government work.
• Government Expenditures (Individual) by agencies and
departments which provide visitor services such as cultural (art
museums), recreational (national park) or clearance (immigration/
customs) to individual visitors.
• Visitor Exports, which include spending by international
visitors on goods and services.
II Travel & Tourism Demand builds on Travel & Tourism
consumption to include Travel & Tourism products and services
associated with residual components of final demand. It is used to
construct a broader ‘economy-wide’ impact of Travel & Tourism.
The residual elements of Travel & Tourism demand are:
• Government Expenditures (Collective) made by agencies
and departments associated with Travel & Tourism, but generally
made on behalf of the community at large, such as tourism
promotion, aviation administration, security services and resort
area sanitation services.
• Capital Investment by Travel & Tourism providers (the private
sector) and government agencies (the public sector) to provide
facilities, equipment and infrastructure to visitors.
• Exports (Non-Visitor) which include consumer goods sent
abroad for ultimate sale to visitors (such as clothing, electronics
or petrol) or capital goods sent abroad for use by industry service
providers (such as aircraft or cruise ships).
By employing input/output modelling separately to these two
aggregates (Travel & Tourism Consumption and Travel & Tourism
Demand), the Satellite Account is able to produce two different and
complementary aggregates of Travel & Tourism Supply: the Travel &
Tourism Industry and the Travel & Tourism Economy.The former
captures the explicitly defined production-side ‘industry’ equivalent,
direct impact only, for comparison with all other industries, while the
latter captures the broader ‘economy-wide’ impact, direct and indirect, of
Travel & Tourism.Through this process, the Satellite Account is also able
to determine that portion of supply, which it Imports from abroad.
Next, the satellite account breaks down both aggregates of supply
(Industry and Economy) into the direct and indirect impacts of Gross
Domestic Product (GDP), the main descriptor of economic
production, as well as the various components of GDP (Wages &
Salaries, Indirect/Transaction Taxes, Operating Surplus,
Depreciation and Subsidies). Beyond the regular TSA accounts, a
separate analysis is also provided of Personal Income Taxes paid by
Travel & Tourism generated employment and Corporate and
Property Taxes paid by Travel & Tourism companies.
Finally, one of the most important elements of the Travel & Tourism
Satellite Account are the Employment results, which can now be
quantified for the basic Travel & Tourism Industry and the broader Travel
& Tourism Economy.
• T&T Industry Employment generally includes those jobs with
face-to-face contact with visitors (airlines, hotels, car rental,
restaurant, retail, entertainment, etc).
• T&T Economy Employment includes T&T Industry
Employment plus those faceless jobs associated with:
• Industry suppliers (airline caterers, laundry services, food
suppliers, wholesalers, accounting firms, etc).
• Government agencies, manufacturing and construction of capital
goods and exported goods used in Travel & Tourism.
• Supplied commodities (steel producers, lumber, oil production,
etc).

32
Worldwide in 2004, Travel & Tourism is expected to
post US$5.5 trillion of economic activity (Total
Demand) and this is forecast to grow to US$9.6 trillion
by 2014.
Total Demand in the Caribbean region is
expected to reach US$40.3 billion in 2004, growing to
US$81.9 billion by 2014.
In 2004, the Travel & Tourism Industry should
contribute 3.8 per cent to worldwide GDP. The
broader Travel & Tourism Economy should contribute
10.4 per cent to world GDP in 2004.
In the Caribbean, the Travel & Tourism Industry is
expected to contribute 4.5 per cent to GDP in 2004
(US$8.7 billion), rising to US$18.4 billion (5.2 per
cent of total), by 2014.The Travel & Tourism Economy
contribution should grow from 14.8 per cent
(US$28.4 billion) to 16.5 per cent (US$58.5 billion)
over the same period.
Travel & Tourism is a high-growth activity, which is
forecast to increase its total economic activity by 4.5
per cent per annum worldwide in real terms over the
next ten years.
In the Caribbean,Travel & Tourism is expected to
post average annualized gains of 4.0 per cent between
2004 and 2014.
Travel & Tourism is human resource intensive, creating
quality jobs across the full employment spectrum. In
2004, one in 12.3 jobs will be generated by the Travel
& Tourism Economy. The Travel & Tourism Industry
accounts for 2.8 per cent of global employment.Today
there are 73.7 million Travel & Tourism Industry jobs
and 214.7 million jobs in the Travel & Tourism
Economy, and these will rise to 87.5 million Travel &
Tourism Industry jobs and 259.9 million Travel &
Tourism Economy jobs by 2014.
In the Caribbean, in 2004, Travel & Tourism
Economy employment is estimated at 2.4 million jobs,
or 15.5 per cent of total employment. By 2014, the
number of jobs should grow to 3.2 million – 17.1 per
cent of total employment. The 814,600 Travel &
Tourism Industry jobs will account for 5.2 per cent of
total employment in 2004 and are forecast to rise to 1.1
million jobs, or 5.9 per cent of the total, by 2014.
Travel & Tourism is a major exporter, with inbound
visitors injecting foreign exchange directly into the
economy.
In the Caribbean, exports make up the major
share of Travel & Tourism’s contribution to GDP. Of
total Caribbean exports, services and merchandise,
Travel & Tourism is expected to generate 18.4 per cent
(US$21.7 billion) in 2004, increasing to US$46.2
billion (18.7 per cent of total exports), in 2014.
Travel & Tourism is a catalyst for construction and
manufacturing. In 2004, the public and private sectors
combined are expected to spend US$802.3 billion in
new Travel & Tourism capital investment worldwide –
9.4 per cent of total investment – rising to US$1.4
trillion, or 9.9 per cent of the total, in 2014.
Capital investment in the Caribbean’s Travel &
Tourism Economy in 2004 is estimated at US$7.4
billion, or 21.7 per cent of total investment. By 2014,
this should reach US$13.7 billion, or 22.4 per cent of
the total.
Travel & Tourism is both a generator and receiver of
government funds. Globally, in 2004,Travel & Tourism
is expected to account for US$265.3 billion of
government expenditures, or 3.9 per cent of total
expenditures. By 2014, government spending on Travel
& Tourism should increase to US$398.5 billion – 4.1
per cent of total government expenditures.
Government Travel & Tourism operating
expenditures in the Caribbean in 2004 are expected to
total US$1.9 billion, or 8.2 per cent of total
government spending. In 2014, this spending is forecast
to rise to US$3.7 billion, or 8.7 per cent of total
government spending.
TRAVEL & TOURISM’SECONOMIC IMPACTTRAVEL & TOURISM – ENCOMPASSING TRANSPORT,ACCOMMODATION,CATERING, RECREATION AND SERVICES FOR VISITORS – IS THECARIBBEAN’S HIGHEST-PRIORITY INDUSTRY AND EMPLOYER.
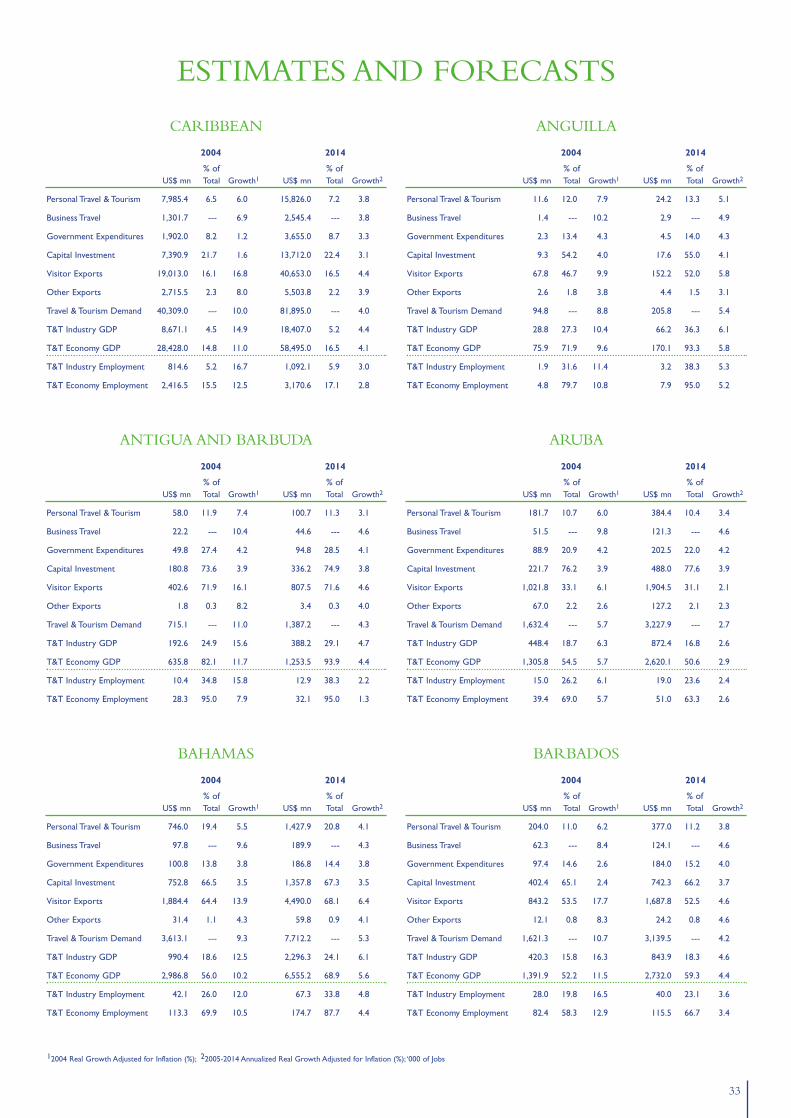
33
CARIBBEAN
2004 2014
% of % of US$ mn Total Growth1 US$ mn Total Growth2
Personal Travel & Tourism 7,985.4 6.5 6.0 15,826.0 7.2 3.8
Business Travel 1,301.7 --- 6.9 2,545.4 --- 3.8
Government Expenditures 1,902.0 8.2 1.2 3,655.0 8.7 3.3
Capital Investment 7,390.9 21.7 1.6 13,712.0 22.4 3.1
Visitor Exports 19,013.0 16.1 16.8 40,653.0 16.5 4.4
Other Exports 2,715.5 2.3 8.0 5,503.8 2.2 3.9
Travel & Tourism Demand 40,309.0 --- 10.0 81,895.0 --- 4.0
T&T Industry GDP 8,671.1 4.5 14.9 18,407.0 5.2 4.4
T&T Economy GDP 28,428.0 14.8 11.0 58,495.0 16.5 4.1
T&T Industry Employment 814.6 5.2 16.7 1,092.1 5.9 3.0
T&T Economy Employment 2,416.5 15.5 12.5 3,170.6 17.1 2.8
ANGUILLA
2004 2014
% of % of US$ mn Total Growth1 US$ mn Total Growth2
Personal Travel & Tourism 11.6 12.0 7.9 24.2 13.3 5.1
Business Travel 1.4 --- 10.2 2.9 --- 4.9
Government Expenditures 2.3 13.4 4.3 4.5 14.0 4.3
Capital Investment 9.3 54.2 4.0 17.6 55.0 4.1
Visitor Exports 67.8 46.7 9.9 152.2 52.0 5.8
Other Exports 2.6 1.8 3.8 4.4 1.5 3.1
Travel & Tourism Demand 94.8 --- 8.8 205.8 --- 5.4
T&T Industry GDP 28.8 27.3 10.4 66.2 36.3 6.1
T&T Economy GDP 75.9 71.9 9.6 170.1 93.3 5.8
T&T Industry Employment 1.9 31.6 11.4 3.2 38.3 5.3
T&T Economy Employment 4.8 79.7 10.8 7.9 95.0 5.2
ANTIGUA AND BARBUDA
2004 2014
% of % of US$ mn Total Growth1 US$ mn Total Growth2
Personal Travel & Tourism 58.0 11.9 7.4 100.7 11.3 3.1
Business Travel 22.2 --- 10.4 44.6 --- 4.6
Government Expenditures 49.8 27.4 4.2 94.8 28.5 4.1
Capital Investment 180.8 73.6 3.9 336.2 74.9 3.8
Visitor Exports 402.6 71.9 16.1 807.5 71.6 4.6
Other Exports 1.8 0.3 8.2 3.4 0.3 4.0
Travel & Tourism Demand 715.1 --- 11.0 1,387.2 --- 4.3
T&T Industry GDP 192.6 24.9 15.6 388.2 29.1 4.7
T&T Economy GDP 635.8 82.1 11.7 1,253.5 93.9 4.4
T&T Industry Employment 10.4 34.8 15.8 12.9 38.3 2.2
T&T Economy Employment 28.3 95.0 7.9 32.1 95.0 1.3
ARUBA
2004 2014
% of % of US$ mn Total Growth1 US$ mn Total Growth2
Personal Travel & Tourism 181.7 10.7 6.0 384.4 10.4 3.4
Business Travel 51.5 --- 9.8 121.3 --- 4.6
Government Expenditures 88.9 20.9 4.2 202.5 22.0 4.2
Capital Investment 221.7 76.2 3.9 488.0 77.6 3.9
Visitor Exports 1,021.8 33.1 6.1 1,904.5 31.1 2.1
Other Exports 67.0 2.2 2.6 127.2 2.1 2.3
Travel & Tourism Demand 1,632.4 --- 5.7 3,227.9 --- 2.7
T&T Industry GDP 448.4 18.7 6.3 872.4 16.8 2.6
T&T Economy GDP 1,305.8 54.5 5.7 2,620.1 50.6 2.9
T&T Industry Employment 15.0 26.2 6.1 19.0 23.6 2.4
T&T Economy Employment 39.4 69.0 5.7 51.0 63.3 2.6
BAHAMAS
2004 2014
% of % of US$ mn Total Growth1 US$ mn Total Growth2
Personal Travel & Tourism 746.0 19.4 5.5 1,427.9 20.8 4.1
Business Travel 97.8 --- 9.6 189.9 --- 4.3
Government Expenditures 100.8 13.8 3.8 186.8 14.4 3.8
Capital Investment 752.8 66.5 3.5 1,357.8 67.3 3.5
Visitor Exports 1,884.4 64.4 13.9 4,490.0 68.1 6.4
Other Exports 31.4 1.1 4.3 59.8 0.9 4.1
Travel & Tourism Demand 3,613.1 --- 9.3 7,712.2 --- 5.3
T&T Industry GDP 990.4 18.6 12.5 2,296.3 24.1 6.1
T&T Economy GDP 2,986.8 56.0 10.2 6,555.2 68.9 5.6
T&T Industry Employment 42.1 26.0 12.0 67.3 33.8 4.8
T&T Economy Employment 113.3 69.9 10.5 174.7 87.7 4.4
BARBADOS
2004 2014
% of % of US$ mn Total Growth1 US$ mn Total Growth2
Personal Travel & Tourism 204.0 11.0 6.2 377.0 11.2 3.8
Business Travel 62.3 --- 8.4 124.1 --- 4.6
Government Expenditures 97.4 14.6 2.6 184.0 15.2 4.0
Capital Investment 402.4 65.1 2.4 742.3 66.2 3.7
Visitor Exports 843.2 53.5 17.7 1,687.8 52.5 4.6
Other Exports 12.1 0.8 8.3 24.2 0.8 4.6
Travel & Tourism Demand 1,621.3 --- 10.7 3,139.5 --- 4.2
T&T Industry GDP 420.3 15.8 16.3 843.9 18.3 4.6
T&T Economy GDP 1,391.9 52.2 11.5 2,732.0 59.3 4.4
T&T Industry Employment 28.0 19.8 16.5 40.0 23.1 3.6
T&T Economy Employment 82.4 58.3 12.9 115.5 66.7 3.4
12004 Real Growth Adjusted for Inflation (%); 22005-2014 Annualized Real Growth Adjusted for Inflation (%); ‘000 of Jobs
ESTIMATES AND FORECASTS

34
BERMUDA
2004 2014
% of % of US$ mn Total Growth1 US$ mn Total Growth2
Personal Travel & Tourism 190.0 7.7 6.1 350.0 8.3 3.2
Business Travel 36.0 --- 8.6 68.1 --- 3.5
Government Expenditures 73.8 18.3 2.9 132.1 19.0 2.9
Capital Investment 267.4 45.8 2.7 468.3 46.5 2.7
Visitor Exports 394.8 23.0 13.1 905.5 29.0 5.5
Other Exports 33.9 2.0 1.8 50.3 1.6 1.0
Travel & Tourism Demand 995.9 --- 7.5 1,974.3 --- 4.0
T&T Industry GDP 194.6 6.2 12.5 442.3 8.6 5.4
T&T Economy GDP 753.1 24.1 8.4 1,552.5 30.2 4.4
T&T Industry Employment 3.2 8.7 10.5 4.8 12.1 4.0
T&T Economy Employment 10.3 27.9 7.6 14.3 36.0 3.3
BRITISH VIRGIN ISLANDS
2004 2014
% of % of US$ mn Total Growth1 US$ mn Total Growth2
Personal Travel & Tourism 74.1 49.7 8.5 162.1 63.7 5.5
Business Travel 8.1 --- 7.0 15.1 --- 3.8
Government Expenditures 8.3 26.6 -0.4 15.1 27.7 3.6
Capital Investment 33.2 53.8 -1.2 58.5 53.8 3.2
Visitor Exports 272.8 62.6 11.3 566.9 73.1 5.0
Other Exports 4.7 1.1 -0.2 5.7 0.7 -0.4
Travel & Tourism Demand 401.1 --- 9.1 823.4 --- 4.9
T&T Industry GDP 122.8 37.3 11.5 259.7 38.1 5.2
T&T Economy GDP 313.7 95.2 9.7 648.7 95.2 5.0
T&T Industry Employment 3.4 38.3 1.2 3.8 38.3 1.2
T&T Economy Employment 8.4 95.0 1.1 9.3 93.8 1.1
CAYMAN ISLANDS
2004 2014
% of % of US$ mn Total Growth1 US$ mn Total Growth2
Personal Travel & Tourism 80.0 5.1 7.8 205.4 6.3 6.7
Business Travel 34.3 --- 10.4 77.5 --- 5.3
Government Expenditures 56.9 28.9 4.7 123.7 30.3 4.9
Capital Investment 108.3 52.4 4.0 209.9 49.0 3.7
Visitor Exports 499.8 49.2 7.6 1,051.2 66.7 4.6
Other Exports 28.3 2.8 0.6 27.8 1.8 -3.1
Travel & Tourism Demand 807.7 --- 6.7 1,695.6 --- 4.6
T&T Industry GDP 220.3 12.8 8.1 479.6 13.5 5.0
T&T Economy GDP 644.4 37.6 7.1 1,358.4 38.3 4.6
T&T Industry Employment 4.2 18.0 4.4 4.7 18.9 1.2
T&T Economy Employment 11.0 47.4 3.8 12.2 48.8 1.0
CUBA
2004 2014
% of % of US$ mn Total Growth1 US$ mn Total Growth2
Personal Travel & Tourism 1,155.9 5.3 4.0 2,058.9 5.7 2.9
Business Travel 125.2 --- 7.2 227.4 --- 3.1
Government Expenditures 159.1 5.7 1.6 271.7 5.9 2.4
Capital Investment 878.0 14.9 1.4 1,469.0 15.1 2.2
Visitor Exports 2,458.6 42.0 16.0 4,902.0 44.8 4.0
Other Exports 53.3 0.9 1.2 86.9 0.8 1.9
Travel & Tourism Demand 4,830.0 --- 9.2 9,015.8 --- 3.3
T&T Industry GDP 1,135.0 4.4 15.7 2,267.7 5.7 4.1
T&T Economy GDP 3,490.6 13.7 11.6 6,681.9 16.8 3.6
T&T Industry Employment 166.9 3.9 14.2 220.2 5.0 2.8
T&T Economy Employment 505.9 11.8 10.3 640.7 14.5 2.4
CURAÇAO
2004 2014
% of % of US$ mn Total Growth1 US$ mn Total Growth2
Personal Travel & Tourism 193.6 10.1 5.4 328.3 11.9 3.4
Business Travel 74.0 --- 7.3 115.9 --- 2.6
Government Expenditures 30.2 4.8 1.5 44.7 4.9 2.0
Capital Investment 112.5 19.5 1.3 164.8 19.8 1.9
Visitor Exports 266.6 16.4 16.5 528.9 18.0 5.0
Other Exports 11.7 0.7 0.8 16.7 0.6 1.6
Travel & Tourism Demand 688.5 --- 8.6 1,199.2 --- 3.6
T&T Industry GDP 89.4 2.2 22.1 188.3 2.9 5.7
T&T Economy GDP 277.0 6.7 18.2 547.8 8.5 5.0
T&T Industry Employment 1.6 3.0 20.0 2.5 4.1 4.5
T&T Economy Employment 4.5 8.3 17.4 6.7 10.7 4.1
DOMINICA
2004 2014
% of % of US$ mn Total Growth1 US$ mn Total Growth2
Personal Travel & Tourism 18.9 10.7 7.7 32.2 11.4 3.4
Business Travel 4.0 --- 12.1 6.9 --- 3.7
Government Expenditures 3.9 6.0 5.4 6.4 6.2 3.0
Capital Investment 14.8 17.6 5.1 23.8 17.8 2.8
Visitor Exports 44.0 27.9 15.4 91.1 30.6 5.5
Other Exports 2.2 1.4 6.3 3.9 1.3 3.8
Travel & Tourism Demand 87.8 --- 11.0 164.3 --- 4.4
T&T Industry GDP 21.1 8.2 15.4 43.4 11.3 5.4
T&T Economy GDP 64.4 25.1 12.8 125.9 32.9 4.9
T&T Industry Employment 2.8 7.7 16.0 4.1 10.6 3.8
T&T Economy Employment 8.4 22.7 13.6 11.6 29.9 3.3
12004 Real Growth Adjusted for Inflation (%); 22005-2014 Annualized Real Growth Adjusted for Inflation (%); ‘000 of Jobs
ESTIMATES AND FORECASTS

35
DOMINICAN REPUBLIC
2004 2014
% of % of US$ mn Total Growth1 US$ mn Total Growth2
Personal Travel & Tourism 626.2 6.3 15.7 1,632.0 8.0 5.4
Business Travel 157.6 --- 1.2 347.3 --- 3.6
Government Expenditures 227.1 20.6 -6.0 483.2 21.6 3.3
Capital Investment 794.3 24.9 -4.1 1,641.0 25.3 3.0
Visitor Exports 3,196.9 32.4 31.2 5,890.5 33.5 1.8
Other Exports 185.6 1.9 35.1 303.8 1.7 0.6
Travel & Tourism Demand 5,187.6 --- 19.5 10,297.8 --- 2.5
T&T Industry GDP 1,406.9 8.8 23.6 2,641.2 7.5 2.0
T&T Economy GDP 4,096.4 25.5 16.7 7,810.7 22.3 2.1
T&T Industry Employment 268.9 7.7 27.0 319.1 6.6 1.7
T&T Economy Employment 772.2 22.2 20.1 930.0 19.4 1.9
GRENADA
2004 2014
% of % of US$ mn Total Growth1 US$ mn Total Growth2
Personal Travel & Tourism 33.9 10.0 7.2 67.4 11.5 5.0
Business Travel 10.7 --- 10.5 20.1 --- 4.4
Government Expenditures 8.3 11.7 4.8 14.8 12.1 3.9
Capital Investment 39.5 21.0 4.5 68.9 21.3 3.6
Visitor Exports 74.9 28.1 17.0 155.5 28.6 5.5
Other Exports 3.1 1.2 5.8 5.9 1.1 4.5
Travel & Tourism Demand 170.5 --- 10.7 332.6 --- 4.8
T&T Industry GDP 38.0 8.3 16.1 79.1 10.0 5.5
T&T Economy GDP 127.8 27.8 12.4 253.8 32.2 5.0
T&T Industry Employment 3.6 8.2 13.6 5.4 10.0 4.2
T&T Economy Employment 11.3 26.2 10.5 16.4 30.4 3.8
GUADELOUPE
2004 2014
% of % of US$ mn Total Growth1 US$ mn Total Growth2
Personal Travel & Tourism 129.4 6.7 -3.0 252.8 8.2 7.1
Business Travel 36.7 --- -0.7 64.0 --- 5.9
Government Expenditures 55.2 20.4 -5.8 91.1 21.0 5.3
Capital Investment 135.7 23.9 -5.2 191.7 21.2 3.6
Visitor Exports 454.5 29.5 0.3 1,001.8 27.0 8.5
Other Exports 61.3 4.0 -2.6 155.0 4.2 9.9
Travel & Tourism Demand 872.9 --- -1.7 1,756.4 --- 7.4
T&T Industry GDP 203.9 8.4 0.0 424.6 10.9 7.9
T&T Economy GDP 656.2 26.9 -1.4 1,288.2 33.1 7.2
T&T Industry Employment 24.9 8.2 8.7 38.8 10.7 4.6
T&T Economy Employment 76.1 25.2 7.3 112.8 31.2 4.0
HAITI
2004 2014
% of % of US$ mn Total Growth1 US$ mn Total Growth2
Personal Travel & Tourism 113.6 4.2 -6.5 166.1 4.5 1.5
Business Travel 38.3 --- -4.1 57.8 --- 1.8
Government Expenditures 4.8 2.9 -9.1 6.8 2.9 1.2
Capital Investment 34.5 4.6 -9.0 48.2 4.7 1.1
Visitor Exports 53.9 9.5 5.2 130.4 10.8 6.8
Other Exports 12.9 2.3 1.7 26.8 2.2 5.1
Travel & Tourism Demand 258.1 --- -3.9 436.1 --- 3.0
T&T Industry GDP 54.9 1.6 -4.0 104.2 2.0 4.2
T&T Economy GDP 158.5 4.5 -4.6 293.4 5.5 4.0
T&T Industry Employment 40.4 1.2 -3.2 60.8 1.5 4.2
T&T Economy Employment 118.3 3.6 -3.8 173.8 4.4 3.9
JAMAICA
2004 2014
% of % of US$ mn Total Growth1 US$ mn Total Growth2
Personal Travel & Tourism 408.8 8.4 8.8 752.9 8.8 2.6
Business Travel 154.4 --- 7.8 295.2 --- 3.0
Government Expenditures 204.9 15.8 1.7 374.3 16.4 2.5
Capital Investment 636.6 32.3 2.1 1,142.1 32.9 2.4
Visitor Exports 1,866.3 47.1 18.5 4,234.8 51.0 4.8
Other Exports 29.6 0.7 12.2 53.5 0.6 2.4
Travel & Tourism Demand 3,300.7 --- 12.0 6,852.8 --- 3.9
T&T Industry GDP 870.5 11.8 16.7 1,948.8 14.8 4.7
T&T Economy GDP 2,647.8 36.0 12.6 5,631.9 42.9 4.1
T&T Industry Employment 130.3 10.7 16.6 190.2 13.5 3.9
T&T Economy Employment 387.4 31.8 12.7 539.0 38.1 3.4
MARTINIQUE
2004 2014
% of % of US$ mn Total Growth1 US$ mn Total Growth2
Personal Travel & Tourism 381.0 5.4 -0.4 776.9 5.8 4.8
Business Travel 67.4 --- 10.2 138.3 --- 4.9
Government Expenditures 65.2 7.9 4.0 120.6 8.2 3.8
Capital Investment 333.9 18.3 3.6 604.0 18.6 3.5
Visitor Exports 352.7 12.7 15.2 595.8 11.6 2.9
Other Exports 66.1 2.4 -1.1 109.0 2.1 2.6
Travel & Tourism Demand 1,266.3 --- 5.4 2,344.6 --- 3.8
T&T Industry GDP 175.0 2.1 15.5 313.5 2.0 3.5
T&T Economy GDP 760.1 8.9 10.1 1,372.1 8.5 3.5
T&T Industry Employment 6.5 2.6 12.2 6.9 2.5 0.5
T&T Economy Employment 23.6 9.4 8.0 24.9 9.0 0.6
12004 Real Growth Adjusted for Inflation (%); 22005-2014 Annualized Real Growth Adjusted for Inflation (%); ‘000 of Jobs
ESTIMATES AND FORECASTS

36
PUERTO RICO
2004 2014
% of % of US$ mn Total Growth1 US$ mn Total Growth2
Personal Travel & Tourism 2,533.1 5.2 5.4 5,032.3 5.5 3.0
Business Travel 107.0 --- 8.3 216.3 --- 3.2
Government Expenditures 433.0 3.9 2.7 839.1 4.1 2.7
Capital Investment 1,281.2 10.5 2.5 2,425.8 10.7 2.5
Visitor Exports 3,040.6 4.3 11.6 7,464.9 5.0 5.2
Other Exports 1,637.3 2.3 6.8 3,397.7 2.3 3.4
Travel & Tourism Demand 9,032.2 --- 7.1 19,376.1 --- 3.8
T&T Industry GDP 1,239.4 1.4 11.2 2,941.8 1.7 4.9
T&T Economy GDP 4,881.6 5.3 9.2 10,881.0 6.3 4.2
T&T Industry Employment 23.3 1.6 11.2 36.9 2.1 4.8
T&T Economy Employment 83.2 5.8 8.5 121.5 7.1 3.9
SAINT KITTS AND NEVIS
2004 2014
% of % of US$ mn Total Growth1 US$ mn Total Growth2
Personal Travel & Tourism 24.9 9.3 7.6 54.4 9.0 6.0
Business Travel 10.9 --- 15.9 28.0 --- 7.8
Government Expenditures 13.3 14.4 8.8 31.6 15.2 6.9
Capital Investment 50.2 25.9 8.0 112.7 25.9 6.3
Visitor Exports 63.7 37.3 15.7 135.5 39.7 5.8
Other Exports 1.9 1.1 6.8 3.3 1.0 3.5
Travel & Tourism Demand 164.9 --- 11.3 365.6 --- 6.2
T&T Industry GDP 29.4 7.9 18.5 72.5 10.9 7.3
T&T Economy GDP 112.1 30.1 15.4 278.4 41.9 7.4
T&T Industry Employment 1.7 9.0 18.1 2.6 12.4 4.3
T&T Economy Employment 5.7 30.3 15.4 8.8 42.2 4.4
SAINT LUCIA
2004 2014
% of % of US$ mn Total Growth1 US$ mn Total Growth2
Personal Travel & Tourism 45.6 8.2 7.4 91.4 9.1 5.1
Business Travel 20.7 --- 12.4 41.6 --- 5.2
Government Expenditures 29.9 23.8 6.1 56.6 24.8 4.5
Capital Investment 91.7 43.3 5.9 171.9 44.6 4.4
Visitor Exports 265.6 65.1 17.2 550.0 56.4 5.5
Other Exports 3.7 0.9 14.1 11.0 1.1 9.2
Travel & Tourism Demand 457.2 --- 12.7 922.5 --- 5.2
T&T Industry GDP 112.2 15.6 17.9 227.8 19.2 5.3
T&T Economy GDP 345.1 47.9 14.8 686.9 58.0 5.0
T&T Industry Employment 11.2 16.5 17.9 16.8 20.4 4.2
T&T Economy Employment 32.4 47.7 15.3 47.9 57.9 4.0
ST VINCENT AND THE GRENADINES
2004 2014
% of % of US$ mn Total Growth1 US$ mn Total Growth2
Personal Travel & Tourism 20.8 7.2 6.3 36.6 6.8 3.7
Business Travel 11.2 --- 8.3 17.0 --- 2.2
Government Expenditures 9.4 8.6 2.8 15.0 8.9 2.8
Capital Investment 50.6 36.7 5.1 95.7 37.0 4.5
Visitor Exports 87.9 43.0 14.0 148.6 40.6 3.3
Other Exports 1.5 0.7 2.8 2.4 0.6 2.5
Travel & Tourism Demand 181.5 --- 9.5 315.2 --- 3.6
T&T Industry GDP 39.1 10.0 14.8 67.6 10.1 3.6
T&T Economy GDP 133.8 34.1 11.7 239.3 35.8 3.9
T&T Industry Employment 4.3 9.2 12.7 4.7 9.4 1.1
T&T Economy Employment 14.1 30.4 9.8 16.2 31.9 1.4
TRINIDAD AND TOBAGO
2004 2014
% of % of US$ mn Total Growth1 US$ mn Total Growth2
Personal Travel & Tourism 443.7 7.1 6.6 842.1 8.3 4.7
Business Travel 110.3 --- 9.5 196.7 --- 4.0
Government Expenditures 48.1 4.1 3.8 81.3 4.2 3.5
Capital Investment 411.5 18.4 4.0 769.5 21.0 4.5
Visitor Exports 407.7 6.5 13.3 859.5 5.9 5.8
Other Exports 412.8 6.6 6.5 932.7 6.4 6.5
Travel & Tourism Demand 1,834.0 --- 7.5 3,681.7 --- 5.3
T&T Industry GDP 244.7 2.3 10.4 435.5 2.5 4.0
T&T Economy GDP 1,147.5 10.8 8.1 2,115.5 12.1 4.4
T&T Industry Employment 14.4 2.6 8.3 19.1 2.8 2.9
T&T Economy Employment 58.5 10.4 6.3 79.8 11.7 3.2
US VIRGIN ISLANDS
2004 2014
% of % of US$ mn Total Growth1 US$ mn Total Growth2
Personal Travel & Tourism 310.7 9.8 3.8 669.6 10.6 3.8
Business Travel 59.8 --- 9.1 129.5 --- 3.9
Government Expenditures 131.6 19.5 3.5 274.2 20.5 3.5
Capital Investment 550.0 61.6 3.1 1,104.1 62.2 3.1
Visitor Exports 992.4 35.9 10.4 2,398.9 41.6 5.1
Other Exports 50.8 1.8 2.5 92.5 1.6 2.1
Travel & Tourism Demand 2,095.3 --- 6.7 4,668.7 --- 4.2
T&T Industry GDP 393.5 8.8 11.6 1,002.7 11.3 5.6
T&T Economy GDP 1,421.4 31.9 8.8 3,397.6 38.3 4.9
T&T Industry Employment 5.6 12.3 9.8 8.1 15.8 3.9
T&T Economy Employment 17.0 37.6 7.8 23.7 46.1 3.4
12004 Real Growth Adjusted for Inflation (%); 22005-2014 Annualized Real Growth Adjusted for Inflation (%); ‘000 of Jobs
ESTIMATES AND FORECASTS


38
TOTAL DEMANDTravel & Tourism in the Caribbean economies is expected to generate
US$40.3 billion of economic activity (Total Demand) in 2004. This
represents an expected real growth of 10.0 per cent over 2003’s level.
More importantly, it reflects a robust return to growth following
several years of poor results that began in 2001 due to the events of 11
September and the depressed economic situation in key source
markets.
Travel & Tourism Demand is an aggregate measure of Travel &
Tourism economic activity that combines personal Travel & Tourism,
business travel (government and corporate), government expenditures to
support Travel & Tourism activities, traditional visitor exports, and
merchandise exports (consumer and capital goods) shipped abroad for
use by visitors or Travel & Tourism companies.
The largest Caribbean Travel & Tourism economy is Puerto Rico,
which is expected to generate US$9.0 billion of total demand in 2004
and account for 22.4 per cent of the region’s Travel & Tourism activity.
Second in size is the Dominican Republic with an estimated US$5.2
billion of Total Demand, followed by Cuba with US$4.8 billion, the
Bahamas with US$3.6 billion and Jamaica with US$3.3 billion. These
five economies combined account for nearly two-thirds (64.4 per cent)
of total Caribbean Travel & Tourism.
Over the next ten years, to 2014, the expected annual growth rates
for the different Caribbean islands (in terms of Travel & Tourism
Demand) range from 2.5 per cent for the Dominican Republic and 2.7
per cent for Aruba, at the low end of the scale, to 7.4 per cent and 6.2
per cent respectively for Guadeloupe and St Kitts and Nevis at the top
of the scale. Average growth for the Caribbean region as a whole is
expected to total 4.0 per cent over the period.
Each of the Caribbean economies reflects a unique combination
of Travel & Tourism Demand, as illustrated in the pie charts below
(Total Demand Components). First, the region includes countries such
as Antigua and Barbuda, where the spending of island residents
(Personal Travel & Tourism) plays a very small part in the islands’Travel
& Tourism economies. In Haiti the opposite is true. The situation is
similar with regard to Puerto Rico’s spending on Business Travel by
resident companies and government agencies, which represents a
minor contribution to Puerto Rico’s Travel & Tourism economy. In
contrast, again, Business Travel by residents is an important component
of Total Demand.
With regard to Travel & Tourism Capital Investment in 2004, the
British Virgin Islands reports the lowest share of Total Demand, while St
Kitts and Nevis has the highest share. Perhaps the most interesting
measure for Caribbean Travel & Tourism is the ratio of Visitor Exports
to Total Demand.With regard to this tourism indicator, Haiti is clearly
the least dependent on inbound visitors for its Travel & Tourism
economy, while Anguilla is clearly the most dependent on inbound
tourism. Finally, one interesting case worth noting, when looking at the
breakdown of Total Demand in the Caribbean, is that of Trinidad and
Tobago, where energy exports constitute a large portion of their Travel
& Tourism ‘Other Exports’.
CARIBBEAN
BAHAMAS
CAYMAN ISLANDS
ANGUILLA
BARBADOS
CUBA
ANTIGUA AND BARBUDA
BERMUDA
CURAÇAO
ARUBA
BRITISH VIRGIN ISLANDS
DOMINICA
Travel & Tourism Demand Components 2004
■ Personal Travel & Tourism ■ Business Travel ■ Government Expenditures ■ Capital Investment ■ Visitor Exports ■ Other Exports

39
DOMINICAN REPUBLIC
SAINT LUCIA
JAMAICA
GRENADA
ST VINCENT AND THE GRENADINES
MARTINIQUE
GUADELOUPE
TRINIDAD AND TOBAGO
PUERTO RICO
HAITI
US VIRGIN ISLANDS
SAINT KITTS AND NEVIS
Virgin IslandsTrinidad and Tobago
St Vincent and the GrenadinesSaint Lucia
Saint Kitts and NevisPuerto RicoMartinique
JamaicaHaiti
GuadeloupeGrenada
Dominican RepublicDominicaCuraçao
CubaCayman Islands
British Virgin IslandsBermudaBarbadosBahamas
ArubaAntigua and Barbuda
Anguilla 94.8715.1
1,632.43,613.1
1,621.3995.9
401.1807.7
4,830688.5
87.85,187.6
170.5872.9
258.13,300.7
1,266.39,032.2
164.9457.2
181.51,834
2,095.3
CARIBBEAN COUNTRIESTravel & Tourism Total Demand(2004 Est. US$ mn)
Puerto Rico
Dominican Republic
Cuba
Bahamas
Jamaica
US Virgin IslandsTrinidad and TobagoArubaBarbadosMartiniqueBermudaGuadeloupeCayman IslandsAntigua and BarbudaCuraçaoSaint LuciaBritish Virgin IslandsHaitiSt Vincent and the Grenadines
GrenadaSaint Kitts and NevisAnguillaDominica
CARIBBEAN COUNTRIESTravel & Tourism Total Demand(Market Share)
Virgin IslandsTrinidad and Tobago
St Vincent and the GrenadinesSaint Lucia
Saint Kitts and NevisPuerto RicoMartinique
JamaicaHaiti
GuadeloupeGrenada
Dominican RepublicDominicaCuraçao
CubaCayman Islands
British Virgin IslandsBermudaBarbadosBahamas
ArubaAntigua and Barbuda
Anguilla 5.44.3
2.75.3
4.24.0
4.94.6
3.33.6
4.42.5
4.87.4
3.03.9
3.83.8
6.25.2
3.65.3
4.2
CARIBBEAN COUNTRIESTravel & Tourism Total Demand(2005-2014 Real Growth Annualized, %)

40
EMPLOYMENTTourism Satellite Accounting quantifies Travel & Tourism Employment
in two different ways. First, it measures Travel & Tourism Industry
employment – employment which is directly associated with Travel &
Tourism consumption (ie visitor expenditures). In 2004, we expect the
Caribbean economies to produce 814,600 Travel & Tourism Industry
jobs. These will represent 5.2 per cent of total Caribbean economy
employment. Second, there is Travel & Tourism Economy employment
– that which is indirectly, as well as directly, associated with Travel &
Tourism Demand, which includes Travel & Tourism consumption, as
well as capital investment, government expenditures and other exports.
This latter definition is the broader and more comprehensive
measure of Travel & Tourism generated employment. In 2004,
WTTC/OEF estimate that 2.4 million Caribbean jobs will result from
Travel & Tourism Demand. These jobs will represent 15.5 per cent of
total employment in the region.
Our comparative analysis highlights the vast differences from one
island in the Caribbean to another, in terms of employment numbers.
The Caribbean economy with the largest number of Travel & Tourism
Economy jobs is the Dominican Republic, with 772,200. Cuba ranks in
second position with 505,900, followed by Jamaica with 387,400.These
three Travel & Tourism economies combined account for more than
two-thirds (68.9 per cent) of Caribbean Travel & Tourism Economy
employment.
A second measure of Travel & Tourism’s importance in terms of
jobs generated is the share of Travel & Tourism in total employment.
Antigua/Barbuda and the British Virgin Islands head the ranking for this
measure with 95.0 per cent of their total employment produced directly
or indirectly by the Travel & Tourism Economy. Next in line is Anguilla
with 79.7 per cent of total employment in Travel & Tourism. Other
nations for which a majority of jobs (ie more than 50 per cent) are
associated with Travel & Tourism include Aruba, the Bahamas and
Barbados.Travel & Tourism employment in the Cayman Islands and St
Lucia falls just short of the 50 per cent threshold, accounting for 47.4
per cent and 47.7 per cent of total employment in each of the countries
respectively.
Over the next ten years,Travel & Tourism employment is expected
to grow fastest in Anguilla at a compound annual rate of 5.2 per cent
per annum. Following closely behind will be the Bahamas and St Kitts
and Nevis, building their Travel & Tourism Economy jobs total by 4.4
per cent per annum.Three other nations – Curaçao, Guadeloupe and St
Lucia – are also expected to grow their Travel & Tourism Economy
employment by 4.0 per cent or more annually.
The charts at the bottom of both pages illustrate the complete
history and forecasts of Travel & Tourism Economy employment growth
for each country beginning in 1988.The stories of employment growth
are as diverse as the individual Caribbean economies. First there are
countries such as Aruba, the Bahamas, the British Virgin Islands, Cuba
and Dominica with largely consistent, as well as steady growth, while
there are others like Curaçao and Haiti with significant annual swings –
both positive and negative – throughout their history. Finally, there are
a number of Caribbean economies, such as Bermuda, St Kitts and Nevis,
St Vincent and the Grenadines, and the US Virgin Islands, that have
suffered several years of employment declines due to lost business or
productivity gains.
1990 1994 1998 2002 2006 2010 2014-100
-50
0
50
100
150
200
CARIBBEAN
1990 1994 1998 2002 2006 2010 2014-100
-50
0
50
100
150
200
BAHAMAS
1990 1994 1998 2002 2006 2010 2014-100
-50
0
50
100
150
200
CAYMAN ISLANDS
1990 1994 1998 2002 2006 2010 2014-100
-50
0
50
100
150
200
ANGUILLA
1990 1994 1998 2002 2006 2010 2014-100
-50
0
50
100
150
200
BARBADOS
1990 1994 1998 2002 2006 2010 2014-100
-50
0
50
100
150
200
CUBA
1990 1994 1998 2002 2006 2010 2014-100
-50
0
50
100
150
200
ANTIGUA AND BARBUDA
1990 1994 1998 2002 2006 2010 2014-100
-50
0
50
100
150
200
BERMUDA
1990 1994 1998 2002 2006 2010 2014-100
-50
0
50
100
150
200
CURAÇAO
1990 1994 1998 2002 2006 2010 2014-100
-50
0
50
100
150
200
ARUBA
1990 1994 1998 2002 2006 2010 2014-100
-50
0
50
100
150
200
BRITISH VIRGIN ISLANDS
1990 1994 1998 2002 2006 2010 2014-100
-50
0
50
100
150
200
DOMINICA
Travel & Tourism Economy Employment (Cumulative Growth, %)

41
1990 1994 1998 2002 2006 2010 2014-100
-50
0
50
100
150
200
DOMINICAN REPUBLIC
1990 1994 1998 2002 2006 2010 2014-100
-50
0
50
100
150
200
SAINT LUCIA
1990 1994 1998 2002 2006 2010 2014-100
-50
0
50
100
150
200
JAMAICA
1990 1994 1998 2002 2006 2010 2014-100
-50
0
50
100
150
200
GRENADA
1990 1994 1998 2002 2006 2010 2014-100
-50
0
50
100
150
200
ST VINCENT AND THE GRENADINES
1990 1994 1998 2002 2006 2010 2014-100
-50
0
50
100
150
200
MARTINIQUE
1990 1994 1998 2002 2006 2010 2014-100
-50
0
50
100
150
200
GUADELOUPE
1990 1994 1998 2002 2006 2010 2014-100
-50
0
50
100
150
200
TRINIDAD AND TOBAGO
1990 1994 1998 2002 2006 2010 2014-100
-50
0
50
100
150
200
PUERTO RICO
1990 1994 1998 2002 2006 2010 2014-100
-50
0
50
100
150
200
HAITI
1990 1994 1998 2002 2006 2010 2014-100
-50
0
50
100
150
200
US VIRGIN ISLANDS
1990 1994 1998 2002 2006 2010 2014-100
-50
0
50
100
150
200
SAINT KITTS AND NEVIS
0 100 200 300 400 500 600 700 800US Virgin Islands
Trinidad and TobagoSt Vincent and the Grenadines
Saint LuciaSaint Kitts and Nevis
Puerto RicoMartinique
JamaicaHaiti
GuadeloupeGrenada
Dominican RepublicDominicaCuraçao
CubaCayman Islands
British Virgin IslandsBermudaBarbadosBahamas
ArubaAntigua and Barbuda
Anguilla
Economy Industry
CARIBBEAN COUNTRIESTravel & Tourism Employment(‘000 Jobs)
0 10 20 30 40 50 60 70 80 90 100US Virgin Islands
Trinidad and TobagoSt Vincent and the Grenadines
Saint LuciaSaint Kitts and Nevis
Puerto RicoMartinique
JamaicaHaiti
GuadeloupeGrenada
Dominican RepublicDominicaCuraçao
CubaCayman Islands
British Virgin IslandsBermudaBarbadosBahamas
ArubaAntigua and Barbuda
Anguilla
Economy Industry
CARIBBEAN COUNTRIESTravel & Tourism Employment(% of Total Employment)
5.21.3
2.64.4
3.43.3
1.11.0
2.44.1
3.31.9
3.84.0
3.93.4
0.63.9
4.44.0
1.43.2
3.4US Virgin IslandsTrinidad and Tobago
St Vincent and the GrenadinesSaint Lucia
Saint Kitts and NevisPuerto RicoMartinique
JamaicaHaiti
GuadeloupeGrenada
Dominican RepublicDominicaCuraçao
CubaCayman Islands
British Virgin IslandsBermudaBarbadosBahamas
ArubaAntigua and Barbuda
Anguilla
CARIBBEAN COUNTRIESTravel & Tourism Employment(2005-2014 Growth Annualized, %)

42
GROSS DOMESTIC PRODUCTAs is the case with employment, there are two sides of Travel & Tourism
Gross Domestic Product (GDP) quantified by the Tourism Satellite
Account. First there is Travel & Tourism Industry GDP – that which is
directly associated with Travel & Tourism consumption (ie visitor
expenditures). In 2004, we expect the Caribbean economies to generate
US$8.7 billion of Travel & Tourism Industry value added or GDP.This
represents 4.5 per cent of total Caribbean GDP.
Again, as with employment, the second measure is that of Travel
& Tourism Economy GDP – or GDP that is directly and indirectly
associated with Travel & Tourism Demand, including Travel & Tourism
consumption, capital investment, government expenditures and other
exports. By definition and design, this is the broader and more
comprehensive measure of Travel & Tourism GDP. In 2004,
WTTC/OEF estimate that US$28.4 billion of Caribbean GDP will
result from Travel & Tourism Demand.This broader figure represents
14.8 per cent of total value added (GDP) in the Caribbean
economies.
For the purposes of comparative analysis, Caribbean nations can be
ranked in absolute and relative terms for Travel & Tourism GDP. First,
the Caribbean economy with the largest Travel & Tourism GDP impact
in US dollars is Puerto Rico – with US$4.9 billion expected for 2004.
The Dominican Republic follows in second place with US$4.1 billion
of Travel & Tourism Economy GDP, ahead of the Bahamas, Cuba and
Jamaica with more than US$2.5 billion each.
On a relative scale, the ranking is different. In 2004 we expect the
British Virgin Islands to post the highest relative GDP contribution from
the Travel & Tourism Economy at 95.2 per cent.Also in the top tier are
Antigua and Barbuda and Anguilla, with shares of 82.1 per cent and 71.9
per cent respectively. Among the remaining Caribbean nations Aruba,
the Bahamas and Barbados also owe more than half their economies to
Travel & Tourism.
For the forecast period (2005 to 2014),Travel & Tourism GDP is
expected to grow fastest in St Kitts and Nevis at an annualized growth
rate of 7.4 per cent.Also in this top tier of growth is Guadeloupe, which
is projected to see 7.2 per cent Travel & Tourism GDP growth per
annum, with Anguilla forecast at 5.8 per cent per annum and the
Bahamas at 5.6 per cent.
The cumulative growth analysis at the bottom of both pages shows
the historical and forecast growth for each Caribbean country’s Travel &
Tourism Economy GDP – figures that reveal some remarkable stories.
Immediately apparent is the large number of success stories, including
those related to Aruba, Cuba, Curaçao, the Dominican Republic,
Grenada and Jamaica.
But it is also easy to recognize those nations that have suffered from
different events such as hurricanes or 11 September 2001, as well as
identify clearly how these affected their Travel & Tourism GDP results.
The impact of 11 September was very marked in several countries. But
despite the negative influences of the past, the outlook for Travel &
Tourism GDP in all Caribbean countries over the next decade is
extremely positive.
1990 1994 1998 2002 2006 2010 2014-50
0
50
100
150
200
CARIBBEAN
1990 1994 1998 2002 2006 2010 2014-50
0
50
100
150
200
BAHAMAS
1990 1994 1998 2002 2006 2010 2014-50
0
50
100
150
200
CAYMAN ISLANDS
1990 1994 1998 2002 2006 2010 2014-50
0
50
100
150
200
ANGUILLA
1990 1994 1998 2002 2006 2010 2014-50
0
50
100
150
200
BARBADOS
1990 1994 1998 2002 2006 2010 2014-50
0
50
100
150
200
CUBA
1990 1994 1998 2002 2006 2010 2014-50
0
50
100
150
200
ANTIGUA AND BARBUDA
1990 1994 1998 2002 2006 2010 2014-50
0
50
100
150
200
BERMUDA
1990 1994 1998 2002 2006 2010 2014-50
0
50
100
150
200
CURAÇAO
1990 1994 1998 2002 2006 2010 2014-50
0
50
100
150
200
ARUBA
1990 1994 1998 2002 2006 2010 2014-50
0
50
100
150
200
BRITISH VIRGIN ISLANDS
1990 1994 1998 2002 2006 2010 2014-50
0
50
100
150
200
DOMINICA
Travel & Tourism Economy GDP (Cumulative Real Growth, %)

43
1990 1994 1998 2002 2006 2010 2014-50
0
50
100
150
200
DOMINICAN REPUBLIC
1990 1994 1998 2002 2006 2010 2014-50
0
50
100
150
200
SAINT LUCIA
1990 1994 1998 2002 2006 2010 2014-50
0
50
100
150
200
JAMAICA
1990 1994 1998 2002 2006 2010 2014-50
0
50
100
150
200
GRENADA
1990 1994 1998 2002 2006 2010 2014-50
0
50
100
150
200
ST VINCENT AND THE GRENADINES
1990 1994 1998 2002 2006 2010 2014-50
0
50
100
150
200
MARTINIQUE
1990 1994 1998 2002 2006 2010 2014-50
0
50
100
150
200
GUADELOUPE
1990 1994 1998 2002 2006 2010 2014-50
0
50
100
150
200
TRINIDAD AND TOBAGO
1990 1994 1998 2002 2006 2010 2014-50
0
50
100
150
200
PUERTO RICO
1990 1994 1998 2002 2006 2010 2014-50
0
50
100
150
200
HAITI
1990 1994 1998 2002 2006 2010 2014-50
0
50
100
150
200
US VIRGIN ISLANDS
1990 1994 1998 2002 2006 2010 2014-50
0
50
100
150
200
SAINT KITTS AND NEVIS
0 500 1,000 1,500 2,000 2,500 3,000 3,500 4,000 4,500 5,000
US Virgin IslandsTrinidad and Tobago
St Vincent and the GrenadinesSaint Lucia
Saint Kitts and NevisPuerto RicoMartinique
JamaicaHaiti
GuadeloupeGrenada
Dominican RepublicDominicaCuraçao
CubaCayman Islands
British Virgin IslandsBermudaBarbadosBahamas
ArubaAntigua and Barbuda
Anguilla
Economy Industry
CARIBBEAN COUNTRIESTravel & Tourism Gross Domestic Product(US$ mn)
0 10 20 30 40 50 60 70 80 90 100US Virgin Islands
Trinidad and TobagoSt Vincent and the Grenadines
Saint LuciaSaint Kitts and Nevis
Puerto RicoMartinique
JamaicaHaiti
GuadeloupeGrenada
Dominican RepublicDominicaCuraçao
CubaCayman Islands
British Virgin IslandsBermudaBarbadosBahamas
ArubaAntigua and Barbuda
Anguilla
Economy Industry
CARIBBEAN COUNTRIESTravel & Tourism Gross Domestic Product(% of Total GDP)
5.84.4
2.95.6
4.44.4
5.04.6
3.65.0
4.92.1
5.07.2
4.04.1
3.54.2
7.45.0
3.94.4
4.9US Virgin IslandsTrinidad and Tobago
St Vincent and the GrenadinesSaint Lucia
Saint Kitts and NevisPuerto RicoMartinique
JamaicaHaiti
GuadeloupeGrenada
Dominican RepublicDominicaCuraçao
CubaCayman Islands
British Virgin IslandsBermudaBarbadosBahamas
ArubaAntigua and Barbuda
Anguilla
CARIBBEAN COUNTRIESTravel & Tourism Economy Gross Domestic Product(2005-2014 Real Growth Annualized, %)
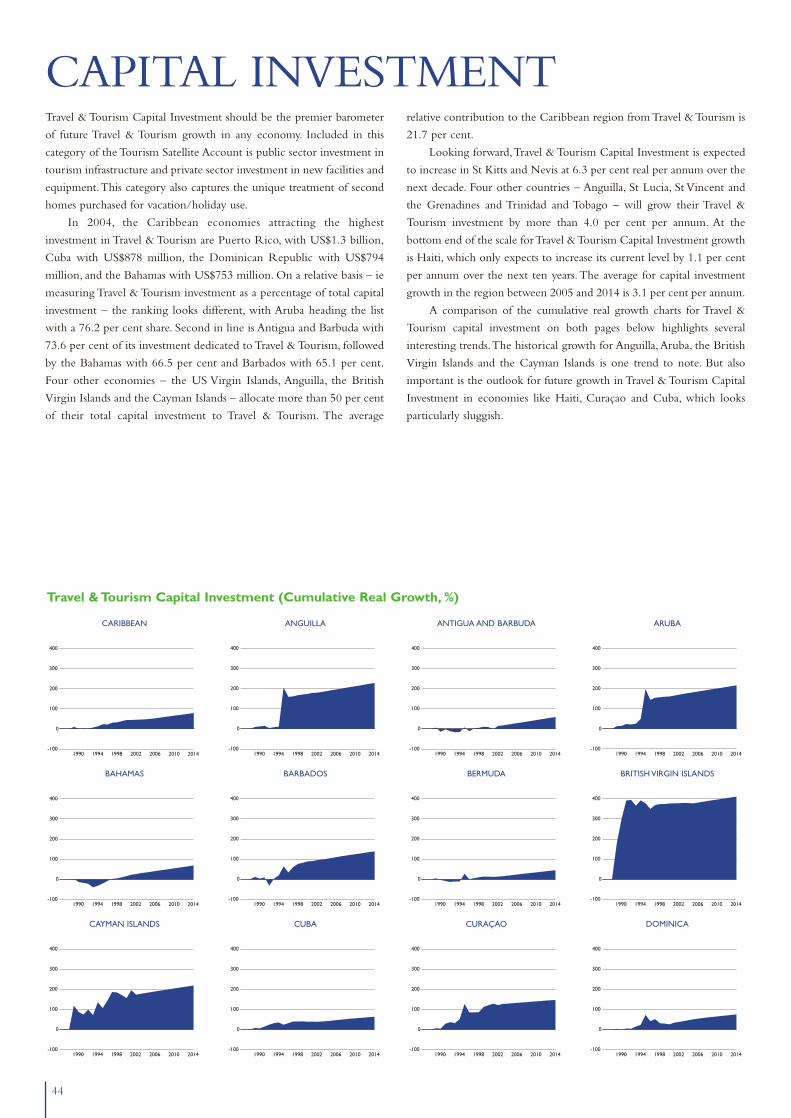
44
CAPITAL INVESTMENTTravel & Tourism Capital Investment should be the premier barometer
of future Travel & Tourism growth in any economy. Included in this
category of the Tourism Satellite Account is public sector investment in
tourism infrastructure and private sector investment in new facilities and
equipment.This category also captures the unique treatment of second
homes purchased for vacation/holiday use.
In 2004, the Caribbean economies attracting the highest
investment in Travel & Tourism are Puerto Rico, with US$1.3 billion,
Cuba with US$878 million, the Dominican Republic with US$794
million, and the Bahamas with US$753 million. On a relative basis – ie
measuring Travel & Tourism investment as a percentage of total capital
investment – the ranking looks different, with Aruba heading the list
with a 76.2 per cent share. Second in line is Antigua and Barbuda with
73.6 per cent of its investment dedicated to Travel & Tourism, followed
by the Bahamas with 66.5 per cent and Barbados with 65.1 per cent.
Four other economies – the US Virgin Islands, Anguilla, the British
Virgin Islands and the Cayman Islands – allocate more than 50 per cent
of their total capital investment to Travel & Tourism. The average
relative contribution to the Caribbean region from Travel & Tourism is
21.7 per cent.
Looking forward,Travel & Tourism Capital Investment is expected
to increase in St Kitts and Nevis at 6.3 per cent real per annum over the
next decade. Four other countries – Anguilla, St Lucia, St Vincent and
the Grenadines and Trinidad and Tobago – will grow their Travel &
Tourism investment by more than 4.0 per cent per annum. At the
bottom end of the scale for Travel & Tourism Capital Investment growth
is Haiti, which only expects to increase its current level by 1.1 per cent
per annum over the next ten years.The average for capital investment
growth in the region between 2005 and 2014 is 3.1 per cent per annum.
A comparison of the cumulative real growth charts for Travel &
Tourism capital investment on both pages below highlights several
interesting trends.The historical growth for Anguilla,Aruba, the British
Virgin Islands and the Cayman Islands is one trend to note. But also
important is the outlook for future growth in Travel & Tourism Capital
Investment in economies like Haiti, Curaçao and Cuba, which looks
particularly sluggish.
1990 1994 1998 2002 2006 2010 2014-100
0
100
200
300
400
CARIBBEAN
1990 1994 1998 2002 2006 2010 2014-100
0
100
200
300
400
BAHAMAS
1990 1994 1998 2002 2006 2010 2014-100
0
100
200
300
400
CAYMAN ISLANDS
1990 1994 1998 2002 2006 2010 2014-100
0
100
200
300
400
ANGUILLA
1990 1994 1998 2002 2006 2010 2014-100
0
100
200
300
400
BARBADOS
1990 1994 1998 2002 2006 2010 2014-100
0
100
200
300
400
CUBA
1990 1994 1998 2002 2006 2010 2014-100
0
100
200
300
400
ANTIGUA AND BARBUDA
1990 1994 1998 2002 2006 2010 2014-100
0
100
200
300
400
BERMUDA
1990 1994 1998 2002 2006 2010 2014-100
0
100
200
300
400
CURAÇAO
1990 1994 1998 2002 2006 2010 2014-100
0
100
200
300
400
ARUBA
1990 1994 1998 2002 2006 2010 2014-100
0
100
200
300
400
BRITISH VIRGIN ISLANDS
1990 1994 1998 2002 2006 2010 2014-100
0
100
200
300
400
DOMINICA
Travel & Tourism Capital Investment (Cumulative Real Growth, %)

45
1990 1994 1998 2002 2006 2010 2014-100
0
100
200
300
400
DOMINICAN REPUBLIC
1990 1994 1998 2002 2006 2010 2014-100
0
100
200
300
400
SAINT LUCIA
1990 1994 1998 2002 2006 2010 2014-100
0
100
200
300
400
JAMAICA
1990 1994 1998 2002 2006 2010 2014-100
0
100
200
300
400
GRENADA
1990 1994 1998 2002 2006 2010 2014-100
0
100
200
300
400
ST VINCENT AND THE GRENADINES
1990 1994 1998 2002 2006 2010 2014-100
0
100
200
300
400
MARTINIQUE
1990 1994 1998 2002 2006 2010 2014-100
0
100
200
300
400
GUADELOUPE
1990 1994 1998 2002 2006 2010 2014-100
0
100
200
300
400
TRINIDAD AND TOBAGO
1990 1994 1998 2002 2006 2010 2014-100
0
100
200
300
400
PUERTO RICO
1990 1994 1998 2002 2006 2010 2014-100
0
100
200
300
400
HAITI
1990 1994 1998 2002 2006 2010 2014-100
0
100
200
300
400
US VIRGIN ISLANDS
1990 1994 1998 2002 2006 2010 2014-100
0
100
200
300
400
SAINT KITTS AND NEVIS
US Virgin IslandsTrinidad and Tobago
St Vincent and the GrenadinesSaint Lucia
Saint Kitts and NevisPuerto RicoMartinique
JamaicaHaiti
GuadeloupeGrenada
Dominican RepublicDominicaCuraçao
CubaCayman Islands
British Virgin IslandsBermudaBarbadosBahamas
ArubaAntigua and Barbuda
Anguilla 9.3180.8
221.7752.8
402.4267.4
33.2108.3
878.0112.5
14.8794.3
39.5135.7
34.5636.6
333.91,281.2
50.291.7
50.6411.5
550.0
CARIBBEAN COUNTRIESTravel & Tourism Capital Investment(US$ mn)
US Virgin IslandsTrinidad and Tobago
St Vincent and the GrenadinesSaint Lucia
Saint Kitts and NevisPuerto RicoMartinique
JamaicaHaiti
GuadeloupeGrenada
Dominican RepublicDominicaCuraçao
CubaCayman Islands
British Virgin IslandsBermudaBarbadosBahamas
ArubaAntigua and Barbuda
Anguilla 54.273.6
76.266.5
65.145.8
53.852.4
14.919.5
17. 624.9
21. 023.9
4.632. 3
18.310. 5
25.943.3
36.718. 4
61.6
CARIBBEAN COUNTRIESTravel & Tourism Capital Investment(% of Total)
US Virgin IslandsTrinidad and Tobago
St Vincent and the GrenadinesSaint Lucia
Saint Kitts and NevisPuerto RicoMartinique
JamaicaHaiti
GuadeloupeGrenada
Dominican RepublicDominicaCuraçao
CubaCayman Islands
British Virgin IslandsBermudaBarbadosBahamas
ArubaAntigua and Barbuda
Anguilla 4.13.83.9
3.53.7
2.73.2
3.72.2
1.92.8
3.03.63.6
1.12.4
3.52.5
6.34.44.54.5
3.1
CARIBBEAN COUNTRIESTravel & Tourism Capital Investment(2005-2014 Real Growth Annualized, %)

46
PERSONAL & BUSINESS.
1990 1994 1998 2002 2006 2010 2014-50
0
50
100
150
200
250
300
CARIBBEAN
1990 1994 1998 2002 2006 2010 2014-50
0
50
100
150
200
250
300
BAHAMAS
1990 1994 1998 2002 2006 2010 2014-50
0
50
100
150
200
250
300
CAYMAN ISLANDS
1990 1994 1998 2002 2006 2010 2014-50
0
50
100
150
200
250
300
ANGUILLA
1990 1994 1998 2002 2006 2010 201 4-50
0
50
100
150
200
250
300
BARBADOS
1990 1994 1998 2002 2006 2010 2014-50
0
50
100
150
200
250
300
CUBA
1990 1994 1998 2002 2006 2010 2014-50
0
50
100
150
200
250
300
ANTIGUA AND BARBUDA
1990 1994 1998 2002 2006 2010 2014-50
0
50
100
150
200
250
300
BERMUDA
1990 1994 1998 2002 2006 2010 2014-50
0
50
100
150
200
250
300
CURAÇAO
1990 1994 1998 2002 2006 2010 2014-50
0
50
100
150
200
250
300
ARUBA
1990 1994 1998 2002 2006 2010 201 4-50
0
50
100
150
200
250
300
BRITISH VIRGIN ISLANDS
1990 1994 1998 2002 2006 2010 201 4-50
0
50
100
150
200
250
300
DOMINICA
Personal Travel & Tourism (Cumulative Real Growth, %)
Personal Travel & Tourism reflects spending by Caribbean residents on
domestic and international Travel & Tourism, and includes both
traditional travel services such as airlines, car rental, hotels, meals and
entertainment, as well as the purchase of merchandise (shopping) while
on a trip, and durable and non-durable goods purchased before or after
a trip as a function of the trip. This category of Travel & Tourism
Demand is therefore one of the broadest and most flexible, and depends
entirely on the spending habits of each country’s population.
Business Travel & Tourism on the other hand is spending by
resident companies and government agencies on domestic and
international business travel for their employees. Again, the list of
expenditure can include both services and merchandise, but it is
typically focused on traditional travel service activities.
As most people would expect, the Caribbean economy with the
highest volume of Personal and Business Travel & Tourism is the region’s
largest economy, Puerto Rico. Second in the ranking is Cuba, followed
by the Bahamas and the Dominican Republic.
The ranking of Caribbean economies’ Personal Travel & Tourism as
a function of total personal consumption suggests that, as an economy
becomes more developed, the relative spending by residents on Travel &
Tourism increases. The leading Caribbean economies in terms of
Personal Travel & Tourism (as a percentage of total consumption)
include the British Virgin Islands, with Travel & Tourism at 49.7 per cent
of total consumption, and the Bahamas with 19.4 per cent. At the
opposite end of the scale is Haiti at only 4.2 per cent.The average for
all Caribbean economies is 6.5 per cent.
Caribbean economies such as the British Virgin Islands and the
Bahamas reflect a unique phenomenon relative to this category because,
in some cases, the Personal Travel & Tourism concept includes spending
abroad on consumer goods, rather than souvenirs and gifts, that would
normally be purchased within the usual environment and not included
as Personal Travel & Tourism. This happens in the Caribbean, because
the availability of these consumer goods locally is limited and, by
purchasing them abroad on trips, they qualify under the rules of the TSA
as Personal Travel & Tourism.
The WTTC/OEF forecasts for Personal Travel & Tourism over the
coming decade show that major gains will be made in Guadeloupe
(growth of 7.1 per cent per annum), the Cayman Islands (6.7 per cent
per annum) and St Kitts and Nevis (6.0 per cent).
The cumulative real growth charts below (Personal Travel &
Tourism) clearly highlight those Caribbean economies that have made
significant strides over the past 16 years – including Aruba, the British
Virgin Islands, the Cayman Islands, Dominica, Guadeloupe and
Martinique.

47
1990 1994 1998 2002 2006 2010 2014-50
0
50
100
150
200
250
300
DOMINICAN REPUBLIC
1990 1994 1998 2002 2006 2010 2014-50
0
50
100
150
200
250
300
SAINT LUCIA
1990 1994 1998 2002 2006 2010 2014-50
0
50
100
150
200
250
300
JAMAICA
1990 1994 1998 2002 2006 2010 2014-50
0
50
100
150
200
250
300
GRENADA
1990 1994 1998 2002 2006 2010 2014-50
0
50
100
150
200
250
300
ST VINCENT AND THE GRENADINES
1990 1994 1998 2002 2006 2010 2014-50
0
50
100
150
200
250
300
MARTINIQUE
1990 1994 1998 2002 2006 2010 2014-50
0
50
100
150
200
250
300
GUADELOUPE
1990 1994 1998 2002 2006 2010 2014-50
0
50
100
150
200
250
300
TRINIDAD AND TOBAGO
1990 1994 1998 2002 2006 2010 2014-50
0
50
100
150
200
250
300
PUERTO RICO
1990 1994 1998 2002 2006 2010 2014-50
0
50
100
150
200
250
300
HAITI
1990 1994 1998 2002 2006 2010 2014-50
0
50
100
150
200
250
300
US VIRGIN ISLANDS
1990 1994 1998 2002 2006 2010 2014-50
0
50
100
150
200
250
300
SAINT KITTS AND NEVIS
0 500 1,000 1,500 2,000 2,500 3,000US Virgin Islands
Trinidad and TobagoSt Vincent and the Grenadines
Saint LuciaSaint Kitts and Nevis
Puerto RicoMartinique
JamaicaHaiti
GuadeloupeGrenada
Dominican RepublicDominicaCuraçao
CubaCayman Islands
British Virgin IslandsBermudaBarbadosBahamas
ArubaAntigua and Barbuda
Anguilla
Business Personal
CARIBBEAN COUNTRIESPersonal and Business Travel & Tourism(US$ mn)
12. 011. 9
10. 719. 4
11. 07.7
49. 75.15.3
10. 110. 7
6.310. 0
6.74.2
8.45.45.2
9.38.2
7.27.1
9.8US Virgin IslandsTrinidad and Tobago
St Vincent and the GrenadinesSaint Lucia
Saint Kitts and NevisPuerto RicoMartinique
JamaicaHaiti
GuadeloupeGrenada
Dominican RepublicDominicaCuraçao
CubaCayman Islands
British Virgin IslandsBermudaBarbadosBahamas
ArubaAntigua and Barbuda
Anguilla
CARIBBEAN COUNTRIESPersonal Travel & Tourism(% of Total Personal Consumption)
5.13.1
3.44.1
3.83.2
5.56.7
2.93.43.4
5.45.0
7.11.5
2.64.8
3.06.0
5.13.7
4.73.8US Virgin Islands
Trinidad and TobagoSt Vincent and the Grenadines
Saint LuciaSaint Kitts and Nevis
Puerto RicoMartinique
JamaicaHaiti
GuadeloupeGrenada
Dominican RepublicDominicaCuraçao
CubaCayman Islands
British Virgin IslandsBermudaBarbadosBahamas
ArubaAntigua and Barbuda
Anguilla
CARIBBEAN COUNTRIESPersonal Travel & Tourism(2005-2014 Real Growth Annualized, %)

48
EXPORTS
1990 1994 1998 2002 2006 2010 2014-100
-50
0
50
100
150
200
CARIBBEAN
1990 1994 1998 2002 2006 2010 2014-100
-50
0
50
100
150
200
BAHAMAS
1990 1994 1998 2002 2006 2010 2014-100
-50
0
50
100
150
200
CAYMAN ISLANDS
1990 1994 1998 2002 2006 2010 2014-100
-50
0
50
100
150
200
ANGUILLA
1990 1994 1998 2002 2006 2010 2014-100
-50
0
50
100
150
200
BARBADOS
1990 1994 1998 2002 2006 2010 2014-100
-50
0
50
100
150
200
CUBA
1990 1994 1998 2002 2006 2010 2014-100
-50
0
50
100
150
200
ANTIGUA AND BARBUDA
1990 1994 1998 2002 2006 2010 2014-100
-50
0
50
100
150
200
BERMUDA
1990 1994 1998 2002 2006 2010 2014-100
-50
0
50
100
150
200
CURAÇAO
1990 1994 1998 2002 2006 2010 2014-100
-50
0
50
100
150
200
ARUBA
1990 1994 1998 2002 2006 2010 2014-100
-50
0
50
100
150
200
BRITISH VIRGIN ISLANDS
1990 1994 1998 2002 2006 2010 2014-100
-50
0
50
100
150
200
DOMINICA
Travel & Tourism Visitor Exports (Cumulative Real Growth, %)
As we illustrated with Total Demand, the vast majority of Caribbean
countries are heavily reliant on Travel & Tourism Visitor Exports for
their Travel & Tourism activity. Visitor exports (otherwise known as
international visitor receipts) represent the traditional perspective of
tourism as a service-oriented industry providing for international
visitors. Other exports represent the hard-goods manufacturing
perspective of tourism as an industry that produces goods for visitors
and travel companies – no matter where the trip takes place.
The charts below and on the following page illustrate the absolute
size of Visitor and Other Exports estimated for 2004 in the Caribbean
economies. The largest producer of Visitor Exports is the Dominican
Republic with a total of US$3.2 billion in 2004, followed by Puerto
Rico with US$3.0 billion and Cuba with US$2.5 billion. The
Bahamas and Jamaica are also major producers of visitor exports on an
absolute basis.
When other exports are added to the base of visitor exports,
Puerto Rico becomes the largest exporter of Travel & Tourism products
and services in the Caribbean.This is mainly a result of Puerto Rico’s
strong manufacturing base. Also interesting is the nearly equal size of
visitor and other exports for Trinidad and Tobago as a result of its
energy exports.
When visitor exports are isolated relative to total exports, several
Caribbean economies excel in 2004.The ranking is led by Antigua and
Barbuda with 71.9 per cent of total exports resulting from Travel &
Tourism Visitor Exports. Second is St Lucia with a respective share of
65.1 per cent of total exports, followed by the Bahamas with 64.4 per
cent and the British Virgin Islands with 62.6 per cent. The average
share of Visitor Exports in total exports for the Caribbean region is
16.1 per cent.
Over the next decade, several Caribbean countries expect to
expand their visitor exports. At the top of the growth expectations’ list
is Guadeloupe, projecting 8.5 per cent growth per annum for visitor
exports, followed by Haiti with 6.8 per cent per annum and the
Bahamas with 6.4 per cent.Ten other Caribbean economies expect their
visitor export growth to exceed 5 per cent per annum, while the annual
regional average is expected to be 4.4 per cent.
Finally, the cumulative visitor exports real growth charts below tell
a number of stories. First, the Caribbean was almost universally affected
by the events of 11 September 2001, resulting in reduced visitor exports.
Second, most of this impact has been recovered and the outlook for
growth is strong. Finally, although most countries have enjoyed generally
positive growth over the past 16 years, several countries – including the
Bahamas, Bermuda, Martinique, St Kitts and Nevis and the US Virgin
Islands – have had difficulty in growing their visitor exports.

49
1990 1994 1998 2002 2006 2010 2014-100
-50
0
50
100
150
200
DOMINICAN REPUBLIC
1990 1994 1998 2002 2006 2010 2014-100
-50
0
50
100
150
200
SAINT LUCIA
1990 1994 1998 2002 2006 2010 2014-100
-50
0
50
100
150
200
JAMAICA
1990 1994 1998 2002 2006 2010 2014-100
-50
0
50
100
150
200
GRENADA
1990 1994 1998 2002 2006 2010 2014-100
-50
0
50
100
150
200
ST VINCENT AND THE GRENADINES
1990 1994 1998 2002 2006 2010 2014-100
-50
0
50
100
150
200
MARTINIQUE
1990 1994 1998 2002 2006 2010 2014-100
-50
0
50
100
150
200
GUADELOUPE
1990 1994 1998 2002 2006 2010 2014-100
-50
0
50
100
150
200
TRINIDAD AND TOBAGO
1990 1994 1998 2002 2006 2010 2014-100
-50
0
50
100
150
200
PUERTO RICO
1990 1994 1998 2002 2006 2010 2014-100
-50
0
50
100
150
200
HAITI
1990 1994 1998 2002 2006 2010 2014-100
-50
0
50
100
150
200
US VIRGIN ISLANDS
1990 1994 1998 2002 2006 2010 2014-100
-50
0
50
100
150
200
SAINT KITTS AND NEVIS
0 500 1,000 1,500 2,000 2,500 3,000 3,500 4,000 4,500 5,000US Virgin Islands
Trinidad and TobagoSt Vincent and the Grenadines
Saint LuciaSaint Kitts and Nevis
Puerto RicoMartinique
JamaicaHaiti
GuadeloupeGrenada
Dominican RepublicDominicaCuraçao
CubaCayman Islands
British Virgin IslandsBermudaBarbadosBahamas
ArubaAntigua and Barbuda
Anguilla
Visitor Other
CARIBBEAN COUNTRIESTravel & Tourism Exports(US$ mn)
0 10 20 30 40 50 60 70 80US Virgin Islands
Trinidad and Tobagot Vincent and the Grenadines
Saint LuciaSaint Kitts and Nevis
Puerto RicoMartinique
JamaicaHaiti
GuadeloupeGrenada
Dominican RepublicDominicaCuraçao
CubaCayman Islands
British Virgin IslandsBermudaBarbadosBahamas
ArubaAntigua and Barbuda
Anguilla
Visitor Other
CARIBBEAN COUNTRIESTravel & Tourism Exports(% of Total Exports)
5.84.6
2.16.4
4.65.5
5.04.6
4.05.0
5.51.8
5.58.5
6.84.8
2.95.2
5.85.5
3.35.8
5.1US Virgin IslandsTrinidad and Tobago
St Vincent and the GrenadinesSaint Lucia
Saint Kitts and NevisPuerto RicoMartinique
JamaicaHaiti
GuadeloupeGrenada
Dominican RepublicDominicaCuraçao
CubaCayman Islands
British Virgin IslandsBermudaBarbadosBahamas
ArubaAntigua and Barbuda
Anguilla
CARIBBEAN COUNTRIESTravel & Tourism Visitor Exports(2005-2014 Real Growth Annualized, %)
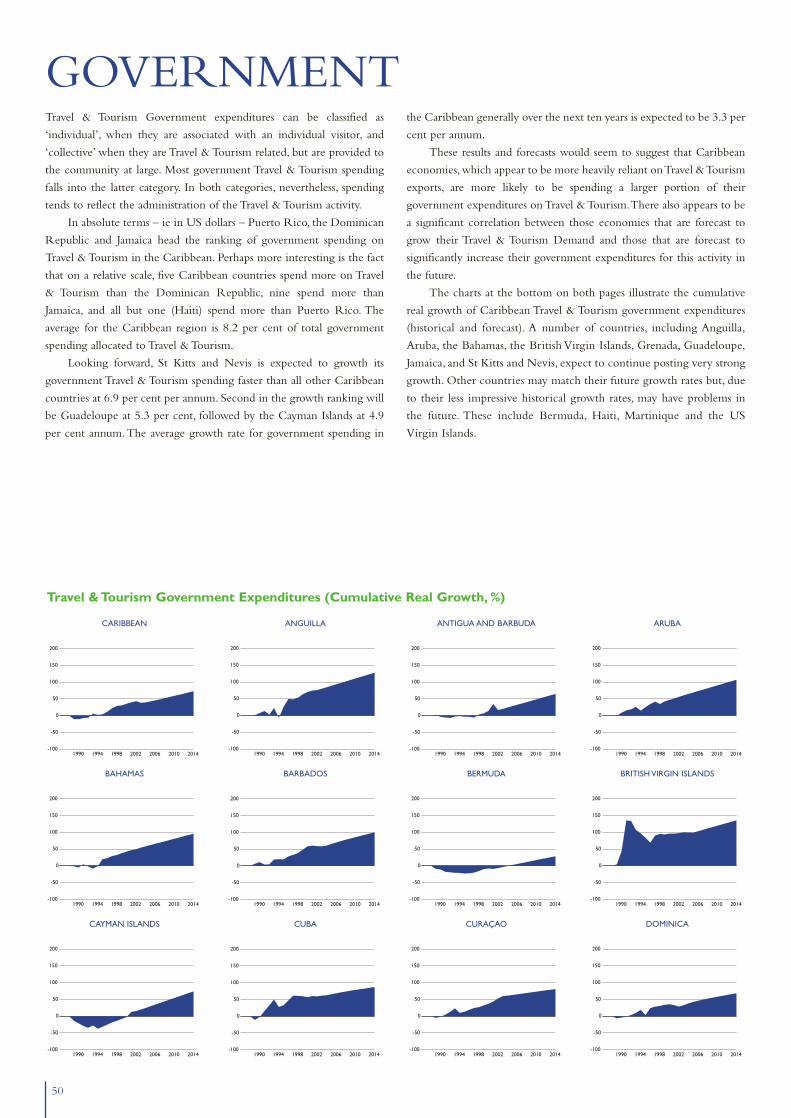
50
GOVERNMENT
1990 1994 1998 2002 2006 2010 2014-100
-50
0
50
100
150
200
CARIBBEAN
1990 1994 1998 2002 2006 2010 2014-100
-50
0
50
100
150
200
BAHAMAS
1990 1994 1998 2002 2006 2010 2014-100
-50
0
50
100
150
200
CAYMAN ISLANDS
1990 1994 1998 2002 2006 2010 2014-100
-50
0
50
100
150
200
ANGUILLA
1990 1994 1998 2002 2006 2010 2014-100
-50
0
50
100
150
200
BARBADOS
1990 1994 1998 2002 2006 2010 2014-100
-50
0
50
100
150
200
CUBA
1990 1994 1998 2002 2006 2010 2014-100
-50
0
50
100
150
200
ANTIGUA AND BARBUDA
1990 1994 1998 2002 2006 2010 2014-100
-50
0
50
100
150
200
BERMUDA
1990 1994 1998 2002 2006 2010 2014-100
-50
0
50
100
150
200
CURAÇAO
1990 1994 1998 2002 2006 2010 2014-100
-50
0
50
100
150
200
ARUBA
1990 1994 1998 2002 2006 2010 2014-100
-50
0
50
100
150
200
BRITISH VIRGIN ISLANDS
1990 1994 1998 2002 2006 2010 2014-100
-50
0
50
100
150
200
DOMINICA
Travel & Tourism Government Expenditures (Cumulative Real Growth, %)
Travel & Tourism Government expenditures can be classified as
‘individual’, when they are associated with an individual visitor, and
‘collective’ when they are Travel & Tourism related, but are provided to
the community at large. Most government Travel & Tourism spending
falls into the latter category. In both categories, nevertheless, spending
tends to reflect the administration of the Travel & Tourism activity.
In absolute terms – ie in US dollars – Puerto Rico, the Dominican
Republic and Jamaica head the ranking of government spending on
Travel & Tourism in the Caribbean. Perhaps more interesting is the fact
that on a relative scale, five Caribbean countries spend more on Travel
& Tourism than the Dominican Republic, nine spend more than
Jamaica, and all but one (Haiti) spend more than Puerto Rico. The
average for the Caribbean region is 8.2 per cent of total government
spending allocated to Travel & Tourism.
Looking forward, St Kitts and Nevis is expected to growth its
government Travel & Tourism spending faster than all other Caribbean
countries at 6.9 per cent per annum. Second in the growth ranking will
be Guadeloupe at 5.3 per cent, followed by the Cayman Islands at 4.9
per cent annum.The average growth rate for government spending in
the Caribbean generally over the next ten years is expected to be 3.3 per
cent per annum.
These results and forecasts would seem to suggest that Caribbean
economies,which appear to be more heavily reliant on Travel & Tourism
exports, are more likely to be spending a larger portion of their
government expenditures on Travel & Tourism.There also appears to be
a significant correlation between those economies that are forecast to
grow their Travel & Tourism Demand and those that are forecast to
significantly increase their government expenditures for this activity in
the future.
The charts at the bottom on both pages illustrate the cumulative
real growth of Caribbean Travel & Tourism government expenditures
(historical and forecast). A number of countries, including Anguilla,
Aruba, the Bahamas, the British Virgin Islands, Grenada, Guadeloupe,
Jamaica, and St Kitts and Nevis, expect to continue posting very strong
growth. Other countries may match their future growth rates but, due
to their less impressive historical growth rates, may have problems in
the future. These include Bermuda, Haiti, Martinique and the US
Virgin Islands.

51
1990 1994 1998 2002 2006 2010 2014-100
-50
0
50
100
150
200
DOMINICAN REPUBLIC
1990 1994 1998 2002 2006 2010 2014-100
-50
0
50
100
150
200
SAINT LUCIA
1990 1994 1998 2002 2006 2010 2014-100
-50
0
50
100
150
200
JAMAICA
1990 1994 1998 2002 2006 2010 2014-100
-50
0
50
100
150
200
GRENADA
1990 1994 1998 2002 2006 2010 2014-100
-50
0
50
100
150
200
ST VINCENT AND THE GRENADINES
1990 1994 1998 2002 2006 2010 2014-100
-50
0
50
100
150
200
MARTINIQUE
1990 1994 1998 2002 2006 2010 2014-100
-50
0
50
100
150
200
GUADELOUPE
1990 1994 1998 2002 2006 2010 2014-100
-50
0
50
100
150
200
TRINIDAD AND TOBAGO
1990 1994 1998 2002 2006 2010 2014-100
-50
0
50
100
150
200
PUERTO RICO
1990 1994 1998 2002 2006 2010 2014-100
-50
0
50
100
150
200
HAITI
1990 1994 1998 2002 2006 2010 2014-100
-50
0
50
100
150
200
US VIRGIN ISLANDS
1990 1994 1998 2002 2006 2010 2014-100
-50
0
50
100
150
200
SAINT KITTS AND NEVIS
2.349. 8
88. 9100. 897. 4
73. 88.3
56. 9159. 1
30. 23.9
227. 18.3
55. 24.8
204. 965. 2
433. 013. 3
29. 99.4
48. 1131. 6US Virgin Islands
Trinidad and TobagoSt Vincent and the Grenadines
Saint LuciaSaint Kitts and Nevis
Puerto RicoMartinique
JamaicaHaiti
GuadeloupeGrenada
Dominican RepublicDominicaCuraçao
CubaCayman Islands
British Virgin IslandsBermudaBarbadosBahamas
ArubaAntigua and Barbuda
Anguilla
CARIBBEAN COUNTRIESTravel & Tourism Government Expenditures(US$ mn)
13. 427. 4
20. 913. 8
14. 618. 3
26. 628. 9
5.74.8
6.020. 6
11. 720. 4
2.915. 8
7.93.9
14.423. 8
8.64.1
19. 5US Virgin IslandsTrinidad and Tobago
St Vincent and the GrenadinesSaint Lucia
Saint Kitts and NevisPuerto RicoMartinique
JamaicaHaiti
GuadeloupeGrenada
Dominican RepublicDominicaCuraçao
CubaCayman Islands
British Virgin IslandsBermudaBarbadosBahamas
ArubaAntigua and Barbuda
Anguilla
CARIBBEAN COUNTRIESTravel & Tourism Government Expenditures(% of Total)
4.34.14.2
3.84.0
2.93.6
4.92.4
2.03.0
3.33.9
5.31.2
2.53.8
2.76.9
4.52.8
3.53.5US Virgin Islands
Trinidad and TobagoSt Vincent and the Grenadines
Saint LuciaSaint Kitts and Nevis
Puerto RicoMartinique
JamaicaHaiti
GuadeloupeGrenada
Dominican RepublicDominicaCuraçao
CubaCayman Islands
British Virgin IslandsBermudaBarbadosBahamas
ArubaAntigua and Barbuda
Anguilla
CARIBBEAN COUNTRIESTravel & Tourism Government Expenditures(2005-2014 Real Growth Annualized, %)


53
Travel & Tourism is the one really bright spot on the horizon, and it is
very bright – thanks in no small part to the region’s wealth of natural
geographic attractions and resources. Most importantly, several of the
largest, most powerful and most influential economies clearly recognize
Travel & Tourism’s potential as a contributor to economic growth and
social development throughout their countries and the region.
Nevertheless, while many of the Caribbean governments accept
that Travel & Tourism has a significant role to play in achieving robust
economic development, it appears that even some of these
underestimate the full scope of the industry as a catalyst for the
development of other areas of economic activity, such as agriculture,
manufacturing and financial services. Neither is there wide appreciation
of Travel & Tourism’s potential to reduce disparities between the ‘haves’
and the ‘have nots’ – which, in turn, could bring major improvements to
Caribbeans’ quality of life and well-being – and to support
environmental protection efforts.
Forecasts by the World Travel & Tourism Council (WTTC) and its
research partner, Oxford Economic Forecasting (OEF), are positive,
pointing to an average annual growth in Travel & Tourism Demand of
4.0 per cent over the next ten years. If this growth is realized, the wider
Travel & Tourism Economy will contribute 16.5 per cent to the
Caribbean’s GDP by 2014 – more than any other individual sector.
Moreover, the potential impact could be even greater if the underlying
policy framework is conducive to growth – ie if the individual
governments and regional organizations create the underlying
conditions for market confidence, dynamism and sustainability.
However, several challenges lie ahead, and these must be addressed
to ensure the long-term sustainable development of Caribbean Travel &
Tourism, generating maximum benefits for all stakeholders and at all
levels of the economy. While the private sector can and must play the
driving role in tourism development, ensuring quality products and
competitive services geared towards rapidly changing demand,
governments need to show leadership by stimulating and facilitating
investment, streamlining and clarifying regulations, and developing
much needed infrastructure and human capital.
The public and private sectors clearly have separate interests and
roles in Travel & Tourism. Yet there is a significant opportunity, and
obligation, for them to work in partnership at all levels – locally,
nationally and regionally – to share a vision and help fulfil the potential
of Travel & Tourism in the Caribbean. From the top down, this means
that the Caribbean Tourism Organization (CTO) and the Caribbean
Hotel Association (CHA) must work together with their respective
members to find areas of common interest and agreement to smooth the
way for collective achievement. By setting a standard for public-private
sector co-operation, the CTO and CHA will do more for Caribbean
Travel & Tourism than either could achieve alone.
WTTC conducted a series of 18 public and private sector focus
group sessions in nine Caribbean destinations in preparation for this
report, as well as spending one month in desk research studying key
issues affecting the Caribbean. As a result, we are well aware of the
plethora of national and regional research reports, policy statements,
workshop findings, strategies and masterplans that have been produced
THE POLICYFRAMEWORK POLICY RECOMMENDATIONS
THE CARIBBEAN IS THE MOST TOURISM-INTENSIVE REGION IN THEWORLD. HOWEVER,A VAST MAJORITY OF THE CARIBBEAN COUNTRIESDISREGARD, ARE UNAWARE OF, OR ARE IN COMPLETE DENIAL ABOUTTHE ECONOMIC IMPACT OF TRAVEL & TOURISM. AS A RESULT, THEYFAIL TO REALIZE THE FULL POTENTIAL THAT TRAVEL & TOURISM CANMAKE TO THEIR ECONOMIES AS A CREATOR OF JOBS ANDDEVELOPMENT OPPORTUNITIES.
Unemployment is extremely high in many of the Caribbean economies and many residents livebelow the poverty line. Although foreign assistance, economic and fiscal reforms are having apositive impact, auguring well for improved macro-economic development, key sectors of theeconomy that were once vital sources of foreign exchange earnings – notably agriculture – havebeen declining, and are expected to continue to decline, in response to intense internationalcompetition.

54
by and for the Caribbean countries over the past few years.Although it
is our standard practice to take a fresh and independent view of the
policy situation and develop a set of recommendations that follow our
tried and tested policy agenda, it is our conclusion – in the case of the
Caribbean – that much of what we would like to say has already been
said, and said very well.
Instead of re-inventing the policy wheel, therefore, we have
decided to use as our foundation the Caribbean Tourism Strategic Plan.
This was commissioned by the Commonwealth Fund for Technical
Co-operation (CFTC) Programme, prepared under the direction of
CTO and in collaboration with the CARICOM Community
Secretariat, CHA and the CARICOM Tourism Summit Preparatory
Committee. In those instances in which our views and
recommendations differ from those expressed in the Strategic Plan, we
have highlighted our differences and tried to justify our different
viewpoints. Similarly, in areas in which we feel the Strategic Plan is
inadequate or lacking, we have added our recommendations and
arguments to support these positions.
Although our policy review did not cover the entire Caribbean
region, we feel confident that we were able to incorporate a broad
spectrum of public and private sector perspectives representing the
different geographical (Eastern, Northern, Caribbean, etc) and cultural
(English, French, Spanish and Dutch) interests. In addition, we tried to
ensure that the focus group discussions involved small and large
economies and all market sectors.
Nevertheless, given that our review was limited in duration and
scope, we acknowledge that WTTC is not in a position to pontificate
on all the important Caribbean Travel & Tourism policy issues.
However, we do feel that we were able to identify the most significant
policy issues through our different focus group meetings – all of which
were frequently cited by participants and featured strongly in the
ensuing discussions. Having said this, our Policy Recommendations do
not focus on any of the specific Caribbean economies, but rather
provide general guidance for all the economies individually and the
region as a whole.
One final point should be made about the many research reports,
policy statements, strategies and masterplans produced for Caribbean
Travel & Tourism over the years. Although much of what has been
analyzed, reported and recommended has been professional, credible
and to the point, the primary weakness identified by participants of the
WTTC focus group meetings was that implementation of the
conclusions, recommendations and directives was lacking and that this
inability to focus on making change happen needs to be addressed.
Frankly, it is easy to commission a report, a study or a review, but it
is another matter altogether to take that information and transform it into
action. Implementation takes significantly more time and resources and is
not as easy as writing a cheque to a consultant at the end of a study.
However difficult and resource-consuming, government officials and
private sector players must begin to re-orient their approach to this work.
Instead of spending all their time and money on developing the perfect
answer to a given question, it may make sense to spend fewer resources
on fewer issues and focus greater resources on making change happen.
Against this background WTTC makes the following
recommendations to Caribbean governments and, where relevant, to all
public and private stakeholders in Caribbean Travel & Tourism:
HIGHLIGHT AND COMMUNICATETHE STRATEGIC IMPORTANCE OFTOURISMRecognize Travel & Tourism’s EconomicImportanceTravel & Tourism is without question the foremost export sector in the
Caribbean, generating the highest share of foreign exchange revenues. It
possesses the inherent ability to diversify the Caribbean economy,
stimulate entrepreneurship – particularly among small and medium-
sized enterprises (SMEs) – catalyse investment, create large numbers of
sustainable jobs, and help social development in local communities.
However, no matter where one travels within the Caribbean, the impact
of the industry is generally not understood by public officials, the
industry itself or the communities where it takes place. More than any
other issue, this lack of awareness is responsible for many of the key
limitations that Travel & Tourism faces in the region.
In many Caribbean countries the political sympathy and
overwhelming sense of entitlement usually lie with agriculture as a
result of historical precedent. Unfortunately, the globalization of
agricultural commodities has made Caribbean agriculture
uncompetitive and, as a result, it has lost market share and output. In
contrast,Travel & Tourism in the Caribbean has enormous competitive
advantage, even in a globalized economy, to create new opportunities
and employment. However, it requires a fair and level playing field to
demonstrate the potential that it can provide. Governments across the
Caribbean should step back from the emotional ‘feed ourselves’
approach to agriculture to a more balanced approach, ie ‘create self-
sufficiency and diversity’ through Travel & Tourism.
It is also time for the Caribbean governments to acknowledge one
of the economic facts of life – that Travel & Tourism is an export sector
just like agriculture, fishing, manufacturing, or pharmaceuticals. Because
of this, it is rare for a country to impose taxes on its exports, since
resulting price increases disadvantage its products in the global
marketplace. Indeed, countries are prone to subsidize exports to gain
export market share and/or to tax imports to protect a domestic
industry. If a country taxes its own exports, a self-imposed tariff is
created, prices are increased and demand naturally decreases, thereby
limiting development opportunities and job creation.
The regional organizations and national governments should
undertake an industrial image campaign to ensure that all public and
private stakeholders recognize Travel & Tourism’s full impact across the
national economy – not just on eating and drinking places and retail
business, but also on construction, real estate, manufacturing,
agriculture, and other sectors of the economy. Even more importantly,
stakeholders should be made aware of its untapped potential and of the
spin-off benefits of tourism that filter down through all levels of the
community.

55
Travel & Tourism should be factored into mainstream policies for
employment, trade, investment, education and environmental protection.
The strategic importance of Travel & Tourism should be communicated to
all levels of government, industry and local communities. All government
departments affected by, or impacting on, Travel & Tourism development
should be closely involved in drawing up the National Tourism Policies and
in planning and co-ordinating individual programmes.
The regional organizations, CTO and CHA, should establish a Tourism
Economics SWOT Team to help the different Caribbean nations
understand the impact of Travel & Tourism on their economies by
conducting a seminar for each existing and each new government that takes
office. Ideally, this resource-building exercise should be focused on
ministerial level appointees from all cabinet agencies, as well as
parliamentarians, to facilitate their understanding of the role that Travel &
Tourism plays in their economies, and how their particular functionality
impacts or is impacted by the industry.
Another approach to raising the level of awareness and positive profile
of Travel & Tourism is through the large army of Travel & Tourism
employees. In many respects, these people should be, and must be,
ambassadors of Travel & Tourism’s contribution throughout the broader
economy. Unfortunately, in many cases there is a lack of communication
between owners/employers and the people who take the reservations, make
the beds, fly the aircraft, wait on tables and guide visitors around the islands.
These people have a great deal of personal influence within the
communities in which they live.
If they are helped to understand the basics of Travel & Tourism and how
the flow of visitor revenues and spending impacts their lives, they can serve
as emissaries to the rest of the community to help spread the message that
Travel & Tourism is everybody’s business. One important step in this effort
– already undertaken to some extent by regional and local hotel associations
– is opening the lines of communication between owners/operators and
their employees through direct contact or regular dialogue and news
bulletins. Not only will this raise awareness, but it will also help galvanize
employees into supporting and championing Travel & Tourism within their
communities.
Perhaps most importantly, WTTC’s focus group meetings identified
an almost universal call for a regional, national and local public awareness
campaign to inform and educate the general public about the merits and
impact of Travel & Tourism in the Caribbean, as well as in individual
countries and local communities.Although many destinations already have
such public awareness campaigns in place, the coverage is not uniform or
consistent across the region, and there is always a continuing need to
reinforce the message. More significantly, campaigns tend to be geared
towards ‘treating the tourist well’ rather than highlighting the economic
and social benefits that Travel & Tourism can bring to local communities.
Lastly, Travel & Tourism needs to focus media attention on industry
issues. The Caribbean Media Exchange (CMEx) does a very good job of
improving the quality of media coverage on Travel & Tourism issues for the
region, largely through educating the media about these issues, and should
be supported and encouraged to continue this critical line of awareness
building.
Caribbean Media Exchange
Since its inception in October 2001, CMEx has become an ever-
increasing source of confidence and pride for the Caribbean
region.
CMEx began with the inspiration of Counterpart
International to improve the quality of media coverage of
sustainable tourism in the Caribbean. Further, it sought to
increase the input of the media in the design of sustainable
tourism policies, and highlight the necessity of tourism to the
economies of small island states. Two and a half years and five
conferences later, it has accomplished just that.
By attracting such notable speakers as the Travel Detective,
Peter Greenberg, who doubles as Travel Editor NBC News, and
a range of prestige sponsorship from Air Jamaica to Black
Entertainment Television (BET), what was recently just a simple
initiative has become a full-blown affair.
Extending invitations to members of the media has proven
to be one of the quickest ways for CMEx to spread the
sustainable tourism message to the masses.The organizers of the
conference promote the mingling of journalists, both Caribbean
and international, and members of the hospitality sector, in order
that synergies will result for the betterment of island peoples.
As the executive vice-president of the Barbados Hotel &
Tourism Association, Sue Springer, insightfully said: “The press
definitely can play a major role (in developing tourism awareness)
and we need to invite you more into all of our tourism events.”
Evolving from CMEx, we are happy to see the sharpening
of skills within the press corps, the creation of freelance and
training opportunities for Caribbean media in North America,
smart partnerships between public and private sector
organizations, and the implementation of sustainable tourism
initiatives that safeguard the environment and enrich Caribbean
communities.
Through an increase in published and aired stories
throughout the regional and international media, our CMEx
sponsors have become closely identified as champions of the
sustainable tourism movement. Indeed, with every passing
forum, public awareness of the issues of sustainable tourism have
become more widely acknowledged and accepted.
CMEx is produced by Air Jamaica, Counterpart
International, Counterpart Caribbean, the Caribbean
Broadcasting Union, Caribbean Hotel Association, Caribbean
Hotel Association Charitable Trust (Life Needs the Caribbean),
the Barbara Pyle Foundation, Caribbean Alliance for Sustainable
Tourism and EarthVoice, and has grown into the region’s premier
gathering of the industry’s creative elite with leading journalists
in the region and beyond.
Source: www.caribbeanmediaexchange.com
56
Long-term planning at the national andregional levels is a prerequisite forgenerating investor confidence andorganizing the successful development ofTravel & Tourism in the Caribbean.
PLAN FOR THE FUTURELong-term Tourism PlanningLong-term planning at the national and regional levels is a prerequisite
for generating investor confidence and organizing the successful
development of Travel & Tourism in the Caribbean. Not only is the
industry fragile and likely to be adversely affected by short-term
political considerations, but the majority of the Caribbean states are
small countries and can less afford to make mistakes than most of their
competitors with deep pockets. With so much at stake for tourism-
intensive countries in the Caribbean, it is time that Travel & Tourism
shed its schoolboy image and approach to business and graduated to the
ranks of professional world-class industries.
In many cases, the Caribbean economies have relied on
spontaneous, natural evolution or passive acceptance to decide the
nature and direction of Travel & Tourism in their countries/islands.
Although this approach may be appropriate in less critical circumstances
or at an embryonic stage of development, the economic and political
forces currently impacting on the Caribbean economies require a
structured professional approach to be taken to tourism planning that
will ensure sustainable development.
WTTC applauds the efforts of those Caribbean economies that
have produced and maintained a Tourism Strategic Plan or Tourism
Masterplan, and we would encourage them to persevere towards their
goals and focus their attention on implementation. For those economies
that are still relying on spontaneous or passive response to Travel &
Tourism development, we recommend the creation of a Tourism
Masterplan incorporated into a formal National Tourism Policy, closely
linked to the nation’s vision for the future.This Policy must start from
a vision of what kind of Travel & Tourism all stakeholders in individual
countries wish to develop – in physical and marketing terms. These
stakeholders must include representation from all levels of civil society,
as well as the industry and politicians.The Policy must include certain
basic elements:
■ Clearly defined goals, objectives and responsibilities;
■ Decisions based on quantitative input;
■ Indications of best practice in tourism development;
■ Measures to support existing industry, as well as for the promotion
of new developments;
■ An articulated strategy for product development and
diversification;
■ A long-term strategy for tourism marketing and promotion in line
with the Policy’s long-term goals and objectives; and
■ Clear branding, supporting the generic ‘brand Caribbean’, that
reinforces the basic vision for the region’s Travel & Tourism
development.
In order to ensure greater support and commitment from all
stakeholders, each government should also initiate a cohesive and co-
operative approach to longer-term tourism planning and development,
involving all levels of government, the private sector and local
communities. The governments should strengthen their partnerships
1See Holder, JS: Meeting the Challenge of Change – presentation to the Tourism Summit, December 2001 – from which much of the information in this Section is derived.
with the private sector and local authorities through their respective
national tourism organizations (NTOs). Ideally, they should also
establish a Travel & Tourism Government Advisory Council that
provides direct private sector input into mission-critical policy and
decision-making by the public sector in regard to Travel & Tourism.
One last thought on the matter of masterplanning. If the
government authorities are not able or willing to produce a masterplan
– although this state of affairs would be highly unusual – we would
recommend that a broad coalition of private sector players join forces
and produce a plan that represents their aspirations for Travel & Tourism.
This could then be submitted to the government authorities for
consideration and agreement. Although this is not our preferred
approach, long-term planning is key to the development of sustainable
tourism, and if the public sector does not take the bull by the horns,
then the private sector must be proactive and initiate the process.
In order to facilitate attainment of these goals, the responsibility of
the ministry of tourism should be increased.This is especially important
in cases where tourism represents the majority, or primary, island
industry. The ministry should be granted leadership and authority
within the individual Caribbean economies to factor the industry’s
needs into mainstream policies for employment, trade, investment,
education and environmental protection.
On a regional basis, WTTC applauds the Caribbean Tourism
Strategic Plan produced in 2002, but recommends that it be updated,
modified as appropriate – in line with the recommendations made in
this report – and expanded to broaden its geographic focus and ensure
its relevance to the French, Spanish and Dutch, as well as the English
Caribbean. Formal agreement of the report should be expedited so that
it can be implemented as soon as possible.
The following contains large extracts from the 2002 Caribbean
Tourism Strategic Plan, notably from Section 4, entitled Critical Issues1,
which we firmly believe summarize the critical issues which Caribbean
tourism is facing, and that require specific strategic responses. Section 4,
although relabelled, is included in its entirety with the exceptions of
parts 4.11 on Marketing and 4.16 on Funding, for which we have
alternative comments and recommendations (included at the end of the
section). Extracts taken directly from the Strategic Plan are highlighted
in italics so as to identify them clearly

57
SUSTAINABLE DEVELOPMENT2
The tourism industry is the major source of income for most Caribbean countries
and it is therefore imperative that any threats to the sustainability of the industry
be firmly addressed and tackled. Its future depends on preserving that very
precious combination of natural and cultural assets that have enabled the region
to become one of the world’s leading warm weather tourism destinations.
In looking at the issue of sustainability of the tourism industry in the
Caribbean, CTO has a broad perspective which takes into account the
cornerstones of protecting the natural environment, conserving and enhancing the
cultural patrimony, strengthening linkages between tourism and other economic
sectors, and involving local communities in planning and benefits. Sustainability
also depends on the region’s ability to maintain product quality, ensure adequate
returns for investors, engage in effective marketing and promotion, and ensure air
access at competitive rates from major tourist generating markets.
Simply put, investor confidence is created by profits/yield and
bureaucratic structure and operation, as well as by a consistent legal
framework that includes clear policies and guidelines as to development
planning and land-use regulations.
These principles are enshrined in the Regional Sustainable Tourism Policy
Framework Policy and Regulatory Framework for Sustainable Tourism in
the Caribbean (CTO/ USAID), which was endorsed and approved by the
country and agency members of the CTO Sustainable Tourism Technical Committee
at their 4th meeting held in Guyana in May 2000.The Policy and Regulatory
Framework has been presented to the ACS as an important tool to facilitate the
implementation of the ACS Convention on Sustainable Tourism Zone of the
Caribbean (signed in December 2001 and now in the process of ratification).
This new conceptual approach now provides a vehicle through which
tourism can play an enhanced and ever-increasing role in the long-term
development of the Caribbean region. No longer is it possible to view tourism
only from its commercial and economic perspective, ie in terms of arrivals,
bednights and expenditure. The multi-faceted impacts of tourism make it
imperative that the development of the industry be fully integrated at policy,
planning and delivery levels across ministries/departments.
Issues of sustainability are highly inter-related. The discussion and
formulation of recommendations will thus be organized (below) around the
following issues: natural environment; safety and security and health; linkages;
community involvement; profitability and return on investment; air access; control
over distribution systems; and the need for a sustainable source of funding for
tourism development programmes.
Natural EnvironmentThe quality and success of the regional tourism product is dependent, in large
measure, on the maintenance of a healthy and attractive natural environment.
There is need for:
■ Improved planning and management – many of the small island
developing states of the Caribbean lack the necessary technical expertise
required for the complex field of tourism development and the environment
in the areas of pollution monitoring, coastal zone management, and the
preparation and evaluation of Environmental Impact Assessments (EIAs);
■ Increased regional co-operation and collaboration – eg by joining the
Cartagena Convention and its Protocols;
■ Development and implementation of high standards of
2See background paper on Sustainable Development Issues in Tourism – prepared for the Tourism Summit by CTO/CHA/CAST/PAHO/ CANARI/CARICOM,December 2001 – and McHardy, Pauline: Regional Sustainable Tourism Policy Framework, USAID/CTO, September 2000

58
environmental quality, including prevention of pollution by cruise and
other ships;
■ Conservation and sustainable use of natural resources – the challenge
is to ensure that local tourism businesses and entrepreneurs develop good
environmental and social practices, both during the tourism development
planning and construction phase and in the operations of tourism
enterprises through participation in environmental certification and rating
programmes such as Green Globe, Blue Flag and QTC (see below);
■ Improving national infrastructure to support the tourism industry;water
and electricity costs in certain Caribbean countries are among the highest in
the world and, where services such as solid waste disposal are not available,
hoteliers must operate their own treatment and disposal systems, adding
further to their operating expenses;
■ Land-use policy – eg the need to address the issue of the use of land for
tourism, golf courses and indeed housing, and the spiralling price of land,
especially on or near areas near the coast in some island destinations, which
negatively affects the local population; there is need for better zoning on the
basis of maximizing economic returns, respecting parks, water courses, hotels
and facilities rather than private villas; policies like taxing of land ought as
far as possible to take account of the different situations of local, as opposed
to transient, resident populations;
■ Incentives to mobilize the private sector – lack of financing is a major
constraint to investment in environmental improvements, especially in small
and medium-sized hotels. Governments can help by providing concessions
for capital investments by tourism businesses that impact on reduced water
and energy consumption, reduced solid waste consumption, etc;
■ Education and in-service training for a more sustainable approach
to tourism – there is need to encourage environmental education in schools,
devise and implement effective public awareness campaigns and activities to
promote care of the environment, and to increase training programmes for
industry professionals that support environmental sustainability of the
industry; and
■ Crisis and Disaster Management – the region’s tourism industry is
exposed to severe risk from the possibility of natural and environmental
disasters, such as hurricanes, volcanic eruptions, etc. Of particular concern are
the threats to the marine environment posed by oil-spill emergencies and the
transport of hazardous substances, such as nuclear waste, through the region.
SAFETY, SECURITY AND HEALTHAmong the broad forces driving change in the tourism industry today, traveller
safety and health are becoming two of the most influential. Crime, harassment
and other forms of anti-social behaviour, along with hazardous and unhealthy
facilities, are some of the major threats to the development of the industry. Such
problems frustrate national and regional efforts to maintain the region’s image as
a safe, clean and hospitable destination. Whether or not such concerns are
supported by data, it is the perception that matters most to the uninformed
traveller, including potential travellers to the Caribbean.
Among the critical issues that need to be addressed are:
■ negative information dissemination and how this can be managed;
■ crime and drugs;
■ visitor harassment – surveys show a worsening situation with regard to
visitor harassment, sometimes involving drug peddling, with more than half
of all visitors in some destinations complaining that they were harassed
either a little or a lot. Generally, however, measures to deal with harassment
have not been successful; and

59
HIV/AIDS in the Workplace – AProgramme for the Tourism IndustryIncreased tourist demand for adventure and romance is evident in
the continuing trend of sexual interactions between visitors and
host populations. Of concern, therefore, is the HIV/AIDS epidemic
potential of this interaction and its negative impact not only on the
tourism industry but also on public health and the national
economy. The Caribbean Tourism Health, Safety and Resource
Conservation Project (CTHSRCP) recognizes the importance of
the Travel & Tourism industry to the Caribbean’s economic
development, and acknowledges that the growth and profitability of
the industry are dependent on healthy and sustainable operating
systems.
As part of its standards’ development process and its education
and training programmes, the CTHSRC project has begun to
collaborate with key stakeholders in the tourism industry and health
sector in the development of policies, procedures and practices that
protect the health of visitors and host population, with particular
reference to HIV/AIDS.
Supported by a German Technical Co-operation (GTZ) grant
of US$50,000 and technical assistance from CAREC’s SPSTI Unit,
the project team has developed a participatory initiative, the specific
objective of which is to increase the capability of the tourism sector
to respond proactively to the HIV/AIDS epidemic.
The high point of the HIV/AIDS tourism programme is the
development of HIV/AIDS policy guidelines and educational
material specific to the industry. This will be undertaken during
two-day workshops for industry managers, human resource officers,
hotel doctors and nurses and trade union representatives.
Source: www.carec.org
Quality Tourism for the Caribbean Workplace ProgrammeQuality Tourism for the Caribbean (QTC) is a joint venture project, which seeks to strengthen the overall quality and competitiveness of the
tourism industry in the Caribbean through the establishment and dissemination of quality standards and systems designed to ensure healthy, safe
and environmentally conscious products and services. The partners in the QTC project are the Caribbean Alliance for Sustainable Tourism
(CAST), the environmental regional subsidiary of the Caribbean Hotel Association (CHA), the Caribbean Epidemiology Centre (CAREC), the
Caribbean’s health monitoring and disease prevention agency, and a specialized institution of the Pan American Health Agency (PAHO).
QTC has published HIV/AIDS Policy Guidelines for the Caribbean Tourism Industry to assist hoteliers and restaurateurs in protecting their
workforces and in so doing, protect the viability of their businesses.
One of the two main components of the programme is the development of health, safety and resource conservation standards and systems
supported by the establishment of a credible certification/registration process. It is expected that these standards will help:
■ Address the concerns related to the health, hygiene, and environmental conditions for guests and staff at hotels and other tourism businesses;
■ Provide greater market share for Caribbean hotels through decreased liability and improved profitability; and
■ Contribute to the sustainability of the tourism industry and to economic development in the region.
A core set of draft standards has been developed and the Project Execution Unit is seeking to finalize these standards before implementation
at industry level.
The Caribbean Tourism, Health, Safety and Resource Conservation project has taken up the call of the International Hotel & Restaurant
Association for the global hospitality industry to address the issue of HIV/AIDS in the workplace.
Source: www.businessfightsaids.org

60
■ human health issues, including the growing incidence of HIV/AIDS
(which apart from being a personal tragedy is also threatening the stability
of the Caribbean labour pool); the spread of food borne diseases; the
quality of water for drinking, swimming and bathing; and the spread of
vector borne diseases such as dengue, yellow fever, malaria, etc.
HIV/AIDS To cite the World Bank:“In the Caribbean,HIV/AIDS has become the
major cause of death among men under the age of 45. Official figures
show more than 360,000 people living with AIDS, but estimates place
the number at over 500,000 due to under-reporting. More than 80,000
children have been orphaned by the epidemic, and the infection rate is
estimated to have reached 12 per cent in some urban areas, spreading
in many countries from high-risk groups to the general population.”
“AIDS threatens to reverse the social and economic gains that the
men and women of the Caribbean have worked hard for decades to
achieve,” said US Secretary of State, Colin Powell, noting that the
HIV/AIDS infection rate in the Caribbean is growing at an “alarming”
rate, second only to that found in sub-Saharan Africa. He continued:
“Our Caribbean community shares the problem of HIV/AIDS, and all
of us must work in partnership to address it… Our response to this
crisis must be no less comprehensive, and no less relentless, than the
AIDS pandemic itself.”
There is no question that the Travel & Tourism industry will need
to act proactively to address the issue as well. Although the horrors of
this disease and its impact can be quite overwhelming, there are some
inspirational programmes in place in the Travel & Tourism industry that
offer great hope. Two such examples are the work of the Caribbean
Tourism Health, Safety and Resource Conservation Project
(CTHSRCP) and Quality Tourism for the Caribbean (QTC).WTTC
encourages all Travel & Tourism stakeholders to use CTHSRCP and
QTC as leading examples, and address HIV/AIDS head on, seeking
out help and assistance when and where necessary to make a difference
for their employees, the industry and humanity.
COMMUNITY DEVELOPMENTThere is concern that the benefits from tourism in the Caribbean might not be
reaching those who need them most and that, despite the impressive growth in
visitor numbers and expenditures, tourism is not doing as much as it could to
relieve existing problems of unemployment, poverty and social dislocation caused
in part and exacerbated by the demise of traditional industries.Tourism, as the
region’s leading industry, must be a key element of any national strategy to
alleviate poverty and build resilience and sustainability into rural and urban
communities.There is encouraging evidence that national planners are paying
increasing attention to this aspect of tourism development and avoiding the
pitfall of confusing growth for development, but mechanisms to implement such
policies have been generally weak, poorly conceived or non-existent.
Sustainable tourism, if it is to become a reality, must be placed squarely
within a national policy framework of social and economic development.
Implementation of such a policy shift will require leaders to adopt and promote
a new vision and way of thinking about the tourism industry.There is need for:
■ Research on measures to enhance community benefits from tourism,
including the most appropriate incentives and concessions, institutional
arrangements, target markets, import-substitution opportunities, etc;
■ Technical assistance and training to local communities in the areas of
business practice, marketing and complying with regulations for those
providing bed and breakfast accommodation;
■ Development of programmes of capacity building, both in terms of specific
skills and financing for community-based tourism projects;
■ Development of strategic partnerships between government, the private
sector, NGOs, donor agencies and community organizations, both locally,
nationally and regionally, to support a new agenda and vision for the
future; and
■ Identification and implementation of pilot projects (which is increasingly
popular with international donors).
LINKAGESThe importance of creating stronger linkages between the tourism industry (land-
based and cruise) and other sectors of the economies of the region has long been
accepted. However, the debate on how this can be achieved is far from being
resolved. Barriers to the creation of such linkages include: the acknowledged
weakness in the goods producing sectors in the region in terms of volume, quality,
price and consistency of production; and the absence of effective distribution and
information systems to link the demand of the tourism industry with producers
at national and regional levels.There is need for:
■ Improved methods of tracking and evaluating the linkages which actually
exist;
■ Potential producers and suppliers must be able to obtain early information
on these developments and be organized to interface at the development
stage of projects with investors, development planners and project architects;
■ Greater interaction between major local distributors (who tend to import the
bulk of the goods sourced locally by the industry) and local and regional
producers;
■ Targeted promotions to the decision-makers in the construction and
distribution chains (in the same way that Export Promotion Agencies do
for local producers in external markets);
■ Structured promotion and demonstration activities aimed at hotel and cruise
ship purchasing agents, food and beverage managers, and head chefs (many
of whom may be unfamiliar with Caribbean sources of supply);
■ Development and marketing of local produce to hotels and other tourism
enterprises (eg cruise ships), a growing number of whom already recognize
the contribution they can make to support local economies by purchasing
local fruit and vegetables;
Tourism, as the region’s leading industry,must be a key element of any nationalstrategy to alleviate poverty and buildresilience and sustainability into rural andurban communities.

61
■ Development of programmes for the upgrading of the traditional skills and
methods of craft producers to promote quality production (particularly in the
small island developing states where there has been less of a tradition of craft
compared to elsewhere in the Caribbean). Training is also required for
promotion and marketing; and
■ Development and implementation of an overall strategy in close
collaboration with local musicians, dance schools and national cultural
foundations to raise the overall standards of cultural performances, and
thereby provide enhanced employment opportunities for Caribbean artistes
in hotel and cruise ship cabaret shows.
Many have argued that the know-how to create linkages between Travel
& Tourism and the rest of the economy is well established, but that the
largest weakness in the equation is in the implementation and execution
of the effort.WTTC recommends that a dedicated effort and resources
be organized by each national tourism organization (NTO) or tourism
ministry to guarantee a focused approach to establishing effective
linkages between Travel & Tourism and the rest of the economy.
INVESTMENTBecause of the fundamental importance of tourism to the economies and well-
being of almost every Caribbean country, it is crucial to put in place an operating
climate that will encourage growth and investment in the tourism sector.This in
turn will generate the taxes with which to finance infrastructural and social
programmes.
In 1997 investment needs in the tourism sector in the Caribbean were
estimated at around US$3-4 billion per annum, made up of circa US$1 billion
per annum to increase room numbers, US$0.5 billion per annum for renovation
(60 per cent of hotels are over 15 years old) and the remainder in investment in
tourist attractions, leisure facilities, ancillary facilities, and development of
infrastructure.These will have increased in 2002 (and 2003).
The present operating climate in many countries does not encourage growth
or investment.This is at least partly due to the high operating costs (high cost of
local and imported inputs, heavy import duties on both construction and
consumable goods, punitive costs of distribution and marketing, the even higher
cost of utilities and the broad-based levels of taxation which currently exist in
most countries in the region), which reduce profitability and prospective returns
on new investment.The partnership challenge for governments and the hotel and
other sub sectors is to find ways to reduce operating costs, thereby increasing
profitability and consequently stimulating new investment to further expand the
industry and the taxes it generates.Another challenge faced by the industry is to
find appropriate insurance against the risk posed by hurricanes.
Very uneven patterns of competitiveness exist in the region whereby many
countries are experiencing stagnation and loss of market share, while others enjoy
better results.The comparatively higher cost of doing business in CARICOM
(cost of labour, taxation, utilities, cost of funds, construction and operating inputs)
is responsible for faltering profitability and viability, which has been exacerbated
by falling growth rates.There is a danger that CARICOM countries may not
be able to meet their growth targets because of lack of investment (and lack of
growth would in turn inhibit potential investors).
There is need to examine the availability of financing and to devise ways
of improving access to finance, especially for the small hotels sector (and other
62
sectors such as tour operators, restaurants, and attractions). Commercial
banks tend to view the hospitality industry as an above-average risk for lending
with the result that loan terms are more onerous than they ought to be.
Consideration needs to be given to the creation of specialized financial
intermediaries to unlock the very considerable funds tied up in Caribbean
pension funds, national insurance funds, insurance companies, etc and make them
available for investments in the hotel sector. However, to some extent, the problem
is not so much the lack of investors but the lack of projects yielding a return of
15 per cent or greater.There is scope for public-private partnerships to provide
new and upgraded infrastructure for the tourism industry.
Many of the focus group participants interviewed in preparation
for this research also identified the difficulties associated with incentive
programmes as a major drawback or limiting factor for continuing
investment in Travel & Tourism. Many pointed to the high and difficult
bureaucratic barriers and red tape associated with new Travel &
Tourism projects as a key factor in limiting economic development and
job creation. They also suggested that there is a lack of knowledge
among the development agencies about how Travel & Tourism
functions and that, as a result, incentives and programmes have been
misconstrued and misapplied.
In some cases, participants indicated that eligible and applied
incentives were difficult, if not impossible to collect. They called for
‘one-stop shopping’ or ‘fast-track’ programmes to ease the process of
establishing new businesses, and suggested that more attention should
paid to indigenous operators willing to re-invest in the community and
allow them to compete fairly with the multinationals.The participants
called for consistency of investment application, clarity and transparency
of the incentive process. Surprisingly, they also called for greater
policing of investment regulations, indicating that some operators were
taking unfair advantage of the public’s trust.
Due to the importance of attracting and supporting the proper mix
of Travel & Tourism investment, as well as developing and applying
attractive, effective and efficient incentive schemes, WTTC calls on
NTOs working with national development agencies to produce a Travel
& Tourism Investment Strategy that addresses these issues of concern.
This should comprise a detailed ten-year plan that provides strategic
guidance and operational direction for the industry.
Some mention should also be made of a new initiative to support
tourism in the Caribbean from PRO€INVEST, an investment
promotion agency that comes under the European Commission. Funds
of €3 million are being made available to the tourism industry to
support partnerships with the Caribbean and opportunities for
investment. CHA has been a major driver in helping to launch this
initiative, which is also being supported by WTTC and other
international organizations.
...there is a lack of knowledge among thedevelopment agencies about how Travel &Tourism functions and..., as a result,incentives and programmes have beenmisconstrued and misapplied.
WTTC Principles of Intelligent Taxation
A study of Travel & Tourism taxation policy by the London School
of Economics for WTTC recommended five principles that public
policy-makers should use to guide their review of tax policy
proposals and legislation.
Equity
All economic sectors should be treated fairly with regard to
taxation. Even-handed treatment of all sectors reduces imbalances
that can result in political, social and economic difficulties.
Efficiency
Taxes must generate revenue without a significant impact on the
demand for a good or service (unless the tax is designed to modify
behaviour).At a certain threshold, the benefits of a tax become less
significant than the costs of reduced demand. The decrease in
demand sends a debilitating wave throughout the economy as
linked suppliers are affected. This negative cycle swells because of
the subsequent loss of tax revenue in many sectors.
Simplicity
Complicated taxation schemes eat up revenues through
administrative costs. These costs include both those borne by
government in the process of collecting and enforcing taxes, and
those borne by taxpayers. An objective of good tax policy is to
achieve the highest possible ratio of revenues generated per dollar
invested in collecting the tax. Special note should be made to
incorporate taxpayers’ costs of compliance in calculating this ratio.
Simplicity in taxing also dictates that it is clear what the tax rates are,
and what the revenues are intended to be used for.
Fair Revenue Generation
Fair revenue generation arises from the concept of equity. In the
even-handed capturing of tax revenue, it is unreasonable to assess
special fees or levies on specific goods or services.These taxes are
often cloaked by language and terminology to hide their real intent.
Special charges and fees may appear, on face value, to be modest.
They aggregate, however, to become a cumulative and often
unreasonable burden to a sector.
Effective Stimulus to Growth
Tax incentives and disincentives should be imposed with the
underlying goal of stimulating growth. Taxes that support
infrastructure will ideally result in the attraction of investment and
subsequent employment.When taxes become excessive, economic
growth often grinds to a halt.
Many taxes on Travel & Tourism violate some or all of these
Intelligent Tax Principles. The practical reality of these principles
provides that taxes can be imposed to generate revenue, increase
competitiveness, or change consumptive behaviour. If taxes follow
the criteria above, they will result in both increased revenues for
governments and strong competitive economies.

63
TAXATIONThe tourism sector is perceived as an attractive tax target for governments whose
other tax sources are coming under threat. In addition to taxes imposed by
Caribbean governments, tourists are also faced with an array of travel-related
taxes that are now arguably the fastest-growing area of travel costs (currently
representing, for example, almost one-third of the cost of an economy fare from
London Heathrow to Miami).
While attractive for policy-makers because the bulk of the burden is
perceived to fall on non-constituents, the net consequences of taxes on Travel &
Tourism can be negative in terms of depressing demand when they pass a certain
threshold.Taxing the tourist is like a self-imposed tariff on exports, unless the
receipts are used for specific purposes that will assist the tourism industry, eg in
marketing and product development.There is need for more research to measure
and track the impact of both internal and external taxes on the tourism industry
in the Caribbean, and whether or not they place the region at a competitive
disadvantage.
However, with such a narrow tax base (other than the tourism sector), few
governments could afford to make drastic cuts in the incidence of taxation on
tourism establishments unless they were convinced that such measures would be
quickly offset by the stimulus provided to sectoral growth and investment.
This makes it even more important that taxes that are applied are
equitable and, where possible, hypothecated. One of the most
contentious issues in the region is the inequitable treatment of land-based
tourists compared with cruise passengers. The former pay significant
departure taxes while the latter pay only a token port charge, if anything.
With this said, it is important that Caribbean authorities recall the
WTTC Principles and Guidelines of Intelligent Taxation and refer to
these principles when they consider new taxes or adjustments to
existing tax structures.
AIR ACCESSThe most critical aviation issues for the Caribbean are:
Lack of Control over Airlift Airlift is critical to the existence of the Caribbean tourism industry. However, only
a very small proportion of tourism traffic that comes to the region comes in aircraft
owned by or under the control of companies or states in the region.As a result of
consolidation of international airline companies, regions (such as the Caribbean)
with few airline services of their own will find themselves more and more at the
mercy of a dwindling number of external airlines, both in respect of the services on
offer and the price at which they are sold.This raises the issue of the vulnerability
of the region’s vital tourism industry to any decisions taken by these external
carriers regarding cessation or curtailment of services, increases in fares, etc.
There is need for the creation of a viable Caribbean air transport system,
to supplement the services being provided by the external carriers and to
guarantee sustainability of air transport services for the region.
Viability of Regional CarriersA core prerequisite of airline sustainability is profitability unless shareholders
value other components (eg tourism promotion) whose enhancement outweighs
the airline losses.
Lack of Co-operation between Regional CarriersIf the region is to solve some of its airlift problems and not be totally dependent
on foreign carriers, there is a need for regional carriers to work more closely
together, both to provide point-to-point service from some external markets to the
region, and to distribute that traffic to the smaller destination countries which will
otherwise be deprived of business.The Caribbean carriers should be encouraged
by specific policy incentives to return to the blueprint for functional co-operation
in regional transportation detailed in the 1993 CTO study, as well as to
In order to assist decision-makers in developing sound Travel &
Tourism tax policies,WTTC has developed the following guidelines
for taxing the world’s largest industry:
■ Tax officials should compile a complete picture of individual
Travel & Tourism taxes and add-on charges, and compare this
level with other economically strategic industries.
■ The Travel & Tourism private sector should be an active
participant in the formulation of tax policies affecting the
industry. Policy-makers should seek input from the industry
when considering any tax or fee on Travel & Tourism services,
products or consumers.
■ Taxes that directly inhibit the competitiveness and vitality of
Travel & Tourism should be avoided. Consultation with the
Travel & Tourism industry can help policy-makers raise needed
revenue while sustaining the employment and revenue base of
the industry.
■ Policy makers should apply the same standards to Travel &
Tourism exports that are applied to manufactured goods.
International Travel & Tourism is essentially an export industry.
Taxing inbound travel is equivalent to taxing an export product.
■ Growing the Travel & Tourism tax base should have priority over
raising tax rates. Sustainable economic growth in the industry
will yield increased public revenues if taxes do not hinder market
processes.
■ Travel & Tourism development policy must be consistent and
synchronized with fiscal policy.This requires an examination of
the tax vehicles used across all sectors comprising the Travel &
Tourism Industry.
■ Travel & Tourism taxes should be easily administered and
collected. Imposing taxes that are difficult to administer and
collect results in increased costs to government and industry,
negating or reducing net proceeds to both entities.
■ Education and research into the effects of Travel & Tourism taxes
should be encouraged. Many policy-makers are not familiar with
the scope and economic power of Travel & Tourism. Every effort
should be made to familiarize policy-makers with the realities of
Travel & Tourism tax economics.
WTTC Tax Policy Guidelines

64
rationalize services both with each other and external carriers in the context of
new ‘hub and spoke’ arrangements. The processes for cost reduction have been
detailed and accepted, but will need to be updated.While regional airlines seem
to prefer to focus on achieving revenue improvement through strategic alliances
with extra-regional airlines, the two approaches are not incompatible.
Airport Safety and Security Very few Caribbean countries currently meet the ICAO safety oversight standards
and have the International Air Safety Assessment Programme Category 1
classification.This situation is a serious impediment for air access. For example, the
USA penalizes those countries that do not maintain appropriate safety oversight
standards by restricting the operational flexibility and curtailing the expansion of
their designated airlines to serve the USA.The US airlines are free to continue to
expand services to Category 2 countries while BWIA, Suriname Airways, etc are
not.A further significant restriction is the inability of any Category 1 airline that
serves the USA to put its designator code on flights of Category 2 airlines in any
part of the world even where the specific flights of the Category 1 airline do not
serve the USA.
The inclusion of Annex 17 to the Convention on International Civil
Aviation, which deals with aviation security, in the ICAO Universal Safety
Oversight programme, will impose further obligations on states to significantly
enhance aviation safety to satisfy revised international standards, including the
commitment of additional financial resources.There is need to implement proposals
for the formation of a Regional Safety and Security Oversight Authority to
facilitate the cost effective attainment and maintenance of ICAO safety oversight
standards.
CRUISE TOURISMCruise tourism in the Caribbean has, over the past decade, generally grown faster
than land-based tourism.This trend is likely to continue. Based on current trends
and planned capacity increase, CTO projects the number of cruise passenger visits
to Caribbean destinations to increase from just under 14 million visits in 2000
to 19.5 million visits by 2005. In line with its faster growth, the relative
importance of cruise tourism expenditure (compared with expenditure of land-
based tourism) has also grown in recent years, and currently accounts for around
10 per cent of the Caribbean’s total visitor receipts.
While cruise tourism makes a significant economic contribution to
Caribbean economies (and this is likely to increase in both absolute and relative
terms), Caribbean destinations need to balance cruise tourism development with
that of their land-based tourism (which, in every case, makes a larger economic
contribution), and decide on the most appropriate mix. However, the two sub-
sectors need to work together, especially in the area of tourism marketing, to regain
declining market shares.
Critical issues include:
■ Declining market share – while remaining a leading destination region, the
Caribbean’s share of cruise business has declined from a peak of 60 per cent
of all bed-days marketed out of North America in 1991 to 48 per cent in
2000.
■ Increasing dominance by a few players – a series of mergers and acquisitions
over the past decade has led to the emergence of a few large companies which
now dominate the industry,with two companies – Carnival and Royal Caribbean
– now together accounting for almost 75 per cent of total capacity deployed in the
region.

65
■ Trend towards bigger ships – there has been a marked increase in the
average size of cruise ships visiting Caribbean destinations, with the
result that most destinations are receiving an increasing number of cruise
passengers on a declining number of ships; this is placing greater pressure
on existing plant and creating a demand for new or expanded facilities to
handle these larger ships. Larger ships also lead to increased levels of
‘bunching’ with high levels of congestion on some days and little business
on other days; the result is less than optimal utilization of the available
facilities.
■ Visitor conversion – cruise tourism provides the region each year with a
large number of short-stay visitors who would have already demonstrated
their interest in the region by taking the decision to cruise in the
Caribbean. This presents destinations with the opportunity to convert
cruise visitors (many of whom admit to being on a familiarization tour
of the Caribbean) into future stayover tourists.There is need for further
research as to market perceptions of the two products, the degree of direct
competition and demand substitution between them, or the extent of
conversion to stayover visitor.
■ Regional sourcing of goods and services – further concerted efforts are
required to increase the level of regional sourcing of goods and services by
cruise lines; the industry appears to be interested in working with
Caribbean destinations in this area (eg supply of fresh fruit and
vegetables), providing that their criteria of price, quality and delivery can
be met, but quantities can be very large for a single Caribbean supplier
In addition to the critical issues cited in the 2002 Strategic Plan, it is
important to note that many industry players in the Caribbean – and
in particular hoteliers – are concerned at what they see as an unfair
playing field for cruise and land-based tourism. Despite the fast
growth of cruise passenger arrivals, their contribution to the region’s
economies is in many cases negligible, accounting for less than ten per
cent of total international tourism receipts. Moreover, the cruise
industry’s growth is largely due to its tax-free status. When some
governments have dared to consider imposing head taxes on cruise
passengers the result has usually been a pull-out from that particular
country by the cruise ship operator.
Other criticism of cruise lines relates to the fact that they have
always refused to contribute to the regional marketing campaign and
other joint marketing initiatives, and they refused to pay the
environmental levy that all land-based hotels were obliged to pay.
The regional authorities, public and private sector, should
undertake to develop and agree a regional cruise line strategy that
addresses these above-mentioned issues and many others that have
created negative perceptions, attitudes and relations between the
cruise lines, destinations and land-based operators. These include
infrastructure development, port operation, carrying capacity, port
and destination charges and cruise passenger fees. Closer co-operation
could help pave the way for a more harmonious and sustainable
relationship. In many respects the destinations need to understand
that, although they are in competition with the cruise lines for visitor
business, they are also partners. It is a difficult equation between
destinations and the cruise lines, but some kind of balance must be
achieved so all parties can benefit.

next 4-5 years.This has posed many challenges for travel agents in their role as
sources of information and as sales outlets.The use of new technologies should,
however, also be seen as providing opportunities for agents to serve the consumer
in new ways.
If managed properly, the revolution in information technology can be used
to open new opportunities for Caribbean tourism, but this means that planners
and decision-makers, in both the public and private sectors, are not only
provided with access to timely, relevant and accurate information, but have the
knowledge and tools to utilize it. National tourism organizations (NTOs) in
the Caribbean, which in some cases have been slow to respond to changes in
ways of doing business and of exploiting the potential of new technologies such
as the Internet, must quickly become much more expert as information
managers, ensuring that they have the facilities including the right personnel to
collect, store and disseminate comprehensive, high-quality information about
the tourism product.
Mention should also be made of the Caribbean Society of Hotel
Association Executives (CSHAE), comprising high-level representatives
of all the islands’ hotel associations,which is endeavouring to co-ordinate
information technology efforts and Internet presence across the region.
Critical issues for the future include:
Internet The ultimate success of the umbrella Internet system for the Caribbean,
developed by CTO (called Caribbean Global Gateways), will depend not only
on how well the umbrella system has been designed and executed, but also on the
quality of the individual participating country sites. These must achieve some
minimum quality standard in order to get maximum benefit from the new system.
Otherwise, there will be a serious risk of skewing the benefits towards those
countries with better-organized sites, not to mention the risk of compromising the
effectiveness of the entire system. There is therefore a great need for training of
personnel at all levels of the industry to ensure that they are equipped to deal with
this new technology.To minimize costs, much of the training can be provided at
regional seminars and workshops, attachments, etc.
At the regional level, there is need to develop and implement a programme
for future self-sustainability for CGG, both through cost savings and income
generation (eg via sponsorship, partnerships or sale of merchandising rights;
information sales; sale of advertising; commission on third party sales, a CGG
internet shop and the appointment of a commercial manager to develop and
promote CGG commercial activity. It is also imperative that a booking and
purchasing facility is developed for CGG.
This above-mentioned project has, nevertheless, received strong
criticism from travel agencies in the Caribbean.
Deficiencies in Existing Tourism Information SystemsThe events of 11 September highlighted the Caribbean’s inability to quickly but
accurately evaluate the immediate impact of this and similar manmade or natural
catastrophes and their likely implications for the region’s economies in the short
and medium term. In particular, this underlined the need to improve the region’s
tourism information systems in the following areas: more timely visitor arrival
statistics; improved hotel occupancy and performance statistics; improved market
intelligence and market research; improved economic analysis (ie improved
methods of measurement of the economic contribution made by tourism).
66
TIMESHAREOver the past few years, new product concepts like timeshare have
begun to find their way into the landscape of Caribbean Travel &
Tourism.
One of the world’s largest timeshare operators, Interval
International, has been following the market for timeshare
opportunities for a number of years, and it reports that timeshare
continues to be one of the fastest-growing segments of the global Travel
& Tourism economy. Global membership growth has continued to
increase over the past 22 years at a compound annual rate in excess of
17.5 per cent. Currently, over 5,000 resorts are located in over 110
countries and over nine million weeks of timeshare are owned.
In general, timeshare has matured as a Travel & Tourism product
category and is now viewed as a mainstream hospitality product that
neatly supplements hotels and other accommodation products. It
appeals to growing middle-class visitors who appreciate the entry of
larger companies with strong reputations, offering higher-quality
resorts, at affordable prices, in great destinations.The industry has also
seen increased quality exchange opportunities, more flexible
alternatives, increased consumer protection and vacation/holiday
ownership that is a good hedge against inflation.
At the same time, the public sector appreciates the sustainable
development associated with timeshare, not to mention its significantly
higher occupancies, longer visitor stays, more frequent and return visits,
and higher spending.Timeshare is also seen as a successful product for
softening down-cycles and directing traffic to new tourist areas, as well
as alleviating problems of accommodation over-supply.
Since the outlook for timeshare in the Caribbean seems so
positive, it is imperative that industry leaders work in partnership with
governments to establish sound regulations that protect the consumer
and allow legitimate timeshare developers to grow their businesses.
The cornerstone of these regulations should be a seven-day cooling
off period to allow the consumer time to think things over before a
sale becomes final.Any money paid at the time of the sale will be held
in an independent escrow account or trust during this seven-day
cooling off period.Additional mechanisms that protect the consumer’s
rights over the life of the ‘right to use’ programme must also be
instituted as another cornerstone of intelligent timeshare regulation.A
number of countries, including the USA and members of the
European Union, provide best-case examples of regulatory law for
timesharing that Caribbean governments should consider in
developing its regulatory structure.
INFORMATION MANAGEMENTTo successfully address the challenge from competing destinations in other parts
of the world, the Caribbean needs to utilize the best available tools and
technology to manage, develop and market the tourism industry. New
information-related technologies are rapidly transforming the Travel & Tourism
industry, which has been among the earliest and largest users of these new tools.
The World Tourism Organization projects that transactions over the Internet will
account for up to one quarter of all tourism sales in the main markets over the

67
ResearchResearch is needed to answer key questions about the performance and impact of
the tourism industry in the Caribbean. In the past, the main part of the CTO
research programme has been carried out on an irregular basis with assistance
from donor agencies.
Monitoring demand trends on a regular basis implies the provision
of good quality statistical data on Caribbean Travel & Tourism, including
data on international visitor arrivals and departures, intra-regional and
domestic tourism, hotel operating performance, expenditure patterns,
attitudes and preferences, as well as on the overall economic
contribution of Travel & Tourism.
The region needs to fund an ongoing comprehensive tourism research
programme that should be undertaken jointly by CTO, CHA, the UWI and
other tertiary institutions in the region, and national entities working together.
A regional Tourism Forecasting Council (TFC) – established along
the same lines as Australia’s successful TFC, in which all stakeholders are
well represented and confidentiality and trust are present to encourage
real private sector participation – could be a useful tool for ensuring the
credibility of historical results and future demand forecasts. It could also
help to anticipate future capital investment and infrastructure needs,
mitigating serious supply shortages or oversupply.
Implement Satellite Accounting on an Annual BasisTravel & Tourism needs to be effectively measured in order to
understand its full impact throughout the economy. As a new industry,
Travel & Tourism is not discretely identified in charts of national or state
accounts – its component parts are scattered throughout the accounts.
Public sector analysis and related policies tend to overlook, or
understate, the impact of the industry, or deal with its smaller individual
components.
The technique of satellite accounting is designed to measure the
new service sectors, and this Tourism Satellite Account (TSA) research
developed by WTTC and OEF for the Caribbean should prove to be a
significant tool for planning and policy development.WTTC urges the
regional organizations in concert with national government agencies,
possibly using the resources of the Tourism Forecasting Council
discussed above, to update this TSA on an annual basis to ensure that
adequate data is available to factor Travel & Tourism into economic and
employment strategies.
INTRA-CARIBBEAN TOURISMThe Caribbean market is the third largest market for the Caribbean after the
USA and Europe.Traditionally, many of the Caribbean visitors have travelled
to other Caribbean destinations mainly for business or to visit friends and/or
relatives (VFR) or to shop. More and more, however, Caribbean people travel to
other Caribbean countries for events such as festivals and sports, as well as for
leisure.
Long deprived of any form of active promotion and advertising by either
governments or the land-based private sector, the intra-Caribbean market would
appear to have a potential for growth that has not as yet been fully exploited.
Recently, a few countries and a few Caribbean carriers have been addressing this
market with some success.These efforts are now being bolstered by CTO, which
in 2001 launched for the first time a dedicated intra-Caribbean marketing
programme, with a budget of US$200,000 and the recruitment of a marketing
professional to manage the project.This effort needs to be fully supported at the
national level. It is most important that the development of the intra-Caribbean
travel market must be seen as a collaborative effort between CTO and its member
countries.

68
Cultural TourismThe region’s cultural heritage, encompassing its built heritage, monuments and
historic sites, the performing, visual and literary arts, festivals, folklore, etc, can
become an important component of the tourist product offering, and already, in
certain countries, much has been done to exploit its potential.
However, strategies need to be formulated to ensure that the further
development of the cultural heritage as a tourism product is undertaken in a
responsible and co-ordinated manner, including:
■ More research eg to create an inventory of cultural heritage sites,
monuments, landscapes and cultural patrimony, including architecture, oral
history, folk traditions, visual, literary and performing arts, archaeological
resources and collective memory working with the Caribbean Monuments
and Sites Organization (CARIMOS) and the Museums Association of
the Caribbean (MAC);
■ Development of realistic business plans by experts for any proposed heritage
tourism project, including the need to ensure that all funding is in place at
the outset of the project and that the project can generate sufficient demand
from visitors to at least cover long-term maintenance costs;
■ The need to provide co-ordinated and ongoing support to artistes and
cultural heritage institutions in the development and effective marketing of
the region’s cultural products, including specific action to raise the quality of
hotel shows to match those provided on cruise ships;
■ A specific medium-term strategy to attract and support a limited number of
‘hallmark’ cultural, sporting and other events that are compatible with the
destination and the type of tourists that the region wishes to target; and
■ Support for the development of historic or cultural ‘trails’ which link common
historical or cultural experiences; one such route, similar in concept to the Ruta
Maya in Central America and the Silk Route in Central Asia, is the Slave
Route which is being developed and implemented through UNESCO’s
Cultural Tourism Programme; and the rather similar African Diaspora
Heritage Tourism Trail which being promoted by Bermuda. It is proposed
to establish a Slave Route secretariat within CTO, but more human and
financial resources need to be allocated to get this project more firmly underway.
HUMAN RESOURCEDEVELOPMENT3
Tourism is a labour-intensive, quality-driven service profession. It depends
crucially on the skills level and professionalism of the workforce to make the sector
productive and competitive. The human resources requirements of the tourism
sector require a systematic strategy and action that is responsive to the needs of
the industry and relevant to national and regional experiences.
In this regard,Travel & Tourism, by its very nature, requires greater
flexibility of labour laws to accommodate the seasonality, daily flows and
other operating characteristics of a 24-hour daily/7-day weekly industry.
While a significant amount of tourism education and training activity is
currently being provided throughout the region, much is still unco-ordinated and
fragmented. For this reason, CTO spearheaded the setting up of the Caribbean
Tourism Human Resource Council (CTHRC) in 1997 to serve as an overall
co-ordinating agency for tourism human resource development.
It should be noted that the CTHRC has not yet really found its
stride – in fact, focus group participants said that it has generated a lot
of talk, but little action to date. The success of the Council as a co-ordinating
agency depends on building strong partnerships with key stakeholders,
particularly CHA, and for this it must be equipped with the necessary human
and financial resources – in addition to that being provided by donors such as
CIDA (for the development of a Tourism Learning System) and the EU (under
the Caribbean Regional Tourism Sector Development Programme).
Other key HRD issues include:
Global CompetitionIncreasing global competition and consolidation in Travel & Tourism are putting
pressure on Caribbean hoteliers’ profit margins while, at the same time, requiring
them to improve and differentiate their products to meet international standards
and to invest in training to upgrade the professionalism of the tourism workforce
without being able to significantly improve rewards and compensation.
Public Perception of TourismWorldwide, as well as in the Caribbean, the hospitality industry is having
difficulty in attracting and retaining motivated employees because of its image as
primarily offering low-pay, low-status jobs, with long demanding working hours
and difficult conditions, with little to offer in terms of worthwhile careers or career
advancement opportunities. Serious attention must be paid to the issues of
employee and workforce sustainability: the pressure to improve efficiency and
production must be balanced with the need for quality of work life and general
quality of life for tourism workers.
At the same time there is a real concern among some Caribbean
operators and destinations that service quality has deteriorated and is
becoming a real product delivery issue. In some cases this deterioration
reflects a lack of awareness by employees regarding the difference
between ‘service’ and ‘servitude’, which must be addressed to guarantee
the sustainability of the tourism product.
Tourism WorkforceBeing labour-intensive, the tourism sector has the potential to ease somewhat the
growing burden of unemployed or underemployed persons in the region,
particularly at the unskilled level, but it is imperative that some form of basic
skills training and re-training is provided for unemployed/underemployed
persons wishing to join the tourism workforce and become productive employees.
Tourism Education and Training ServicesThere is need to give Caribbean nationals early exposure to tourism, beginning
at the primary and secondary education levels and as a separate subject at the
CXC and CAPE secondary levels of certification in order to help create a better
understanding/appreciation of the importance of tourism, a greater social
acceptance of the sector, and to attract young people to consider and choose tourism
as a serious career option.
It is also necessary to raise the quality of tourism education and training
programmes at the post-secondary level to prepare new entrants for the sector and
to upgrade and refresh skills of tourism workers at all levels.
3See ‘Human Resource Development in the Caribbean: Competing with the Best’ (Tourism Summit Paper prepared jointly by CTO/CHA/UWI/ACTI/ and the CaribbeanCongress of Labour (CCL)
69
Adequate resources need to be provided to enable local and regional tourism
training institutions to provide quality education and training to develop a highly
competent tourism workforce.
Education and development of management talent is also crucially
important for raising standards to international levels; outmoded authoritarian or
paternalistic management styles must be replaced by a more modern ‘consultative’
style which seeks out the opinions and ideas of the employees in the decision-
making process.The new tourism manager must also understand how properly to
recruit and retain staff who can add value to the business.
Training also needs to continue into the workplace where ‘cross
training and cross flexibility’ of jobs will provide additional
opportunities and motivation to the workforce. Efforts to provide
incentives for in-house training should be explored.
INSTITUTIONALSTRENGTHENINGNational and regional tourism organizations, especially CHA and CTO,
must be equipped with the human and financial resources necessary to fulfil
their expanding mandates in the areas of product development, marketing,
human resource development and information management. In particular, with
the advent and impact of new technologies, such as the Internet, these
organizations must ensure that they have the facilities and the right personnel
to collect, store and disseminate comprehensive, high-quality information about
the tourism product.
One of the more frequent comments made during the private and
public sector focus group sessions conducted in preparation of this
report was that the roles and responsibilities of CHA and CTO were
neither sufficiently clear nor effectively communicated. It was suggested
that, in some instances, existing functions were no longer necessary,
applicable or appropriate and should be reconsidered in light of this
Strategic Plan.
WTTC recommends that, following the recently announced
retirement of the current CTO Secretary General at the end of the year
and the appointment of a new Secretary General, the CHA and CTO
should convene a Caribbean Travel & Tourism Congress. This would
involve both organizations and their respective members in designing,
agreeing and establishing a permanent Caribbean Tourism Strategy
Committee that would update and implement a public-private sector-
endorsed Caribbean Tourism Strategic Plan.
The Caribbean Tourism Strategy Committee should be the
region’s leading demonstration of public-private sector partnership with
a board of directors comprising the most influential private sector
CEOs and professional tourism directors representing all segments of
the industry, together with public sector tourism ministers from the
broadest possible range of tourism destinations.
The Tourism Strategy Committee would allow the industry to
speak regionally with one voice and provide a guiding vision to the
tactical functionality of both CHA and CTO, while at the same time
allowing them to maintain their individual mandates, personalities and
independence.
MARKETING AND FUNDINGFollowing the acceptance of the Caribbean Tourism Strategic Plan by
the Caribbean Tourism Organization Board in 2002, the entire plan was
sidelined by the disagreement of some important and influential players
over the funding mechanism necessary and appropriate to implement
the plan. Although the tourism ministers had unanimously agreed to
implement a uniform head tax of US$20 on cruise ship passengers at
the June 2003 CTO Board meeting, the agreement quickly dissolved
behind closed doors and the momentum for the Strategic Plan was lost.
It is the conclusion of WTTC, following discussions with many
parties in this matter, that the failure to reach and maintain agreement
on the funding mechanism is due to three reasons. First, there is
insufficient consensus that regional marketing for Caribbean tourism is
necessary, appropriate or feasible at this moment in time. Although
many have argued in favour of a regional marketing programme –
especially as it relates to the smaller destinations that have few local
resources (financial and other) – there is still significant reluctance by a
number of the more independent destinations to undertake a regional
marketing effort. Second, although the arguments in favour of a cruise
ship head tax were well intentioned, they completely ignored and
underestimated the politics of the proposal and it was doomed to fail
from the outset. Finally, in review of the proposed Tourism
Development Fund expenditures, the marketing item accounted for
more than three-quarters of the total expenditure, which is a major
commitment for an unproven concept and unproven organization. For
all these reasons, therefore, the momentum for the broader Strategic
Plan was lost.
Given these circumstances, WTTC recommends that the
marketing initiative be presented as an addendum in the Strategic Plan
with consideration for possible later implementation. This treatment
would allow the broader Travel & Tourism issues to become the focus
of the Strategic Plan, allow immediate implementation of the plan,
provide a basis for confidence building and require significantly lower
funding.
The funding mechanism for this Strategic Plan should be revisited
using hindsight as a guide, involving all players, public and private, and
in this case provide for a more equitable and politically sound solution.
WTTC recommends that the Caribbean Tourism Strategy Committee
previously discussed, design, agree and establish a funding mechanism
that balances the economics of supply and demand with the politics of
operators and destinations. Although the task will not be easy, it is
imperative that all players – public and private, land-based, cruise and
aviation, small and large countries, tourism-intensive and diversified –
build a consensus that works for the whole of the Caribbean.
Meanwhile, the region’s Travel & Tourism’s stakeholders could
learn some valuable lessons from the successful brand campaigns
undertaken by the Pacific Asia Travel Association (PATA). Its project
Phoenix, PATA’s most successful global consumer communications
campaign to date, was designed to re-invigorate Travel & Tourism after
the successive batterings the industry suffered over the past few years as
a result of terrorist attacks, wars and the SARS outbreak.

70
CARIBBEAN 1999 2000 2001 2002 2003E 2004E 2014P
Travel & Tourism - US$ mn
Personal Travel & Tourism 6,434.50 6,909.20 6,972.90 7,298.20 7,426.70 7,985.40 15,826.00
Business Travel & Tourism 1,392.40 1,454.20 1,384.20 1,231.80 1,215.20 1,301.70 2,545.40
Gov’t Expenditures - Individual 474.08 512.35 555.55 590.64 568.96 577.39 1,109.80
Visitor Exports 15,919.00 16,753.00 16,449.00 15,602.00 16,502.00 19,013.00 40,653.00
Travel & Tourism Consumption 24,220.00 25,629.00 25,362.00 24,722.00 25,713.00 28,878.00 60,134.00
Gov’t Expenditures - Collective 1,087.40 1,174.60 1,274.70 1,355.10 1,304.50 1,324.60 2,545.30
Capital Investment 6,054.10 6,542.30 6,826.90 7,103.60 7,234.10 7,390.90 13,712.00
Exports (Non-Visitor) 1,709.50 1,956.20 2,211.90 2,279.70 2,467.10 2,715.50 5,503.80
Travel & Tourism Demand 33,071.00 35,302.00 35,675.00 35,461.00 36,718.00 40,309.00 81,895.00
T&T Industry GDP 7,505.90 7,743.40 7,704.10 7,323.20 7,632.80 8,671.10 18,407.00
T&T Economy GDP 24,007.00 24,991.00 25,553.00 24,897.00 25,744.00 28,428.00 58,495.00
T&T Industry Employment (‘000) 719.24 721.76 681.43 656.22 697.87 814.55 1,092.10
T&T Economy Employment (‘000) 2,173.50 2,189.10 2,115.70 2,062.40 2,147.50 2,416.50 3,170.60
Travel & Tourism Accounts as % of National Accounts
Personal Travel & Tourism 6.60 6.63 6.32 6.30 6.26 6.54 7.16
Gov’t Expenditures 8.77 8.86 8.92 8.95 8.44 8.22 8.74
Capital Investment 21.98 22.31 21.98 21.85 21.77 21.67 22.41
Exports 22.45 21.34 19.78 18.13 17.77 18.39 18.75
Imports 10.06 10.58 9.83 9.72 9.56 9.69 9.91
T&T Industry GDP 5.29 5.15 4.76 4.17 4.13 4.50 5.21
T&T Economy GDP 16.92 16.62 15.79 14.17 13.93 14.75 16.55
T&T Industry Employment 4.99 4.92 4.56 4.34 4.55 5.22 5.88
T&T Economy Employment 15.08 14.91 14.16 13.63 13.99 15.48 17.06
Travel & Tourism Real Growth (per annum except 2014 = 10-year annualized)
Personal Travel & Tourism 0.87 3.92 -3.86 0.67 -1.28 6.04 3.78
Business Travel & Tourism 8.62 1.27 -7.64 -12.29 -1.84 6.90 3.77
Gov’t Expenditures 1.48 4.89 3.83 3.85 -4.76 1.19 3.31
Capital Investment 6.23 5.42 -0.13 1.52 0.39 1.65 3.11
Visitor Exports 2.72 2.12 -5.73 -7.58 5.05 16.81 4.41
Other Exports 16.08 11.60 3.57 -2.27 3.56 8.03 3.93
Travel & Tourism Demand 3.79 3.67 -3.42 -3.51 1.94 9.97 3.96
T&T Industry GDP 1.43 0.07 -4.25 -7.12 3.65 14.85 4.38
T&T Economy GDP 2.39 1.07 -1.87 -4.93 2.41 11.02 4.08
T&T Industry Employment 1.63 0.35 -5.59 -3.70 6.35 16.72 2.99
T&T Economy Employment 1.39 0.72 -3.35 -2.52 4.12 12.52 2.76
ANGUILLA 1999 2000 2001 2002 2003E 2004E 2014P
Travel & Tourism - US$ mn
Personal Travel & Tourism 9.19 10.21 9.94 10.03 10.46 11.57 24.21
Business Travel & Tourism 1.41 1.45 1.28 1.15 1.22 1.38 2.85
Gov’t Expenditures - Individual 0.45 0.57 0.55 0.63 0.64 0.65 1.40
Visitor Exports 57.50 56.63 59.99 56.51 60.18 67.81 152.22
Travel & Tourism Consumption 68.55 68.86 71.76 68.32 72.50 81.41 180.68
Gov’t Expenditures - Collective 1.25 1.25 1.33 1.37 1.50 1.63 3.08
Capital Investment 7.16 7.37 7.70 8.13 8.67 9.25 17.63
Exports (Non-Visitor) 1.45 2.29 2.15 2.29 2.41 2.56 4.43
Travel & Tourism Demand 78.41 79.76 82.93 80.11 85.07 94.85 205.82
T&T Industry GDP 24.67 24.13 25.49 23.86 25.42 28.77 66.24
T&T Economy GDP 63.62 63.46 66.60 63.34 67.56 75.91 170.12
T&T Industry Employment (‘000) 1.68 1.70 1.84 1.76 1.71 1.91 3.20
T&T Economy Employment (‘000) 4.16 4.26 4.60 4.46 4.34 4.80 7.92
SATELLITE ACCOUNT

71
TABLES
Travel & Tourism Accounts as % of National Accounts
Personal Travel & Tourism 12.53 13.07 12.30 11.76 11.51 11.96 13.33
Gov’t Expenditures 13.14 13.19 13.23 13.27 13.33 13.39 13.97
Capital Investment 55.36 53.45 53.95 54.04 54.12 54.20 55.03
Exports 51.35 50.19 50.01 47.25 47.15 48.48 53.47
Imports 11.68 12.10 11.71 11.39 11.30 11.61 13.02
T&T Industry GDP 28.59 27.91 29.05 26.95 25.41 27.26 36.34
T&T Economy GDP 73.74 73.40 75.91 71.55 67.54 71.94 93.31
T&T Industry Employment 33.16 32.38 33.70 31.27 29.47 31.63 38.30
T&T Economy Employment 82.14 81.42 84.29 79.12 74.67 79.69 95.00
Travel & Tourism Real Growth (per annum except 2014 = 10-year annualized)
Personal Travel & Tourism -1.55 10.62 -2.00 -3.50 1.73 7.91 5.07
Business Travel & Tourism 8.24 2.10 -11.28 -13.62 3.19 10.23 4.94
Gov’t Expenditures 10.54 6.45 4.41 1.29 4.35 4.34 4.35
Capital Investment 3.72 2.33 5.15 1.08 4.07 4.05 4.06
Visitor Exports -5.66 -1.98 6.60 -9.88 3.90 9.92 5.80
Other Exports 30.83 57.69 -5.60 1.98 2.50 3.80 3.06
Travel & Tourism Demand -3.36 1.25 4.64 -7.60 3.61 8.77 5.44
T&T Industry GDP -5.06 -2.63 6.31 -10.47 3.93 10.43 6.08
T&T Economy GDP -3.80 -0.73 5.62 -9.02 4.07 9.60 5.78
T&T Industry Employment -10.23 1.03 8.47 -4.24 -2.80 11.38 5.35
T&T Economy Employment -9.42 2.58 7.87 -3.11 -2.67 10.77 5.17
ANTIGUA AND BARBUDA 1999 2000 2001 2002 2003E 2004E 2014P
Travel & Tourism - US$ mn
Personal Travel & Tourism 51.06 49.31 49.02 50.52 52.68 57.98 100.73
Business Travel & Tourism 18.94 20.09 18.82 18.41 19.57 22.16 44.57
Gov’t Expenditures - Individual 12.03 12.90 15.97 13.34 14.18 15.07 28.82
Visitor Exports 356.60 362.03 339.69 323.84 338.36 402.56 807.49
Travel & Tourism Consumption 438.64 444.34 423.50 406.12 424.79 497.77 981.61
Gov’t Expenditures - Collective 27.67 29.37 36.32 30.73 32.45 34.73 65.99
Capital Investment 151.57 147.08 135.73 161.09 169.75 180.83 336.22
Exports (Non-Visitor) 1.03 1.76 1.42 1.50 1.62 1.79 3.39
Travel & Tourism Demand 618.90 622.55 596.98 599.43 628.61 715.12 1,387.21
T&T Industry GDP 169.33 172.48 163.68 155.43 162.59 192.61 388.24
T&T Economy GDP 548.52 553.79 529.72 529.67 555.55 635.85 1,253.50
T&T Industry Employment (‘000) 10.26 10.42 9.64 8.88 8.96 10.38 12.91
T&T Economy Employment (‘000) 26.79 27.05 27.22 25.98 26.25 28.31 32.05
Travel & Tourism Accounts as % of National Accounts
Personal Travel & Tourism 12.86 13.42 13.55 11.70 11.49 11.90 11.31
Gov’t Expenditures 27.07 27.18 27.52 27.19 27.29 27.40 28.55
Capital Investment 73.60 73.11 73.03 73.35 73.46 73.58 74.86
Exports 75.12 74.30 72.85 70.72 70.13 72.27 71.89
Imports 13.28 13.84 14.16 13.62 13.43 13.86 14.74
T&T Industry GDP 25.99 26.15 23.99 21.83 21.74 24.87 29.08
T&T Economy GDP 84.20 83.95 77.65 74.40 74.28 82.12 93.89
T&T Industry Employment 36.39 36.61 33.59 30.57 30.44 34.82 38.28
T&T Economy Employment 95.00 95.00 94.82 89.39 89.18 95.00 95.00

72
Travel & Tourism Real Growth (per annum except 2014 = 10-year annualized)
Personal Travel & Tourism 1.50 -2.24 -3.68 0.84 1.74 7.37 3.13
Business Travel & Tourism 2.92 7.39 -9.25 -4.29 3.74 10.44 4.64
Gov’t Expenditures 3.21 7.80 19.84 -17.54 3.23 4.18 4.05
Capital Investment 5.13 -1.76 -10.60 16.12 2.81 3.93 3.80
Visitor Exports 10.10 2.78 -9.10 -6.72 1.94 16.06 4.62
Other Exports 17.72 72.75 -21.71 3.34 4.97 8.23 3.98
Travel & Tourism Demand 7.43 1.83 -7.10 -1.75 2.32 10.98 4.25
T&T Industry GDP 9.64 3.11 -8.06 -7.09 2.06 15.57 4.66
T&T Economy GDP 8.21 2.21 -7.33 -2.17 2.34 11.65 4.42
T&T Industry Employment 6.74 1.55 -7.48 -7.87 0.83 15.85 2.23
T&T Economy Employment 1.20 0.95 0.64 -4.56 1.02 7.86 1.25
ARUBA 1999 2000 2001 2002 2003E 2004E 2014P
Travel & Tourism - US$ mn
Personal Travel & Tourism 171.37 182.83 172.00 162.37 164.42 181.65 384.41
Business Travel & Tourism 44.58 44.69 45.16 41.54 44.95 51.45 121.26
Gov’t Expenditures - Individual 18.15 19.53 21.05 22.91 24.86 27.01 61.50
Visitor Exports 832.60 674.30 924.80 905.37 923.92 1,021.80 1,904.45
Travel & Tourism Consumption 1,066.70 921.35 1,163.00 1,132.18 1,158.14 1,281.92 2,471.62
Gov’t Expenditures - Collective 41.45 44.79 48.43 52.51 57.03 61.90 141.04
Capital Investment 155.10 161.92 175.31 188.97 204.72 221.68 488.05
Exports (Non-Visitor) 39.60 44.67 75.50 56.19 62.63 66.95 127.21
Travel & Tourism Demand 1,302.84 1,172.74 1,462.24 1,429.84 1,482.52 1,632.44 3,227.90
T&T Industry GDP 363.83 281.82 400.38 398.45 404.78 448.43 872.35
T&T Economy GDP 1,016.95 833.59 1,152.22 1,150.25 1,185.47 1,305.76 2,620.05
T&T Industry Employment (‘000) 14.85 11.05 15.01 14.43 14.12 14.99 18.99
T&T Economy Employment (‘000) 38.04 29.38 39.18 37.75 37.29 39.43 50.99
Travel & Tourism Accounts as % of National Accounts
Personal Travel & Tourism 14.63 14.53 12.72 11.12 10.42 10.66 10.43
Gov’t Expenditures 20.35 20.45 20.55 20.66 20.76 20.87 21.98
Capital Investment 77.59 75.38 75.92 75.78 76.00 76.19 77.55
Exports 36.29 20.98 31.66 36.65 34.61 35.23 33.16
Imports 10.52 10.31 10.36 10.38 10.02 10.16 11.73
T&T Industry GDP 21.53 15.62 20.78 19.31 18.26 18.72 16.84
T&T Economy GDP 60.17 46.19 59.81 55.74 53.47 54.52 50.58
T&T Industry Employment 30.14 21.86 29.09 27.03 25.56 26.21 23.58
T&T Economy Employment 77.20 58.11 75.95 70.70 67.49 68.96 63.30
Travel & Tourism Real Growth (per annum except 2014 = 10-year annualized)
Personal Travel & Tourism 6.13 2.98 -9.09 -8.66 -2.30 6.03 3.45
Business Travel & Tourism 11.77 -3.23 -2.34 -11.01 4.41 9.85 4.58
Gov’t Expenditures 7.99 4.17 4.39 5.01 4.76 4.21 4.21
Capital Investment 2.83 0.77 4.62 4.29 4.53 3.92 3.85
Visitor Exports 4.21 -21.83 32.53 -5.28 -1.54 6.14 2.14
Other Exports 42.40 8.90 63.32 -28.00 7.56 2.59 2.33
Travel & Tourism Demand 5.57 -13.11 20.49 -5.39 0.04 5.68 2.75
T&T Industry GDP 2.97 -25.23 37.29 -3.71 -1.99 6.32 2.58
T&T Economy GDP 3.81 -20.88 33.57 -3.41 -0.56 5.71 2.90
T&T Industry Employment 10.77 -25.56 35.78 -3.85 -2.15 6.14 2.40
T&T Economy Employment 11.35 -22.75 33.35 -3.66 -1.22 5.73 2.61

73
BAHAMAS 1999 2000 2001 2002 2003E 2004E 2014P
Travel & Tourism - US$ mn
Personal Travel & Tourism 616.48 612.18 640.11 655.19 689.53 745.97 1,427.94
Business Travel & Tourism 106.43 89.94 91.28 81.58 86.99 97.76 189.94
Gov’t Expenditures - Individual 22.58 24.24 25.64 26.97 28.76 30.61 56.75
Visitor Exports 1,597.80 1,829.30 1,681.90 1,507.10 1,613.40 1,884.40 4,490.02
Travel & Tourism Consumption 2,343.29 2,555.66 2,438.93 2,270.84 2,418.68 2,758.73 6,164.64
Gov’t Expenditures - Collective 51.92 55.36 58.85 61.90 65.96 70.15 130.02
Capital Investment 538.23 581.73 632.78 667.86 709.70 752.80 1,357.80
Exports (Non-Visitor) 23.47 21.22 18.55 27.68 29.36 31.40 59.78
Travel & Tourism Demand 2,956.91 3,213.98 3,149.11 3,028.29 3,223.71 3,613.07 7,712.24
T&T Industry GDP 838.34 920.66 884.26 801.67 858.54 990.45 2,296.32
T&T Economy GDP 2,431.41 2,645.57 2,623.74 2,473.15 2,644.02 2,986.82 6,555.23
T&T Industry Employment (‘000) 38.77 40.28 39.26 35.30 37.57 42.08 67.28
T&T Economy Employment (‘000) 101.71 105.03 104.57 96.48 102.56 113.29 174.70
Travel & Tourism Accounts as % of National Accounts
Personal Travel & Tourism 21.24 19.82 19.60 19.13 18.97 19.37 20.80
Gov’t Expenditures 13.58 13.64 13.69 13.74 13.79 13.85 14.40
Capital Investment 63.05 64.04 65.88 66.32 66.39 66.47 67.26
Exports 73.99 64.57 67.17 63.37 63.52 65.48 69.05
Imports 19.03 17.85 19.43 18.41 18.24 18.76 21.94
T&T Industry GDP 18.51 19.11 18.38 16.19 16.90 18.56 24.14
T&T Economy GDP 53.70 54.91 54.55 49.95 52.05 55.96 68.91
T&T Industry Employment 25.92 26.75 25.74 22.67 23.66 25.98 33.79
T&T Economy Employment 68.00 69.77 68.55 61.96 64.59 69.93 87.75
Travel & Tourism Real Growth (per annum except 2014 = 10-year annualized)
Personal Travel & Tourism 5.74 -2.48 2.54 0.14 3.49 5.54 4.11
Business Travel & Tourism 21.59 -17.01 -0.47 -12.57 4.85 9.64 4.28
Gov’t Expenditures 5.21 4.93 4.08 2.91 4.80 3.77 3.77
Capital Investment 4.55 6.14 6.67 3.26 4.49 3.48 3.49
Visitor Exports 14.08 12.43 -9.84 -12.34 5.27 13.95 6.45
Other Exports 133.66 -11.20 -14.29 46.02 4.31 4.31 4.05
Travel & Tourism Demand 10.88 6.74 -3.92 -5.92 4.68 9.34 5.26
T&T Industry GDP 13.81 7.84 -5.81 -11.31 5.31 12.55 6.15
T&T Economy GDP 12.29 6.85 -2.75 -7.78 5.13 10.21 5.56
T&T Industry Employment 10.84 3.89 -2.51 -10.09 6.42 12.02 4.83
T&T Economy Employment 9.87 3.27 -0.44 -7.74 6.29 10.46 4.45
BARBADOS 1999 2000 2001 2002 2003E 2004E 2014P
Travel & Tourism - US$ mn
Personal Travel & Tourism 169.01 177.87 187.93 184.92 187.64 204.00 377.03
Business Travel & Tourism 58.59 63.96 62.25 55.89 56.12 62.27 124.13
Gov’t Expenditures - Individual 24.66 26.90 28.39 27.87 28.19 29.57 55.85
Visitor Exports 686.50 721.50 696.30 670.94 699.43 843.21 1,687.78
Travel & Tourism Consumption 938.76 990.24 974.88 939.62 971.38 1,139.04 2,244.79
Gov’t Expenditures - Collective 56.74 61.50 65.17 64.14 64.56 67.86 128.17
Capital Investment 311.61 329.10 347.04 364.84 383.66 402.35 742.25
Exports (Non-Visitor) 7.71 11.93 9.99 10.35 10.87 12.06 24.24
Travel & Tourism Demand 1,314.81 1,392.76 1,397.07 1,378.96 1,430.47 1,621.31 3,139.45
T&T Industry GDP 344.78 363.35 354.70 341.07 353.06 420.26 843.87
T&T Economy GDP 1,121.65 1,187.93 1,188.64 1,174.27 1,218.94 1,391.87 2,731.97
T&T Industry Employment (‘000) 22.02 22.34 21.23 23.44 24.07 28.04 39.97
T&T Economy Employment (‘000) 63.89 65.05 62.96 70.94 72.99 82.43 115.54

74
Travel & Tourism Accounts as % of National Accounts
Personal Travel & Tourism 10.79 11.06 11.07 10.52 10.60 11.00 11.21
Gov’t Expenditures 14.43 14.50 14.56 14.54 14.55 14.59 15.20
Capital Investment 65.07 64.65 64.82 64.91 65.00 65.09 66.20
Exports 53.21 53.21 51.79 51.96 51.66 54.23 53.23
Imports 13.34 13.50 14.37 13.89 13.54 13.94 15.19
T&T Industry GDP 13.85 13.76 12.79 13.81 13.86 15.75 18.30
T&T Economy GDP 45.05 44.97 42.87 47.55 47.86 52.18 59.26
T&T Industry Employment 17.45 17.33 16.12 17.40 17.47 19.85 23.06
T&T Economy Employment 50.61 50.46 47.79 52.66 52.97 58.35 66.66
Travel & Tourism Real Growth (per annum except 2014 = 10-year annualized)
Personal Travel & Tourism 2.34 6.31 2.14 -1.77 -0.03 6.18 3.76
Business Travel & Tourism -1.46 10.28 -5.92 -10.38 -1.07 8.35 4.55
Gov’t Expenditures 10.40 9.70 2.31 -1.83 -0.70 2.60 3.97
Capital Investment 5.22 6.68 1.94 4.95 3.60 2.42 3.72
Visitor Exports -6.77 6.16 -6.71 -3.81 2.70 17.74 4.60
Other Exports 18.87 56.19 -19.02 3.43 3.50 8.34 4.61
Travel & Tourism Demand -1.68 7.00 -3.03 -1.47 2.20 10.69 4.24
T&T Industry GDP -5.10 6.45 -5.63 -4.01 1.98 16.26 4.63
T&T Economy GDP -1.76 6.98 -3.28 -1.38 2.27 11.52 4.38
T&T Industry Employment -3.48 1.45 -4.96 10.41 2.67 16.50 3.63
T&T Economy Employment -1.00 1.82 -3.21 12.67 2.89 12.93 3.45
BERMUDA 1999 2000 2001 2002 2003E 2004E 2014P
Travel & Tourism - US$ mn
Personal Travel & Tourism 183.00 180.00 171.07 168.86 173.73 190.01 350.00
Business Travel & Tourism 37.57 40.03 34.88 30.71 32.16 36.02 68.09
Gov’t Expenditures - Individual 17.92 18.79 18.88 19.95 21.16 22.40 40.12
Visitor Exports 479.00 431.00 351.00 315.50 338.49 394.79 905.50
Travel & Tourism Consumption 717.49 669.81 575.82 535.02 565.54 643.22 1,363.71
Gov’t Expenditures - Collective 41.08 42.98 43.55 45.74 48.43 51.41 92.03
Capital Investment 222.50 228.84 231.06 240.14 252.70 267.42 468.26
Exports (Non-Visitor) 19.91 21.13 29.36 31.01 32.27 33.85 50.29
Travel & Tourism Demand 1,000.98 962.76 879.79 851.91 898.94 995.90 1,974.28
T&T Industry GDP 228.73 208.69 172.53 156.62 167.85 194.64 442.35
T&T Economy GDP 768.53 730.33 657.98 633.47 674.13 753.14 1,552.49
T&T Industry Employment (‘000) 4.43 3.91 3.24 2.85 2.92 3.23 4.79
T&T Economy Employment (‘000) 12.84 11.66 10.24 9.40 9.61 10.33 14.28
Travel & Tourism Accounts as % of National Accounts
Personal Travel & Tourism 8.85 8.51 7.95 7.59 7.47 7.73 8.25
Gov’t Expenditures 18.09 18.14 18.15 18.21 18.28 18.35 19.04
Capital Investment 46.05 45.52 45.64 45.68 45.74 45.81 46.50
Exports 33.42 29.92 25.74 23.08 23.31 24.93 30.61
Imports 13.37 13.19 12.91 12.62 12.47 12.89 14.57
T&T Industry GDP 8.85 7.76 6.37 5.57 5.68 6.23 8.62
T&T Economy GDP 29.72 27.15 24.29 22.52 22.80 24.11 30.24
T&T Industry Employment 12.38 10.86 8.92 7.79 7.95 8.72 12.06
T&T Economy Employment 35.87 32.35 28.22 25.74 26.11 27.90 36.01
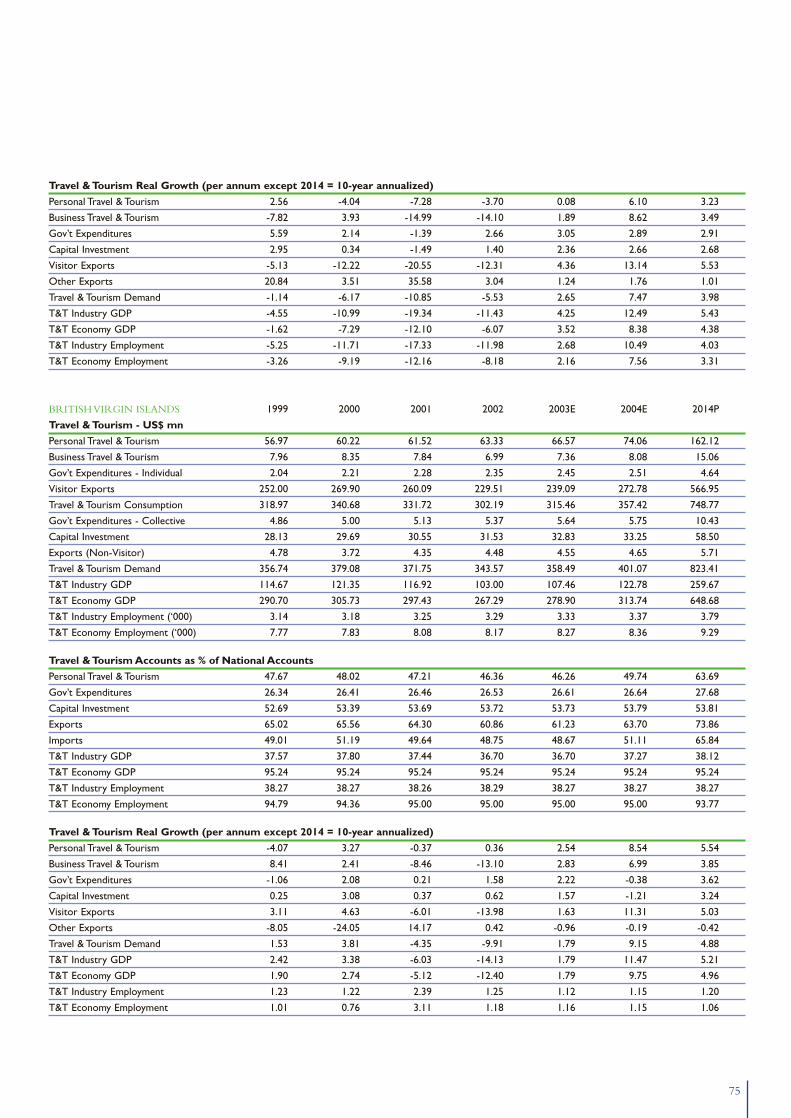
75
Travel & Tourism Real Growth (per annum except 2014 = 10-year annualized)
Personal Travel & Tourism 2.56 -4.04 -7.28 -3.70 0.08 6.10 3.23
Business Travel & Tourism -7.82 3.93 -14.99 -14.10 1.89 8.62 3.49
Gov’t Expenditures 5.59 2.14 -1.39 2.66 3.05 2.89 2.91
Capital Investment 2.95 0.34 -1.49 1.40 2.36 2.66 2.68
Visitor Exports -5.13 -12.22 -20.55 -12.31 4.36 13.14 5.53
Other Exports 20.84 3.51 35.58 3.04 1.24 1.76 1.01
Travel & Tourism Demand -1.14 -6.17 -10.85 -5.53 2.65 7.47 3.98
T&T Industry GDP -4.55 -10.99 -19.34 -11.43 4.25 12.49 5.43
T&T Economy GDP -1.62 -7.29 -12.10 -6.07 3.52 8.38 4.38
T&T Industry Employment -5.25 -11.71 -17.33 -11.98 2.68 10.49 4.03
T&T Economy Employment -3.26 -9.19 -12.16 -8.18 2.16 7.56 3.31
BRITISH VIRGIN ISLANDS 1999 2000 2001 2002 2003E 2004E 2014P
Travel & Tourism - US$ mn
Personal Travel & Tourism 56.97 60.22 61.52 63.33 66.57 74.06 162.12
Business Travel & Tourism 7.96 8.35 7.84 6.99 7.36 8.08 15.06
Gov’t Expenditures - Individual 2.04 2.21 2.28 2.35 2.45 2.51 4.64
Visitor Exports 252.00 269.90 260.09 229.51 239.09 272.78 566.95
Travel & Tourism Consumption 318.97 340.68 331.72 302.19 315.46 357.42 748.77
Gov’t Expenditures - Collective 4.86 5.00 5.13 5.37 5.64 5.75 10.43
Capital Investment 28.13 29.69 30.55 31.53 32.83 33.25 58.50
Exports (Non-Visitor) 4.78 3.72 4.35 4.48 4.55 4.65 5.71
Travel & Tourism Demand 356.74 379.08 371.75 343.57 358.49 401.07 823.41
T&T Industry GDP 114.67 121.35 116.92 103.00 107.46 122.78 259.67
T&T Economy GDP 290.70 305.73 297.43 267.29 278.90 313.74 648.68
T&T Industry Employment (‘000) 3.14 3.18 3.25 3.29 3.33 3.37 3.79
T&T Economy Employment (‘000) 7.77 7.83 8.08 8.17 8.27 8.36 9.29
Travel & Tourism Accounts as % of National Accounts
Personal Travel & Tourism 47.67 48.02 47.21 46.36 46.26 49.74 63.69
Gov’t Expenditures 26.34 26.41 26.46 26.53 26.61 26.64 27.68
Capital Investment 52.69 53.39 53.69 53.72 53.73 53.79 53.81
Exports 65.02 65.56 64.30 60.86 61.23 63.70 73.86
Imports 49.01 51.19 49.64 48.75 48.67 51.11 65.84
T&T Industry GDP 37.57 37.80 37.44 36.70 36.70 37.27 38.12
T&T Economy GDP 95.24 95.24 95.24 95.24 95.24 95.24 95.24
T&T Industry Employment 38.27 38.27 38.26 38.29 38.27 38.27 38.27
T&T Economy Employment 94.79 94.36 95.00 95.00 95.00 95.00 93.77
Travel & Tourism Real Growth (per annum except 2014 = 10-year annualized)
Personal Travel & Tourism -4.07 3.27 -0.37 0.36 2.54 8.54 5.54
Business Travel & Tourism 8.41 2.41 -8.46 -13.10 2.83 6.99 3.85
Gov’t Expenditures -1.06 2.08 0.21 1.58 2.22 -0.38 3.62
Capital Investment 0.25 3.08 0.37 0.62 1.57 -1.21 3.24
Visitor Exports 3.11 4.63 -6.01 -13.98 1.63 11.31 5.03
Other Exports -8.05 -24.05 14.17 0.42 -0.96 -0.19 -0.42
Travel & Tourism Demand 1.53 3.81 -4.35 -9.91 1.79 9.15 4.88
T&T Industry GDP 2.42 3.38 -6.03 -14.13 1.79 11.47 5.21
T&T Economy GDP 1.90 2.74 -5.12 -12.40 1.79 9.75 4.96
T&T Industry Employment 1.23 1.22 2.39 1.25 1.12 1.15 1.20
T&T Economy Employment 1.01 0.76 3.11 1.18 1.16 1.15 1.06

76
CAYMAN ISLANDS 1999 2000 2001 2002 2003E 2004E 2014P
Travel & Tourism - US$ mn
Personal Travel & Tourism 54.52 58.60 63.44 68.03 72.09 80.04 205.44
Business Travel & Tourism 32.69 36.51 31.56 28.20 30.19 34.34 77.50
Gov’t Expenditures - Individual 11.01 11.89 14.11 14.86 16.05 17.30 37.58
Visitor Exports 508.30 554.69 483.28 448.27 451.19 499.79 1,051.20
Travel & Tourism Consumption 606.52 661.69 592.38 559.37 569.52 631.46 1,371.72
Gov’t Expenditures - Collective 25.19 27.41 32.47 34.23 36.71 39.60 86.12
Capital Investment 95.40 82.49 118.05 94.62 101.09 108.33 209.94
Exports (Non-Visitor) 15.30 22.89 81.98 26.88 27.34 28.34 27.79
Travel & Tourism Demand 742.41 794.48 824.89 715.10 734.66 807.73 1,695.57
T&T Industry GDP 220.68 245.00 207.55 196.37 197.91 220.27 479.65
T&T Economy GDP 610.24 663.46 662.05 573.27 584.25 644.40 1,358.40
T&T Industry Employment (‘000) 5.49 5.75 4.64 4.20 4.00 4.18 4.71
T&T Economy Employment (‘000) 13.95 14.44 12.97 11.06 10.62 11.03 12.17
Travel & Tourism Accounts as % of National Accounts
Personal Travel & Tourism 5.29 5.26 4.86 4.96 4.91 5.08 6.30
Gov’t Expenditures 28.09 28.23 28.53 28.62 28.75 28.89 30.34
Capital Investment 70.51 56.43 68.86 52.52 52.47 52.40 49.05
Exports 56.24 57.84 59.26 50.96 50.47 52.01 68.51
Imports 17.00 15.69 18.48 15.26 15.11 15.25 15.93
T&T Industry GDP 17.46 18.19 14.57 13.09 12.38 12.84 13.51
T&T Economy GDP 48.28 49.26 46.46 38.21 36.56 37.57 38.26
T&T Industry Employment 24.45 25.47 20.39 18.32 17.34 17.98 18.91
T&T Economy Employment 62.18 63.92 57.00 48.28 46.02 47.44 48.85
Travel & Tourism Real Growth (per annum except 2014 = 10-year annualized)
Personal Travel & Tourism 5.09 4.76 5.40 4.43 3.17 7.80 6.69
Business Travel & Tourism 11.66 8.87 -15.84 -12.98 4.23 10.42 5.34
Gov’t Expenditures 5.32 5.83 15.42 2.61 4.65 4.69 4.93
Capital Investment -12.70 -15.71 39.33 -21.95 4.01 4.05 3.73
Visitor Exports 6.65 6.37 -15.17 -9.68 -2.00 7.55 4.59
Other Exports -40.25 45.85 248.73 -68.08 -0.94 0.62 -3.05
Travel & Tourism Demand 2.12 4.31 1.09 -15.59 0.03 6.75 4.57
T&T Industry GDP 9.93 8.22 -17.52 -7.87 -1.87 8.06 4.96
T&T Economy GDP 4.81 5.97 -2.84 -15.68 -0.77 7.09 4.61
T&T Industry Employment 5.54 4.91 -19.36 -9.52 -4.72 4.45 1.22
T&T Economy Employment 2.33 3.51 -10.20 -14.71 -4.02 3.83 1.00
CUBA 1999 2000 2001 2002 2003E 2004E 2014P
Travel & Tourism - US$ mn
Personal Travel & Tourism 874.62 973.40 872.07 1,004.74 1,068.60 1,155.90 2,058.93
Business Travel & Tourism 128.70 134.92 119.29 106.41 112.34 125.22 227.39
Gov’t Expenditures - Individual 36.21 38.18 40.23 42.81 45.71 48.30 82.44
Visitor Exports 1,879.80 1,926.40 1,876.50 1,864.60 2,038.00 2,458.60 4,901.95
Travel & Tourism Consumption 2,919.33 3,072.90 2,908.08 3,018.56 3,264.65 3,788.02 7,270.71
Gov’t Expenditures - Collective 83.09 87.49 92.32 98.10 104.78 110.76 189.28
Capital Investment 675.56 714.69 737.09 781.34 832.38 877.97 1,469.00
Exports (Non-Visitor) 35.80 41.00 44.91 48.47 50.62 53.29 86.85
Travel & Tourism Demand 3,713.78 3,916.08 3,782.40 3,946.46 4,252.43 4,830.03 9,015.84
T&T Industry GDP 860.72 886.70 872.82 864.37 943.60 1,134.95 2,267.73
T&T Economy GDP 2,634.24 2,738.10 2,745.87 2,775.66 3,008.45 3,490.61 6,681.86
T&T Industry Employment (‘000) 162.27 159.67 152.35 140.98 146.14 166.86 220.24
T&T Economy Employment (‘000) 489.63 485.95 472.07 445.55 458.68 505.87 640.75

77
Travel & Tourism Accounts as % of National Accounts
Personal Travel & Tourism 5.29 5.61 4.78 5.20 5.21 5.35 5.71
Gov’t Expenditures 5.56 5.58 5.60 5.62 5.64 5.66 5.86
Capital Investment 15.05 15.16 14.88 14.89 14.92 14.94 15.14
Exports 44.44 42.16 41.18 39.31 39.93 42.90 45.57
Imports 21.58 21.08 18.21 20.33 20.40 20.94 22.65
T&T Industry GDP 4.42 4.32 4.04 3.78 3.91 4.45 5.71
T&T Economy GDP 13.53 13.33 12.72 12.15 12.46 13.68 16.83
T&T Industry Employment 3.87 3.78 3.54 3.31 3.42 3.89 5.00
T&T Economy Employment 11.67 11.49 10.96 10.46 10.73 11.79 14.53
Travel & Tourism Real Growth (per annum except 2014 = 10-year annualized)
Personal Travel & Tourism -1.35 2.70 -12.23 7.67 1.30 4.01 2.87
Business Travel & Tourism -1.54 -3.27 -13.38 -16.63 0.55 7.18 3.08
Gov’t Expenditures -1.18 -2.80 3.33 -0.65 1.72 1.63 2.43
Capital Investment 1.21 -2.38 1.04 -0.94 1.46 1.42 2.22
Visitor Exports 0.98 -5.44 -4.57 -7.14 4.10 16.00 4.04
Other Exports -13.23 5.70 7.30 0.86 -0.53 1.22 1.95
Travel & Tourism Demand 0.15 -2.70 -5.37 -2.49 2.63 9.22 3.35
T&T Industry GDP -0.62 -4.94 -3.56 -7.45 3.97 15.65 4.06
T&T Economy GDP -0.76 -4.09 -1.75 -5.53 3.23 11.57 3.61
T&T Industry Employment 2.05 -1.60 -4.58 -7.47 3.66 14.18 2.82
T&T Economy Employment 1.91 -0.75 -2.86 -5.62 2.95 10.29 2.40
CURAÇAO 1999 2000 2001 2002 2003E 2004E 2014P
Travel & Tourism - US$ mn
Personal Travel & Tourism 191.20 189.20 184.88 178.24 179.14 193.59 328.32
Business Travel & Tourism 69.31 67.67 72.84 64.20 67.27 73.98 115.87
Gov’t Expenditures - Individual 6.13 6.73 7.34 8.06 8.80 9.08 13.52
Visitor Exports 267.00 227.00 253.00 232.97 223.29 266.63 528.88
Travel & Tourism Consumption 533.64 490.60 518.06 483.47 478.51 543.27 986.59
Gov’t Expenditures - Collective 13.97 15.54 16.89 18.47 20.19 21.08 31.14
Capital Investment 85.38 97.72 106.86 100.13 108.30 112.45 164.82
Exports (Non-Visitor) 12.64 9.46 11.04 11.17 11.34 11.72 16.68
Travel & Tourism Demand 645.63 613.32 652.85 613.24 618.33 688.52 1,199.22
T&T Industry GDP 86.58 56.62 72.30 73.59 71.44 89.44 188.25
T&T Economy GDP 252.39 174.30 222.51 229.23 228.55 277.01 547.81
T&T Industry Employment (‘000) 2.07 1.25 1.51 1.46 1.36 1.63 2.53
T&T Economy Employment (‘000) 5.45 3.41 4.12 4.03 3.81 4.47 6.65
Travel & Tourism Accounts as % of National Accounts
Personal Travel & Tourism 11.17 11.12 10.63 10.01 9.70 10.10 11.86
Gov’t Expenditures 4.67 4.69 4.72 4.75 4.77 4.79 4.91
Capital Investment 21.62 22.48 22.71 19.54 19.45 19.47 19.76
Exports 21.61 18.11 18.96 17.00 15.63 17.11 18.62
Imports 22.40 25.17 24.14 21.40 21.19 21.61 23.02
T&T Industry GDP 2.79 1.72 2.08 1.99 1.83 2.16 2.91
T&T Economy GDP 8.13 5.28 6.39 6.20 5.84 6.69 8.48
T&T Industry Employment 3.90 2.40 2.91 2.79 2.56 3.02 4.08
T&T Economy Employment 10.27 6.56 7.93 7.67 7.16 8.29 10.73

78
Travel & Tourism Real Growth (per annum except 2014 = 10-year annualized)
Personal Travel & Tourism -1.18 -6.47 -4.04 -4.00 -1.46 5.43 3.39
Business Travel & Tourism 39.82 -7.72 5.70 -12.23 2.73 7.28 2.56
Gov’t Expenditures 5.40 4.70 6.88 9.05 7.09 1.47 1.97
Capital Investment 25.86 8.18 7.38 -6.70 6.04 1.31 1.86
Visitor Exports 1.92 -19.64 9.45 -8.31 -6.04 16.50 5.01
Other Exports -6.41 -29.24 14.61 0.72 -0.47 0.83 1.57
Travel & Tourism Demand 6.64 -10.21 4.53 -6.47 -1.15 8.64 3.65
T&T Industry GDP -2.11 -38.19 25.40 1.34 -4.82 22.15 5.66
T&T Economy GDP 0.05 -34.73 25.37 2.58 -2.25 18.25 4.99
T&T Industry Employment -9.03 -39.61 20.90 -3.11 -7.02 19.96 4.52
T&T Economy Employment -7.70 -37.40 20.90 -2.33 -5.35 17.38 4.08
DOMINICA 1999 2000 2001 2002 2003E 2004E 2014P
Travel & Tourism - US$ mn
Personal Travel & Tourism 19.61 18.88 18.29 17.22 17.31 18.92 32.21
Business Travel & Tourism 3.73 3.98 3.94 3.30 3.48 3.96 6.93
Gov’t Expenditures - Individual 1.13 1.09 1.10 1.05 1.11 1.17 1.97
Visitor Exports 50.41 48.59 46.93 41.88 37.57 44.00 91.07
Travel & Tourism Consumption 74.88 72.54 70.25 63.45 59.48 68.05 132.19
Gov’t Expenditures - Collective 2.47 2.59 2.56 2.43 2.54 2.74 4.44
Capital Investment 12.04 11.61 12.83 13.26 13.87 14.79 23.80
Exports (Non-Visitor) 1.57 2.28 1.64 1.88 2.06 2.22 3.91
Travel & Tourism Demand 90.95 89.02 87.28 81.02 77.95 87.80 164.34
T&T Industry GDP 23.69 22.80 22.26 19.72 17.99 21.08 43.39
T&T Economy GDP 66.97 65.24 64.62 59.53 56.21 64.36 125.92
T&T Industry Employment (‘000) 2.98 2.73 2.80 2.63 2.45 2.84 4.11
T&T Economy Employment (‘000) 8.22 7.61 7.90 7.71 7.39 8.39 11.61
Travel & Tourism Accounts as % of National Accounts
Personal Travel & Tourism 11.70 10.67 11.29 10.79 10.39 10.66 11.42
Gov’t Expenditures 5.96 5.97 5.96 5.95 5.96 5.99 6.18
Capital Investment 17.90 17.45 17.55 17.55 17.57 17.60 17.82
Exports 33.15 32.80 33.99 30.57 27.34 29.27 31.88
Imports 13.28 12.99 13.57 13.13 12.84 13.28 14.71
T&T Industry GDP 8.85 8.46 8.46 7.80 7.15 8.21 11.32
T&T Economy GDP 25.02 24.19 24.56 23.54 22.34 25.08 32.85
T&T Industry Employment 8.28 7.91 7.91 7.29 6.69 7.68 10.59
T&T Economy Employment 22.83 22.05 22.36 21.36 20.21 22.73 29.91
Travel & Tourism Real Growth (per annum except 2014 = 10-year annualized)
Personal Travel & Tourism 5.31 -4.28 -4.95 -5.56 0.01 7.70 3.42
Business Travel & Tourism 6.27 6.09 -2.94 -15.98 5.01 12.07 3.72
Gov’t Expenditures 3.26 1.68 -2.68 -4.17 4.24 5.37 3.01
Capital Investment -1.71 -4.07 8.40 3.63 4.08 5.08 2.82
Visitor Exports 23.24 -4.16 -5.26 -10.49 -10.73 15.37 5.46
Other Exports 4.23 44.49 -29.62 15.20 9.03 6.28 3.75
Travel & Tourism Demand 13.31 -2.68 -3.83 -6.89 -4.28 10.98 4.40
T&T Industry GDP 23.08 -4.30 -4.25 -11.14 -9.20 15.41 5.41
T&T Economy GDP 18.06 -3.14 -2.84 -7.60 -6.04 12.81 4.86
T&T Industry Employment 20.58 -8.45 2.45 -5.91 -7.08 15.98 3.81
T&T Economy Employment 16.12 -7.43 3.82 -2.46 -4.14 13.59 3.32

79
DOMINICAN REPUBLIC 1999 2000 2001 2002 2003E 2004E 2014P
Travel & Tourism - US$ mn
Personal Travel & Tourism 697.80 796.03 804.95 811.42 658.62 626.15 1,632.01
Business Travel & Tourism 256.79 292.78 286.04 245.19 189.58 157.61 347.30
Gov’t Expenditures - Individual 90.34 107.29 125.58 133.56 89.34 68.94 146.72
Visitor Exports 2,550.30 2,931.30 2,756.10 2,806.30 2,965.60 3,196.90 5,890.46
Travel & Tourism Consumption 3,595.22 4,127.40 3,972.66 3,996.47 3,903.15 4,049.60 8,016.50
Gov’t Expenditures - Collective 207.06 245.97 287.82 306.47 204.96 158.21 336.46
Capital Investment 1,014.40 1,151.40 1,218.80 1,219.00 1,008.40 794.25 1,641.00
Exports (Non-Visitor) 172.95 172.39 154.65 152.68 167.18 185.58 303.84
Travel & Tourism Demand 4,989.63 5,697.16 5,633.94 5,674.63 5,283.69 5,187.64 10,297.80
T&T Industry GDP 1,263.07 1,404.95 1,391.55 1,397.87 1,385.72 1,406.93 2,641.22
T&T Economy GDP 4,023.66 4,445.20 4,533.68 4,561.24 4,274.66 4,096.35 7,810.70
T&T Industry Employment (‘000) 198.77 200.36 184.14 192.14 211.83 268.94 319.12
T&T Economy Employment (‘000) 622.02 622.92 588.78 615.27 642.79 772.21 930.01
Travel & Tourism Accounts as % of National Accounts
Personal Travel & Tourism 5.36 5.27 5.01 5.03 5.18 6.26 8.04
Gov’t Expenditures 21.15 21.37 21.57 21.66 20.98 20.58 21.58
Capital Investment 24.42 24.81 24.91 24.91 24.84 24.87 25.33
Exports 34.10 34.44 34.60 35.32 34.57 34.24 35.19
Imports 10.40 11.54 10.93 10.95 10.62 10.75 12.28
T&T Industry GDP 7.29 7.17 6.56 6.60 7.12 8.76 7.54
T&T Economy GDP 23.21 22.69 21.37 21.55 21.97 25.50 22.30
T&T Industry Employment 6.42 6.32 5.78 5.82 6.28 7.72 6.65
T&T Economy Employment 20.10 19.66 18.49 18.64 19.05 22.17 19.37
Travel & Tourism Real Growth (per annum except 2014 = 10-year annualized)
Personal Travel & Tourism 0.39 8.28 -4.08 5.21 -13.46 15.74 5.36
Business Travel & Tourism 8.28 8.22 -7.33 -10.53 -17.56 1.21 3.60
Gov’t Expenditures -5.29 12.74 11.01 11.10 -28.69 -6.04 3.26
Capital Investment 1.25 7.73 0.41 4.39 -11.80 -4.11 2.96
Visitor Exports 13.58 9.09 -10.81 6.28 12.67 31.24 1.77
Other Exports 12.22 -5.39 -14.91 3.05 16.74 35.14 0.58
Travel & Tourism Demand 7.36 8.37 -6.20 5.13 -0.73 19.53 2.53
T&T Industry GDP 6.74 5.58 -6.05 4.85 5.69 23.60 1.96
T&T Economy GDP 3.73 4.86 -3.25 5.01 -0.08 16.66 2.12
T&T Industry Employment 2.79 0.80 -8.10 4.35 10.25 26.96 1.74
T&T Economy Employment 0.02 0.15 -5.48 4.50 4.47 20.13 1.89
GRENADA 1999 2000 2001 2002 2003E 2004E 2014P
Travel & Tourism - US$ mn
Personal Travel & Tourism 27.82 30.73 26.80 29.18 30.83 33.89 67.45
Business Travel & Tourism 7.77 8.89 8.78 8.95 9.48 10.74 20.11
Gov’t Expenditures - Individual 1.86 2.04 2.41 2.18 2.40 2.45 4.48
Visitor Exports 63.76 67.81 63.76 60.30 62.44 74.91 155.46
Travel & Tourism Consumption 101.20 109.48 101.75 100.61 105.17 121.99 247.50
Gov’t Expenditures - Collective 4.34 4.71 5.54 5.10 5.33 5.85 10.32
Capital Investment 32.09 36.17 26.58 34.84 36.91 39.53 68.91
Exports (Non-Visitor) 2.08 2.20 2.34 2.66 2.87 3.12 5.92
Travel & Tourism Demand 139.71 152.56 136.22 143.21 150.28 170.48 332.64
T&T Industry GDP 31.24 33.27 31.70 30.62 31.93 37.98 79.07
T&T Economy GDP 103.95 112.13 101.11 105.87 110.93 127.85 253.84
T&T Industry Employment (‘000) 3.20 3.21 3.20 3.10 3.15 3.58 5.39
T&T Economy Employment (‘000) 10.05 10.20 9.68 10.09 10.27 11.35 16.42

80
Travel & Tourism Accounts as % of National Accounts
Personal Travel & Tourism 13.80 12.59 10.82 9.69 9.68 9.96 11.53
Gov’t Expenditures 11.50 11.56 11.68 11.61 11.65 11.71 12.14
Capital Investment 21.19 20.96 20.85 20.95 20.98 21.02 21.33
Exports 30.20 29.36 30.74 28.15 27.36 29.25 29.65
Imports 13.60 13.27 13.10 12.94 12.89 13.34 15.90
T&T Industry GDP 8.27 8.18 7.96 7.50 7.45 8.27 10.02
T&T Economy GDP 27.53 27.58 25.39 25.94 25.87 27.84 32.16
T&T Industry Employment 8.25 8.16 7.94 7.48 7.42 8.25 9.99
T&T Economy Employment 25.91 25.92 24.03 24.32 24.23 26.17 30.40
Travel & Tourism Real Growth (per annum except 2014 = 10-year annualized)
Personal Travel & Tourism 5.91 9.69 -15.15 5.69 3.11 7.24 5.04
Business Travel & Tourism 9.28 13.73 -3.93 -1.05 3.38 10.49 4.41
Gov’t Expenditures 6.24 8.10 14.65 -11.14 3.59 4.76 3.88
Capital Investment 6.76 11.93 -28.49 27.25 3.37 4.47 3.65
Visitor Exports 6.07 5.61 -8.50 -8.19 1.03 17.04 5.49
Other Exports 93.83 4.88 3.73 10.22 5.37 5.78 4.54
Travel & Tourism Demand 7.10 8.43 -13.11 2.06 2.38 10.68 4.83
T&T Industry GDP 6.15 5.76 -7.31 -6.20 1.72 16.05 5.53
T&T Economy GDP 7.69 7.11 -12.26 1.65 2.22 12.44 5.02
T&T Industry Employment 1.22 0.33 -0.42 -2.92 1.42 13.59 4.22
T&T Economy Employment 2.52 1.47 -5.08 4.21 1.85 10.46 3.77
GUADELOUPE 1999 2000 2001 2002 2003E 2004E 2014P
Travel & Tourism - US$ mn
Personal Travel & Tourism 104.97 96.73 96.86 104.38 116.27 129.44 252.78
Business Travel & Tourism 42.18 37.80 32.31 29.19 32.23 36.74 63.99
Gov’t Expenditures - Individual 13.76 12.54 12.64 13.99 15.49 16.76 27.68
Visitor Exports 375.00 418.00 365.71 365.21 394.91 454.54 1,001.76
Travel & Tourism Consumption 535.91 565.07 507.51 512.78 558.90 637.48 1,346.21
Gov’t Expenditures - Collective 31.44 28.93 29.06 32.02 35.62 38.47 63.41
Capital Investment 97.79 90.11 90.42 99.69 124.64 135.66 191.73
Exports (Non-Visitor) 41.08 38.72 47.66 49.84 54.87 61.33 155.00
Travel & Tourism Demand 706.21 722.84 674.65 694.33 774.03 872.95 1,756.35
T&T Industry GDP 177.08 194.25 163.79 163.16 177.65 203.90 424.59
T&T Economy GDP 543.81 572.93 507.34 518.16 579.92 656.16 1,288.23
T&T Industry Employment (‘000) 24.08 29.11 24.62 22.76 22.87 24.85 38.80
T&T Economy Employment (‘000) 70.74 82.53 72.88 68.88 70.93 76.10 112.79
Travel & Tourism Accounts as % of National Accounts
Personal Travel & Tourism 6.38 6.38 6.35 6.44 6.50 6.73 8.22
Gov’t Expenditures 20.13 20.01 20.02 20.14 20.27 20.37 21.03
Capital Investment 20.81 20.77 20.74 20.85 23.63 23.91 21.15
Exports 37.47 41.48 34.19 33.27 32.88 33.51 31.18
Imports 13.47 13.45 12.45 12.53 12.60 12.67 12.21
T&T Industry GDP 8.86 10.52 8.74 7.94 7.84 8.36 10.90
T&T Economy GDP 27.21 31.03 27.08 25.21 25.58 26.91 33.07
T&T Industry Employment 8.72 10.36 8.60 7.81 7.71 8.23 10.73
T&T Economy Employment 25.62 29.36 25.47 23.65 23.91 25.20 31.18

81
Travel & Tourism Real Growth (per annum except 2014 = 10-year annualized)
Personal Travel & Tourism 5.48 4.27 2.10 0.34 -8.74 -3.01 7.12
Business Travel & Tourism 9.12 1.40 -12.86 -15.86 -9.54 -0.70 5.95
Gov’t Expenditures 10.33 3.80 2.53 2.75 -9.02 -5.83 5.30
Capital Investment 10.30 4.27 2.31 2.66 2.43 -5.18 3.65
Visitor Exports -7.19 26.12 -10.79 -7.02 -11.41 0.28 8.46
Other Exports 10.21 6.65 25.51 -2.63 -9.81 -2.63 9.87
Travel & Tourism Demand -0.41 15.81 -4.83 -4.17 -8.67 -1.75 7.43
T&T Industry GDP -5.67 24.12 -14.02 -7.25 -10.80 -0.01 7.85
T&T Economy GDP -1.95 19.20 -9.71 -4.91 -8.31 -1.43 7.18
T&T Industry Employment -7.86 20.90 -15.42 -7.54 0.49 8.65 4.58
T&T Economy Employment -4.68 16.68 -11.70 -5.48 2.97 7.29 4.02
HAITI 1999 2000 2001 2002 2003E 2004E 2014P
Travel & Tourism - US$ mn
Personal Travel & Tourism 136.11 134.02 126.82 115.75 111.56 113.60 166.15
Business Travel & Tourism 56.87 60.20 50.18 39.14 36.68 38.33 57.78
Gov’t Expenditures - Individual 2.55 2.24 2.10 1.83 1.51 1.45 2.12
Visitor Exports 59.04 58.52 49.32 44.70 47.04 53.92 130.35
Travel & Tourism Consumption 254.57 254.98 228.41 201.42 196.78 207.30 356.40
Gov’t Expenditures - Collective 5.75 5.27 4.80 4.36 3.34 3.35 4.69
Capital Investment 52.13 44.12 39.65 35.13 34.81 34.49 48.23
Exports (Non-Visitor) 11.67 10.69 9.72 10.83 11.69 12.95 26.77
Travel & Tourism Demand 324.11 315.07 282.59 251.73 246.62 258.08 436.08
T&T Industry GDP 76.64 73.23 65.43 55.46 52.54 54.93 104.20
T&T Economy GDP 224.93 208.70 186.65 160.36 152.49 158.48 293.36
T&T Industry Employment (‘000) 43.99 47.76 43.83 41.79 41.68 40.36 60.84
T&T Economy Employment (‘000) 131.25 138.17 126.90 122.73 122.93 118.28 173.75
Travel & Tourism Accounts as % of National Accounts
Personal Travel & Tourism 4.01 4.23 4.06 4.04 4.12 4.24 4.47
Gov’t Expenditures 2.97 2.95 2.94 2.92 2.86 2.86 2.93
Capital Investment 4.60 4.40 4.38 4.37 4.93 4.64 4.68
Exports 13.39 14.02 12.75 11.55 11.50 11.74 13.05
Imports 8.48 8.34 7.82 7.63 7.55 7.66 8.06
T&T Industry GDP 1.87 2.00 1.79 1.69 1.65 1.57 1.96
T&T Economy GDP 5.50 5.70 5.12 4.88 4.80 4.53 5.52
T&T Industry Employment 1.46 1.55 1.39 1.31 1.28 1.22 1.52
T&T Economy Employment 4.35 4.49 4.04 3.85 3.79 3.58 4.35
Travel & Tourism Real Growth (per annum except 2014 = 10-year annualized)
Personal Travel & Tourism -4.11 11.09 -6.50 0.39 -0.38 -6.52 1.54
Business Travel & Tourism -0.53 19.43 -17.63 -14.21 -3.13 -4.07 1.84
Gov’t Expenditures 55.90 2.20 -9.25 -1.41 -19.01 -9.13 1.24
Capital Investment 14.93 -4.51 -11.20 -2.56 2.44 -9.03 1.09
Visitor Exports -7.41 11.83 -16.73 -0.30 8.78 5.22 6.81
Other Exports 11.89 3.40 -10.16 22.57 11.54 1.66 5.11
Travel & Tourism Demand 0.04 9.67 -11.38 -2.02 1.27 -3.94 3.01
T&T Industry GDP -7.38 7.80 -11.71 -6.77 -2.09 -4.03 4.21
T&T Economy GDP -3.13 4.68 -11.63 -5.50 -1.70 -4.60 3.96
T&T Industry Employment -7.67 8.57 -8.23 -4.65 -0.25 -3.17 4.19
T&T Economy Employment -3.21 5.27 -8.15 -3.29 0.16 -3.79 3.93

82
JAMAICA 1999 2000 2001 2002 2003E 2004E 2014P
Travel & Tourism - US$ mn
Personal Travel & Tourism 0.36 0.35 0.34 0.38 0.38 0.41 0.75
Business Travel & Tourism 0.18 0.19 0.19 0.16 0.14 0.15 0.30
Gov’t Expenditures - Individual 0.06 0.06 0.06 0.07 0.06 0.06 0.11
Visitor Exports 1.49 1.58 1.49 1.48 1.59 1.87 4.23
Travel & Tourism Consumption 2.09 2.17 2.08 2.09 2.18 2.49 5.40
Gov’t Expenditures - Collective 0.14 0.14 0.13 0.16 0.14 0.14 0.26
Capital Investment 0.58 0.67 0.81 0.69 0.63 0.64 1.14
Exports (Non-Visitor) 0.04 0.03 0.02 0.03 0.03 0.03 0.05
Travel & Tourism Demand 2.85 3.01 3.05 2.97 2.98 3.30 6.85
T&T Industry GDP 0.75 0.78 0.72 0.73 0.76 0.87 1.95
T&T Economy GDP 2.37 2.47 2.45 2.39 2.38 2.65 5.63
T&T Industry Employment (‘000) 102.03 105.13 98.12 96.68 111.80 130.31 190.19
T&T Economy Employment (‘000) 312.45 326.19 322.18 309.15 343.73 387.40 538.96
Travel & Tourism Accounts as % of National Accounts
Personal Travel & Tourism 7.17 6.63 6.33 7.27 7.88 8.42 8.82
Gov’t Expenditures 15.80 15.81 15.77 15.92 15.82 15.82 16.44
Capital Investment 30.91 31.85 34.98 32.00 32.13 32.25 32.91
Exports 43.89 43.97 43.59 45.02 46.04 47.87 51.61
Imports 11.95 12.18 12.97 12.02 11.91 12.13 12.71
T&T Industry GDP 10.01 10.08 9.31 9.04 10.29 11.82 14.85
T&T Economy GDP 31.43 32.08 31.48 29.70 32.45 35.95 42.90
T&T Industry Employment 9.07 9.13 8.44 8.19 9.33 10.71 13.45
T&T Economy Employment 27.78 28.33 27.70 26.18 28.68 31.84 38.12
Travel & Tourism Real Growth (per annum except 2014 = 10-year annualized)
Personal Travel & Tourism 7.93 -5.66 -1.54 11.34 11.05 8.76 2.64
Business Travel & Tourism 5.11 3.83 -1.36 -16.12 2.56 7.78 3.03
Gov’t Expenditures -3.52 -0.89 -2.98 15.46 1.75 1.73 2.55
Capital Investment 3.69 13.84 21.82 -16.23 1.79 2.10 2.36
Visitor Exports 6.52 4.34 -4.50 -2.51 20.42 18.48 4.82
Other Exports 15.23 -27.47 -27.23 15.49 19.24 12.23 2.44
Travel & Tourism Demand 5.37 4.17 1.80 -4.22 12.48 12.05 3.88
T&T Industry GDP 5.40 1.32 -5.99 -1.48 16.42 16.66 4.68
T&T Economy GDP 4.56 2.74 -0.17 -4.22 11.66 12.55 4.13
T&T Industry Employment 6.95 3.04 -6.66 -1.47 15.64 16.56 3.87
T&T Economy Employment 6.14 4.40 -1.23 -4.05 11.19 12.70 3.37
MARTINIQUE 1999 2000 2001 2002 2003E 2004E 2014P
Travel & Tourism - US$ mn
Personal Travel & Tourism 308.42 320.79 333.68 348.72 358.83 381.03 776.89
Business Travel & Tourism 49.10 48.50 46.90 45.02 57.44 67.44 138.34
Gov’t Expenditures - Individual 12.46 11.68 12.13 13.81 17.79 19.82 36.61
Visitor Exports 404.00 302.00 245.00 251.99 287.17 352.66 595.75
Travel & Tourism Consumption 773.98 682.98 637.71 659.54 721.23 820.94 1,547.58
Gov’t Expenditures - Collective 28.74 26.67 27.75 31.56 40.97 45.34 84.04
Capital Investment 217.71 198.91 208.79 236.16 302.43 333.94 604.02
Exports (Non-Visitor) 38.58 41.66 56.49 59.95 62.68 66.07 108.99
Travel & Tourism Demand 1,059.01 950.22 930.74 987.20 1,127.31 1,266.29 2,344.64
T&T Industry GDP 184.89 137.71 113.39 117.18 142.09 174.98 313.54
T&T Economy GDP 653.69 522.58 482.48 519.56 647.91 760.15 1,372.11
T&T Industry Employment (‘000) 11.17 8.67 6.71 6.09 5.82 6.53 6.86
T&T Economy Employment (‘000) 34.40 28.18 23.83 22.34 21.81 23.56 24.88

83
Travel & Tourism Accounts as % of National Accounts
Personal Travel & Tourism 7.16 7.69 7.58 7.00 5.65 5.41 5.84
Gov’t Expenditures 7.71 7.67 7.69 7.75 7.87 7.92 8.24
Capital Investment 18.47 18.04 18.17 18.21 18.28 18.32 18.60
Exports 20.86 16.43 14.05 13.56 13.69 15.03 13.78
Imports 13.86 13.82 13.84 13.80 13.52 13.64 16.60
T&T Industry GDP 3.71 2.85 2.18 1.96 1.85 2.06 1.95
T&T Economy GDP 13.12 10.82 9.29 8.70 8.46 8.95 8.55
T&T Industry Employment 4.72 3.62 2.78 2.49 2.36 2.62 2.48
T&T Economy Employment 14.52 11.77 9.85 9.15 8.83 9.45 9.01
Travel & Tourism Real Growth (per annum except 2014 = 10-year annualized)
Personal Travel & Tourism 2.18 12.68 0.17 -5.49 -16.62 -0.37 4.83
Business Travel & Tourism 9.04 7.02 -6.90 -13.17 3.38 10.16 4.88
Gov’t Expenditures 4.64 0.84 0.14 2.88 4.95 4.04 3.79
Capital Investment 0.28 -1.02 1.09 2.29 3.77 3.60 3.54
Visitor Exports -5.31 -19.02 -21.88 -6.98 -7.66 15.22 2.89
Other Exports 24.48 16.98 30.57 -4.02 -15.27 -1.11 2.62
Travel & Tourism Demand -0.19 -2.80 -5.67 -4.07 -7.47 5.39 3.81
T&T Industry GDP -2.91 -19.31 -20.71 -6.54 -1.74 15.54 3.48
T&T Economy GDP -0.44 -13.40 -11.09 -2.61 1.05 10.08 3.54
T&T Industry Employment -6.58 -22.36 -22.60 -9.22 -4.54 12.24 0.53
T&T Economy Employment -4.81 -18.09 -15.44 -6.23 -2.40 8.02 0.56
PUERTO RICO 1999 2000 2001 2002 2003E 2004E 2014P
Travel & Tourism - US$ mn
Personal Travel & Tourism 1,816.90 2,014.37 2,143.63 2,206.19 2,311.45 2,533.06 5,032.28
Business Travel & Tourism 100.89 110.18 100.71 89.41 95.00 107.01 216.32
Gov’t Expenditures - Individual 91.71 100.34 108.83 115.19 123.07 131.45 254.69
Visitor Exports 2,235.40 2,498.30 2,831.30 2,480.00 2,620.30 3,040.60 7,464.86
Travel & Tourism Consumption 4,244.90 4,723.18 5,184.47 4,890.79 5,149.83 5,812.11 12,968.20
Gov’t Expenditures - Collective 210.59 230.18 249.78 264.14 282.17 301.51 584.45
Capital Investment 999.50 991.03 1,068.10 1,127.70 1,202.00 1,281.20 2,425.80
Exports (Non-Visitor) 962.90 1,063.26 1,269.65 1,358.53 1,474.60 1,637.34 3,397.65
Travel & Tourism Demand 6,417.89 7,007.65 7,772.00 7,641.16 8,108.59 9,032.16 19,376.10
T&T Industry GDP 932.28 1,052.39 1,164.75 1,015.48 1,071.22 1,239.37 2,941.78
T&T Economy GDP 3,545.89 3,913.56 4,359.54 4,047.54 4,298.57 4,881.61 10,881.00
T&T Industry Employment (‘000) 24.46 27.50 28.53 21.15 20.95 23.30 36.93
T&T Economy Employment (‘000) 84.67 92.70 96.35 76.91 76.65 83.19 121.53
Travel & Tourism Accounts as % of National Accounts
Personal Travel & Tourism 5.20 5.30 5.23 5.10 5.03 5.18 5.54
Gov’t Expenditures 3.82 3.85 3.87 3.88 3.90 3.91 4.08
Capital Investment 11.43 10.43 10.41 10.43 10.45 10.47 10.66
Exports 7.69 7.80 7.64 6.59 6.46 6.66 7.21
Imports 5.97 6.09 5.97 5.84 5.76 5.85 5.93
T&T Industry GDP 1.61 1.72 1.72 1.29 1.26 1.36 1.69
T&T Economy GDP 6.13 6.41 6.42 5.16 5.05 5.34 6.26
T&T Industry Employment 1.95 2.12 2.12 1.54 1.49 1.63 2.15
T&T Economy Employment 6.76 7.14 7.16 5.58 5.46 5.82 7.07

84
Travel & Tourism Real Growth (per annum except 2014 = 10-year annualized)
Personal Travel & Tourism -3.64 6.94 -4.32 -4.97 -1.16 5.37 3.00
Business Travel & Tourism 4.21 5.33 -17.82 -18.02 0.25 8.30 3.18
Gov’t Expenditures 4.54 5.46 -2.45 -2.33 0.78 2.73 2.73
Capital Investment 14.58 -4.36 -3.10 -2.51 0.56 2.48 2.49
Visitor Exports -7.32 7.80 1.89 -19.12 -0.32 11.57 5.23
Other Exports 8.59 6.51 7.36 -1.20 2.40 6.76 3.43
Travel & Tourism Demand -0.38 5.32 -0.29 -9.22 0.11 7.10 3.79
T&T Industry GDP -7.17 8.88 -0.49 -19.50 -0.48 11.24 4.87
T&T Economy GDP -1.51 6.46 0.15 -14.27 0.19 9.19 4.20
T&T Industry Employment 0.82 12.42 3.73 -25.85 -0.95 11.23 4.76
T&T Economy Employment 0.71 9.48 3.94 -20.17 -0.34 8.53 3.89
SAINT KITTS AND NEVIS 1999 2000 2001 2002 2003E 2004E 2014P
Travel & Tourism - US$ mn
Personal Travel & Tourism 22.44 24.60 21.62 22.11 22.81 24.90 54.44
Business Travel & Tourism 8.45 9.22 9.12 8.51 9.27 10.90 28.03
Gov’t Expenditures - Individual 2.78 3.43 3.46 3.31 3.63 4.05 9.59
Visitor Exports 70.00 58.00 62.00 55.96 54.29 63.73 135.48
Travel & Tourism Consumption 103.67 95.25 96.20 89.89 90.00 103.59 227.55
Gov’t Expenditures - Collective 6.32 8.08 7.79 7.79 8.41 9.26 22.04
Capital Investment 28.51 39.42 40.97 42.44 45.78 50.18 112.72
Exports (Non-Visitor) 1.50 1.30 1.58 1.68 1.76 1.91 3.27
Travel & Tourism Demand 140.00 144.05 146.54 141.80 145.96 164.93 365.58
T&T Industry GDP 31.93 25.41 27.26 24.54 24.47 29.44 72.51
T&T Economy GDP 100.81 92.10 98.71 92.96 95.76 112.12 278.42
T&T Industry Employment (‘000) 2.22 1.76 1.85 1.53 1.44 1.70 2.59
T&T Economy Employment (‘000) 6.45 5.72 6.00 5.15 4.98 5.75 8.82
Travel & Tourism Accounts as % of National Accounts
Personal Travel & Tourism 11.90 9.89 10.54 9.77 9.35 9.30 9.03
Gov’t Expenditures 14.08 14.27 14.25 14.24 14.31 14.40 15.21
Capital Investment 25.37 25.92 25.98 26.01 25.99 25.95 25.89
Exports 49.49 41.67 41.84 38.27 36.38 38.46 40.63
Imports 17.77 21.00 20.11 19.78 19.62 19.91 22.95
T&T Industry GDP 10.62 7.74 7.95 6.95 6.76 7.90 10.91
T&T Economy GDP 33.52 28.04 28.79 26.35 26.45 30.09 41.87
T&T Industry Employment 12.06 8.79 9.04 7.90 7.68 8.98 12.39
T&T Economy Employment 35.04 28.54 29.31 26.60 26.56 30.35 42.18
Travel & Tourism Real Growth (per annum except 2014 = 10-year annualized)
Personal Travel & Tourism 21.55 5.76 -14.38 0.15 1.76 7.56 6.02
Business Travel & Tourism 4.19 5.29 -3.62 -8.62 7.39 15.94 7.77
Gov’t Expenditures 9.65 22.02 -4.82 -3.30 6.98 8.82 6.91
Capital Investment 13.89 33.35 1.27 1.45 6.38 7.99 6.30
Visitor Exports -8.99 -20.08 4.15 -11.60 -4.33 15.65 5.75
Other Exports -5.83 -16.89 19.08 3.76 3.43 6.81 3.48
Travel & Tourism Demand 1.14 -0.76 -0.88 -5.23 1.51 11.33 6.17
T&T Industry GDP -10.75 -23.25 4.54 -11.85 -1.64 18.52 7.32
T&T Economy GDP -6.07 -11.88 4.42 -7.76 1.58 15.36 7.39
T&T Industry Employment -12.00 -20.65 4.91 -17.28 -5.88 18.06 4.34
T&T Economy Employment -8.36 -11.31 4.80 -14.13 -3.34 15.43 4.40
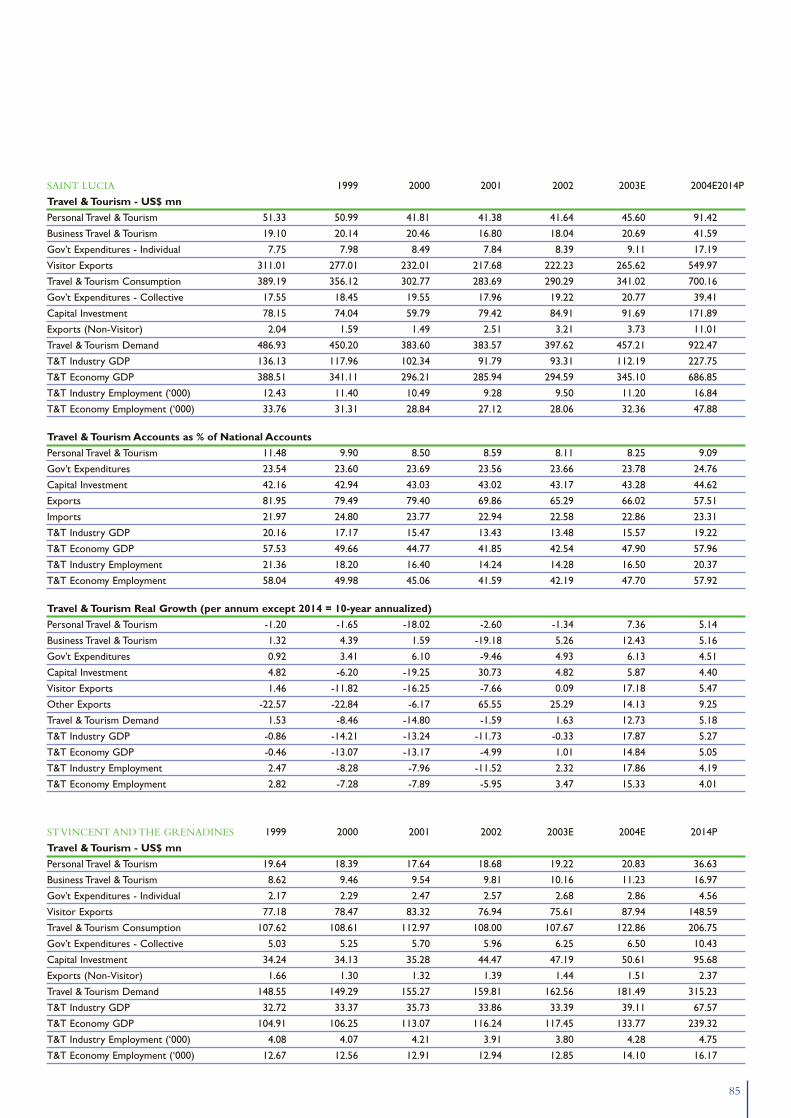
85
SAINT LUCIA 1999 2000 2001 2002 2003E 2004E2014P
Travel & Tourism - US$ mn
Personal Travel & Tourism 51.33 50.99 41.81 41.38 41.64 45.60 91.42
Business Travel & Tourism 19.10 20.14 20.46 16.80 18.04 20.69 41.59
Gov’t Expenditures - Individual 7.75 7.98 8.49 7.84 8.39 9.11 17.19
Visitor Exports 311.01 277.01 232.01 217.68 222.23 265.62 549.97
Travel & Tourism Consumption 389.19 356.12 302.77 283.69 290.29 341.02 700.16
Gov’t Expenditures - Collective 17.55 18.45 19.55 17.96 19.22 20.77 39.41
Capital Investment 78.15 74.04 59.79 79.42 84.91 91.69 171.89
Exports (Non-Visitor) 2.04 1.59 1.49 2.51 3.21 3.73 11.01
Travel & Tourism Demand 486.93 450.20 383.60 383.57 397.62 457.21 922.47
T&T Industry GDP 136.13 117.96 102.34 91.79 93.31 112.19 227.75
T&T Economy GDP 388.51 341.11 296.21 285.94 294.59 345.10 686.85
T&T Industry Employment (‘000) 12.43 11.40 10.49 9.28 9.50 11.20 16.84
T&T Economy Employment (‘000) 33.76 31.31 28.84 27.12 28.06 32.36 47.88
Travel & Tourism Accounts as % of National Accounts
Personal Travel & Tourism 11.48 9.90 8.50 8.59 8.11 8.25 9.09
Gov’t Expenditures 23.54 23.60 23.69 23.56 23.66 23.78 24.76
Capital Investment 42.16 42.94 43.03 43.02 43.17 43.28 44.62
Exports 81.95 79.49 79.40 69.86 65.29 66.02 57.51
Imports 21.97 24.80 23.77 22.94 22.58 22.86 23.31
T&T Industry GDP 20.16 17.17 15.47 13.43 13.48 15.57 19.22
T&T Economy GDP 57.53 49.66 44.77 41.85 42.54 47.90 57.96
T&T Industry Employment 21.36 18.20 16.40 14.24 14.28 16.50 20.37
T&T Economy Employment 58.04 49.98 45.06 41.59 42.19 47.70 57.92
Travel & Tourism Real Growth (per annum except 2014 = 10-year annualized)
Personal Travel & Tourism -1.20 -1.65 -18.02 -2.60 -1.34 7.36 5.14
Business Travel & Tourism 1.32 4.39 1.59 -19.18 5.26 12.43 5.16
Gov’t Expenditures 0.92 3.41 6.10 -9.46 4.93 6.13 4.51
Capital Investment 4.82 -6.20 -19.25 30.73 4.82 5.87 4.40
Visitor Exports 1.46 -11.82 -16.25 -7.66 0.09 17.18 5.47
Other Exports -22.57 -22.84 -6.17 65.55 25.29 14.13 9.25
Travel & Tourism Demand 1.53 -8.46 -14.80 -1.59 1.63 12.73 5.18
T&T Industry GDP -0.86 -14.21 -13.24 -11.73 -0.33 17.87 5.27
T&T Economy GDP -0.46 -13.07 -13.17 -4.99 1.01 14.84 5.05
T&T Industry Employment 2.47 -8.28 -7.96 -11.52 2.32 17.86 4.19
T&T Economy Employment 2.82 -7.28 -7.89 -5.95 3.47 15.33 4.01
ST VINCENT AND THE GRENADINES 1999 2000 2001 2002 2003E 2004E 2014P
Travel & Tourism - US$ mn
Personal Travel & Tourism 19.64 18.39 17.64 18.68 19.22 20.83 36.63
Business Travel & Tourism 8.62 9.46 9.54 9.81 10.16 11.23 16.97
Gov’t Expenditures - Individual 2.17 2.29 2.47 2.57 2.68 2.86 4.56
Visitor Exports 77.18 78.47 83.32 76.94 75.61 87.94 148.59
Travel & Tourism Consumption 107.62 108.61 112.97 108.00 107.67 122.86 206.75
Gov’t Expenditures - Collective 5.03 5.25 5.70 5.96 6.25 6.50 10.43
Capital Investment 34.24 34.13 35.28 44.47 47.19 50.61 95.68
Exports (Non-Visitor) 1.66 1.30 1.32 1.39 1.44 1.51 2.37
Travel & Tourism Demand 148.55 149.29 155.27 159.81 162.56 181.49 315.23
T&T Industry GDP 32.72 33.37 35.73 33.86 33.39 39.11 67.57
T&T Economy GDP 104.91 106.25 113.07 116.24 117.45 133.77 239.32
T&T Industry Employment (‘000) 4.08 4.07 4.21 3.91 3.80 4.28 4.75
T&T Economy Employment (‘000) 12.67 12.56 12.91 12.94 12.85 14.10 16.17

86
Travel & Tourism Accounts as % of National Accounts
Personal Travel & Tourism 9.37 10.24 8.65 7.37 7.15 7.23 6.78
Gov’t Expenditures 8.45 8.48 8.52 8.54 8.57 8.59 8.86
Capital Investment 36.40 36.57 36.92 36.64 36.67 36.68 36.95
Exports 44.97 44.13 46.26 43.08 41.54 43.76 41.28
Imports 17.92 20.93 20.00 19.69 19.54 19.80 20.55
T&T Industry GDP 9.91 9.89 10.12 9.27 8.92 9.96 10.10
T&T Economy GDP 31.78 31.50 32.02 31.82 31.37 34.07 35.79
T&T Industry Employment 9.18 9.16 9.37 8.58 8.25 9.22 9.36
T&T Economy Employment 28.49 28.25 28.73 28.38 27.93 30.40 31.86
Travel & Tourism Real Growth (per annum except 2014 = 10-year annualized)
Personal Travel & Tourism -0.59 -6.41 -8.89 5.02 2.55 6.30 3.75
Business Travel & Tourism 5.68 9.61 -4.16 1.96 3.29 8.32 2.19
Gov’t Expenditures 6.05 4.59 3.02 3.43 4.50 2.76 2.76
Capital Investment 12.20 -0.38 -1.83 25.02 5.81 5.13 4.49
Visitor Exports 4.29 1.62 0.84 -8.41 -2.03 14.04 3.34
Other Exports -6.64 -21.49 -4.22 4.77 3.64 2.80 2.54
Travel & Tourism Demand 5.34 0.44 -1.22 2.09 1.41 9.46 3.61
T&T Industry GDP -0.20 1.91 1.69 -6.00 -1.70 14.84 3.58
T&T Economy GDP 1.43 1.22 1.07 1.97 0.73 11.67 3.92
T&T Industry Employment -4.14 -0.21 3.33 -7.04 -2.95 12.72 1.07
T&T Economy Employment -2.70 -0.83 2.75 0.23 -0.71 9.81 1.39
TRINIDAD AND TOBAGO 1999 2000 2001 2002 2003E 2004E 2014P
Travel & Tourism - US$ mn
Personal Travel & Tourism 279.10 334.67 343.35 386.90 405.10 443.72 842.07
Business Travel & Tourism 102.49 100.87 91.60 94.00 98.01 110.25 196.65
Gov’t Expenditures - Individual 8.88 9.12 11.84 12.85 13.70 14.58 24.64
Visitor Exports 364.70 371.20 361.20 337.20 350.43 407.66 859.48
Travel & Tourism Consumption 755.17 815.86 807.99 830.95 867.23 976.22 1,922.84
Gov’t Expenditures - Collective 20.32 20.82 27.16 29.42 31.37 33.48 56.67
Capital Investment 254.69 399.46 242.54 360.59 385.24 411.55 769.45
Exports (Non-Visitor) 226.26 374.20 321.32 347.17 377.35 412.77 932.74
Travel & Tourism Demand 1,256.44 1,610.35 1,399.01 1,568.13 1,661.19 1,834.01 3,681.70
T&T Industry GDP 213.74 187.77 220.09 208.53 215.77 244.71 435.47
T&T Economy GDP 851.50 925.63 939.01 981.35 1,033.26 1,147.50 2,115.54
T&T Industry Employment (‘000) 17.43 13.41 14.75 13.40 13.32 14.42 19.09
T&T Economy Employment (‘000) 61.54 56.78 55.19 54.49 54.98 58.47 79.78
Travel & Tourism Accounts as % of National Accounts
Personal Travel & Tourism 6.76 7.44 7.34 6.86 6.90 7.11 8.25
Gov’t Expenditures 3.95 3.96 4.02 4.04 4.06 4.07 4.21
Capital Investment 17.76 26.87 14.44 18.15 18.26 18.37 20.99
Exports 17.28 15.07 13.69 13.20 12.84 13.16 12.33
Imports 13.38 18.46 11.63 13.89 13.78 13.97 13.85
T&T Industry GDP 3.15 2.34 2.50 2.22 2.17 2.30 2.50
T&T Economy GDP 12.53 11.54 10.68 10.46 10.37 10.78 12.13
T&T Industry Employment 3.51 2.62 2.80 2.48 2.42 2.57 2.79
T&T Economy Employment 12.41 11.07 10.46 10.10 9.99 10.42 11.66

87
Travel & Tourism Real Growth (per annum except 2014 = 10-year annualized)
Personal Travel & Tourism 7.43 8.53 -1.73 8.47 1.95 6.63 4.68
Business Travel & Tourism 20.25 -10.91 -13.02 -1.21 1.52 9.51 4.05
Gov’t Expenditures -9.06 -7.20 24.79 4.32 3.81 3.82 3.48
Capital Investment 25.10 41.96 -41.84 43.11 4.03 4.00 4.52
Visitor Exports -1.36 -7.88 -6.79 -10.13 1.19 13.25 5.80
Other Exports 61.35 49.69 -17.75 4.01 5.83 6.49 6.52
Travel & Tourism Demand 15.20 16.01 -16.78 7.90 3.15 7.48 5.27
T&T Industry GDP -7.85 -20.49 12.28 -8.80 0.75 10.41 4.02
T&T Economy GDP 4.56 -1.61 -2.83 0.60 2.52 8.11 4.38
T&T Industry Employment -11.08 -23.05 9.99 -9.20 -0.60 8.29 2.86
T&T Economy Employment -1.25 -7.74 -2.81 -1.27 0.89 6.35 3.16
US VIRGIN ISLANDS 1999 2000 2001 2002 2003E 2004E2014P
Travel & Tourism - US$ mn
Personal Travel & Tourism 211.70 228.67 246.83 266.51 287.76 310.68 669.63
Business Travel & Tourism 50.82 55.15 53.95 49.12 52.65 59.76 129.50
Gov’t Expenditures - Individual 27.71 30.15 32.07 34.53 37.19 40.03 83.30
Visitor Exports 955.00 1,014.40 931.17 826.81 864.59 992.35 2,398.85
Travel & Tourism Consumption 1,245.24 1,328.38 1,264.02 1,176.98 1,242.20 1,402.82 3,281.28
Gov’t Expenditures - Collective 63.59 68.95 73.68 79.18 85.15 91.62 190.88
Capital Investment 380.15 417.57 446.41 478.18 513.00 550.04 1,104.10
Exports (Non-Visitor) 45.45 36.98 43.43 45.45 47.64 50.77 92.45
Travel & Tourism Demand 1,734.43 1,851.88 1,827.54 1,779.79 1,887.98 2,095.25 4,668.71
T&T Industry GDP 396.15 402.77 370.47 324.37 338.95 393.49 1,002.67
T&T Economy GDP 1,292.59 1,316.52 1,273.79 1,191.34 1,255.73 1,421.44 3,397.55
T&T Industry Employment (‘000) 7.43 7.08 6.21 5.14 5.08 5.58 8.12
T&T Economy Employment (‘000) 21.08 20.13 18.27 15.85 15.76 17.00 23.66
Travel & Tourism Accounts as % of National Accounts
Personal Travel & Tourism 9.41 9.41 9.56 9.65 9.73 9.80 10.63
Gov’t Expenditures 19.09 19.19 19.27 19.36 19.44 19.54 20.46
Capital Investment 60.01 61.03 61.40 61.45 61.57 61.63 62.22
Exports 43.24 42.36 39.94 36.37 36.09 37.68 43.15
Imports 22.50 25.24 24.87 24.91 24.88 24.90 25.02
T&T Industry GDP 12.51 11.77 10.19 8.34 8.14 8.82 11.30
T&T Economy GDP 40.81 38.49 35.04 30.62 30.14 31.85 38.29
T&T Industry Employment 17.51 16.48 14.27 11.67 11.39 12.34 15.82
T&T Economy Employment 49.70 46.85 41.99 35.97 35.32 37.60 46.09
Travel & Tourism Real Growth (per annum except 2014 = 10-year annualized)
Personal Travel & Tourism 3.86 3.86 3.79 3.82 3.82 3.82 3.83
Business Travel & Tourism 6.92 4.34 -5.94 -12.44 3.05 9.15 3.91
Gov’t Expenditures 4.39 4.37 2.61 3.39 3.44 3.48 3.48
Capital Investment 7.96 5.61 2.80 2.99 3.15 3.10 3.10
Visitor Exports -0.29 2.13 -11.73 -14.62 0.54 10.37 5.07
Other Exports -2.24 -21.77 12.91 0.63 0.78 2.48 2.10
Travel & Tourism Demand 2.31 2.66 -5.11 -6.36 2.00 6.72 4.19
T&T Industry GDP -3.45 -2.24 -11.56 -15.81 0.47 11.63 5.64
T&T Economy GDP -1.58 -2.07 -6.97 -10.07 1.35 8.85 4.94
T&T Industry Employment -5.84 -4.65 -12.33 -17.15 -1.17 9.76 3.87
T&T Economy Employment -4.59 -4.54 -9.23 -13.24 -0.55 7.83 3.39


Adventure Jeep Tour
Air Jamaica, Ltd
American Airlines
Asesor Económico, Secretaría deEstado de Turismo
Asoc Hoteles de Juan Dolio
Asoc Hoteles de Santo Domingo
Asoc Hoteles Romana-Bayahibe
ASONAHORES
Atlantis Adventures
Bahamas Hotel Association
Bahamas Hotel EmployersAssociation
Bahamas Ministry of Tourism
Bahamas Taxi Cab Union
Bakers Choice
Barbados Chamber of Commerce
Barbados Ministry of Tourism
Barbados Tourism Authority
Barbados Tourism Investment Inc
Barbados Workers' Union
British Airways (Barbados)
Caribbean Producers Jamaica Ltd
Caribbean Tourism Organization
Central Bank of The Bahamas
Centro de Estrategias
Centro de Investigación Económicade las Antillas (CENANTILLAS)
Coco Kreole Resorts
Comfort Suites Paradise Island
Courtesy Rent-A-Car
Cox & Company
Creative Travel Consultants
Cuentas Nacionales Banco Central
Curaçao Hospitality & TourismAssociation
De Marchena Kaluche & Asociados
Deloitte & Touche
Foster & Ince Cruise Services Inc
Grenada Board of Tourism
Grenada Hotel & TourismAssociation
Grenada Industrial DevelopmentCorporation
Grenada Ministry of Tourism
Hanschell Inniss Ltd
Harmony Suites
Horned Dorset Primavera
Horwath Consulting
Hotel Development Corporation
Hyatt Hotels & Resorts
International Hospitality Enterprises
Jamaica Hotel & Tourist Association
Jamaica Ministry of Finance &Planning
Jamaica Ministry of Industry &Tourism
Jamaica Tourist Board
Jamaica Tours
Kerzner International
Minister of Tourism (St Lucia)
Nassau Paradise Island PromotionBoard
Nature Heritage Tourism
Organisation of Eastern CaribbeanStates
Pas Purchasing
PricewaterhouseCoopers
Puerto Rico Convention Bureau
Puerto Rico Convention CenterDistrict
Puerto Rico Department ofEconomic Development &Commerce
Puerto Rico GovernmentDevelopment Bank
Puerto Rico Hotel & TourismAssociation
Puerto Rico Tourism Company
Round Hill Hotel
Sandals Halcyon
Sol Meliá Hotels & Resorts
St Lucia Ministry of Finance
St Lucia Air & Sea Ports Authority
St Lucia Department of Labour
St Lucia Golf & Country Club
St Lucia Ground Handlers
St Lucia Hotel & TourismAssociation
St Lucia Ministry of Tourism
St Lucia National Economic Council
St Lucia Representative Services
St Lucia Taxi Council
St Lucia Tourist Board
St Lucia Yachting Association
Sunset Beach Resort
SuperClubs
Symonette Marketing Group
The Barbados Hotel & TourismAssociation
The Flamboyant Hotel
The New York Times
The Sandpiper Hotel
USAir, Bahamas
US Airways
United States Virgin IslandsDepartment of Tourism
Villa Montaña Resort
Viva Resorts
Wavecrest Apartments
Wexford Court Hotel
Windjammer Landing
Wyndham El San Juan Hotel
Wyndham Hotels & Resort
WTTC would like to express its appreciation to the following organizations that contributedtheir knowledge, insight and data/information to the policy review effort included in this report:

This WTTC Caribbean Report has been made possible by the generous support of:
with the additional support of:
HOTEL KURAHULANDA
Curaçao
LE MERIDIENJAMAICA PEGASUS
Jamaica
MELIA SANTO DOMINGOHOTEL & CASINODominican Republic
RAINBOW HOTELSt Lucia
SILVER SANDSHOTEL
Barbados
SPICE ISLANDBEACH RESORT
Grenada