THE DEVELOPMENT OF COGENERATION SYSTEMS IN … · 1 THE DEVELOPMENT OF COGENERATION SYSTEMS IN...
41
1 THE DEVELOPMENT OF COGENERATION SYSTEMS IN TURKEY AND ITS FUTURE TREND Presented by OZKAN AGIS Chairman Turkish Cogen and Clean Energy Technologies Association (TURKOTED) 4th SE EUROPEAN CODE WORKSHOP 10 – 11th of March 2011, Thessaloniki, Greece
Transcript of THE DEVELOPMENT OF COGENERATION SYSTEMS IN … · 1 THE DEVELOPMENT OF COGENERATION SYSTEMS IN...
1
THE DEVELOPMENT OF
COGENERATION SYSTEMS IN
TURKEY AND ITS FUTURE TREND
Presented by
OZKAN AGIS
Chairman
Turkish Cogen and Clean Energy Technologies Association (TURKOTED)
4th SE EUROPEAN CODE WORKSHOP
10 – 11th of March 2011, Thessaloniki, Greece

2
1. GENERAL ENERGY POLICY
• The Republic of TURKEY (population 73 million, area 780,000 km²)
forms a natural bridge between Europe and Asia. TURKEY is a
rapidly growing economy and over the past decade, its GDP has
increased at an exceptional rate compared to other OECD countries.
Turkey is the 17th largest economy in the world.
• From 2000 to 2010, the economy is expanded on average by 5% a
year, despite the damages of the last global crises. The
unemployment rate was 12% in 2010, while per capita GDP is slightly
over 10,000 USD. As it is in all developed economies, services
constitute 64% of GDP in 2010, industry 26% including construction,
textiles, vehicle manufacturing, food processing. The agriculture
accounts 10% of GDP.

3
1. GENERAL ENERGY POLICY cont
• Turkey has applied for full membership to European Union,
almost 50 years ago but accession talks are going on since
2005. EU membership bid manifests itself in growing
harmonisation with EU legislation. The recent evidence of
such a nice harmonisation is the synchrony operation of
Turkish H.V. Grid with European Grid since 18th September
2010 (through Babaeski – Mariza (Bulgaria) H.V. lines and
through Babaeski – Kometini (Greece) H.V. lines).
4
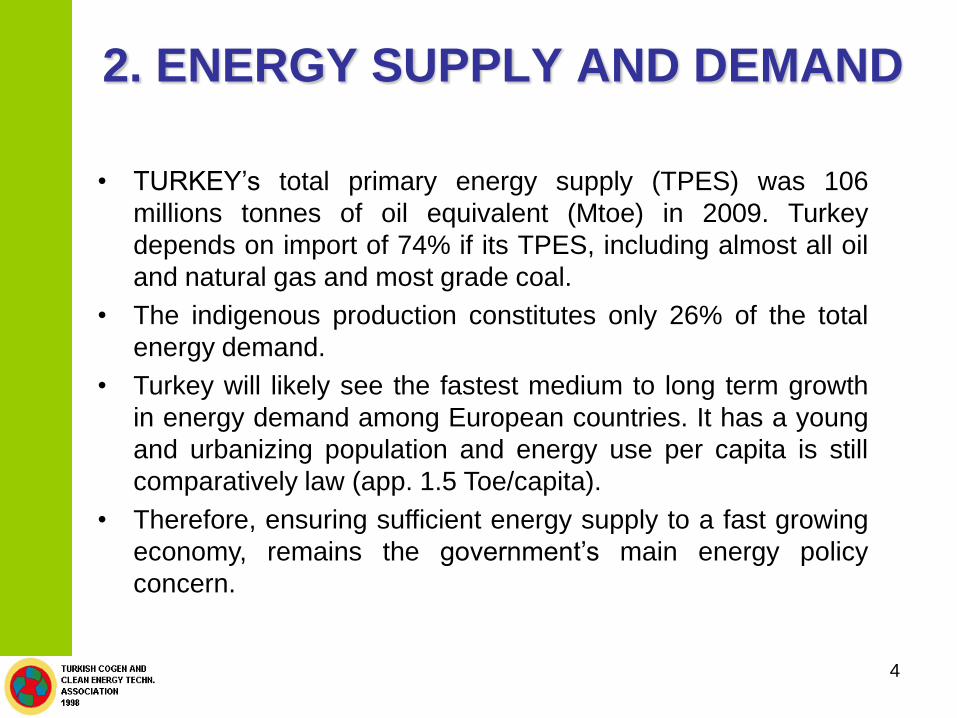
2. ENERGY SUPPLY AND DEMAND
• TURKEY’s total primary energy supply (TPES) was 106
millions tonnes of oil equivalent (Mtoe) in 2009. Turkey
depends on import of 74% if its TPES, including almost all oil
and natural gas and most grade coal.
• The indigenous production constitutes only 26% of the total
energy demand.
• Turkey will likely see the fastest medium to long term growth
in energy demand among European countries. It has a young
and urbanizing population and energy use per capita is still
comparatively law (app. 1.5 Toe/capita).
• Therefore, ensuring sufficient energy supply to a fast growing
economy, remains the government’s main energy policy
concern.
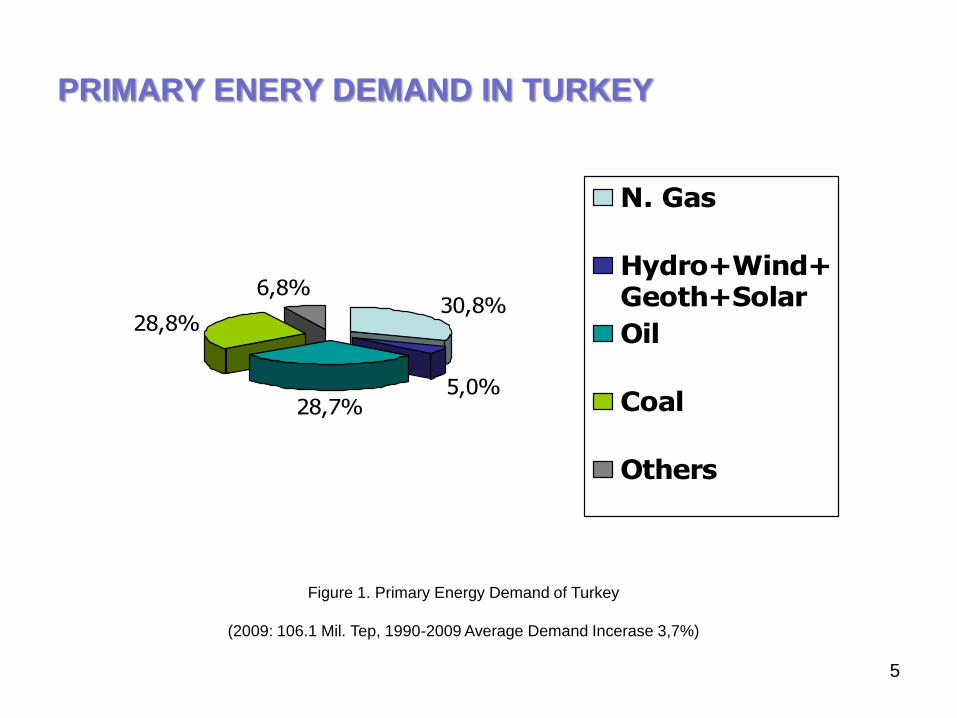
PRIMARY ENERY DEMAND IN TURKEY
5
28,8%
6,8%30,8%
5,0%28,7%
N. Gas
Hydro+Wind+Geoth+Solar
Oil
Coal
Others
Figure 1. Primary Energy Demand of Turkey
(2009: 106.1 Mil. Tep, 1990-2009 Average Demand Incerase 3,7%)

ENERGY DEMAND AND LOCAL PRODUCTION
6
MToe
0
50
100
150
200
250
1980 1990 2000 2008 2010 2020
Production
Demand
7
As one of the government’s primary policy goals, energy
security has attracted more focus than market reform and
environmental protection. However, Turkey has progressed
greatly in all areas of energy policy since 2000, by attracting
energy investments. To attract investments, the following
measures have been taken:
Privatization process have been started. As of today, 90%
of the Regional Electricity Distribution Systems and 50%
power production plants are privatized.
Power sector reforms have been progressed significantly
and comprised moving last reflective whole sale tariffs in
the electricity market.
The share of public company in electricity generation is in
declining, from 100% in 2000 to 45% in 2010.
8
• Thanks to attracted electricity tariffs in the market, well known
power generation companies are investing for power generation to
get a share in power market like RWE, OMW, E-ON,
FINMECCANICA, IBERDOLA.
• The government tries to increase the domestic energy supply. In
that sense, lignite production has been doubled in last 10 years.
• The government is also determined to utilise Turkey’s large hydro
potential, wind power and geothermal energy and aims to
introduce nuclear power.
• In natural gas sector, reform has been slower, largely owing the
security of supply concerns and needs to be accelerated.
However, Botas is successful in the operation of gas transit from
gas rich countries to Europe.

9
3. KEY POLICIESTurkey’s energy policy broadly follows the strategic objectives:
security of supply, to meet energy expectations of economic
growth and environmental protection.
1. Security of Supply
Ensuring sufficient energy to a growing economy, has been main
energy concern. A key part of Turkey’s policy is energy diplomacy
with the supplier countries in the region, which have more than
70% of the proven oil&gas reserves of the world. Turkey has been
quite seccessful by the supply agreements with Russia, Iran,
Azerbaijan, Egypt, Algeria, Nigeria, Qatar. These agreements and
the related projects strenghten Turkey’s role as a transit country,
an energy corridor and terminal between its neighbouring suppliers
and the international markets.

NATURAL GAS IMPORT OF TURKEY 2009
(35,8 billion m3 Üretim:0,7 billion m3 )
10
56
15
14
123
Russland
Iran
Aserbaidschan
Algerien
Nigeria

NATURAL GAS CONSUMPTION REACHED 36.86
BILLION m3 IN 2008
11

12
In the following chart you will see, how natural gas purchases
have been developed with the gas suppliers:

13
“BAKU-TİFLİS-CEYHAN” CRUDE OİL
PİPE LİNE

CASPİAN -TURKEY NATURAL GAS PİPELİNE
(South Caucasus N. Gas Pipeline)
14

SOUTH EUROPE NATURAL GAS RING
16

TURKEY – GREECE NATURAL GAS PIPELINE
17
Karacabey
Kipi / İpsala
Kızılcaterzi
Değirmencik
Turkey-Greece Natural Gas Pipeline
Marmara Sea
Çanakkale
İstanbul
(Dedeağaç)
(Gümülcine)
Bursa
TekirdağAmbarlı
Pendik
Hersek
Muallim

NABUCCO NATURAL GAS PIPELINE PROJECT
18

19
2. Attracting the Domestic Energy Production
To attract the domestic energy production incentives were enacted
with the renewable energy law in 2005. At the end of last year,
revision of the incentives was passed from the Parliament, which
increased feed-in tariffs, especially for agro residues firing and
geothermal energy production. In renewable energy production,
the target is 30% of total production in 2030. To secure this, the
government is issued a Decret of Strategy in 2009.
3. Environmental Protection Became an Integral Part of
Energy Production
Turkey has been a Party to UNFCCC since 2004 and to the Kyoto
Protocol since August 2009. Turkey has gained a special status
within the Annex – I Parties to UNFCCC. However, Turkey is the
only Annex – I country that has not set mitigation target for the past
2012 period. It is also the only OECD country that does not have a
national emission target for 2020.

20
• Efforts to limit energy related GHG emissions focus on
promoting renewable energy, energy efficiency, nuclear
power.
• In recent years, Turkey has improved its policies to control a
pollution. For example, old coal or lignite-fired plants are
being equipped with the flue gas desulphurization units.
• The limits of gas emissions and discharge limits of the liquid
waste are exactly same with the values given in German
Standard of TA LUFT ½.
21
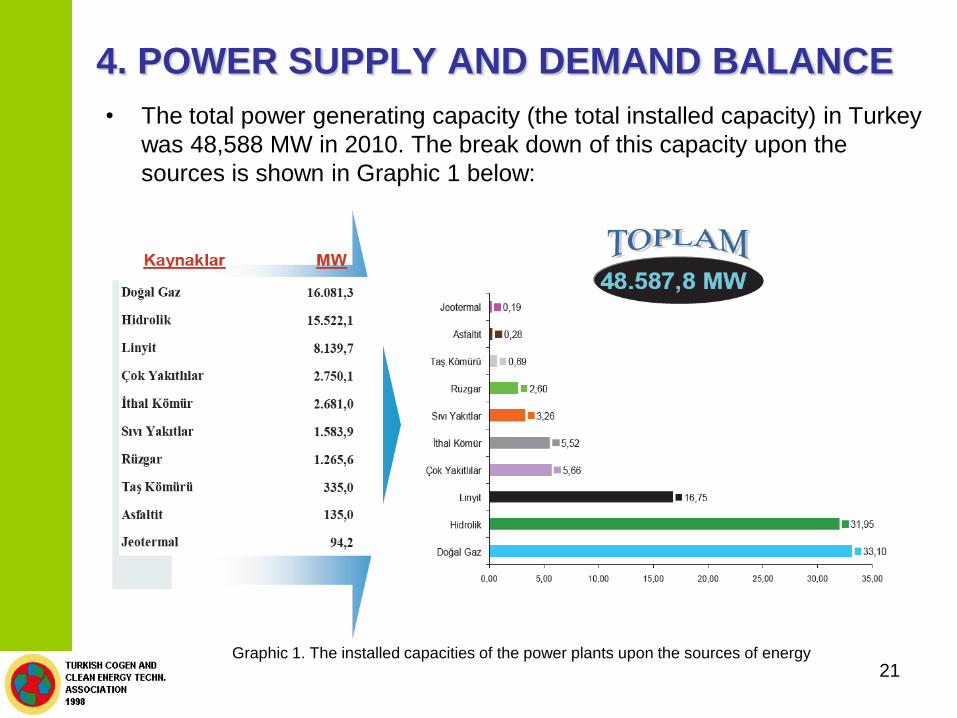
4. POWER SUPPLY AND DEMAND BALANCE
• The total power generating capacity (the total installed capacity) in Turkey
was 48,588 MW in 2010. The break down of this capacity upon the
sources is shown in Graphic 1 below:
Graphic 1. The installed capacities of the power plants upon the sources of energy

22
• You can see from this graphic, natural gas firing capacity is 16,081.3 MW
which constitutes 33.1% of the total.
• If we look at the break down of this capacity upon the power producers,
we have the following (Graphic 2):
• As you can see, Public Utility Company, EUAS has almost 50% of the
installed power capacity.
Graphic 2.The installed capacity of the power plants upon the power producers

23
• As far as the electricity generation is concerned:
1. Upon the sources of generation
• Once again, the share of generation by means of natural gas is
45.90% of total electricity production.
Graphic 3. Electricity Generation upon the sources

24
2. Upon the power producers
• As you see, in 2010, the share of public utility company
EUAS was only 45.37%.
Graphic 4. Electricity Generation upon the Power Producers
25
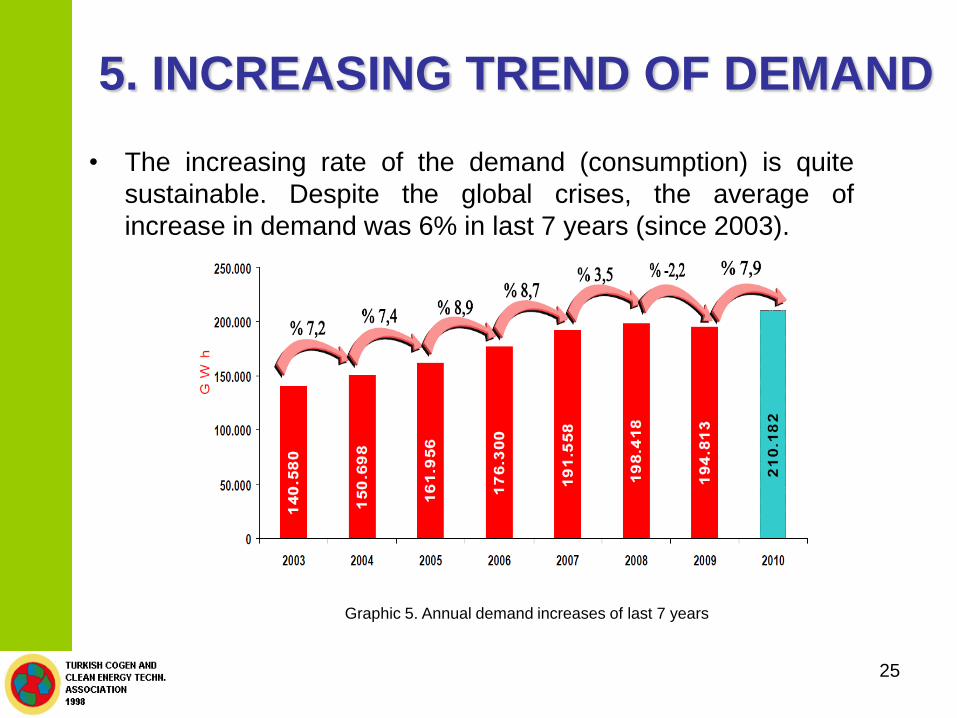
5. INCREASING TREND OF DEMAND
• The increasing rate of the demand (consumption) is quite
sustainable. Despite the global crises, the average of
increase in demand was 6% in last 7 years (since 2003).
Graphic 5. Annual demand increases of last 7 years

26
6. ELECTRICITY MARKET
OPERATION
• The Electricity Market Law (No:4628 is enacted on year2001. this Law created EMRA as the RegulatingAuthority of the Electricity Market.
• EMRA has several tasks: issues licenses,
determines and approves regulated tariffs,
sets the eligibility limit for market opening,
drafts secondary legislation on the electricity market,
resolves dispute,
applies penalties.
27
• EMRA has the powers to issue licenses for all market activities:generation, transmission, distribution, wholesale and retail.Separate licenses are required for each market activity and foreach facility where the activity is carried out. Generation anddistribution licenses are granted for at least 10 years and notmore than 49 years.
• The gradual opening of the electricity market began in March2003, when all consumers directly connected to thetransmission network and those consuming more than 79,000MWh per year to choose their supplies.
• EMRA defines this eligibility threshold for a year at a time in2010 is set at 100 MWh.
• The transmission system operator TEIAS and distributionsystems operator TEDAS are obliged to provide a non-discriminatory transmission and connection services to allsystem users, including eligible consumers, connected or to beconnected to the transmission system.

28
7. MARKET DESIGN
• Turkey’s electricity market model combines bilateral agreements
that are expected to cover the bulk of electricity demand with day-
ahead and real time balancing mechanism as well as a settlement
system for imbalances.
• Within the scope of the balancing and settlement implementations,
two different prices were produced namely an hourly marginal price
and systems, imbalance price. The hourly marginal price was
calculated on an hourly basis and announced daily through the web
site of TEIAS. Theoretically, this price was the market price
indicating the supply-demand situation of the electricity.

29
• The second phase of the transition, started on 1st December 2010,
entails switching from day-ahead planning to the “day-ahead
market”, which is a spot market. However, the practice of hourly
reconciling imbalances in the real time balancing market will
continue.
• If the result of the tender does not ensure sufficient supply, the
Council of Ministers may authorize state owned generation
company (EUAS) to build new power plants.
• After August 2006, when the Transitional Balancing and Settlement
Regulation came into force, suppliers selling electricity through
bilateral contracts terminated their contracts with the consumers
and started to sell electricity to the balancing market. According to
EMRA, from September 2006 to May 2008, the volume of electricity
trade, based on bilateral contracts, fell by 38%.

30
8. THE DEVELOPMENT OF
COGENERATION SYSTEMS IN TURKEY
• Up to year 1984, Power related investments and operations were
under the monopoly of Turkish Electricity Authority (TEK).
• Either the quality of electricity (frequency, voltage, availability,
accessibility etc.) and supply was controlled by TEK.
• Industrial and/or residential consumers had to satisfy with the
available and accessible electricity.
• In 1984, Law No:3096 was enacted by the Turkish Parliament. First
time in Turkish power history, the subject law was giving the right of
build, right of operation and right of ownership of the power
generating facilities.

31
• Thus, first cogeneration plant was built in 1992 (Yalova Elyaf
– 4 MW).
• At that time, natural gas network was only available in
Marmara Region, Bursa, Eskisehir and Ankara (almost 1/6th
of Turkey). Therefore, the number of the new cogen plants
were limited.
• After year 1995, gas network was enlarged by Botas and new
cogen plants were built.
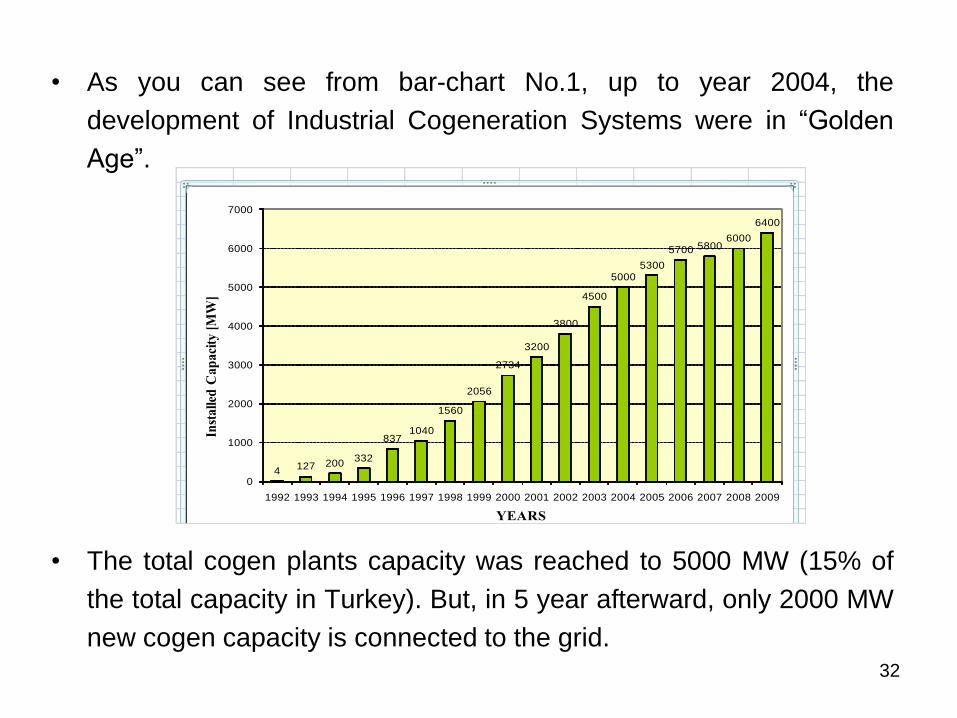
• As you can see from bar-chart No.1, up to year 2004, the
development of Industrial Cogeneration Systems were in “Golden
Age”.
• The total cogen plants capacity was reached to 5000 MW (15% of
the total capacity in Turkey). But, in 5 year afterward, only 2000 MW
new cogen capacity is connected to the grid.32
1992 4
1993 127
1994 200
1995 332
1996 837
1997 1040
1998 1560
1999 2056
2000 2734
2001 3200
2002 3800
2003 4500
2004 5000
2005 5300
2006 5700
2007 5800
2008 6000
2009 64004
127 200332
8371040
1560
2056
2734
3200
3800
4500
50005300
5700 58006000
6400
0
1000
2000
3000
4000
5000
6000
7000
1992 1993 1994 1995 1996 1997 1998 1999 2000 2001 2002 2003 2004 2005 2006 2007 2008 2009
Inst
alled
Cap
aci
ty [
MW
]
YEARS

33
• After 2004, the natural gas prices were rising up so fast that, the
existing plants which were in operation, were loosing money due to
non-affordable gas prices. Consequently, new cogen investments
were almost stopped.
• The graphic – 3 indicates, how natural gas prices were fluctuated from
March 2004 to November 2008.
NATURAL GAS AND ELECTRICITY PRICES
(ELECTRICITY PRICES ARE SDF PRICES AFTER AGU. 06)
0,00
10,00
20,00
30,00
40,00
50,00
60,00
Mar
.04
May
.04
Tem.0
4
Eyl.0
4
Kas.0
4
Oca
.05
Mar
.05
May
.05
Tem.0
5
Eyl.0
5
Kas.0
5
Oca
.06
Mar
.06
May
.06
Tem.0
6
Eyl.0
6
Kas.0
6
Oca
.07
Mar
.07
May
.07
Tem.0
7
Eyl.0
7
Kas.0
7
Oca
.08
Mar
.08
May
.08
Tem.0
8
Eyl.0
8
Kas.0
8
MONTHS
Na
tura
l G
as
Pri
ce
s
[ce
nt$
/Sm
3]
0,00
2,00
4,00
6,00
8,00
10,00
12,00
14,00
16,00
18,00
Ele
ctric
ity P
rice
s
[$c
en
t/kW
h] (P
rice
s a
re S
DF
Pric
. Afte
r Ag
u.0
6)
Natural Gas Prices
Electricity Prices
Graphic 6. Change of Natural Gas and Electricity Prices from March 2004 to November 2008

34
• “Renewable Energy Law” which was issued on 2005 offered
incentives to “renewable energy sourced” electricity production (i.e.
wind, hydro, geothermal, solar, biogas etc.). Since these are
national sources, new power investors (local or foreign) gave No.1
priority to these new era. As of today, nobody is investing money,
unless this investor needs power and heat or coolig energy at the
same time.
• In the buildings, “existing flat owner’s law” is a big barrier on the way
“micro cogeneration”. Because, only one rejecting (opposite) vote in
the owner’s committee, could stop installation, micro or midi
cogeneration installation in the buildings.
• Only shopping malls or new private Residential Projects are trying to
incorporate the cogeneration projects with their civil engineering
studies. Our Association tries to encourage them.

35
• Nowadays, our Association is concentrated on the newmass housing projects to include cogeneration andtrigeneration in their engineering deliverables. In thatrespect, we are getting the full support from MENR. Thebiggest barrier on the way is TOKI, State Mass HousingAdministration. This public Administration is undertakingthe construction of 100,000 houses (flats) in a year. Up tonow, they are applying the conventional “Central HeatingSystems” in their buildings.
• This system is against new “Energy efficiency and energysaving law” which was enacted in 2007.
• Our Association prefers to convince the Authorities,including prime minister T. Erdogan, with symposiums andconferences, explaining academically how big energysaving will be gained, in case cogeneration systems are tobe incorporated with new mass housing projects.
36
However, there are other factors influencing the slowing down
development of cogen plants. These are:
• Government was not agreed with our Association, to issue “The
Cogeneration Directive”, Despite, Turkish Cogen Association
prepared adaptable draft of law tender the name of “High
Efficiency Cogen Systems”, one week after European
Cogeneration Directive is approved (21.02.2004). Then, expected
incentives for cogeneration systems are not approved. This
situation discouraged the cogen investors.
• Anti – natural gas lobby convinced the government on the slowing
down of gas power plants, claiming that, “increasing gas supply is
also increasing Turkey’s dependency to gas supplying countries”.

37
9. INCENTIVES FOR
COGENERATION SYSTEMS80% higher cycle efficiency is accepted to benefit from the following
incentives:
• Connection to the grid will be in priority,
• They don’t need to provide license from EMRA (Energy Market Regulatory
Authority),
• All micro cogeneration units don’t need to provide license. But their
connection to grid is still under discussion. Because new private operators of
the electricity distribution system prefer to deal with big customers,
• If biomass power based design covers the “made in Turkey” cogeneration
system, 0.4 US$ cent/kWh for steam or gas turbine 2.0 US$cent/kWh, for
internal combustion engine or stirling engine 0.9 US$cent/kWh bonus are
to be added at the top of feed-in tariffs.
10. ENERGY EFFICIENCY
38
Turkey’s energy efficiency policy is guided by the 2007
Energy Efficiency Law. This law is almost complying EU’s
Energy Efficiency Strategy’s goals.
Energy Efficiency Law (2007) aims to reduce energy
intensity by 15% below the reference scenario projections
by 2020.
The following regulations have been prepared, based on
the Energy Efficiency Law:

39
• Sharing the heating and domestic hot water expenses in the
buildings,
• Improving Energy efficiency for the utilization of Energy and
Energy Resources,
• Energy Performance of Buildings,
• Regulation on Appointment of Energy Managers in Schools.
Measures on new buildings focus on Energy Performance
requirements. The requirements cover energy needs for space
and water heating, cooling and lightening. The by-law also
mandates regular inspections of boilers and centralized air
conditioning systems. All these requirements largely follow EU
rules that are laid out in the Directive on the Energy
Performance of Buildings (2002/91/EC),

40
• All new buildings must have an energy performance certificate
indicating their energy performance class. Existing buildings
will be required to have energy performance certificate by May
2017,
• Furthermore, the 2007 Energy Efficiency Law obliges large
energy users to appoint or contract an energy manager and to
report annually on energy consumption to MENR.
• Mandatory energy labeling of domestic appliances is
harmonized with EU directives. It covers lamps, ovens,
refrigerators, freezers, washing machines and dishwashers.