
The Development and Application of Oil-In- Water Microemulsion Liquid and Electrokinetic
296
The Development and Application of Oil-In- Water Microemulsion Liquid and Electrokinetic Chromatography for Pharmaceutical Analysis By Eamon McEvoy Dept of Chemical & Life Sciences School of Science Waterford Institute of Technology Waterford, Ireland Under the Supervision of Dr. Kevin Altria, Dr. Sheila Donegan & Dr. Joe Power A Thesis submitted to Waterford Institute of Technology for the Degree of Doctor of Philosophy, July 2008
Transcript of The Development and Application of Oil-In- Water Microemulsion Liquid and Electrokinetic

The Development and Application of Oil-In-
Water Microemulsion Liquid and Electrokinetic
Chromatography for Pharmaceutical Analysis
By
Eamon McEvoy
Dept of Chemical & Life Sciences
School of Science
Waterford Institute of Technology
Waterford, Ireland
Under the Supervision of
Dr. Kevin Altria, Dr. Sheila Donegan & Dr. Joe Power
A Thesis submitted to Waterford Institute of Technology for the Degree of Doctor of
Philosophy, July 2008
I
Declaration
I hereby declare that this thesis is my own work in partial fulfilment of the requirements
of Doctor of Philosophy degree. It is based on work carried out in the Department of
Chemical and Life Sciences, Waterford Institute of Technology, Waterford, Ireland
between October 2005 and July 2008.
_______________________
Eamon McEvoy

II
Abstract
Since the term ‘microemulsion’ was first coined almost fifty years ago to describe clear, isotropic, thermodynamically stable systems composed of oil, water, surfactant and cosurfactant, numerous and varied reports of the applications of microemulsions have appeared in the literature. Reports of the use of microemulsions in separation science began to appear in the literature in the early 1990’s when they were first used as mobile phases for HPLC and as carrier electrolytes for CE separations, particularly for pharmaceutical applications. Although both MELC and MEEKC have been used for the separation of a wide range of components, MEEKC has received the most attention in recent years as it can be used for the separation of both charged and neutral solutes has been shown to be particularly useful for rapid chiral separations. The main objective of this study was the development of rapid O/W MELC and MEEKC methods for the analysis of pharmaceutical compounds in highly hydrophobic formulations which require lengthy sample preparation and extraction procedures prior to analysis using currently preferred techniques such as titration and RP-HPLC. Both cationic and anionic microemulsions were successfully utilised for the O/W MELC analysis of paracetamol in a suppository and ibuprofen in a cream formulation. The results of validation studies were very favourable and the method for the analysis of the suppository was extremely rapid and easy compared to the reference method. Analysis times for the cream were also rapid and were comparable to sample preparation and analysis times using the reference method. Similarly O/W MEEKC methods for the analysis of paracetamol in a suppository using cationic and anionic microemulsions were very rapid and validation results were comparable to those achieved with O/W MELC. Investigations into the stability of microemulsions under gradient MELC conditions showed that the length of the surfactant alkyl chain was the major factor affecting the systems stability and hence chromatographic reproducibility. The reproducible separation of paracetamol and five of its related impurities in a suppository sample was achieved using a novel isocratic MELC method with a stable diluted CTAB microemulsion as eluent. The most stable microemulsions under diluted conditions were found to be formed with surfactants of longer alkyl chain lengths. Rapid O/W MEEKC methods for paracetamol impurity profiling using both anionic and cationic microemulsions were also developed, however the methods sensitivities were too low for impurity detection at 0.1% levels. The higher solubilising power of longer alkyl chain surfactants was highlighted One of the most active areas of MEEKC research to date has been chiral separations. Various chiral selectors such as; cyclodextrins, chiral oils, chiral alcohols etc have been incorporated into the microemulsions and successfully used to achieve enantioseparation using MEEKC. To date there have been no reports of chiral separations using MELC techniques. The effects of using chiral components in the microemulsion mobile phase for the separation of a number of chiral pharmaceutical compounds were assessed. Microemulsions modified with β-cyclodextrin, a chiral bile salt and a chiral oil phase were used to assess the separations achieved for ibuprofen, ketoprofen, baclofen, atenolol and procyclidine HCl. No chiral separations were achieved, however the effects of surfactant type, microemulsion pH, modifier type & concentration and column temperature were found to effect the achiral separations of the test compounds.

III
Acknowledgements
I would like to express my gratitude to my supervisors, Dr. Kevin Altria, Dr. Sheila
Donegan & Dr. Joe Power who gave me excellent opportunities, assistance, guidance
and support during this work.
Richie, my fellow interfacial analytical scientist, keep up the good work.
Many thanks also to the lab technicians and library staff who were always there to lend
a hand.
To Margaret who was always there to support me and to Johnny who sadly won’t get to
see the end of my endeavours.
Lastly, to Pamela who had to listen to me talk about papers, chapters, deadlines and test
compounds for the last few years, I promise I’ll stop now.
IV
Publications
McEvoy E, Altria K, Donegan S, Power J. Capillary Electrophoresis: Microemulsion
Electrokinetic Chromatography. In: Encyclopedia of Separation Science, Online
Update. Colin F. Poole & Ian D. Wilson (Eds). Elsevier, Oxford (2007).
McEvoy E, Altria K, Donegan S, Power J. Liquid Chromatography: Microemulsion
based HPLC Methods. In: Encyclopedia of Separation Science, Online Update. Colin F.
Poole & Ian D. Wilson (Eds). Elsevier, Oxford (2007).
McEvoy E, Donegan S, Power J, Altria K. Optimisation and Validation of a Rapid and
Efficient Microemulsion Liquid Chromatographic (MELC) Method for the
Determination of Paracetamol (acetaminophen) Content in a Suppository Formulation.
Journal of Pharmaceutical & Biomedical Analysis, 44, 137-143 (2007).
McEvoy E, Marsh A, Altria K, Donegan S, Power J. Recent Advances in the
Development and Application of Microemulsion EKC. Electrophoresis, 28, 193-207
(2007).
McEvoy E, Altria K, Marsh A, Donegan S, Power J,. Capillary Electrophoresis for
Pharmaceutical Analysis. In: Handbook of Capillary and Microchip Electrophoresis
and Associated Microtechniques 3rd Edition. James P. Landers (Ed). CRC Press (2007).
McEvoy E, Donegan S, Power J, Altria K. Application of MELC and MEEKC for the
Analysis of Paracetamol and Related Impurities in Suppositories. Chromatographia, 68,
49-56 (2008).
Ryan R, Donegan S, Power J, McEvoy E, Altria K. An Introduction to Microemulsion
HPLC (MELC). LCGC Europe, Article in Press.
Ryan R, Donegan S, Power J, McEvoy E, Altria K. Recent Advances in Methodology,
Optimisation and Development of Microemulsion Electrokinetic Chromatography
Methods. Electrophoresis, Article in Press.
V
Poster Presentations
The use of Microemulsions in Pharmaceutical Analysis using both CE and LC.
Analytical Research Forum (RSC), UCC, Cork, July 2006.
Optimisation and Validation of a Rapid and Efficient Microemulsion Liquid
Chromatographic (MELC) Method for the Determination of Paracetamol
(acetaminophen) Content in a Suppository Formulation.
31st International Symposium on High Performance Liquid Phase Separations and
Related Techniques (HPLC 2008), Ghent, Belgium, June 2007.
VI
Contents
Declaration I
Abstract II
Acknowledgements III
Publications IV
Poster presentations V
Table of Contents VI
Table of Contents
Section I Literature Review & Theoretical Aspects
1
Chapter One Introduction to Microemulsions and Microemulsion
Liquid Chromatography
2
1.1 Introduction 3
1.2 Interfacial Tension 3
1.3 Surfactants 3
1.3.1 Anionic Surfactants 5
1.3.2 Cationic Surfactants 6
1.3.3 Non-ionic Surfactants 7
1.3.4 Zwitterionic Surfactants 7
1.3.5 Aqueous Surfactant Structures 7
1.3.5.1 Micelle Structures 8
1.4 Emulsions 9
1.5 Microemulsions 11
1.5.1 Microemulsion Phase Diagrams 14
1.5.2 Applications of Microemulsions 15
1.5.2.1 Tertiary Oil Recovery 15
1.5.2.2 Fuel Additives 15
1.5.2.3 Lubricants & Cutting Oils 15
1.5.2.4 Paints, Coatings & Textiles 15

VII
1.5.2.5 Cosmetics 16
1.5.2.6 Pharmaceuticals 16
1.5.2.7 Reaction Media 16
1.5.2.8 Analytical Applications 17
1.5.2.9 Other Applications 17
1.6 Introduction to Microemulsion Liquid Chromatography 18
1.6.1 Oil in Water MELC 19
1.6.2 Water in Oil MELC 19
1.6.3 MELC as an Extension of MLC 20
1.6.4 Operating Parameters of Oil-in-Water MELC 21
1.6.4.1 Surfactant Concentration 21
1.6.4.2 Surfactant Type 21
1.6.4.3 Cosurfactant Concentration 22
1.6.4.4 Cosurfactant Type 22
1.6.4.5 Oil Type 23
1.6.4.6 Oil Concentration 23
1.6.4.7 Mobile Phase Additives 24
1.6.4.8 Column Temperature 24
1.6.4.9 Microemulsion pH 25
1.6.5 Stationary Phases 25
1.6.6 Gradient Elution and MELC 26
1.6.7 Analyte Detection at Low Wavelengths 27
1.6.8 Operating Parameters of Water in Oil MELC 28
1.6.8.1 Oil Type 29
1.6.8.2 Surfactant Type 29
1.6.8.3 Cosurfactant Type 30
1.6.8.4 Water Concentration 30
1.6.8.5 Temperature & pH Effects 30
1.6.8.6 Log P Values & Retention 30
1.6.9 Applications of MELC 30
1.7 Conclusion 33
1.8 References 33

VIII
Chapter Two Capillary Electrophoresis & Microemulsion
Electrokinetic Chromatography for Pharmaceutical
Analysis
36
2.1 Introduction 37
2.2 Background 38
2.3 Modes of CE for Pharmaceutical Analysis 39
2.3.1 Free Solution Capillary Electrophoresis 39
2.3.2 Non-Aqueous Capillary Electrophoresis 41
2.3.3 Micellar Electrokinetic Chromatography 42
2.3.4 Microemulsion Electrokinetic Chromatography 43
2.3.5 CE-MS 43
2.3.6 Multiplexed Capillary Electrophoresis 43
2.3.7 Microchip Capillary Electrophoresis 44
2.4 Pharmaceutical Applications of CE 45
2.4.1 Chiral Pharmaceutical Analysis 45
2.4.1.1 Cyclodextrins 46
2.4.1.2 Crown Ethers 46
2.4.1.3 Macrocyclic Antibiotics 47
2.4.1.4 Oligo and Polysaccharides 47
2.4.1.5 Proteins 48
2.4.1.6 Chiral MEKC 48
2.4.1.7 Chiral MEEKC 49
2.4.2 Pharmaceutical Assay 49
2.4.3 Impurity Profiling of Pharmaceuticals 52
2.4.4 Physicochemical Profiling 53
2.4.4.1 pKa Measurements 54
2.4.4.2 Log Pow Measurements 55
2.4.5 Analysis of Small Molecules and Ions 56
2.5 Microemulsion Electrokinetic Chromatography 58
2.5.1 Introduction 58
2.5.2 Comparison of MEEKC to Other CE Modes 59
2.5.3 Method Development & Operating Parameters 61
2.5.3.1 Surfactant Type & Concentration 62
IX
2.5.3.2 Cosurfactant 63
2.5.3.3 Oil Phase 64
2.5.3.4 Buffer Concentration & Additives 65
2.5.3.5 Microemulsion pH 67
2.5.3.6 Temperature 67
2.5.3.7 Sample Diluent & Injection 68
2.5.4 High Speed MEEKC 69
2.5.4.1 Pressure Assisted MEEKC 69
2.5.4.2 Short End Injection 69
2.5.4.3 Dual Opposite Injection 70
2.5.5 Improved Sensitivity & Detection Limits 70
2.5.6 Water-in-Oil MEEKC 70
2.5.7 MEEKC-MS 71
2.5.8 Multiplexed MEEKC 72
2.5.9 Applications 73
2.5.9.1 Pharmaceutical Analysis 73
2.5.9.2 Chiral Separations 75
2.5.9.3 Food & Natural Products 77
2.5.9.4 Bioanalysis 79
2.5.9.5 Log P Determinations 79
2.5.9.6 Other Applications 80
2.6 Conclusions 81
2.7 References 82
Chapter Three Chiral HPLC Methods using Chiral Stationary
Phases and Chiral Mobile Phase Additives
91
3.1 Introduction 92
3.2 Chiral Separation Mechanism – Stationary Phase 94
3.3 Types of Chiral Stationary Phase 96
3.3.1 Brush-Type or Pirkle Phases 96
3.3.2 Helical Polymers 96
3.3.3 Cavity Phases 96

X
3.3.4 Protein Phases 97
3.3.5 Macrocyclic Antibiotics 97
3.3.6 Ligand-Exchange Phases 98
3.3.7 Chiral Surfactants 98
3.4 Chiral Mobile Phases 98
3.4.1 Cyclodextrins 99
3.4.2 Ligand-Exchange Mobile Phases 102
3.4.3 Macrocyclic Antibiotics 104
3.4.4 Ion-Pair Additives 106
3.4.5 Proteins 106
3.5 Surfactants, Micelles & ME’s in Chiral Chromatography 106
3.5.1 Surfactants 106
3.5.2 Chiral Surfactant Stationary Phases 107
3.5.3 Micellar Liquid Chromatography 107
3.5.4 Microemulsion Liquid Chromatography 107
3.5.5 Micellar Electrokinetic Chromatography 108
3.5.6 Microemulsion Electrokinetic Chromatography 108
3.5.7 Chiral Microemulsion components 110
3.5.8 Chiral Complexation Sites 110
3.6 Conclusion 111
3.7 References 112
Chapter Four Microemulsion Characterisation Techniques 115
4.1 Introduction 115
4.2 Microemulsion Structural Determination Methods 117
4.2.1 Small Angle Scattering 117
4.2.1.1 SANS 117
4.2.1.2 SAXS 118
4.2.1.3 DLS 119
4.2.1.4 Applications of Scattering Techniques for ME
Characterisation
120
4.2.2 NMR 123
XI
4.2.3 FF-TEM 125
4.2.4 Viscosity 127
4.2.5 Conductivity 129
4.2.6 DSC 131
4.2.7 Surface Tension 132
4.2.8 Density 133
4.2.9 Turbidity 133
4.2.10 Refractive Index 134
4.2.11 Polarised Light Microscopy 134
4.2.12 Fluorescence Correlation Spectroscopy 134
4.2.13 Other Characterisation Techniques 135
4.3 Conclusions 135
4.4 References 136
Section II Experimental Studies 138
Chapter Five Studies into The Optimisation of MELC Methods for
Analysis of Hydrophobic Pharmaceutical Formulations
139
5.1 Introduction & Aims 140
5.2 Materials & Methods 142
5.2.1 Chemicals 142
5.2.2 Equipment 142
5.3 SDS MELC – Method Optimisation 143
5.3.1 Microemulsion Preparation 143
5.3.2 Reference Standard Solution Preparation 143
5.3.3 Chromatographic Conditions 143
5.3.4 Optimisation of Microemulsion Composition 143
5.3.5 Optimisation of Column Temp & Flow Rate 147
5.3.6 Transfer to a Shorter Column 147
5.3.7 Choosing an Internal Standard 147
5.4 Sample Preparation 148
5.4.1 Paracetamol Suppositories 148
XII
5.4.2 Ibuprofen Cream 148
5.5 Method Validation 148
5.5.1 Paralink Suppository – Paracetamol Analysis 148
5.1.1.1 Specificity 148
5.1.1.2 Linearity 148
5.1.1.3 Assay 149
5.1.1.4 Precision – Repeatability 150
5.1.1.5 Accuracy 150
5.1.1.6 LOD 150
5.1.1.7 LOQ 151
5.5.2 Proflex Cream – Ibuprofen Analysis 151
5.5.2.1 Specificity 151
5.5.2.2 Linearity 151
5.5.2.3 Assay 152
5.5.2.4 Precision – Repeatability 152
5.5.2.5 Accuracy 152
5.5.2.6 LOD 152
5.5.2.7 LOQ 152
5.6 Method Optimisation – CTAB MELC Suppository Analysis 153
5.7 Reference Methods 154
5.7.1 Paracetamol Suppository 154
5.7.2 Ibuprofen Cream 155
5.8 Results & Discussion 155
5.9 Conclusions 159
5.10 References 160
XIII
Chapter Six An Evaluation of Microemulsion Electrokinetic
Chromatography Methods for the Analysis of
Paracetamol in Suppositories
161
6.1 Introduction & Aims 162
6.2 Materials & Methods 163
6.2.1 Chemicals 163
6.2.2 Equipment 163
6.2.3 Microemulsion Preparation 163
6.2.4 SDS MEEKC – Method Optimisation 164
6.2.5 CTAB MEEKC – Method Optimisation 165
6.3 Method Validation 165
6.3.1 SDS MEEKC Suppository Analysis 165
6.3.1.1 Specificity 165
6.3.1.2 Linearity 166
6.3.1.3 Assay 166
6.3.1.4 Accuracy, Repeatability, Precision, LOD &
LOQ
166
6.3.2 CTAB MEEKC Suppository Analysis 168
6.3.2.1 Specificity 168
6.3.2.2 Linearity 168
6.3.2.3 Assay 168
6.3.2.4 Accuracy, Repeatability, Precision, LOD &
LOQ
169
6.4 Results & Discussion 169
6.5 Conclusions 173
6.6 References 174
XIV
Chapter Seven An Experimental Assessment of Microemulsion
Stability under Gradient Elution Conditions
176
7.1 Introduction and Aims 176
7.2 Materials 177
7.2.1 Chemicals 177
7.2.2 Equipment 178
7.3 Experimental 179
7.3.1 Separation of Paracetamol & Related Substances 179
7.3.1.1 Microemulsion and Sample Prep. 179
7.3.1.2 Separation of Paracetamol & Related Compounds 179
7.3.2 Assessment of SDS ME Stability under Gradient
Conditions.
183
7.3.3 Assessment of CTAB ME Stability under Gradient
Conditions.
184
7.3.4 Assessment of TTAB ME Stability under Gradient
Conditions
185
7.3.5 Assessment of DOTAB ME Stability under Gradient
Conditions
185
7.3.6 Stability Assessment of ME Prepared using Mixed
Surfactants
185
7.4 Results of Microemulsion Stability Studies 186
7.4.1 SDS microemulsion stability 186
7.4.2 CTAB Microemulsion Stability 189
7.4.3 DOTAB Microemulsion Stability 190
7.4.4 TTAB Microemulsion Stability 192
7.4.5 Mixed Surfactant Microemulsion Stability 193
7.5 Discussion 194
7.6 Conclusion 197
7.7 References 198
XV
Chapter Eight Stability Indicating Studies for Paracetamol using
MELC & MEEKC
199
8.1 Introduction & Aims 200
8.2 Materials 201
8.2.1 Chemicals 201
8.2.2 Equipment 201
8.3 Experimental 201
8.3.1 Microemulsion Preparation 201
8.3.2 Sample Preparation 202
8.3.3 MELC Conditions 202
8.3.4 MEEKC Conditions 202
8.3.5 Determination of the Solubilising Power of Different
Microemulsions.
203
8.4 Results 204
8.4.1 Separation of Spiked Paracetamol using CTAB MELC 204
8.4.2 Separation of Spiked Paracetamol using DOTAB MELC 213
8.4.3 Separation of Spiked Paracetamol using TTAB MELC 215
8.4.4 Separation of Spiked Paracetamol using Mixed Surfactant
MELC
216
8.4.5 MEEKC Paracetamol Stability Indicating Studies 217
8.4.5.1 SDS MEEKC 217
8.4.5.2 CTAB MEEKC 218
8.4.6 Solubilising Power of Different Microemulsions 220
8.5 Discussion 221
8.6 Conclusion 224

XVI
Chapter Nine An Initial Assessment of Chiral Microemulsion
Components and a Chiral Column for
Enantioseparations using MELC
226
9.1 Introduction 227
9.2 Aims 227
9.3 Materials & Methods 228
9.3.1 Chemicals 228
9.3.2 Equipment 230
9.3.3 Chromatographic Conditions 230
9.3.4 Sample Preparation 230
9.3.5 Experimental Methods 230
9.4 Results 233
9.4.1 Monolithic Column with SDS Microemulsion 233
9.4.1.1 Effects of Added Sodium Cholate 233
9.4.1.2 Effects of Added β-Cyclodextrin 236
9.4.1.3 Chiral 2-octanol Effects 238
9.4.2 C18 Packed Column with SDS Microemulsion 239
9.4.2.1 Effects of Added Sodium Cholate 239
9.4.2.2 Effects of Added β-Cyclodextrin 244
9.4.2.3 Effects of Changing the Oil Phase 246
9.4.3 C18 Packed Column with CTAB Microemulsion 249
9.4.3.1 Sodium Cholate Addition 249
9.4.3.2 Effects of Added β-Cyclodextrin 252
9.4.3.3 Effects of Changing the Oil Phase 253
9.4.4 Agilent Chiradex β-Cyclodextrin Column 254
9.4.4.1 Separations using Aqueous/Organic Mobile
Phases
254
9.4.4.2 SDS Microemulsion as Mobile Phase 255
9.4.4.3 Sodium Cholate Micellar Mobile Phase 256
9.5 Discussion 257
9.5.1 Added Sodium Cholate Effects 257
9.5.2 Effects of Added β-Cyclodextrin 260
9.5.3 Effects of Changing the Oil Phase 260
XVII
9.5.4 SDS Microemulsion on a Chiral Column 261
9.5.5 Comparison of SDS & CTAB Microemulsions 262
9.6 Conclusions 263
9.7 References 264
Chapter Ten Conclusions & Future Work 265
10.1 Thesis Summary 266
10.2 Conclusions 269
10.3 Evaluation and Comparison of MEEKC & MELC 271
10.3.1 O/W MELC using SDS & CTAB ME’s 271
10.3.2 O/W MEEKC using SDS & CTAB ME’s 273
10.4 Future Work 274
10.5 References 277
Appendix Publications 278
1
Section I
Literature Review and Theoretical Aspects

2
Chapter One
Introduction to Microemulsions and
Microemulsion Liquid Chromatography

3
1.1 Introduction
This chapter will provide a brief introduction to surfactants and microemulsions and the
thermodynamic aspects associated with microemulsion formation. The various classes
of surfactants and their role as ‘surface active agents’ will be covered. The use of phase
diagrams and the composition of various types of microemulsions, in particular oil-in-
water microemulsions will be considered. Microemulsion liquid chromatography will
be introduced in this chapter with an overview of the role of microemulsions in liquid
chromatography for pharmaceutical analysis covering theoretical aspects and current
applications.
1.2 Interfacial tension
It is an obvious statement that water and oil don’t mix and upon vigorous shaking will
eventually separate to achieve a minimum surface area between the two distinct phases
(the same can be said of any two immiscible bulk liquids). Interfacial tension exists in
the boundary region between the two bulk liquid phases. Interfacial tension is the
property of a liquid/liquid interface exhibiting the characteristics of a thin elastic
membrane acting along the interface in such a way as to reduce the total interfacial area
by an apparent contraction process [1].
Thermodynamically, interfacial tension is the excess of free energy resulting from an
imbalance of forces acting upon the molecules of each phase. Atoms or molecules at an
interface between two immiscible liquids will generally have a higher potential energy
than those in the bulk of the two phases. Their location at the interface means they will
experience a net force due to the nearest neighbour interactions significantly different
from those in the bulk phases. For two immiscible liquid phases, surface molecules will
normally interact more strongly with those in the bulk rather than those in the adjacent
phase.
Interfacial tension is normally defined in units of dyne/cm or mN/m as a force per unit
length which is equal to energy per unit area.
1.3 Surfactants
Surfactants are materials which exhibit the characteristic of reducing the interfacial
tension between two immiscible liquids by way of enhanced adsorption at the interface.
These surfactants or ‘surface active agents’ are usually amphiphilic organic compounds
4
i.e. possessing in the same molecule two distinct groups which differ greatly in their
solubility relationships. Generally speaking surfactants possess a hydrophobic tail group
and a hydrophilic head group. The hydrophobic tail is usually a long chain hydrocarbon
and the hydrophilic head is an ionic or highly polar group that imparts water solubility
to the molecule. The unique amphiphilic structure of surfactants gives rise to some
characteristic properties which fall into two broad categories;
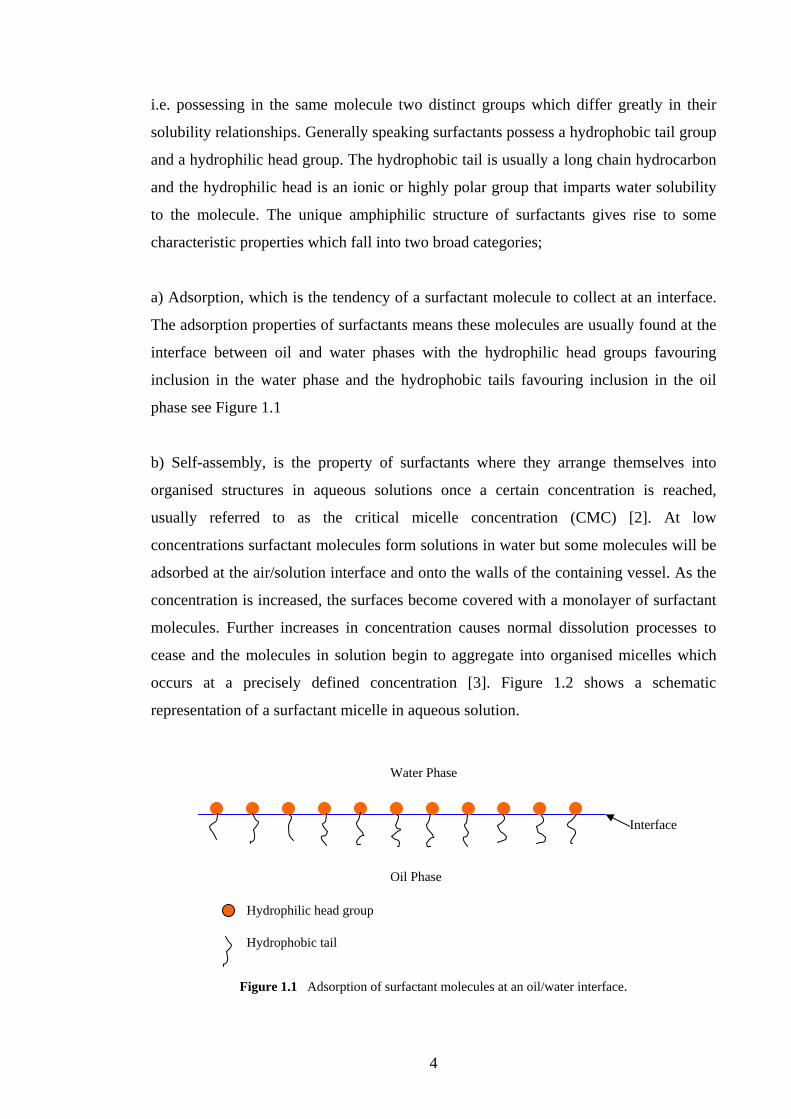
a) Adsorption, which is the tendency of a surfactant molecule to collect at an interface.
The adsorption properties of surfactants means these molecules are usually found at the
interface between oil and water phases with the hydrophilic head groups favouring
inclusion in the water phase and the hydrophobic tails favouring inclusion in the oil
phase see Figure 1.1
b) Self-assembly, is the property of surfactants where they arrange themselves into
organised structures in aqueous solutions once a certain concentration is reached,
usually referred to as the critical micelle concentration (CMC) [2]. At low
concentrations surfactant molecules form solutions in water but some molecules will be
adsorbed at the air/solution interface and onto the walls of the containing vessel. As the
concentration is increased, the surfaces become covered with a monolayer of surfactant
molecules. Further increases in concentration causes normal dissolution processes to
cease and the molecules in solution begin to aggregate into organised micelles which
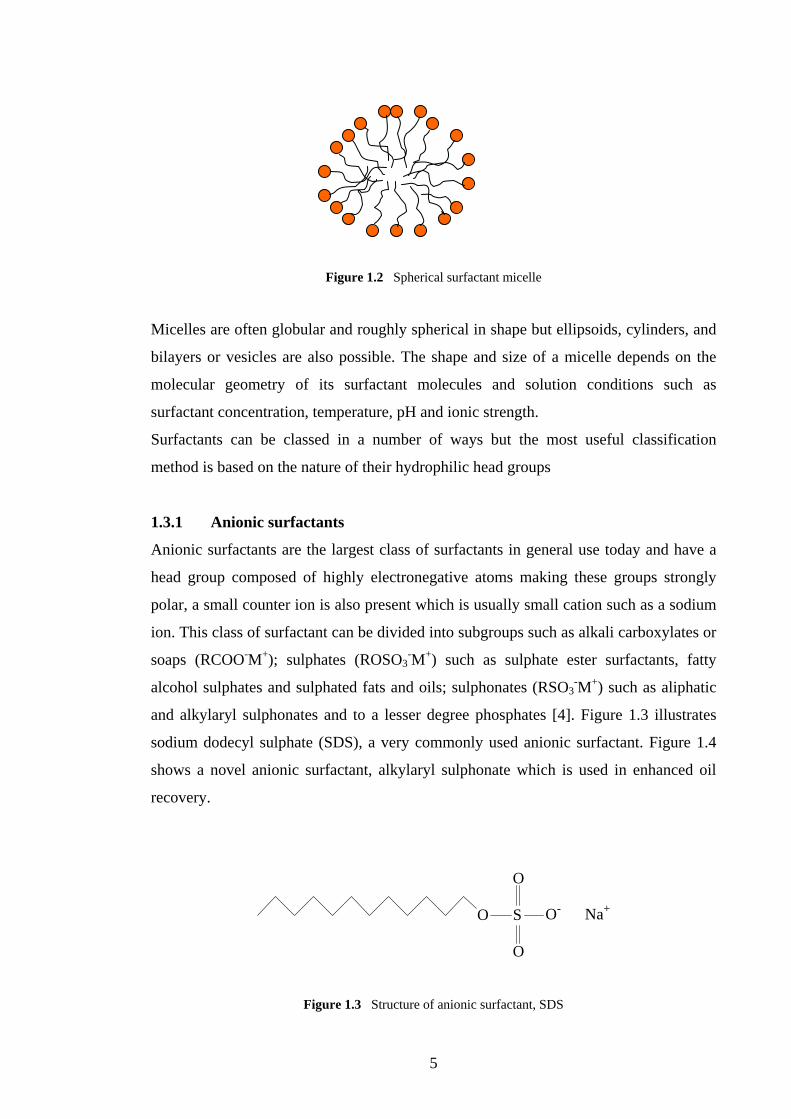
occurs at a precisely defined concentration [3]. Figure 1.2 shows a schematic
representation of a surfactant micelle in aqueous solution.
Water Phase Interface Oil Phase Hydrophilic head group Hydrophobic tail
Figure 1.1 Adsorption of surfactant molecules at an oil/water interface.
5
Figure 1.2 Spherical surfactant micelle
Micelles are often globular and roughly spherical in shape but ellipsoids, cylinders, and
bilayers or vesicles are also possible. The shape and size of a micelle depends on the
molecular geometry of its surfactant molecules and solution conditions such as
surfactant concentration, temperature, pH and ionic strength.
Surfactants can be classed in a number of ways but the most useful classification
method is based on the nature of their hydrophilic head groups
1.3.1 Anionic surfactants
Anionic surfactants are the largest class of surfactants in general use today and have a
head group composed of highly electronegative atoms making these groups strongly
polar, a small counter ion is also present which is usually small cation such as a sodium
ion. This class of surfactant can be divided into subgroups such as alkali carboxylates or
soaps (RCOO-M+); sulphates (ROSO3-M+) such as sulphate ester surfactants, fatty
alcohol sulphates and sulphated fats and oils; sulphonates (RSO3-M+) such as aliphatic
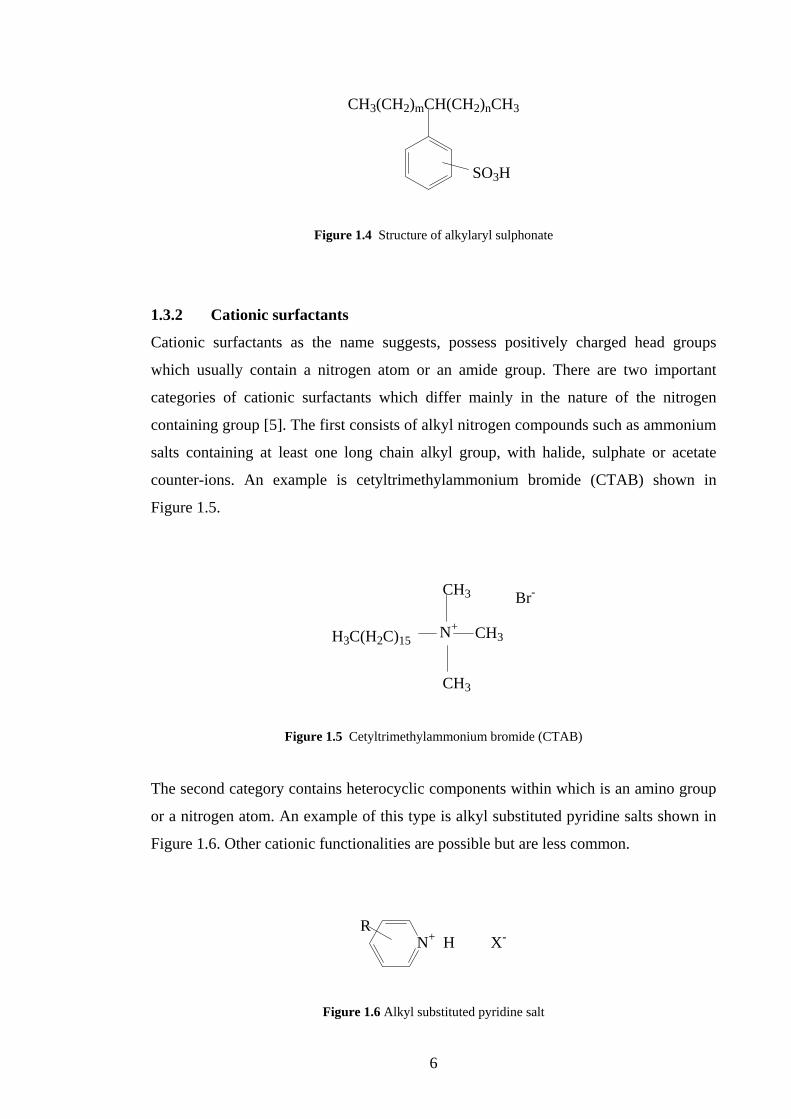
and alkylaryl sulphonates and to a lesser degree phosphates [4]. Figure 1.3 illustrates
sodium dodecyl sulphate (SDS), a very commonly used anionic surfactant. Figure 1.4
shows a novel anionic surfactant, alkylaryl sulphonate which is used in enhanced oil
recovery.
O S O- Na+
O
O
Figure 1.3 Structure of anionic surfactant, SDS
6
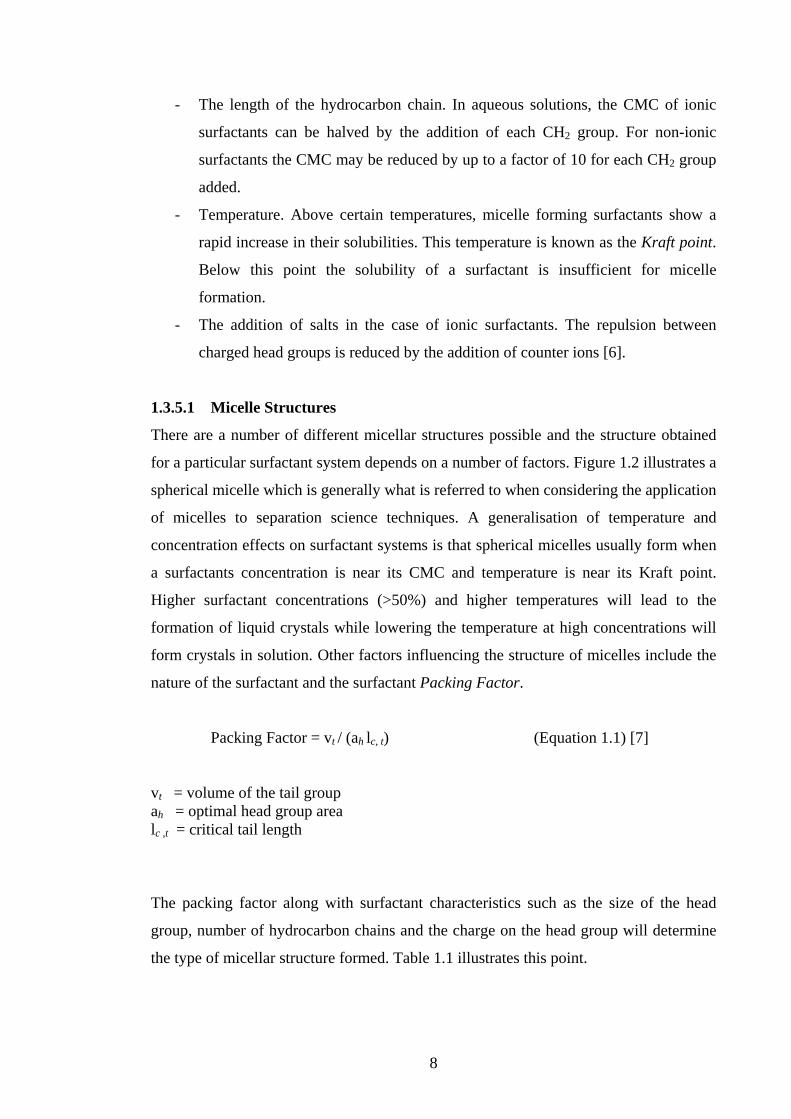
CH3(CH2)mCH(CH2)nCH3
SO3H
Figure 1.4 Structure of alkylaryl sulphonate
1.3.2 Cationic surfactants
Cationic surfactants as the name suggests, possess positively charged head groups
which usually contain a nitrogen atom or an amide group. There are two important
categories of cationic surfactants which differ mainly in the nature of the nitrogen
containing group [5]. The first consists of alkyl nitrogen compounds such as ammonium
salts containing at least one long chain alkyl group, with halide, sulphate or acetate
counter-ions. An example is cetyltrimethylammonium bromide (CTAB) shown in
Figure 1.5.
H3C(H2C)15 N+ CH3
Br-CH3
CH3
Figure 1.5 Cetyltrimethylammonium bromide (CTAB)
The second category contains heterocyclic components within which is an amino group
or a nitrogen atom. An example of this type is alkyl substituted pyridine salts shown in
Figure 1.6. Other cationic functionalities are possible but are less common.
N+ H X-R
Figure 1.6 Alkyl substituted pyridine salt

7
1.3.3 Non-ionic surfactants
The two previously mentioned surfactants dissociate in water to produce a net charge on
the head group of the molecule. This is not a necessary requirement for the existence of
surface activity and non-ionic surfactants can offer advantages over ionic surfactants i.e.
the effect of solution pH is lessened and the degree of water solubility can be controlled
by controlling the polarity and size of the head group. Non-ionic surfactants can be
further divided into sub groups such as block copolymer non-ionic surfactants;
derivatives of polyglycerols and other polyols; and polyoxyethylene based surfactants
like polyoxyethylene 23 lauryl ether (CH3(CH2)10CH2(OCH2CH2)23OH) which are the
most numerous and widely used.
1.3.4 Zwitterionic surfactants
Zwitterionic or amphoteric surfactants contain or have the potential to form both
positive and negative functional groups under specified conditions. The zwitterionic
nature of these surfactants makes them very much compatible with other forms of
surfactants. There are in general four classes of functionalities with potential for
producing zwitterionic surfactants; imidazole derivatives such as fatty
acid/aminoethylethanolamine condensates (RCONHCH2CH2NR’R’’), betaines and
sulphobetaines such as dodecylbetaine (C12H25(CH3)2N+CH2COO-), amino acid
derivatives, and lecithins.
1.3.5 Aqueous Surfactant Structures
Surfactant molecules in solution exhibit unusual physical properties. In dilute solutions
the surfactant acts as a normal solute but upon reaching a well defined concentration,
abrupt changes in physical properties are observed. These properties include; osmotic
pressure, turbidity, electrical conductance, and surface tension. This concentration as
mentioned in Section 1.3 is called the CMC where at and above this concentration
micellisation occurs. The formation of micelles is an alternative mechanism to
adsorption at the interface by which a surfactant solution may decrease its interfacial
energy. The CMC of a surfactant can be affected by a number of factors outlined on the
following page.
8
- The length of the hydrocarbon chain. In aqueous solutions, the CMC of ionic
surfactants can be halved by the addition of each CH2 group. For non-ionic
surfactants the CMC may be reduced by up to a factor of 10 for each CH2 group
added.
- Temperature. Above certain temperatures, micelle forming surfactants show a
rapid increase in their solubilities. This temperature is known as the Kraft point.
Below this point the solubility of a surfactant is insufficient for micelle
formation.
- The addition of salts in the case of ionic surfactants. The repulsion between
charged head groups is reduced by the addition of counter ions [6].
1.3.5.1 Micelle Structures
There are a number of different micellar structures possible and the structure obtained
for a particular surfactant system depends on a number of factors. Figure 1.2 illustrates a
spherical micelle which is generally what is referred to when considering the application
of micelles to separation science techniques. A generalisation of temperature and
concentration effects on surfactant systems is that spherical micelles usually form when
a surfactants concentration is near its CMC and temperature is near its Kraft point.
Higher surfactant concentrations (>50%) and higher temperatures will lead to the
formation of liquid crystals while lowering the temperature at high concentrations will
form crystals in solution. Other factors influencing the structure of micelles include the
nature of the surfactant and the surfactant Packing Factor.
Packing Factor = vt / (ah lc, t) (Equation 1.1) [7]
vt = volume of the tail group ah = optimal head group area lc ,t = critical tail length
The packing factor along with surfactant characteristics such as the size of the head
group, number of hydrocarbon chains and the charge on the head group will determine
the type of micellar structure formed. Table 1.1 illustrates this point.

9
Table 1.1 Packing parameter and micelle structure. [8]
Surfactant type Critical Packing Parameter
Micelle Structure formed
Single hydrocarbon tail with large head group
<1/3 Spherical
Single tail with small head group 1/3 – 1/2 Cylindrical Double tail with large head group 1/2 – 1 Flexible bilayers Double tail with small head group (anionic)
~1 Planar bilayers
Double tail with small head group (non-ionic)
>1 Inverted micelles
1.4 Emulsions
An emulsion is a heterogeneous system consisting of at least one immiscible liquid
dispersed in another in the form of droplets, whose diameter, in general exceeds 0.1 µm.
Such systems possess a minimal stability, which may be accentuated by such additives
as surface-active agents, finely divided solids etc [9]. Emulsions are generally opaque or
milky in appearance due to the relatively large droplets which scatter white light.
The formation of an emulsion requires the generation of a very large amount of
interfacial area between two immiscible phases which in turn requires work to be done
on the system i.e. vigorous shaking of two immiscible liquids in a closed container. The
work required to generate one cm2 of new interface is given by the following formula;
W = σi ΔA (Equation 1.2) [10]
Where W = work; σi = the interfacial tension between two immiscible phases and ΔA is
the change in interfacial area. Since work done on the system remains as potential
energy, the system will be thermodynamically unstable and will undergo
transformations to reduce the interfacial area to a minimum and so achieve minimum
potential energy. These energetically favourable transformations are summarised as
follows;

10
a) Coalescence, the joining of two or more drops to form a single larger drop of larger
volume;
b) Flocculation, the mutual attraction of individual drops to form loose assemblies of
particles in which the identity of each is maintained;
c) Breaking of an emulsion where gross separation of the two phases occurs and the
physical and chemical properties of the emulsion are lost;
d) Creaming is related to flocculation and will occur over time with almost all
emulsions where there is a difference in the density of the two phases [10].
Upon the addition of a surfactant (emulsifying agent) to the system, a number of factors
will contribute to enhance the emulsion stability.
a) A saturated monolayer of surfactant molecules is adsorbed at the oil-water
interface, lowering the interfacial tension between the two phases resulting in less work
being required to increase the surface area (Equation 1.2).
b) Mechanical stabilisation of the interfacial film. By combined use of water-
soluble and oil-soluble surfactants, the interfacial film is stronger and more elastic
which retards coalescence [11].
c) If the surfactant is ionic and imparts a charge on the interface, then the dispersed
phase will be surrounded by a charged atmosphere which can slow down the rate at
which particles come together [12].
d) High viscosity. The addition of a surfactant to an oil-water mixture can have a
profound effect on the resulting emulsion viscosity depending on the type and
concentration of surfactant used. High viscosities retard the rate of coalescence,
creaming etc [11].
Another factor which effects emulsion stability is the ratio of oil and water phases. A
relatively small volume of the dispersed phase will favour emulsion stability. The
relative ratios of the oil and water phases and surfactant will also determine the type of
emulsion if any that will form. The two most important types for the purposes of this
research are oil-in-water (O/W) and water-in-oil (W/O). These will be discussed in
more detail when related to microemulsions.

11
1.5 Microemulsions
The term microemulsion is applied to systems prepared by emulsifying an oil in an
aqueous surfactant and then adding a fourth component called a cosurfactant, which is
generally an intermediate chain length alcohol such as pentanol or butanol.
Microemulsions are quite distinct from previously mentioned emulsions in a number of
ways, the main distinction being that emulsions are thermodynamically unstable and
have a finite lifetime after which the emulsion breaks. Microemulsions on the other
hand are thermodynamically stable compositions which form spontaneously or with
gentle agitation once the correct composition is reached. They have potentially infinite
lifetimes which depend on storage conditions. Other distinctions include droplet size
and the colour of the system. Emulsion systems generally have spherical droplets with
diameters large enough to scatter white light and are therefore opaque in appearance,
whereas microemulsions have droplet sizes of 100 nm or less and are transparent or
have a slightly blueish tinge. Microemulsions can be either oil-in-water (O/W), water-
in-oil (W/O) or a mixture of these two called a bicontinuous phase. Figure 1.7 illustrates
a representation of an O/W microemulsion droplet. W/O microemulsions are composed
of a dispersed aqueous phase with the surfactant tails oriented outwards towards the oil
bulk phase
Surfactant molecule Cosurfactant molecule
Figure 1.7 Cross sectional representation of a spherical O/W microemulsion droplet.
Oil phase
Aqueous phase
Aqueous phase
12
Microemulsion droplets differ from micellar aggregates in that the dispersed phase of a
microemulsion is contained in the interior of the microemulsion droplet and these
droplets tend to be slightly larger than micelles. Microemulsions also have superior
solubilising power over micelles due to the presence of the dispersed phase and the
larger droplet size. The formation of micelles depends on the concentration of
surfactants in solution with micellisation occurring once the CMC is reached. The
formation of microemulsions however has very specific compositional requirements
with concentrations of each component critical to their formation and to the type of
microemulsion formed. This can be illustrated in the form of a ‘phase diagram’ which is
a two dimensional representation of a three phase system at a fixed temperature, see
Figure 1.8.
The fact that microemulsions can form spontaneously once the correct proportions of
each component is reached and remains stable, implies that there is a minimum of
interfacial free energy at the interface between the oil and aqueous phases which is
occupied by the surfactant and cosurfactant. There have been various theories to explain
the formation and stability of microemulsions;
i) The presence of a mixed film of surfactant and cosurfactant makes the interfacial free
energy negative,
ii) Solubilisation, where increasing amounts of oil introduced to a micellar system
become solubilised in the core of the micelle which increases in size and eventually
forms a microemulsion.
iii) Thermodynamic considerations which can explain formation, stability and droplet
size.
The following equation was put forward by Ruckenstein [13] to explain the
thermodynamics of microemulsion formation based on Gibbs free energy equation.
ΔGm = ΔG1 + ΔG2 + ΔG3 – TΔS (Equation 1.3) ΔGm is the free energy of microemulsion formation ΔG1 is the free energy change due to the increase in surface area ΔG2 is the free energy change due to the interaction between droplets ΔG3 is the free energy change due to adsorption of surfactant molecules at the oil water interface T = temperature (K) ΔS = the increase in entropy due to the dispersion of droplets.
13
The overall sum of the free energy changes on the right hand side of Equation 1.3 will
determine whether microemulsion formation will occur. If ΔGm is negative then
spontaneous dispersion will lead to formation of microemulsion droplets. An increase in
overall free energy of the system due to decreasing particle size may be offset by the
TΔS term. Since the number of microemulsion particles increases with decreasing
particle size, TΔS becomes more favourable with decreasing size [14]. The spontaneous
dispersion of one phase into another liquid phase can only occur if the interfacial
tension between the two phases is so low that ΔS can dominate the total energy of the
system. Although surfactants can lower the interfacial tension between oil and water
substantially, the nature of the head group will usually lead to the formation of fairly
rigid interfacial films and limited surfactant mobility in the film and hence reduce the
curvature of the droplet, preventing the formation of small droplets [15]. The addition of
a cosurfactant usually in the form of a short or medium chain length alcohol can reduce
the rigidity of the interfacial film and increase adsorption at the surface.
δσ = -ГiRT δ(lnCi) (Equation 1.4)
σ = interfacial tension of a system Гi = the surface excess of component i at the interface Ci = concentration of component i in bulk solution R = gas constant T = temperature Equation 1.4 relates the amount of surfactant material adsorbed at the interface to the
interfacial tension of the system. The maximum value of Гi possible for a single
surfactant system is usually limited by solubility and/or CMC so that the amount of
surfactant adsorbed onto the interface is not usually enough to reduce the interfacial
tension adequately for spontaneous microemulsion formation. The addition of medium
chain alcohols (cosurfactants) to surfactant systems will result in an increase in their
CMC and water solubility, thereby increasing the amount of surfactant molecules at the
interface. As illustrated in Figure 1.7, these molecules orient themselves at the oil-water
interface in the same manner as the surfactant molecules. Because of the relatively small
size of the alcohol molecules compared to the surfactant molecules, they can efficiently
pack themselves between the surfactant molecules at the interface, moderating the
electrostatic and steric interactions between the surfactant head groups. This results in a

14
densely packed interfacial layer and a much higher value of Гi making the interfacial
energy sufficiently low for spontaneous microemulsion formation.
1.5.1 Microemulsion Phase Diagrams
Phase diagrams are used to display regions in which different phases exist in three
component systems. They are triangular in shape with each corner of the triangle
representing 100% of each component. Although microemulsions generally contain four
key components; surfactant, cosurfactant, oil and water, the surfactant and cosurfactant
are grouped together as one component to fit into the three-component model.
B Lyotropic liquid crystals
W/O microemulsion
O/W microemulsion
A C Unstable region, usually two phases in equilibrium
Figure 1.8. A three-component phase diagram indicating the composition of the various phases.
Components; A = 100% water; B = 100% surfactant; C = 100% oil.
The phase diagram in Figure 1.8 is a representation of one that would be specific to
three defined components at constant pressure and temperature. The character of a
microemulsion and whether one will be formed is determined by variables such as the
type and concentration of the surfactant and cosurfactant employed, temperature, the
nature and concentration of the oil phase, aqueous electrolytes and the relative ratios of
the components. The combined use of a range of these variables will generate distinct
phase diagrams for each system used.
15
1.5.2 Applications of Microemulsions
The unique nature of microemulsions as thermodynamically stable dispersions with a
narrow size distribution of nanometre-sized droplets has made them suitable for a
number of applications. Some of these applications will be discussed in this section.
1.5.2.1 Tertiary Oil Recovery
After initial recovery operations to extract oil from subterranean reservoirs using natural
pressure and flushing with water, approximately 70% of the oil reserve remains trapped
in the pore structure of the reservoir by capillary and viscous forces. Under optimum
conditions, an aqueous surfactant solution which may contain cosurfactants,
electrolytes, etc. can be pumped into the oil reservoir to solubilise the oil, effectively
dispersing it as a microemulsion and releasing it into the bulk phase for extraction [16].
1.5.2.2 Fuel Additives
One of the direct advantages of using microemulsion-based fuel additives is the
reduction of soot formation. When the water phase of the microemulsion is vaporized
during fuel combustion, the amount of heat released and the combustion temperature are
lowered. As a direct consequence, the emission rate of gases like nitrogen oxides and
carbon monoxide can be decreased [17].
1.5.2.3 Lubricants, Cutting Oils and Corrosion Inhibitors
The presence of a surfactant in microemulsion causes corrosion inhibition and the
increased water content compared to pure oil leads to higher heat capacity. On one hand
the corrosive agents cannot react with the metal surface because of solubilisation in the
microemulsion and on the other, the metal surface is protected by the adsorbed
hydrophobic surfactant film. In microemulsions, water with much higher thermal
conductivity, imparts higher heat capacity to the system. Microemulsions can be used in
cutting oil as the oil lubricates the cutting surface, and the water helps to remove the
frictional heat generated during the cutting process [17].
1.5.2.4 Paints, Coatings and Textile Finishings.
Paint formulations using microemulsions have shown higher scrub resistance, better
colour intensity and more stain resistance than those prepared by emulsions. In
principle, three different possibilities of using microemulsions exist for coating
16
applications: (1) for producing microdispersions by using microemulsified monomers,
(2) for transferring non-water-soluble polymers into water, and (3) for obtaining specific
effects by polymerization in W/O systems. Many auxiliary agents used in textile
finishing are of amphiphilic nature. Greater homogeneity can be achieved in dyeing
processes when using microemulsion based dyeing systems compared to conventional
dyeing systems [17].
1.5.2.5 Cosmetics
Microemulsions have been used in a variety of cosmetic products, where
microemulsions result in faster uptake of products into the skin. The solubilisation of
fragrance and flavoured oils can also be enhanced with microemulsions.
1.5.2.6 Pharmaceuticals
The use of microemulsions in pharmaceutical formulations has many advantages over
liquid crystalline and emulsion-based systems. The more stable microemulsion systems
can prolong the shelf life of many liquid formulations. The dispersed phase of the
microemulsion can act as a reservoir for hydrophilic or lipophilic drugs depending on
whether an O/W or W/O system is used. Coming in contact with a semi permeable
membrane, such as skin or mucous membrane, the drug can be transported through the
barrier. Both lipophilic and hydrophilic drugs can be administered together due to the
unique power of microemulsions to solubilise both types simultaneously. In contrast to
emulsions, microemulsions cause minimum immuno reactions or fat embolism. Proteins
are not denatured in microemulsions although they are unstable at high or low
temperatures. The total dose of the drug can be reduced when applied through the
microemulsion route and thus side effects can be minimized. Microemulsions are
promising delivery systems to allow sustained or controlled drug release for
percutaneous, topical, transdermal, ocular and parenteral administration. Enhanced
absorption of drugs, modulation of the kinetics of the drug release and decreased
toxicity are several advantages in the delivery process [17].
1.5.2.7 Reaction Media
Due to varied consistencies and microstructures, microemulsions have been considered
as useful reaction media for a variety of chemical reactions. The major types of
reactions studied in microemulsions comprise the formation of inorganic particles
17
(nanoparticles), polymerization, photochemical, electrochemical and electrocatalytic
and organic synthesis [17].
1.5.2.8 Analytical Applications
Microemulsions have been used in a number of analytical techniques such as
chromatography and laser-excited photoionization spectroscopy. Two of the most
common methods to date are the subject of this research and are briefly outlined below.
Microemulsion electrokinetic chromatography (MEEKC) uses microemulsions as
carrier electrolytes and there have been numerous applications of this method for
pharmaceutical analysis using the O/W type, including impurity determinations,
physicochemical measurements and chiral separations. The use of W/O microemulsions
for MEEKC separations has also been reported [18].
Microemulsions have been used as eluents in liquid chromatography using both gradient
and isocratic modes for the analysis of a range of compounds and formulations. These
two separation techniques benefit greatly from the solubilising power of
microemulsions for both hydrophilic and hydrophobic compounds with sample
preparation often reduced to a minimum and rapid analysis times possible [19]. Because
of the small size of microemulsion droplets (<100 nm), UV detection using very low
wavelengths (~190 nm) is possible particularly when analyzing solutes with limited UV
activity. This was demonstrated by McEvoy et al [20] when detecting ibuprofen using
O/W microemulsion liquid chromatography (MELC) and UV detection at 190 nm. The
theory and applications of microemulsion liquid chromatography (MELC) will be
discussed in this Chapter while microemulsion electrokinetic chromatography is
covered in Chapter Two.
1.5.2.9 Other Applications
Other areas in which microemulsions have found use which will not be discussed here
include; Agrochemicals, food, environmental detoxification, liquid separation
membranes and biotechnology.
18
1.6 Introduction to Microemulsion Liquid Chromatography (MELC)
Microemulsions were first used as eluents for HPLC in 1986 [21] but there has been
sporadic research carried out in this area of chromatography until recently with more
research papers appearing in the last 4 to 5 years. HPLC is a dynamic adsorption
process where a mixture of analyte molecules partition to different degrees between the
mobile phase and the surface adsorption sites of the stationary phase. Using a
microemulsion as a mobile phase alters these partitioning characteristics in two ways.
Firstly a layer of surfactant molecules adsorbs onto the surface of the stationary phase.
This effectively increases the amount of stationary phase and the nature of the adsorbed
surfactant molecules also affects the retention of the solutes.
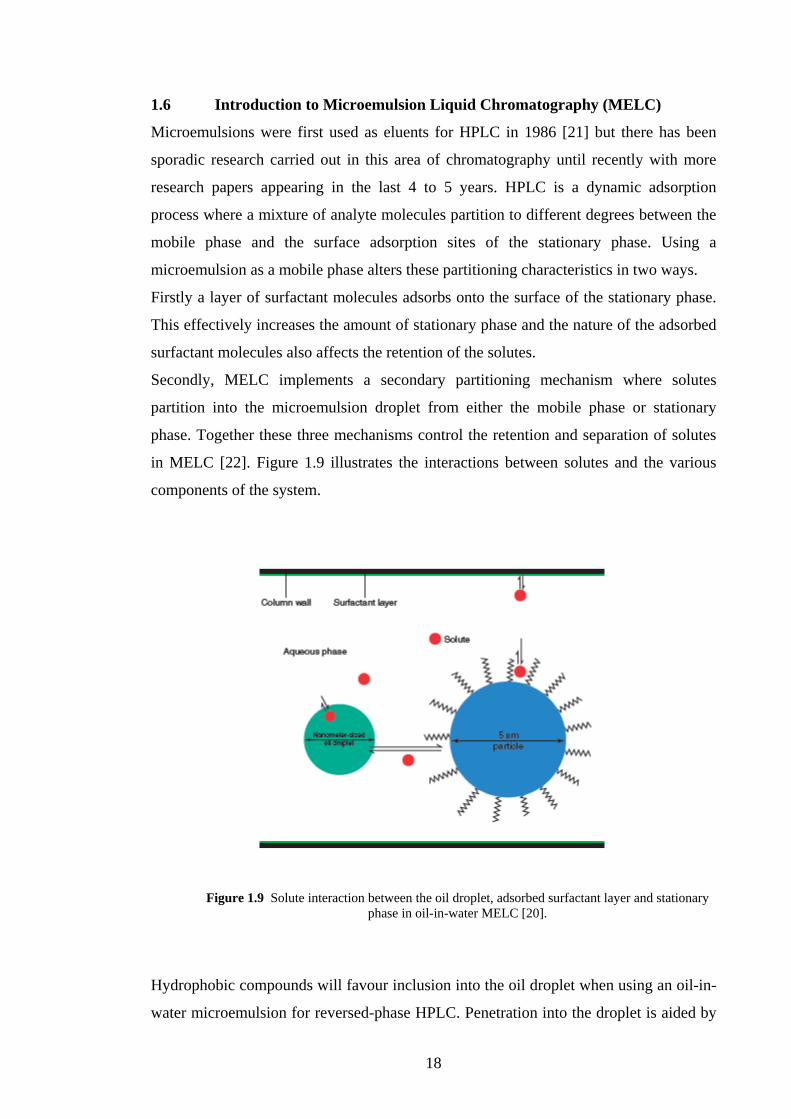
Secondly, MELC implements a secondary partitioning mechanism where solutes
partition into the microemulsion droplet from either the mobile phase or stationary
phase. Together these three mechanisms control the retention and separation of solutes
in MELC [22]. Figure 1.9 illustrates the interactions between solutes and the various
components of the system.
Figure 1.9 Solute interaction between the oil droplet, adsorbed surfactant layer and stationary phase in oil-in-water MELC [20].
Hydrophobic compounds will favour inclusion into the oil droplet when using an oil-in-
water microemulsion for reversed-phase HPLC. Penetration into the droplet is aided by
19
the fact that the droplet surface is loose due to the presence of cosurfactant hydroxyl
groups between the surfactant head-groups [23]. Partitioning into the oil core of the
microemulsion droplet predominantly influences retention of hydrophobic solutes.
Hydrophilic solutes favour the continuous aqueous phase of the microemulsion and
their retention is largely controlled by stationary phase interactions.
1.6.1 Oil-in-Water MELC
This technique was first reported in 1992 [24-25] when microemulsions of heptane,
pentanol, SDS and water were used on a reversed phase column for the separation of a
series of alkyl benzenes [24] and for the rapid screening of 11 drugs used illegally in
sports [25]. These studies highlighted the unique solubilising power of microemulsions
for hydrophobic compounds due to the large droplets with a hydrophobic interior. The
water content of 90% solubilises hydrophilic compounds well and has excellent
compatibility with reversed phase columns. Using the microemulsion as a mobile phase
in this way enables the isocratic separation of complex mixtures of hydrophilic and
hydrophobic compounds. In contrast, conventional HPLC modes often require an
elution gradient to achieve successful separation of such mixtures. The elution order of
solutes in oil-in-water MELC is in the order of their water-solubility, with highly water-
soluble solutes eluting first [22]. The aqueous continuous phase of the microemulsion
usually contains additives so that optimum separation conditions are achieved. Organic
modifiers, ion pair reagents and pH buffers can be added to achieve the required
separation.
1.6.2 Water-in-Oil MELC
The first reported use of water-in-oil microemulsions as mobile phases for normal phase
chromatography was in 1986 when Dorsey and co-workers [21] were experimenting
with reversed micellar mobile phases using 50 mM sodium bis(2-ethylhexyl)
sulphosuccinate (AOT) plus 1% v/v water in hexane. They found that the
microemulsion mobile phase provided a much more robust methodology than the usual
non-polar eluents.
More studies carried out in 1990 [26] examined the chromatographic performance of 50
different microemulsion compositions for the separation of 4-nitrobenzoic acid and 4-
20
nitrophenol. It was not until 2004 [27] that further work was carried out in this area
which examined the effects on the separation of a four component test mixture by
varying the oil type, co-surfactant, surfactant, water concentration, temperature and flow
rate.
Oils such as heptane are used as the continuous phase in a water-in-oil microemulsion
and these microemulsions are highly solubilising for hydrophobic solutes.
Microemulsion droplets have a high surface area and are often used in extraction
processes. Their ability to reduce or eliminate lengthy extraction processes for oil or
cream based samples was demonstrated when using water-in-oil microemulsions for
analysis by MEEKC [28]. Creams and ointments were dissolved in the microemulsion
and directly injected into the capillary. This was in comparison to HPLC or titration
methodsd where pre-treatment steps such as removal of excipients are usually needed.
Solute retention in water-in-oil MELC is dependant on water solubility with retention
times inversely proportional to the solutes log P value [27]. The elution order of solutes
is the reverse of that obtained with oil-in-water MELC i.e. highly water-soluble solutes
will elute last in water-in-oil MELC.
1.6.3 MELC as an Extension of MLC (Micellar Liquid Chromatography)
Micellar liquid chromatography is a chromatographic technique where a micellar
solution is used as a mobile phase. Solutes will partition between the aqueous
component and the micelles of the mobile phase in a similar manner to solute
interactions with a microemulsion droplet. Micellar liquid chromatography however
suffers from poor efficiency, which is due to the slow mass transfer between micelles
and the aqueous phase and the stationary phase due to surfactant adsorption onto the
stationary phase [29]. Organic solvents such as iso-propanol are generally added to
micellar mobile phases to improve separation performance [30].
The introduction of a microemulsion as a mobile phase for liquid chromatography has
resulted in improved efficiencies and solute solubilisation capacity [22]. The less rigid
surface of the microemulsion droplet allows for faster and easier solute penetration and
thus greater efficiency than micellar liquid chromatography. The co-surfactant in MELC
desorbs surfactant molecules from the stationary phase enabling faster mass transfer
21
between the droplet and the aqueous phase of the microemulsion and also the stationary
phase [31].
Gradient elution may be required in micellar liquid chromatography and other HPLC
modes to separate complex mixtures of hydrophilic and hydrophobic compounds
whereas the same separation may be achieved isocratically with MELC.
1.6.4 Operating Parameters in Oil-in-Water MELC
1.6.4.1 Surfactant Concentration.
Increasing the concentration of the surfactant in the microemulsion system can result in
a decrease in the retention of most solutes which have an affinity for the microemulsion
droplets [32]. The increased surfactant concentration results in an increase in the
volume of microemulsion droplets flowing towards the detector. Changing the
surfactant concentration will affect hydrophobic solutes more than hydrophilic solutes
due to their greater affinity for the droplet. The retention of more hydrophobic analytes
will be affected to a greater degree due to their distribution into the droplet. Analytes
with no affinity for the oil droplet will not be affected [22, 32-34]. This was shown by
El-Sherbiny et al [35] where increased concentrations of SDS resulted in a reduction in
the retention of flunarazine and five of its hydrophobic degradation products. Reports
have also shown that the surfactant concentration can affect the analyte peak height and
areas [35, 36].
Solutes will also interact with surfactant molecules adsorbed onto the stationary phase.
Those which are attracted electrostatically to the charged surfactant head group will
spend more time at the stationary phase resulting in increased retention as the surfactant
concentration increases. Solutes that are repelled by the adsorbed surfactant head group
will be retained less as the surfactant concentration increases [22]. When studying the
separation of simvastatin and six of its impurities using MELC, Malenovic et al [37]
found that strict control of the surfactant concentration was necessary to obtain
robustness of the method.
1.6.4.2 Surfactant Type.
Changing the surfactant type can affect separation selectivity [33]. Using a surfactant
molecule with a different head group or carbon tail length will alter the partitioning
22
properties between the solute and the droplet and the solute and the adsorbed stationary
phase layer [38].
Using mixed surfactants such as SDS, which is anionic and Brij 35, a non-ionic
surfactant can alter the separation selectivity. This is due to a change in the charged
nature of the surfactant which alters the solute-droplet or solute-adsorbed layer
interactions. The head groups of positively charged surfactants will interact with the
acidic groups on the bonded stationary phase of a reverse phase column which retains
the hydrophobicity of the stationary phase. The opposite is true of anionic surfactants
where the alkyl tail of anionic surfactants interacts with the alkyl chain of the bonded
phase leaving their charged head groups outermost resulting in a hydrophilic layer [38,
39].
1.6.4.3 Co-surfactant Concentration.
The co-surfactant is a very important part of a microemulsion system as it influences
phase behaviour and changing the cosurfactant type can alter selectivity [32, 33, 37].
Increasing the concentration of co-surfactant in the system increases the proportion of
organic phase in the microemulsion and decreases solute retention times [22, 33, 40]. A
high concentration of co-surfactant causes the microemulsion droplet to become
saturated with these molecules and the concentration of the aqueous surfactant phase
increases resulting in faster elution of hydrophobic solutes [22]. Using very high
concentrations of co-surfactant causes microemulsion instability and should be avoided.
1.6.4.4 Co-surfactant Type.
The selectivity changes that can occur when changing the co-surfactant type can be
significant. A range of co-surfactants, which includes short chain alcohols,
tetrahydrofuran and acetonitrile [32, 39], have been used in oil-in-water MELC and
have displayed different selectivities and retention times. Pentan-1-ol with a five-carbon
alkyl chain is more hydrophobic than other short chain alcohols and will penetrate the
microemulsion droplet deeper, causing larger droplets to be formed. This alters the
phase behaviour and decreases retention times [22]. Short chain alcohols such as
propanol are completely miscible with water and influence mobile phase
hydrophobicity which affects retention [39, 41]. Jancic et al [41] found that the type and
concentration of the cosurfactant had the biggest influence on the separation and
23
detection of fosinoprilat in human plasma. Substitution of butanol with propanol,
tetrahydrofuran and acetonitrile caused a large increase in retention time and affected
selectivity.
1.6.4.5 Oil Type.
Different organic solvents covering a wide range of polarities have been used as the oil
phase in oil-in-water MELC. Although octane is commonly used, other solvents such as
di-isopropyl ether [33], 2-octanone, 1-octanol [32], butyl acetate, cyclohexane [41] and
ethyl acetate [22] have all been used, each displaying very different selectivity and
effects on retention times.
The molecular volume of the oil, relative to the hydrophobic chain of the surfactant,
affects the extent to which it penetrates the surfactant tails of the oil-water interface.
Oils of small molecular volume do not form a central droplet core but penetrate the
surfactant layer altering solute solubilisation in the head region of the aggregate. Large
molecular volume oils form a central core of oil molecules, which provides an extra site
for solubilisation of compounds [42]. Replacement of octane with chlorobutane or ethyl
acetate, which have lower molecular volume, resulted in an increase in retention time
and resolution of a range of pharmaceutical compounds caused by the lower distribution
of the solutes in the microemulsion droplets [22]. When using octane or any oil with a
similar molecular volume, structurally similar substances may be poorly resolved. By
using an oil phase of lower molecular volume for example, ethyl acetate, better
resolution may be achieved. Replacing octane with heptane or alcohols such as hexanol
or heptanol can improve peak efficiencies but increase run time [22].
1.6.4.6 Oil Concentration.
Marsh et al [22] when using a standard microemulsion system of 3.3% w/w SDS, 6.6%
w/w butan-1-ol, 0.8% w/w octane in 0.05% v/v trifluoroacetic acid found that changing
the concentration of oil by small amounts can have very noticeable effects on
separations achieved. At 1% w/w octane or greater, poor reproducibility was seen as the
microemulsion became unstable. Above 1.2% w/w no more oil could be solubilised by
the surfactant system. Solute retention decreased as the oil content was increased due to
the increased solubilising power of the microemulsion droplet. Increasing the
24
concentration of oil in the microemulsion showed no change in selectivity but affected
the resolution of solute peaks depending on the hydrophobicity of the solutes.
1.6.4.7 Mobile Phase Additives
Very few MELC applications have used mobile phase additives to control selectivity or
retention times for the applied separations. Most reports of MELC to date have studied
the effects of the basic microemulsion components and their concentrations on solute
retention. Marsh et al [22] studied the effects of adding cyclodextrin to the
microemulsion on the separation of a mixture of pharmaceutical compounds and found
that both α and β-cyclodextrin at 15 mM concentration increased retention times. γ-
cyclodextrin was found to be insoluble in the microemulsion.
In the same report, the effects of ion-pair reagent (IPR) addition to the microemulsion
were studied. Octane sulphonic acid, a negative IPR and tributylammonium hydrogen
sulphate, a positive IPR were added at 10 mM concentration and both were found to
affect separation selectivity and increase retention times.
Organic solvents have been added to microemulsion eluents and have been shown to
reduce retention times without affecting peak selectivity or efficiency [43].
1.6.4.8 Column Temperature.
Investigations into temperature affects in MELC have been limited. The effect of
column temperature on the separation of a test mixture of ethyl, methyl, and propyl
parabens, oxibendazole and beclamethasone dipropionate was investigated between 20
and 60º C. Results indicated that increasing the operating temperature had little effect
on peak retention times or the separation in general. There was an increase in peak-to-
peak resolution of oxibendazole and beclamethasone dipropionate, which were the last
two peaks to elute as a result of increased solute mass transfer between the two peaks
[22]. Increasing the column temperature had little effect on peak efficiencies when
analysing paracetamol in a suppository formulation [44].
Increasing the temperature also has the effect of lowering the viscosity of the
microemulsion, which allows higher flow rates to be used to speed up some analyses. It
25
was found that column temperature, column back pressure and microemulsion viscosity
were directly related [44].
1.6.4.9 Microemulsion pH.
Retention of analytes in reversed-phase HPLC is related to their hydrophobicity, the
more hydrophobic analytes are retained the most. When analytes are ionised, they
become less hydrophobic and retention times decrease due to decreased retention on the
stationary phase. Control of the pH therefore is necessary to achieve good separations
when separating mixtures of acids or bases.
Variation of the pH of the microemulsion in MELC has similar effects on separations to
that observed in RP-HPLC [22, 34]. One of the few investigations into pH effects upon
solute retention in MELC demonstrated that the retention time of naproxen sodium, an
acid with a pKa of 4.4 increased as the pH of the microemulsion was lowered. A similar
investigation into pH effects on the retention of naphthalene, which is un-ionisable,
showed no change in retention time over a pH range of 2.5 to 5 [22]. In a study by El-
Sherbiny et al [34] the retention times of loratadine and deloratadine with pKa values of
5.0 and 4.2 respectively found that retention increased as pH was increased from 3 to 7.
At higher pH values the ionisation of both compounds decreased and retention was
dependant on the log P of each compound.
1.6.5 Stationary Phases.
The characteristics of the analytes to be separated will govern the choice of stationary
phase when using RP-HPLC columns. The compatibility of the oil-in-water
microemulsion mobile phases with reversed-phased columns and a wide range of
compounds of varying polarity and solubility means a single stationary phase can be
used for a broad range of compounds.
Monolithic silica columns have been used in MELC to achieve rapid separations [45].
These stationary phases have large through-pores for the transport of mobile phase and
analyte. These through-pores have a typical diameter of 2 micrometers, which reduces
the diffusion path and provides high permeability at low operating pressure.
26
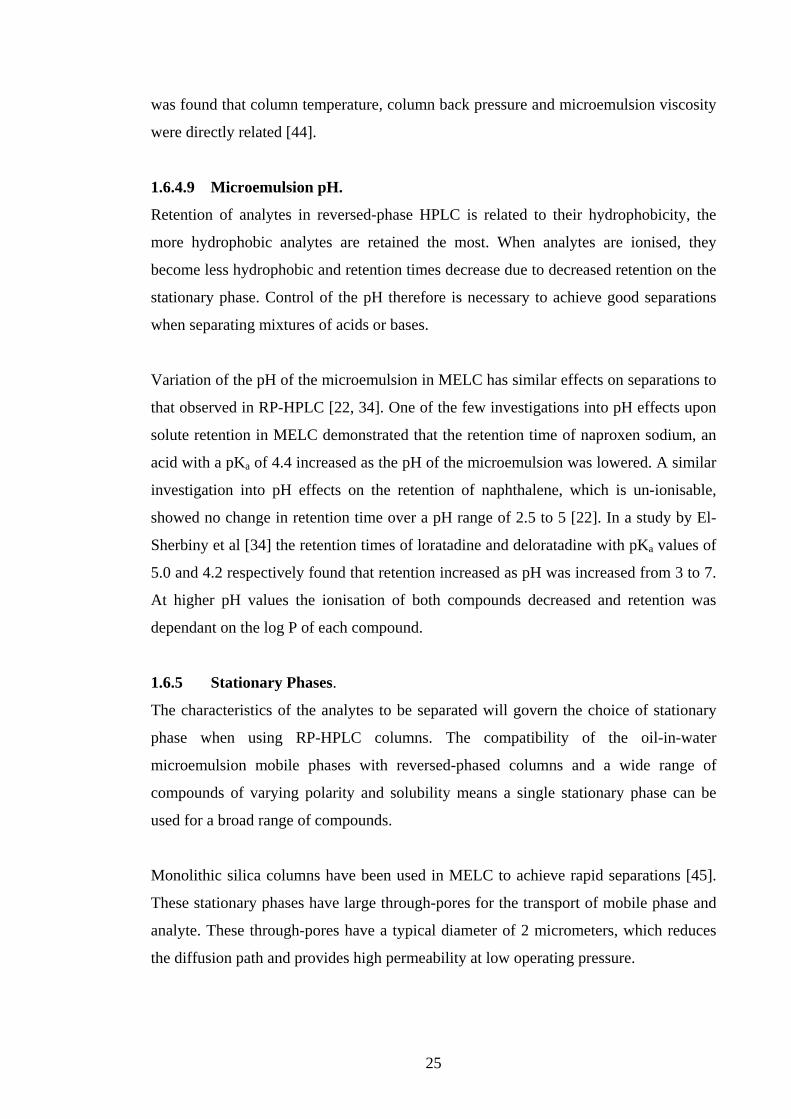
A secondary pore structure of shallow diffusive mesopores exists which provides
additional surface area for chromatographic activity. Rapid MELC separations of a
mixture of paraben preservatives have been achieved using these columns in less than 1
minute using high flow rates of 4 ml.min-1 while generating modest back-pressure. See
Figure 1.10.
20
30
40
50
60
70
Res
pons
e
1 2 3 4Retention time
met
hyl p
eth
yl p
pro
pyl p
but
yl p
Figure 1.10. Isocratic separation of test-mixture of paraben preservatives with monolith column. Experimental conditions: test-mix 0.1 mgmL-1 in MeOH; injection volume 5 µL; 215 nm UV; flow rate 4 mLmin-1; 60°C; mobile phase: water + 3.3 % w/w SDS + 6.6 % w/w butanol + 0.8 % w/w octane + 0.05 % v/v TFA; isocratic elution; Chromolith RP-18 100 x 4.6 mm column. Ref [45].
1.6.6 Gradient Elution and MELC
Gradient elution is possible with MELC and its use allows more complex mixtures to be
separated. Although there have been few publications reporting the use of gradient
elution in MELC the benefits of this method have been demonstrated using both C18
packed columns [44 ,43] and monolith silica columns [45]. Figure 1.11 shows the
improved separation of a range of compounds using gradient elution.
Gradient elution is utilised in MELC where an aqueous starting eluent is mixed with
increasing amounts of microemulsion. This method has been shown to improve peak
resolution and efficiency compared to using isocratic mode [43]. Increasing the
concentration of the microemulsion droplets in the mobile phase does not change the
structure and composition of the stationary phase. When using gradient MELC the re-
equilibration time between injections is reduced due to the high aqueous content present
in the microemulsion throughout the run [45]. For the same reason the microemulsion
gradient can also be extended to 100%. This is usually not possible when using 100%

27
organic solvents as the column may become dehydrated. A rapid gradient MELC
method has been optimised for the separation of paracetamol and five of its related
substances [44] showing a dramatic decrease in analysis time compared to reversed
phase gradient HPLC.
Figure 1.11 Comparison of oil-in-water microemulsion gradient and isocratic separation of a test mixture. Gradient separation (top trace) reservoir A contains 0.05% v/v TFA in water, reservoir B 3.3% w/w SDS, 0.8% w/w octane, 6.6% w/w butan-1-ol, 0.05% v/v TFA in water. Gradient started at 95% v/v A, ramping up to 100% B over 7 min then held for 8 min. isocratic separation (bottom trace) 100% reservoir B held constant throughout run. UV detection at 215 nm, 30º C, 1 mLmin-1 flow rate, 5 µL injection volume, test-mix 0.1 mgmL-1 in microemulsion, 150 mm · 4.6 mm BDS C18 column with 5 micrometer particle size. Ref [43]. 1.6.7 Analyte Detection at Low Wavelengths
Oil-in-water microemulsions are usually ~90% aqueous and contain optically clear
nanometre sized droplets. The UV cut-off of water at 190 nm and the droplet size makes
them suitable as mobile phases for elution of analytes with weak chromophores. As
many analytes do not have very strong chromophores they need to be analysed at low
wavelengths or alternative detection methods may have to be used. Most HPLC solvents
will absorb at low wavelengths and generate poor baselines or do not allow the use of
very low wavelengths. For example, methanol and ethanol have a UV cut-off of 205
nm, acetonitrile at 200 nm and tetrahydrofuran at 220 nm. MELC separations and
analysis have been carried out at wavelengths as low as 190 nm [22, 43] for the
detection of ethyl and methyl parabens and ibuprofen [20]. Figure 1.12 shows the
simultaneous detection of ibuprofen at both 190 and 222 nm.

28
(a)ibuprofen 0.4mg/ml
Minutes
0 1 2 3 4 5 6 7 8 9 10
Vol
ts
0.00
0.05
0.10
Vol
ts
0.00
0.05
0.10
Detector A - 1 (190nm)ibuprofen170206ibuprofen.4mgmlA
(b)
ibuprofen 0.4mg/ml
Minutes
0 1 2 3 4 5 6 7 8 9 10
Vol
ts
0.0
0.1
0.2
0.3
Vol
ts
0.0
0.1
0.2
0.3
Detector A - 2 (222nm)ibuprofen170206ibuprofen.4mgmlA
Figure 1.12. Ibuprofen Detection at 190 and 222 nm using microemulsion mobile phase. 0.4 mg.ml-1 ibuprofen standard injected onto an O/W MELC system. Microemulsion composition; 3.3% w/w SDS, 6.6% w/w butan-1-ol, 0.8% w/w octane in 0.05% aqueous TFA, pH 2.8. Injection volume; 20µl, flow rate; 1ml.min-1; column, Waters Symmetry C18, 150mm x 3.9 mm with 5 micrometer packing particles. a) Detection at 190 nm. b) Simultaneous detection at 222 nm. Ref [20].
1.6.8 Operating Parameters of Water-in-Oil MELC
This mode of MELC has received limited research and preliminary work has shown its
usefulness for analysing a range of water insoluble compounds on normal phase silica
columns [27]. Figure 1.13 illustrates the water-in-oil MELC separation of four neutral
analytes of varying solubility.
Figure 1.13. W/O MELC Separation of a test mix of 4 neutral analytes. Separation Conditions: Microemulsion 70%w/w heptane 16.6%w/w pentanol 8.3%w/w SDS 5% w/w 70 mM sodium acetate; 55ºC; 254 nm; flow-rate 1 mL min-1; 125mm x 4.6 mm column packed with 5 micrometer particles [27].
29
The viscosity of water-in-oil microemulsions is greater than that of oil-in-water
microemulsions due to increased amounts of oil and surfactant in the system. This leads
to greater back pressures than would be encountered with oil-in-water MELC. A typical
water-in-oil microemulsion is composed of 8.33% w/w SDS, 16.6% w/w pentanol, 70%
w/w heptane and 5% w/w 70 mM sodium acetate [27].
Heavy adsorbance of the surfactant onto the stationary phase of the column due to high
surfactant concentrations can cause increased retention times and peak tailing. Regular
flushing is therefore needed to maintain the column. Regular column flushing is also
required when reversed-phase columns are used for oil-in-water MELC. Three different
solvent mixtures are generally used to flush the column; 60/40 propan-2-ol/methanol
followed by a 50/50 mix of propan-2-ol/ water and lastly propan-2-ol with 1% ethanol
[27]. This procedure can be time consuming and together with re-equilibrating the
column can take several hours. This needs to be accounted for when performing
analyses, with flushing and column equilibration best performed using automated
instruments outside of normal laboratory hours.
1.6.8.1 Oil Type.
Hydrocarbon oils such as heptane, hexane and decane have been used as the oil
continuous phase in water-in-oil microemulsions but heptane was shown to give the
best resolution with short retention time for a range of neutral components [27].
1.6.8.2 Surfactant Type.
As with oil-in-water MELC, changing the nature of the head group and carbon tail
length has a significant effect on separations. An adsorbed layer of surfactant on the
stationary phase interacts with solutes and affects the partitioning and retention of
solutes. Replacing SDS with sodium caprylate showed a change in elution order of
niacinamide and paracetamol. Retention times were also altered [27]. When using a
mixture of anionic SDS and non-ionic Brij35, the repulsion between the surfactant
head-groups is reduced resulting in a larger water droplet. Water-soluble analytes can
therefore partition more easily into the droplet allowing easier solubilisation of
lipophilic compounds. This can however result in the co-elution of water-soluble
compounds [27].
30
1.6.8.3 Co-surfactant.
The use of co-surfactants with increasing carbon chain length was shown to increase
resolution and retention times of analytes. Medium chain alcohols gave increased
efficiency because of competition between SDS adsorbed onto the column. The
concentration of co-surfactant is important for the formation of a stable microemulsion
and the ratio of surfactant to co-surfactant must always be 1:2 for stable microemulsion
formation [27].
1.6.8.4 Water Concentration.
Increasing the water concentration in a water-in-oil microemulsion alters the
physicochemical structure of the microemulsion which results in higher back pressures.
The amount of SDS adsorbed onto the column decreases when the water content is
increased due to a larger quantity of SDS molecules associating with the higher
concentration of water present in the microemulsion [27].
1.6.8.5 Temperature Effects and pH
Peak shape is improved with elevated temperatures in conjunction with medium chain
alcohols and can improve resolution [46]. When comparing the separation of caffeine
and paracetamol at temperatures of 25ºC and 55ºC, it was found that both compounds
co-eluted at the lower temperature but were fully resolved at 55ºC [27].
Varying the pH of the microemulsion can affect the retention and resolution of solutes.
Limited study has been carried out in this area and further research is required.
1.6.8.6 Log P Values and Retention in Water-in-Oil MELC.
It has been shown that there is good inverse correlation between retention time and
solute Log P values. Changes in retention mirrors its dependence on Log P values [27].
1.6.9 Applications of MELC
Because of the relative infancy of this mode of HPLC there have been few reports of
MELC applications. Due to the unique ability of microemulsions to solubilise complex
mixtures, the potential elimination of sample pre-treatment steps and their transparency
at low UV wavelengths, the number and range of applications of MELC continues to
expand. Table 1.2 shows the range of reported applications of MELC.
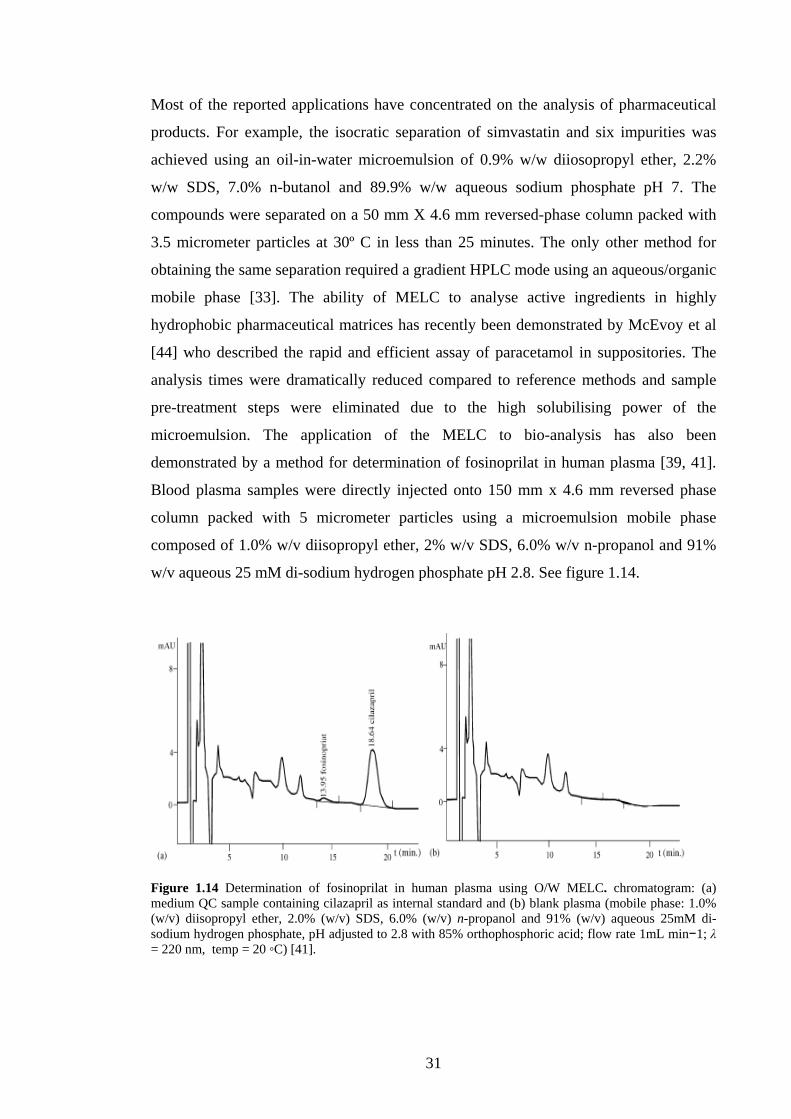
31
Most of the reported applications have concentrated on the analysis of pharmaceutical
products. For example, the isocratic separation of simvastatin and six impurities was
achieved using an oil-in-water microemulsion of 0.9% w/w diiosopropyl ether, 2.2%
w/w SDS, 7.0% n-butanol and 89.9% w/w aqueous sodium phosphate pH 7. The
compounds were separated on a 50 mm X 4.6 mm reversed-phase column packed with
3.5 micrometer particles at 30º C in less than 25 minutes. The only other method for
obtaining the same separation required a gradient HPLC mode using an aqueous/organic
mobile phase [33]. The ability of MELC to analyse active ingredients in highly
hydrophobic pharmaceutical matrices has recently been demonstrated by McEvoy et al
[44] who described the rapid and efficient assay of paracetamol in suppositories. The
analysis times were dramatically reduced compared to reference methods and sample
pre-treatment steps were eliminated due to the high solubilising power of the
microemulsion. The application of the MELC to bio-analysis has also been
demonstrated by a method for determination of fosinoprilat in human plasma [39, 41].
Blood plasma samples were directly injected onto 150 mm x 4.6 mm reversed phase
column packed with 5 micrometer particles using a microemulsion mobile phase
composed of 1.0% w/v diisopropyl ether, 2% w/v SDS, 6.0% w/v n-propanol and 91%
w/v aqueous 25 mM di-sodium hydrogen phosphate pH 2.8. See figure 1.14.
Figure 1.14 Determination of fosinoprilat in human plasma using O/W MELC. chromatogram: (a) medium QC sample containing cilazapril as internal standard and (b) blank plasma (mobile phase: 1.0% (w/v) diisopropyl ether, 2.0% (w/v) SDS, 6.0% (w/v) n-propanol and 91% (w/v) aqueous 25mM di-sodium hydrogen phosphate, pH adjusted to 2.8 with 85% orthophosphoric acid; flow rate 1mL min−1; λ = 220 nm, temp = 20 ◦C) [41].

32
Table 1.2 MELC Applications. 1986-2008
Application MELC Mode
Chromatographic Conditions Reference
Separation of two polar organic solutes
W/O
Normal phase silica column, 50 mM AOT + 1% v/v hexane in water
[21]
Determination of capacity factors of 4-nitrobenzoic acid and 4-nitrophenol
W/O
Normal phase column with AOT, heptane, water microemulsion
[26]
Separation of a mixture of four alkyl benzenes
O/W
Heptane, SDS, pentanol, water with a reversed phase column
[24]
Screening of 11 drugs used illegally in sport
O/W
Heptane, SDS, pentanol, water with a 5µ C18 column
[25]
Determination of anabolic steroids in pharmaceuticals
O/W
0.1 M SDS in (aq), 7% pentanol, C18 reversed phase column
[47]
Separation of a range of anti- hypersensitive and non-steroidal anti-inflammatory drugs. Direct injection of plasma and urine samples.
O/W
2% SDS, 10% 1-butanol, 1% 1-octanol, 0.3% TEA in 0.02M phosphoric acid. 1 ml.min-1. UV detection at 250 nm.
[32]
Separation of pharmaceuticals and related impurities using gradient elution
Gradient elution O/W
33 g SDS, 8.1 g octane, 66.1 g 1-butanol, in 1 litre of 10 mM sodium tetraborate.
[48]
Separation of simvastatin and six impurities.
O/W
0.9% diisopropyl ether, 1.7 & 2.2% SDS, 7% n-butanol, 89.9 & 90.4% aqueous 25 mM disodium phosphate pH 7.0
[33, 37]
Analysis of pharmaceuticals
O/W
3.3% SDS, 6.6% butan-1-ol, 8% octane in 0.05% aqueous TFA.
[22]
Gradient elution MELC determination of pharmaceuticals
Gradient elution O/W
3.3% SDS, 6.6% butan-1-ol, 8% octane in 0.05% aqueous TFA.
[43]
Water-in-oil MELC. Separation of pharmaceuticals.
W/O
8.33% w/w SDS, 16.6% w/w pentan-1-ol, 70% w/w heptane, 5% w/w (70 mM) sodium acetate.
[27]
Fosinopril sodium and Fosinoprilat separation with chemometrical support
O/W
2.2% w/w SDS, 0.9% w/w cyclohexane, 8.0% n-butanol, 88.9% aqueous 25 mM disodium phosphate.
[39]
Determination of fosinoprilat in human plasma
O/W
1.0% w/v diiospropyl ether, 2.0% w/v SDS, 6.0% w/v n-propanol, 91.0% w/v aqueous disodium hydrogen phosphate.
[41]
Analysis of flunarizine in the presence of degradation products.
O/W
0.15 M SDS, 10% n-propanol, 0.3% TEA in 0.02 M phosphoric acid pH 7.0.
[35]
Loratadine and desloratadine
O/W
0.1 M SDS, 1% octanol, 10% n-propanol and 0.3% TEA in 0.02 M phosphoric acid.
[34]
33
Paracetamol in suppository formulations
O/W
3.3 g SDS, 66 g butanol, 8 g octane in 0.05% TFA with 3% acetonitrile added
[44]
Nicardipine HCl determination in biological fluids and preparations; stability indicating studies
O/W
0.175 M SDS, 10% n-propanol, 0.3% triethylamine in 0.02 M phosphoric acid, pH 6.5
[36]
MELC characterisation by salvation parameter model
O/W
3.3% SDS, 6.6% n-butanol, 1.6% heptane, 88.5% buffer
[49]
Investigation of structural and interfacial properties on the separation of simvastatin and six impurities
O/W
1% diisopropyl ether, 2% SDS, 6.6% butanol, 90.4% 25 mM disodium phosphate pH 7.0
[50]
1.7 Conclusion Microemulsions have been used in various forms for a number of applications described
in this chapter. The amphiphilic properties of surfactant molecules have been exploited
for the formation of stable microemulsion systems. The ability of microemulsions to
solubilise both polar and non-polar compounds is a property that offers advantages over
conventional aqueous/organic mobile phases and sample solvents.
1.6 References [1] Myers D, Surfactant Science and Technology 2nd edition, VCH Publishers, New York
(1992). p24.
[2] http://www.kcpc.usyd.edu.au/discovery/9.5.5-short/9.5.5_introsurfactants.html (11-01-
07)
[3] Hunter RJ, Introduction to Modern Colloid Science, Oxford University Press, New
York (1993), p12.
[4] Myers D, Surfactant Science and Technology 2nd edition, VCH Publishers, New York
(1992), pp 41-50.
[5] Myers D, Surfactant Science and Technology 2nd edition, VCH Publishers, New York
(1992), p62.
[6] Shaw DJ, Introduction to Colloid and Surface Chemistry 3rd edition, Butterworths,
London (1980), p80.
[7] Heimenz PC, Rajagopalan R, Principles of Colloid and Surface Chemistry 3rd edition,
Marcel Decker, New York (1997), p369.
34
[8] Heimenz PC, Rajagopalan R, Principles of Colloid and Surface Chemistry 3rd edition,
Marcel Decker, New York (1997), p371.
[9] Becher P, Emulsions: Theory and Practice, 2nd edition, Reinhold, New York (1966), p2.
[10] Myers D, Surfactant Science and Technology 2nd edition, VCH Publishers, New York
(1992), p212.
[11] Shaw DJ, Introduction to Colloid and Surface Chemistry 3rd edition, Butterworths,
London (1980), p234.
[12] Heimenz PC, Rajagopalan R, Principles of Colloid and Surface Chemistry 3rd edition,
Marcel Decker, New York (1997), p389.
[13] Ruckenstein E, Chi JC, J Chem Soc Faraday Trans, 71, 1690-1707 (1975).
[14] Heimenz PC, Rajagopalan R, Principles of Colloid and Surface Chemistry 3rd edition,
Marcel Decker, New York (1997), p390.
[15] Myers D, Surfactant Science and Technology 2nd edition, VCH Publishers, New York
(1992), p152.
[16] Heimenz PC, Rajagopalan R, Principles of Colloid and Surface Chemistry 3rd edition,
Marcel Decker, New York (1997), p393.
[17] Paul KB, Moulik SP, Current Science, 80 (8), 990-1001 (2001).
[18] Broderick M, Donegan S, Power J, Altria K, J Pharm Biomed Anal, 37, 877-884
(2005).
[19] Marsh A, Clark B, Broderick M, Donegan S, Power J, Altria K., Electrophoresis, 25
(23-24), 3970-3980 (2004).
[20] McEvoy E, Donegan S, Power J, Altria K, Marsh A, Liquid Chromatography:
Microemulsion based HPLC methods. Encyclopaedia of Separation Science – online
update. Elsevier (2007).
[21] Hernandez-Torres M, Landy J, Dorsey J, Anal Chem, 62, 744-747 (1986).
[22] Marsh A, Clark B, Altria K, Chromatographia, 59, 531-542 (2004).
[23] Myers D, Surfactant Science and Technology, VCH Publishers, New York (1992),
p153.
[24] Berthod A, Decarvalho M, Anal Chem, 64(19), 2267-2272 (1992).
[25] Berthod A, Laserna JJ, Carretero I, J Liq Chromatogr, 15(17), 3115-3127 (1992).
[26] Berthod A, Nicholas O, Porthault M, Anal Chem, 62, 1402-1407 (1990).
[27] Altria KD, Broderick M, Donegan S, Power J, Chromatographia, 62, 341-348 (2005).
[28] Broderick M, Donegan S, Power J, Altria K, J Pharm Biomed Anal, 37, 877-884
(2005).
[29] Khaledi M., J Chromatogr A, 780 (1-2), 3-40 (1997).
[30] Berthod A., J Chromatogr A, 780 (1-2), 191-206 (1997).
[31] Berthod A, Laserna JJ, Carretero I, J Liq Chromatogr, 15(17), 3115-3127 (1992).
35
[32] El-Sherbiny Mohamad DT, El-Ashry SM et al, J Sep Sci, 26(6-7), 503-509 (2003).
[33] Malenovic A, Ivanovic D, Medenica M et al, J Sep Sci, 27(13), 1087-1092 (2004).
[34] El-Sherbiny DT, El-Eanay N., Belal FF, Hansen SH. J Pharm Biomed Anal, 43, 1236-
1242 (2007).
[35] El-Sherbiny DT, Eid MI, El-Wasseef DR et al, J Sep Sci, 28, 197-202 (2005).
[36] Walash MI, Belal F, El-Enany N, Abdelal A, J Liq Chromatogr & Rel Tech, 30, 1015-
1034 (2007).
[37] Malenovic A, Medecina M, Ivanovic D, Jancic B, Chromatographia, 63, S95-S100
(2006).
[38] Lavine BK, Hendayana S, Tetreault J, Anal Chem, 66(20), 3458-3465 (1994).
[39] Jancic B, Medenica M, Ivanovic D et al, Anal Bio Anal Chem, 383, 687-694 (2005).
[40] Hantzschel D, Endars S, Kahl H et al, Phys Chem Chem Phys, 1(24), 5703-5710 (1999).
[41] Jancic B, Medenica M, Ivanovic D et al, J Chromatogr A, 1088, 187-192 (2005).
[42] Lawrence D, Rees G, Adv Drug Deliv Rev, 45, 89-93 (2000).
[43] Marsh A, Clark BJ, Altria, KD, Chromatographia, 61(11-12), 539-547 (2005).
[44] McEvoy E, Donegan S, Power J, Altria K, J Pharm Biomed Anal, 44, 137-143 (2007).
[45] Altria KD, Marsh A, Clark BJ, Chromatographia 63(7-8), 309-314 (2006).
[46] Dorsey JG, De Etchegaray MT, Landy JS, Anal Chem 55, 924-929 (1983).
[47] Cartas ST, Alvarezoque MCG, Camanas RMV, Analytica Chimica Acta 302(2-3), 163-
172 (1995)
[48] Bryant SM, Altria KD, J Sep Sci 27(17-18), 1498-1502 (2004).
[49] Liu J, Sun J, Wang Y, Liu X et al, J Chromatogr A 1164, 129-138 (2007).
[50] Malenovic A, Darko I, Medecina M, Jancic B, Markovic S, J Chromatogr A, 1131, 67-
73 (2006).
36
Chapter Two
Capillary Electrophoresis and Microemulsion
Electrokinetic Chromatography for
Pharmaceutical Analysis
37
2.1 Introduction
The use of capillary electrophoresis (CE) as an analytical technique has become more
widespread and popular in recent years and has established itself as a method of choice
for many applications. The ability to analyse small ions and organic molecules has
made it popular in many industries such as the food and beverage, biotechnology and
pharmaceutical industries, many of which have incorporated CE into their research as
well as QA and QC departments.
Pharmaceutical analysis is dominated by high performance liquid chromatography
(HPLC) with thin layer chromatography (TLC) and gas chromatography (GC) used to a
lesser extent. CE however is becoming more widely used and is recognised by several
regulatory authorities as a reliable routine analytical technique. Although CE was
initially heralded for its high speed and low sample volume, resolving power and
versatility, the technique is also valuable because it is quantitative, can be automated
and can separate compounds that have traditionally been difficult to handle by HPLC.
Qualitative analysis is also possible by CE-MS.
The small sample volumes required by CE can be an advantage over HPLC if sample
supply is limited, for example in drug discovery. However with short path lengths using
UV detection methods, the technique can suffer from low sensitivity. A number of
solutions to this problem have been introduced including ‘The Bubble Cell’ by Agilent,
which increases the path length at the point of detection. A ‘High Sensitivity Detection
Cell’ also by Agilent improves detection sensitivity over normal capillaries. Other
detection methods such as Laser Induced Fluorescence Detection (LIFD) and CE-MS
also give better sensitivity and have led to CE being on a par with HPLC for many
pharmaceutical applications.
The advantages of CE for pharmaceutical analysis include its speed and cost of analysis,
reductions in solvent consumption and disposal and the possibility of rapid method
development. CE also offers the possibility of using a single set of operating conditions
for a wide range of separations, which can improve laboratory efficiency. CE
instruments can be coupled to a variety of detector types including mass spectrometers,
indirect UV detectors, laser induced fluorescence detectors and low wavelength UV
detectors.
38
Separation efficiencies achieved by CE can be an order of magnitude better than
comparable HPLC methods, this highlights the potential resolving power of CE for
complex and difficult separations, which is a valuable advantage in pharmaceutical
analysis. The use of an open tubular capillary improves resolution relative to that of
packed HPLC columns by eliminating the multiple path term (A) in the van Deemter
equation below. CE reduces plate height further by also eliminating the mass transfer
term (Cux) that comes from the finite time needed for solutes to equilibrate between the
mobile and stationary phases in LC. This stationary phase is absent in CE [1] with the
exception of MEKC and MEEKC modes where a ‘pseudo-stationary phase’ forms part
of the separation mechanism, these CE modes will be discussed later in this chapter.
van Deemter equation for plate height H = A + B/ux + Cux
A is the multiple path term which is zero for CE capillaries.
B/ux is the longitudinal diffusion term and is the only contributor to band broadening in
CE.
C/ux is the equilibration time (mass transfer) term, also zero for CE.
High-speed separations are possible with CE, sometimes as quick as a matter of seconds
when using microchip CE. Because of this it is an ideal technique for ‘high throughput’
analyses such as forensic testing, DNA sequencing and in particular screening of
candidate drug compounds. Multiplexed CE instruments can be used to perform
multiple parallel separations, dramatically increasing sample throughput. For example,
the ‘CombiSep cePRO 9600™’, utilises multiple capillaries and can perform 96
separations in parallel.
This chapter will look at the use of CE for pharmaceutical analysis and will include
descriptions of the various modes of CE with particular attention being given to
microemulsion electrokinetic chromatography.
2.2 Background In the 1930’s Tiselius developed the first electrophoretic apparatus to perform
separations based upon differential migration rates in an electrical field. Up until the
39
early 1980’s most of the research carried out using this technique was by biochemists
and molecular biologists for the separation, isolation and analysis of proteins and other
biological macromolecules. Since its introduction in the 1980’s [2-5] and with the
appearance of commercial instruments for performing analytical electrophoresis on a
microscale in capillary columns, CE has become established as a fast, reliable and
highly efficient alternative and complementary method to LC. While CE can perform
separations which may be difficult by traditional LC methods and provides different
migration patterns, the combined use of these two techniques can be a powerful
analytical tool for the pharmaceutical analyst. Since the early 1990’s, there have been
many review papers [6-12] and books [13, 14] published concerning CE for
pharmaceutical analysis. Since the first applications of CE to pharmaceutical analysis by
Altria and Simpson [15] in 1987, the number of reports of CE for a range of
pharmaceutical applications now numbers in the hundreds and the number of
pharmaceutical compounds analysed by CE is far greater [13]. There have also been a
number of specialised reviews of CE for pharmaceutical analysis including chiral CE
[16-20], CE with electrochemical [21], conductivity [22] and laser induced fluorescence
detection (LIFD) [23], CE coupled with electrospray-ionisation mass spectrometry (CE-
ESI-MS) [25] and CE determination of acid dissociation constants [25].
2.3 Modes of CE for Pharmaceutical Analysis
There are several electrophoretic modes which can and have been used for
pharmaceutical analysis. Each mode offers different possibilities and the choice of mode
will be determined by a number of factors including; analyte solubility in
aqueous/organic electrolytes, analyte charge, analyte physicochemical data, properties
of the sample matrix etc. This section will provide a brief overview of the modes of CE
for pharmaceutical analysis reported in the literature to date.
2.3.1 Free Solution Capillary Electrophoresis (FSCE)
Free solution capillary electrophoresis (FSCE) or capillary zone electrophoresis (CZE)
as it is sometimes called, is the simplest and one of the most widely used forms of CE
and involves the use of buffered aqueous solutions as the carrier electrolytes. FSCE is
principally used to separate charged, water-soluble analytes and separations rely
principally on the pH-controlled dissociation of acidic groups or the protonation of
basic groups on the solute. These ionic species are separated based on differences in
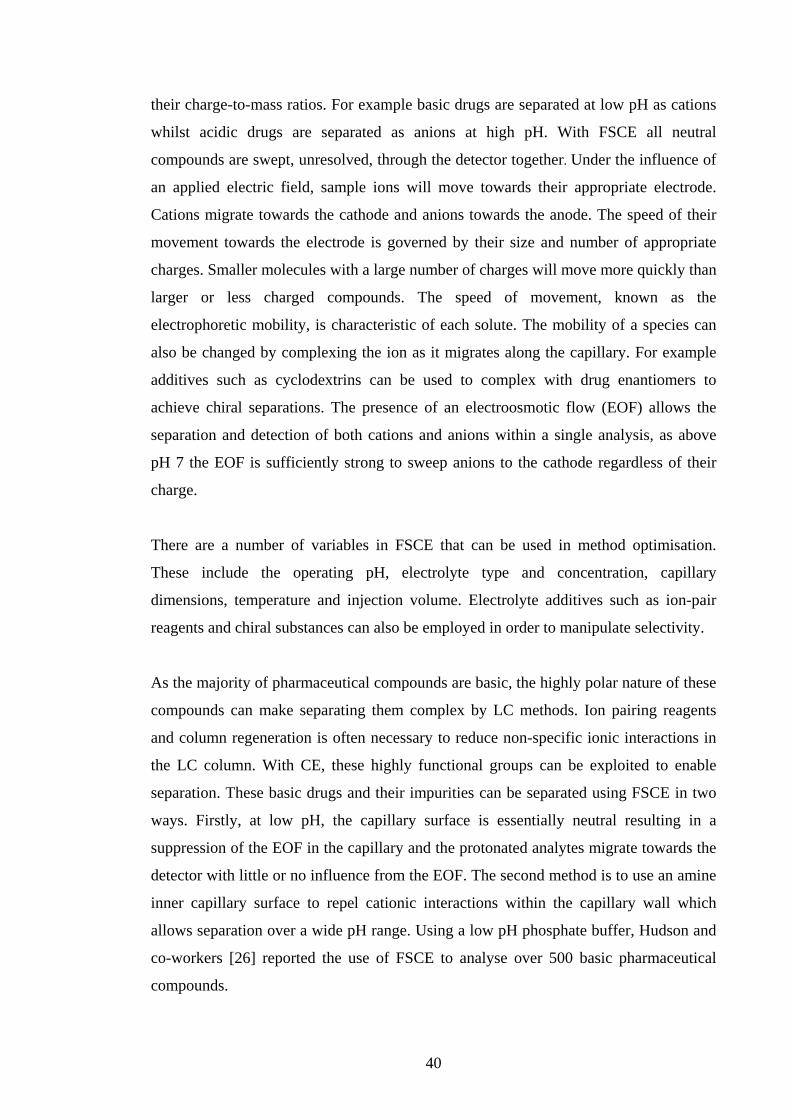
40
their charge-to-mass ratios. For example basic drugs are separated at low pH as cations
whilst acidic drugs are separated as anions at high pH. With FSCE all neutral
compounds are swept, unresolved, through the detector together. Under the influence of
an applied electric field, sample ions will move towards their appropriate electrode.
Cations migrate towards the cathode and anions towards the anode. The speed of their
movement towards the electrode is governed by their size and number of appropriate
charges. Smaller molecules with a large number of charges will move more quickly than
larger or less charged compounds. The speed of movement, known as the
electrophoretic mobility, is characteristic of each solute. The mobility of a species can
also be changed by complexing the ion as it migrates along the capillary. For example
additives such as cyclodextrins can be used to complex with drug enantiomers to
achieve chiral separations. The presence of an electroosmotic flow (EOF) allows the
separation and detection of both cations and anions within a single analysis, as above
pH 7 the EOF is sufficiently strong to sweep anions to the cathode regardless of their
charge.
There are a number of variables in FSCE that can be used in method optimisation.
These include the operating pH, electrolyte type and concentration, capillary
dimensions, temperature and injection volume. Electrolyte additives such as ion-pair
reagents and chiral substances can also be employed in order to manipulate selectivity.
As the majority of pharmaceutical compounds are basic, the highly polar nature of these
compounds can make separating them complex by LC methods. Ion pairing reagents
and column regeneration is often necessary to reduce non-specific ionic interactions in
the LC column. With CE, these highly functional groups can be exploited to enable
separation. These basic drugs and their impurities can be separated using FSCE in two
ways. Firstly, at low pH, the capillary surface is essentially neutral resulting in a
suppression of the EOF in the capillary and the protonated analytes migrate towards the
detector with little or no influence from the EOF. The second method is to use an amine
inner capillary surface to repel cationic interactions within the capillary wall which
allows separation over a wide pH range. Using a low pH phosphate buffer, Hudson and
co-workers [26] reported the use of FSCE to analyse over 500 basic pharmaceutical
compounds.
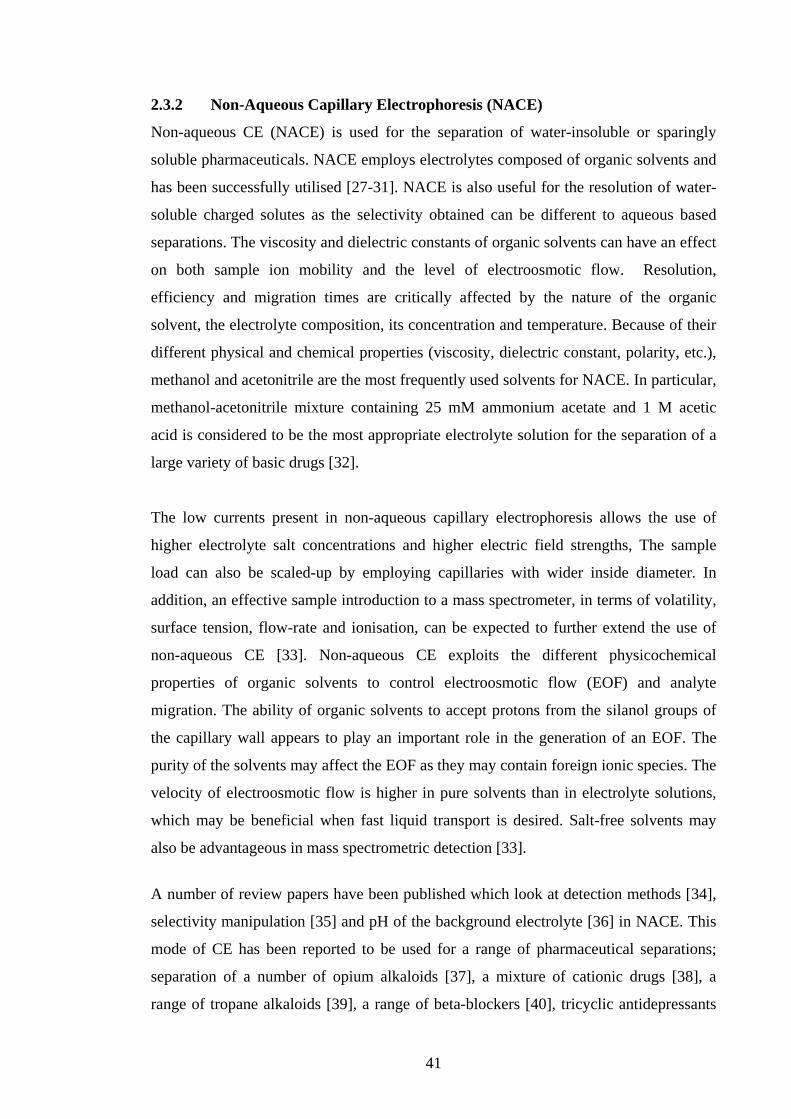
41
2.3.2 Non-Aqueous Capillary Electrophoresis (NACE)
Non-aqueous CE (NACE) is used for the separation of water-insoluble or sparingly
soluble pharmaceuticals. NACE employs electrolytes composed of organic solvents and
has been successfully utilised [27-31]. NACE is also useful for the resolution of water-
soluble charged solutes as the selectivity obtained can be different to aqueous based
separations. The viscosity and dielectric constants of organic solvents can have an effect
on both sample ion mobility and the level of electroosmotic flow. Resolution,
efficiency and migration times are critically affected by the nature of the organic
solvent, the electrolyte composition, its concentration and temperature. Because of their
different physical and chemical properties (viscosity, dielectric constant, polarity, etc.),
methanol and acetonitrile are the most frequently used solvents for NACE. In particular,
methanol-acetonitrile mixture containing 25 mM ammonium acetate and 1 M acetic
acid is considered to be the most appropriate electrolyte solution for the separation of a
large variety of basic drugs [32].
The low currents present in non-aqueous capillary electrophoresis allows the use of
higher electrolyte salt concentrations and higher electric field strengths, The sample
load can also be scaled-up by employing capillaries with wider inside diameter. In
addition, an effective sample introduction to a mass spectrometer, in terms of volatility,
surface tension, flow-rate and ionisation, can be expected to further extend the use of
non-aqueous CE [33]. Non-aqueous CE exploits the different physicochemical
properties of organic solvents to control electroosmotic flow (EOF) and analyte
migration. The ability of organic solvents to accept protons from the silanol groups of
the capillary wall appears to play an important role in the generation of an EOF. The
purity of the solvents may affect the EOF as they may contain foreign ionic species. The
velocity of electroosmotic flow is higher in pure solvents than in electrolyte solutions,
which may be beneficial when fast liquid transport is desired. Salt-free solvents may
also be advantageous in mass spectrometric detection [33].
A number of review papers have been published which look at detection methods [34],
selectivity manipulation [35] and pH of the background electrolyte [36] in NACE. This
mode of CE has been reported to be used for a range of pharmaceutical separations;
separation of a number of opium alkaloids [37], a mixture of cationic drugs [38], a
range of tropane alkaloids [39], a range of beta-blockers [40], tricyclic antidepressants
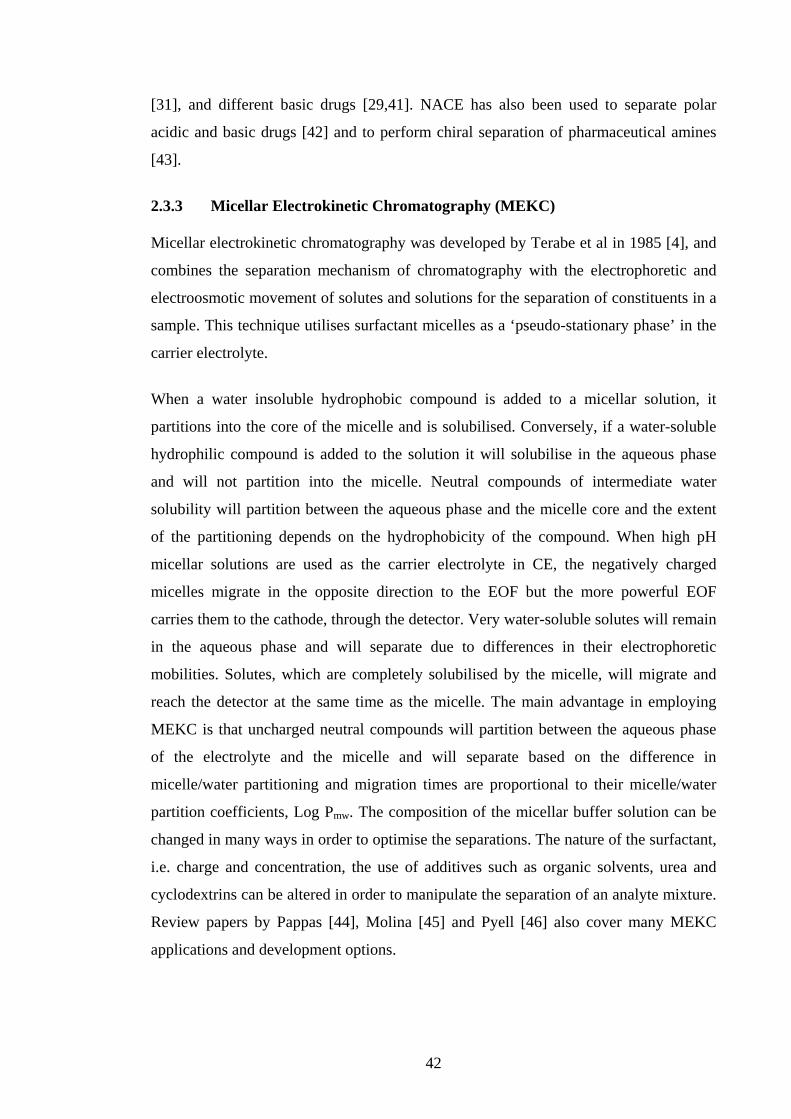
42
[31], and different basic drugs [29,41]. NACE has also been used to separate polar
acidic and basic drugs [42] and to perform chiral separation of pharmaceutical amines
[43].
2.3.3 Micellar Electrokinetic Chromatography (MEKC)
Micellar electrokinetic chromatography was developed by Terabe et al in 1985 [4], and
combines the separation mechanism of chromatography with the electrophoretic and
electroosmotic movement of solutes and solutions for the separation of constituents in a
sample. This technique utilises surfactant micelles as a ‘pseudo-stationary phase’ in the
carrier electrolyte.
When a water insoluble hydrophobic compound is added to a micellar solution, it
partitions into the core of the micelle and is solubilised. Conversely, if a water-soluble
hydrophilic compound is added to the solution it will solubilise in the aqueous phase
and will not partition into the micelle. Neutral compounds of intermediate water
solubility will partition between the aqueous phase and the micelle core and the extent
of the partitioning depends on the hydrophobicity of the compound. When high pH
micellar solutions are used as the carrier electrolyte in CE, the negatively charged
micelles migrate in the opposite direction to the EOF but the more powerful EOF
carries them to the cathode, through the detector. Very water-soluble solutes will remain
in the aqueous phase and will separate due to differences in their electrophoretic
mobilities. Solutes, which are completely solubilised by the micelle, will migrate and
reach the detector at the same time as the micelle. The main advantage in employing
MEKC is that uncharged neutral compounds will partition between the aqueous phase
of the electrolyte and the micelle and will separate based on the difference in
micelle/water partitioning and migration times are proportional to their micelle/water
partition coefficients, Log Pmw. The composition of the micellar buffer solution can be
changed in many ways in order to optimise the separations. The nature of the surfactant,
i.e. charge and concentration, the use of additives such as organic solvents, urea and
cyclodextrins can be altered in order to manipulate the separation of an analyte mixture.
Review papers by Pappas [44], Molina [45] and Pyell [46] also cover many MEKC
applications and development options.
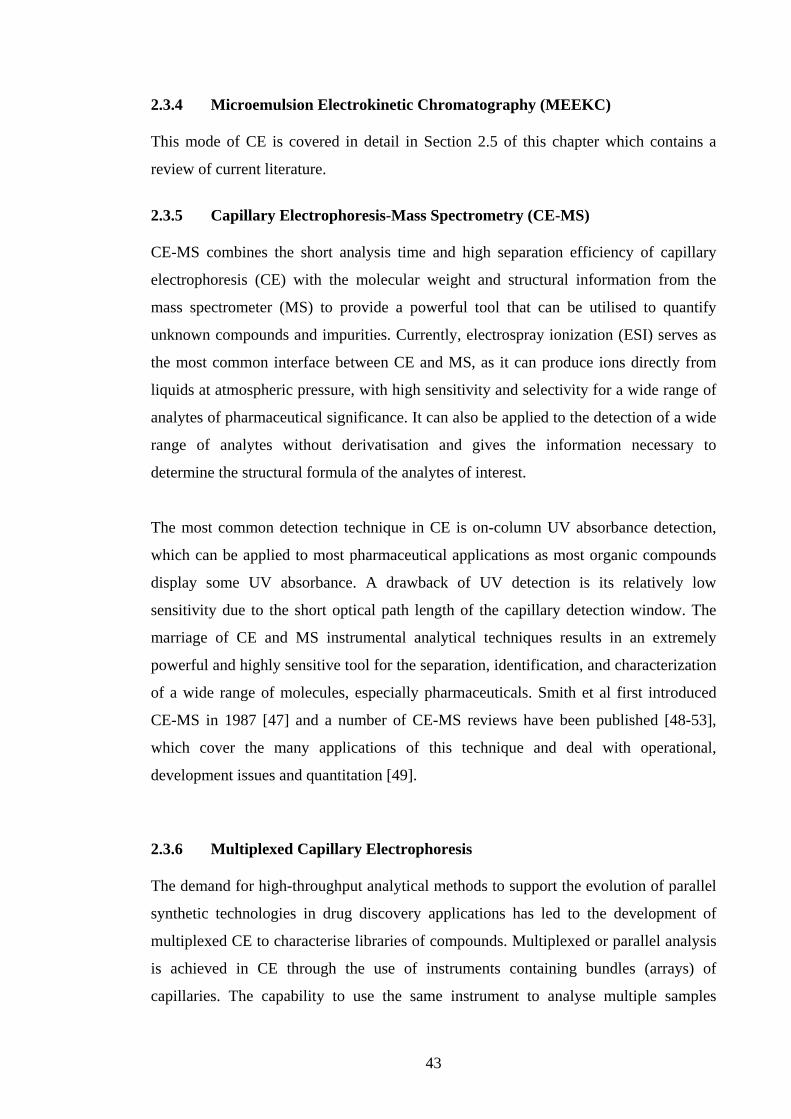
43
2.3.4 Microemulsion Electrokinetic Chromatography (MEEKC)
This mode of CE is covered in detail in Section 2.5 of this chapter which contains a
review of current literature.
2.3.5 Capillary Electrophoresis-Mass Spectrometry (CE-MS)
CE-MS combines the short analysis time and high separation efficiency of capillary
electrophoresis (CE) with the molecular weight and structural information from the
mass spectrometer (MS) to provide a powerful tool that can be utilised to quantify
unknown compounds and impurities. Currently, electrospray ionization (ESI) serves as
the most common interface between CE and MS, as it can produce ions directly from
liquids at atmospheric pressure, with high sensitivity and selectivity for a wide range of
analytes of pharmaceutical significance. It can also be applied to the detection of a wide
range of analytes without derivatisation and gives the information necessary to
determine the structural formula of the analytes of interest.
The most common detection technique in CE is on-column UV absorbance detection,
which can be applied to most pharmaceutical applications as most organic compounds
display some UV absorbance. A drawback of UV detection is its relatively low
sensitivity due to the short optical path length of the capillary detection window. The
marriage of CE and MS instrumental analytical techniques results in an extremely
powerful and highly sensitive tool for the separation, identification, and characterization
of a wide range of molecules, especially pharmaceuticals. Smith et al first introduced
CE-MS in 1987 [47] and a number of CE-MS reviews have been published [48-53],
which cover the many applications of this technique and deal with operational,
development issues and quantitation [49].
2.3.6 Multiplexed Capillary Electrophoresis
The demand for high-throughput analytical methods to support the evolution of parallel
synthetic technologies in drug discovery applications has led to the development of
multiplexed CE to characterise libraries of compounds. Multiplexed or parallel analysis
is achieved in CE through the use of instruments containing bundles (arrays) of
capillaries. The capability to use the same instrument to analyse multiple samples

44
simultaneously, and the diverse separation conditions that are possible, allows rapid
turnaround times. In the past ten years multiplexed CE instruments have become
commercially available with a number of companies such as CombiSep, Beckman
Coulter and Genteon offering capillary array systems with up to 384 capillaries coupled
to LIF and UV detectors. Applications of multiplexed CE in pharmaceutical analysis
include physicochemical profiling [54-56], chiral analysis [57, 58] and organic reaction
monitoring [59]. In a recent paper, Marsh and Altria [60] reported the use of
multiplexed CE for measurement of log P and pKa values, tablet assay and impurity
determination. While still in its infancy, the use of multiplexed CE for pharmaceutical
applications shows clear advantages over other screening techniques. The ability to
analyse multiple samples or vary experimental conditions in parallel offers a unique and
powerful tool for drug discovery. The multiplexed CE format provides the flexibility to
simultaneously vary separation conditions to speed up method development processes.
As this CE approach is relatively new there are few sources of literature dedicated to the
topic. The papers previously mentioned [54-60] cover the use of multiplexed CE for
various pharmaceutical applications and give brief discussions of method development
and instrumentation. A review paper by Pang et al [61] gives more detailed information
about the instrumentation and a wider range of applications.
2.3.7 Microchip Capillary Electrophoresis
Capillary electrophoresis on a chip was first developed in the early 1990’s by Harrison
[62] and Manz [63] who presented the first CE experiments on a chip like structure.
Since the first microchip CE experiments were performed there have been numerous
reports of this technique for a range of applications including DNA sequencing [64],
separation of antimicrobial metabolites [65] and pharmaceuticals [66]. Commercially
available microchip CE systems are supplied by a number of manufacturers such as
Agilent and Shimadzu. The availability of such automated and high throughput systems
can offer advantages over conventional CE systems such as shorter run times and high
throughput for multichannel systems but can suffer from lower peak capacity due to
shorter separation channels.

45
2.4 Pharmaceutical Applications of Capillary Electrophoresis
Since the first application of CE to pharmaceutical analysis in 1988 [15], the number of
reports describing the analysis of numerous different pharmaceutical compounds and
formulations by CE has expanded to be in the hundreds. Lunn [13] has covered in detail
the CE separation methods for over seven hundred pharmaceutical compounds taken
from hundreds of publications.
2.4.1 Chiral Pharmaceutical Analysis
Chiral analysis has become one of the most studied areas of CE, as it is a powerful
analytical tool for separating chiral compounds. The two most important analytical
techniques used in chiral separations are liquid chromatography (LC) and capillary
electrophoresis (CE), followed by gas chromatography (GC) and capillary
electrochromatography (CEC). Compared to other techniques, CE has several
advantages including the high resolving power, low consumption of sample, solvent and
chiral selector. In method development the chiral selector is added to the background
electrolyte instead of using a range of expensive chiral LC columns. Chiral CE provides
high flexibility in choosing and changing types of selectors. The possibility of low
wavelength UV detection for CE also allows the separation and detection of analytes
with poor chromophores, which are difficult to detect by UV/HPLC.
At low pH, basic drugs are positively charged and their migration towards the cathode
can be retarded by a chiraly selective complexing agent, resulting in separation of
enantiomers of differing affinity for the agent. This principle has been demonstrated for
the resolution of chiral basic drugs using cyclodextrins as a chiral selector [67]. At high
pH, chiral acidic drugs are negatively charged and migrate against the EOF towards the
anode. Neutral chiral selector agents are swept along the capillary with the EOF towards
the detector, thus complexation reduces the migration time of the drug and results in
enantioseparation [68].
There are many types of chiral selectors that have been applied to the separation of
enantiomers by CE, but the most common are native and derivatised cyclodextrins
(CDs). Other chiral selectors, which have been applied to CE separations, include
natural and synthetic chiral micelles, crown ethers, chiral ligands, proteins, peptides,
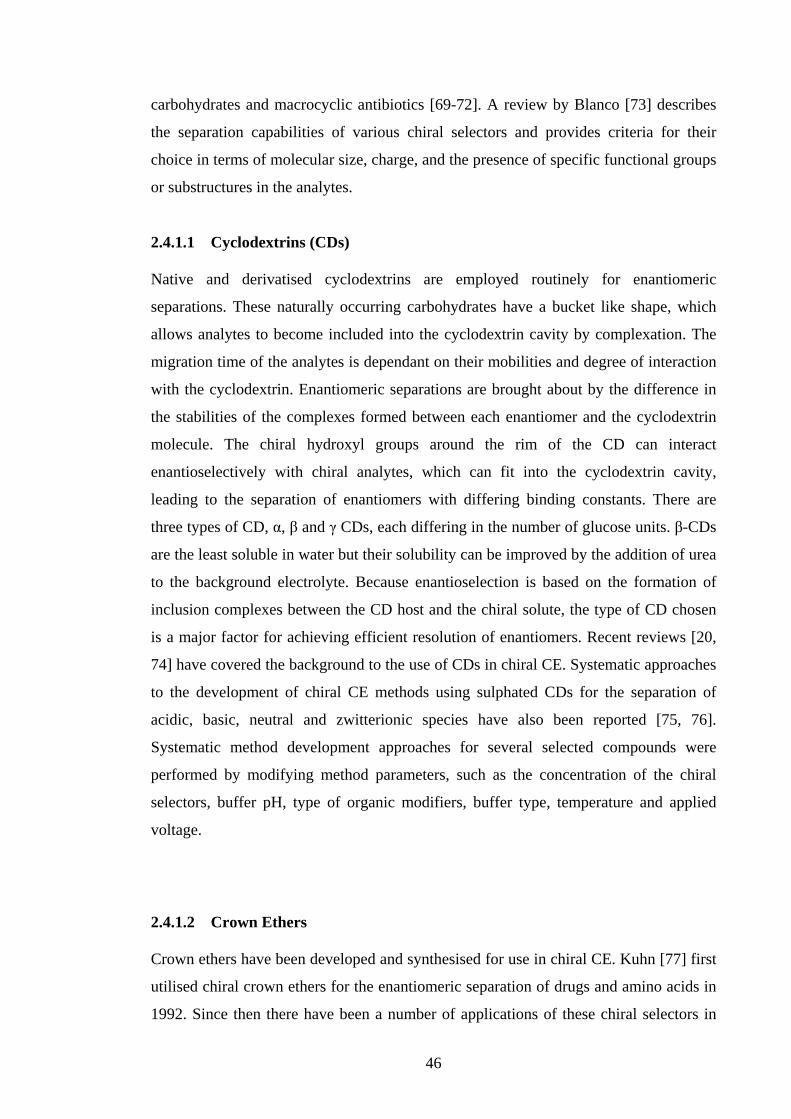
46
carbohydrates and macrocyclic antibiotics [69-72]. A review by Blanco [73] describes
the separation capabilities of various chiral selectors and provides criteria for their
choice in terms of molecular size, charge, and the presence of specific functional groups
or substructures in the analytes.
2.4.1.1 Cyclodextrins (CDs)
Native and derivatised cyclodextrins are employed routinely for enantiomeric
separations. These naturally occurring carbohydrates have a bucket like shape, which
allows analytes to become included into the cyclodextrin cavity by complexation. The
migration time of the analytes is dependant on their mobilities and degree of interaction
with the cyclodextrin. Enantiomeric separations are brought about by the difference in
the stabilities of the complexes formed between each enantiomer and the cyclodextrin
molecule. The chiral hydroxyl groups around the rim of the CD can interact
enantioselectively with chiral analytes, which can fit into the cyclodextrin cavity,
leading to the separation of enantiomers with differing binding constants. There are
three types of CD, α, β and γ CDs, each differing in the number of glucose units. β-CDs
are the least soluble in water but their solubility can be improved by the addition of urea
to the background electrolyte. Because enantioselection is based on the formation of
inclusion complexes between the CD host and the chiral solute, the type of CD chosen
is a major factor for achieving efficient resolution of enantiomers. Recent reviews [20,
74] have covered the background to the use of CDs in chiral CE. Systematic approaches
to the development of chiral CE methods using sulphated CDs for the separation of
acidic, basic, neutral and zwitterionic species have also been reported [75, 76].
Systematic method development approaches for several selected compounds were
performed by modifying method parameters, such as the concentration of the chiral
selectors, buffer pH, type of organic modifiers, buffer type, temperature and applied
voltage.
2.4.1.2 Crown Ethers
Crown ethers have been developed and synthesised for use in chiral CE. Kuhn [77] first
utilised chiral crown ethers for the enantiomeric separation of drugs and amino acids in
1992. Since then there have been a number of applications of these chiral selectors in

47
CE analysis. 18-crown-6 tetracarboxylic acid (18C6H(4)) is to date, the only chiral
crown ether that has been used for chiral CE separations and forms complexes with
chiral analytes in a similar way to CDs, based on differences in complex formation
energies. Two new 18-crown-6 diaza derivatives were investigated as chiral selectors
[78]. These derivatives did not show any chiral selectivity towards the investigated
analytes.
2.4.1.3 Macrocyclic Antibiotics
Although cyclodextrins and their derivatives are present in the majority of chiral CE
applications, the use of macrocyclic antibiotics can be observed with increasing
frequency [79, 80]. The number of macrocyclic antibiotics utilised for chiral CE has
now exceeded 10 and includes four main groups: glycopeptides, polypeptides,
ansamycins and aminoglycosides (although this group is not always considered as
macrocyclic). Thanks to their macrocyclic structure and the diversity in chemical
groups, they exhibit a variety of interactions (inclusion, electrostatic, hydrogen-bond,
hydrophilic-lipophilic, or other van-der-Waals bond type), which enables them to
achieve high chiral resolution with a wider range of analytes (acidic or basic, with large
or small molecular sizes, etc) [81]. Macrocyclic antibiotics are enantioselective for
positively charged solutes using ansamycins and enantioselective for anionic
compounds using the glycopeptides. Within a given class of antibiotics such as the
glycopeptides, enantioselectivity may also be altered by the use of micelles, uncoated
and coated capillaries, or manipulation of operating parameters such as pH or organic
modifiers. In a review paper, Aboul-Enein [82] describe the chemistry of these
antibiotics, the effect of chromatographic conditions on enantioselectivity, the
mechanism of resolution, the applications and limitations of the compounds in liquid
chromatography and CE.
2.4.1.4 Oligo and Polysaccharides
Apart from cyclodextrins, many other linear and cyclic oligo and polysaccharides have
been used as chiral selectors [83] (e.g. monosaccharides as D-glucose, D-mannose, or

48
polysaccharides as dextrins, dextrans, and many others). Park et al [84] used highly
sulfated cyclosophoraoses, the sulfated derivatives of chiral unbranched cyclic β-
(1 → 2)-D-glucans, and successfully used them to separate five basic chiral drugs. These
derivatives exhibited higher resolution than the original cyclosophoraoses. Another new
charged polysaccharide, N-(3-sulfo, 3-carboxy)-propionylchitosan, was studied by
Budanova et al. [85]. This appeared to have a different chiral recognition mechanism
from the charged polysaccharides. The use of polysaccharides combined with
cyclodextrins has also been reported [86].
2.4.1.5 Proteins
A protein or glycoprotein consists of amino acids or amino acids and sugars, both of
which are chiral. Therefore proteins have the possibility to discriminate between the
enantiomers of a chiral molecule. CE methods using proteins as the immobilized ligands
or running buffer additives are attractive for the separation of enantiomeric mixtures.
Although separation efficiencies by CE are generally somewhat higher than those
obtained with HPLC, chiral CE methods based on proteins have a disadvantage of low
efficiencies in addition to low loadability. Proteins such as bovine serum albumin
(BSA) and human serum albumin (HSA) and several additional proteins have been used
as chiral selectors in CE. Reviews by Haginaka [70] and Millet [87], provide a more in
depth coverage of chiral CE separations using proteins as chiral selectors. Although
proteins display very good chiral discrimination for pharmaceutical enantiomers, their
high background UV absorbance limits their usefulness in chiral CE.
2.4.1.6 Chiral MEKC
Enantiomeric separation by MEKC involves the addition of a chiral surfactant or a
chiral selective agent to the background electrolyte. A number of selectors have been
used in chiral MEKC including crown ethers and CD’s. These selectors are usually used
in combination with chiral or achiral micelles, for example cyclodextrin modified
MEKC (CD-MEKC) [88]. Chiral surfactants used for chiral MEKC separations include
natural surfactants (bile salts, amino acids and glucose), monomeric synthetic

49
surfactants and polymeric surfactants [89-91]. Chiral separation in MEKC is affected by
the affinity of the enantiomers towards the micelles and the concentration of the
micellar phase, which depends on the aggregation properties of the chiral surfactants or
chirally modified surfactants. Dobashi et al [89] first reported the use of chiral mixed
micelles to obtain optical separation of enantiomers in 1989 and since then, there have
been many reports on enantiomer separations by MEKC. Otsuka [92] has reviewed the
use of natural and synthetic chiral surfactants in MEKC. In a review by Ha et al [16],
recent applications and aspects of chiral MEKC are considered in more detail.
2.4.1.7 Chiral MEEKC
Chiral separation by MEEKC was first demonstrated in 1993 [93] using (2R,3R)-di-n-
butyl tartrate as a water immiscible chiral selector in the microemulsion electrolyte
which successfully separated ephedrine enantiomers. Chiral MEEKC offers increased
method development flexibility, the ability to custom tune chiral resolution through the
increased method development options and unique solubility capabilities for both
analytes and additives when compared to other CE techniques. Chiral MEEKC offers
the possibility to simultaneously determine drug enantiomers of more than one
compound along with chemical impurities/additives. Importantly, the greatest advantage
of this technique is the ability to separate more hydrophobic racemic components for
which CE is not currently a preferred methodology. Only in recent years has more
research into this area of chiral separations been carried out by Pascoe and Foley [94],
Mertzman and Foley [95, 96] and Zheng et al [97]. Chiral separations in MEEKC can
be achieved by utilising a number of chiral agents such as a chiral surfactant
dodecoxycarbonylvaline (DDCV) [94], chiral alcohols as co-surfactants [97], a
combination of both of these chiral components [98] and the use of cyclodextrins in CD
modified MEEKC as the only chiral agent and in combination with both SDS and
DDCV as surfactants [90]. Section 2.5.9.2 provides a more comprehensive review of
chiral MEEKC.
2.4.2 Pharmaceutical Assay
In the pharmaceutical industry, HPLC has dominated most analytical assays and it is
well established as the method of choice in most laboratories. In addition,

50
pharmacopoeia monographs specify HPLC and titrimetric methods for the majority of
assays. To date, CE is not used extensively in quality control work despite displaying
excellent efficiencies, resolution, asymmetry factors and signal to noise ratio. This is
mainly due to the fact that CE can suffer from insufficient sensitivity and repeatability
to control impurities in pharmaceutical substances at the levels required. These issues
have been addressed somewhat with sensitivity improvements being reported through
the use of alternative detection techniques such as MS and LIFD and the use of high
sensitivity detection cells for UV detection. When conducting CE analyses, the
electrophoretic conditions inside the capillary can sometimes vary slightly between
injections, which can lead to greater variability in peak migration times. Poor injection
precision due to the very small volumes injected can also cause variations in peak areas.
A number of approaches can be made to overcome these problems. Migration times and
peak areas can be calculated relative to an internal standard, which leads to
improvements in repeatability [99]. Greater migration time reproducibility can also be
achieved by applying the separation voltage across the capillary for a very short time
prior to injection and separation [100]. The factors affecting CE reproducibility and
efforts to address the problem have been covered in more detail by Shihabi [101],
Schaeper [102] and Mayer [103]. Many factors are involved in reproducibility. Some of
these, such as temperature control, voltage control, and sample injection precision, are
inherent in the design of the instrument. Other factors, such as the quality of the
reagents used and the manner in which the instrument is programmed and operated, are
completely in the hands of the user. Control of these two factors are required in order to
achieve reproducible results. A commercially available capillary treatment system of
proprietary buffers and rinse solutions has been shown to improve CE repeatability as
the capillary is coated with a bilayer of surfactants ensuring that the surface coverage
and the EOF is consistent between injections and between capillaries [104]. Figure 2.1
highlights the consistency of the EOF when using the buffer coating system compared
to a standard phosphate buffer when using a capillary composed of 19 different
channels. In Figure 2.1(a), the peaks in the channels have different speeds and the
separation is poor while Figure 2.1(b) shows a single peak due to a consistent EOF in
each channel, which makes the peaks move at the same speed.
Regulatory authorities are beginning to recognize CE with general monographs
appearing in the BP, EP and Japanese Pharmacopoeia using CE for identification tests.
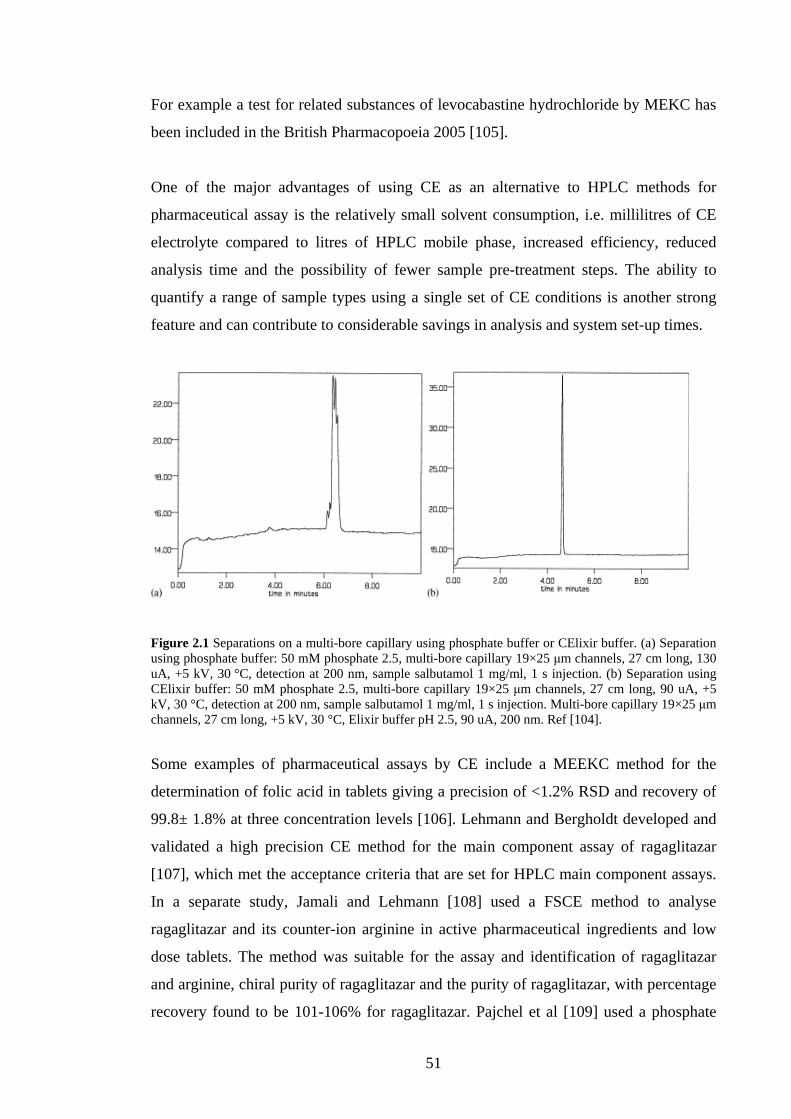
51
For example a test for related substances of levocabastine hydrochloride by MEKC has
been included in the British Pharmacopoeia 2005 [105].
One of the major advantages of using CE as an alternative to HPLC methods for
pharmaceutical assay is the relatively small solvent consumption, i.e. millilitres of CE
electrolyte compared to litres of HPLC mobile phase, increased efficiency, reduced
analysis time and the possibility of fewer sample pre-treatment steps. The ability to
quantify a range of sample types using a single set of CE conditions is another strong
feature and can contribute to considerable savings in analysis and system set-up times.
Figure 2.1 Separations on a multi-bore capillary using phosphate buffer or CElixir buffer. (a) Separation using phosphate buffer: 50 mM phosphate 2.5, multi-bore capillary 19×25 μm channels, 27 cm long, 130 uA, +5 kV, 30 °C, detection at 200 nm, sample salbutamol 1 mg/ml, 1 s injection. (b) Separation using CElixir buffer: 50 mM phosphate 2.5, multi-bore capillary 19×25 μm channels, 27 cm long, 90 uA, +5 kV, 30 °C, detection at 200 nm, sample salbutamol 1 mg/ml, 1 s injection. Multi-bore capillary 19×25 μm channels, 27 cm long, +5 kV, 30 °C, Elixir buffer pH 2.5, 90 uA, 200 nm. Ref [104].
Some examples of pharmaceutical assays by CE include a MEEKC method for the
determination of folic acid in tablets giving a precision of <1.2% RSD and recovery of
99.8± 1.8% at three concentration levels [106]. Lehmann and Bergholdt developed and
validated a high precision CE method for the main component assay of ragaglitazar
[107], which met the acceptance criteria that are set for HPLC main component assays.
In a separate study, Jamali and Lehmann [108] used a FSCE method to analyse
ragaglitazar and its counter-ion arginine in active pharmaceutical ingredients and low
dose tablets. The method was suitable for the assay and identification of ragaglitazar
and arginine, chiral purity of ragaglitazar and the purity of ragaglitazar, with percentage
recovery found to be 101-106% for ragaglitazar. Pajchel et al [109] used a phosphate

52
buffer supplemented with SDS to develop a selective and precise assay method for
quantitative determination of benzylpenicillin, procaine, benzathine and clemizole. The
separation is shown in Figure 2.2.
Figure 2.2 Electropherogram of benzylpenicillin and procaine, benzathine and clemizole. Buffer phosphate–borate pH 8.7, supplemented with 14.4 g/l SDS. Detection wavelength was 214 nm. Separations were performed in 60 cm (52 cm effective length) ×75 μm i.d. fused-silica capillary coated with polyimide (AccuSep capillaries, Waters) thermo regulated at 25 °C, with voltage of 18 kV applied (current about 140 μA). Hydrodynamic injection by gravity-driven siphoning 10 s. P, procaine; B, benzathine; C, clemizole; BP, benzylpenicillin; MEOH, methanol (EOF marker). Ref [109].
2.4.3 Impurity Profiling of Pharmaceuticals
The presence of unwanted impurities even in small amounts may influence the efficacy
and safety of the pharmaceutical products. Impurity profiling is another important
aspect of pharmaceutical analysis and must meet strict regulatory requirements. The
different pharmacopoeias, such as the British Pharmacopoeia (BP) and the United States
Pharmacopoeia (USP) have tests for related substances incorporated into most
monographs for pharmaceutical compounds and formulations. In addition, The
International Conference on Harmonization (ICH) has published guidelines on
impurities in new drug substances [110]. Impurity profiling is generally carried out by
HPLC and cross-correlated with other chromatographic methods such as TLC or an

53
alternative HPLC method. The overriding requirements in impurity determination
methods are that all likely synthetic and degradative impurities are resolved from the
main compound and these can be quantified at 0.1% and lower levels. This
quantification is possible using commercial CE instrumentation with standard
capillaries. The structural impurities of a drug will often possess similar structural
properties to the main component, which makes achieving resolution of the compounds
challenging. The high separation efficiencies and different separation mechanism of CE
often allows easier resolution of the main component and related substances compared
to using HPLC or TLC. The ability to easily alter separation parameters and the
applicability of one CE method to a range of compounds can make CE a cheaper and
more rapid complementary method to LC methods. Because LC and CE utilize
different separation mechanisms a high degree of confidence can be gained from the
cross-correlation of agreeable results.
2.4.4 Physicochemical Profiling.
During the early and later phases of drug development, knowledge of physiochemical
properties of pharmaceutical compounds is important in order to predict their
bioavailability and blood-brain barrier distribution to help in formulation design, and
drug delivery. Physicochemical properties such as acid dissociation constant (pKa),
octanol-water partition coefficient (log Pow), solubility, permeability and protein binding
are closely related to drug absorption, distribution, metabolism and excretion. About
30% of drug candidate molecules are rejected due to pharmacokinetic-related failures
[111]. Fast and reliable in vitro prediction strategies are needed to filter out problematic
molecules at the earliest stages of discovery. In drug discovery there can be a vast
number of compounds requiring physicochemical screening, consequently there is a
need for rapid and reliable methods of physicochemical profiling to maintain high
throughput and efficiency. CE is a simple, versatile, automated, and powerful separation
technique and widely applied in physicochemical profiling for pharmaceuticals. It has
advantages over traditional potentiometric, spectrophotometric, chromatographic and
other methods, as CE requires very small amounts of sample and can measure
compounds with impurities and low aqueous solubility. Of the physicochemical
properties mentioned previously in this section, only capillary electrophoretic
measurements of pKa and log Pow values will be covered here as they have received the
most attention in physicochemical profiling by CE

54
2.4.4.1 pKa Measurements
The majority of pharmaceutical compounds are either acidic or basic and are therefore
ionisable. Physicochemical properties, such as lipophilicity and solubility, are pKa
dependent, therefore pKa is one of the fundamental properties of a drug molecule. The
pKa determination of acids and bases by CE is based on measuring the electrophoretic
mobility of charged species associated with the acid-base equilibria as a function of pH.
The pKa values of pharmaceutical compounds can be determined from migration time
data obtained by running the compound with free solution CE electrolytes at a range of
pH values. The mobility of the solute at each pH can be calculated from its migration
time and the EOF (measured against a neutral marker such as methanol), and a plot of
mobility vs. pH can be constructed. See Figure 2.3. The pKa value can be calculated
mathematically or obtained from the plot.
Figure 2.3 Dependence of the effective mobilities of a monovalent compound (LY334370) on pH. Arrow
indicates the pH equal to the pKa [112].
The pKa values of water-insoluble and sparingly soluble compounds can be determined
by NACE using methanol as the background electrolyte [41], or a 50% methanol/water
electrolyte as used by de Nogales et al [113] for the measurements of acid dissociation
constants of several hydrophobic drugs. The most common method for pKa
measurements, however is FSCE.
CE compares favourably to other methods of pKa measurements [41] and unlike
titration methods, precise information of sample concentration is not required as only
the analyte mobilities are used to calculate dissociation constants by CE. Sparingly
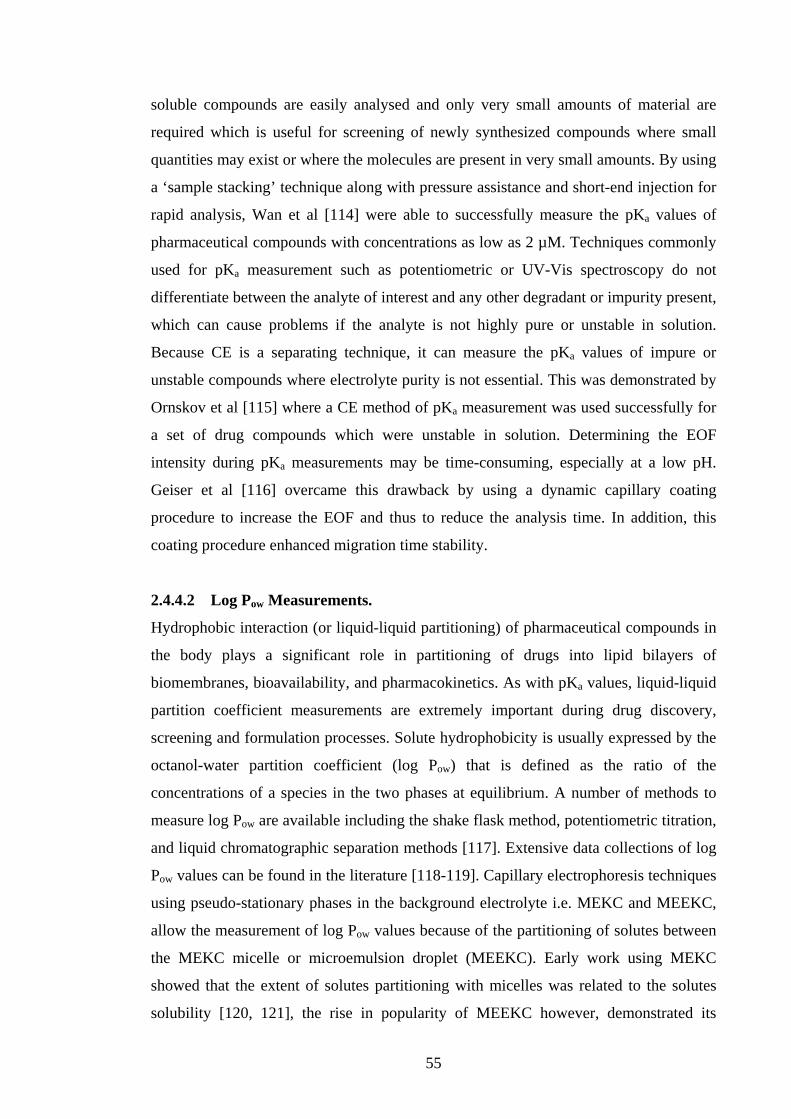
55
soluble compounds are easily analysed and only very small amounts of material are
required which is useful for screening of newly synthesized compounds where small
quantities may exist or where the molecules are present in very small amounts. By using
a ‘sample stacking’ technique along with pressure assistance and short-end injection for
rapid analysis, Wan et al [114] were able to successfully measure the pKa values of
pharmaceutical compounds with concentrations as low as 2 µM. Techniques commonly
used for pKa measurement such as potentiometric or UV-Vis spectroscopy do not
differentiate between the analyte of interest and any other degradant or impurity present,
which can cause problems if the analyte is not highly pure or unstable in solution.
Because CE is a separating technique, it can measure the pKa values of impure or
unstable compounds where electrolyte purity is not essential. This was demonstrated by
Ornskov et al [115] where a CE method of pKa measurement was used successfully for
a set of drug compounds which were unstable in solution. Determining the EOF
intensity during pKa measurements may be time-consuming, especially at a low pH.
Geiser et al [116] overcame this drawback by using a dynamic capillary coating
procedure to increase the EOF and thus to reduce the analysis time. In addition, this
coating procedure enhanced migration time stability.
2.4.4.2 Log Pow Measurements.
Hydrophobic interaction (or liquid-liquid partitioning) of pharmaceutical compounds in
the body plays a significant role in partitioning of drugs into lipid bilayers of
biomembranes, bioavailability, and pharmacokinetics. As with pKa values, liquid-liquid
partition coefficient measurements are extremely important during drug discovery,
screening and formulation processes. Solute hydrophobicity is usually expressed by the
octanol-water partition coefficient (log Pow) that is defined as the ratio of the
concentrations of a species in the two phases at equilibrium. A number of methods to
measure log Pow are available including the shake flask method, potentiometric titration,
and liquid chromatographic separation methods [117]. Extensive data collections of log
Pow values can be found in the literature [118-119]. Capillary electrophoresis techniques
using pseudo-stationary phases in the background electrolyte i.e. MEKC and MEEKC,
allow the measurement of log Pow values because of the partitioning of solutes between
the MEKC micelle or microemulsion droplet (MEEKC). Early work using MEKC
showed that the extent of solutes partitioning with micelles was related to the solutes
solubility [120, 121], the rise in popularity of MEEKC however, demonstrated its
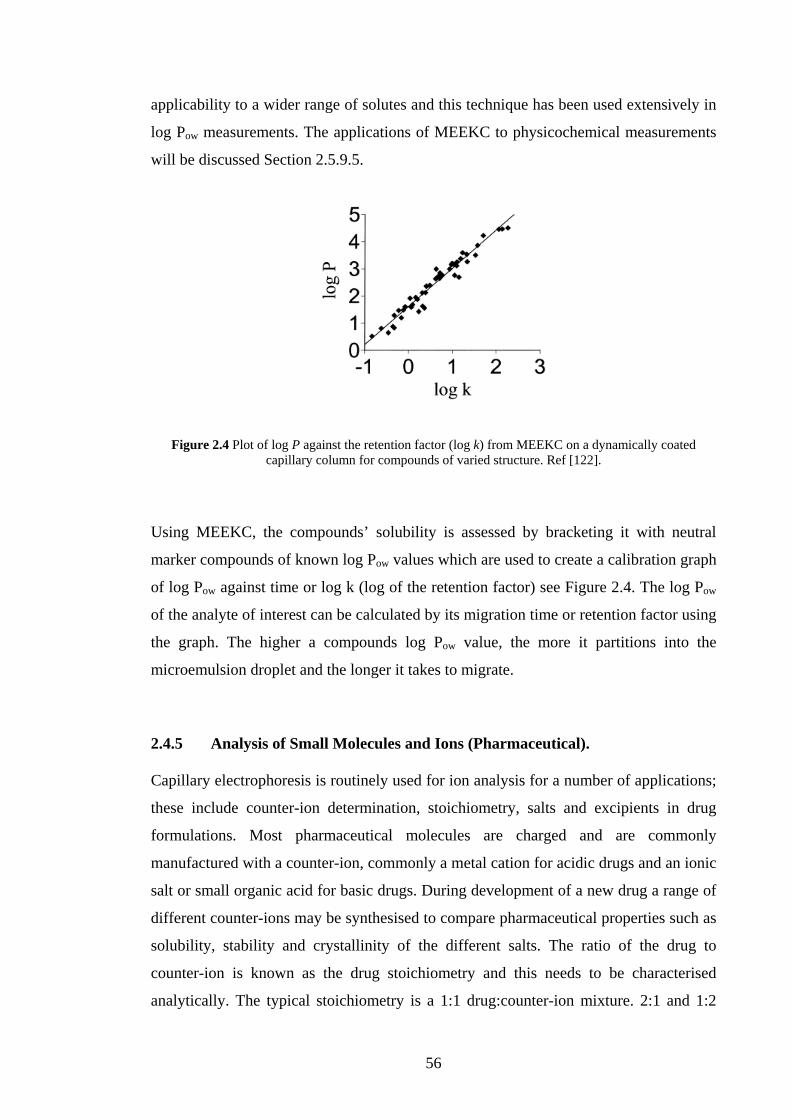
56
applicability to a wider range of solutes and this technique has been used extensively in
log Pow measurements. The applications of MEEKC to physicochemical measurements
will be discussed Section 2.5.9.5.
Figure 2.4 Plot of log P against the retention factor (log k) from MEEKC on a dynamically coated capillary column for compounds of varied structure. Ref [122].
Using MEEKC, the compounds’ solubility is assessed by bracketing it with neutral
marker compounds of known log Pow values which are used to create a calibration graph
of log Pow against time or log k (log of the retention factor) see Figure 2.4. The log Pow
of the analyte of interest can be calculated by its migration time or retention factor using
the graph. The higher a compounds log Pow value, the more it partitions into the
microemulsion droplet and the longer it takes to migrate.
2.4.5 Analysis of Small Molecules and Ions (Pharmaceutical).
Capillary electrophoresis is routinely used for ion analysis for a number of applications;
these include counter-ion determination, stoichiometry, salts and excipients in drug
formulations. Most pharmaceutical molecules are charged and are commonly
manufactured with a counter-ion, commonly a metal cation for acidic drugs and an ionic
salt or small organic acid for basic drugs. During development of a new drug a range of
different counter-ions may be synthesised to compare pharmaceutical properties such as
solubility, stability and crystallinity of the different salts. The ratio of the drug to
counter-ion is known as the drug stoichiometry and this needs to be characterised
analytically. The typical stoichiometry is a 1:1 drug:counter-ion mixture. 2:1 and 1:2

57
compositions are frequently manufactured depending upon the ionic nature of the drug
and/or counter-ion. The counter-ion of basic drugs includes inorganics such as sulphate
and chloride or organic acids such as maleate, fumarate, acetate or succinate. Cations
analysed involve a range of metal ions including Na+, K+, Mg2+, Ca2+ and simple low
molecular weight amines. These analytes possess little or no chromophore, which
generally necessitates use of indirect UV detection. However, some larger anionic
counter-ions such as benzoates and simple organic acids can possess sufficient UV
activity to allow direct UV detection. Alternatively, metal ions may be complexed ‘on
capillary’ to form metal chelates which can then be detected by direct UV measurement.
Alternative methods such as conductivity detection have also been used [123] to detect
potassium counter-ion and other inorganic cationic impurities in pharmaceutical drug
substances. Popular techniques for the analysis of small ions include ion-exchange
chromatography and flame atomic absorption spectrometry but CE is becoming more
popular for such applications due to its simplicity and speed of method development
and analysis, elimination of the need for specialised columns, high resolving power and
simple sample treatment steps (typically, the sample just needs to be diluted in the
background electrolyte and injected onto the capillary).
Figure 2.5 Electropherogram of 20 common amino acids. 50 mM Ethanesulfonic acid, pH 2.8; applied voltage, 30 kV; injection time, 10 s. Ref [126].
Pharmaceutical excipients such as sodium dodecyl sulphate (SDS) or alginic acid can be
analysed as raw materials or when present in formulations [124]. Kelly et al developed a
58
reliable quantitative CE method for the determination of SDS in a cefuroxime axetil
pharmaceutical preparation [125]. Separation of amino acids can be troublesome and
complicated using HPLC methods as they first need to be derivatised to provide a
chromophore for detection. Performing these separations using CE with low pH
electrolytes can be relatively simplistic as lower detection wavelengths of 185 nm can
be used to detect zwitterionic amino acids, which become cations at low pH. A
background electrolyte of 50 mM ethanesulphonic acid pH 2.8 was used to resolve a
number of amino acids, which were detected at 185 nm without any sample pre-
treatment [126], as shown in Figure 2.5. CE can measure the presence of small ion
contaminant impurities in drug substances. For example, a NACE method with indirect
UV detection was used to monitor ammonium ion contaminant in pharmaceutical
preparations with a limit of detection of 50 ppb [127].
2.5 Microemulsion Electrokinetic Chromatography
2.5.1 Introduction Microemulsion Electrokinetic Chromatography (MEEKC) is a mode of capillary
electrophoresis, which utilises microemulsions as separation media. These
microemulsions are usually composed of nanometre-sized droplets of hydrophobic
organic solvents in an aqueous buffer and are referred to as oil-in-water microemulsions.
Although most applications of MEEKC have utilised oil-in-water type microemulsions,
there has been a recent application of water-in-oil MEEKC [128].
Separations in MEEKC are achieved by a combination of chromatographic partitioning of
solutes between the microemulsion droplets and the continuous phase and the
electrophoretic mechanism within the capillary. Hydrophobic solutes will favour
inclusion in the oil droplets while hydrophilic solutes will favour the aqueous phase. The
degree of partitioning of solutes will depend on their hydrophobicity and this facilitates
the separation of neutral as well as charged solutes. Charged solutes migrate through the
capillary under the influence of the applied voltage and separation is dependant on their
charge and size. Migration of charged solutes will also be affected to some degree by
charge repulsion or ion association with the droplet.
59
Generally when performing MEEKC separations, a high electroosmotic flow (EOF) is
generated by the use of high pH buffers. When using SDS, the negatively charged SDS
head groups give the microemulsion droplets a negative charge and these attempt to
migrate towards the anode but the greater force of the EOF sweeps them towards the
cathode end of the capillary through the detector.
Review papers by Hansen [129] and Marsh et al [130] have covered applications of
MEEKC from 1996 to 2004. Another review paper by Huie [131] also covered many new
applications up to 2005 and covered in more detail the history of microemulsion
development, separation properties of microemulsions and comparison to MEKC
separations. MEEKC has become increasingly popular for routine applications and some
recent applications will be described.
2.5.2 Comparison of MEEKC with MEKC and Other Modes of CE. Since its introduction by Terabe [132] in the mid 1980’s MEKC has seen many varied
applications with numerous publications. The mode of separation is similar to that of
MEEKC. In MEKC, surfactant molecules are present in the electrolyte at a concentration
higher than the CMC of the surfactant, micelles form and solutes interact with these to
facilitate separation [133]. MEEKC, however, can be applied to a wider range of solutes
than MEKC as solutes can penetrate the surface of the microemulsion droplet more easily
than the more rigid micelle [134]. MEEKC has often been found to provide superior
separation efficiency to MEKC. This is probably due to the improved mass transfer of
solutes between the microemulsion droplets and the aqueous phase, aided by the co-
surfactant [134]. The separation window in MEEKC is larger and its size can be
controlled [134-136]. This therefore offers greater separation capability than MEKC for
water-insoluble compounds [137]. Studies have been carried out comparing MEEKC to
solvent modified MEKC [138], which used an electrolyte containing the same buffer, co-
surfactant, and amount of SDS as the microemulsion. The results obtained for separation
selectivity and efficiency were very similar. Recent comparisons have shown MEEKC
separations to be superior to MEKC for a number of applications. Hansen et al [139]
compared MEEKC to MEKC for the separation of bromazepam and five of its impurities,
the order of separation obtained was very similar for both methods, however MEEKC

60
provided much faster separations. Gong [140] used MEEKC to separate a mixture of six
biphenyl nitrile compounds and three impurities, obtaining superior results to those
achieved with MEKC.
Chiral analysis of pharmaceutical compounds is one application area of MEEKC that has
recently been studied [95-98, 139-142]. Mertzman and Foley [143] compared MEEKC
and MEKC for the chiral analysis of pharmaceutical compounds and found that MEEKC
gave the shortest elution range and showed better values for enantioselectivity, resolution
and retention factors. At higher concentrations of surfactant (4%
dodecoxycarbonylvaline) MEEKC yielded far superior results. Studies have been
performed to compare MEEKC with other electrophoretic modes [136, 139, 144-148]
such as CZE, MEKC and non-aqueous CE (NACE). When analysing both water-soluble
and fat-soluble vitamins by MEEKC and MEKC, Sanchez [148] showed the advantage of
MEEKC in its ability to analyse both types of vitamins, as MEKC was unable to separate
the fat-soluble types found in a commercial formulation. MEEKC separations of a range
of methylquinolones have been compared to MEKC and NACE [144], while the
separation of nicotine and related impurities [145] was compared using MEEKC, NACE
and FSCE. Figure 2.6 shows the separation of nicotine and related impurities using
MEEKC, which showed better selectivity over the other methods.
Figure 2.6 Separation of nicotine and related impurities by MEEKC. Test mix dissolved in electrolyte; 50 µm ID x 30cm standard fused silica capillary; sample injection 10mbar for 5 s; 10kV separation; 260nm UV detection; 40ºC; electrolyte, 89% 10mM tetraborate at pH 9.5 + 0.8% octane + 3.3% SDS + 6.6% butanol. Ref [145].
61
The separation of bromazepam and its impurities was performed using CZE, MEKC,
MEEKC and NACE [139]. Shorter migration times were achieved with MEEKC but only
NACE achieved full resolution. The analyses were performed at low pH to protonate the
compounds.
Tao et al [149] compared MEEKC to solvent modified MEKC for the separation of 17
species of heroin, amphetamine and basic impurities and found that the lipophillic organic
core of the microemulsion droplet played an important role in improving separation
performance relative to the 1-butanol modified MEKC method. MEEKC and MEKC
were also compared for the separation of bisphenol-A-diglycidyl ether and its derivatives
[150]. MEEKC was found to provide better resolution due to the lower retention factor.
Nozal et al [151] used a hexane-in-water microemulsion without a cosurfactant for the
separation of three different types of antibiotics and found that the stable microemulsion
provided more efficient separations than a MEKC method and the microemulsions were
critical for the separation of tetracyclines. Yang et al [152] examined the separation of
eight benzoylurea insecticide compounds using both MEEKC and MEKC. MEEKC
Separation was achieved by optimising the surfactant, cosurfactant and oil concentrations
while acetonitrile and a high level of γ-CD was necessary for MEKC separation, however
both methods were found to be effective for the application.
2.5.3 Method Development Options and Operating Parameters in MEEKC
The microemulsion buffers used in MEEKC separations are made up of many different
components and with the possibility of using additional reagents, there are many options
to consider when developing separation methods. Variation of any of these components
can affect the separation selectivity and quality, which provides considerable method
development options for more difficult or complex separations. Because of the number of
variables involved, method development and optimisation can sometimes be difficult.
The use of experimental design techniques to speed up method development have
recently been reported. Applying experimental design to MEEKC using a 13 run,
multivariate experimental plan with different microemulsion composition factors has
been used for the first time to optimise the separation of ketorolac and three of its
impurities [153]. Experimental design has been used [154] to ensure a thorough approach
to method development for MEEKC separations, which fully assessed the impact of each

62
of the separation factors. A series of tests were performed on a mixture of anionic,
cationic and neutral drugs where the effect of variation of surfactant, co-surfactant, borate
buffer concentration, Brij 35 and propan-2-ol addition and temperature was studied.
Multiple linear regression models were used to analyse the results, with SDS
concentration and propan-2-ol addition found to have the largest effect on separation
selectivity.
Artificial Neural Networks (ANN’s) have also been used to predict MEEKC migration
times [155]. The ANN was used to build a quantitative structure property relationship
between the molecular structural parameters of 53 benzene derivatives and their observed
MEEKC migration indices. Given the structural parameters of unknown molecules, the
model was found to predict their migration indices with minimum and maximum error of
1.18 and 7.25% respectively.
2.5.3.1 Surfactant Type and Concentration
The type and concentration of microemulsion surfactant significantly affects separations
achieved in MEEKC by altering the droplet size and charge, the level and direction of the
EOF and the degree of ion pairing with the solutes. SDS, which is an anionic surfactant,
is usually employed in MEEKC at a concentration of 3.3% (typically 118 mM).
Increasing the SDS concentration effects solute migration times depending on the
analytes charge and also by reducing the EOF [136, 154, 156-158]. Depending on its
interaction with the surfactant, increasing its concentration can either decrease [159], or
increase analyte migration time [136] which affects peak resolution [159]. Increasing
SDS concentration has also been shown to result in a more stable and reproducible
microemulsion system [160] but at the expense of higher operating currents. Selectivity
can be greatly altered by mixing SDS with another surfactant or by replacing it
completely [161]. The use of anionic bile salts in place of SDS has been shown to offer
different selectivity [162]. The bile salt sodium cholate is reported to offer better
selectivity for lipophilic solutes [159]. Using a different salt of the surfactant, for example
lithium dodecyl sulphate instead of SDS, has been shown to increase the EOF and reduce
operating current so that a higher voltage can be applied and faster separations achieved
without generating excess current [157].

63
Positively charged surfactants are often utilised in MEEKC for the separation of basic
analytes. The use of cationic surfactants has been used to eliminate ion-pair reactions,
which occur between cations and the negatively charged droplets [157, 163]. Use of
cationic surfactants results in a reversal of the EOF and requires the use of negative
polarity voltage. Neutral surfactants have been infrequently used in MEEKC as they
cannot be used to separate neutral solutes. They can however be added to microemulsions
without increasing the overall operating current. They have been used to separate
insoluble sun-tan lotions and to provide optimum conditions for MEEKC dual-opposite
injection separation [164].
Chiral surfactants have been used in MEEKC to improve enantiomeric separations.
DDCV (dodecoxycarbonylvaline) has been used in conjunction with a chiral co-
surfactant, (S)-2-hexanol to achieve chiral separation [98]. DDCV was also utilised in a
study to compare MEEKC, MEKC and solvent-modified MEKC for the chiral analysis of
pharmaceutical compounds [143].
Mixed surfactant systems, which utilise two different types of surfactant to provide
optimum separation selectivity have been reported [165-167]. A mixed surfactant system
with 0.75% w/w Brij 35 and 2.25% w/w SDS has been used to separate UV filters in
sunscreen lotions [167]. Different separation selectivity for a mixture of neutrals was
achieved when using mixed systems of SDS, SDOSS, MAPS, Tween 21 or Brij 35 [166].
A microemulsion containing 100 mM SDS and 80 mM sodium cholate was used to
separate a mixture of six biphenyl nitrile compounds and three related substances with
high hydrophobicity and similar structures [140].
2.5.3.2 Co-Surfactant
The co-surfactants used are usually medium chain alcohols with butan-1-ol being the
most commonly used in MEEKC [157, 137, 161]. Migration times are altered with an
increase in co-surfactant concentration [157] because the solution viscosity and EOF rate
change, the microemulsion droplets increase in size, thus reducing their ability to oppose
the EOF [168]. Increasing the co-surfactant concentration can alter the selectivity of a
mixture if it contains ionic and neutral solutes [157]. For mixtures of similar compounds,
it has been found that selectivity remains the same but retention times are altered when
the co-surfactant concentration is increased [169]. Increasing the concentration of the co-
64
surfactant has been found to improve the separation [159], and also increase migration
times and peak resolution [136, 138, 170]. Although butan-1-ol is the most common co-
surfactant employed for MEEKC separations, a variety of different alcohols have been
employed as the co-surfactant. Each of a homologous series of alcohols from propan-1-ol
to hexan-1-ol had a marked effect on separation selectivity [171]. Pomponio et al [172]
performed MEEKC analysis on six catechins and caffeine found in green tea using nine
different microemulsions comprised of nine different alcohol co-surfactants and found
four different selectivities. Branched chain alcohols such as butan-2-ol do not enable
microemulsion formation, as they cannot bridge the oil-water interface effectively [157].
It has been suggested that because the co-surfactant can partition into the oil droplet, it
can modify the chromatographic properties of the oil phase and therefore have a
pronounced influence on the separation [173].
The main advance in the use of novel co-surfactants over the last number of years is the
use of a novel chiral microemulsion, which involved utilising chiral alcohols as co-
surfactants. This was demonstrated for the enantiomeric separation of a number of
pharmaceutical drugs using MEEKC [97]. A chiral co-surfactant, S-2-hexanol, was used
along with a chiral surfactant to obtain improved chiral separations [98].
2.5.3.3 Oil Phase
The common oils generally used to form microemulsions for MEEKC separations are
hexane, heptane and octane. All three oils have been shown to give similar selectivity and
migration times [166], although octane has been reported to give more repeatable
microemulsions with superior peak resolution, efficiency and precision [148, 160]. Other
oils employed include medium chain alcohols, as they are not miscible with water e.g.
pentan-1-ol, hexan-1-ol and octan-1-ol [174]. Reports have shown that varying the oil
concentration does not significantly affect MEEKC separations [136, 138, 170]. High
speed MEEKC using ethyl acetate has been reported [175] which has a lower interfacial
tension and requires a lower concentration of SDS to bridge the oil water interface,
allowing high voltages to be applied which results in efficient resolution of components.
Mertzman [176] and Pascoe [94] have also reported the use of low interfacial oils like
ethyl acetate in MEEKC separations. A range of other oils have been reported [148, 157,
161, 163, 174, 177-178] including cyclohexane, chloroform, methylene chloride,
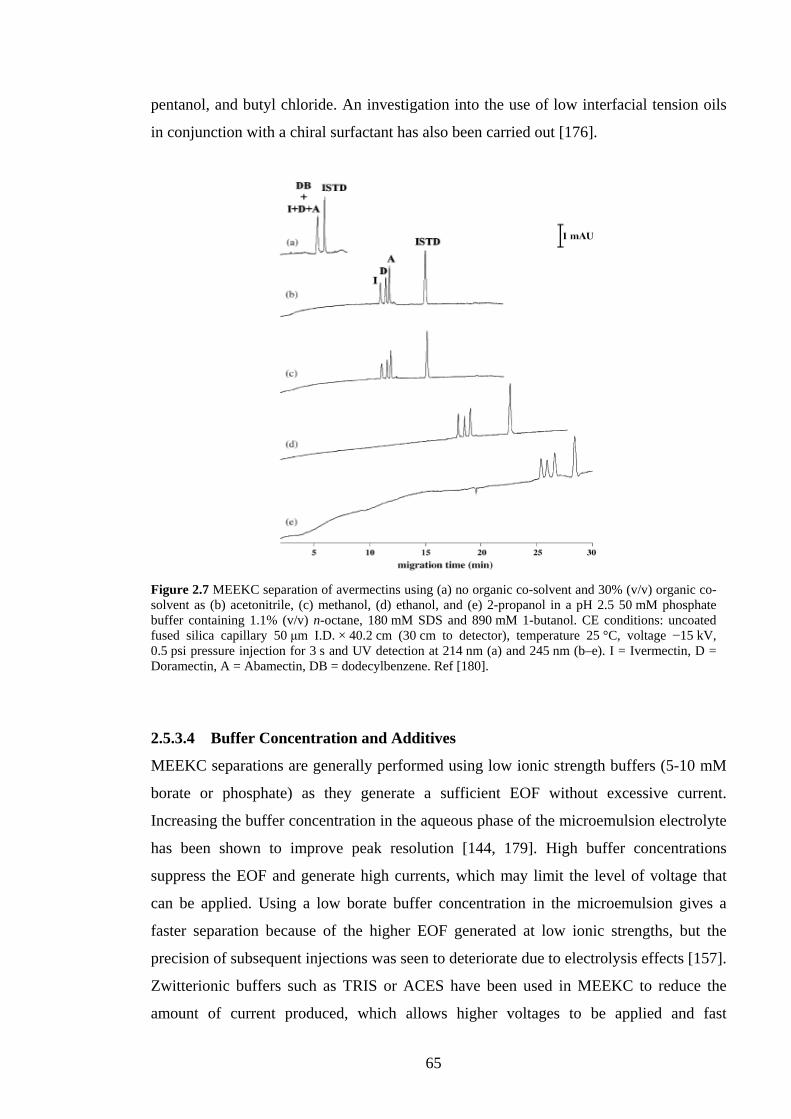
65
pentanol, and butyl chloride. An investigation into the use of low interfacial tension oils
in conjunction with a chiral surfactant has also been carried out [176].
Figure 2.7 MEEKC separation of avermectins using (a) no organic co-solvent and 30% (v/v) organic co-solvent as (b) acetonitrile, (c) methanol, (d) ethanol, and (e) 2-propanol in a pH 2.5 50 mM phosphate buffer containing 1.1% (v/v) n-octane, 180 mM SDS and 890 mM 1-butanol. CE conditions: uncoated fused silica capillary 50 μm I.D. × 40.2 cm (30 cm to detector), temperature 25 °C, voltage −15 kV, 0.5 psi pressure injection for 3 s and UV detection at 214 nm (a) and 245 nm (b–e). I = Ivermectin, D = Doramectin, A = Abamectin, DB = dodecylbenzene. Ref [180].
2.5.3.4 Buffer Concentration and Additives
MEEKC separations are generally performed using low ionic strength buffers (5-10 mM
borate or phosphate) as they generate a sufficient EOF without excessive current.
Increasing the buffer concentration in the aqueous phase of the microemulsion electrolyte
has been shown to improve peak resolution [144, 179]. High buffer concentrations
suppress the EOF and generate high currents, which may limit the level of voltage that
can be applied. Using a low borate buffer concentration in the microemulsion gives a
faster separation because of the higher EOF generated at low ionic strengths, but the
precision of subsequent injections was seen to deteriorate due to electrolysis effects [157].
Zwitterionic buffers such as TRIS or ACES have been used in MEEKC to reduce the
amount of current produced, which allows higher voltages to be applied and fast
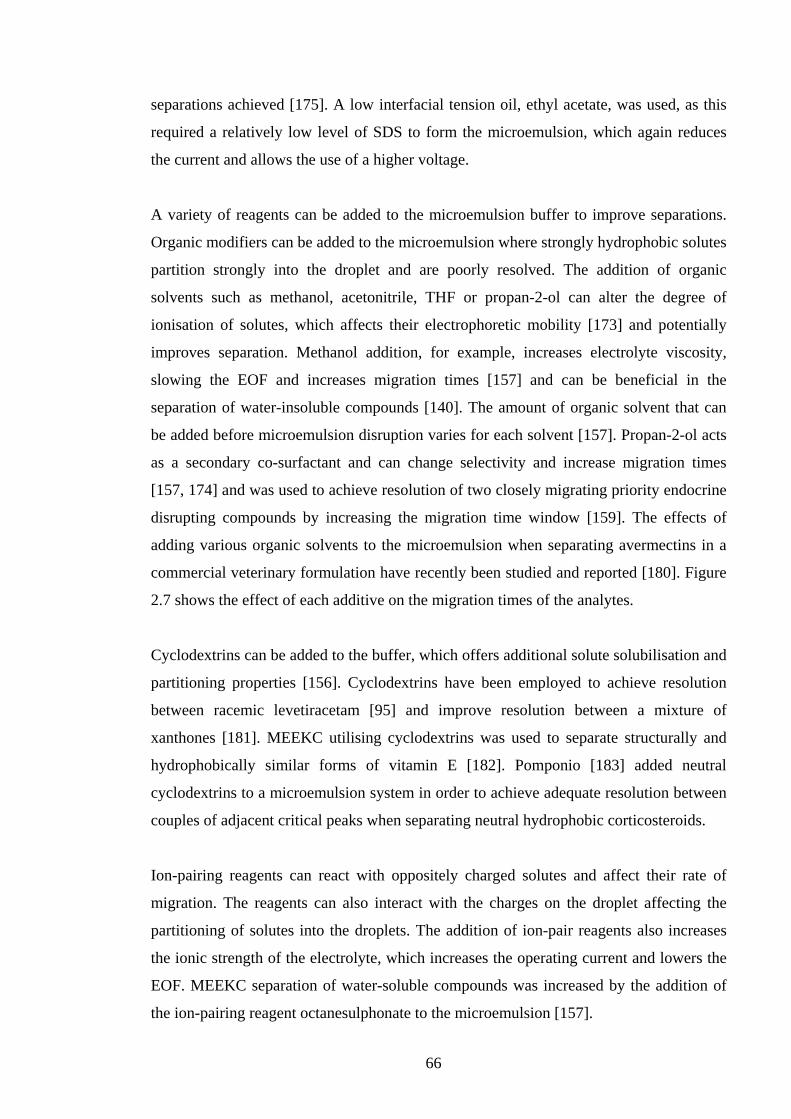
66
separations achieved [175]. A low interfacial tension oil, ethyl acetate, was used, as this
required a relatively low level of SDS to form the microemulsion, which again reduces
the current and allows the use of a higher voltage.
A variety of reagents can be added to the microemulsion buffer to improve separations.
Organic modifiers can be added to the microemulsion where strongly hydrophobic solutes
partition strongly into the droplet and are poorly resolved. The addition of organic
solvents such as methanol, acetonitrile, THF or propan-2-ol can alter the degree of
ionisation of solutes, which affects their electrophoretic mobility [173] and potentially
improves separation. Methanol addition, for example, increases electrolyte viscosity,
slowing the EOF and increases migration times [157] and can be beneficial in the
separation of water-insoluble compounds [140]. The amount of organic solvent that can
be added before microemulsion disruption varies for each solvent [157]. Propan-2-ol acts
as a secondary co-surfactant and can change selectivity and increase migration times
[157, 174] and was used to achieve resolution of two closely migrating priority endocrine
disrupting compounds by increasing the migration time window [159]. The effects of
adding various organic solvents to the microemulsion when separating avermectins in a
commercial veterinary formulation have recently been studied and reported [180]. Figure
2.7 shows the effect of each additive on the migration times of the analytes.
Cyclodextrins can be added to the buffer, which offers additional solute solubilisation and
partitioning properties [156]. Cyclodextrins have been employed to achieve resolution
between racemic levetiracetam [95] and improve resolution between a mixture of
xanthones [181]. MEEKC utilising cyclodextrins was used to separate structurally and
hydrophobically similar forms of vitamin E [182]. Pomponio [183] added neutral
cyclodextrins to a microemulsion system in order to achieve adequate resolution between
couples of adjacent critical peaks when separating neutral hydrophobic corticosteroids.
Ion-pairing reagents can react with oppositely charged solutes and affect their rate of
migration. The reagents can also interact with the charges on the droplet affecting the
partitioning of solutes into the droplets. The addition of ion-pair reagents also increases
the ionic strength of the electrolyte, which increases the operating current and lowers the
EOF. MEEKC separation of water-soluble compounds was increased by the addition of
the ion-pairing reagent octanesulphonate to the microemulsion [157].

67
An ionic liquid additive (1-butyl-3-methylimidazolium tetrafluoborate) has been used for
the separation of the components of Scutellariae radix [184] where the imidazole cations
interacted with the microemulsion droplets, changing the character of the droplets and
altering the distribution of the analytes.
Urea is sometimes added to the buffer to aid in the analysis of hydrophobic compounds.
The effect is similar to that observed on the addition of an organic modifier and an
expansion of the migration window was seen [157].
2.5.3.5 Microemulsion pH
As pH affects both the EOF velocity and the degree of ionisation of solutes, it is a major
factor in MEEKC separations. The effect of pH is directly related to the EOF and thus
determines the rate of migration of the analytes. Generally a pH of between 7 and 9 is
used to achieve fast, efficient separations and a number of reports have examined the
effects of pH in MEEKC analyses [147, 157, 171]. Migration times have been found to
decrease with increase in pH [159, 161] as higher pH values generate a greater EOF.
Buffers up to pH 12 have been used for basic compounds [185] to eliminate ionisation
and for acidic compounds a low pH buffer is required (pH 1.2-1.4). Because at low pH
there is little or no EOF generated, a negative voltage needs to be applied across the
capillary in order to move the droplets through the detector which results in the most
retained compounds being detected first [157, 186]. Although utilisation of a high pH
buffer is most common in MEEKC, low pH buffers have been used to separate priority
endocrine disrupting compounds [160], parabens from parahydroxybenzoic acid [186], a
range of insoluble vitamins [187], a range of pharmaceuticals [188] and green tea
catechins [172]. A negative voltage of –15kV was applied when analysing curcuminoids
in turmeric samples at a pH of 2.5 [189].
2.5.3.6 Temperature
The temperature of the capillary when performing MEEKC separations affects analyte
solubility and hence their partitioning with the droplets. The selectivities of mixtures of
different solutes can alter because temperature affects neutral and charged solutes
disproportionately [147, 173]. Increasing the temperature leads to a reduction in
microemulsion viscosity and hence an increase in EOF and reduction in migration times
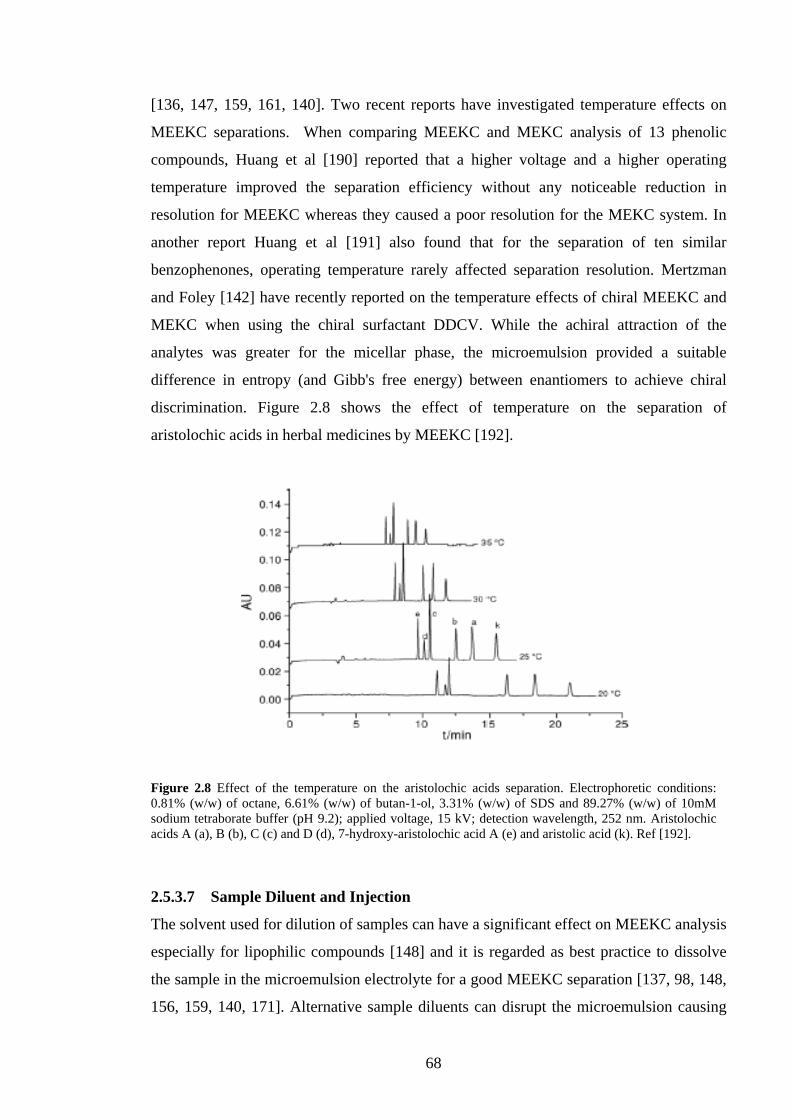
68
[136, 147, 159, 161, 140]. Two recent reports have investigated temperature effects on
MEEKC separations. When comparing MEEKC and MEKC analysis of 13 phenolic
compounds, Huang et al [190] reported that a higher voltage and a higher operating
temperature improved the separation efficiency without any noticeable reduction in
resolution for MEEKC whereas they caused a poor resolution for the MEKC system. In
another report Huang et al [191] also found that for the separation of ten similar
benzophenones, operating temperature rarely affected separation resolution. Mertzman
and Foley [142] have recently reported on the temperature effects of chiral MEEKC and
MEKC when using the chiral surfactant DDCV. While the achiral attraction of the
analytes was greater for the micellar phase, the microemulsion provided a suitable
difference in entropy (and Gibb's free energy) between enantiomers to achieve chiral
discrimination. Figure 2.8 shows the effect of temperature on the separation of
aristolochic acids in herbal medicines by MEEKC [192].
Figure 2.8 Effect of the temperature on the aristolochic acids separation. Electrophoretic conditions: 0.81% (w/w) of octane, 6.61% (w/w) of butan-1-ol, 3.31% (w/w) of SDS and 89.27% (w/w) of 10mM sodium tetraborate buffer (pH 9.2); applied voltage, 15 kV; detection wavelength, 252 nm. Aristolochic acids A (a), B (b), C (c) and D (d), 7-hydroxy-aristolochic acid A (e) and aristolic acid (k). Ref [192]. 2.5.3.7 Sample Diluent and Injection
The solvent used for dilution of samples can have a significant effect on MEEKC analysis
especially for lipophilic compounds [148] and it is regarded as best practice to dissolve
the sample in the microemulsion electrolyte for a good MEEKC separation [137, 98, 148,
156, 159, 140, 171]. Alternative sample diluents can disrupt the microemulsion causing
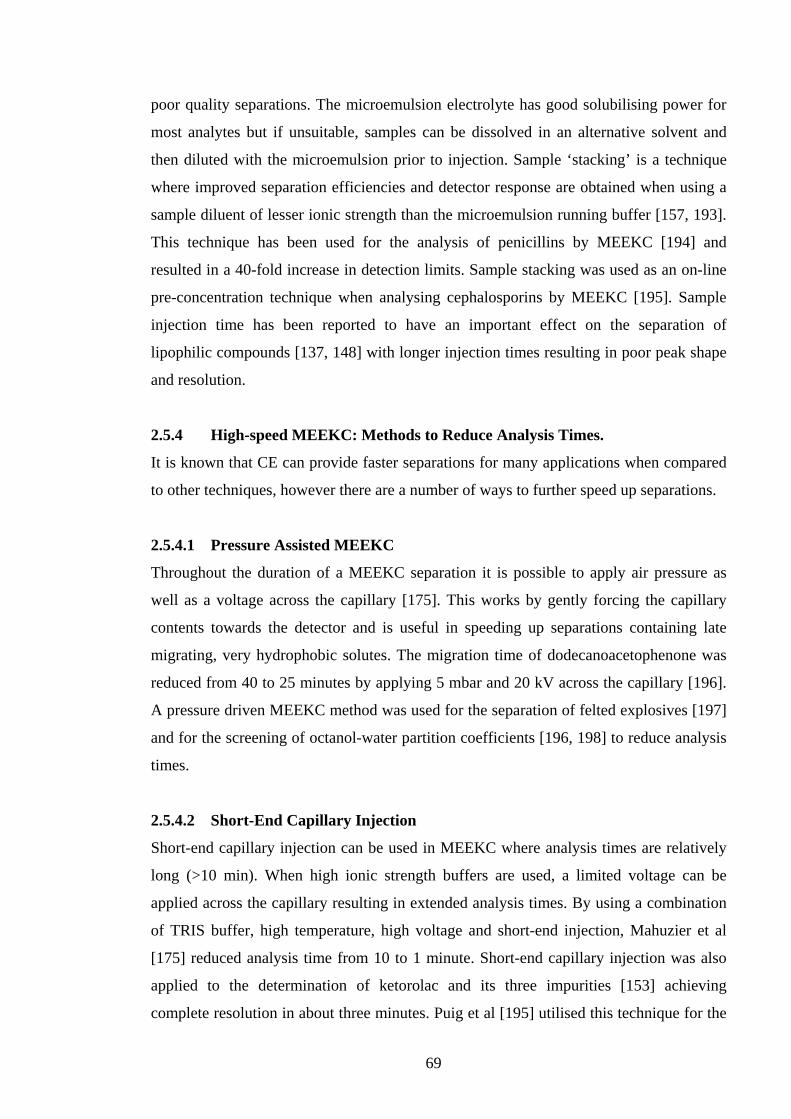
69
poor quality separations. The microemulsion electrolyte has good solubilising power for
most analytes but if unsuitable, samples can be dissolved in an alternative solvent and
then diluted with the microemulsion prior to injection. Sample ‘stacking’ is a technique
where improved separation efficiencies and detector response are obtained when using a
sample diluent of lesser ionic strength than the microemulsion running buffer [157, 193].
This technique has been used for the analysis of penicillins by MEEKC [194] and
resulted in a 40-fold increase in detection limits. Sample stacking was used as an on-line
pre-concentration technique when analysing cephalosporins by MEEKC [195]. Sample
injection time has been reported to have an important effect on the separation of
lipophilic compounds [137, 148] with longer injection times resulting in poor peak shape
and resolution.
2.5.4 High-speed MEEKC: Methods to Reduce Analysis Times.
It is known that CE can provide faster separations for many applications when compared
to other techniques, however there are a number of ways to further speed up separations.
2.5.4.1 Pressure Assisted MEEKC
Throughout the duration of a MEEKC separation it is possible to apply air pressure as
well as a voltage across the capillary [175]. This works by gently forcing the capillary
contents towards the detector and is useful in speeding up separations containing late
migrating, very hydrophobic solutes. The migration time of dodecanoacetophenone was
reduced from 40 to 25 minutes by applying 5 mbar and 20 kV across the capillary [196].
A pressure driven MEEKC method was used for the separation of felted explosives [197]
and for the screening of octanol-water partition coefficients [196, 198] to reduce analysis
times.
2.5.4.2 Short-End Capillary Injection
Short-end capillary injection can be used in MEEKC where analysis times are relatively
long (>10 min). When high ionic strength buffers are used, a limited voltage can be
applied across the capillary resulting in extended analysis times. By using a combination
of TRIS buffer, high temperature, high voltage and short-end injection, Mahuzier et al
[175] reduced analysis time from 10 to 1 minute. Short-end capillary injection was also
applied to the determination of ketorolac and its three impurities [153] achieving
complete resolution in about three minutes. Puig et al [195] utilised this technique for the
70
analysis of cephelasporins and achieved good separations within nine minutes. A
MEEKC method using short-end injection was compared to a similar MEKC method for
urine analysis [199] and although the MEEKC method gave a substantial reduction in
migration times over MEKC it offered no real advantages in terms of resolution achieved.
Zhao et al [200] achieved rapid determination of two diterpenoids in an herbal remedy
using short-end injection MEEKC.
2.5.4.3 Dual Opposite Injection
Dual opposite injection capillary electrophoresis (DOI-CE) is a CE technique where the
sample is introduced into both ends of the capillary. For the analysis of compounds with
widely varying pKa values using a voltage-driven separation scheme, DOI-CE is superior
to conventional CE (with sample introduction at only one end of the capillary) due to a
broader elution window [164]. The detection window can be situated at the middle of the
capillary, thus compensating for the different migration times of cationic and anionic
compounds, offering the possibility of greater resolution without increasing run times.
Zhou and Foley [164] investigated DOI-MEEKC using a low EOF facilitated by
incorporating zinc cations in the microemulsion electrolyte and a neutral surfactant to
achieve partitioning of the solutes.
2.5.5 Improved Sensitivity and Detection Limits
One of the disadvantages of MEEKC and indeed other modes of CE is the decreased
sensitivity and lower detection limits achieved when compared to HPLC. Recent methods
to improve sensitivity and LOD’s have included sample stacking [194] to improve
sensitivity up to 40 fold, and laser induced fluorescence detection (LIFD) [179, 201],
used for to achieve LOD’s of 5.3 and 3.9 ng.ml-1 ephedrine and pseudoephedrine
respectively in Chinese herbal remedies [201].
2.5.6 Water-in-Oil MEEKC
This novel mode of MEEKC has recently been investigated, and has shown excellent
ability to separate highly hydrophobic compounds and compounds in oily matrices by
direct dilution in the microemulsion and injection onto the capillary. Water-in-oil
microemulsion systems are composed of water droplets surrounded by a surfactant and
co-surfactant in a non-polar continuous phase. W/O microemulsions offer the possibility
of delivering unique and novel separation selectivities compared to conventional O/W
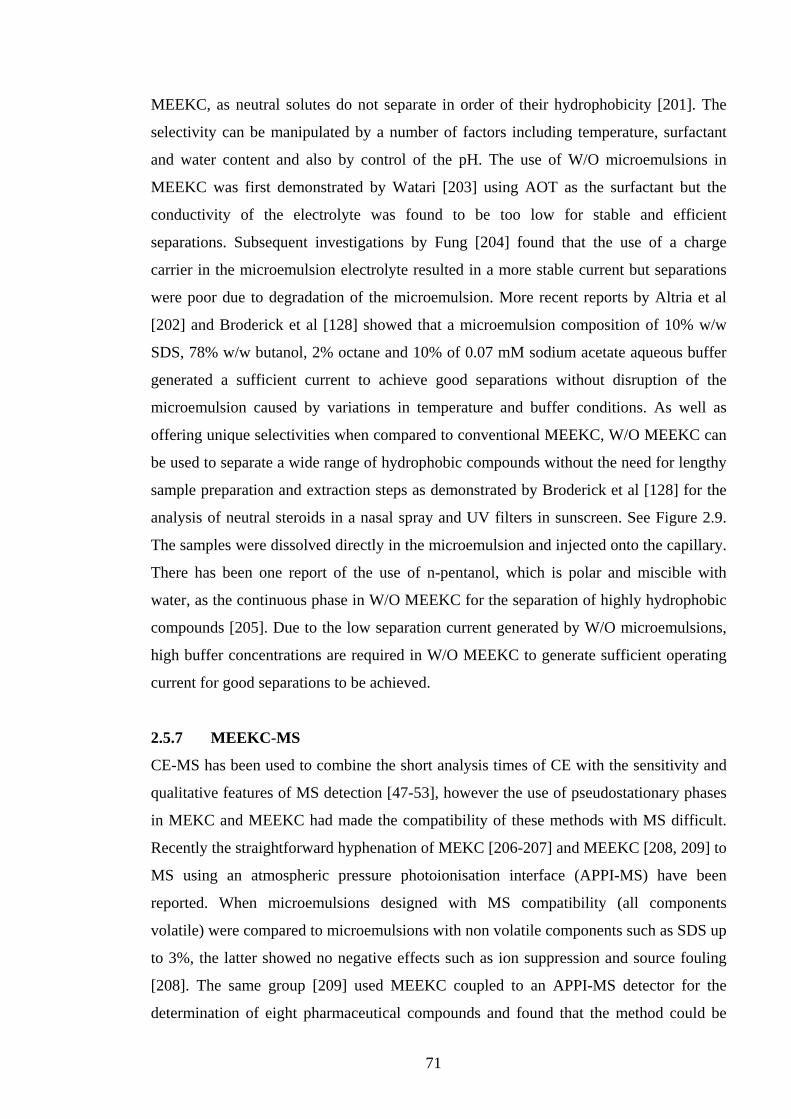
71
MEEKC, as neutral solutes do not separate in order of their hydrophobicity [201]. The
selectivity can be manipulated by a number of factors including temperature, surfactant
and water content and also by control of the pH. The use of W/O microemulsions in
MEEKC was first demonstrated by Watari [203] using AOT as the surfactant but the
conductivity of the electrolyte was found to be too low for stable and efficient
separations. Subsequent investigations by Fung [204] found that the use of a charge
carrier in the microemulsion electrolyte resulted in a more stable current but separations
were poor due to degradation of the microemulsion. More recent reports by Altria et al
[202] and Broderick et al [128] showed that a microemulsion composition of 10% w/w
SDS, 78% w/w butanol, 2% octane and 10% of 0.07 mM sodium acetate aqueous buffer
generated a sufficient current to achieve good separations without disruption of the
microemulsion caused by variations in temperature and buffer conditions. As well as
offering unique selectivities when compared to conventional MEEKC, W/O MEEKC can
be used to separate a wide range of hydrophobic compounds without the need for lengthy
sample preparation and extraction steps as demonstrated by Broderick et al [128] for the
analysis of neutral steroids in a nasal spray and UV filters in sunscreen. See Figure 2.9.
The samples were dissolved directly in the microemulsion and injected onto the capillary.
There has been one report of the use of n-pentanol, which is polar and miscible with
water, as the continuous phase in W/O MEEKC for the separation of highly hydrophobic
compounds [205]. Due to the low separation current generated by W/O microemulsions,
high buffer concentrations are required in W/O MEEKC to generate sufficient operating
current for good separations to be achieved.
2.5.7 MEEKC-MS
CE-MS has been used to combine the short analysis times of CE with the sensitivity and
qualitative features of MS detection [47-53], however the use of pseudostationary phases
in MEKC and MEEKC had made the compatibility of these methods with MS difficult.
Recently the straightforward hyphenation of MEKC [206-207] and MEEKC [208, 209] to
MS using an atmospheric pressure photoionisation interface (APPI-MS) have been
reported. When microemulsions designed with MS compatibility (all components
volatile) were compared to microemulsions with non volatile components such as SDS up
to 3%, the latter showed no negative effects such as ion suppression and source fouling
[208]. The same group [209] used MEEKC coupled to an APPI-MS detector for the
determination of eight pharmaceutical compounds and found that the method could be
72
used for quantitative analysis. No interference from the oil phase or surfactant was
evident using a microemulsion composed of 0.8% octane, 6.6% butanol, 2% SDS, 90.6%
20 mM ammonium hydrogencarbonate.
Figure 2.9 Separation of sun block filters in sunscreen lotion in W/O standard microemulsion W/O MEEKC. Sample injected for 1 s at 50 mbar. 10% (w/w) sodium dodecyl sulphate (SDS), 78% (w/w) butanol, 2% (w/w) octane, 10% (w/w, 0.07 M) sodium acetate buffer pH 8, −30 kV, 33 cm×50 μm ID capillary (detection window at 24.5 cm), 25 ◦C, 200 nm. Ref [128].
2.5.8 Multiplexed Microemulsion Electrokinetic Chromatography
Successful applications of multiplexed MEEKC have appeared in the literature over the
last four years and have shown its potential for routine laboratory use. The capability to
analyse multiple samples simultaneously, and the diverse separation conditions that are
possible, allows rapid turnaround times. Examples of recent high-throughput applications
of multiplexed MEEKC include estimation of log Pow values [210] using microchip
MEEKC with induced fluorescence detection. Wehmeyer et al [56], Marsh & Altria [60]
and Wong et al [55], have reported the use of multiplexed MEEKC for the determination
of log P values. Marsh & Altria in a recent paper [60] reported the use of this method for
a number of applications including, tablet assay and impurities determination, pKa
determinations and log P determinations. Pang et al [61] have shown examples of the
applications of multiplexed CE for physicochemical profiling, enzyme analysis, chiral
separations and protein/metabolite analysis.
73
2.5.9 Applications
The number of applications of MEEKC has increased considerably in recent years.
MEEKC can provide improved separation of various hydrophobic and hydrophilic
compounds with reduced sample pre-treatment steps, unique selectivities, improved
efficiencies and can allow simultaneous determination of many compounds, their
impurities and excipients. Recent advances in MEEKC include W/O MEEKC for
separation of highly hydrophobic compounds and the use of chiral surfactants and chiral
alcohols included in the microemulsion for the separation of pharmaceutical enantiomers,
while log P determination and correlation continues to be an active area of research.
Applications of MEEKC for the analysis of pharmaceuticals, cosmetics and health care
products, biological and environmental compounds, plant materials, explosives, Chinese
traditional medicines and foods are just a selection of the many new applications that
have developed in recent years. This applications section is aimed to provide a concise
overview of new MEEKC applications between 2004 and 2008.
2.5.9.1 Pharmaceutical Analysis
Pharmaceuticals have been one of the major areas of application of MEEKC since it was
first developed. Early applications were for the separation of pharmaceutical substances
such as steroids [137, 174, 160, 166, 188], cardiac glycosides [211], analgesics [177] and
cephalosporins [196]. More recent applications have seen the analysis of pharmaceutical
formulations. For example a MEEKC method has been developed and validated for the
determination of naproxen and rizatripan benzoate in pharmaceutical formulations [212].
The same microemulsion electrolyte was used for a validated MEEKC method to
determine a range of paraben preservatives in a liquid formulation [186]. Figure 2.10
shows the separation of ingredients in a cold medicine using a similar MEEKC method
[214]. A sample stacking technique was used to analyse amoxicillin (a penicillin
compound) in a commercial formulation by MEEKC [194], which showed up to a 40 fold
increase in sensitivity and achieved LODs of between 10 and 25 µg.L-1. Furlanetto [153]
developed and validated a MEEKC technique for the determination of ketorolac and its
impurities in bulk drug and tablet formulations, which demonstrated the usefulness of
chemometric techniques in developing complex analytical methods and its potential for
use in pharmaceutical quality control. Tripodi et al [215] developed a novel MEEKC
method using bis(2-ethylhexyl) sulfosuccinate (AOT) surfactant for the analysis of seven
natural and synthetic estrogens and their impurities which traditionally required separate
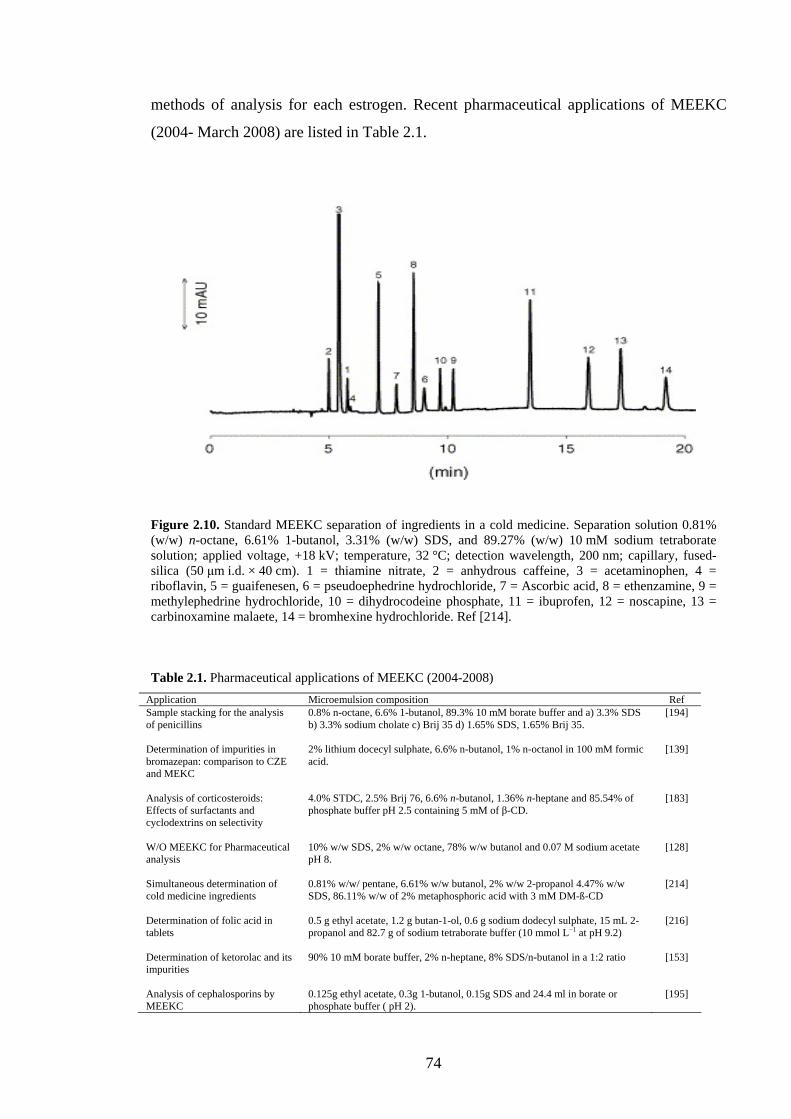
74
methods of analysis for each estrogen. Recent pharmaceutical applications of MEEKC
(2004- March 2008) are listed in Table 2.1.
Figure 2.10. Standard MEEKC separation of ingredients in a cold medicine. Separation solution 0.81% (w/w) n-octane, 6.61% 1-butanol, 3.31% (w/w) SDS, and 89.27% (w/w) 10 mM sodium tetraborate solution; applied voltage, +18 kV; temperature, 32 °C; detection wavelength, 200 nm; capillary, fused-silica (50 μm i.d. × 40 cm). 1 = thiamine nitrate, 2 = anhydrous caffeine, 3 = acetaminophen, 4 = riboflavin, 5 = guaifenesen, 6 = pseudoephedrine hydrochloride, 7 = Ascorbic acid, 8 = ethenzamine, 9 = methylephedrine hydrochloride, 10 = dihydrocodeine phosphate, 11 = ibuprofen, 12 = noscapine, 13 = carbinoxamine malaete, 14 = bromhexine hydrochloride. Ref [214]. Table 2.1. Pharmaceutical applications of MEEKC (2004-2008)
Application Microemulsion composition Ref Sample stacking for the analysis of penicillins Determination of impurities in bromazepan: comparison to CZE and MEKC Analysis of corticosteroids: Effects of surfactants and cyclodextrins on selectivity W/O MEEKC for Pharmaceutical analysis Simultaneous determination of cold medicine ingredients Determination of folic acid in tablets Determination of ketorolac and its impurities Analysis of cephalosporins by MEEKC
0.8% n-octane, 6.6% 1-butanol, 89.3% 10 mM borate buffer and a) 3.3% SDS b) 3.3% sodium cholate c) Brij 35 d) 1.65% SDS, 1.65% Brij 35. 2% lithium docecyl sulphate, 6.6% n-butanol, 1% n-octanol in 100 mM formic acid. 4.0% STDC, 2.5% Brij 76, 6.6% n-butanol, 1.36% n-heptane and 85.54% of phosphate buffer pH 2.5 containing 5 mM of β-CD. 10% w/w SDS, 2% w/w octane, 78% w/w butanol and 0.07 M sodium acetate pH 8. 0.81% w/w/ pentane, 6.61% w/w butanol, 2% w/w 2-propanol 4.47% w/w SDS, 86.11% w/w of 2% metaphosphoric acid with 3 mM DM-ß-CD 0.5 g ethyl acetate, 1.2 g butan-1-ol, 0.6 g sodium dodecyl sulphate, 15 mL 2-propanol and 82.7 g of sodium tetraborate buffer (10 mmol L−1 at pH 9.2) 90% 10 mM borate buffer, 2% n-heptane, 8% SDS/n-butanol in a 1:2 ratio 0.125g ethyl acetate, 0.3g 1-butanol, 0.15g SDS and 24.4 ml in borate or phosphate buffer ( pH 2).
[194]
[139]
[183]
[128]
[214]
[216]
[153]
[195]
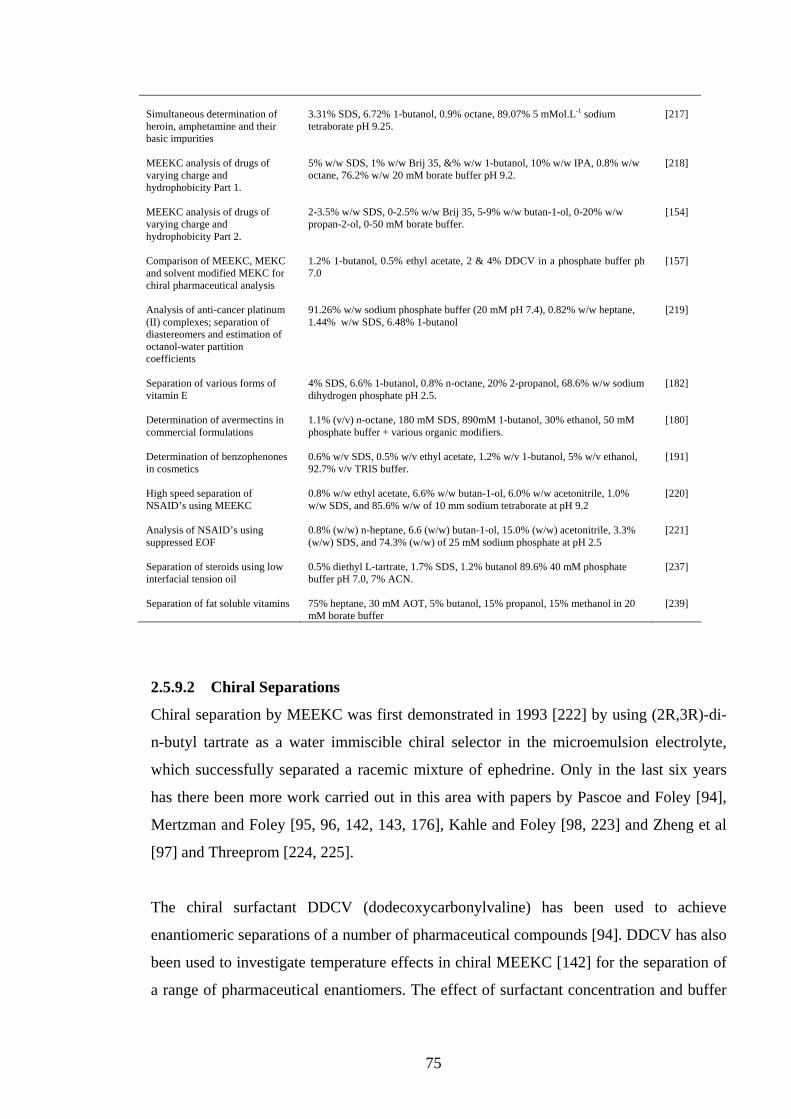
75
Simultaneous determination of heroin, amphetamine and their basic impurities MEEKC analysis of drugs of varying charge and hydrophobicity Part 1. MEEKC analysis of drugs of varying charge and hydrophobicity Part 2. Comparison of MEEKC, MEKC and solvent modified MEKC for chiral pharmaceutical analysis Analysis of anti-cancer platinum (II) complexes; separation of diastereomers and estimation of octanol-water partition coefficients Separation of various forms of vitamin E Determination of avermectins in commercial formulations Determination of benzophenones in cosmetics High speed separation of NSAID’s using MEEKC Analysis of NSAID’s using suppressed EOF Separation of steroids using low interfacial tension oil Separation of fat soluble vitamins
3.31% SDS, 6.72% 1-butanol, 0.9% octane, 89.07% 5 mMol.L-1 sodium tetraborate pH 9.25. 5% w/w SDS, 1% w/w Brij 35, &% w/w 1-butanol, 10% w/w IPA, 0.8% w/w octane, 76.2% w/w 20 mM borate buffer pH 9.2. 2-3.5% w/w SDS, 0-2.5% w/w Brij 35, 5-9% w/w butan-1-ol, 0-20% w/w propan-2-ol, 0-50 mM borate buffer. 1.2% 1-butanol, 0.5% ethyl acetate, 2 & 4% DDCV in a phosphate buffer ph 7.0 91.26% w/w sodium phosphate buffer (20 mM pH 7.4), 0.82% w/w heptane, 1.44% w/w SDS, 6.48% 1-butanol 4% SDS, 6.6% 1-butanol, 0.8% n-octane, 20% 2-propanol, 68.6% w/w sodium dihydrogen phosphate pH 2.5. 1.1% (v/v) n-octane, 180 mM SDS, 890mM 1-butanol, 30% ethanol, 50 mM phosphate buffer + various organic modifiers. 0.6% w/v SDS, 0.5% w/v ethyl acetate, 1.2% w/v 1-butanol, 5% w/v ethanol, 92.7% v/v TRIS buffer. 0.8% w/w ethyl acetate, 6.6% w/w butan-1-ol, 6.0% w/w acetonitrile, 1.0% w/w SDS, and 85.6% w/w of 10 mm sodium tetraborate at pH 9.2 0.8% (w/w) n-heptane, 6.6 (w/w) butan-1-ol, 15.0% (w/w) acetonitrile, 3.3% (w/w) SDS, and 74.3% (w/w) of 25 mM sodium phosphate at pH 2.5 0.5% diethyl L-tartrate, 1.7% SDS, 1.2% butanol 89.6% 40 mM phosphate buffer pH 7.0, 7% ACN. 75% heptane, 30 mM AOT, 5% butanol, 15% propanol, 15% methanol in 20 mM borate buffer
[217]
[218]
[154]
[157]
[219]
[182]
[180]
[191]
[220]
[221]
[237]
[239]
2.5.9.2 Chiral Separations
Chiral separation by MEEKC was first demonstrated in 1993 [222] by using (2R,3R)-di-
n-butyl tartrate as a water immiscible chiral selector in the microemulsion electrolyte,
which successfully separated a racemic mixture of ephedrine. Only in the last six years
has there been more work carried out in this area with papers by Pascoe and Foley [94],
Mertzman and Foley [95, 96, 142, 143, 176], Kahle and Foley [98, 223] and Zheng et al
[97] and Threeprom [224, 225].
The chiral surfactant DDCV (dodecoxycarbonylvaline) has been used to achieve
enantiomeric separations of a number of pharmaceutical compounds [94]. DDCV has also
been used to investigate temperature effects in chiral MEEKC [142] for the separation of
a range of pharmaceutical enantiomers. The effect of surfactant concentration and buffer
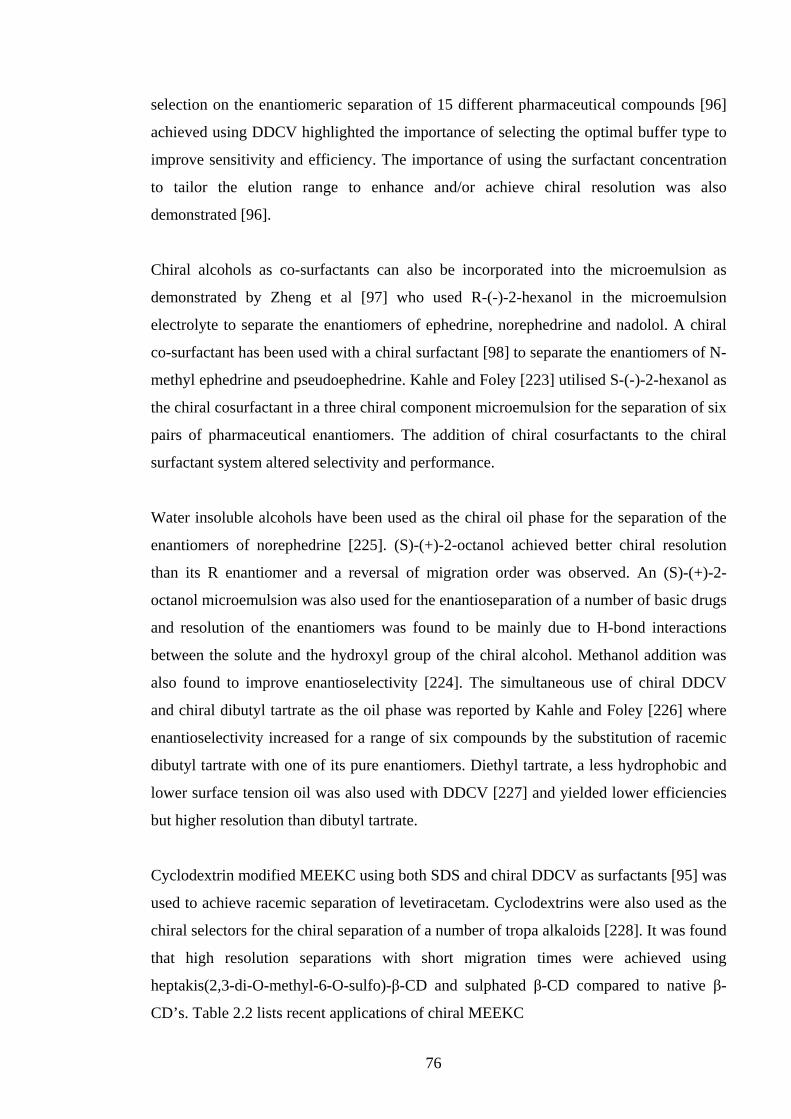
76
selection on the enantiomeric separation of 15 different pharmaceutical compounds [96]
achieved using DDCV highlighted the importance of selecting the optimal buffer type to
improve sensitivity and efficiency. The importance of using the surfactant concentration
to tailor the elution range to enhance and/or achieve chiral resolution was also
demonstrated [96].
Chiral alcohols as co-surfactants can also be incorporated into the microemulsion as
demonstrated by Zheng et al [97] who used R-(-)-2-hexanol in the microemulsion
electrolyte to separate the enantiomers of ephedrine, norephedrine and nadolol. A chiral
co-surfactant has been used with a chiral surfactant [98] to separate the enantiomers of N-
methyl ephedrine and pseudoephedrine. Kahle and Foley [223] utilised S-(-)-2-hexanol as
the chiral cosurfactant in a three chiral component microemulsion for the separation of six
pairs of pharmaceutical enantiomers. The addition of chiral cosurfactants to the chiral
surfactant system altered selectivity and performance.
Water insoluble alcohols have been used as the chiral oil phase for the separation of the
enantiomers of norephedrine [225]. (S)-(+)-2-octanol achieved better chiral resolution
than its R enantiomer and a reversal of migration order was observed. An (S)-(+)-2-
octanol microemulsion was also used for the enantioseparation of a number of basic drugs
and resolution of the enantiomers was found to be mainly due to H-bond interactions
between the solute and the hydroxyl group of the chiral alcohol. Methanol addition was
also found to improve enantioselectivity [224]. The simultaneous use of chiral DDCV
and chiral dibutyl tartrate as the oil phase was reported by Kahle and Foley [226] where
enantioselectivity increased for a range of six compounds by the substitution of racemic
dibutyl tartrate with one of its pure enantiomers. Diethyl tartrate, a less hydrophobic and
lower surface tension oil was also used with DDCV [227] and yielded lower efficiencies
but higher resolution than dibutyl tartrate.
Cyclodextrin modified MEEKC using both SDS and chiral DDCV as surfactants [95] was
used to achieve racemic separation of levetiracetam. Cyclodextrins were also used as the
chiral selectors for the chiral separation of a number of tropa alkaloids [228]. It was found
that high resolution separations with short migration times were achieved using
heptakis(2,3-di-O-methyl-6-O-sulfo)-β-CD and sulphated β-CD compared to native β-
CD’s. Table 2.2 lists recent applications of chiral MEEKC
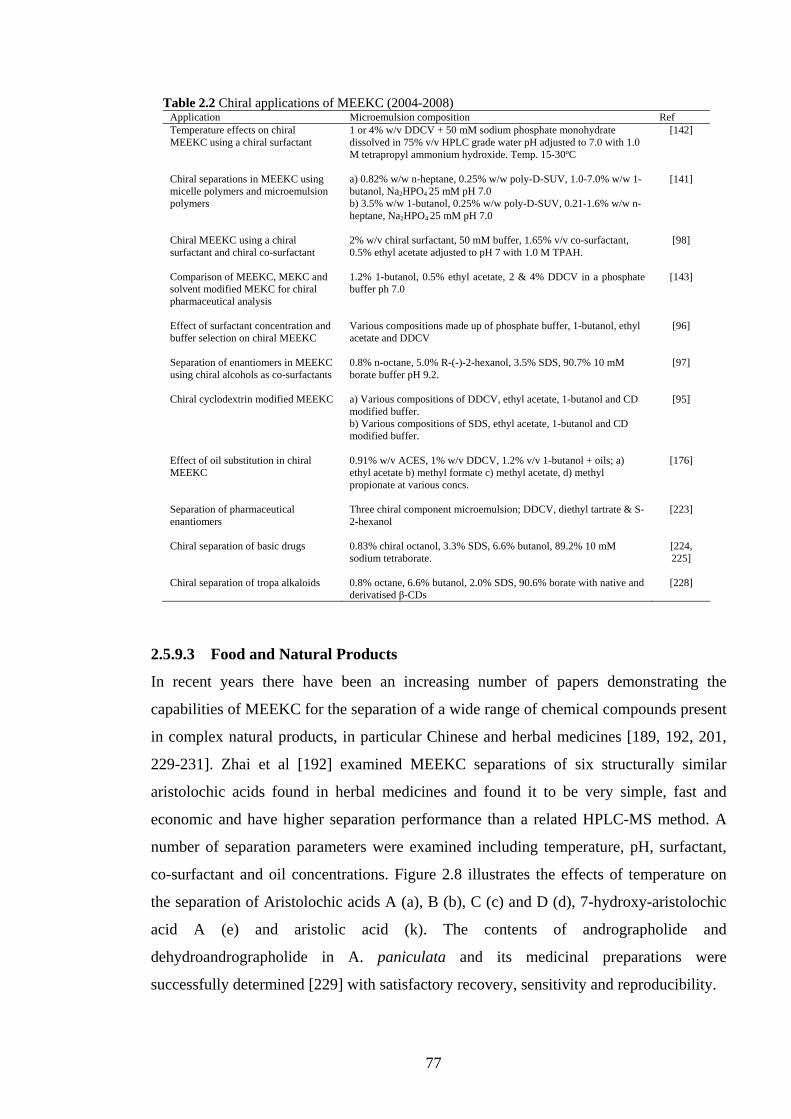
77
Table 2.2 Chiral applications of MEEKC (2004-2008) Application Microemulsion composition Ref Temperature effects on chiral MEEKC using a chiral surfactant Chiral separations in MEEKC using micelle polymers and microemulsion polymers Chiral MEEKC using a chiral surfactant and chiral co-surfactant Comparison of MEEKC, MEKC and solvent modified MEKC for chiral pharmaceutical analysis Effect of surfactant concentration and buffer selection on chiral MEEKC Separation of enantiomers in MEEKC using chiral alcohols as co-surfactants Chiral cyclodextrin modified MEEKC Effect of oil substitution in chiral MEEKC Separation of pharmaceutical enantiomers Chiral separation of basic drugs Chiral separation of tropa alkaloids
1 or 4% w/v DDCV + 50 mM sodium phosphate monohydrate dissolved in 75% v/v HPLC grade water pH adjusted to 7.0 with 1.0 M tetrapropyl ammonium hydroxide. Temp. 15-30ºC a) 0.82% w/w n-heptane, 0.25% w/w poly-D-SUV, 1.0-7.0% w/w 1-butanol, Na2HPO4 25 mM pH 7.0 b) 3.5% w/w 1-butanol, 0.25% w/w poly-D-SUV, 0.21-1.6% w/w n-heptane, Na2HPO4 25 mM pH 7.0 2% w/v chiral surfactant, 50 mM buffer, 1.65% v/v co-surfactant, 0.5% ethyl acetate adjusted to pH 7 with 1.0 M TPAH. 1.2% 1-butanol, 0.5% ethyl acetate, 2 & 4% DDCV in a phosphate buffer ph 7.0 Various compositions made up of phosphate buffer, 1-butanol, ethyl acetate and DDCV 0.8% n-octane, 5.0% R-(-)-2-hexanol, 3.5% SDS, 90.7% 10 mM borate buffer pH 9.2. a) Various compositions of DDCV, ethyl acetate, 1-butanol and CD modified buffer. b) Various compositions of SDS, ethyl acetate, 1-butanol and CD modified buffer. 0.91% w/v ACES, 1% w/v DDCV, 1.2% v/v 1-butanol + oils; a) ethyl acetate b) methyl formate c) methyl acetate, d) methyl propionate at various concs. Three chiral component microemulsion; DDCV, diethyl tartrate & S-2-hexanol 0.83% chiral octanol, 3.3% SDS, 6.6% butanol, 89.2% 10 mM sodium tetraborate. 0.8% octane, 6.6% butanol, 2.0% SDS, 90.6% borate with native and derivatised β-CDs
[142]
[141]
[98]
[143]
[96]
[97]
[95]
[176]
[223]
[224, 225]
[228]
2.5.9.3 Food and Natural Products
In recent years there have been an increasing number of papers demonstrating the
capabilities of MEEKC for the separation of a wide range of chemical compounds present
in complex natural products, in particular Chinese and herbal medicines [189, 192, 201,
229-231]. Zhai et al [192] examined MEEKC separations of six structurally similar
aristolochic acids found in herbal medicines and found it to be very simple, fast and
economic and have higher separation performance than a related HPLC-MS method. A
number of separation parameters were examined including temperature, pH, surfactant,
co-surfactant and oil concentrations. Figure 2.8 illustrates the effects of temperature on
the separation of Aristolochic acids A (a), B (b), C (c) and D (d), 7-hydroxy-aristolochic
acid A (e) and aristolic acid (k). The contents of andrographolide and
dehydroandrographolide in A. paniculata and its medicinal preparations were
successfully determined [229] with satisfactory recovery, sensitivity and reproducibility.
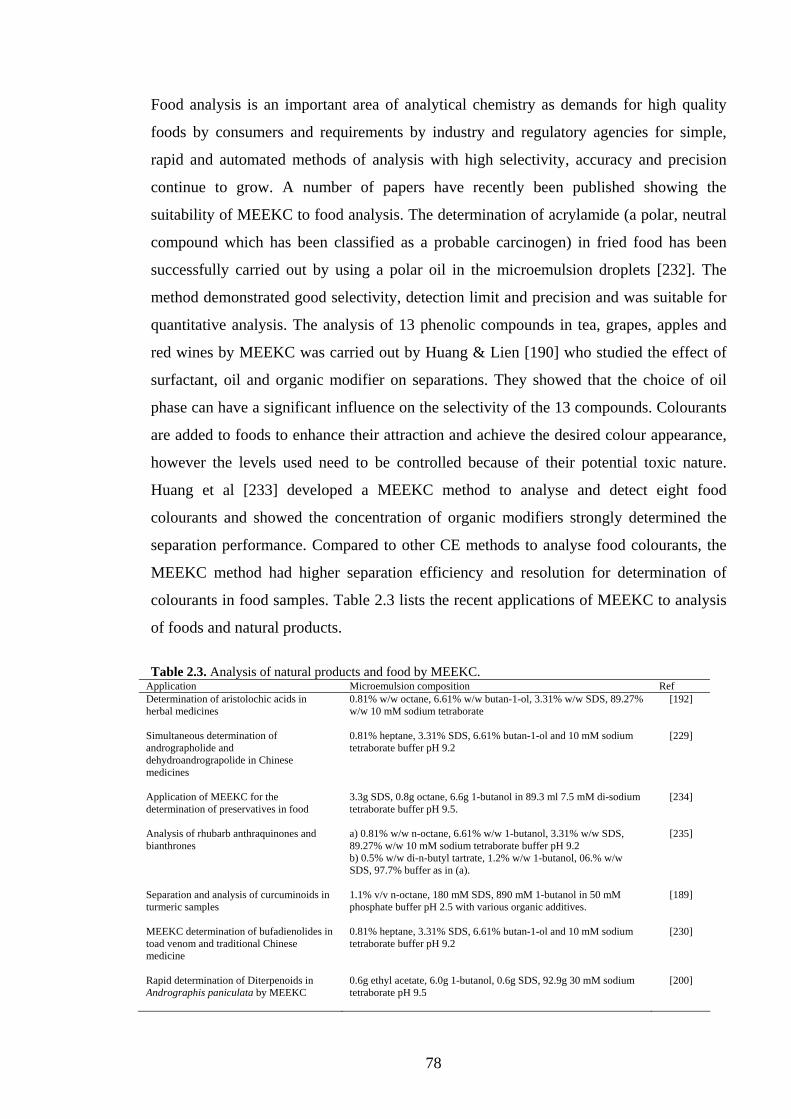
78
Food analysis is an important area of analytical chemistry as demands for high quality
foods by consumers and requirements by industry and regulatory agencies for simple,
rapid and automated methods of analysis with high selectivity, accuracy and precision
continue to grow. A number of papers have recently been published showing the
suitability of MEEKC to food analysis. The determination of acrylamide (a polar, neutral
compound which has been classified as a probable carcinogen) in fried food has been
successfully carried out by using a polar oil in the microemulsion droplets [232]. The
method demonstrated good selectivity, detection limit and precision and was suitable for
quantitative analysis. The analysis of 13 phenolic compounds in tea, grapes, apples and
red wines by MEEKC was carried out by Huang & Lien [190] who studied the effect of
surfactant, oil and organic modifier on separations. They showed that the choice of oil
phase can have a significant influence on the selectivity of the 13 compounds. Colourants
are added to foods to enhance their attraction and achieve the desired colour appearance,
however the levels used need to be controlled because of their potential toxic nature.
Huang et al [233] developed a MEEKC method to analyse and detect eight food
colourants and showed the concentration of organic modifiers strongly determined the
separation performance. Compared to other CE methods to analyse food colourants, the
MEEKC method had higher separation efficiency and resolution for determination of
colourants in food samples. Table 2.3 lists the recent applications of MEEKC to analysis
of foods and natural products.
Table 2.3. Analysis of natural products and food by MEEKC.
Application Microemulsion composition Ref Determination of aristolochic acids in herbal medicines Simultaneous determination of andrographolide and dehydroandrograpolide in Chinese medicines Application of MEEKC for the determination of preservatives in food Analysis of rhubarb anthraquinones and bianthrones Separation and analysis of curcuminoids in turmeric samples MEEKC determination of bufadienolides in toad venom and traditional Chinese medicine Rapid determination of Diterpenoids in Andrographis paniculata by MEEKC
0.81% w/w octane, 6.61% w/w butan-1-ol, 3.31% w/w SDS, 89.27% w/w 10 mM sodium tetraborate 0.81% heptane, 3.31% SDS, 6.61% butan-1-ol and 10 mM sodium tetraborate buffer pH 9.2 3.3g SDS, 0.8g octane, 6.6g 1-butanol in 89.3 ml 7.5 mM di-sodium tetraborate buffer pH 9.5. a) 0.81% w/w n-octane, 6.61% w/w 1-butanol, 3.31% w/w SDS, 89.27% w/w 10 mM sodium tetraborate buffer pH 9.2 b) 0.5% w/w di-n-butyl tartrate, 1.2% w/w 1-butanol, 06.% w/w SDS, 97.7% buffer as in (a). 1.1% v/v n-octane, 180 mM SDS, 890 mM 1-butanol in 50 mM phosphate buffer pH 2.5 with various organic additives. 0.81% heptane, 3.31% SDS, 6.61% butan-1-ol and 10 mM sodium tetraborate buffer pH 9.2 0.6g ethyl acetate, 6.0g 1-butanol, 0.6g SDS, 92.9g 30 mM sodium tetraborate pH 9.5
[192]
[229]
[234]
[235]
[189]
[230]
[200]
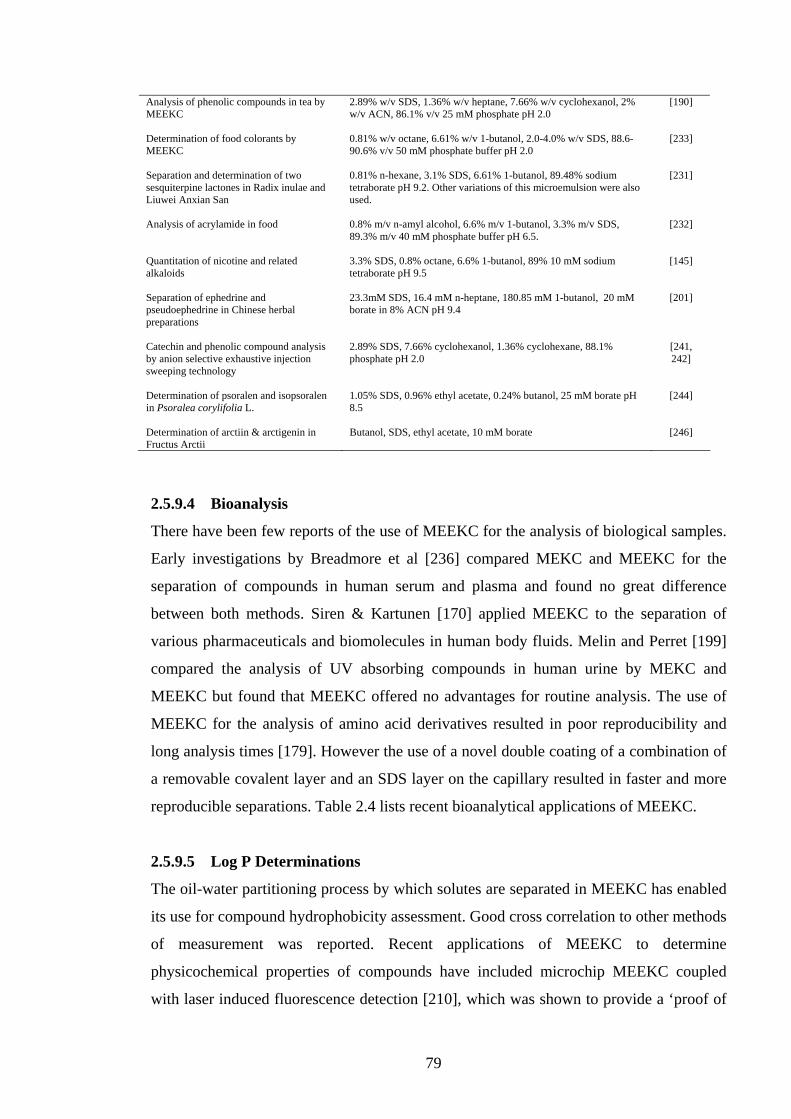
79
Analysis of phenolic compounds in tea by MEEKC Determination of food colorants by MEEKC Separation and determination of two sesquiterpine lactones in Radix inulae and Liuwei Anxian San Analysis of acrylamide in food Quantitation of nicotine and related alkaloids Separation of ephedrine and pseudoephedrine in Chinese herbal preparations Catechin and phenolic compound analysis by anion selective exhaustive injection sweeping technology Determination of psoralen and isopsoralen in Psoralea corylifolia L. Determination of arctiin & arctigenin in Fructus Arctii
2.89% w/v SDS, 1.36% w/v heptane, 7.66% w/v cyclohexanol, 2% w/v ACN, 86.1% v/v 25 mM phosphate pH 2.0 0.81% w/v octane, 6.61% w/v 1-butanol, 2.0-4.0% w/v SDS, 88.6-90.6% v/v 50 mM phosphate buffer pH 2.0 0.81% n-hexane, 3.1% SDS, 6.61% 1-butanol, 89.48% sodium tetraborate pH 9.2. Other variations of this microemulsion were also used. 0.8% m/v n-amyl alcohol, 6.6% m/v 1-butanol, 3.3% m/v SDS, 89.3% m/v 40 mM phosphate buffer pH 6.5. 3.3% SDS, 0.8% octane, 6.6% 1-butanol, 89% 10 mM sodium tetraborate pH 9.5 23.3mM SDS, 16.4 mM n-heptane, 180.85 mM 1-butanol, 20 mM borate in 8% ACN pH 9.4 2.89% SDS, 7.66% cyclohexanol, 1.36% cyclohexane, 88.1% phosphate pH 2.0 1.05% SDS, 0.96% ethyl acetate, 0.24% butanol, 25 mM borate pH 8.5 Butanol, SDS, ethyl acetate, 10 mM borate
[190]
[233]
[231]
[232]
[145]
[201]
[241, 242]
[244]
[246]
2.5.9.4 Bioanalysis
There have been few reports of the use of MEEKC for the analysis of biological samples.
Early investigations by Breadmore et al [236] compared MEKC and MEEKC for the
separation of compounds in human serum and plasma and found no great difference
between both methods. Siren & Kartunen [170] applied MEEKC to the separation of
various pharmaceuticals and biomolecules in human body fluids. Melin and Perret [199]
compared the analysis of UV absorbing compounds in human urine by MEKC and
MEEKC but found that MEEKC offered no advantages for routine analysis. The use of
MEEKC for the analysis of amino acid derivatives resulted in poor reproducibility and
long analysis times [179]. However the use of a novel double coating of a combination of
a removable covalent layer and an SDS layer on the capillary resulted in faster and more
reproducible separations. Table 2.4 lists recent bioanalytical applications of MEEKC.
2.5.9.5 Log P Determinations
The oil-water partitioning process by which solutes are separated in MEEKC has enabled
its use for compound hydrophobicity assessment. Good cross correlation to other methods
of measurement was reported. Recent applications of MEEKC to determine
physicochemical properties of compounds have included microchip MEEKC coupled
with laser induced fluorescence detection [210], which was shown to provide a ‘proof of
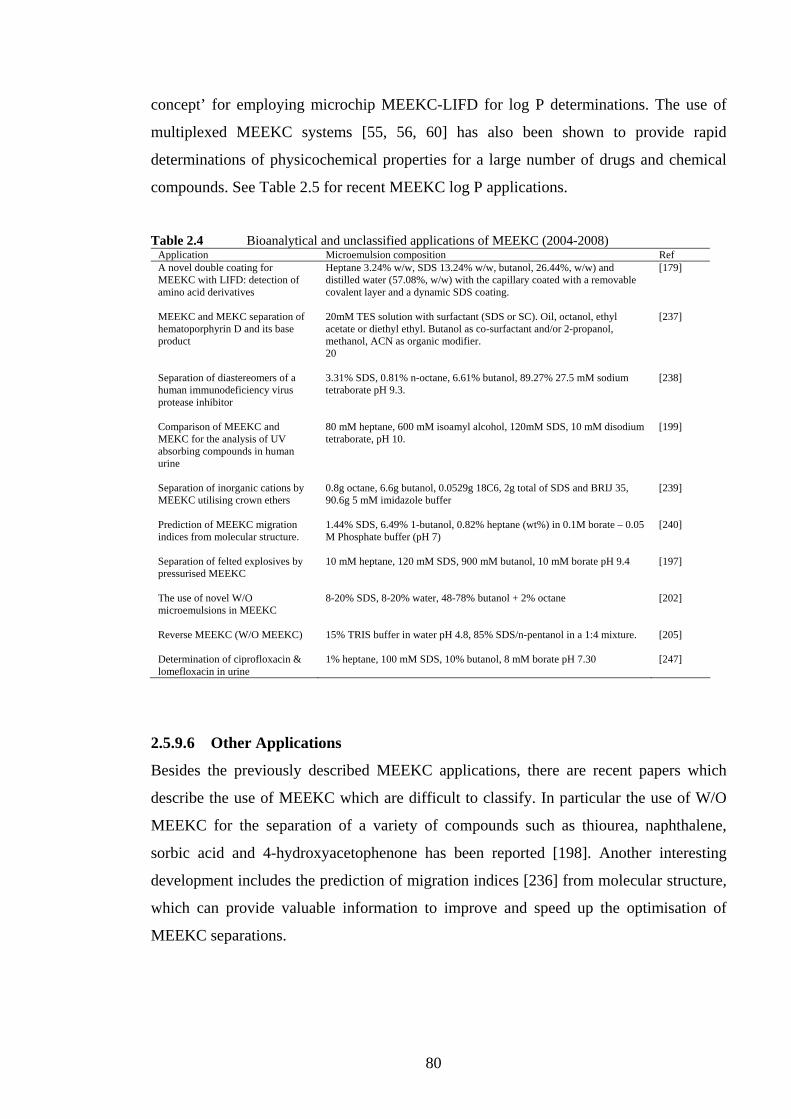
80
concept’ for employing microchip MEEKC-LIFD for log P determinations. The use of
multiplexed MEEKC systems [55, 56, 60] has also been shown to provide rapid
determinations of physicochemical properties for a large number of drugs and chemical
compounds. See Table 2.5 for recent MEEKC log P applications.
Table 2.4 Bioanalytical and unclassified applications of MEEKC (2004-2008)
Application Microemulsion composition Ref A novel double coating for MEEKC with LIFD: detection of amino acid derivatives MEEKC and MEKC separation of hematoporphyrin D and its base product Separation of diastereomers of a human immunodeficiency virus protease inhibitor Comparison of MEEKC and MEKC for the analysis of UV absorbing compounds in human urine Separation of inorganic cations by MEEKC utilising crown ethers Prediction of MEEKC migration indices from molecular structure. Separation of felted explosives by pressurised MEEKC The use of novel W/O microemulsions in MEEKC Reverse MEEKC (W/O MEEKC) Determination of ciprofloxacin & lomefloxacin in urine
Heptane 3.24% w/w, SDS 13.24% w/w, butanol, 26.44%, w/w) and distilled water (57.08%, w/w) with the capillary coated with a removable covalent layer and a dynamic SDS coating. 20mM TES solution with surfactant (SDS or SC). Oil, octanol, ethyl acetate or diethyl ethyl. Butanol as co-surfactant and/or 2-propanol, methanol, ACN as organic modifier. 20 3.31% SDS, 0.81% n-octane, 6.61% butanol, 89.27% 27.5 mM sodium tetraborate pH 9.3. 80 mM heptane, 600 mM isoamyl alcohol, 120mM SDS, 10 mM disodium tetraborate, pH 10. 0.8g octane, 6.6g butanol, 0.0529g 18C6, 2g total of SDS and BRIJ 35, 90.6g 5 mM imidazole buffer 1.44% SDS, 6.49% 1-butanol, 0.82% heptane (wt%) in 0.1M borate – 0.05 M Phosphate buffer (pH 7) 10 mM heptane, 120 mM SDS, 900 mM butanol, 10 mM borate pH 9.4 8-20% SDS, 8-20% water, 48-78% butanol + 2% octane 15% TRIS buffer in water pH 4.8, 85% SDS/n-pentanol in a 1:4 mixture. 1% heptane, 100 mM SDS, 10% butanol, 8 mM borate pH 7.30
[179] [237] [238] [199] [239] [240] [197] [202] [205] [247]
2.5.9.6 Other Applications
Besides the previously described MEEKC applications, there are recent papers which
describe the use of MEEKC which are difficult to classify. In particular the use of W/O
MEEKC for the separation of a variety of compounds such as thiourea, naphthalene,
sorbic acid and 4-hydroxyacetophenone has been reported [198]. Another interesting
development includes the prediction of migration indices [236] from molecular structure,
which can provide valuable information to improve and speed up the optimisation of
MEEKC separations.
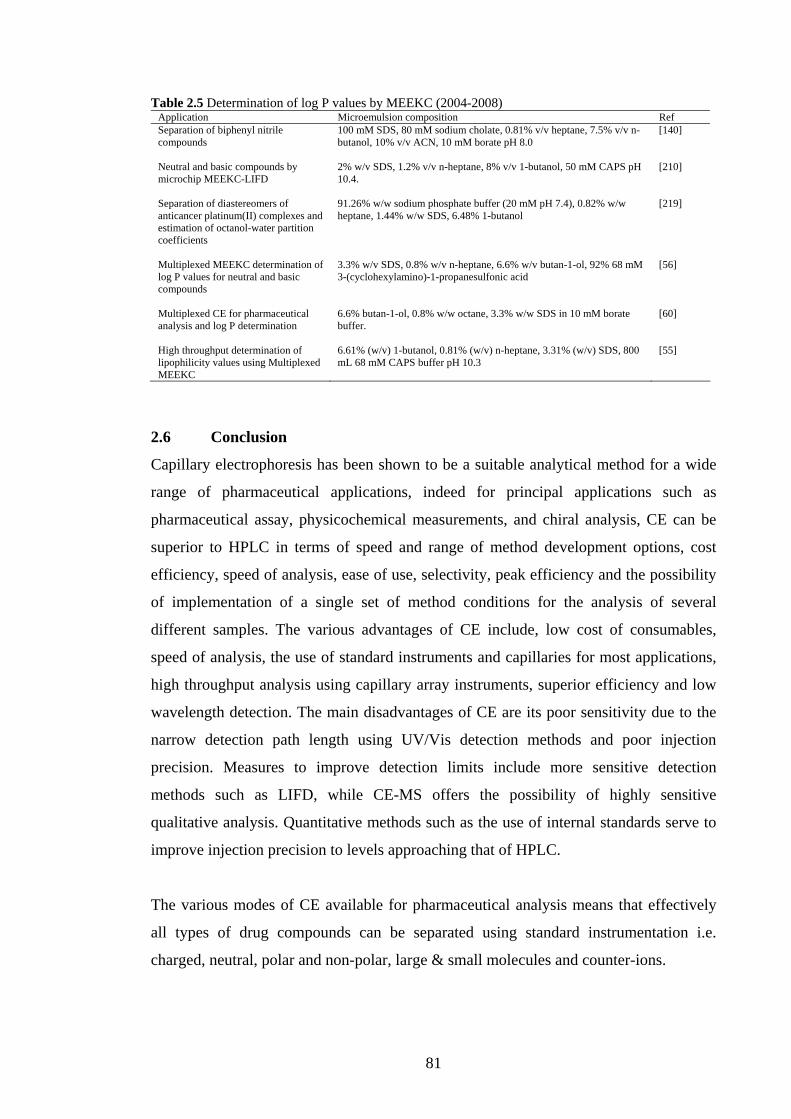
81
Table 2.5 Determination of log P values by MEEKC (2004-2008) Application Microemulsion composition Ref Separation of biphenyl nitrile compounds Neutral and basic compounds by microchip MEEKC-LIFD Separation of diastereomers of anticancer platinum(II) complexes and estimation of octanol-water partition coefficients Multiplexed MEEKC determination of log P values for neutral and basic compounds Multiplexed CE for pharmaceutical analysis and log P determination High throughput determination of lipophilicity values using Multiplexed MEEKC
100 mM SDS, 80 mM sodium cholate, 0.81% v/v heptane, 7.5% v/v n-butanol, 10% v/v ACN, 10 mM borate pH 8.0 2% w/v SDS, 1.2% v/v n-heptane, 8% v/v 1-butanol, 50 mM CAPS pH 10.4. 91.26% w/w sodium phosphate buffer (20 mM pH 7.4), 0.82% w/w heptane, 1.44% w/w SDS, 6.48% 1-butanol 3.3% w/v SDS, 0.8% w/v n-heptane, 6.6% w/v butan-1-ol, 92% 68 mM 3-(cyclohexylamino)-1-propanesulfonic acid 6.6% butan-1-ol, 0.8% w/w octane, 3.3% w/w SDS in 10 mM borate buffer. 6.61% (w/v) 1-butanol, 0.81% (w/v) n-heptane, 3.31% (w/v) SDS, 800 mL 68 mM CAPS buffer pH 10.3
[140] [210] [219] [56] [60] [55]
2.6 Conclusion
Capillary electrophoresis has been shown to be a suitable analytical method for a wide
range of pharmaceutical applications, indeed for principal applications such as
pharmaceutical assay, physicochemical measurements, and chiral analysis, CE can be
superior to HPLC in terms of speed and range of method development options, cost
efficiency, speed of analysis, ease of use, selectivity, peak efficiency and the possibility
of implementation of a single set of method conditions for the analysis of several
different samples. The various advantages of CE include, low cost of consumables,
speed of analysis, the use of standard instruments and capillaries for most applications,
high throughput analysis using capillary array instruments, superior efficiency and low
wavelength detection. The main disadvantages of CE are its poor sensitivity due to the
narrow detection path length using UV/Vis detection methods and poor injection
precision. Measures to improve detection limits include more sensitive detection
methods such as LIFD, while CE-MS offers the possibility of highly sensitive
qualitative analysis. Quantitative methods such as the use of internal standards serve to
improve injection precision to levels approaching that of HPLC.
The various modes of CE available for pharmaceutical analysis means that effectively
all types of drug compounds can be separated using standard instrumentation i.e.
charged, neutral, polar and non-polar, large & small molecules and counter-ions.

82
CE is regularly used to provide complimentary information to HPLC or other methods
as well as being a technique of choice for certain applications. As further research is
carried out and the use of CE becomes more widespread in pharmaceutical laboratories,
the use of CE is certain to become more popular and possibly take over from traditional
analytical methods like HPLC and titrimetric techniques for routine testing of
pharmaceuticals.
The number of publications relating to MEEKC continues to rise as the diversity of
method development options expands with new possibilities of generating unique
selectivities. W/O MEEKC has been reported which is especially useful for the analysis
of highly water insoluble substances. Chiral separations continue to be a growing area of
MEEKC with various chiral components being used singly or in combination with others.
The number of applications of MEEKC to the analysis of natural products is expanding
quickly with a wide range of uses being reported. The use of new instrumentation such as
multiplexed and microchip CE systems with improved detection methods may be
prominent in future MEEKC literature.
2.7 References [1] Harris Daniel C., Quantitative Chemical analysis, 4th ed. (W. H. Freeman and
Company, New York, 1995) pp 643, 713.
[2] Jorgenson J.W., Lukacs K.D., Zone electrophoresis in open tubular glass capillaries,
Anal Chem., 53, 1289-1302 (1981).
[3] Mikkers F.E.P., Everaerts F.M., Verheggen T.P.E.M., High-performance Zone
electrophoresis, J. Chromatography, 169, 11-20 (1979).
[4] Terabe S., Otsuka K., Ando T., Anal Chem., 57, 834-841 (1985).
[5] Terabe S., Trends anal. Chem., 8, 129-134, (1989).
[6] Altria K.D., J. Chromatography, 646 (2), 245-257 (1993).
[7] Holland L.A., Chetwyn NP, Perkins MD, et al., Pharmaceutical Research, 14 (4), 372-
387 (1997).
[8] Altria K.D., Kelly M.A., Clark B.J., Trac-Trends Anal Chem 17 (4), 204-214 (1998).
[9] Altria K.D., Kelly M.A., Clark B.J., Trac-Trends Anal Chem 17 (4), 214-226 (1998).
[10] Altria K.D., J. Chromatogr A, 856 (1-2), 443-463, (1999).
[11] Altria K.D., Elder D., J. Chromatogr A, 1023 (1), 1-14, (2004).
[12] Natishan T.K., J. Liquid Chrom. and Rel. Tech., 28 (7-8), 1115-1160 (2005).
83
[13] Lunn G., Capillary Electrophoresis Methods for Pharmaceutical analysis, (John Wiley
and Sons, New York, 2000).
[14] Landers J.P. (Ed), Handbook of Capillary Electrophoresis 2nd ed. (CRC Press, Florida,
1997).
[15] Altria K.D., Simpson C.F., J Pharm Biomed Anal, 6 (6-8), 801-807 (1988).
[16] Ha P.T.T, Hoogmartens J., van Schepdael A., J Pharm Biomed Anal, 41(1), 1-11
(2006).
[17] Scriba G.K.E., J Pharm Biomed Anal, 27 (3-4), 373-399 (2002).
[18] Scriba G.K.E., Electrophoresis 24 (15) 2409-2421 (2003).
[19] Amini A, Electrophoresis, 22 (15), 3107-3130 (2001).
[20] de Boer T., de Zeeuw R.A., de Jong J., Ensing K., Electrophoresis 21 (15), 3220-3239
(2000).
[21] Wang A.B. Fang Y.Z., Electrophoresis, 21 (7), 1281-1290 (2000).
[22] Zemann A.J., TrAC Trends Anal Chem, 20 (6-7), 346-354 (2001).
[23] Lacroix M., Poinsot V., Fournier C., et al. Electrophoresis 26 (13), 2608-2601 (2005).
[24] Smyth W.F., Electrophoresis 27 (11), 2051-2062 (2006).
[25] Poole S.K., Patel S., Dehring K., Workman H., J. Chrom. A, 1037 (1-2), 445-454
(2004).
[26] Hudson J., Golin M., Malcolm M., Whiting C., Can. Soc. Forens. Sci. J., 31 (1), 1-19
(1998).
[27] Esaka, Y., Okumura, N., Uno, B., Goto, M., Analytical Sciences 17 (1), 99-102 (2001).
[28] Yuqin L, Shuya C, Yuqiao C, Xingguo C, Anal. Chim. Acta. 508, 17-22 (2004)
[29] Leung, G. N. W., Tang, H. P. O., Tso, T. S. C., J. Chromatogr. A, 738, 141-154 (1996).
[30] Cherkaoui. S., Varesio, E., Christen, P., Veuthey, J.L., Electrophoresis 19 (16-17),
2900-2906 (1998).
[31] Cantú, M. D., Hillebrand, S., Costa Queiroz, M. E. et al, J. Chromatogr. B 799, 127-
132 (2004)
[32] Cherkaoui S., Veuthey J.L., Analysis, 27, 765-771 (1999).
[33] Riekkola M.L., Jisilli M., Porras S.P., Valko I.E. J. Chromatogr. A, 892 (1-2), 155-170
(2000).
[34] Matysik F.M., Electrophoresis 23 (3), 400-407 (2002).
[35] Fillet M., Servais A.C., Crommen J. Electrophoresis 24 (10), 1499-1507 (2003).
[36] Porras S.P., Kenndler E. J. Chromatogr. A, 1037 (1-2) 455-465 (2004).
[37] Bjornsdottir I., Hansen S.H., J. Pharm. & Biomed. Anal. 13, 1473-1481 (1995).
[38] Bjornsdottir I., Hansen S.H. J. Chromatogr. A. 711, 313-319 (1995).
[39] Cherkaoui S., Varesio E., Christen P., Veuthey J.L. Electrophoresis, 19, 2900-2906
(1998).
84
[40] Servais A.C., Fillet M., Chiap P., et al., J. Sep. Sci., 25, 1087-1095 (2002).
[41] Porras S.P., Reikkola M-L., J. Chromatogr. A., 905, 259-268 (2001).
[42] Siren H., Hiissa T., Min Y., Analyst, 9, 1561-1568 (2000).
[43] Hedeland Y., Hedeland M., Bondesson U., Petterson C., J. Chromatogr. A. 984, 261-
271 (2003).
[44] Pappas T.J., Gayton-Ely M., Holland L.A. Electrophoresis 26 (4-5), 719-734 (2005).
[45] Molina M., Silva M., Electrophoresis 23 (22-23), 3907-3921 (2002).
[46] Pyell U., Fresenius J. Anal. Chem. 371 (6) 691-703 (2001).
[47] Smith R.D., Barinaga C.J., Udseth H.R. Anal. Chem., 60, 1948-1952 (1988).
[48] Smyth W.F., Electrophoresis 27 (11), 2051-2062 (2006).
[49] Ohnesorge J., Neususs C., Watsig H., Electrophoresis 26 (21), 3973-3987 (2005).
[50] Schmitt-Kopplin P., Englmann M., Electrophoresis 26 (7-8), 1209-1220 (2005).
[51] Smyth W.F., Electrophoresis 26 (7-8), 1334-1357 (2005).
[52] Shamsi S.A., Miller B.E., Electrophoresis 25 (23-24), 3927-3961 (2005).
[53] Issaq H.J., Janini G.M., Chan K.C., Veenstra T.D., J. Chromatogr. A. 1053 (1-2), 37-42
(2004).
[54] Tu J., Anderson L.N., Dai J et al, J Chromatogr B, 789(2), 323-335 (2003).
[55] Wong K.S., Kenseth J., Strasburg R., J. Pharm. Sci., 93 (4), 916-931 (2004).
[56] Wehmeyer K.R., Tu J., Yin Y.K., King S., Stella M., Stanton D.T., Kenseth J., Wong
K.S., LC GC North America SS90-SS95 (2004).
[57] Reetz M.T., Kuhling K.M., Deege A., Hinrichs H., Belder D., Angewandte Chemie 39
(21), 3891-3893 (2000).
[58] Zhong W., Yeung E.S., Electrophoresis 23 (17), 2996-3005 (2002).
[59] Zhang Y.H., Gong X.Y., Zhang H.M., Larock R.C, J. Comb Chem 2 (5) 450-452
(2000).
[60] Marsh A., Altria K.D., Chromatographia. 64 (5-6), 327-333 (2006).
[61] Pang H.M., Kenseth J., Coldiron S., Drug Discovery Today 9 (24), 1072-1080 (2004).
[62] Harrison DJ, Manz A, Fan ZH et al. Anal Chem 64, 1926-1932 (1992).
[63] Manz A, Harrison DJ, Verpoorte EMJ et al. J Chromarogr, 593, 253-258 (1992).
[64] Yan H, Ho-Ming P, Yeung ES, J Chromatogr A, 894 (1-2), 179-190 (2000).
[65] Guihen E, Glennon JD, J Chromatogr A, 1071 (1-2), 223-228 (2005).
[66] Ding SH, Xu JJ, Zhang WJ, HY Chen, Talanta, 70(3), 572-577 2006.
[67] Denola N.L., Quiming N.S., Catabay A.P., Saito Y., Jinno K. Electrophoresis 27 (12),
2367-2375 (2006).
[68] Koppenhoefer B., Zhu X., Jakob A., Wuerthner S., Lin B., J. Chromatogr. A, 875 (1-2),
135-161 (2000).
[69] Rizzi A., Electrophoresis 22, 3079-3106 (2001).
85
[70] Haginaka J., J. Chromatogr. A. 875 (1-2), 235-254 (2000).
[71] Chiou C-S, Shih J-S. Anal Chim Acta. 360 (1-3), 69-76 (1998).
[72] Fanali S., Aturki Z., et al J. Chromatogr. A, 838, (1-2), 223-235 (1999).
[73] Blanco M., Valverde I., Trac-Trends Anal. Chem. 22 (7) 428-439 (2003).
[74] Fillet M., Hubert P., Crommen J. Electrophoresis 19, 2834-2840 (1998).
[75] Evans C.E., Stalcup A.M., Chirality 15 (8), 709-723 (2003).
[76] Zhou L., Thompson R., Song S., et al J. Pharm. Biomed. Anal. 27 (3-4) 541-553
(2002).
[77] Kuhn R., Stoecklin F., Erni F. Chromatographia, 33 (1-2), 32-36 (1992).
[78] Iványi T., Pal K, Lázár I., et al, J. Chromatogr. A 1028, 325–332 (2004).
[79] Fanali S., Cartoni C., Desiderio C. Chromatographia 54 (1-2), 87-92 (2001).
[80] Desederio C., Fanali S., J. Chromatogr. A. 807 (1), 37-56 (1998).
[81] Ha P.T.H., Van Schepdael A., Roets E., Hoogmartens J. J. Pharm.Biomed. Anal. 34 (5-
10), 861-870 (2004).
[82] Aboul-Enein H.Y., Ali I., Chromatographia 52 (11-12), 679-691 (2000).
[83] Bortocan R., Bonato P.S., Electrophoresis 25 (16) 2848-2853 (2004).
[84] Park H., Lee S., Kang S., Jung Y., Jung S. Electrophoresis 25 (16), 2671-2674 (2004).
[85] Budanova N., Shapovalova E., Lopatin S. et al, Chromatographia 59 (11-12) 709-713
(2004).
[86] Quan Z., Song Y., Feng Y., et al, Anal Chim Acta. 528 (1), 101-106 (2005).
[87] Millet M.C., J. Chromatogr. B., 797 (1-2), 131-159 (2003).
[88] Tesarova E., Sevcik J., Gag B., Armstrong D.W. Electrophoresis 25 (16), 2693-2700
(2004).
[89] Dobashi A., Ono T., Hara S., Yamaguchi J., Anal. Chem. 61 (17), 1984-1986 (1989).
[90] Terabe S., Shibata M., Miyashita Y.J., J. Chromatogr A. 480, 403-411 (1989).
[91] Tickle D.C., Okafo G.N., Camilleri P., Anal. Chem. 66 (23) 4121-4126 (1994).
[92] Otsuka K., Terabe S., J. Chromatogr. A., 875, 163-178 (2000).
[93] Aiken J.H., Huie C.W., Chromatographia, 35 (7-8), 448-450 (1993).
[94] Pascoe R., Foley J., Analyst 127 (6), 710-714 (2002).
[95] Mertzman M.D., Foley J.P., Electrophoresis 25 (9), 1188-1200 (2004).
[96] Mertzman M.D., Foley J.P. Electrophoresis 25 (18-19), 3247-3256 (2004).
[97] Zheng Z.X., Lin J.M., Huie C.W. et al Electrophoresis 25 (18-19), 3263-3269 (2004).
[98] Kahle K.A., Foley J.P., Electrophoresis 27 (4), 896-904 (2006).
[99] Dose E.V., Guiochon G.A., Anal. Chem. 63 (11), 1154-1158 (1991).
[100] Ross G.A., J. Chromatogr. A. 718 (2), 444-447 (1995).
[101] Shihabi Z.K., Hinsdale M.E., Electrophoresis 16 (11), 2159-2163 (1995).
[102] Schaeper J.P., Sepaniak M.J., Electrophoresis 21 (7), 1421-1429 (2000).
86
[103] Mayer B.X., J. Chromatogr. A., 907, 21-37 (2001).
[104] Altria K.D., J. Pharm Biomed. Anal. 31 (3), 447-453 (2003).
[105] British Pharmacopoeia 2005, Volume 2, p1177.
[106] Aurora-Prado M.S., Silva C.A., Altria K.D., J. Chromatogr. A., 1051 (1-2), 291-296
(2004).
[107] Lehmann S.V., Bergholdt A.B., J. Chromatogr. A. 1011 (1-2), 203-211 (2003).
[108] Jamali B., Lehmann S.V., J. Pharm Biomed. Anal, 34, 463-472 (2004).
[109] Pajchel G, Michalska K, Tyski S., J. Chrom A. 1032 (1-2), 265-272 (2004).
[110] ICH, Q3A(R). Federal Register. 2000; 65 (140): 45085-45090.
[111] Avdeef A., Current Topics Med. Chem. 1(4), 277-351 (2001).
[112] Caliaro G.A., Herbots C.A., J. Pharm Biomed. Anal., 26 (3), 427-434 (2001).
[113] de Nogales V., Ruiz R., Rosés M., et al, J. Chromatogr. A, 1123 (1), 113-120 (2006).
[114] Wan H., Holmén A., Någård M. Lindberg W., J. Chromatogr. A, 979 (1-2), 369-377
(2002).
[115] Ornskov E., Linusson A., Folestad S., J. Pharm Biomed Anal, 33 (3), 379-391 (2003).
[116] Geiser L., Henchoz Y., Veuthey J.L. et al, J. Sep. Science, 28 (17), 2374-2380 (2005).
[117] Berthod A., Carda-Broch S., J. Chromatogr. A, 1037 (1-2), 3-14 (2004).
[118] Hansch C., Leo A., Substituent Constants for Correlation Analysis in Chemistry and
Biology, John Wiley and Sons: New York, 1979.
[119] Sangster, J. J. Phys. Chem. Ref. Data, 18, 1111-1229 (1989).
[120] Chen N., Zhang Y., Terabe S. Nakagawa T., J. Chromatogr. A, 678 (2) 327-332 (1994).
[121] Herbert B.J., Dorsey J.G., Anal. Chem. 67 (4) 744-749 (1995).
[122] Poole S.K., Patel S., Dehring K., Workman H., Dong J., J.Chromatogr. B, 793 (2), 265-
274 (2003).
[123] Johnson B.D., Grinberg N., Bicker G., et al J. of Liquid Chrom. & Rel. Technologies,
20 (2), 257-272 (1997).
[124] Moore D.E., Miao W.G., Benikos C., J. Pharm Biomed. Anal., 34 (1), 233-238 (2004).
[125] Kelly M.A., Altria K.D., Clark B.J., J.Chromatogr. A, 781 (1-2), 67-71 (1997).
[126] Fritz J.S., J. Chromatogr. A, 884 (1-2), 261-275 (2000).
[127] Gong X.Y., Shen Y., Mao B., J. Liq. Chrom. Rel. Tech, 27 (4), 661-675 (2004).
[128] Broderick MF, Donegan S, Power J, Altria KD, J. Pharm. Biomed. Anal. 37, 877-884
(2005).
[129] Hansen, S.H., Electrophoresis 24, 3900-3907 (2003).
[130] Marsh A, Clark BJ, Broderick M, Power J, Donegan S. Altria KD, Electrophoresis 25,
3970-3980 (2004).
[131] Huie C.W., Electrophoresis 27, 60-75 (2006).
[132] Terabe S., Otsuka K., lchikawa K., Tsuchiya A., Ando T.,Anal. Chem. 56, 111 (1984).

87
[133] Ishihama Y., Okada Y., J. Chromatogr. 608, 23-29 (1992).
[134] Hansen S.H., Gabel-Jenson, C., Traffic Mohamed El-Sherbiny, D., Trends Anal. Chem.
20, 614-619 (2001).
[135] Pyell, U., J. Chromatogr. A 1037, 479-490 (2004).
[136] Cherkaoui, S., Veuthey, J.L., J. Sep. Sci. 25, 1073-1078 (2002).
[137] Altria K.D., J. Chromatogr. A, 844, 371-386 (1999).
[138] Hansen S.H., Gabel-Jensen, C., Pedersen-Berjaard, S., J. Sep. Sci. 24, 643-650 (2001).
[139] Hansen S.H., Sheribah Z.A., J. Pharm. Biomed. Anal. 39, 322-327 (2005).
[140] Gong S.X., Bo T., Huang L., Li K.A., Liu H.W., Electrophoresis 25 (7-8), 1058-1064
(2004).
[141] Iqbal R., Asad S., Rizvi A., et al, J. Chromatogr. A. 1043 (2), 291-302 (2004).
[142] Mertzman M.D., Foley J.P., J Chromatogr. A, 1073 (1-2), 181-189 (2005).
[143] Mertzman M.D., Foley J.P., Electrophoresis 26 (21), 4153-4163 (2005).
[144] Schoftner R., Buchberger W., J. Sep. Sci. 26, 1247-1252 (2003).
[145] Marsh A., Altria K.D., Clark B.J., Electrophoresis 25, 1270-1278 (2004).
[146] Cigic I.K., Gucek M., Zubancic-Klali L., Pihlar B., J. Sep. Sci. 26, 1253-1258 (2003).
[147] Huang H.Y., Lai Y.C., Chiu C.W., Yeh J.M., J. Chromatogr. A. 993 (1-2) 153-164
(2003).
[148] Sanchez J.M., Salvado V., J. Chromatogr. A. 980, (1-2) 241-247 (2002).
[149] Wen T., Zhao X., Lou Guoan et al Talanta 71, 854-860 (2007).
[150] Pouthree K, Soonthorntantikul W et al Electrophoresis 28, 3705-3711 (2007).
[151] Nozal L, Lourdes A, Simonet BM et al Electrophoresis 26, 4439-4445 (2006).
[152] Yang X, Xia Y, Tao C et al Electrophoresis 28, 1744-1751 (2007).
[153] Furlanetto S., Orlandini S., Marras A.M., et al. Electrophoresis 27 (4), 805-818 (2006).
[154] Harang V., Eriksson J., Sanger-van-Greind C.E., et al Electrophoresis 25, 80-93
(2004).
[155] Fatemi M.H., J. Chromatogr. A 1022, 221-229 (2003).
[156] Miola M. F., Snowden M.J., Altria K.D., J. Pharm. Biomed. Anal. 18, 785-797 (1998).
[157] Altria K.D., Clark B.J., Mahuzier P.E., Chromatographia 52, 758-768 (2000).
[158] Cherkaoui S., Veuthey J.L., Cahours X., Electrophoresis 23, 336-342 (2002).
[159] Lo Y., Bo T., Li M., et al. J. Liq. Chromatogr. Related. Tech. 26, 1719-1730 (2003).
[160] Fogarty B., Dempsey E., Regan F., J. Chromatogr. A 1014, 129-139 (2003).
[161] Pedersen-Berjaard S., Gabel-Jensen, C., Hansen S.H., J. Chromatogr. A 897, 375-381
(2000).
[162] Miksik I., Deyl Z., J. Chromatogr. A 709, 11-19 (1998).
[163] Boso R.L., Bellini M.S., Miksik I., Deyl Z., J. Chromatogr. A 709, 11-19 (1995).
[164] Zhou M. X., Foley J.P., Electrophoresis 25, 653-663 (2004).
88
[165] Gong S.J., Benko M.H., Hallberg R.K., Steele K.P., J. Chromatogr. A 744, 141-146
(1996).
[166] Gabel-Jensen C., Hansen S.H., Pedersen-Bjergaard S., Electrophoresis 22, 1330-1336
(2001).
[167] Klampfl C.W., Leitner T., J. Sep. Sci, 26, 1259-1262 (2003).
[168] Hoffman H., Phys. Chem. 100, 1109-1117 (1996).
[169] Szucs R., Van Hove E., Sandra P., J. High Resolut. Chromatogr. 19, 189-192 (1996).
[170] Siren H., Kartlunen A., J Chromatogr. B 783, 113-124 (2003).
[171] Ivanova M., Puinti A., Marziali E., Kenndler E, et al Electrophoresis 24, 992-998
(2003).
[172] Pomponio R., Gotti R., Luppi B., Cavrini V., Electrophoresis 24, 1658-1667 (2003).
[173] Klampfl C.W., Electrophoresis 24, 1537-1543 (2003).
[174] Vomastova L., Miksik I., Deyl Z., J. Chromatogr. B 681, 107-113 (1996).
[175] Mahuzier P.E., Altria K.D., Clark B.J., Bryant S.M., Electrophoresis 22, 3819-3823
(2001).
[176] Mertzman M.D., Foley J.P., Electrophoresis 25, 723-732 (2004).
[177] Fu X., Lu J., Zhu A., J. Chromatogr. A 735, 353-356 (1996).
[178] Miksik I., Gabriel J., Deyl Z., J. Chromatogr. A 772, 297-303 (1997).
[179] Jiangping X., Jiyou Z., Huanxiang L., et al. J. Pharm. Biomed Anal. 36 (1), 1-8 (2004).
[180] Seelanan P., Srisa-art M., Petsom A., Nhujak T., Anal. Chim. Acta 570 (1), 8-14 (2006).
[181] Bo T., Yang X.D., Lui H.W., Li K.A., Xu L.Z., J. Sep. Sci. 26 (1-2), 133-136 (2003)
[182] Chang L.C., Chang H.T., Sun S.W., J. Chromatogr. A 1110 (1-2), 227-234 (2006).
[183] Pomponio R., Gotti R., Fiori J., Cavrini V., J. Chromatogr. A 1081 (1), 24-30 (2005).
[184] Zhang H, Tian K, Tang J et al J Chromatogr. A 1129, 304-307 (2006).
[185] Gluck S.J., Benko M.H., Hallberg R.K., Steele K.P., J Chromatogr. A 744, 141-146
(1996).
[186] Mahuzier P.E., Altria K.D., Clark B.J., J. Chromatogr. A 924, 465-470 (2001).
[187] Pedersen-Bergaard S., Naess O., Moestue S., J. Chromatogr. A 876, 201-211 (2000).
[188] Pedersen-Bergaard S., Chromatographia 52, 593-598 (2000).
[189] Nhujak T., Saisuwan W., Srisa-art M., Petsom A., J. Sep. Sci. 29, 666-676 (2006).
[190] Huang H.Y., Lien W.C., Chiu C.W., J. Sep. Sci. 28 (9-10), 973-981 (2005).
[191] Huang H.Y., Chiu C.W., Chen Y.C., Yeh J.M., Electrophoresis 26 (4-5), 895-902
(2005).
[192] Zhai Z.D., Luo X.P., Shi Y.P., Anal. Chim. Acta 561, 119-125 (2006).
[193] Quirino J.P., Terabe S., Otsuka K., Vincent B., J. Chromatogr. A 838, 3-10 (1999).
[194] Puig P., Borull F., Aguilar C., Calull M. J., Chromatogr. B 831 (1-2), 196-204 (2006).
89
[195] Puig P., Borull F., Aguilar C., Calull M., Chromatographia 62 (11-12), 603-610
(2005).
[196] Jia Z., Mei L., Lin F., et al, J. Chromatogr. A 1007, 203-208 (2003).
[197] Jiang J., Gong S.X., Liu H.W., Zhang Y., Deng Y.L., Chin. Chem. Lett. 15 (7), 831-833
(2004).
[198] Poole S.K., Durham D., Kibbey C., J. Chromatogr. B 745, 117-126 (2000).
[199] Melin V., Perret D., Electrophoresis 25 (10-11), 1503-1510 (2004).
[200] Zhao Y., Ming Y., Zhang H., et al, Chromatographia 62, 611-615 (2005).
[201] Zhang J., Xie J., Lui J., et al, Electrophoresis 25(1), 74-79 (2004).
[202] Altria K.D., Broderick M.F., Donegan S., Power J., Electrophoresis 25, 645-652
(2004).
[203] Watari H., J. Chromatogr. A, 780, 93-102 (1997).
[204] Fung C.A.K.F., Post S., J. Liq. Chromatogr. Related. Tech. 24, 1133-1151 (2001).
[205] Mendonca CRB, Bica CID, Piatnicki CIS, et al, Electrophoresis 26 (4-5), 858-866
(2005).
[206] Somsen GW, Mol R, De Jong GJ, Anal. Bioanal. Chem. 384, 31-36 (2006).
[207] Mol R, De Jong GJ, Somsen GW, Anal Chem, 77, 5277-5280, (2005).
[208] Himmelsbach M, Haunschmidt M, et al Anal. Chem., 79, 1564-1568, (2007).
[209] Himmelsbach M, Haunschmidt M, et al, J. Chromatogr. A, 1159, 58-62 2007.
[210] Tu J., Halsall B., Seliskar C.J., et al, J. Pharm. Biomed. Anal. 38(1), 1-7 (2005).
[211] Debusschere L., Demesmay C., Rocca J.L., et al. J. Chromatogr. A 779 (1-2), 227-233
(1997).
[212] Mrestani Y., Reinhart N., J. Chromatogr. A 871 (1-2), 439-448 (2000).
[213] Mahuzier PE, Clark BJ, Crumpton AJ, Altria K.D., J. Sep Sci. 24 (9), 784-788 (2001).
[214] Okamoto H., Nakajima T., Ito Y., et al., J. Pharm. Biomed. Anal. 37 (3), 517-528
(2005).
[215] Tripodi V, Flor S, Carlucci A, Lucangioli S, Electrophoresis, 27, 4431-4438 (2006).
[216] Aurora-Prado M.S., Silva C.A., Tavares M.F.M., Altria KD, J Chromatogr A 1051, 291-296
(2004).
[217] Wen T., Zhao X., Lou G.A., et al. Chin. Chem. Lett. 16 (11), 1499-1502 (2005).
[218] Harang V., Jacobsson S.P., Westerlund D., Electrophoreisis 25, 1792-1809 (2004).
[219] Rappel C., Galanski M., Yasemi A., Habala L., Keppler B.K., Electrophoresis 26, 878-884
(2005).
[220] Macia A., Borrill F., Calull M., Aguilar C., Electrophoresis 26, 970-979 (2005).
[221] Macia A., Borrill F., Calull M., Aguilar C., Chromatographia 63 (3-4), 149-154 (2006).
[222] Aiken J.H., Huie C.W., Chromatographia 35, 448-450 (1993).
[223] Kahle K, Foley JP, Electrophoresis, 28, 3024-3040 (2007).
90
[224] Threeprom J, Anal. Sci., 23, 1071-1075 (2007).
[225] Threeprom J, Chromatographia, 65, 569-573, (2007).
[226] Kahle K, Foley JP, Electrophoresis, 28, 1723-1734, (2007).
[227] Kahle K, Foley JP, Electrophoresis, 28, 2644-2657, (2007).
[228] Bitar Y, Holzgrabe U, Electrophoresis, 28, 2693-2700, (2007).
[229] Yanfang Z., Xingpin L., Zongde Z., J. Pharm. Biomed. Anal. 40, 157-161 (2006).
[230] Luo XP, Zhai ZD, Zhao YF et al., Anal. Bioanal. Chem. 384(5), 1254-1258 (2006).
[231] Wenhua G., Yaowen C., Yegao Y., et al, Biomed. Chromatogr. 18, 826-832 (2004).
[232] Bermundo E., Ruiz-Calero V., Puignou L., Galceran M.T., Electrophoresis 25, 3257-3262
(2004).
[233] Huang H.Y., Chuang C.L., Chui C.W., Chung M.C., Electrophoresis, 26, 867-877 (2005).
[234] Huang H.S., Chuang C.L., Chiu C.W., Yeh J.M., Food Chem. 89, 315-322 (2005).
[235] Sun S.W., Yeh P.C., J. Pharm. Biomed. Anal. 36, 995-1001 (2006).
[236] Breadmore M.C., Prochazkova A., Thorman W., J. Chromatogr. A. 1014, 57-70 (2003).
[237] Li Q., Chang C.K., Huie C., Electrophoresis 26(4-5), 885-894 (2005).
[238] Leonard S., Van Schepdael A., Ivanyi T., et al, Electrophoresis 26 (3), 627-632 (2005).
[239] Cook H.A., Klampfl C.W., Buchberger W., J. Chromatogr. A. 1085, 164-169 (2005).
[240] Hadjmohammadi M.R., Safa F., Asian J. Chem. 17 (1-2), 681-688 (2005).
[241] Huang HY, Huang IY, et al Electrophoresis, 28, 1735-1743 (2007)
[242] Huang HY, Lien WC, Huang IY, Electrophoresis, 26, 3202-3209, (2006).
[243] Wu CH, Chen TH, Huang KP et al, Electrophoresis, 28, 3691-3696 (2007).
[244] Zhang H, Zhu J, Qi S et al, Biomed. Chromatogr., 21, 1083-1087 (2007).
[245] Bustamante-Rangel M, Delgado-Zamarreno MM et al, J. Chromatog.r A, 1125, 270-
273 (2006).
[246] Lu W, Chen Y, Zhang Y et al, J. Chromatogr. B, 860, 127-133 (2007).
[247] Wei S, Lin J., Li H, Lin JM, J. Chromatogr. A. 1163, 333-336 (2007).
91
Chapter Three
Chiral HPLC Techniques using Chiral Stationary
Phases and Chiral Mobile Phase Additives

92
3.1 Introduction Many pharmaceutical molecules are chiral, i.e. molecules which are non-
superimposable on their mirror images due to an element of chirality in the molecular
structure. The chirality of a molecule can be attributed to;
a) The presence of a chiral centre,
b) The lack of an axis of symmetry or,
c) The lack of a plane of symmetry.
The two mirror image forms of chiral molecules, called enantiomers, possess similar
chemical and physical properties except that the two enantiomers rotate plane polarised
light in opposite directions. Figure 3.1 shows both isomers of ibuprofen with the chiral
centre marked.
C*
COOH
HH3C
C*
COOH
CH3H
(R)-ibuprofen (S)-ibuprofen
Figure 3.1 R and S enantiomers of ibuprofen showing the chiral centre.
While some drug enantiomers have the same pharmacological effect on the body and
may also display similar pharmacokinetics, it is possible that both of these forms may
produce different effects. Both enantiomers might be equally effective or one might be
more effective, in some cases one enantiomer might produce the desired
pharmacological effect while the other could cause different levels of unwanted side
effects. A well known example of this is the enantiomeric drug thalidomide, which was
prescribed to pregnant women to aleviate morning sickness. While one enantiomer
produced the desired effect, the second enantiomer caused many of those using the drug

93
to give birth to children with severe defects. A second and less extreme example is
ibuprofen, a non-steroidal anti-inflammatory whose S-(+)-enantiomer exhibits
pharmacological effects while R-(−)-ibuprofen seems to be inactive [1].
Due to the possibility of contradictory pharmacological effects of drug enantiomers, one
of the most important areas of pharmaceutical analysis is the separation, detection and
quantitation of enantiomers in both bulk drug products and formulations. Many
separation and detection methods have been used including TLC and GC, with CE
emerging in the last two decades as an extremely powerful enantiomeric separation tool.
HPLC however remains the most commonly used method for chiral pharmaceutical
analysis with literally thousands of individual chiral separations reported.
Enantiomeric separations can be achieved by liquid chromatographic means provided
that the system used is asymmetric i.e. chiral. This can be achieved in a number of ways
the most common of which is to use a chiral stationary phase. A second type of chiral
system can be achieved by using a chiral mobile phase with an achiral stationary phase,
while a combination of these two techniques is less frequently used.
Chiral separation methods can be divided into two categories; one is a direct method
based on the formation of diastereomeric complexes with the chiral stationary or mobile
phase. The other is an indirect method based on the formation of diastereomers by
reaction with an achiral reagent with separation then possible using achiral separation
methods. A disadvantage of using the indirect method is that enantiomers may require
complex derivatising procedures and induce inaccurate determinations of enantiomeric
ratios due to chiral impurities in the derivatising agent and/or racemising during the
procedure.
When using chiral stationary phases, enantiomeric resolution relies on the formation of
transient diastereoisomers on the surface of the column packing [2]. The compound
which forms the most stable diastereoisomer will be most retained, whereas the opposite
enantiomer will form a less stable diastereoisomer and will elute first. Chiral mobile
phases can form diastereomeric complexes with analyte enantiomers by the use of chiral
ion-pairing reagents, formation of inclusion complexes with cyclodextrins and using
ligand exchange phases.
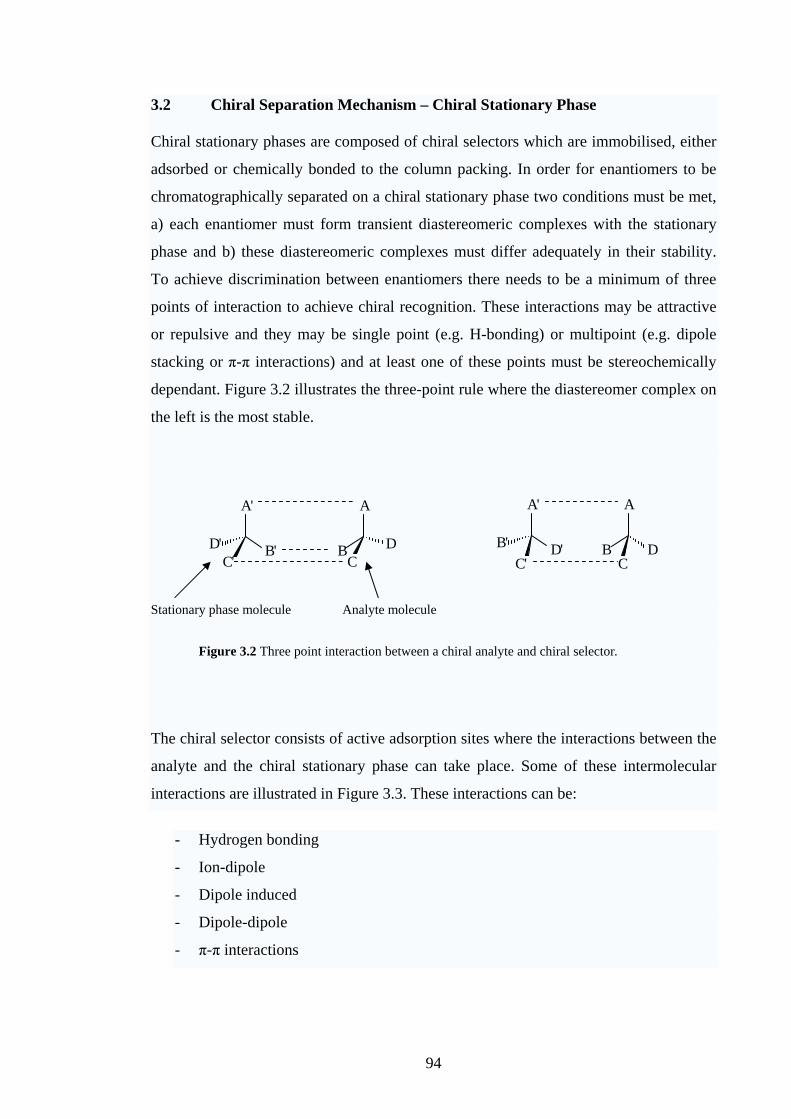
94
3.2 Chiral Separation Mechanism – Chiral Stationary Phase
Chiral stationary phases are composed of chiral selectors which are immobilised, either
adsorbed or chemically bonded to the column packing. In order for enantiomers to be
chromatographically separated on a chiral stationary phase two conditions must be met,
a) each enantiomer must form transient diastereomeric complexes with the stationary
phase and b) these diastereomeric complexes must differ adequately in their stability.
To achieve discrimination between enantiomers there needs to be a minimum of three
points of interaction to achieve chiral recognition. These interactions may be attractive
or repulsive and they may be single point (e.g. H-bonding) or multipoint (e.g. dipole
stacking or π-π interactions) and at least one of these points must be stereochemically
dependant. Figure 3.2 illustrates the three-point rule where the diastereomer complex on
the left is the most stable.
A'
B'D'C'
A
B DC
A'
D'B'C'
A
B DC
Stationary phase molecule Analyte molecule
Figure 3.2 Three point interaction between a chiral analyte and chiral selector.
The chiral selector consists of active adsorption sites where the interactions between the
analyte and the chiral stationary phase can take place. Some of these intermolecular
interactions are illustrated in Figure 3.3. These interactions can be:
- Hydrogen bonding
- Ion-dipole
- Dipole induced
- Dipole-dipole
- π-π interactions

95
The type of chiral stationary phases used for separating a class of enantiomer is often
very specific. There are numerous chiral stationary phases commercially available along
with many specialist phases which have been prepared for specific uses in research.
Studying the structure of chiral phases and visualising the potential interactions with the
analyte can narrow down the choice significantly.
R'
H N H
CR''
O
NH
N
O
H
H
O
Figure 3.3a. π-π interactions (arrow) and dipole-dipole interactions (dashed line) between a chiral stationary phase and a chiral analyte.
OH
NO2
O
H
Figure 3.3b. Inclusion and hydrogen bonding (dashed line) between an analyte and a conical cyclodextrin.

96
3.3 Types of Chiral Stationary Phases
3.3.1 ‘Brush-Type’ or ‘Pirkle Phases’
These chiral stationary phases are composed of small molecules usually with π-
interactive groups which are bonded to a silica support and are designed to give strong
three point interactions with one of an enantiomer pair. There are two main types of
stationary phases, π-acceptor or π-donor phases. The most common π-acceptor phase is
capable of separating a large range of compounds which include a π-donor aromatic
group.
3.3.2 Helical Polymers such as Cellulose and its Derivatives.
Cellulose columns use a combination of attractive interactions and inclusion complexes
to produce a separation. Cellulose derivatives such as triacetyl cellulose and cellulose
tribenzoate are available as bulk material as well as coated onto silica. The range of
enantiomers that can be separated by cellulose stationary phases and its derivatives is
the broadest of all chiral stationary phase groups although the retention and separation
mechanisms of helical polymers are complex and not yet fully understood.
3.3.3 Cavity Phases.
Cyclic chiral selectors such as cyclodextrins and crown ethers are bonded to silica
support phases where they can undergo host-guest complexation with small molecules
in the ring structure of the selector. Cyclodextrins are cyclic oligosaccharides containing
from six to twelve chiral glucose units. Three types; alpha, beta & gamma
corresponding to 6, 7 and 8 glucose units respectively are commonly available. The
arrangement of a beta cyclodextrin is shown in Figure 3.4. The cyclodextrin molecule
forms a truncated conical cavity the diameter of which depends on the number of
glucose units. Primary hydroxyl groups at the narrow rim of the cone and secondary
hydroxyl groups at the wider rim provide chiral binding points and together with the
hydrophobic core of the cone provide a three-point interaction for chiral recognition.
For chiral recognition to occur a portion of the solute molecule must enter the
hydrophobic cavity and a hydrogen-bonding region of the molecule must interact with
the mouth of the cavity. The hydroxyl groups on the cyclodextrins can also be
derivatised by bonding various groups onto the surface hydroxyls of the cyclodextrin
cavity which can extend the area available for chiral interactions.
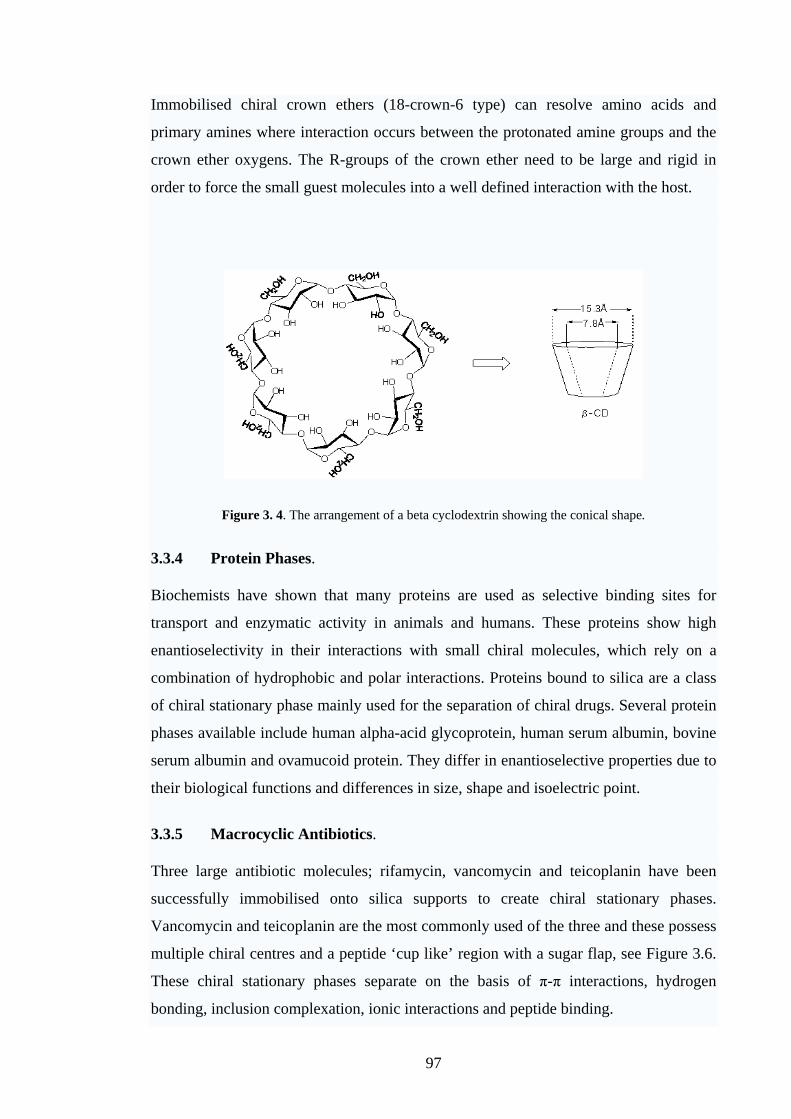
97
Immobilised chiral crown ethers (18-crown-6 type) can resolve amino acids and
primary amines where interaction occurs between the protonated amine groups and the
crown ether oxygens. The R-groups of the crown ether need to be large and rigid in
order to force the small guest molecules into a well defined interaction with the host.
Figure 3. 4. The arrangement of a beta cyclodextrin showing the conical shape.
3.3.4 Protein Phases.
Biochemists have shown that many proteins are used as selective binding sites for
transport and enzymatic activity in animals and humans. These proteins show high
enantioselectivity in their interactions with small chiral molecules, which rely on a
combination of hydrophobic and polar interactions. Proteins bound to silica are a class
of chiral stationary phase mainly used for the separation of chiral drugs. Several protein
phases available include human alpha-acid glycoprotein, human serum albumin, bovine
serum albumin and ovamucoid protein. They differ in enantioselective properties due to
their biological functions and differences in size, shape and isoelectric point.
3.3.5 Macrocyclic Antibiotics.
Three large antibiotic molecules; rifamycin, vancomycin and teicoplanin have been
successfully immobilised onto silica supports to create chiral stationary phases.
Vancomycin and teicoplanin are the most commonly used of the three and these possess
multiple chiral centres and a peptide ‘cup like’ region with a sugar flap, see Figure 3.6.
These chiral stationary phases separate on the basis of π-π interactions, hydrogen
bonding, inclusion complexation, ionic interactions and peptide binding.
98
3.3.6 Ligand-Exchange Phases.
Amino acids bonded to silica or a polymeric stationary phase and loaded with Cu2+ ions
can interact stereoselectively with amino acids in aqueous solution. Steric factors then
determine which of the two complexes is most stable. Ligand-exchange phases are
suited to the separation of amino acids and some β-amino alcohols because these
compounds bear two functional groups adequately spaced.
3.3.7 Chiral Surfactants.
The use of novel stationary phases composed of chiral surfactants bound to silica gel
supports on reversed-phase columns has been reported for the enantioseparation of
racemic N-acylleucine isopropyl esters [3].
3.4 Chiral Separations using Chiral Mobile Phases
Enantiomeric separations can be obtained using conventional achiral columns by
utilising an appropriate chiral mobile phase or mobile phase additive. If a chiral selector
capable of forming an ion-pair or any other stable complex with the enantiomers in a
sample is added to the mobile phase, chiral separation is possible provided there is an
adequate difference between the distribution coefficients (between the chiral mobile
phase and achiral stationary phase) of the diastereomers formed.
The main advantage of using chiral mobile phases is that a wide range of achiral
stationary phase columns are available relatively cheaply compared to chiral columns. It
can be argued however that the long-term cost of using chiral additives in the mobile
phase can be uneconomical. A second advantage of this method is the ability to choose
from a wide variety of chiral selectors one that appears most likely to produce a
separation based on previous experience and/or reported methods. Examination of the
structural and functional group characteristics of the selector molecule and analyte
compound can also help when choosing the chiral additive. Although the use of chiral
mobile phases has received relatively little attention compared to chiral stationary
phases, there have been a number of reports of a variety of chiral additives used with
achiral columns or in conjunction with chiral columns. The main groups of chiral
mobile phase additives are; inclusion complexes i.e. cyclodextrins (chiral crown ethers
99
are too toxic for use as chiral additives), ion pair reagents, ligand exchange reagents and
proteins. Chiral surfactants, micellar solutions and microemulsions have received little
attention for application to chiral HPLC, however they are very popular for chiral
capillary electrophoresis separations.
3.4.1 Cyclodextrins (CDs).
CDs, in particular β-CDs are the most widely used chiral mobile phase additives as they
are relatively cheap, have low UV absorbance, are good solubilisers [4]. A variety of
native and derivatised CDs have been reported to be successful for a range of chiral
separations [5-29]. The use of CDs as chiral mobile phase additives provides a flexible
alternative for the separation of enantiomers, as separations can be performed on achiral
columns which generally yield higher efficiencies and are less expensive than chiral
columns [23]. Derivatisation of hydroxyl groups at the rim of the CD can increase their
solubility and the depth of the hydrophobic cavity can be modified.
The chiral recognition mechanism is the same as for immobilised CDs with the bulky
hydrophobic group of the analyte (mainly bulky aromatic groups) being included in the
enlarged cavity. Dipole-dipole interactions and/or hydrogen bonding between the
hydroxyl groups or introduced functional groups at the rim of the CD and polar
substituents on the analyte complete the three-point interaction necessary for chiral
separation [28] with the formation of an inclusion complex mainly determined by the
relative size of the cyclodextrin cavity [26]. As an example, sulphation of β-CDs gives
the cyclodextrins a negative charge and alters the molecular recognition capabilities of
the native CD. Because of this, electrostatic or ion-pairing interactions between the
analyte enantiomers and the CD can be introduced.
Separation of diastereomeric complexes formed by the analyte and CD can be due to
two dynamic processes;
a) The differences in the distribution coefficients between the chiral mobile phase and
achiral stationary phase of each diastereomer. There must be sufficient retention of the
analyte on the stationary phase for chiral separation to be possible.
b) As CDs can be adsorbed onto the stationary phase packing, enantiomer complexation
with these semi-immobilised CDs can also play a role in enantioseparations. The extent
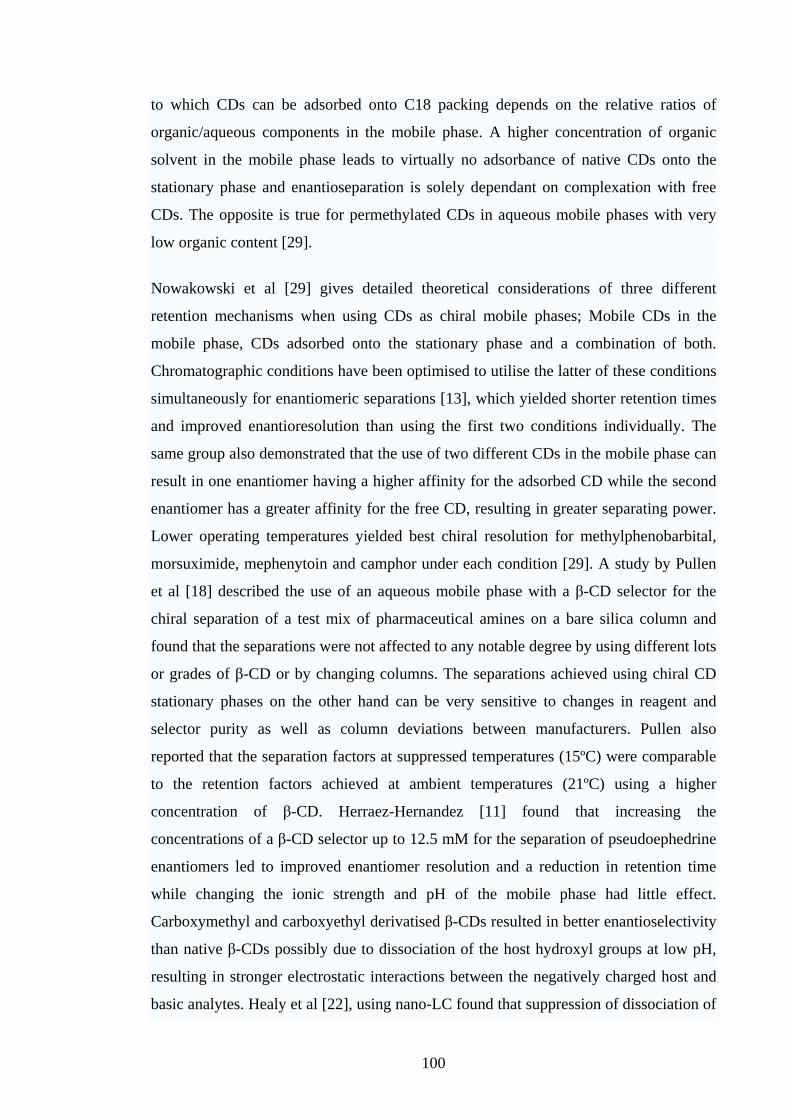
100
to which CDs can be adsorbed onto C18 packing depends on the relative ratios of
organic/aqueous components in the mobile phase. A higher concentration of organic
solvent in the mobile phase leads to virtually no adsorbance of native CDs onto the
stationary phase and enantioseparation is solely dependant on complexation with free
CDs. The opposite is true for permethylated CDs in aqueous mobile phases with very
low organic content [29].
Nowakowski et al [29] gives detailed theoretical considerations of three different
retention mechanisms when using CDs as chiral mobile phases; Mobile CDs in the
mobile phase, CDs adsorbed onto the stationary phase and a combination of both.
Chromatographic conditions have been optimised to utilise the latter of these conditions
simultaneously for enantiomeric separations [13], which yielded shorter retention times
and improved enantioresolution than using the first two conditions individually. The
same group also demonstrated that the use of two different CDs in the mobile phase can
result in one enantiomer having a higher affinity for the adsorbed CD while the second
enantiomer has a greater affinity for the free CD, resulting in greater separating power.
Lower operating temperatures yielded best chiral resolution for methylphenobarbital,
morsuximide, mephenytoin and camphor under each condition [29]. A study by Pullen
et al [18] described the use of an aqueous mobile phase with a β-CD selector for the
chiral separation of a test mix of pharmaceutical amines on a bare silica column and
found that the separations were not affected to any notable degree by using different lots
or grades of β-CD or by changing columns. The separations achieved using chiral CD
stationary phases on the other hand can be very sensitive to changes in reagent and
selector purity as well as column deviations between manufacturers. Pullen also
reported that the separation factors at suppressed temperatures (15ºC) were comparable
to the retention factors achieved at ambient temperatures (21ºC) using a higher
concentration of β-CD. Herraez-Hernandez [11] found that increasing the
concentrations of a β-CD selector up to 12.5 mM for the separation of pseudoephedrine
enantiomers led to improved enantiomer resolution and a reduction in retention time
while changing the ionic strength and pH of the mobile phase had little effect.
Carboxymethyl and carboxyethyl derivatised β-CDs resulted in better enantioselectivity
than native β-CDs possibly due to dissociation of the host hydroxyl groups at low pH,
resulting in stronger electrostatic interactions between the negatively charged host and
basic analytes. Healy et al [22], using nano-LC found that suppression of dissociation of

101
the carboxylic acid group on naproxen by pH control helped to increase its retention and
improved the likelihood of chiral separation using β-CD additives with low pH (approx
pH 3) yielding the best chiral selectivity. It was also found that increasing the CD
concentration up to 20 mM resulted in better resolution but no further improvements
were noted thereafter. Flow rates between 0.5 and 2.0 ml.min-1 did not affect chiral
selectivity.
Deng et al [26] incorporated an ion pair reagent, sodium 1-heptanesulphonate (SHS),
into a chiral β-CD mobile phase when separating the enantiomers of salsolinols and
found that small amounts of SHS significantly enhanced the adsorption of salsolinols
onto a reversed-phase column by increasing their hydrophobicity, resulting in increased
retention and stability of the analyte-CD complexes. When studying the
enantioseparation of some amino acids by reversed-phase HPLC with CD additives in
the mobile phase, Watanabe et al [10] found increasing the acetonitrile concentration in
the mobile phase from 5-20% dramatically reduced retention times and resulted in a
reversal of elution order for the enantiomers when using hydroxypropyl derivatised β-
CDs instead of native β-CDs.
Ye et al [34] used a hydroxypropyl-β-CD to achieve the separation of norgestrel and
found that increasing the concentration of HP-β-CD in the mobile phase had the effect
of reducing retention times and increasing resolution while concentrations of a native β-
CD above 10 mM could not achieve resolution.
Table 3.1 provides a list of many chiral separations achieved on achiral columns using
cyclodextrins as chiral mobile phase additives.
Table 3. 1 Chiral separations on achiral columns using cyclodextrins as mobile phase additives Chiral application Chiral additive Ref Citalopram β-CD [5] Sibutramine β-CD [6] Simendan β-CD [7] Terfenadine β-CD [9] N-t-butyloxycarnonyl amino acids Hydroxypropyl- β-CD and native β-CD [10] Norephedrine, ephedrine, pseudoephedrine, N-methylephedrine and N-methylpseuoephedrine
Methyl-ß-CD, carboxyethyl- β-CD, carboxymethyl- β-CD and hydroxypropyl- β-CD
[11]
Lactic acid Native β-CD, dimethyl- β-CD, trimethyl- β-CD [30] Mandelic acid and its esters
Native and modified alpha, beta and gamma-CD’s and permethylated-CDs
[31]
Methylphenobarbital, mephenytoin, morsuximide and camphor
α-CD, β-CDs and their permethylated derivatives
[13]
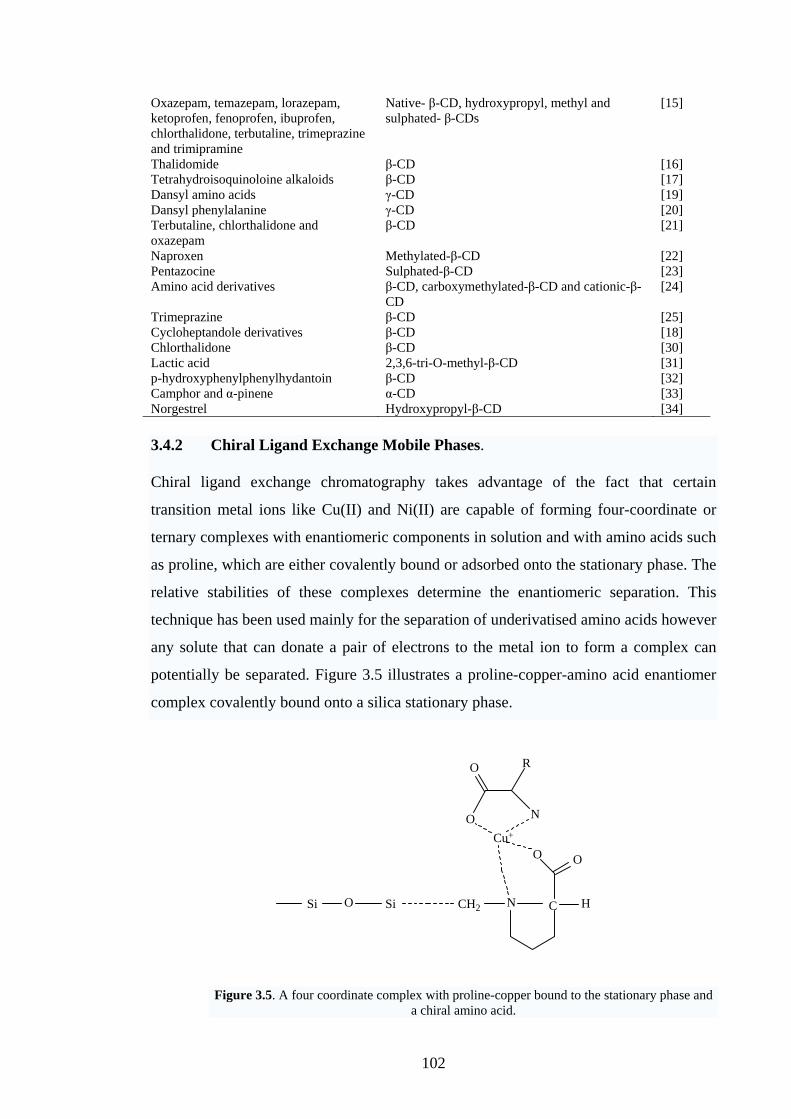
102
Oxazepam, temazepam, lorazepam, ketoprofen, fenoprofen, ibuprofen, chlorthalidone, terbutaline, trimeprazine and trimipramine
Native- β-CD, hydroxypropyl, methyl and sulphated- β-CDs
[15]
Thalidomide β-CD [16] Tetrahydroisoquinoloine alkaloids β-CD [17] Dansyl amino acids γ-CD [19] Dansyl phenylalanine γ-CD [20] Terbutaline, chlorthalidone and oxazepam
β-CD [21]
Naproxen Methylated-β-CD [22] Pentazocine Sulphated-β-CD [23] Amino acid derivatives β-CD, carboxymethylated-β-CD and cationic-β-
CD [24]
Trimeprazine β-CD [25] Cycloheptandole derivatives β-CD [18] Chlorthalidone β-CD [30] Lactic acid 2,3,6-tri-O-methyl-β-CD [31] p-hydroxyphenylphenylhydantoin β-CD [32] Camphor and α-pinene α-CD [33] Norgestrel Hydroxypropyl-β-CD [34]
3.4.2 Chiral Ligand Exchange Mobile Phases.
Chiral ligand exchange chromatography takes advantage of the fact that certain
transition metal ions like Cu(II) and Ni(II) are capable of forming four-coordinate or
ternary complexes with enantiomeric components in solution and with amino acids such
as proline, which are either covalently bound or adsorbed onto the stationary phase. The
relative stabilities of these complexes determine the enantiomeric separation. This
technique has been used mainly for the separation of underivatised amino acids however
any solute that can donate a pair of electrons to the metal ion to form a complex can
potentially be separated. Figure 3.5 illustrates a proline-copper-amino acid enantiomer
complex covalently bound onto a silica stationary phase.
Si O Si CH2 N C H
OOCu+
O
O
N
R
Figure 3.5. A four coordinate complex with proline-copper bound to the stationary phase and a chiral amino acid.
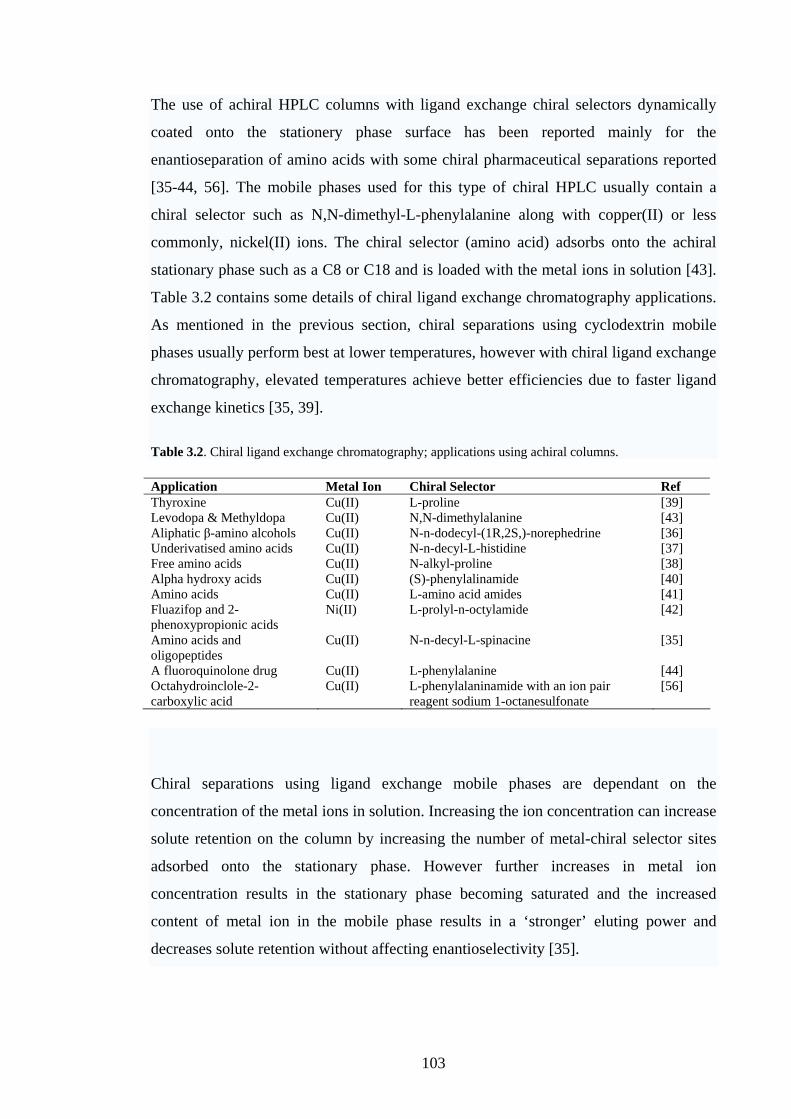
103
The use of achiral HPLC columns with ligand exchange chiral selectors dynamically
coated onto the stationery phase surface has been reported mainly for the
enantioseparation of amino acids with some chiral pharmaceutical separations reported
[35-44, 56]. The mobile phases used for this type of chiral HPLC usually contain a
chiral selector such as N,N-dimethyl-L-phenylalanine along with copper(II) or less
commonly, nickel(II) ions. The chiral selector (amino acid) adsorbs onto the achiral
stationary phase such as a C8 or C18 and is loaded with the metal ions in solution [43].
Table 3.2 contains some details of chiral ligand exchange chromatography applications.
As mentioned in the previous section, chiral separations using cyclodextrin mobile
phases usually perform best at lower temperatures, however with chiral ligand exchange
chromatography, elevated temperatures achieve better efficiencies due to faster ligand
exchange kinetics [35, 39].
Table 3.2. Chiral ligand exchange chromatography; applications using achiral columns.
Application Metal Ion Chiral Selector Ref Thyroxine Cu(II) L-proline [39] Levodopa & Methyldopa Cu(II) N,N-dimethylalanine [43] Aliphatic β-amino alcohols Cu(II) N-n-dodecyl-(1R,2S,)-norephedrine [36] Underivatised amino acids Cu(II) N-n-decyl-L-histidine [37] Free amino acids Cu(II) N-alkyl-proline [38] Alpha hydroxy acids Cu(II) (S)-phenylalinamide [40] Amino acids Cu(II) L-amino acid amides [41] Fluazifop and 2-phenoxypropionic acids
Ni(II) L-prolyl-n-octylamide [42]
Amino acids and oligopeptides
Cu(II) N-n-decyl-L-spinacine [35]
A fluoroquinolone drug Cu(II) L-phenylalanine [44] Octahydroinclole-2-carboxylic acid
Cu(II) L-phenylalaninamide with an ion pair reagent sodium 1-octanesulfonate
[56]
Chiral separations using ligand exchange mobile phases are dependant on the
concentration of the metal ions in solution. Increasing the ion concentration can increase
solute retention on the column by increasing the number of metal-chiral selector sites
adsorbed onto the stationary phase. However further increases in metal ion
concentration results in the stationary phase becoming saturated and the increased
content of metal ion in the mobile phase results in a ‘stronger’ eluting power and
decreases solute retention without affecting enantioselectivity [35].
104
The pH of the mobile phase plays an important role in the separation of amino acid
enantiomers. Increasing the pH favours the formation of ternary stationary complexes
resulting in an increase in the capacity factors of both enantiomers with a corresponding
increase in selectivity [35, 41]. The addition of organic modifiers to ligand exchange
mobile phases has a significant affect on the retention of amino acids and even small
amounts can lead to the loss of column selectivity by weakening the hydrophobic
interactions between the sample and stationary phase [35, 41].
3.4.3 Macrocyclic Antibiotics.
The use of glycopeptide antibiotics as chiral selectors was first introduced in 1994 [53,
54] and have been covalently bonded to achiral stationary phases to form chiral
columns. These macrocyclic antibiotics have also been used as chiral mobile phase
additives on achiral columns [45, 47-52]. Enantioseparation may be possible via
several different mechanisms including π-π complexation, hydrogen bonding, inclusion
in a hydrophobic pocket, dipole stacking, steric interactions, or combinations of these.
While all other chiral selectors avail themselves of the same type of interactions, they
are not all necessarily available in a single chiral selector and in relatively close
proximity to one another. Macrocyclic antibiotics seem to have many of the useful
enantioselectivity properties of proteins and other polymeric chiral selectors without
their inherent problems of instability and low capacities [53]. The most commonly used
antibiotics for chiral stationary phases are vancomycin and teicoplanin, which has also
found use as a chiral mobile phase additives [45, 47-52]. The structure of vancomycin
illustrated in Figure 3.6, contains 18 chiral centres that surround three pockets or
cavities linked by polar amide bonds forming a hydrophobic cleft and ionisable groups;
five aromatic ring structures bridge these strategic cavities and hydrogen donor and
acceptor sites are readily available close to the ring structures. Teicoplanin also shown
in Figure 3.6 can form micellar aggregates due to its hydrophobic acyl side chain while
the side chain can be used to immobilise the chiral selector onto hydrophobic achiral
stationary phases [50, 55]. Other macrocyclic antibiotics utilised as chiral mobile phase
additives are listed in Table 3.3.

105
Teicoplanin Vancomycin
Figure 3.6 Teicoplanin and vancomycin, macrocyclic antibiotics used extensively on chiral columns and less commonly as chiral mobile phase additives.
Haroun et al [50] reported a reversal of elution order of some aromatic amino acid
enantiomers when using teicoplanin as a chiral additive compared to covalently bonded
teicoplanin stationary phases, while the addition of (acetonitrile) and a decrease in pH
decreased solute retention and had a significant affect on enantioselectivity. Guo et al
[47] when using norvancomycim as a chiral additive also reported that acetonitrile
addition had the same effect on the retention of ketoprofen enantiomers. However an
increase in pH resulted in a decrease in the retention factors of both enantiomers.
As with other chiral mobile phase additives, the concentration of macrocyclic antibiotics
in the mobile phase has a significant effect on solute retention and enantioselectivity
with an optimum concentration providing best results above which the separations no
longer improve or deteriorate [47, 48]. The combined use of macrocyclic antibiotics as
chiral selectors bound to stationary supports and as mobile phase additives have been
investigated [48, 49] and have yielded superior results compared to using a chiral
column with an achiral mobile phase.
Table 3.3 Recent chiral separations using macrocyclic antibiotics as a chiral mobile phase additives with achiral columns Application Chiral Additive Ref Dansyl amino acids - [45] Ketoprofen Norvancomycin [47] Warfarin, ketoprofen, flurbiprofen Vancomycin [48] D,L-tryptophan and D,L-dansyl tryptophan Vancomycin [49] Aromatic amino acids Teicoplanin [50] D,L-dansylvaline Vancomycin [51] Dansylated amino acids Macrocyclic antibiotic LY333328 [52]
106
3.4.4 Ion-Pair Additives.
Chiral ion-pairing reagents may be used with enantiomeric compounds to achieve
separations on achiral columns. Ionic interactions between the enantiomers and ion-pair
reagent allows them to be separated by travelling down the column as diastereomeric
ion-pairs with each diastereomer differing in their affinity for the stationary phase.
However ionic interactions alone are not sufficient to provide chiral recognition
according to the three-point rule and additional interactions such as hydrogen bonding,
dipole-dipole and π-π interactions are needed [28]. Steuer et al [57] showed how the
enantiomers of various β-blockers could be resolved using N-benzoxycarbonylglycyl-L-
proline as a chiral mobile phase additive and triethylamine as basic additive. Josefsson
[58] used a chiral counter-ion, (1S)-(+)-10-camphorsulphonic acid to separate the
enantiomers of two dihydropyridines on a porous graphite carbon stationary phase.
Karlsson [59] also utilised a porous graphite carbon stationary phase and N-
benzoxycarbonylglycyl-L-proline to achieve the enantioseparation of amines. Ion-pair
reagents have been used in conjunction with other types of chiral mobile phase additives
such as ligand exchange agents [56] and cyclodextrins [26].
3.4.5 Proteins.
Although proteins have been chemically bonded to chromatographic supports as chiral
stationary phases, there have been few reports of the use of proteins as chiral mobile
phase additives. One of the first reported uses of protein mobile phases was for the
separation of carboxylic acid enantiomers using albumin as the chiral selector [46]. No
other substantial investigations into proteins as mobile phase additives have been
carried out.
3.5 Surfactants, Micelles and Microemulsions in Chiral Chromatography
3.5.1 Surfactants.
Many chiral surfactants are commercially available and include bile salts, saponines,
long chain N-alkyl-L-amino acids, alkylglycosides, polymeric amino acid and dipeptide
derivatives [28]. Surfactants, both chiral and achiral have been utilised in chiral
chromatography in a number of ways, which will be discussed briefly here. Table 3.4
lists some of the chiral surfactants used for chiral separations.
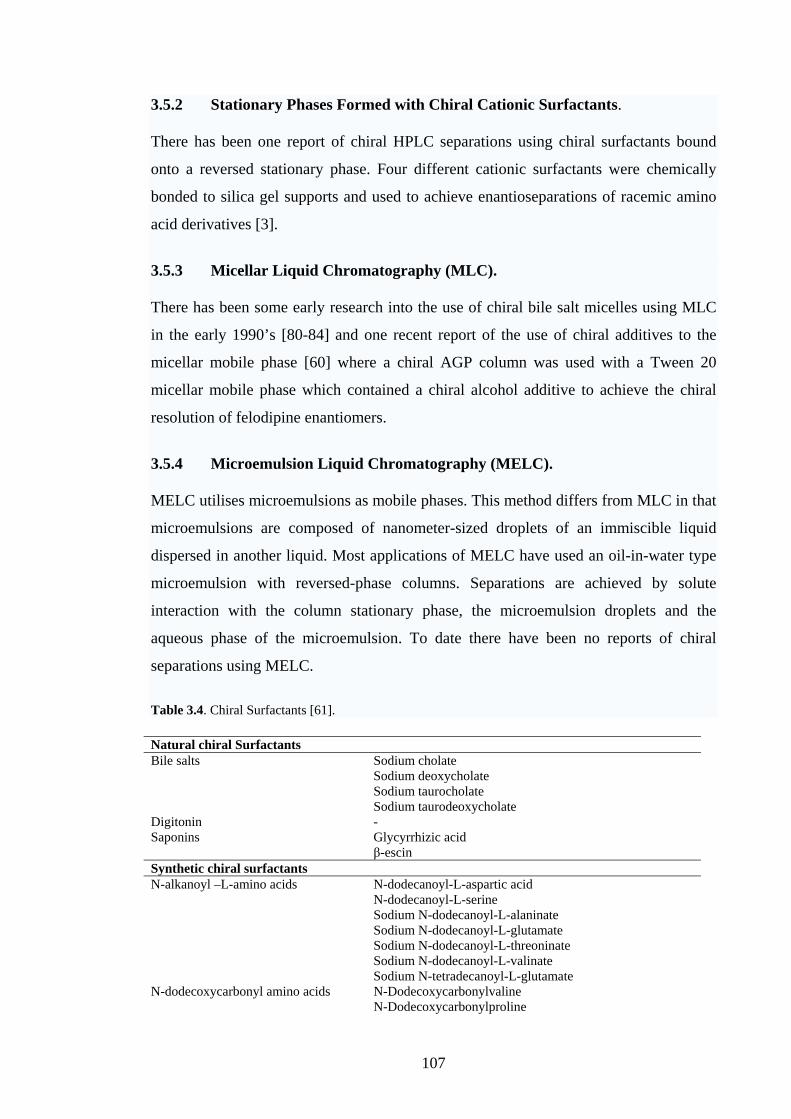
107
3.5.2 Stationary Phases Formed with Chiral Cationic Surfactants.
There has been one report of chiral HPLC separations using chiral surfactants bound
onto a reversed stationary phase. Four different cationic surfactants were chemically
bonded to silica gel supports and used to achieve enantioseparations of racemic amino
acid derivatives [3].
3.5.3 Micellar Liquid Chromatography (MLC).
There has been some early research into the use of chiral bile salt micelles using MLC
in the early 1990’s [80-84] and one recent report of the use of chiral additives to the
micellar mobile phase [60] where a chiral AGP column was used with a Tween 20
micellar mobile phase which contained a chiral alcohol additive to achieve the chiral
resolution of felodipine enantiomers.
3.5.4 Microemulsion Liquid Chromatography (MELC).
MELC utilises microemulsions as mobile phases. This method differs from MLC in that
microemulsions are composed of nanometer-sized droplets of an immiscible liquid
dispersed in another liquid. Most applications of MELC have used an oil-in-water type
microemulsion with reversed-phase columns. Separations are achieved by solute
interaction with the column stationary phase, the microemulsion droplets and the
aqueous phase of the microemulsion. To date there have been no reports of chiral
separations using MELC.
Table 3.4. Chiral Surfactants [61].
Natural chiral Surfactants Bile salts Sodium cholate Sodium deoxycholate Sodium taurocholate Sodium taurodeoxycholate Digitonin - Saponins Glycyrrhizic acid β-escin Synthetic chiral surfactants N-alkanoyl –L-amino acids N-dodecanoyl-L-aspartic acid N-dodecanoyl-L-serine Sodium N-dodecanoyl-L-alaninate Sodium N-dodecanoyl-L-glutamate Sodium N-dodecanoyl-L-threoninate Sodium N-dodecanoyl-L-valinate Sodium N-tetradecanoyl-L-glutamate N-dodecoxycarbonyl amino acids N-Dodecoxycarbonylvaline N-Dodecoxycarbonylproline

108
Alkylglucoside chiral surfactants Sodium dodecylβ-D-glucopyranoside monophosphate & monosulphate
Heptyl-, octyl-, nonyl-, & decyl-β-glucopyranosides Sodium hexadecyl D-glucopyranoside-6-hydrogen sulphate Tartaric acid based surfactants - Steroidal glucoside surfactants N,N-bis-(3-D-gluconamidopropyl)-cholamide N,N-bis-(3-D-gluconamidopropyl)-deoxycholamide Vesicle forming surfactants (1R,2S)-(-)-N-dodecyl-N-methyl-ephedrinium bromide [68] Polymeric alkenoxy amino acid surfactants
Poly-L-SUCL & poly-L-SUCIL [66]
3.5.5 Micellar Electrokinetic Chromatography (MEKC).
MEKC is a mode of CE that utilises micellar solutions as a background electrolyte.
Separations are achieved by the difference in distribution of analytes between the
micelle and the aqueous phase of the background electrolyte under the influence of an
applied voltage. Chiral separations can be achieved by two methods, (a) using chiral
surfactants to form a chiral micellar ‘pseudo-stationary’ phase, (b) adding chiral
selectors to the background electrolyte. Cyclodextrins are the most commonly used
selectors and have been used with both achiral [62, 63], and chiral [64] surfactant
micelles. Chiral separation depends on the differences between the stabilisation of each
enantiomer/chiral selector complex when migrating under the influence of an applied
potential. The enantiomer that interacts more strongly with the micelles will migrate at a
different velocity than the enantiomer which spends more time in the aqueous phase.
Reviews by Ha et al [66] and Otsuka & Terabe [61] detail recent applications of chiral
MEKC and the use of chiral surfactants in chiral MEKC. Table 3.4 lists many of the
chiral surfactants used in MEKC separations
3.5.6 Microemulsion Electrokinetic Chromatography (MEEKC)
Chiral separation by MEEKC was first demonstrated in 1993 [68] by using (2R,3R)-di-
n-butyl tartrate as a water immiscible (oil) chiral selector in the microemulsion
electrolyte. More recently there has been an increased level of reported chiral
applications of MEEKC [69-77]. A recent review by McEvoy et al [78] details recent
chiral applications. The chiral surfactant DDCV (dodecoxycarbonylvaline) illustrated in
Figure 3.7 has been used for a number of applications to achieve enantiomeric
separations of a number of pharmaceutical compounds. DDCV has also been used to
investigate temperature effects in chiral MEEKC. Chiral alcohols as co-surfactants can
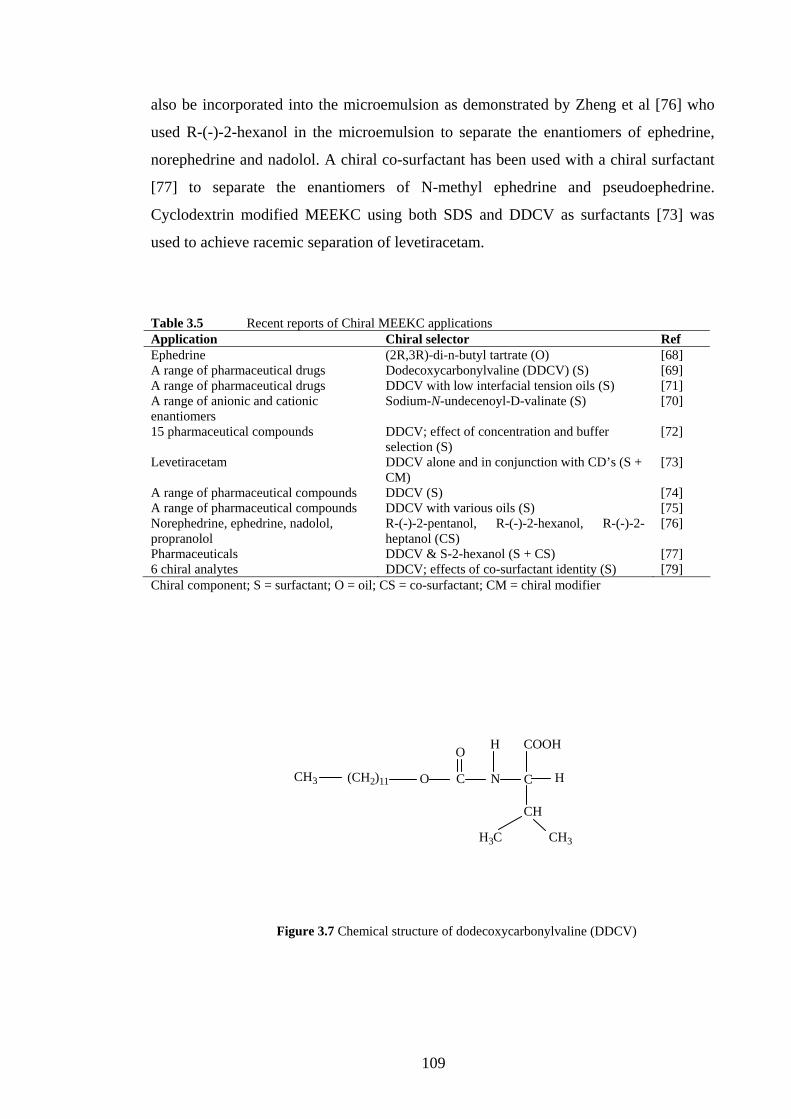
109
also be incorporated into the microemulsion as demonstrated by Zheng et al [76] who
used R-(-)-2-hexanol in the microemulsion to separate the enantiomers of ephedrine,
norephedrine and nadolol. A chiral co-surfactant has been used with a chiral surfactant
[77] to separate the enantiomers of N-methyl ephedrine and pseudoephedrine.
Cyclodextrin modified MEEKC using both SDS and DDCV as surfactants [73] was
used to achieve racemic separation of levetiracetam.
Table 3.5 Recent reports of Chiral MEEKC applications Application Chiral selector Ref Ephedrine (2R,3R)-di-n-butyl tartrate (O) [68] A range of pharmaceutical drugs Dodecoxycarbonylvaline (DDCV) (S) [69] A range of pharmaceutical drugs DDCV with low interfacial tension oils (S) [71] A range of anionic and cationic enantiomers
Sodium-N-undecenoyl-D-valinate (S) [70]
15 pharmaceutical compounds DDCV; effect of concentration and buffer selection (S)
[72]
Levetiracetam DDCV alone and in conjunction with CD’s (S + CM)
[73]
A range of pharmaceutical compounds DDCV (S) [74] A range of pharmaceutical compounds DDCV with various oils (S) [75] Norephedrine, ephedrine, nadolol, propranolol
R-(-)-2-pentanol, R-(-)-2-hexanol, R-(-)-2-heptanol (CS)
[76]
Pharmaceuticals DDCV & S-2-hexanol (S + CS) [77] 6 chiral analytes DDCV; effects of co-surfactant identity (S) [79] Chiral component; S = surfactant; O = oil; CS = co-surfactant; CM = chiral modifier
C
COOH
CH
HN
H
C
O
H3C CH3
O(CH2)11CH3
Figure 3.7 Chemical structure of dodecoxycarbonylvaline (DDCV)
110
Although the number of chiral selectors, in particular surfactants, and applications of
chiral MEEKC separations are very small compared to those used for MEKC, there is
considerable scope for future work in this area of chiral separation. Table 3.5 contains
details of chiral MEEKC applications to date
3.5.7 Chiral Microemulsion Components.
As discussed previously, microemulsions are composed of an oil phase and an aqueous
phase with the microemulsion droplets stabilised by the presence of a surfactant and a
co-surfactant. To date chiral MEEKC has utilised oil-in-water microemulsions with one
or more of the microemulsion components being chiral or incorporating a chiral
additive such as cyclodextrin to achieve chiral discrimination. It can be seen from Table
3.4 however, that the range of chiral surfactants available as potential chiral selectors in
MEEKC is very broad. As the range of chiral additives such as CDs, chiral oils and
chiral co-surfactants available for use in chiral MEEKC continues to expand, the
potential of this method for rapid and inexpensive chiral separations should continue to
grow.
3.5.8 Chiral/Analyte Complexation Sites.
When using chiral components in microemulsions as background electrolytes for
electrokinetic chromatography or mobile phases for liquid chromatography, a number
of chiral complexation sites are potentially available. These theoretical chiral
complexation sites are listed in Table 3.6.
Table 3.6 Possible sites for enantiomer/chiral selector complexation when using oil-in-water MEEKC
or MELC Chiral component Chiral site(s) MEEKC MELC Oil Core of the oil droplet Y Y Surfactant Surfactant molecules at the oil/water interface Y Y Free molecules in the aqueous phase Y Y Molecules adsorbed onto the stationary phase N Y Co-surfactant Molecules at the oil/water interface Y Y Free molecules in the aqueous phase Y Y Chiral modifiers Molecules partitioning between the oil/aqueous phase Y Y Molecules adsorbed onto the stationary phase N Y
It can be seen from Table 3.6 that the many different complexation sites available
combined with MEEKC separation mechanisms offers a host of method development
111
options for chiral separations. Although no chiral separations have been performed to
date using MELC there are two additional possibilities for chiral recognition sites
absent from MEEKC, (a) chiral surfactant molecules adsorbed onto the stationary phase
and (b) chiral modifiers such as CDs adsorbed onto the stationary phase which in effect
could form a temporary chiral stationary phase.
3.6 Conclusion
Chiral separation remains one of the most important areas of pharmaceutical analysis in
both research and quality control. HPLC with chiral columns has been the method of
choice for the majority of chiral analyses performed over the last two decades. Chiral
mobile phase additives have been utilised to a lesser extent with a variety of chiral
selectors used, the most common of which are native and derivatised β-CDs. Chiral
mobile phase additives can offer more flexibility in method development as the type and
concentration of chiral selector can be easily altered to suit a particular separation
whereas when using chiral columns, which can be very expensive, this flexibility is
absent. A disadvantage of using chiral mobile phases however is that chiral selectors are
sometimes expensive and large quantities are needed for routine work.
More recently capillary electrophoresis has been extensively studied as a more rapid
method for chiral analysis where chiral selectors are added to the background
electrolyte. One form of CE which has been shown to be particularly suited to chiral
separations is MEEKC, where various chiral components of the microemulsion
electrolyte offer the possibility of a number of different chiral sites for enantiomer
complexation. MELC is a relatively new mode of HPLC that utilises microemulsions as
eluents, although this chromatographic method has not yet been utilised for chiral
separations it offers the possibility of additional chiral recognition sites to those in
MEEKC. An investigation into the use of chiral microemulsions for chiral MELC
separations is detailed in Chapter 9.

112
3.7 References
[1] Vermeulen B., Remon J.P., J. Chromatogr B: Biomedical Sciences and Applications,
749 (2), 243-251 (2000).
[2] Haginaka J., J. Pharm. Biomed. Anal. 27, 357-372 (2002).
[3] Kurata K., Ono J., Dobashi A., J. Chromatogr. A. 1080, 140-147 (2005).
[4] Juvancz Z., Trends in Analytical Chemistry. 21 (5), 379-388 (2002).
[5] El-Gindy A., Emara S., Mesbah M.K. et al. J. AOAC International 89 (1), 65-70
(2006).
[6] Xiao S.Y., Lui Y., Chen H., et al. Chinese J. Anal. Chem. 33 (12), 1761-1763 (2005).
[7] Zhang D.D., Guo X.J., Yuan B., Li F.M. Chinese J. Anal. Chem. 32 (2), 229-231
(2004).
[8] Mandelings D., Perrin C., Massart D.L. et al. Anal Chimica Acta 509 (1), 11-19 (2004).
[9] Wu Y.J., Fang X., Zhu M.Q., Chinese J. Anal. Chem. 31 (3), 332-335 (2003).
[10] Watanabe S., Kawahara M., Muira K. et al. Anal Scie, 18 (1), 73-76 (2002).
[11] Heraez-Hernandez R., Campins-Falco P., Anal Chimica Acta. 434 (2) 315-324 (2001).
[12] Wang R., Xie J.W., Jia Z.P. et al. Chinese J. Anal. Chem. 29 (4), 406-409 (2001).
[13] Bielejewska A., Nowakowski R., Duszczyk K, et al. J. Chromatogr. A. 840 (2), 159-
170 (1999).
[14] Wei W., Lou G.A., Xiang R., et al. J. Microcolumn Sep. 11 (4), 263-269 (1999).
[15] Ameyibor E., Stewart J.T., J. Liq. Chromatogr. Related Technol. 20 (6), 855-869
(1997).
[16] Reepmeyer J.C., Chirality, 8 (1), 11-17 (1996).
[17] Stammel W., Woesle B., Thomas H., Chirality 7 (1), 10-19 (1995).
[18] Pullen R.H., Brennan J.J., Patonay G., J. Chromatogr. A. 691 (1-2), 187-193 (1995).
[19] Takeuchi T. J. Microcolumn Sep. 4 (3), 209-214 (1992).
[20] Takeuchi T., Nagae N., J. High. Resolut. Chromatogr. 15 (2), 121-123 (1992).
[21] Walhagen A., Edholm L.E., Chromatographia, 32 (5-6) 215-223 (1991).
[22] Healy L.O., Murrihy J.P., Tan A. et al. J. Chromatogr. A. 924 (1-2), 459-464 (2001).
[23] Ameyibor E., Stewart J.T. J. Chromatogr. B. Biomedical Sciences and Applications.
703 (1-2), 273-278 (1997).
[24] Roussel C., Favrou A., J. Chromatogr. A. 704 (1), 67-74 (1995).
[25] Cooper A.D., Jeffries T.M., J. Pharm. Biomed. Anal., 8 (8-12), 847-851 (1990).
[26] Deng Y., Maruyama W., Kawai M., et al. J. Chromatogr. B. Biomedical Sciences and
Applications. 689 (2), 313-320 (1997).
[27] Rizzi A.M., Briza P., Breitenbach M., J. Chromatogr. Biomedical Sciences and
Applications., 582 (1-2), 35-40 (1992).
[28] Gubitz G., Schmid M.G., Molecular Biotechnology. 32, 159-179 (2006).

113
[29] Nowakowski R., Bielejewska A., Duszczyk K., Sybilska D. J. Chromatogr. A. 782 (1),
1-11 (1997).
[30] Herraez-Hernandez R., Campins-Falco P., J. Chromatogr. B. 740 (2), 169-177 (2000).
[31] Bai D.M., Zhao X.M., Hu Z.D., Chinese J Anal Chem, 29 (4), 413-415 (2001).
[32] Yao T.W., Zeng S. Biomedical Chromatography, 15 (2), 141-144 (2001).
[33] Bielejewska A., Duszczyk K., Sybilska D., J. Chromatogr. A. , 931, 81-93 (2001).
[34] Ye J., Chen G., Zeng S., J. Chromatogr. B., 843, 289-294 (2006).
[35] Remelli M., Trombin D., Conato C., Chroamtographia, 55, 301-306 (2002).
[36] Yamazaki S., Saito K., Tanimura T., J. High Res. Chromatogr. 21 (10), 561-564
(1998).
[37] Remelli M., Fornasari P., Pulidori F., J. Chromatogr. A. 761 (1-2), 79-89 (1997).
[38] Lee S.H., Oh T.S., Lee H.W., Bulletin of the Korean Chemical Society. 13 (3), 280-285
(1992).
[39] Wang R., Jai Z.P., Hu X.L. et al. J. Chromatogr. B. 785, 353-359 (2003).
[40] Galaverna G., Panto F., Dossena A. et al. Chirality 7 (5), 331-336 (1995).
[41] Galaverna G., Corradini R., Demunari E., et al. J. Chromatogr. A. 657 (1), 43-54
(1993).
[42] Davy G.S. Francis P.D. J. Chromatogr. A. 394 (2), 323-331 (1987).
[43] Dolezalova M., Thaczykova M., J. Pharm. Biomed. Anal. 19, 555-567 (1999).
[44] Zang Z.F., Yang G.L., Wang D.X. et al, J. Liq. Chromatogr. Related Technol. 27 (5),
813-827 (2004).
[45] Sharp V.S., Letts M.N., Risley D.S., Rose J.P., Chirality 16 (3), 153-161 (2004).
[46] Pettersson C., Arvidsson T., Karlsson A.L., Marle I. J. Pharm. Biomed. Anal. 4 (2),
221-235 (1986).
[47] Guo Z., Wang H., Zhang Y. J. Pharm. Biomed. Anal . 41, 310-314 (2006).
[48] Sun Q., Olesik S.V., J. Chromatogr. B. 745, 159-166 (2000).
[49] Slama I., Jourdan E., Grosset C. et al. J. Chromatogr. B. 795, 115-121 (2003).
[50] Haroun M., Ravelet C., Grosset C. et al. Talanta, 68, 1032-1036 (2006).
[51] Slama I, Dufresne C., Jourdan E. et al. Anal Chem, 74, 5205-5211 (2002).
[52] Sharp V.S., Risley D.S. Chirality 11 (1), 75-81 (1999).
[53] Armstrong D.W., Tang Y., Chen S. et al. Anal Chem. 66, 1473-1484 (1994).
[54] Armstrong D.W., Liu Y., Ekborg-Ott K.H., Chirality 7, 474-480 (1995)
[55] Gasper M., Berthod A., Nair U.B., Armstrong D.W., Anal Chem 68, 2501-2514 (1996).
[56] Sun S.Y., Jia Y.Z., Zeng N., Li F.M. Chromatographia 63 (7-8), 331-335 (2006).
[57] Steuer W., Schindler M., Schill G., Erni F., J. Chromatogr. 447, 287-292 (1998).
[58] Josefsson M., Carlsson B., Norlander B. J. Chromatogr A. 684 (1), 23-27 (1994).
[59] Karlsson A., Pettersson C., J. Chromatogr A. 543, 287-297 (1991).
114
[60] Haupt D., Pettersson C., Westerlund D., Chirality 7 (1), 23-27 (1995).
[61] Otsuka K., Terabe S., J. Chromatogr A. 875, 163-178 (2000).
[62] Antczak A., Ramstad T., Johnson R. Chromatographia 64 (1-2) 57-64 (2006.
[63] Wang Z.Y., Tang Z.M., Gu Z.H., et al Electrophoresis 26 (4-5), 1001-1006 (2005).
[64] Bai M., Cheng Y., Shi Y.W., You J.M. Chinese Anal Chem 34 (1), 119-122 (2006).
[65] Rizvi S.A.A., Shamshi S.A., Electrophoresis 24, 2514-2526 (2004).
[66] Ha P.T.H., Hoogmartens J., van Schepdael A., J. Pharm. Biomed. Anal. 41 (1), 1-11
(2006).
[67] Dey J., Mohanty A, Roy S. et al, J. Chromatogr A. 1048 (1), 127-132 (2004).
[68] Aiken J.H., Huie C.W., Chromatographia 35, 448-450 (1993).
[69] Pascoe R., Foley J., Analyst 127, 710-714 (2002).
[70] Iqbal R., Asad S., Rizvi A., et al, J. Chrom. A. 1043 (2), 291-302 (2004).
[71] Mertzman M.D., Foley J.P., J Chrom. A. 1073 (1-2), 181-189 (2005).
[72] Mertzman M.D., Foley J.P., Electrophoresis 25 (18-19), 3247-3256 (2004).
[73] Mertzman M.D., Foley J.P., Electrophoresis 25 (9), 1188-1200 (2004).
[74] Mertzman M.D., Foley J.P., Electrophoresis 26 (21), 4153-4163 (2005).
[75] Mertzman M.D., Foley J.P., Electrophoresis 25, 723-732 (2004).
[76] Zheng Z.X., Lin J.M., Chan W.H., Li A.W.M., Huie C.W., Electrophoresis, 25 (18-19),
3263-3269 (2004).
[77] Kahle K.A., Foley J.P., Electrophoresis 27 (4), 896-904 (2006).
[78] McEvoy E., Altria K., Donegan S., Power J., Electrophoresis 28 (1-2), 193-207 (2007).
[79] Kahle K.A., Foley J.P., Elecrtrophoresis, 27 (21), 4321-4333 (2006).
[80] Williams R.W., Fu Z.S., Hinze W.L. J. Chromatogr. Sci. 28 (6), 292-302 (1990).
[81] Hinze W.L., Williams R.W., Fu Z.S., et al. Colloids and Surfaces 48 (1-3), 79-94
(1990).
[82] Hu W., Takeuchi T., Haraguchi H., Chromatographia 33 (1-2), 58-62 (1992).
[83] Hu W., Takeuchi T., Haraguchi H., Chromatographia 33 (1-2), 63-66 (1992).
[84] Hu W., Takeuchi T., Haraguchi H. J. High Res. Chromatogr. 15 (4), 275-277 (1992).

115
Chapter Four
Microemulsion Characterisation Techniques

116
4.1 Introduction
In Chapter One, the theory of microemulsion formation, stability and applications was
described. Further to the theoretical overview of microemulsions, Chapter One also
described the theoretical aspects of MELC while an overview of MEEKC is included in
Chapter Two. For the optimisation and further understanding of these analytical
techniques, fundamental aspects of the phase behaviours, interfacial characteristics and
the dynamic structure of microemulsions is required.
Microemulsions have been the focus of extensive research worldwide due to their
importance in a variety of technological applications such as cosmetics, chemical
synthesis, lubrication, pharmaceuticals, etc. In tandem with the development of
microemulsion applications, various methods to elucidate the nature of the
microemulsion structures have been reported. Although the use of both MEEKC and
MELC for pharmaceutical analysis has become more common in recent years there
have been few reports correlating the physicochemical characteristics of the
microemulsions used to the actual separations achieved. This chapter will provide a
review of current methods for the characterisation of microemulsions used for a range
of applications.
The determination of the internal structures of microemulsions used for MEEKC and
MELC techniques is needed to provide more understanding of the separation
mechanisms taking place in the LC column or CE capillary. Altering the microemulsion
component ratios or using additives or modifiers can effect the separations achieved.
While the chromatographic parameters of both techniques such as; retention/migration
time, efficiency, asymmetry, enantioselectivity etc have been measured and related to
the amount and type of each component/modifier in the microemulsion, very few
investigations have been carried out to relate the microstructure of the systems to
chromatographic performance and the composition of the microemulsions. In addition
to the structural elucidation of the microemulsion, measurement of the dynamic
processes within the microemulsion system such as; viscosity, interfacial tension,
conductivity and droplet dynamics could be useful to better understand and predict the
separation processes. Structural determination and dynamic measurement techniques
will be discussed in this chapter.
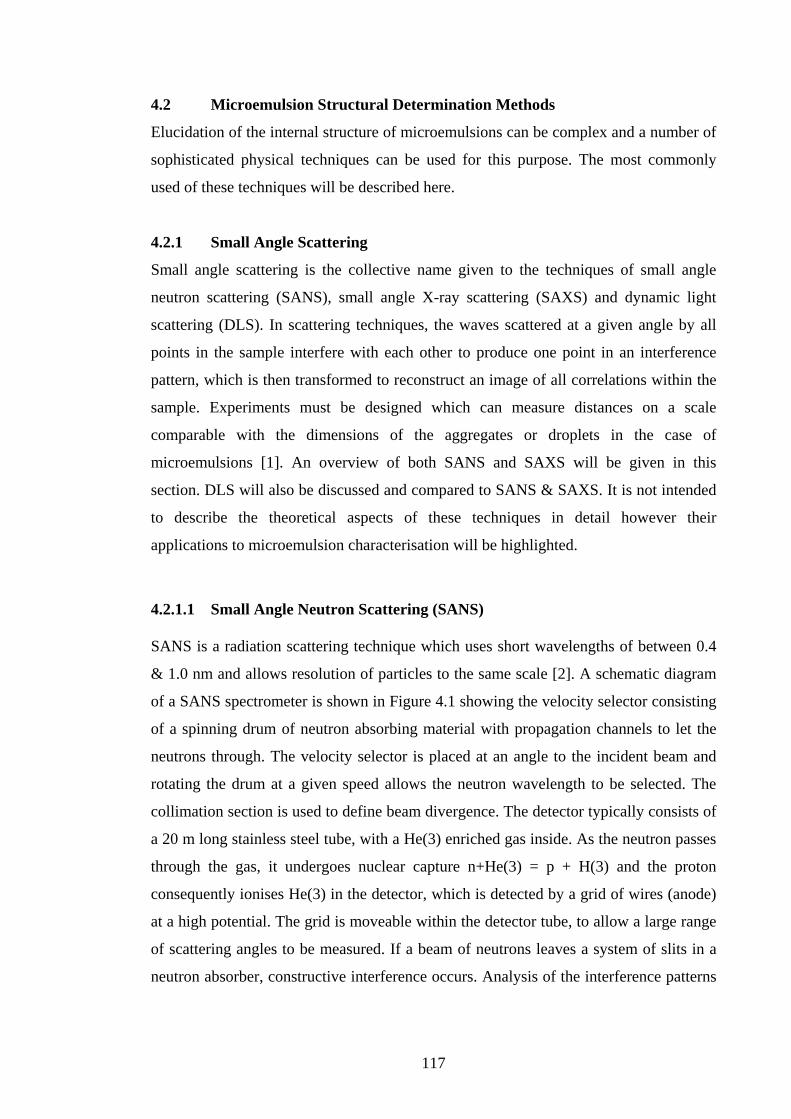
117
4.2 Microemulsion Structural Determination Methods
Elucidation of the internal structure of microemulsions can be complex and a number of
sophisticated physical techniques can be used for this purpose. The most commonly
used of these techniques will be described here.
4.2.1 Small Angle Scattering
Small angle scattering is the collective name given to the techniques of small angle
neutron scattering (SANS), small angle X-ray scattering (SAXS) and dynamic light
scattering (DLS). In scattering techniques, the waves scattered at a given angle by all
points in the sample interfere with each other to produce one point in an interference
pattern, which is then transformed to reconstruct an image of all correlations within the
sample. Experiments must be designed which can measure distances on a scale
comparable with the dimensions of the aggregates or droplets in the case of
microemulsions [1]. An overview of both SANS and SAXS will be given in this
section. DLS will also be discussed and compared to SANS & SAXS. It is not intended
to describe the theoretical aspects of these techniques in detail however their
applications to microemulsion characterisation will be highlighted.
4.2.1.1 Small Angle Neutron Scattering (SANS)
SANS is a radiation scattering technique which uses short wavelengths of between 0.4
& 1.0 nm and allows resolution of particles to the same scale [2]. A schematic diagram
of a SANS spectrometer is shown in Figure 4.1 showing the velocity selector consisting
of a spinning drum of neutron absorbing material with propagation channels to let the
neutrons through. The velocity selector is placed at an angle to the incident beam and
rotating the drum at a given speed allows the neutron wavelength to be selected. The
collimation section is used to define beam divergence. The detector typically consists of
a 20 m long stainless steel tube, with a He(3) enriched gas inside. As the neutron passes
through the gas, it undergoes nuclear capture n+He(3) = p + H(3) and the proton
consequently ionises He(3) in the detector, which is detected by a grid of wires (anode)
at a high potential. The grid is moveable within the detector tube, to allow a large range
of scattering angles to be measured. If a beam of neutrons leaves a system of slits in a
neutron absorber, constructive interference occurs. Analysis of the interference patterns
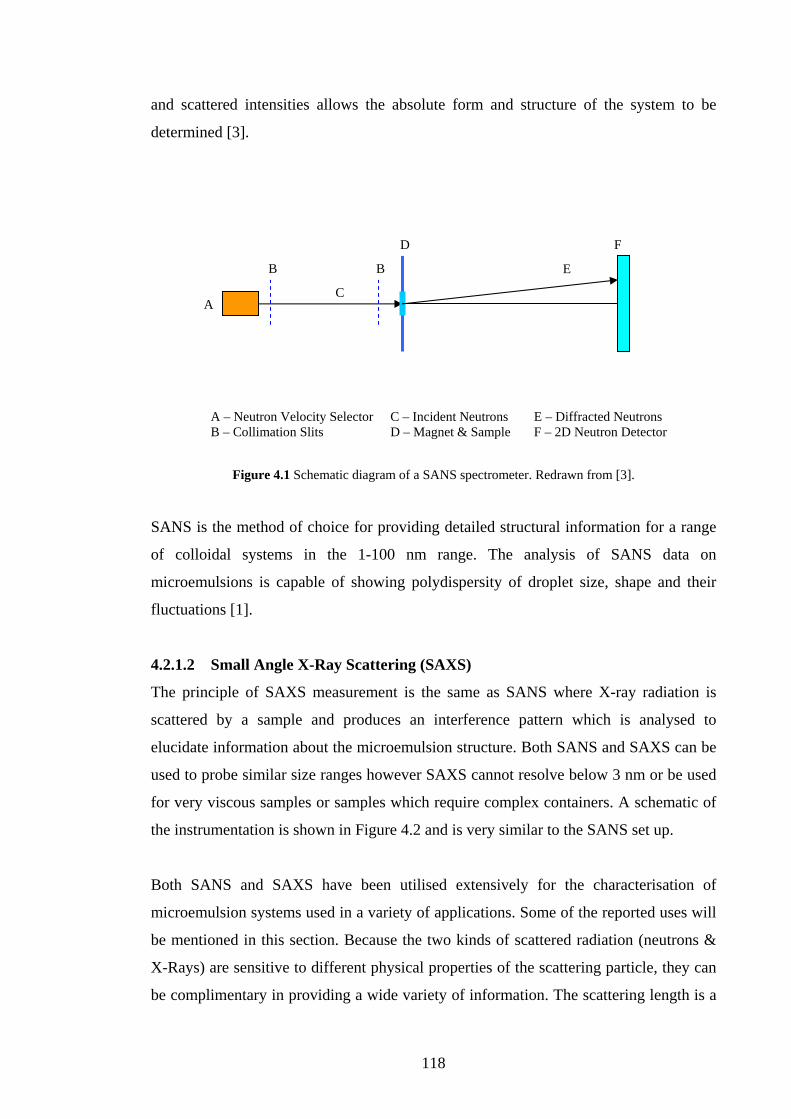
118
and scattered intensities allows the absolute form and structure of the system to be
determined [3].
A – Neutron Velocity Selector C – Incident Neutrons E – Diffracted Neutrons B – Collimation Slits D – Magnet & Sample F – 2D Neutron Detector
Figure 4.1 Schematic diagram of a SANS spectrometer. Redrawn from [3].
SANS is the method of choice for providing detailed structural information for a range
of colloidal systems in the 1-100 nm range. The analysis of SANS data on
microemulsions is capable of showing polydispersity of droplet size, shape and their
fluctuations [1].
4.2.1.2 Small Angle X-Ray Scattering (SAXS)
The principle of SAXS measurement is the same as SANS where X-ray radiation is
scattered by a sample and produces an interference pattern which is analysed to
elucidate information about the microemulsion structure. Both SANS and SAXS can be
used to probe similar size ranges however SAXS cannot resolve below 3 nm or be used
for very viscous samples or samples which require complex containers. A schematic of
the instrumentation is shown in Figure 4.2 and is very similar to the SANS set up.
Both SANS and SAXS have been utilised extensively for the characterisation of
microemulsion systems used in a variety of applications. Some of the reported uses will
be mentioned in this section. Because the two kinds of scattered radiation (neutrons &
X-Rays) are sensitive to different physical properties of the scattering particle, they can
be complimentary in providing a wide variety of information. The scattering length is a
A
B B
C
D
E
F
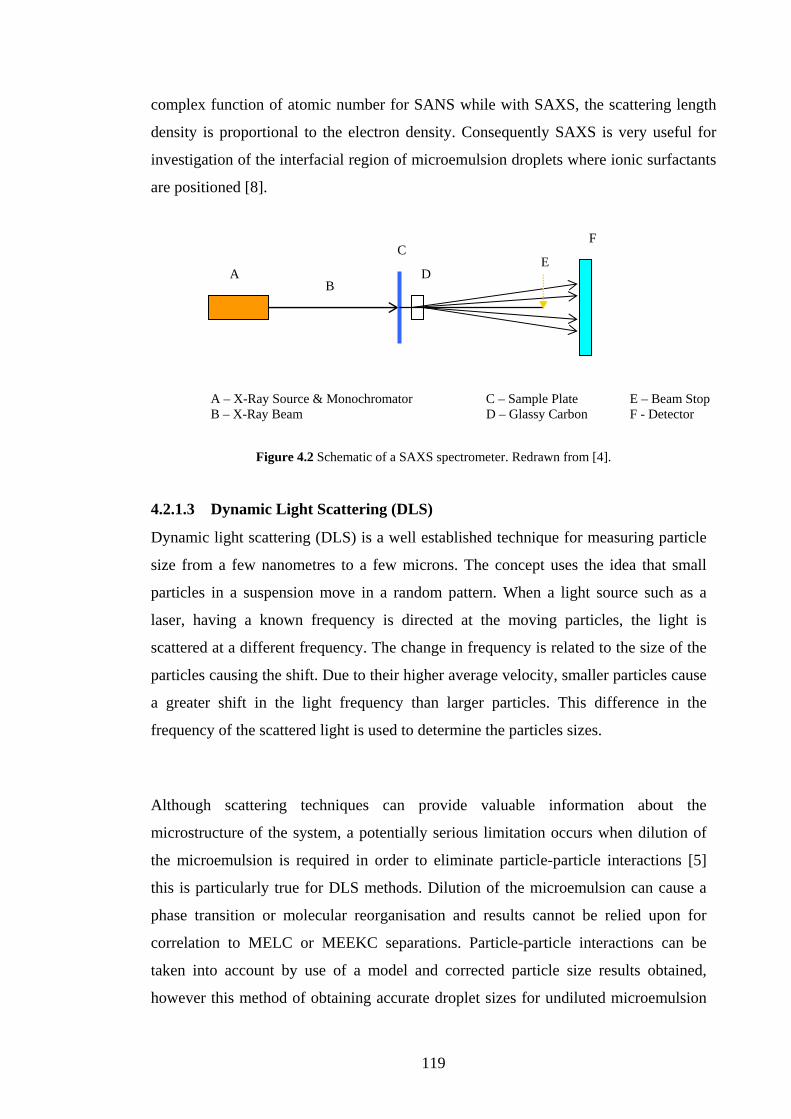
119
EA
B
C
D
F
complex function of atomic number for SANS while with SAXS, the scattering length
density is proportional to the electron density. Consequently SAXS is very useful for
investigation of the interfacial region of microemulsion droplets where ionic surfactants
are positioned [8].
A – X-Ray Source & Monochromator C – Sample Plate E – Beam Stop B – X-Ray Beam D – Glassy Carbon F - Detector
Figure 4.2 Schematic of a SAXS spectrometer. Redrawn from [4].
4.2.1.3 Dynamic Light Scattering (DLS)
Dynamic light scattering (DLS) is a well established technique for measuring particle
size from a few nanometres to a few microns. The concept uses the idea that small
particles in a suspension move in a random pattern. When a light source such as a
laser, having a known frequency is directed at the moving particles, the light is
scattered at a different frequency. The change in frequency is related to the size of the
particles causing the shift. Due to their higher average velocity, smaller particles cause
a greater shift in the light frequency than larger particles. This difference in the
frequency of the scattered light is used to determine the particles sizes.
Although scattering techniques can provide valuable information about the
microstructure of the system, a potentially serious limitation occurs when dilution of
the microemulsion is required in order to eliminate particle-particle interactions [5]
this is particularly true for DLS methods. Dilution of the microemulsion can cause a
phase transition or molecular reorganisation and results cannot be relied upon for
correlation to MELC or MEEKC separations. Particle-particle interactions can be
taken into account by use of a model and corrected particle size results obtained,
however this method of obtaining accurate droplet sizes for undiluted microemulsion
120
systems can be extremely problematic. Few studies have attempted to correct these
interactions [6-8]. Without proper corrections, much of the data obtained from DLS
measurements should only be used to establish the presence of a microemulsion
structure [5].
4.2.1.4 Applications of Scattering Techniques to Microemulsion Characterisation
Although the use of scattering techniques has been widely reported to elucidate the
structure of microemulsions used in a wide variety of applications, there have been
few reports of the use of these techniques or indeed any characterisation techniques
relating to microemulsions in separation science. The applications mentioned in this
section cover a wide range of areas.
Glatter et al [8] utilised SANS, SAXS and DLS for the structural characterisation of a
sugar ester non-ionic microemulsion and found that the scattering data from the three
techniques was very difficult to evaluate due to the system containing four
components in different ratios, however the techniques were found to be useful
complimentary techniques for obtaining qualitative and quantitative information.
Photon correlation spectroscopy was used by Dunn et al [9] for the size
characterisation of W/O microemulsions stabilised by aerosol-OT surfactant. This
technique in conjunction with other SAXS and static fluorescence quenching data
allowed the diffusion coefficients of the microstructures to be determined.
A study by Libster et al [10] utilised a number of characterisation techniques including
SAXS to characterise a microemulsion used to solubilise a nucleating agent in a
polymer matrix. They found that the W/O microemulsion droplet size increased as the
amount of water incorporated into the system was increased until the system inverted
to an O/W system. The droplet size also increased as the nucleating agent was
dissolved in the microemulsion.
121
Itoh et al [11] measured the mean particle size of a microemulsion formulation
containing a lipid lowering drug, N-4472, over a pH range of 2.0 to 7.0 at 37º C. DLS
measurements were used to study the microemulsion stability in the gastrointestinal
tract. Increased particle size from a mean of 18 nm to a wide size distribution of 0.1-
0.6 μm was observed for non microemulsion fluids while the microemulsion
formulation remained stable and particle size was constant.
SAXS measurements of a microemulsion composed of non-ionic Tween 40 surfactant,
Imwotor 308 cosurfactant, water and hydrophobic isopropyl myristate as the oil phase
were used to provide supplementary data to alternate characterisation techniques by
Tomsic et al [12]. Differential scanning calorimetry, density measurements, electrical
conductivity and surface tension were sensitive to structural changes in the system but
could not provide quantitative structural information on the system. The SAXS
method was able to provide information on the microemulsion structure when it was
used as a delivery system for ketoprofen.
Hua et al [13] used a novel microemulsion to increase the solubility and the in vitro
transdermal delivery of a poorly water-soluble drug, vinpocetine. They used a number
of characterisation techniques including DLS. The results quoted for particle size
using DLS were very brief however homogeneous particle sizes of 36 nm with a
polydispersity of 0.3 were reported.
DLS and SAXS were used by Polizelli et al [14] to characterise an O/W
microemulsion used to protect hydrophilic food additives from degrading. The results
obtained for the DLS measurements are shown in Figure 4.3 showing a single modal
peak which is narrow indicating a low polydispersity of the droplets size.
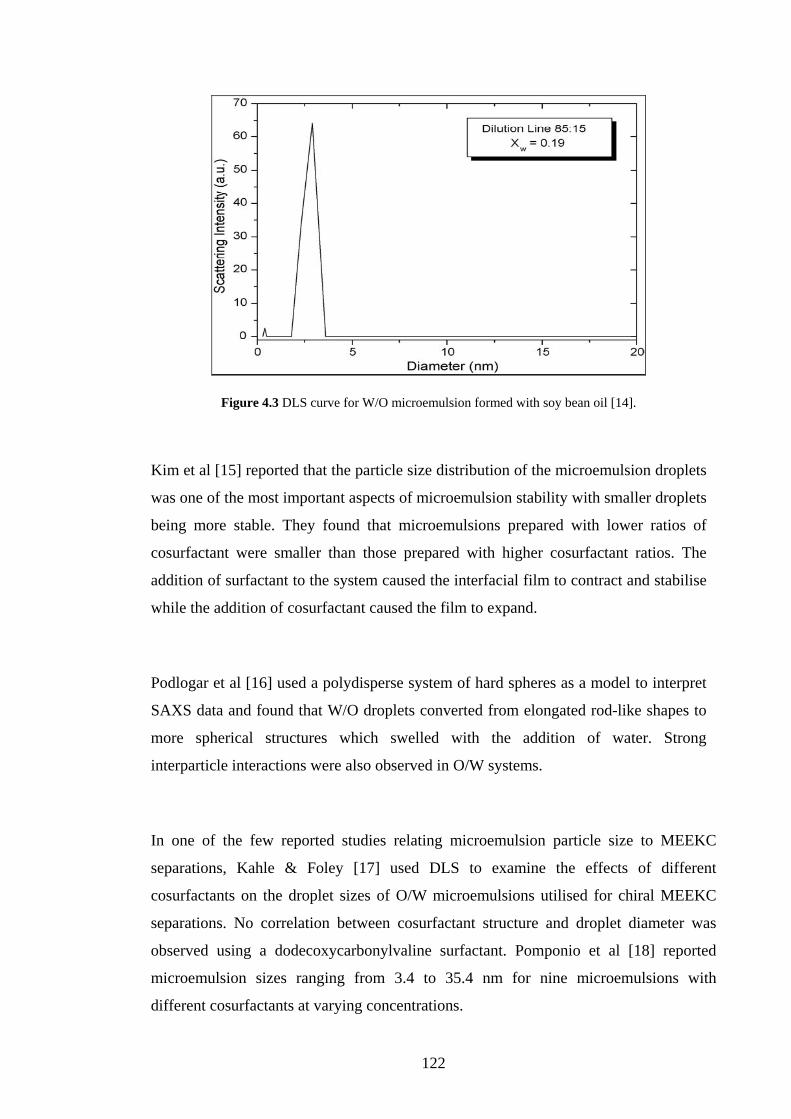
122
Figure 4.3 DLS curve for W/O microemulsion formed with soy bean oil [14].
Kim et al [15] reported that the particle size distribution of the microemulsion droplets
was one of the most important aspects of microemulsion stability with smaller droplets
being more stable. They found that microemulsions prepared with lower ratios of
cosurfactant were smaller than those prepared with higher cosurfactant ratios. The
addition of surfactant to the system caused the interfacial film to contract and stabilise
while the addition of cosurfactant caused the film to expand.
Podlogar et al [16] used a polydisperse system of hard spheres as a model to interpret
SAXS data and found that W/O droplets converted from elongated rod-like shapes to
more spherical structures which swelled with the addition of water. Strong
interparticle interactions were also observed in O/W systems.
In one of the few reported studies relating microemulsion particle size to MEEKC
separations, Kahle & Foley [17] used DLS to examine the effects of different
cosurfactants on the droplet sizes of O/W microemulsions utilised for chiral MEEKC
separations. No correlation between cosurfactant structure and droplet diameter was
observed using a dodecoxycarbonylvaline surfactant. Pomponio et al [18] reported
microemulsion sizes ranging from 3.4 to 35.4 nm for nine microemulsions with
different cosurfactants at varying concentrations.

123
4.2.2 Nuclear Magnetic Resonance (NMR)
NMR spectroscopy based on physical properties of molecular spin is a very powerful
method to study surfactant systems in solution. It has been used to determine CMC,
aggregation number, counter-ion binding, aggregate shape and size, solution structure
and solubilisation equilibria [1]. NMR has been used extensively to measure self-
diffusion coefficients of the various components and yields information on the
microenvironment [5]. Using high resolution 1H, 2H and 13C NMR, intermolecular
interactions and structural rearrangements of non-ionic and anionic microemulsions
have been investigated. This technique can directly reveal the nature of the mono and
polydispersity of the droplets [1]. NMR can be a very effective method to characterise
the structure of microemulsion droplets. Since the bandwidth of the NMR signal is
reflected by the mobility of the nuclei, the changes in linewidth provides information on
the state of drug molecules within the microemulsion droplet. Determination of the self-
diffusion coefficients of the microemulsion components by pulsed-gradient spin-echo
(PGSE) NMR has been shown to be a valuable general tool for characterisation of
microemulsion structures. With this technique, the displacement of nuclear spins in a
controlled magnetic field gradient is monitored and the contributions of different
components are resolved by Fourier Transformation of the NMR signal [10, 19]. Self
diffusion allows a model free and straight-forward extraction of structural information;
however the interpretation of relaxation data requires models. Self diffusion is
experimentally less demanding than relaxation studies and can be more rapid. Self
diffusion is generally based on 1H NMR where the different components of a
microemulsion can be resolved with no isotropic labelling. Relaxation experiments
using 2H NMR requires more care and is the method of choice for the study of
selectively deuterated surfactants [19]. Self diffusion of the microemulsion components
can provide insight into the size and shape of discreet particles while NMR relaxation of
the surfactant molecules at different magnetic fields allows information to be obtained
about interfacial film curvature and droplet shape and size [19].
The detailed theory of NMR and microemulsion characterisation by NMR techniques is
beyond the scope of this brief review and some recent applications of the method to
microemulsion characterisation will be outlined in this section.

124
Figure 4.4 Self diffusion coefficients of an empty microemulsion calculated from PGSE-NMR as a function of the aqueous phase content. Traces from the top; Water, 1-hexanol, mineral oil, Tween 60 [10].
Libster et al [10] stated that fast diffusion is characteristic of free molecules in solution
while a small diffusion coefficient suggests the presence of macromolecules or
immobilised molecules. Using PGSE-NMR, they found that the oil mobility was
severely restricted by the lipophilic chains on the surfactant which were very tightly
packed. The function of the alcohol component was also determined using NMR
measurements where it was found to be accommodated much closer to the oil than the
water phase. They found that its role was to stabilise the interaction between the
surfactant (Tween 60) and the highly hydrophobic oil phase.
In a study to improve the physicochemical properties of a lipid lowering drug, N-4472,
Itoh et al [11] used 1H NMR together with a number of other techniques to investigate
whether microemulsification of the drug improved oral absorption. They found that
when compared to an aqueous solution where broad NMR signals indicated self
association of the drug, narrow NMR signals obtained from the drug dissolved in the
microemulsion indicated that it was molecularly dispersed in the microemulsion
droplets.
Hua et al [13] using pulsed field gradient NMR found that a linear correlation existed
between the self-diffusion coefficient and the transdermal permeation rate of a cerebral
palsy drug in a microemulsion and could be used to optimise the microemulsion
composition to maximise transdermal delivery of the drug.

125
Kreilgaard et al [20] also used NMR to study the transdermal drug delivery potentials of
microemulsions for both hydrophilic and hydrophobic drug compounds and to compare
the drug delivery potential of microemulsions to conventional vehicles. Using 1H NMR
investigations, the microemulsions and their components were characterised by
longitudinal relaxation times which showed that a large proportion of the lipophilic drug
was free and primarily located in the oil phase. The hydrophilic drug was determined to
reside in the aqueous phase however there was partial integration of the drug into the
surfactant system. PGSE-NMR investigations showed a slow diffusion of the
hydrophilic drug in all systems and confirmed its association with the oil phase.
4.2.3 Freeze-Fracture Transmission Electron Microscopy (FF-TEM)
TEM operates on the same principle as light microscopy except that a beam of electrons
is used instead of a visible light source. As the beam of electrons passes through a very
thin sample, the electrons interact with it and a shadow image of the sample appears on
an imaging screen. As the wavelength of the electron beam is in the order of picometers,
the resolution obtained is far greater than that obtained from a light microscope.
Microemulsions cannot be easily characterised by TEM because of low pressures in the
microscope and electrons may induce changes to the microstructure, the fluid nature of
the system also makes sample handling difficult [19]. Freeze fracture is a TEM sample
preparation technique which overcomes these problems and involves the preparation of
a metal replica of a freshly fractured frozen specimen surface which can be permanently
stored. Thin samples (<100 nm) are supported between metal discs and flash frozen by
immersion in liquid propane or nitrogen. The sample is then fractured to reveal a fresh
surface for replication. Replication is performed by evaporating a metal alloy at an
angle onto the fracture surface. The replica is then stabilised by depositing a thin layer
of evaporated carbon perpendicular to the fracture surface [21].
Krauel et al [22] utilised FF-TEM to characterise colloidal drug delivery systems where
it was capable of distinguishing between W/O microemulsions, bicontinuous systems or
solutions and particle sizes measured with FF-TEM were found to be in agreement with
DLS methods.
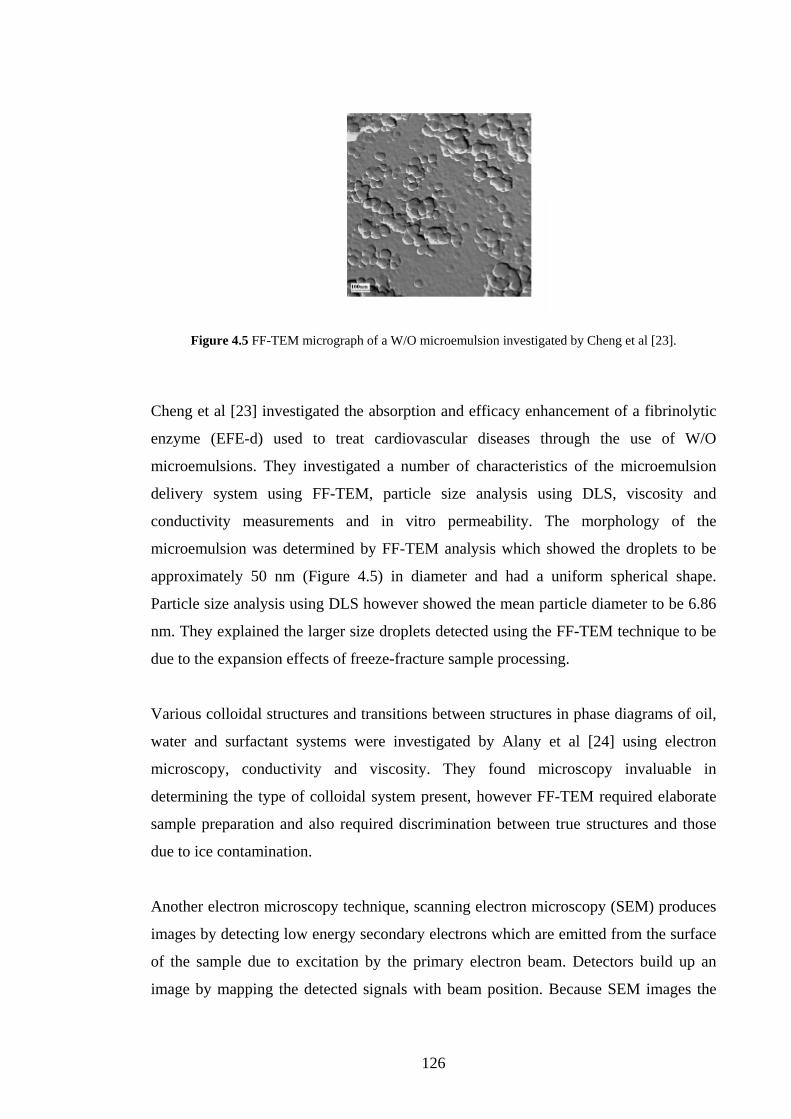
126
Figure 4.5 FF-TEM micrograph of a W/O microemulsion investigated by Cheng et al [23].
Cheng et al [23] investigated the absorption and efficacy enhancement of a fibrinolytic
enzyme (EFE-d) used to treat cardiovascular diseases through the use of W/O
microemulsions. They investigated a number of characteristics of the microemulsion
delivery system using FF-TEM, particle size analysis using DLS, viscosity and
conductivity measurements and in vitro permeability. The morphology of the
microemulsion was determined by FF-TEM analysis which showed the droplets to be
approximately 50 nm (Figure 4.5) in diameter and had a uniform spherical shape.
Particle size analysis using DLS however showed the mean particle diameter to be 6.86
nm. They explained the larger size droplets detected using the FF-TEM technique to be
due to the expansion effects of freeze-fracture sample processing.
Various colloidal structures and transitions between structures in phase diagrams of oil,
water and surfactant systems were investigated by Alany et al [24] using electron
microscopy, conductivity and viscosity. They found microscopy invaluable in
determining the type of colloidal system present, however FF-TEM required elaborate
sample preparation and also required discrimination between true structures and those
due to ice contamination.
Another electron microscopy technique, scanning electron microscopy (SEM) produces
images by detecting low energy secondary electrons which are emitted from the surface
of the sample due to excitation by the primary electron beam. Detectors build up an
image by mapping the detected signals with beam position. Because SEM images the

127
surface of the sample as opposed to transmission images obtained with TEM, it
provides a greater in depth view and 3D representation of the samples. A field of SEM
which uses frozen samples (CRYO-SEM) has been used by Kraeul et al [22] to
characterise microemulsions. Similar to FF-TEM, they found the technique useful for
determining the type of microemulsion formed but Cryo-field emission scanning
electron microscopy proved to be a valuable technique for the visualisation of the
colloidal systems as samples could be observed close to their natural state.
4.2.4 Viscosity
Measurements of viscosity can provide valuable information on the internal consistency
of microemulsion systems as well as yield data from which the overall geometry of the
microemulsion particles can be elucidated [1]. Viscosity depends largely on the type,
particle structure and interactions and on the concentration of the system. Measurements
of a systems dynamic viscosity can yield information on the dynamics of a
microemulsion system and can be used to monitor structural changes [19]. Viscosity
measurements can be applied to obtain the hydrodynamic radius of microemulsion
droplets if the results of viscosity and volume fractions can be fitted into models [25].
Djordjevic et al [26] utilised viscosity along with a number of other techniques for the
characterisation of macrogolglyceride based microemulsions as drug delivery vehicles
for an amphiphilic drug. They found that changes to the % of water in the system
resulted in changes in microemulsion viscosity that was indicative of the nature of the
dispersed phase. It was also found that the empty microemulsion and the microemulsion
loaded with the test drug displayed large variations in viscosity over the same water
concentration range indicating the effects of the test drug on the system. Viscosity data
in combination with conductivity data allowed the quantitative identification of
bicontinuous structures from droplet systems.
Cilek et at [27] when characterising a microemulsion used for oral administration of an
insulin drug, utilised conductivity, turbidity, density, refractive index, DLS and
viscosity to characterise and evaluate the stability of the formulation. They found that
the microemulsion formulation remained stable for at least six months which was
reflected in results obtained from the characterisation techniques used including the
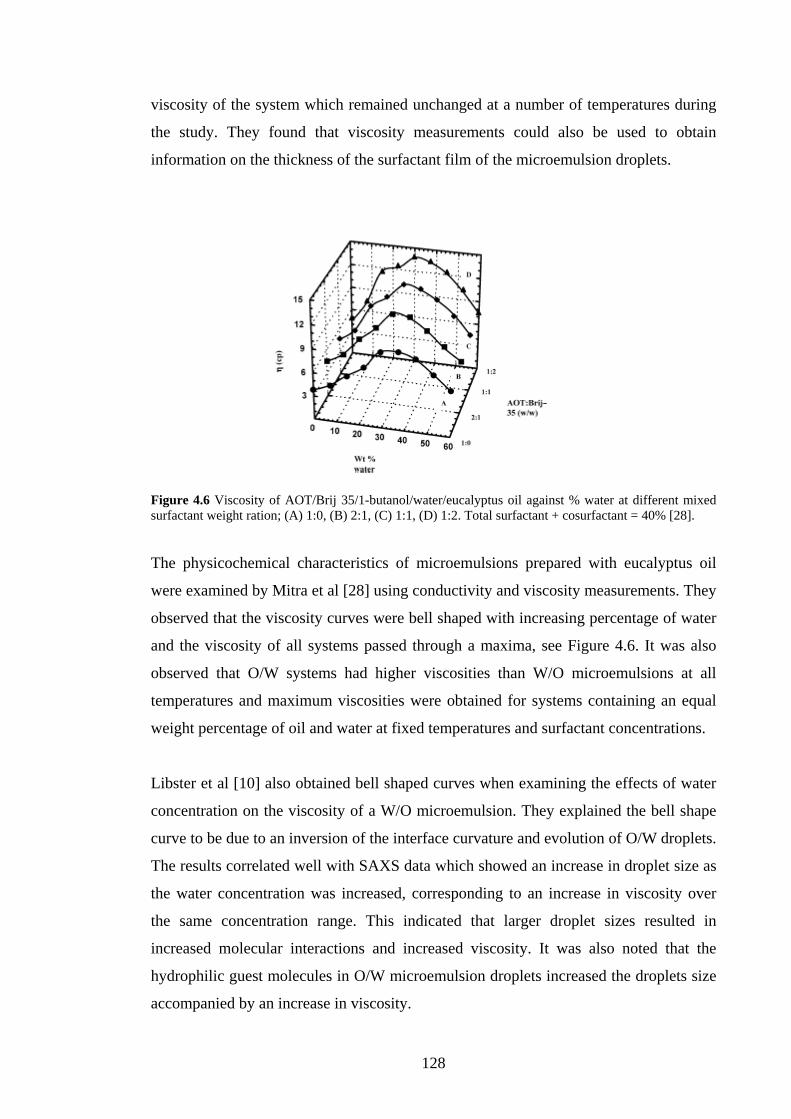
128
viscosity of the system which remained unchanged at a number of temperatures during
the study. They found that viscosity measurements could also be used to obtain
information on the thickness of the surfactant film of the microemulsion droplets.
Figure 4.6 Viscosity of AOT/Brij 35/1-butanol/water/eucalyptus oil against % water at different mixed surfactant weight ration; (A) 1:0, (B) 2:1, (C) 1:1, (D) 1:2. Total surfactant + cosurfactant = 40% [28]. The physicochemical characteristics of microemulsions prepared with eucalyptus oil
were examined by Mitra et al [28] using conductivity and viscosity measurements. They
observed that the viscosity curves were bell shaped with increasing percentage of water
and the viscosity of all systems passed through a maxima, see Figure 4.6. It was also
observed that O/W systems had higher viscosities than W/O microemulsions at all
temperatures and maximum viscosities were obtained for systems containing an equal
weight percentage of oil and water at fixed temperatures and surfactant concentrations.
Libster et al [10] also obtained bell shaped curves when examining the effects of water
concentration on the viscosity of a W/O microemulsion. They explained the bell shape
curve to be due to an inversion of the interface curvature and evolution of O/W droplets.
The results correlated well with SAXS data which showed an increase in droplet size as
the water concentration was increased, corresponding to an increase in viscosity over
the same concentration range. This indicated that larger droplet sizes resulted in
increased molecular interactions and increased viscosity. It was also noted that the
hydrophilic guest molecules in O/W microemulsion droplets increased the droplets size
accompanied by an increase in viscosity.
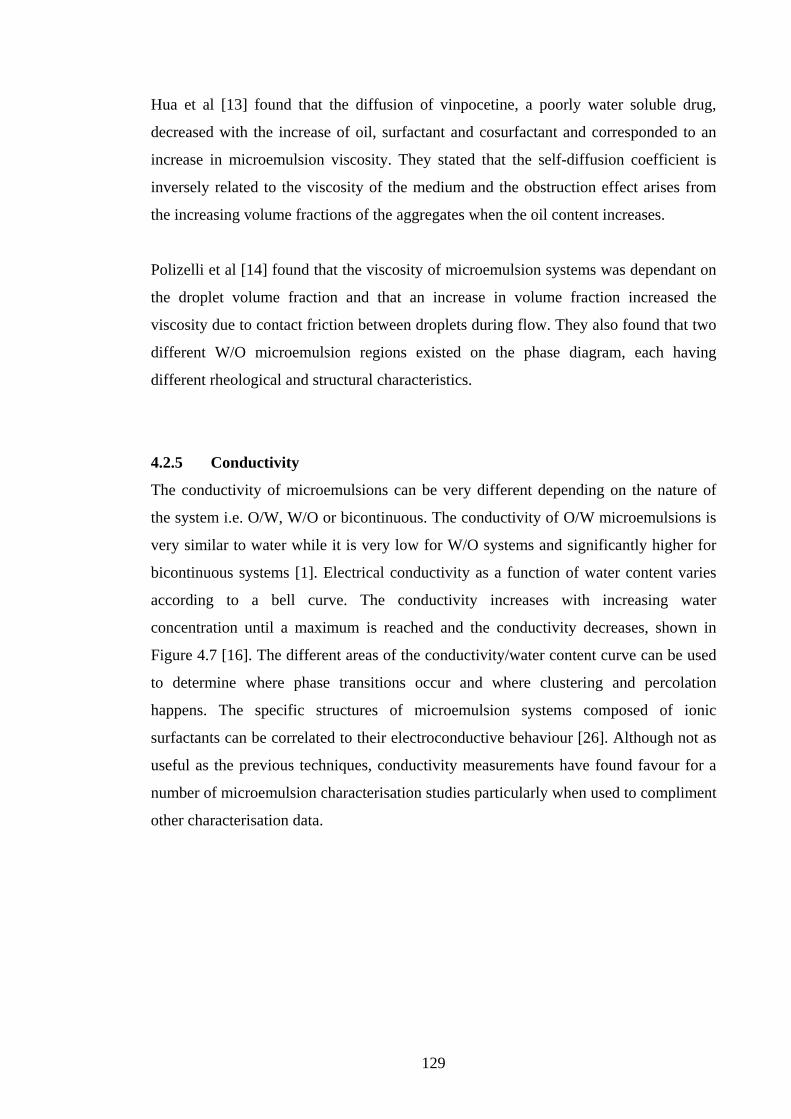
129
Hua et al [13] found that the diffusion of vinpocetine, a poorly water soluble drug,
decreased with the increase of oil, surfactant and cosurfactant and corresponded to an
increase in microemulsion viscosity. They stated that the self-diffusion coefficient is
inversely related to the viscosity of the medium and the obstruction effect arises from
the increasing volume fractions of the aggregates when the oil content increases.
Polizelli et al [14] found that the viscosity of microemulsion systems was dependant on
the droplet volume fraction and that an increase in volume fraction increased the
viscosity due to contact friction between droplets during flow. They also found that two
different W/O microemulsion regions existed on the phase diagram, each having
different rheological and structural characteristics.
4.2.5 Conductivity
The conductivity of microemulsions can be very different depending on the nature of
the system i.e. O/W, W/O or bicontinuous. The conductivity of O/W microemulsions is
very similar to water while it is very low for W/O systems and significantly higher for
bicontinuous systems [1]. Electrical conductivity as a function of water content varies
according to a bell curve. The conductivity increases with increasing water
concentration until a maximum is reached and the conductivity decreases, shown in
Figure 4.7 [16]. The different areas of the conductivity/water content curve can be used
to determine where phase transitions occur and where clustering and percolation
happens. The specific structures of microemulsion systems composed of ionic
surfactants can be correlated to their electroconductive behaviour [26]. Although not as
useful as the previous techniques, conductivity measurements have found favour for a
number of microemulsion characterisation studies particularly when used to compliment
other characterisation data.
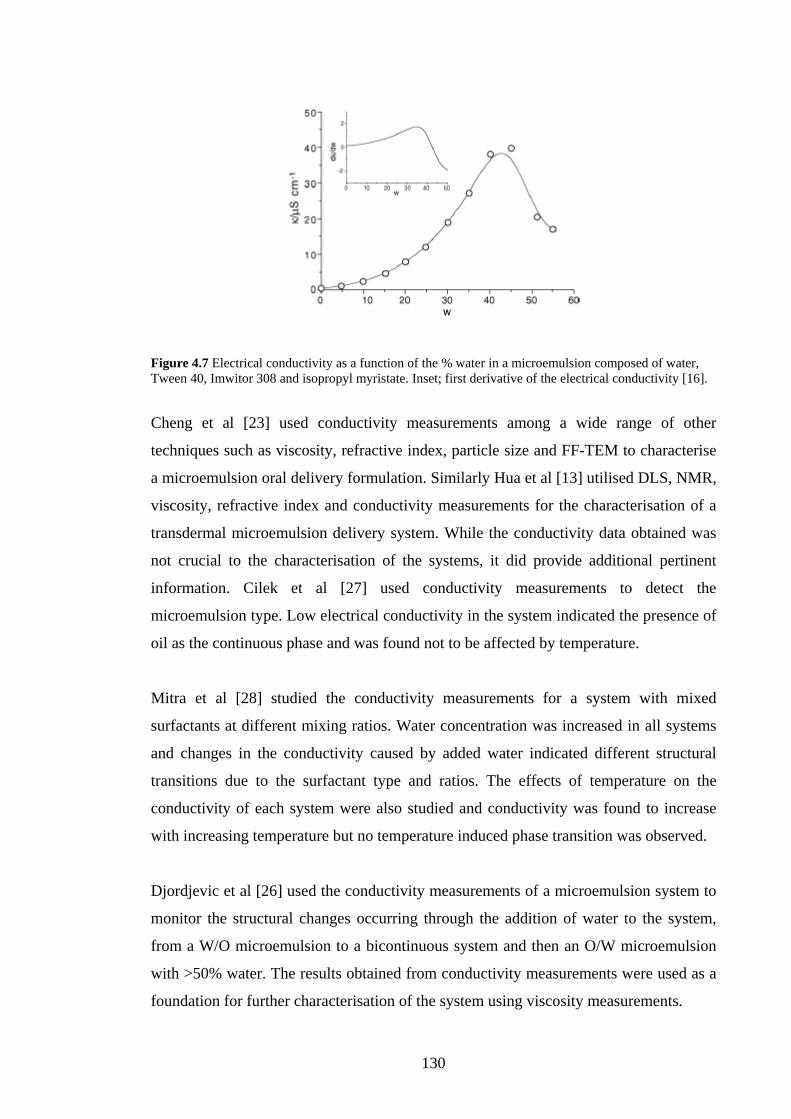
130
Figure 4.7 Electrical conductivity as a function of the % water in a microemulsion composed of water, Tween 40, Imwitor 308 and isopropyl myristate. Inset; first derivative of the electrical conductivity [16].
Cheng et al [23] used conductivity measurements among a wide range of other
techniques such as viscosity, refractive index, particle size and FF-TEM to characterise
a microemulsion oral delivery formulation. Similarly Hua et al [13] utilised DLS, NMR,
viscosity, refractive index and conductivity measurements for the characterisation of a
transdermal microemulsion delivery system. While the conductivity data obtained was
not crucial to the characterisation of the systems, it did provide additional pertinent
information. Cilek et al [27] used conductivity measurements to detect the
microemulsion type. Low electrical conductivity in the system indicated the presence of
oil as the continuous phase and was found not to be affected by temperature.
Mitra et al [28] studied the conductivity measurements for a system with mixed
surfactants at different mixing ratios. Water concentration was increased in all systems
and changes in the conductivity caused by added water indicated different structural
transitions due to the surfactant type and ratios. The effects of temperature on the
conductivity of each system were also studied and conductivity was found to increase
with increasing temperature but no temperature induced phase transition was observed.
Djordjevic et al [26] used the conductivity measurements of a microemulsion system to
monitor the structural changes occurring through the addition of water to the system,
from a W/O microemulsion to a bicontinuous system and then an O/W microemulsion
with >50% water. The results obtained from conductivity measurements were used as a
foundation for further characterisation of the system using viscosity measurements.

131
Alany et al [24] used conductivity measurements to compare electrical conductivities of
a microemulsion with 1-butanol as the co-surfactant and a system without cosurfactant.
They found that the cosurfactant greatly increased the systems conductivity. They were
also able to estimate the magnitude of the changes occurring during phase transition and
estimate the phase transition threshold which may have important implications in drug
delivery systems.
4.2.6 Differential Scanning Calorimetry (DSC)
The state of water in a microemulsion system is indicated by the size and position of the
peak in a DSC cooling curve that represents the freezing of water. Water molecules that
interact strongly with surfactant molecules freeze at lower temperatures than those with
weaker interactions [16]. By analysing microemulsion samples with DSC, changes in
the cooling/heating curve can be observed [25].
Podlogar et al [16] found that the DSC heating curve did not reveal any valuable data
when characterising a drug delivery microemulsion. Analysis of the cooling curve for a
microemulsion containing 10% water revealed a peak for the oil phase, isopropyl
myristate, at -8 ºC representing the freezing of the oil phase. A separate peak for the
water in the system appeared at -45 ºC for the microemulsion with 15% water and
appeared at higher temperatures with increasing amounts of water. These peaks
indicated the freezing of the internal water in the microemulsion. As the freezing
temperature was very low, the water was strongly bound with the surfactants. DSC
measurements of systems with large amounts of water and surfactant showed peaks
indicative of free water. They concluded that the microemulsions with more than 35%
water were of the O/W type.
Another study by Podlogar et al [29] found that microemulsions with between 0 and
15% water and containing very high surfactant/cosurfactant concentrations (up to 80%)
exhibited no freezing peak for water. This was explained to be due to the large amount
of surfactant in the system which lowered the freezing enthalpy of the bound water
below the limit of detection. At higher water concentrations, above 20%, the freezing
peak for water was observed and also moved toward higher temperatures with
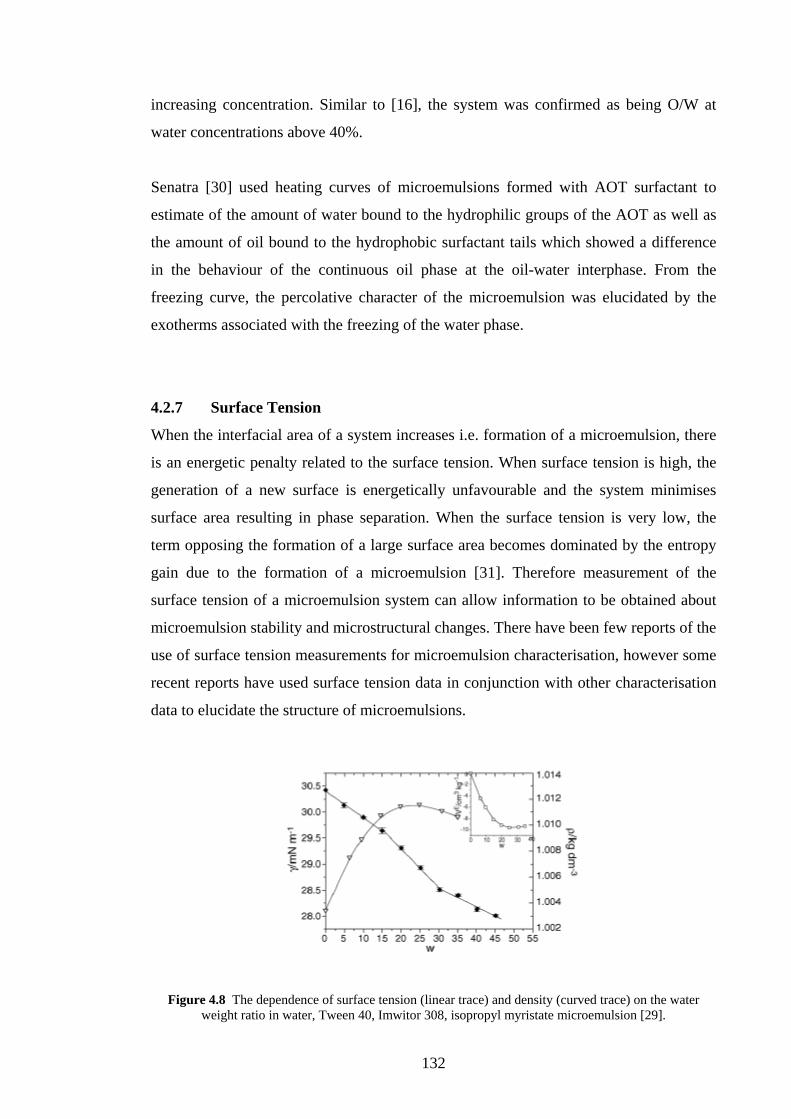
132
increasing concentration. Similar to [16], the system was confirmed as being O/W at
water concentrations above 40%.
Senatra [30] used heating curves of microemulsions formed with AOT surfactant to
estimate of the amount of water bound to the hydrophilic groups of the AOT as well as
the amount of oil bound to the hydrophobic surfactant tails which showed a difference
in the behaviour of the continuous oil phase at the oil-water interphase. From the
freezing curve, the percolative character of the microemulsion was elucidated by the
exotherms associated with the freezing of the water phase.
4.2.7 Surface Tension
When the interfacial area of a system increases i.e. formation of a microemulsion, there
is an energetic penalty related to the surface tension. When surface tension is high, the
generation of a new surface is energetically unfavourable and the system minimises
surface area resulting in phase separation. When the surface tension is very low, the
term opposing the formation of a large surface area becomes dominated by the entropy
gain due to the formation of a microemulsion [31]. Therefore measurement of the
surface tension of a microemulsion system can allow information to be obtained about
microemulsion stability and microstructural changes. There have been few reports of the
use of surface tension measurements for microemulsion characterisation, however some
recent reports have used surface tension data in conjunction with other characterisation
data to elucidate the structure of microemulsions.
Figure 4.8 The dependence of surface tension (linear trace) and density (curved trace) on the water weight ratio in water, Tween 40, Imwitor 308, isopropyl myristate microemulsion [29].

133
Podlogar et al [16, 29] conducted an array of characterisation procedures on
microemulsions prepared with Tween 40 surfactant, water, Imwitor 308 cosurfactant
and isopropyl mysristate as the oil phase including surface tension analysis. They found
that surface tension displayed a linear relationship with the amount of water in the
microemulsion and breaks in the linear curve coincided to DSC and conductivity
measurements which suggested structural changes at different compositions, see Figure
4.8.
4.2.8 Density
The density of any system depends on the relative concentrations of its components and
on the effects of components on each other. This was shown by Podlogar et al [16, 29]
when adding water to a microemulsion made up of the same components listed in the
previous paragraph. The density increased up to ~15% water, after which it remained
constant. Calculation of the excess volume of water as a function of water content in the
system showed that the volumes were not additive and considerable contraction of the
internal phase volume occurred.
Cilek et al [27] used density measurements to monitor microemulsion formulations
containing volatile compounds where changes in the density over time would indicate
evaporation of the compound and changes in the microemulsion composition.
4.2.9 Turbidity
The definition of microemulsions as clear, isotropic, thermodynamically stable mixtures
of water, oil, a surfactant and cosurfactant makes turbidity assessments valuable for
determining the stability of microemulsion systems. As the microemulsion droplets are
in the low nanometre scale (~10 nm), they do not scatter light. Any evidence of
turbidity in the system would indicate that the system was thermodynamically unstable
resulting in a decrease in the interfacial area between the oil-water and an increase in
droplet size to the micrometer scale with the formation of a macroemulsion.
134
Cho et al [32] assessed the stability of microemulsions by turbidity measurements using
a UV/VIS spectrophotometer. Samples were contained within quartz cuvettes with a
path length of 1 cm and all measurements were observed at a wavelength of 502 nm.
The turbidity was calculated as turbidity × path length = 2.303 × absorbance [32]. Cilek
et al [27] studied the stability of a microemulsion formulation for oral administration
using a number of methods including turbidity assessment. They found that low
temperatures (4 ºC) produced mild turbidity after two months but this was eliminated
after the samples were brought to room temperature.
4.2.10 Refractive Index (RI)
Refractive index measurements can provide limited information on the structure of
microemulsions, however consistent RI values at different microemulsion compositions
can indicate that the microstructure has not changed. It can also be useful to monitor
phase transitions for long term microemulsion stability studies [27]. Hua et al [13] used
RI measurements as supplementary data for the characterisation of a transdermal
delivery microemulsion, however the value of the data was limited.
4.2.11 Polarised Light Microscopy (PLM)
Djordjevic et al [26] used PLM to determine the optical isotropy of microemulsion
samples used for drug delivery and found it to be a useful tool to distinguish isotropic
microemulsions from anisotropic lamellar and hexagonal mesophases.
4.2.12 Fluorescence Correlation Spectroscopy (FCS)
FCS is used for the measurement of translational diffusion rates of fluorescent species
in solution. As fluorophores diffuse in and out of this illuminated volume, the
fluorescence intensity fluctuates and can be time correlated using mathematical
equations [33]. This characterisation technique has not found much use to date for
microemulsion characterisation however Burnett et al [33] stated that FCS was a
powerful technique for determining the size of W/O microemulsions droplets. The
technique offered advantages over scattering methods such as SANS or SAXS by being
less expensive and more sensitive.
135
4.2.13 Other Characterisation Techniques
There are many less well known and less reported techniques used for microemulsion
characterisation which will not be discussed in detail in this brief review. Moulik &
Paul [1] dedicate a section in a hugely comprehensive review of the structure, dynamics
and transport properties of microemulsions to these lesser used methods. Some of these
techniques include; dielectric permittivity, electrophoretic birefringence, ultrasonic
interferometry, ultrasonic absorption, adiabatic compressibility and positron
annihilation spectroscopy.
4.3 Conclusions
The number of reports of MEEKC and MELC for pharmaceutical separations is
continuing to grow. The fundamentals of MEEKC and MELC separations however,
have yet to be related to the physical characteristics of the microemulsions used as
sample solvents, mobile phases and carrier electrolytes.
Information about the internal structures and the dynamic processes and properties
within microemulsion systems has been shown in this chapter to be extremely important
for a range of microemulsion applications. Although the majority of these were related
to microemulsions as drug delivery vehicles, the techniques used could be extremely
useful in gaining a more in-depth understanding of the separation processes taking place
within the microemulsion systems used for MEEKC & MELC.
Modification of microemulsion mobile phases and electrolytes with organic additives,
salts, cyclodextrins etc. is a standard procedure in MEEKC and MELC method
development. However, the effects of using modifiers on the microstructure and
interfacial properties of the microemulsion systems have never been fully investigated
or related to other separation parameters such as analyte type and charge, analysis time
etc.
The techniques outlined in this short review, either used alone or as part of an array of
tests, could provide a better understanding of the processes and structural changes
taking place in microemulsions utilised for MEEKC and MELC separations.
136
4.4 References [1] Moulik SP, Paul BK, Advances In Colloid and Interface Science, 78, 99-195 (1998).
[2] Becher P, Schuster D, Encyclopedia of Emulsion Technology: Basic Theory
Measurement. Marcel Decker (1988).
[3] www.unifr.ch/physics/fk/Research/Neut.html Site accessed 10-06-08
[4] www.ipfdd.de/X-ray-Lab.197.0.html Site accessed 10-06-08
[5] Lawrence M.J, Rees GD, Advanced Drug Delivery Reviews 45, 89-121 (2000).
[6] Attwood D, Mallon C, Ktistis G, Taylor CJ, Int J Pharm 88, 471-422 (1992).
[7] Aboofazeli R, Barlow DJ, Lawrence MJ, AAPS Pharm. Sci. 2 449-470 (2000).
[8] Glatter O, Orthaber D, Stradner A, Scherf G, Fanun M, J Colloid Interfacial Science
241, 215-225 (2001).
[9] Dunn CM, Robinson BH, Leng FJ, Spectrochimica Acta 46A, 1017-1025 (1990).
[10] Libster D, Aserin A, Garti N, J Colloid Interfacial Science 302, 322-329 (2006).
[11] Itoh K, Matsui S, Tozuka Y, Oguchi T, Yamamoto K, International Journal
Pharmaceutics 246, 75-83 (2002).
[12] Tomsic M, Podlogar F, Gasperlin M et al, Int J Pharm 327, 170-177 (2006).
[13] Hua L, Weisan L, Ying Z, Drug Dev Ind Pharm 30, 657-666 (2004).
[14] Polizelli MA, Telis VRN, Amaral LQ, Feitosa E, Colloids & Surfaces A 281, 230-236
(2006).
[15] Kim CK, Ryuu SA, Park KM, Lim SJ, Hwang SJ, Int J Pharm 147, 131-134 (1997).
[16] Podlogar F, Gasperlin M, Tomsic M, Jamnik A, Rogac MB, Int J Pharm 276, 115-
128 (2004).
[17] Kahle KA, Foley JP, Electrophoresis 27, 4321-4333 (2006).
[18] Pomponio R, Gotti R, Luppi B, Cavrini V, Electrophoresis 24, 1658-1667 (2003).
[19] Kumar P, Mittal KL, Handbook of microemulsion Science and technology, CRC Press
(1999).
[20] Kreilgaard M, Pedersen EJ, Jaroszewski JW, J Controlled Release 69, 421-433
(2000).
[21] Prud’Homme RK, Khan SA, Foams: Theory, Measurements and applications, CRC
Press (1995).
[22] Kraeul K, Girvan L, Hook S, Rades T, Micron 38 (8), 796-803 (2007).
[23] Cheng MB, Wang JC, LI YH et al, J Controlled Release 129, 41-48 (2008).
[24] Alany RG, Tucker IG, Davies NM, Rades T, Drug Dev Ind Pharm 27, 31-38 (2001).
[25] Tadros TF, Surfactants in Agrochemicals, CRC Press (1995).
[26] Djordjevic L, Primorac M, Stupar M, Krajisnik D, Int J Pharm 271, 11-19 (2004).
[27] Cilek A, Celebi N, Tirnaksiz F, Drug Delivery 13, 19-24 (2006).
137
[28] Mitra RK, Paul BK, J Colloid Interfacial Science 283, 565-577 (2005).
[29] Podlogar F, Rogac MB, Gasperlin M, Int J Pharm 302, 68-77 (2005).
[30] Senatra D, Pratesi R, Pieraccini L, J Thermal Anal Calorimetry 51, 79-90 (1998).
[31] Malmsten M, Surfactants and Polymers in Drug Delivery, Informa Health Care
(2002).
[32] Cho YH, Kim S, Bae EK et al, J Food Science 73, 115-121 (2008).
[33] Burnett GR, Rees GD, steytler DC, Robinson BH, Colloids & Surfaces: Physicochem.
Eng. Aspects 250, 171-178 (2004).
138
Section II
Experimental Studies
139
Chapter Five Studies into the Optimisation of MELC Methods
for the Analysis of Hydrophobic Pharmaceutical
Formulations

140
5.1 Introduction & Aims
Microemulsion Liquid Chromatography (MELC) as described in Chapter One is a
relatively new chromatographic technique, which utilises microemulsions as a mobile
phase and has been shown to be suitable for the separation of a range of pharmaceutical
compounds using both isocratic and gradient elution modes [1, 2] and has been used for
validated determinations of fosinoprilat in human plasma [3] and simvastatin and its
impurities in bulk drug and tablet formulations [4]. Oil-in-water microemulsions are
composed of nanometre sized droplets of a water immiscible liquid (oil) phase
dispersed throughout an aqueous continuous phase, these oil droplets are stabilised by
the presence of a surfactant and a co-surfactant which reduce the interfacial tension at
the oil/water interface to almost zero, resulting in a stable system. Microemulsions
possess a unique property in that they can solubilise both polar and non-polar
substances due to the arrangement of the oil and aqueous phases. Due to the high
aqueous content of O/W microemulsions, they are very compatible with reversed-phase
HPLC columns while the hydrophobic oil core gives them the ability to dissolve non-
polar solutes and sample matrices.
Paracetamol, also known as acetaminophen, is an analgesic and antipyretic commonly
used as a treatment for pain relief and fever and is considered safe for use in a variety of
patients including the elderly, pregnant women and children. Paracetamol is available as
a non-prescription drug in a variety of over the counter preparations such as soluble,
insoluble and dispersible tablets, oral suspensions, solutions and suppositories.
Generally when water-soluble pharmaceutical compounds are present in non-polar
matrices such as creams, ointments or suppositories, dissolution of the non-polar matrix
in a suitable solvent and extraction of the active compound is required before analysis is
possible. Various methods such as calorimetry [5], spectrophotometry [6] and HPLC
with inverse supercritical extraction [7] have been reported for the assay of paracetamol
in suppositories. The latter method reported an improvement in analysis times compared
to US Pharmacopoeia (1998) method but still required a number of time consuming
extraction steps before HPLC analysis was possible. The British Pharmacopoeia 2005
[8] details a titrimetric assay method, which requires refluxing 5 individual suppository
samples in acid for one hour, followed by a number of intermediate steps before
titration and calculation of a mean assay value.
141
In this study, a commercially available paracetamol suppository preparation, Paralink™,
was obtained and a previously reported MELC method which was first used by Marsh
et al [1, 2] for the analysis of a number of pharmaceutical compounds was optimised for
the rapid determination of paracetamol. This method used a microemulsion composition
of 33 g SDS, 66 g butan-1-ol, 8 g n-octane in 1L of 0.05% trifluoroacetic acid (TFA).
A MELC method for the analysis of paracetamol in suppositories using a cationic
microemulsion with CTAB (cetyltrimethylammonium bromide) as the surfactant was
also to be developed and compared to the SDS MELC method with an equimolar
amount of CTAB used as a substitute for SDS in the microemulsion. To date, MELC
using cationic microemulsions has not been reported for pharmaceutical applications
although Marsh et al [1] did study a number of different cationic surfactants for the
MELC separation of a test mixture and found them to produce inferior results compared
to anionic SDS microemulsions.
Further to the method for paracetamol analysis, it was aimed to demonstrate the
capability of SDS MELC to rapidly analyse the active component in a different type of
hydrophobic preparation. A commercially available topical cream, Proflex CreamTM,
containing 5% w/w ibuprofen, a non steroidal anti inflammatory was chosen. The
British Pharmacopoeia [9] describes a HPLC method for the analysis of ibuprofen in
cream formulations using a methanol/water/orthophosphoric acid mobile phase. Other
methods have been reported using capillary electrophoresis [10], solid phase extraction
with UV spectrophotometry [11] and spectrofluorimetry [12]. While the latter method
was reported to achieve relatively short retention times, sample pre-treatment was still
necessary as described in the British Pharmacopoeia (1998). For the purpose of this
study, the BP (2005) method was used for comparison to the optimised MELC method.
The same method optimisation procedure was carried out for the MELC analysis of
ibuprofen i.e. the effects of organic additives and temperature on peak efficiency and
retention times.
Validation of both the analysis of paracetamol in a suppository and ibuprofen in a cream
was carried out according to ICH guidelines [13] for linearity, accuracy, precision, LOD
and LOQ, using methyl and propyl parabens as internal standards. The BP (2005) assay
methods for paracetamol in a suppository and ibuprofen in a cream were carried out to

142
compare the efficiency of the method in terms of analysis times, sample preparation,
assay results and general ease of use.
5.2 Materials and Methods
5.2.1 Chemicals
Propyl paraben, methyl paraben and paracetamol were obtained from Sigma-Aldrich
(Ireland). The microemulsion components; HPLC grade water, n-octane, trifluoroacetic
acid (TFA), butan-1-ol, SDS and CTAB were obtained from Lennox Laboratory
Supplies (Ireland). Organic additives; propan-1-ol and acetonitrile were also obtained
from Lennox.
Paralink suppositories containing 500 mg paracetamol and Proflex cream containing 5%
w/w ibuprofen were purchased over the counter from a local pharmacy. Reference assay
method requirements; sulphuric acid, ferroin solution, dilute hydrochloric acid,
orthophosphoric acid, HPLC grade methanol and ammonium cerium (IV) sulphate were
obtained from the chemical stores at WIT.
5.2.2 Equipment
A Hewlett Packard 1050 HPLC system equipped with HP solvent degassing module
(model G1303A), HP variable wavelength UV/Vis detector (79853C), HP solvent
cabinet and column heater (79856A), HP 21 station autosampler (79855A), and HP
quaternary pump (79852A) coupled to an Agilent Chemstation data management
system (Rev.A.09.01 [1206]) was used for all work carried out.
Method optimisation for the detection of paracetamol and ibuprofen using the SDS
MELC method was carried out using a Waters Symmetryshield RP18 150 mm x 4.6
mm column with 3.5 µm packing material. To further reduce the analysis times for the
suppository samples, the optimised methods were transferred to a Waters Symmetry
C18 100 mm x 4.6 mm column with 3.5 µm packing material. A Waters RP
Symmetryshield 150 mm x 4.6 mm with 3.5 µm packing material was used for the
ibuprofen reference method and all CTAB MELC work.

143
5.3 SDS MELC - Method optimisation
5.3.1 Microemulsion preparation
The microemulsion reported by Marsh et al [1], referred to as the ‘standard’
microemulsion was prepared by mixing 66 g of butan-1-ol, 8 g of n-octane and 33 g of
SDS. This was sonicated for 10 minutes until a homogeneous solution was achieved. 1
litre of 0.05% v/v TFA was then added, sonicated for 30 minutes and filtered.
Amounts of propan-1-ol and acetonitrile were added to the prepared microemulsion to
give a range of concentrations from 0 to 30.5% v/v propan-1-ol and from 0 to 7.4% v/v
acetonitrile. Above these concentrations the microemulsion broke down resulting in a
cloudy dispersion of the components suggesting the formation of an emulsion. The
addition of each solvent was carried out slowly while sonicating to prevent the
microemulsion becoming disrupted. Above 3.8% v/v acetonitrile the microemulsion
became very cloudy and prolonged sonication was required to re-form the
microemulsion.
5.3.2 Reference standard solution preparation
3.9 mg of paracetamol and 2.0 mg of ibuproen reference standards were dissolved in
approx 15 ml of the standard microemulsion by sonicating for 5 minutes. The sample
solution was allowed to cool and made up to 20 ml with the microemulsion in a
volumetric flask.
5.3.3 Chromatographic conditions
The 150 mm column was used for method optimisation. The variable wavelength
detector was set at 220 nm for all runs. Injection volume was 5 µl. The initial runs for
all concentrations of organic modifiers were carried out with the column temperature set
to 60º C to monitor retention times and peak efficiency. The flow rate was varied
between 1 & 2 ml.min-1 to monitor the retention times of both solutes and the back-
pressure generated by the relatively viscous microemulsion.
5.3.4 Optimising the Microemulsion composition
The reference sample solution was run using both the propan-1-ol and acetonitrile
modified microemulsions over a range of concentrations stated in Section 5.3.1. Once
the optimum microemulsion composition was determined in terms of retention time and
peak efficiency, the reference standard was run using the chosen microemulsion at a
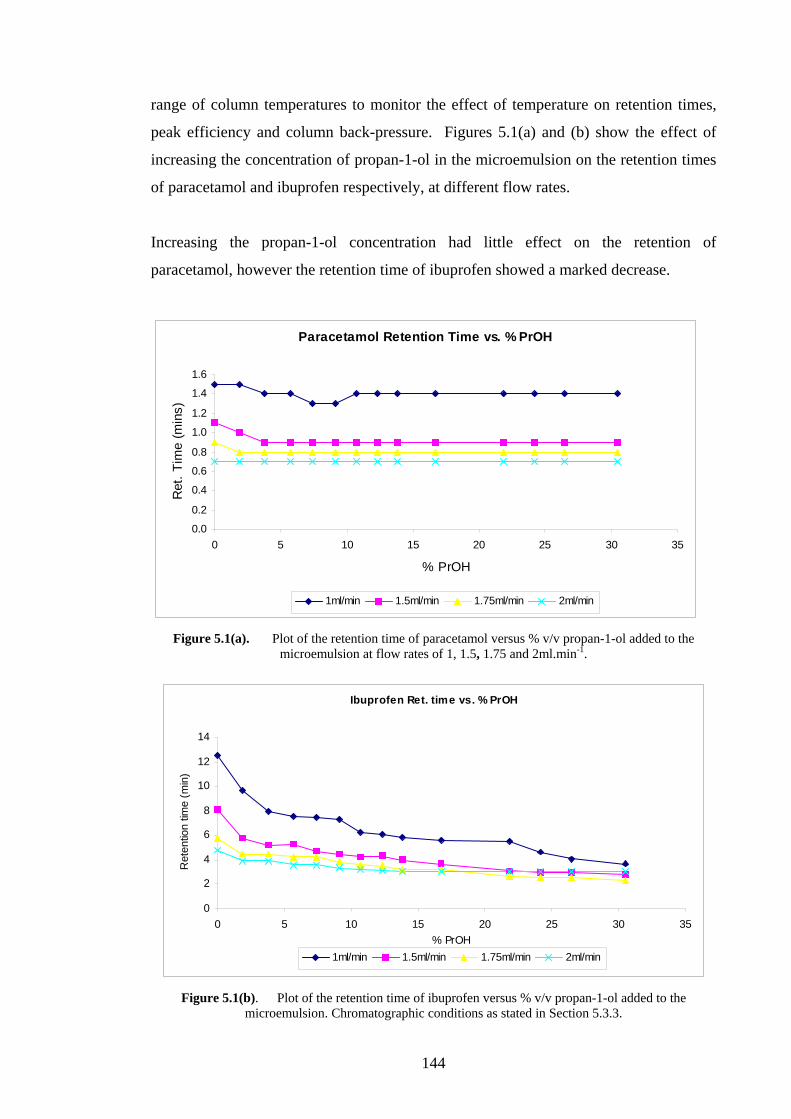
144
range of column temperatures to monitor the effect of temperature on retention times,
peak efficiency and column back-pressure. Figures 5.1(a) and (b) show the effect of
increasing the concentration of propan-1-ol in the microemulsion on the retention times
of paracetamol and ibuprofen respectively, at different flow rates.
Increasing the propan-1-ol concentration had little effect on the retention of
paracetamol, however the retention time of ibuprofen showed a marked decrease.
Paracetamol Retention Time vs. % PrOH
0.0
0.2
0.4
0.6
0.8
1.0
1.2
1.4
1.6
0 5 10 15 20 25 30 35
% PrOH
Ret
. Tim
e (m
ins)
1ml/min 1.5ml/min 1.75ml/min 2ml/min
Figure 5.1(a). Plot of the retention time of paracetamol versus % v/v propan-1-ol added to the microemulsion at flow rates of 1, 1.5, 1.75 and 2ml.min-1.
Ibuprofen Ret. time vs. % PrOH
0
2
4
6
8
10
12
14
0 5 10 15 20 25 30 35% PrOH
Ret
entio
n tim
e (m
in)
1ml/min 1.5ml/min 1.75ml/min 2ml/min
Figure 5.1(b). Plot of the retention time of ibuprofen versus % v/v propan-1-ol added to the
microemulsion. Chromatographic conditions as stated in Section 5.3.3.

145
The addition of acetonitrile up to 7.4% v/v resulted in a slight decrease in retention of
paracetamol over the concentration range used. The retention of ibuprofen was reduced
significantly by a lower concentration of acetonitrile when compared to the addition of
propan-1-ol. The effect of acetonitrile addition on the retention of both compounds is
illustrated in Figures 5.2(a) and (b)
Paracetamol ret. time vs. % ACN
0
0.2
0.4
0.6
0.8
1
1.2
1.4
1.6
0 1 2 3 4 5 6 7 8
% ACN
Ret
entio
n tim
e (m
in)
1ml.min 1.5ml/min 1.75ml/min 2ml/min
Figure 5.2(a). Plot of the retention of paracetamol versus % v/v acetonitrile added to the
microemulsion.
Ibuprofen retention time vs. % ACN
0
2
4
6
8
10
12
14
0 1 2 3 4 5 6 7 8
% ACN
Ret
entio
n tim
e (m
in)
1ml/min 1.5ml/min 1.75ml/min 2ml/min
Figure 5.2(b). Plot of retention of ibuprofen versus % acetonitrile added to the microemulsion.
Chromatographic conditions as in Figure 5.1.

146
Peak efficiency values were calculated for both compounds using both modified
microemulsions over the same concentration ranges at a flow rate of 1.5 ml.min-1.
Figures 5.3(a) and (b) show the effect of each additive and their concentration on the
peak efficiency of both compounds. As illustrated, small amounts of each organic
additive had a different effect on the peak efficiency of paracetamol and ibuprofen but
subsequent increases in concentration caused no further change in peak efficiency.
Peak efficiency vs. % PrOH
0
2000
4000
6000
8000
10000
12000
14000
0 5 10 15 20 25 30 35
% PrOH
Num
ber
of T
heor
etic
al p
late
s
Ibuprofen Paracetamol
Figure 5.3(a). The effect of propan-1-ol addition to the microemulsion on the peak efficiencies of paracetamol and ibuprofen.
Peak efficiency vs. % ACN
0
2000
4000
6000
8000
10000
12000
14000
0 1 2 3 4 5 6 7 8
% ACN
No.
of T
heor
etic
al P
late
s
Ibuprofen Paracetamol
Figure 5.3(b) The effect of acetonitrile addition on peak efficiencies of both ibuprofen & paracetamol.

147
5.3.5 Optimising column temperature and flow rate.
The optimum microemulsion composition for the analysis of paracetamol was chosen to
be the standard microemulsion plus 3% v/v acetonitrile as this was the easiest to prepare
without disrupting the system while still providing high efficiency values and low
retention times. For the analysis of ibuprofen, the addition of 22% v/v propan-1-ol to
the standard microemulsion was chosen as this too yielded a stable system while
providing low retention times and high efficiency values.
The propan-1-ol modified microemulsion was used to monitor the effects of column
temperature on column back-pressure, retention times and peak efficiencies. The
temperature range used was 25-60º C. It was found that increasing the column
temperature over the chosen range did not have a significant effect on the retention of
either compound and reduced their retention times only fractionally. Similarly, peak
efficiency values were not affected to any significant degree and a slight increase was
noted.
There was however a significant drop in column back-pressure as the temperature was
increased. The viscosity of the microemulsion was measured over the same temperature
range and it was found that column temperature, column back-pressure and
microemulsion viscosity showed a direct relationship. When choosing the column
temperature and flow rate for both compounds, it was decided that a column
temperature of 50º C and a flow rate of 1.75 ml.min-1 were the optimum values to give
short retention times and keep column back-pressure well below the instruments limit.
5.3.6 Transfer of the method to a shorter column
As is common practice in HPLC method development, an optimised method can be
transferred to a shorter column to further reduce analysis times. In this case both
methods were successfully transferred to a Waters Symmetry C18 100 mm x 4.6 mm
column with 3.5 µm packing material resulting in a further reduction in analysis time.
5.3.7 Choosing an internal standard
It was known from previous experiments [2] that a range of paraben preservatives
eluted quickly in the order of methyl, ethyl and propyl paraben when using the standard
microemulsion as an eluent in MELC. After spiking the paracetamol/ibuprofen
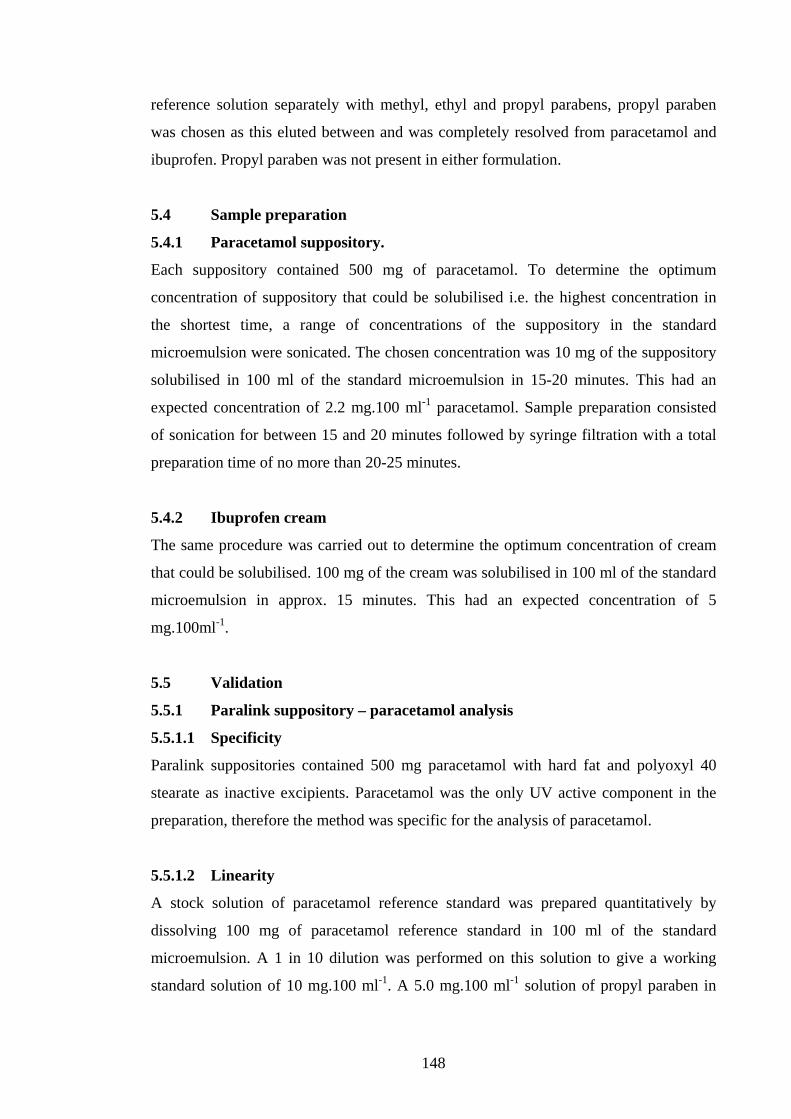
148
reference solution separately with methyl, ethyl and propyl parabens, propyl paraben
was chosen as this eluted between and was completely resolved from paracetamol and
ibuprofen. Propyl paraben was not present in either formulation.
5.4 Sample preparation
5.4.1 Paracetamol suppository.
Each suppository contained 500 mg of paracetamol. To determine the optimum
concentration of suppository that could be solubilised i.e. the highest concentration in
the shortest time, a range of concentrations of the suppository in the standard
microemulsion were sonicated. The chosen concentration was 10 mg of the suppository
solubilised in 100 ml of the standard microemulsion in 15-20 minutes. This had an
expected concentration of 2.2 mg.100 ml-1 paracetamol. Sample preparation consisted
of sonication for between 15 and 20 minutes followed by syringe filtration with a total
preparation time of no more than 20-25 minutes.
5.4.2 Ibuprofen cream
The same procedure was carried out to determine the optimum concentration of cream
that could be solubilised. 100 mg of the cream was solubilised in 100 ml of the standard
microemulsion in approx. 15 minutes. This had an expected concentration of 5
mg.100ml-1.
5.5 Validation
5.5.1 Paralink suppository – paracetamol analysis
5.5.1.1 Specificity
Paralink suppositories contained 500 mg paracetamol with hard fat and polyoxyl 40
stearate as inactive excipients. Paracetamol was the only UV active component in the
preparation, therefore the method was specific for the analysis of paracetamol.
5.5.1.2 Linearity
A stock solution of paracetamol reference standard was prepared quantitatively by
dissolving 100 mg of paracetamol reference standard in 100 ml of the standard
microemulsion. A 1 in 10 dilution was performed on this solution to give a working
standard solution of 10 mg.100 ml-1. A 5.0 mg.100 ml-1 solution of propyl paraben in

149
the standard microemulsion was prepared as the internal standard. A range of standard
solutions was prepared as shown in Table 5.1.
Table 5.1 Preparation of paracetamol standard solutions with internal standard Standard 1 2 3 4 5
Vol. of paracetamol working std (ml) 1 2 3 4 5 Volume of internal standard (ml) 3 3 3 3 3 Total volume (ml) 25 25 25 25 25 Paracetamol concentration (mg.100 ml-1) 0.4 0.8 1.2 1.6 2.0
10 µl of each standard solution was injected and run in triplicate using the optimised
chromatographic conditions. Mean peak areas for paracetamol and the internal standard
were calculated. A calibration curve was plotted of peak area ratios of
paracetamol/internal standard (P/IS) against concentration.
5.5.1.3 Assay
Five suppositories were accurately weighed and a mean weight was calculated. Each
suppository was expected to have contained 500 mg paracetamol (label claim). It was
determined that each suppository contained 22% w/w paracetamol. The five
suppositories were crushed and a 10 mg.100 ml-1 solution of the suppository was
prepared as described in Section 5.4.1. 12 ml of this solution was added to 3 ml of the
internal standard solution and made up to 25 ml with the standard microemulsion. 10 µl
of this solution was injected and run in triplicate. A sample chromatogram is shown in
Figure 5.4. Mean peak areas for paracetamol and the internal standard were calculated
and the concentration of paracetamol in the sample was calculated using P/IS and the
calibration curve equation. Assay values were compared to label claim as percent
paracetamol recovered.
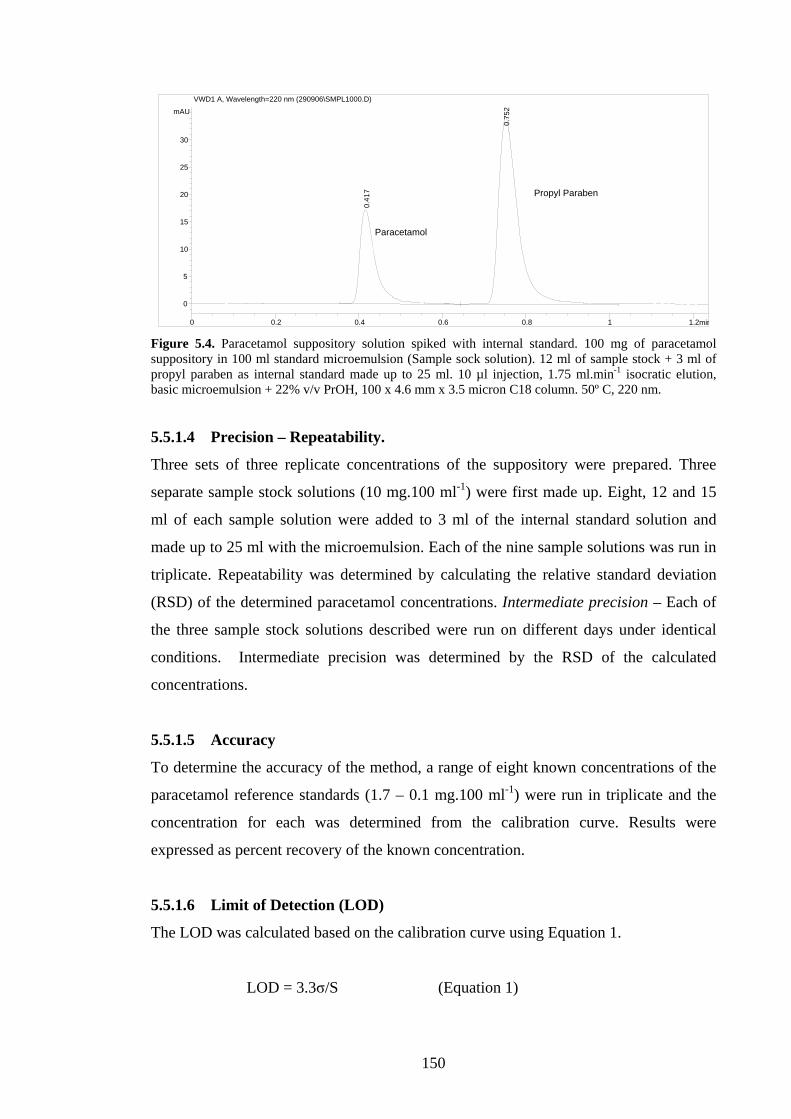
150
min0 0.2 0.4 0.6 0.8 1 1.2
mAU
0
5
10
15
20
25
30
VWD1 A, Wavelength=220 nm (290906\SMPL1000.D)
0.4
17
0.7
52
Paracetamol
Propyl Paraben
Figure 5.4. Paracetamol suppository solution spiked with internal standard. 100 mg of paracetamol suppository in 100 ml standard microemulsion (Sample sock solution). 12 ml of sample stock + 3 ml of propyl paraben as internal standard made up to 25 ml. 10 µl injection, 1.75 ml.min-1 isocratic elution, basic microemulsion + 22% v/v PrOH, 100 x 4.6 mm x 3.5 micron C18 column. 50º C, 220 nm. 5.5.1.4 Precision – Repeatability.
Three sets of three replicate concentrations of the suppository were prepared. Three
separate sample stock solutions (10 mg.100 ml-1) were first made up. Eight, 12 and 15
ml of each sample solution were added to 3 ml of the internal standard solution and
made up to 25 ml with the microemulsion. Each of the nine sample solutions was run in
triplicate. Repeatability was determined by calculating the relative standard deviation
(RSD) of the determined paracetamol concentrations. Intermediate precision – Each of
the three sample stock solutions described were run on different days under identical
conditions. Intermediate precision was determined by the RSD of the calculated
concentrations.
5.5.1.5 Accuracy
To determine the accuracy of the method, a range of eight known concentrations of the
paracetamol reference standards (1.7 – 0.1 mg.100 ml-1) were run in triplicate and the
concentration for each was determined from the calibration curve. Results were
expressed as percent recovery of the known concentration.
5.5.1.6 Limit of Detection (LOD)
The LOD was calculated based on the calibration curve using Equation 1.
LOD = 3.3σ/S (Equation 1)
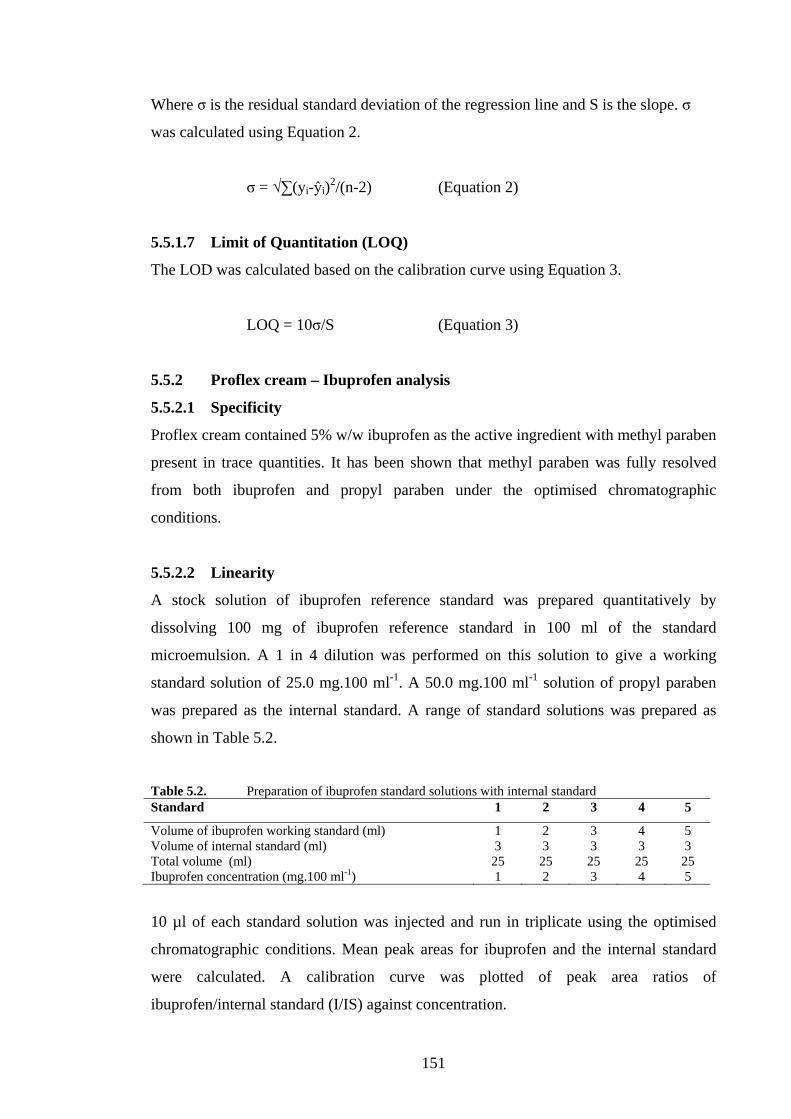
151
Where σ is the residual standard deviation of the regression line and S is the slope. σ
was calculated using Equation 2.
σ = √∑(yi-ŷi)2/(n-2) (Equation 2)
5.5.1.7 Limit of Quantitation (LOQ)
The LOD was calculated based on the calibration curve using Equation 3.
LOQ = 10σ/S (Equation 3)
5.5.2 Proflex cream – Ibuprofen analysis
5.5.2.1 Specificity
Proflex cream contained 5% w/w ibuprofen as the active ingredient with methyl paraben
present in trace quantities. It has been shown that methyl paraben was fully resolved
from both ibuprofen and propyl paraben under the optimised chromatographic
conditions.
5.5.2.2 Linearity
A stock solution of ibuprofen reference standard was prepared quantitatively by
dissolving 100 mg of ibuprofen reference standard in 100 ml of the standard
microemulsion. A 1 in 4 dilution was performed on this solution to give a working
standard solution of 25.0 mg.100 ml-1. A 50.0 mg.100 ml-1 solution of propyl paraben
was prepared as the internal standard. A range of standard solutions was prepared as
shown in Table 5.2.
Table 5.2. Preparation of ibuprofen standard solutions with internal standard Standard 1 2 3 4 5
Volume of ibuprofen working standard (ml) 1 2 3 4 5 Volume of internal standard (ml) 3 3 3 3 3 Total volume (ml) 25 25 25 25 25 Ibuprofen concentration (mg.100 ml-1) 1 2 3 4 5
10 µl of each standard solution was injected and run in triplicate using the optimised
chromatographic conditions. Mean peak areas for ibuprofen and the internal standard
were calculated. A calibration curve was plotted of peak area ratios of
ibuprofen/internal standard (I/IS) against concentration.
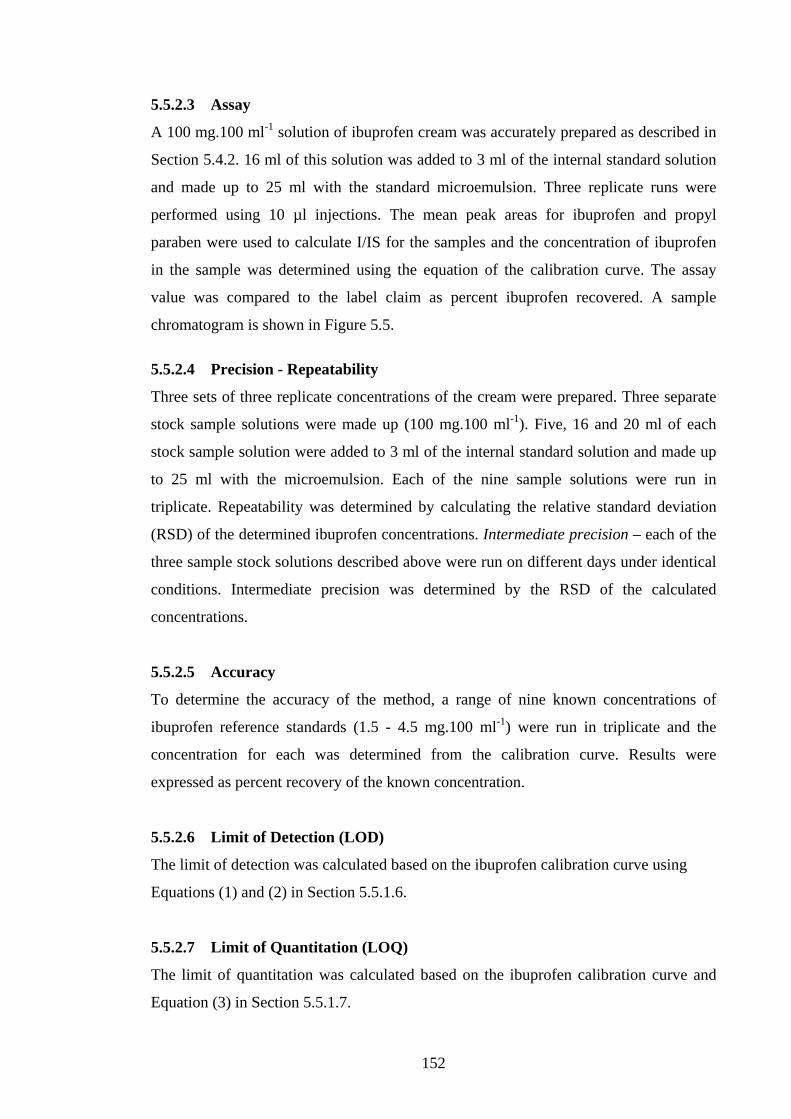
152
5.5.2.3 Assay
A 100 mg.100 ml-1 solution of ibuprofen cream was accurately prepared as described in
Section 5.4.2. 16 ml of this solution was added to 3 ml of the internal standard solution
and made up to 25 ml with the standard microemulsion. Three replicate runs were
performed using 10 µl injections. The mean peak areas for ibuprofen and propyl
paraben were used to calculate I/IS for the samples and the concentration of ibuprofen
in the sample was determined using the equation of the calibration curve. The assay
value was compared to the label claim as percent ibuprofen recovered. A sample
chromatogram is shown in Figure 5.5.
5.5.2.4 Precision - Repeatability
Three sets of three replicate concentrations of the cream were prepared. Three separate
stock sample solutions were made up (100 mg.100 ml-1). Five, 16 and 20 ml of each
stock sample solution were added to 3 ml of the internal standard solution and made up
to 25 ml with the microemulsion. Each of the nine sample solutions were run in
triplicate. Repeatability was determined by calculating the relative standard deviation
(RSD) of the determined ibuprofen concentrations. Intermediate precision – each of the
three sample stock solutions described above were run on different days under identical
conditions. Intermediate precision was determined by the RSD of the calculated
concentrations.
5.5.2.5 Accuracy
To determine the accuracy of the method, a range of nine known concentrations of
ibuprofen reference standards (1.5 - 4.5 mg.100 ml-1) were run in triplicate and the
concentration for each was determined from the calibration curve. Results were
expressed as percent recovery of the known concentration.
5.5.2.6 Limit of Detection (LOD)
The limit of detection was calculated based on the ibuprofen calibration curve using
Equations (1) and (2) in Section 5.5.1.6.
5.5.2.7 Limit of Quantitation (LOQ)
The limit of quantitation was calculated based on the ibuprofen calibration curve and
Equation (3) in Section 5.5.1.7.
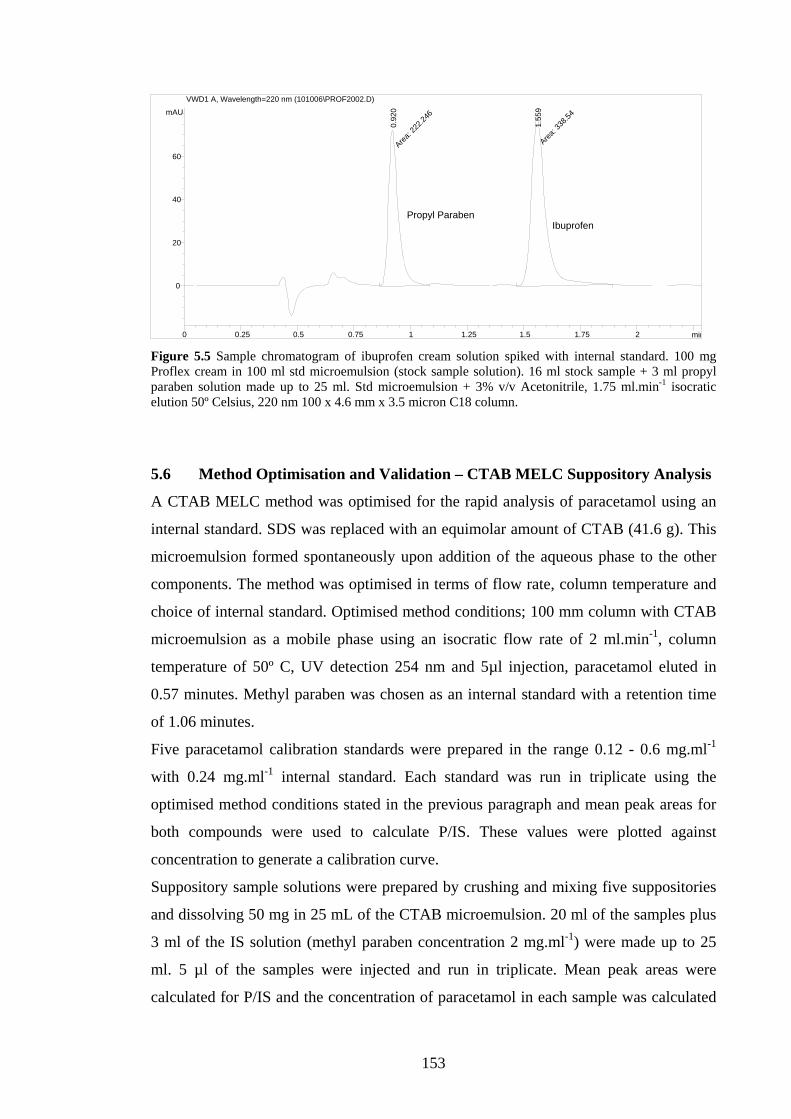
153
min0 0.25 0.5 0.75 1 1.25 1.5 1.75 2
mAU
0
20
40
60
VWD1 A, Wavelength=220 nm (101006\PROF2002.D)
Area
: 222
.246
0.9
20
Area
: 338
.54
1.5
59
Propyl ParabenIbuprofen
Figure 5.5 Sample chromatogram of ibuprofen cream solution spiked with internal standard. 100 mg Proflex cream in 100 ml std microemulsion (stock sample solution). 16 ml stock sample + 3 ml propyl paraben solution made up to 25 ml. Std microemulsion + 3% v/v Acetonitrile, 1.75 ml.min-1 isocratic elution 50º Celsius, 220 nm 100 x 4.6 mm x 3.5 micron C18 column.
5.6 Method Optimisation and Validation – CTAB MELC Suppository Analysis
A CTAB MELC method was optimised for the rapid analysis of paracetamol using an
internal standard. SDS was replaced with an equimolar amount of CTAB (41.6 g). This
microemulsion formed spontaneously upon addition of the aqueous phase to the other
components. The method was optimised in terms of flow rate, column temperature and
choice of internal standard. Optimised method conditions; 100 mm column with CTAB
microemulsion as a mobile phase using an isocratic flow rate of 2 ml.min-1, column
temperature of 50º C, UV detection 254 nm and 5µl injection, paracetamol eluted in
0.57 minutes. Methyl paraben was chosen as an internal standard with a retention time
of 1.06 minutes.
Five paracetamol calibration standards were prepared in the range 0.12 - 0.6 mg.ml-1
with 0.24 mg.ml-1 internal standard. Each standard was run in triplicate using the
optimised method conditions stated in the previous paragraph and mean peak areas for
both compounds were used to calculate P/IS. These values were plotted against
concentration to generate a calibration curve.
Suppository sample solutions were prepared by crushing and mixing five suppositories
and dissolving 50 mg in 25 mL of the CTAB microemulsion. 20 ml of the samples plus
3 ml of the IS solution (methyl paraben concentration 2 mg.ml-1) were made up to 25
ml. 5 µl of the samples were injected and run in triplicate. Mean peak areas were
calculated for P/IS and the concentration of paracetamol in each sample was calculated
154
from the calibration curve. This was repeated for 5 samples from each of two different
batches and mean assay values were calculated for each batch.
The accuracy of the method was determined by injecting a range of eight paracetamol
solutions of known concentration and calculating the mean % recovery.
Repeatability was calculated by preparing three sets of three replicate sample solutions.
Each of these nine samples was run in triplicate and repeatability was determined by
calculating the relative standard deviation of the paracetamol concentrations.
Intermediate precision was determined by calculating the RSD of the concentrations for
three samples on different days under identical conditions.
Limit of detection (LOD) and limit of quantitation (LOQ) were calculated using
Equations (1) and (3). A sample chromatogram for the separation of paracetamol in a
suppository sample spiked with methyl paraben is shown in Figure 5.6.
CTAB M Figure 5.6 CTAB MELC separation of paracetamol in a suppository sample spiked with methyl paraben. Conditions; CTAB microemulsion, isocratic flow rate 2 mL min-1, 50º C, UV detection 254 nm, 5 µL injection, 100 mm x 4.6 mm column with 3.5 µm packing.
5.7 Reference methods
5.7.1 Paracetamol Suppositories
The reference assay for paracetamol in the suppositories was carried out based on the
method described in the British Pharmacopoeia 2005 [8]. One suppository was added to
30 ml of water and 100 ml of 1.0 M sulphuric acid and refluxed under a condenser for
one hour. This was allowed to cool and the following were added; 40 ml of water, 40 g
mi0 0.5 1 1.5 2 2.5 3 3.5 4 4.5
mAU
0
200
400
600
800
1000
1200
VWD1 A, Wavelength=254 nm (030707\SPL40002.D)
Pa
IS
155
of ice, 15 ml of dilute hydrochloric acid and 0.1 ml of ferrion solution. This was then
titrated with 0.1 M ammonium cerium (IV) sulphate VS until a yellow colour was
obtained. Each ml of 0.1 M ammonium cerium (IV) sulphate VS was equivalent to 7.56
mg of paracetamol. The test was repeated using a further four suppositories and an
average value for paracetamol content per suppository was calculated.
5.7.2 Ibuprofen Cream.
The ibuprofen assay for Proflex Cream was carried out based on the method described
in the British Pharmacopoeia 2005 [9]. One deviation from the method was that a
Waters SymmetryShield RP 150 mm x 4.6 mm column with 3.5 µm particles was used.
A mobile phase was prepared using the following: 3 volumes orthophosphoric acid, 247
volumes water and 750 volumes of methanol. Sample solution preparation; a quantity of
cream containing 50 mg ibuprofen was shaken vigorously in 25 ml of the mobile phase
for 10 minutes, this solution was decanted into a 50 ml volumetric flask. The original
vessel was rinsed with two 10 ml quantities of the mobile phase. The combined solution
was diluted to 50 ml with the mobile phase and filtered. A reference standard solution
was prepared of 0.1% w/v ibuprofen in the mobile phase. The chromatographic
procedure was to be carried out using a 25 cm x 4.6 mm column packed with 10 µm
C18 stationary phase (the column was substituted as stated above). Flow rate was 1.5
ml.min-1. Detection wavelength was 220 nm. The ibuprofen content in the cream was
calculated using the ibuprofen reference standard.
5.8 Results and discussion
The objectives of this study were the optimisation and validation of rapid MELC
methods for the determination of the active pharmaceutical ingredients in formulations
composed of highly hydrophobic matrices, while eliminating sample pre-treatment and
extraction procedures. The main target of this study, a paracetamol suppository was
chosen because suppositories generally require a number of sample extraction and/or
pre-treatment steps before the analysis can be performed [5-8] due to the hydrophobic
bulk ingredient in the preparation. Sample preparation was shown to be extremely rapid
compared to the reference method and required a single step of dissolving the
suppository sample in the microemulsion. Studies with the standard SDS microemulsion
showed that it displayed a higher solubilising power than when modified with
156
acetonitrile. In addition to the dramatic reduction in sample preparation time, a minimal
amount of equipment was required compared to the BP reference method i.e. five
suppositories requires five sets of reflux apparatus for simultaneous sample preparation.
The standard SDS microemulsion composition which had previously been used by
Marsh et al [1, 2] was optimised for the analysis of paracetamol and ibuprofen with
respect to retention times and peak efficiency. Paracetamol was hardly retained on the
column and the modest reduction in its retention time due to the addition of organic
modifiers was expected. The addition of organic modifiers to the microemulsion did
affect the retention of ibuprofen significantly with acetonitrile and propan-1-ol having
similar affects. The most interesting result of modifying the microemulsion was the
marked affect it had on the peak efficiencies of both compounds. While the addition of
acetonitrile increased the efficiency of paracetamol peaks, it had the opposite affect on
ibuprofen, reducing peak efficiency. The addition of propan-1-ol had an opposite affect
for each compound. It was found that microemulsion viscosity and column back-
pressure were directly dependant on the column temperature and a flow rate of 1.75
ml.min-1 with a column temperature of 50ºC was the optimum to keep back-pressure
and retention times low. A microemulsion composition of 3% v/v acetonitrile in the
standard microemulsion was the optimum for paracetamol and analysis.
The CTAB MELC method for paracetamol suppositories was optimised to achieve
rapid sample preparation and analysis times without studying the effects of organic
modifiers. The amount of suppository sample that could be solubilised by the CTAB
microemulsion was found to be approximately five times greater than that achieved
using the SDS microemulsion. The solubilising power of different types of
microemulsions for suppository samples will be discussed in Chapter 7. When the
column temperature was set to 50º C, a higher flow rate of 2 ml.min-1 was possible
using the CTAB microemulsion which allowed for very short analysis times. The
validation results are shown in Table 5.3.
Validation of the SDS MELC method for paracetamol showed excellent results for
linearity (r2 = 0.9999), accuracy (RSD = 99.75%) and precision (repeatability: RSD =
0.7%, int. prec. RSD = 0.84%). While an assay value of 100.1% compares very
favourably with the reference assay of 99.8%, see Table 5.3. These results indicate that
157
the optimised MELC method is suitable for routine rapid analysis of paracetamol in
suppositories. The limits of detection and quantitation are relatively low at 0.2 and 0.7
µg.ml-1 respectively
The CTAB MELC method for paracetamol analysis was found to be just as efficient as
the SDS MELC method with total analysis times from sample preparation to final
chromatogram no more than 20 minutes. The validation data outlined in Table 5.3
shows very good linearity, accuracy and repeatability. The assay values obtained for
suppositories from two different batches using the CTAB method were quite different
and may be expected to differ between batches. The assay obtained with the SDS
MELC method (100.1% for suppositories from batch 1) is quite different to the assay
obtained using CTAB MELC for the same batch (97.5%) and may have been due to
experimental error.
The detection wavelength for the CTAB MELC method was 254 nm and a series of
runs at lower wavelengths showed that the UV cut-off for CTAB microemulsions was
approximately 225 nm which would limit its use for some applications. UV detection
using SDS microemulsions on the other hand was possible to as low as 190 nm which is
a major advantage when detecting analytes with weak chromophores or when low
wavelength UV detection at around 200 nm is more sensitive. This difference in UV
cut-off may be due to the droplet size of the microemulsions. Microemulsion
characterisation methods such as SANS, SAXS or DLS which have been reviewed in
Chapter 4 could be used to determine if CTAB microemulsion droplets are larger in
diameter than those of SDS due to the longer alkyl chain of CTAB.
The cream formulation was chosen to assess the ability of MELC to analyse the active
component in an alternative hydrophobic matrix. Sample preparation was again rapid
but there was no significant improvement compared to the reference method. However,
the cream sample was completely dissolved in the standard SDS microemulsion
resulting in a clear solution while the reference method did not fully solubilise the
cream and a milky suspension resulted which required filtration. The standard
microemulsion again displayed a greater solubilising power for the cream than when
modified with organic solvents.
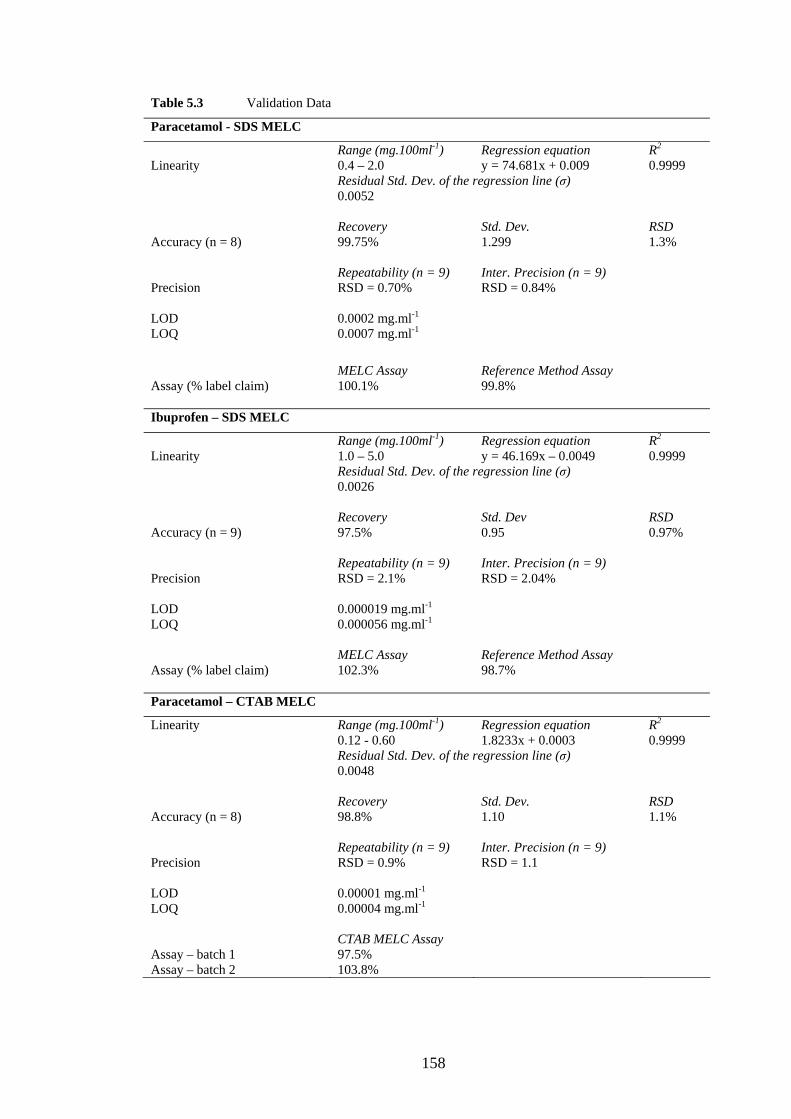
158
Table 5.3 Validation Data
Paracetamol - SDS MELC
Range (mg.100ml-1) Regression equation R2 Linearity 0.4 – 2.0 y = 74.681x + 0.009 0.9999 Residual Std. Dev. of the regression line (σ) 0.0052 Recovery Std. Dev. RSD Accuracy (n = 8) 99.75% 1.299 1.3% Repeatability (n = 9) Inter. Precision (n = 9) Precision RSD = 0.70% RSD = 0.84% LOD 0.0002 mg.ml-1 LOQ 0.0007 mg.ml-1 MELC Assay Reference Method Assay Assay (% label claim) 100.1% 99.8% Ibuprofen – SDS MELC
Range (mg.100ml-1) Regression equation R2 Linearity 1.0 – 5.0 y = 46.169x – 0.0049 0.9999 Residual Std. Dev. of the regression line (σ) 0.0026 Recovery Std. Dev RSD Accuracy (n = 9) 97.5% 0.95 0.97% Repeatability (n = 9) Inter. Precision (n = 9) Precision RSD = 2.1% RSD = 2.04% LOD 0.000019 mg.ml-1 LOQ 0.000056 mg.ml-1 MELC Assay Reference Method Assay Assay (% label claim) 102.3% 98.7% Paracetamol – CTAB MELC
Linearity Range (mg.100ml-1) Regression equation R2 0.12 - 0.60 1.8233x + 0.0003 0.9999 Residual Std. Dev. of the regression line (σ) 0.0048 Recovery Std. Dev. RSD Accuracy (n = 8) 98.8% 1.10 1.1% Repeatability (n = 9) Inter. Precision (n = 9) Precision RSD = 0.9% RSD = 1.1 LOD 0.00001 mg.ml-1 LOQ 0.00004 mg.ml-1 CTAB MELC Assay Assay – batch 1 97.5% Assay – batch 2 103.8%
159
Ibuprofen linearity was also excellent. Although the results obtained for accuracy and
precision were not as good as those for paracetamol, the results demonstrate the
potential of the method for use in routine analysis of ibuprofen in hydrophobic cream
formulations. Assay results for ibuprofen in the cream formulation using MELC display
a higher recovery of the drug than that obtained using the reference method. This may
have been due to the higher solubilising power of the microemulsion compared to the
reference mobile phase (orthophosphoric acid/water/methanol). The cream was not fully
dissolved by the reference method mobile phase and may have led to trace amounts of
ibuprofen being lost after filtration. Limits of detection and quantitation are again
relatively low at 0.19 & 0.56 µg.ml-1.
5.9 Conclusions
Isocratic oil-in-water microemulsion liquid chromatographic methods have been
optimised and validated for the rapid determination of paracetamol in suppository and
ibuprofen in cream formulations. The ability of anionic and cationic O/W
microemulsions to quickly solubilise highly hydrophobic sample matrices has been
shown. This ability eliminated the need for sample pre-treatment and/or extraction steps
before analysis and a significant reduction in analysis times for paracetamol
suppositories was achieved, compared to a reference method. It was shown that a
standard anionic SDS microemulsion was used to rapidly analyse both ibuprofen and
paracetamol in different hydrophobic matrices with minimal method optimisation. A
cationic CTAB microemulsion was also shown to achieve rapid analysis times for a
suppository formulation. The CTAB microemulsion was capable of solubilising a
higher concentration than the SDS microemulsion. The three MELC methods have been
shown to be simple, rapid and useful for routine use and could be used for other
applications.
160
5.10 References
[1] Marsh A., Clark B., Altria K. Chromatographia 59, 531-542 (2004).
[2] Marsh A, Clark BJ, Altria KD. Chromatographia 61, 539-547 (2005).
[3] Jancic B, Ivanovic D, Medenica M, et al. J. Chromatogr. A 1088, 187-192 (2005).
[4] Malenovic A, Medenica M, Ivanovic D, et al. Chromatographia 63, S95-S100 (2006).
[5] Noordin M.I., Chung L.Y., Drug Dev Ind Pharmacy 30, 925-930 (2004).
[6] Bozdogan A., Kunt G.K. Acar A.M. Analytical Letters 25, 2051-2058, (1992).
[7] Almodóvar R.A., Rodríguez R.A., Rosario O., J. Pharm. Biomed. Anal. 17, 89-93
(1998).
[8] British Pharmacopoeia (2005) Vol III, pp 2701-2702.
[9] British Pharmacopoeia (2005) Vol III, pp 2554.
[10] Hamoudova R, Pospisilova M. J. Pharm. Biomed. Anal. 41, 1463-1467 (2006).
[11] Bonazzi D, Andrisano V, Gatti R, et al. J. Pharm. Biomed. Anal. 13, 1321-1329 (1995).
[12] Damiani P.C., Bearzotti M., Cabezón M.A., J. Pharm. Biomed. Anal. 25, 679-683
(2001).
[13] International Conference on Harmonisation (1996), Q2B Validation of Analytical
procedures: Methodology.
161
Chapter Six
An Evaluation of Microemulsion Electrokinetic
Chromatography Methods for the Analysis of
Paracetamol in Suppositories

162
6.1 Introduction and Aims
In Chapter Five, MELC methods using both cationic and anionic microemulsions were
shown to be suitable for routine analysis of the active ingredients in two selected
hydrophobic pharmaceutical formulations. The main advantages of using
microemulsions as eluents and sample solvents were the elimination of sample
extraction procedures, quick and straightforward sample preparation along with rapid
analysis times. Although the analysis of ibuprofen in the cream formulation using SDS
MELC was rapid and sample preparation was easy and quick, the overall analysis time
using the MELC method was comparable to the reference method. The MELC methods
developed for the analysis of paracetamol in suppositories using both anionic and
cationic microemulsions showed significant advantages over the reference method in
terms of ease of sample preparation and short analysis times.
The aims of this experimental section were to evaluate MEEKC methods using anionic
and cationic microemulsions as both sample solvents and carrier electrolytes for the
analysis of paracetamol suppositories and to compare these methods to the MELC
methods in Chapter 5 and to the BP (2005) reference method. The BP (2005) method
for paracetamol suppository analysis is described in Chapter 5 and requires lengthy
sample pre-treatment and analysis.
Recent applications of MEEKC for the determination of active ingredients and their
impurities in drugs and formulations have been reviewed by this group [1]. These
applications include impurity profiling of atropine sulphate [2], the separation of
amphetamines and their basic ephedra alkaloid impurities [3], the separation of heroin,
amphetamine and their basic impurities [4] and the determination of ketorolac and its
impurities [5].
Anionic SDS with a C12 alkyl chain is one of the most commonly used surfactants for
MEEKC applications. Cationic CTAB has also been used [6], though much less
frequently. CTAB forms positively charged microemulsion droplets and has a C16 alkyl
chain, which penetrates into the oil droplet. The positively charged oil droplets generate
a positively charged surfactant bilayer on the capillary wall which reverses the EOF
direction. A negative polarity voltage is therefore required when working with cationic
microemulsions [7].
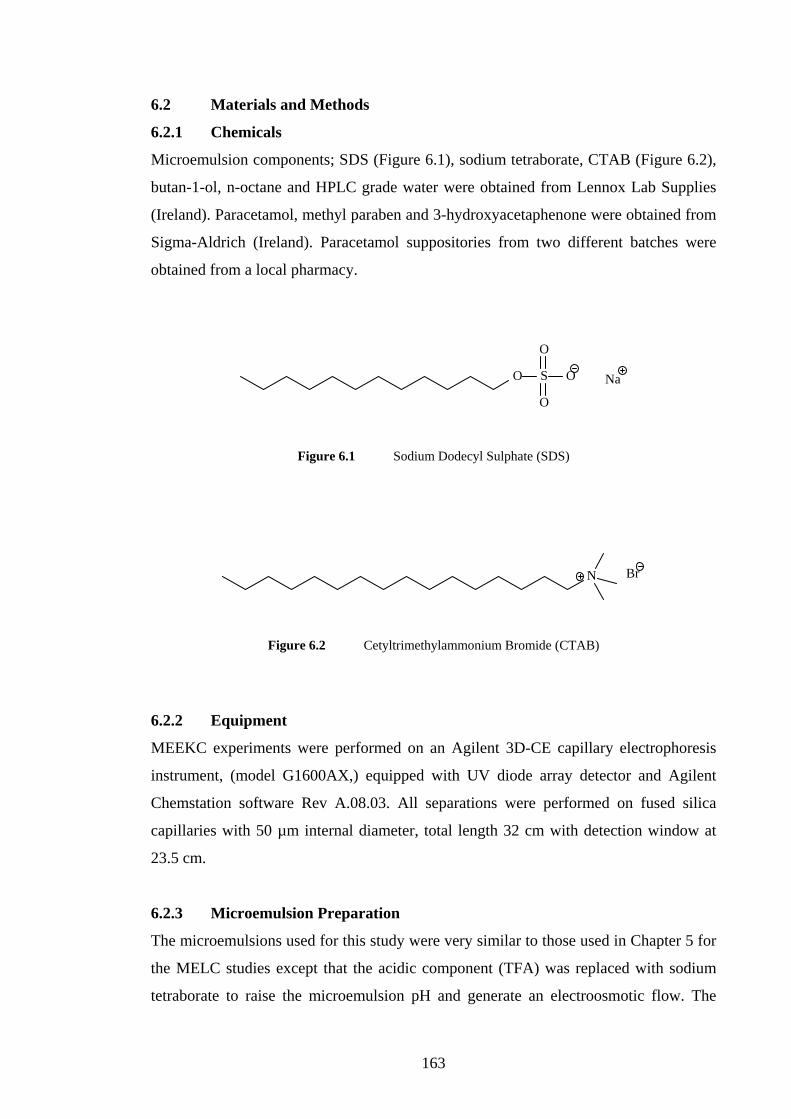
163
6.2 Materials and Methods
6.2.1 Chemicals
Microemulsion components; SDS (Figure 6.1), sodium tetraborate, CTAB (Figure 6.2),
butan-1-ol, n-octane and HPLC grade water were obtained from Lennox Lab Supplies
(Ireland). Paracetamol, methyl paraben and 3-hydroxyacetaphenone were obtained from
Sigma-Aldrich (Ireland). Paracetamol suppositories from two different batches were
obtained from a local pharmacy.
O S O
O
O
Na
Figure 6.1 Sodium Dodecyl Sulphate (SDS)
N Br
Figure 6.2 Cetyltrimethylammonium Bromide (CTAB)
6.2.2 Equipment
MEEKC experiments were performed on an Agilent 3D-CE capillary electrophoresis
instrument, (model G1600AX,) equipped with UV diode array detector and Agilent
Chemstation software Rev A.08.03. All separations were performed on fused silica
capillaries with 50 µm internal diameter, total length 32 cm with detection window at
23.5 cm.
6.2.3 Microemulsion Preparation
The microemulsions used for this study were very similar to those used in Chapter 5 for
the MELC studies except that the acidic component (TFA) was replaced with sodium
tetraborate to raise the microemulsion pH and generate an electroosmotic flow. The
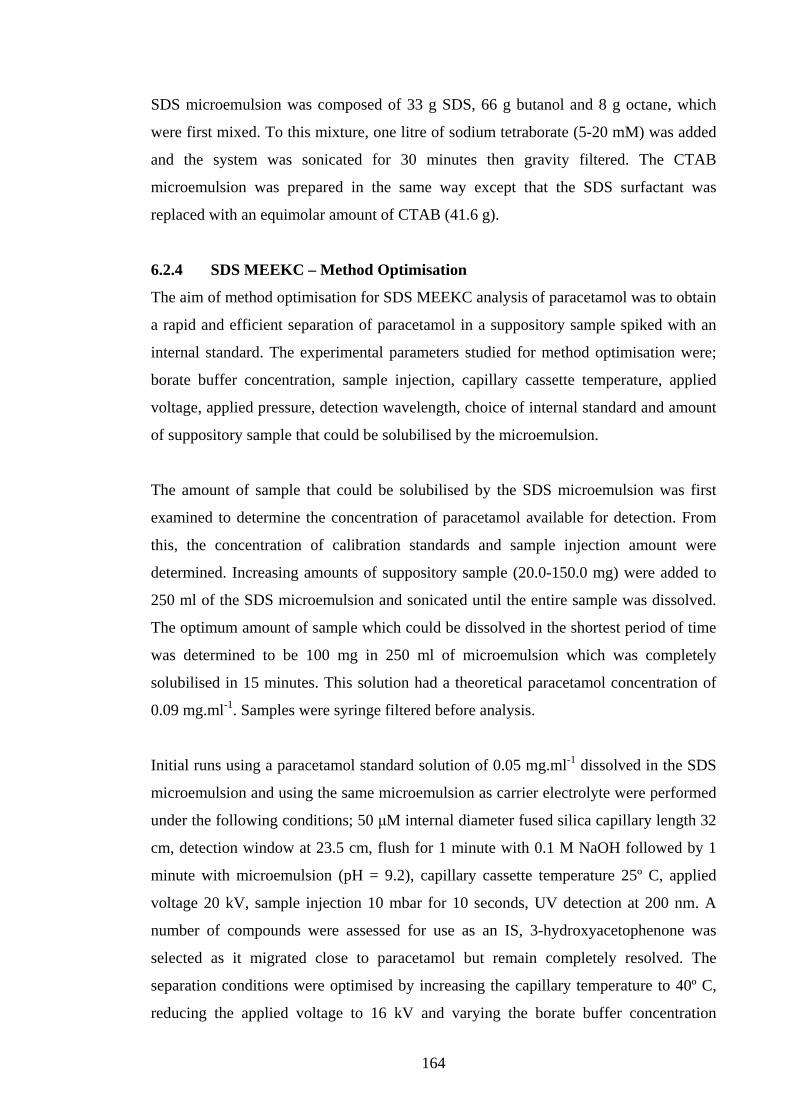
164
SDS microemulsion was composed of 33 g SDS, 66 g butanol and 8 g octane, which
were first mixed. To this mixture, one litre of sodium tetraborate (5-20 mM) was added
and the system was sonicated for 30 minutes then gravity filtered. The CTAB
microemulsion was prepared in the same way except that the SDS surfactant was
replaced with an equimolar amount of CTAB (41.6 g).
6.2.4 SDS MEEKC – Method Optimisation
The aim of method optimisation for SDS MEEKC analysis of paracetamol was to obtain
a rapid and efficient separation of paracetamol in a suppository sample spiked with an
internal standard. The experimental parameters studied for method optimisation were;
borate buffer concentration, sample injection, capillary cassette temperature, applied
voltage, applied pressure, detection wavelength, choice of internal standard and amount
of suppository sample that could be solubilised by the microemulsion.
The amount of sample that could be solubilised by the SDS microemulsion was first
examined to determine the concentration of paracetamol available for detection. From
this, the concentration of calibration standards and sample injection amount were
determined. Increasing amounts of suppository sample (20.0-150.0 mg) were added to
250 ml of the SDS microemulsion and sonicated until the entire sample was dissolved.
The optimum amount of sample which could be dissolved in the shortest period of time
was determined to be 100 mg in 250 ml of microemulsion which was completely
solubilised in 15 minutes. This solution had a theoretical paracetamol concentration of
0.09 mg.ml-1. Samples were syringe filtered before analysis.
Initial runs using a paracetamol standard solution of 0.05 mg.ml-1 dissolved in the SDS
microemulsion and using the same microemulsion as carrier electrolyte were performed
under the following conditions; 50 μM internal diameter fused silica capillary length 32
cm, detection window at 23.5 cm, flush for 1 minute with 0.1 M NaOH followed by 1
minute with microemulsion (pH = 9.2), capillary cassette temperature 25º C, applied
voltage 20 kV, sample injection 10 mbar for 10 seconds, UV detection at 200 nm. A
number of compounds were assessed for use as an IS, 3-hydroxyacetophenone was
selected as it migrated close to paracetamol but remain completely resolved. The
separation conditions were optimised by increasing the capillary temperature to 40º C,
reducing the applied voltage to 16 kV and varying the borate buffer concentration
165
between 5 – 20 mM, 10 mM was found to achieve short migration times without
generating excess current across the capillary. The migration time was 1.73 minutes for
paracetamol and 2.36 minutes for the IS. To reduce migration times and speed up
analysis, pressure was applied across the capillary during the run. 30 mbar of pressure
applied during the run reduced migration times to 1.25 minutes for paracetamol and
1.53 minutes for the IS.
6.2.5 CTAB MEEKC – Method Optimisation
Similar to SDS MEEKC method optimisation, the aim of method optimisation for
CTAB MEEKC analysis of paracetamol was to obtain a rapid and efficient separation of
paracetamol in a suppository sample spiked with an internal standard. The experimental
parameters studied for method optimisation were the same as those in Section 6.2.4.
The optimum amount of suppository sample that could be solubilised by the CTAB
microemulsion was 500 mg in 250 mL microemulsion in 15 minutes to give a
theoretical paracetamol concentration of 0.45 mg.ml-1. Samples were syringe filtered
before analysis.
A paracetamol reference standard solution of 0.5 mg.ml-1 was prepared in the CTAB
microemulsion. Initial runs performed under identical conditions to the final method
conditions described in Section 6.2.4 but with a negative applied voltage and UV
detection at 254 nm resulted in detection of paracetamol in 0.94 minutes. Methyl
paraben was chosen as the IS as this had a migration time of 1.18 minutes and was fully
resolved from the paracetamol peak. No further method optimisation was necessary as
both peaks were efficiently resolved in just over one minute. UV detection at 200 nm
was not possible using the CTAB microemulsion which had a UV cut-off of
approximately 225 nm.
6.3 Method Validation
6.3.1 SDS MEEKC Method for Paracetamol Suppository Analysis
6.3.1.1 Specificity
The paracetamol suppositories contained paracetamol as the active ingredient with
polyoxyl 40 stearate and hard fat as excipients. Paracetamol was the only UV active
compound in the formulation and the method was therefore selective for paracetamol.

166
6.3.1.2 Linearity
A stock solution of paracetamol was prepared by dissolving 100 mg of paracetamol
reference standard in 100 ml of the SDS microemulsion. 50 mg of 3-
hydroxyacetaphenone (internal standard) was dissolved in 100 ml of the microemulsion.
The calibration standards were prepared as detailed in Table 6.1.
Table 6.1 Preparation of paracetamol standard solutions – SDS MEEKC
Standard 1 2 3 4 5
Vol. of paracetamol working std (ml) 1 2 3 4 5
Volume of internal std (ml) 3 3 3 3 3
Total volume (ml) 25 25 25 25 25
Paracetamol concentration (mg.ml-1) 0.04 0.08 0.12 0.16 0.2
Each calibration standard was run in triplicate and mean peak areas were calculated for
the paracetamol and IS peaks. A calibration curve was plotted of peak area ratios of
paracetamol/IS against concentration.
6.3.1.3 Assay
Five suppositories were accurately weighed and the mean weight was calculated. Each
suppository was expected to have contained 500 mg paracetamol. The suppositories
were crushed and mixed and samples prepared as described in Section 6.2.4. 20 ml of
this solution was added to 3 ml of the IS solution and made up to 25 ml with the SDS
microemulsion. This solution had an IS concentration of 0.06 mg.ml-1 and a theoretical
paracetamol concentration of 0.07 mg.ml-1.
Samples were run in triplicate and paracetamol assay was determined from the
calibration curve. This was repeated for five samples from each of two batches and
mean assay values calculated for each batch. A sample separation achieved using the
SDS MEEKC method is illustrated in Figure 6.3
6.3.1.4 Accuracy, Repeatability, Intermediate Precision, LOD & LOQ
The accuracy of the method was determined by injecting a range of eight paracetamol
solutions of known concentration spiked with IS. Each of these solutions was injected

167
and recovery calculated from the calibration curve. The percentage mean recovery was
calculated.
Method repeatability was calculated by preparing three sets of three replicate sample
solutions. Each of these nine samples was run in triplicate and repeatability was
determined by calculating the relative standard deviation (RSD) of the paracetamol
concentrations.
Intermediate precision was determined by calculating the RSD of the concentrations for
three samples on different days under identical conditions.
Limit of detection (LOD) and limit of quantitation (LOQ) were calculated using
Equations (1) & (2) where σ was the RSD of the regression line and S was the slope.
Equation (1) LOD = 3.3σ/S Equation (2) LOQ = 10σ/S
Figure 6.3 SDS MEEKC separation of paracetamol in a suppository sample spiked with 3-hydroxyacetaphenone as an IS. Separation conditions; 50 μM ID fused silica capillary length 32 cm, detection window at 23.5 cm, flush for 1 minute with 0.1 M NaOH followed by 1 minute with microemulsion (pH = 9.2), capillary cassette temperature 40º C, applied voltage 16 kV, sample injection 10 mbar for 10 seconds, UV detection at 200 nm. 30 mbar pressure applied during run.
min0.25 0.5 0.75 1 1.25 1.5 1.75 2 2.25
mAU
0
5
10
15
20
25
30
DAD1 A, Sig=200,16 Ref=off (010807\PARASMPLE000005.D)
IS
Pa
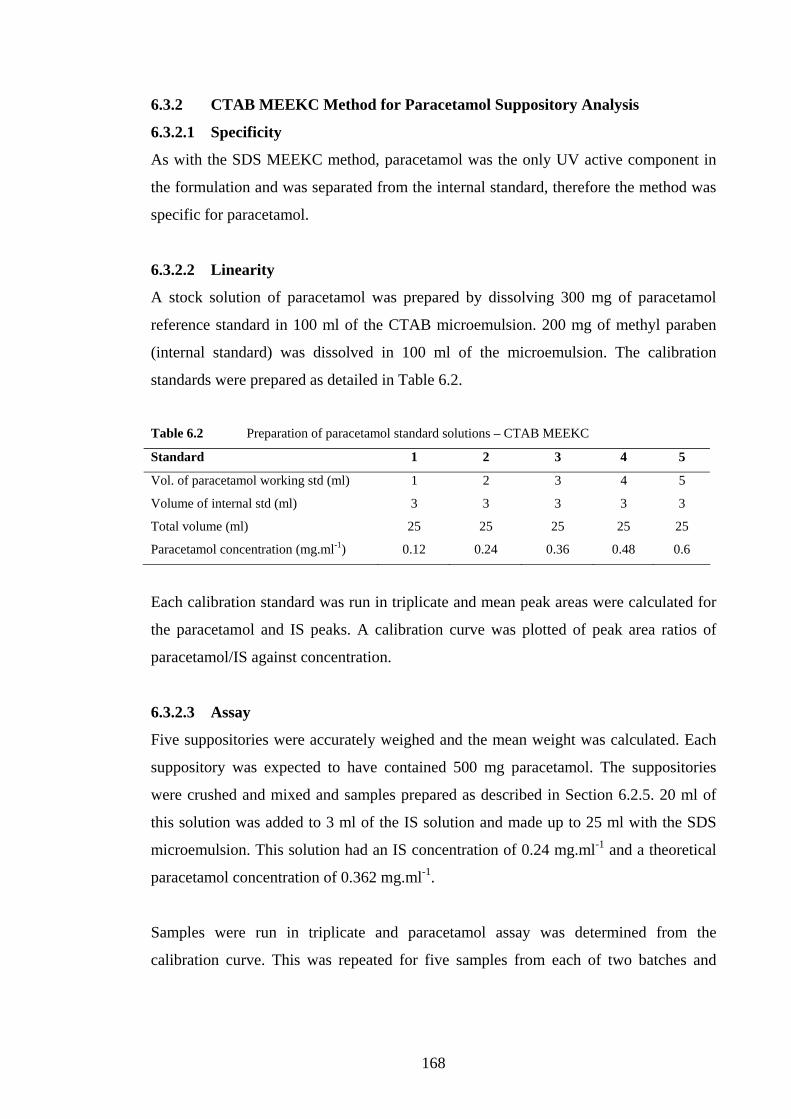
168
6.3.2 CTAB MEEKC Method for Paracetamol Suppository Analysis
6.3.2.1 Specificity
As with the SDS MEEKC method, paracetamol was the only UV active component in
the formulation and was separated from the internal standard, therefore the method was
specific for paracetamol.
6.3.2.2 Linearity
A stock solution of paracetamol was prepared by dissolving 300 mg of paracetamol
reference standard in 100 ml of the CTAB microemulsion. 200 mg of methyl paraben
(internal standard) was dissolved in 100 ml of the microemulsion. The calibration
standards were prepared as detailed in Table 6.2.
Table 6.2 Preparation of paracetamol standard solutions – CTAB MEEKC Standard 1 2 3 4 5
Vol. of paracetamol working std (ml) 1 2 3 4 5
Volume of internal std (ml) 3 3 3 3 3
Total volume (ml) 25 25 25 25 25
Paracetamol concentration (mg.ml-1) 0.12 0.24 0.36 0.48 0.6
Each calibration standard was run in triplicate and mean peak areas were calculated for
the paracetamol and IS peaks. A calibration curve was plotted of peak area ratios of
paracetamol/IS against concentration.
6.3.2.3 Assay
Five suppositories were accurately weighed and the mean weight was calculated. Each
suppository was expected to have contained 500 mg paracetamol. The suppositories
were crushed and mixed and samples prepared as described in Section 6.2.5. 20 ml of
this solution was added to 3 ml of the IS solution and made up to 25 ml with the SDS
microemulsion. This solution had an IS concentration of 0.24 mg.ml-1 and a theoretical
paracetamol concentration of 0.362 mg.ml-1.
Samples were run in triplicate and paracetamol assay was determined from the
calibration curve. This was repeated for five samples from each of two batches and

169
mean assay values calculated for each batch. A sample separation of paracetamol in a
suppository sample spiked with methyl paraben is shown in Figure 6.4.
6.3.2.4 Accuracy, Repeatability, Intermediate Precision, LOD & LOQ
The above validation parameters were assessed in the same manner as outlined in
Section 6.3.1.4.
Figure 6.4 CTAB MEEKC separation of paracetamol suppository sample spiked with methyl paraben as an IS. Separation conditions; 50 μM ID fused silica capillary length 32 cm, detection window at 23.5 cm, flush for 1 minute with 0.1 M NaOH followed by 1 minute with microemulsion (pH = 9.2), capillary cassette temperature 40º C, applied voltage -16 kV, sample injection 10 mbar for 10 seconds, UV detection at 254 nm. 30 mbar pressure applied during run. 6.4 Results and Discussion
The aims of this experimental section were to evaluate MEEKC methods using anionic
and cationic microemulsions as both sample solvents and carrier electrolytes for the
analysis of paracetamol suppositories.
Method development and optimisation of both the SDS and CTAB MEEKC methods
were shown to be relatively straight forward. Sample preparation was shown to be
simple and quick using standard microemulsions prepared with SDS and CTAB
surfactants without any need for additional organic modifiers or lengthy sample
extraction procedures.
min0 0.5 1 1.5 2 2.5
mAU
0
10
20
30
40
50
60
DAD1 C, Sig=254,30 Ref=off (010807\PARASMPLE000015.D)
Pa
IS
170
Due to the presence of a single target analyte in the suppository, the aim of optimising a
standard SDS MEEKC method was to achieve a rapid and efficient separation of
paracetamol from an internal standard. The SDS microemulsion which was used in
Chapter 5 for similar MELC studies was modified by replacing the TFA aqueous
component with borate buffer. Using this high pH microemulsion as the carrier
electrolyte along with the optimisation of standard CE operating conditions (applied
voltage, temp, capillary dimensions, capillary rinse procedure, buffer concentration)
allowed the separation of both compounds. Although initial separation was achieved in
2.3 minutes, 30 mbar applied pressure across the capillary during runs reduced the
analysis time to just over 1.5 minutes, which would be advantageous in high throughput
laboratories. Due to the electrodriven mode of separation, equilibration of the capillary
was not necessary when changing operating parameters during method optimisation
which made method optimisation fast and straight forward.
Similarly, the CTAB microemulsion used in this study was a borate modified version of
the CTAB microemulsion utilised in Chapter 5 for MELC studies. Minor modifications
to the SDS MEEKC operating conditions allowed the separation and detection of
paracetamol and an internal standard in 1.18 minutes. The only modifications necessary
were changing the UV detection wavelength to 254 and reversing the polarity of the
applied voltage to -16 kV due to the generation of a positively charged surfactant
bilayer on the capillary wall which reverses the EOF direction.
Results for the quantitative assessment of both MEEKC methods are shown in Table
6.3. The results achieved for both methods were very similar for batch to batch assay,
accuracy, repeatability, precision, LOD & LOQ. The main difference between the
methods was the solubilising power of the microemulsions for the non polar sample.
The CTAB microemulsion allowed five times more sample to be solubilised than the
SDS microemulsion, hence the calibration range for the CTAB method was at higher
concentration levels. The ability of the CTAB microemulsion to solubilise higher
concentrations of non polar sample matrix may be advantageous for MEEKC
applications where the amount of active ingredient in the sample formulation may be
too small for detection using SDS MEEKC. The validation data for both MEEKC
methods shows that they would be suitable for routine laboratory use with vastly
reduced sample preparation times.

171
Table 6.3 Validation data for MEEKC paracetamol suppository analysis
Paracetamol - SDS MEEKC
Conc. of suppository solubilised 0.4 mg.ml-1 Range (mg.ml-1) Regression equation R2 Linearity 0.04 – 0.2 y = 26.364x - 0.075 0.9999 Residual Std. Dev. of the regression line (σ) 0.0048 Recovery Std. Dev. RSD Accuracy (n = 8) 97.9% 0.92 0.94% Repeatability (n = 9) Inter. Precision (n = 9) Precision RSD = 1.12% RSD = 1.04% LOD 0.0026 mg.ml-1 LOQ 0.008 mg.ml-1 SDS MEEKC Assay Reference Method Assay Assay 1 (% label claim) 100.6% 99.8% Assay 2 102.1% Paracetamol – CTAB MEEKC
Conc. of suppository solubilised 2 mg.ml-1 Range (mg.ml-1) Regression equation R2 Linearity 0.12 - 0.6 y = 0.5563x – 0.036 0.9985 Residual Std. Dev. of the regression line (σ) 0.0026 RSD Accuracy (n = 8) 98.5% 0.965 0.98% Repeatability (n = 9) Inter. Precision (n = 9) Precision (n = 9) RSD = 1.0% RSD = 1.2 LOD 0.0027 mg.ml-1 LOQ 0.008 mg.ml-1 MELC Assay Reference Method Assay Assay 1 (% label claim) 98.9% 99.8% Assay 2 103.4
When comparing the MEEKC and MELC methods (Chapter 5) for paracetamol
suppository analysis, a number of factors were considered which will be discussed here
including; ease of method development and optimisation, sample preparation time,
overall analysis times and validation data.
Method development and optimisation for the MEEKC methods was shown to be
extremely fast compared to MELC. Although the separation was relatively simple for
both techniques i.e. separation of paracetamol and an internal standard, studying the
effects of changes in operating parameters for MELC required lengthy column

172
equilibration. When changes were made to the microemulsion composition or
instrument settings for the MEEKC techniques, no equilibration was required and
changes in separation performance could be identified quickly, speeding up method
development. It is widely known that LC techniques consume large quantities of
solvents compared to CE. The volumes of microemulsion required as a mobile phase
during method development for MELC is even greater than would be required for
developing an equivalent RP-HPLC method using organic/aqueous MP’s due to the
extra column volumes needed for equilibration (~ 72 column volumes for SDS MELC
compared to 15-20 column volumes for organic/aqueous RP-HPLC). MEEKC method
development requires a fraction of the volume of microemulsion used in MELC. The
extra operating parameters which can be utilised in MEEKC separations, such as;
applied voltage, buffer pH & ionic strength and applied pressure provides more scope to
develop separations. In summary, MELC method development is time consuming and
requires large volumes of microemulsion whereas MEEKC method development is
quick, easy, requires small volumes of microemulsion and offers more development
options.
Table 6.4 Comparison of MELC, MEEKC and reference methods for paracetamol suppository analysis
SDS MELC
CTAB MELC
SDS MEEKC
CTAB MEEKC
Detection wavelength (nm) 200 254 200 254 Calibration range (mg mL-1) 0.004-0.02 0.12 - 0.60 0.04 - 0.20 0.12 - 0.60 Linearity 0.9999 0.9999 0.9999 0.9985 Assay batch 1 (%) 100.1 97.50 100.60 98.90 Assay batch 2 (%) - 103.80 102.10 103.40 Accuracy (%) 99.75 98.80 97.90 98.50 Repeatability - RSD (%) 0.7 0.9 1.1 1.0 Inter precision – RSD (%) 0.84 1.1 1.0 1.2 Estimated LOD (mg mL-1) 0.0002 0.0001 0.0026 0.0027 Estimated LOQ (mg mL-1) 0.0007 0.0004 0.008 0.008 Sample prep time (minutes) 20 20 20 20 Total run time including flush (minutes) 0.7 1.1 3.5 3.2 Amount of sample solubilised (mg.ml-1) 0.1 2 0.4 2 Reference method - Assay 98.7% Reference method - Analysis time 5 hours
Sample preparation times for both techniques were similar and no elaborate or time
consuming procedures were required. Samples required sonication in the microemulsion
buffer followed by syringe filtration before injection. The low pH CTAB
microemulsions used for MELC were capable of solubilising up to 9 times more
suppository than their SDS equivalent. When the pH of the SDS microemulsion was

173
raised to 9.2 by the borate buffer, its solubilising power increased fourfold. Sample
preparation times for both techniques could be further reduced by using the greater
solubilising power of the CTAB microemulsion to dissolve a lower concentration of
sample in a shorter time period. Due to the rinse procedure between runs required for
the MEEKC methods, their overall analysis times were slightly longer than MELC.
The results obtained for the assay of paracetamol suppositories with the MEEKC
methods compare favourably to those for both of the MELC methods summarised in
Table 6.4. It can be seen however that the accuracy, repeatability and intermediate
precision were slightly poorer for the MEEKC methods. The estimated LODs and
LOQs for both MEEKC methods were much higher than the MELC equivalents due to
the lower sensitivity of CE methods utilising UV detection with short detection path
lengths (internal diameter of the capillary (50 μm) is the width of the flow cell) and
were expected.
The assay results obtained using the optimised MEEKC methods compared very
favourably to the BP (2005) reference method assay [8] also shown in Table 6.4. The
elimination of sample extraction procedures and rapid analysis times demonstrated by
the MEEKC methods shows a major advantage in reducing analysis times from more
than 5 hours (BP 2005 reference method) to approximately 22 minutes from sample
preparation to sample electropherogram.
6.5 Conclusions
Two MEEKC methods utilising both anionic and cationic microemulsions as sample
solvents and carrier electrolytes have been successfully developed and optimised for the
rapid analysis of paracetamol in suppositories.
Method development and optimisation for MEEKC was shown to be easier and faster
than for equivalent MELC methods. Suppository sample preparation was simple with
minimal sample handling allowing for high throughput analysis. The sample preparation
and analysis procedure was shown to be very effective for highly hydrophobic sample
matrices and could be applied to other similar formulations.
174
The cationic CTAB microemulsion was shown to have a higher solubilising power than
the more commonly used SDS microemulsion allowing higher concentrations of sample
to be used. The validation results suggest that the methods could be used for routine
analysis although the limits of detection and quantitation are higher than those achieved
with similar MELC methods.
6.6 References
[1] McEvoy E., Marsh A., Altria K., Donegan S., Power J., Electrophoresis 28, 193-207
(2007).
[2] Bitar Y., Holzgrabe U., J. Pharm. Biomed. Anal. 44 (3), 623-633 (2007).
[3] Wen T., Zhao X., Lou G.A., Wang Y.M., Wang J., et al Chin. J. Anal. Chem. 34 (11),
1529-1534 (2006).
[4] Wen T., Zhao X., Lou G.A., Wang J., Wang Y.M., et al Talanta 71 (2) 854-860 (2007).
[5] Furlanetto S., Orlandini S., Marras A.M., Mura P., Pinzauti S. Electrophoresis 27 (4),
805-818 (2006).
[6] Bo T., Zhong L., Li M., Lou Y.K., Li K.A., et al. Chromatographia 56 (11-12), 709-
716 (2002).
[7] Altria K.D., J. Chromatogr. A, 892(1-2), 171-186 (2000).
[8] British Pharmacopoeia 2005, Vol II, pp1508-1509.
175
Chapter Seven
An Experimental Assessment of Microemulsion
Stability under Gradient Elution Conditions
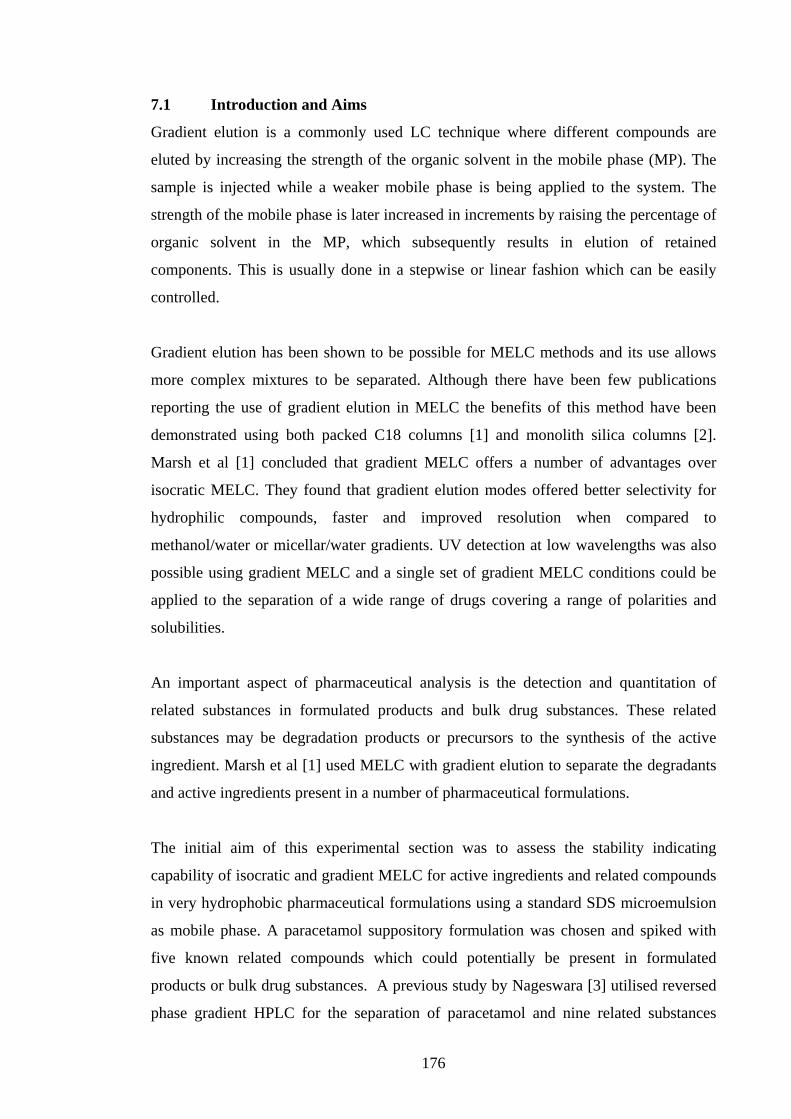
176
7.1 Introduction and Aims
Gradient elution is a commonly used LC technique where different compounds are
eluted by increasing the strength of the organic solvent in the mobile phase (MP). The
sample is injected while a weaker mobile phase is being applied to the system. The
strength of the mobile phase is later increased in increments by raising the percentage of
organic solvent in the MP, which subsequently results in elution of retained
components. This is usually done in a stepwise or linear fashion which can be easily
controlled.
Gradient elution has been shown to be possible for MELC methods and its use allows
more complex mixtures to be separated. Although there have been few publications
reporting the use of gradient elution in MELC the benefits of this method have been
demonstrated using both packed C18 columns [1] and monolith silica columns [2].
Marsh et al [1] concluded that gradient MELC offers a number of advantages over
isocratic MELC. They found that gradient elution modes offered better selectivity for
hydrophilic compounds, faster and improved resolution when compared to
methanol/water or micellar/water gradients. UV detection at low wavelengths was also
possible using gradient MELC and a single set of gradient MELC conditions could be
applied to the separation of a wide range of drugs covering a range of polarities and
solubilities.
An important aspect of pharmaceutical analysis is the detection and quantitation of
related substances in formulated products and bulk drug substances. These related
substances may be degradation products or precursors to the synthesis of the active
ingredient. Marsh et al [1] used MELC with gradient elution to separate the degradants
and active ingredients present in a number of pharmaceutical formulations.
The initial aim of this experimental section was to assess the stability indicating
capability of isocratic and gradient MELC for active ingredients and related compounds
in very hydrophobic pharmaceutical formulations using a standard SDS microemulsion
as mobile phase. A paracetamol suppository formulation was chosen and spiked with
five known related compounds which could potentially be present in formulated
products or bulk drug substances. A previous study by Nageswara [3] utilised reversed
phase gradient HPLC for the separation of paracetamol and nine related substances

177
where reversing the polarity of the mobile phase during the separation achieved
resolution of all substances. As oil-in-water microemulsions are composed mainly of
water, performing gradient elution by ramping up the concentration of the aqueous
component does not reverse the polarity of the eluent and co-eluting compounds can be
separated by exploiting differences in their hydrophobicity.
Microemulsions are composed of a number of different components, the relative
concentrations of which are critical to maintain a stable system (see Section 1.5).
Employing gradient elution using a microemulsion/aqueous mixed mobile phase
changes the relative ratios and concentrations of the system components and may affect
the microemulsion stability leading to de-mixing or phase separation. A second part of
this experimental section was aimed at examining the stability of a number of
microemulsions formed with different surfactants under simulated gradient conditions.
7.2 Materials
7.2.1 Chemicals
SDS and CTAB were obtained from Lennox Lab Supplies (Dublin, Ireland).
Tetradecyltrimethylammonmium bromide (TTAB), dodecyltrimethylammonium
bromide (DOTAB) and Brij 35 were obtained from Sigma Aldrich (Dublin, Ireland).
See Table 7.1
Table 7.1 Molecular formulae of surfactants examined showing chain length and head group. SDS Anionic C12H25S-O4 Na+
DOTAB Cationic C12H25N+(CH3)3 Br-
TTAB Cationic C14H19N+(CH3)3 Br-
CTAB Cationic C16H25N+(CH3)3 Br-
Brij 35 Non-ionic CH3(CH2)10CH2(OCH2OCH2)23OH
Butan-1-ol, n-octane and HPLC grade water were obtained from Lennox Lab Supplies
(Dublin, Ireland). Paralink paracetamol suppository was obtained from a local
pharmacy. Paracetamol and related substances were obtained from Sigma Aldrich
(Ireland), see Table 7.2

178
Table 7.2 Paracetamol and related substances
Paracetamol 4-aminophenol
4-nitrophenol 4-chloroacetanilide
4-hydroxyacetaphenone 2-acetamidophenol
7.2.2 Equipment
A Hewlett Packard 1050 HPLC system equipped with HP solvent degassing module
(model G1303A), HP variable wavelength UV/Vis detector (79853C), HP solvent
cabinet and column heater (79856A), HP 21 station autosampler (79855A), and HP
quaternary pump (79852A) coupled to an Agilent Chemstation data management
system (Rev.A.09.01 [1206]) as used for all work carried out.
A Hypersil Hypurity Elite C18 150 mm x 4.6 mm column with 3 µm packing was used.
A Kruss Contact Angle Measuring System G10 with a DSA1 Drop Shape Analysis
Package was used to measure the surface tension of the microemulsions.
NH2
OH
NH
OHO
NO2
OH
Cl
HH
O
OH
OOH
N
H
O

179
7.3 Experimental
7.3.1 Separation of Paracetamol and Related Substances
To assess the stability indicating capability of MELC for paracetamol, five related
substances, which are either precursors to paracetamol synthesis, side products or its
degradation products were obtained. The BP 2005 test for paracetamol related
substances [4] describes a method for the determination of 4-aminophenol, 4-
nitrophenol and 4-chloroacetanilide. 4-hydroxyacetophenone and 2-acetamidophenol
are side products [3] potentially present in paracetamol bulk substance and/or
formulations.
7.3.1.1 Microemulsion and Sample Preparation The standard SDS microemulsion was prepared as described in Section 5.3.1 without
modification. A suppository sample containing 2.6 mg paracetamol spiked with 0.2 mg
of each of the related compounds shown in Table 7.2 were prepared in 25 ml of the
standard microemulsion. Sample solutions were sonicated and syringe filtered before
use.
7.3.1.2 Separation of Paracetamol and Related Compounds Initial isocratic method conditions for the separation of paracetamol and related
substances were; 150 mm C18 column, 10 µl injection, flow rate 1.75 ml.min-1, column
temperature 50º C, UV detection at 220 nm. Baseline resolution was achieved for 4-
chloroacetanilide, 4-nitrophenol and an unknown peak. Reducing the flow rate to 1.2
ml.min-1 and column temperature to 40º C resulted in the baseline resolution of all
compounds except 4-aminophenol and 4-hydroxyacetaphenone which co-eluted. The
isocratic separation is shown in Figure 7.1.
In order to resolve all of the peaks, a number of gradient modes were attempted and the
retention times for each peak were monitored.
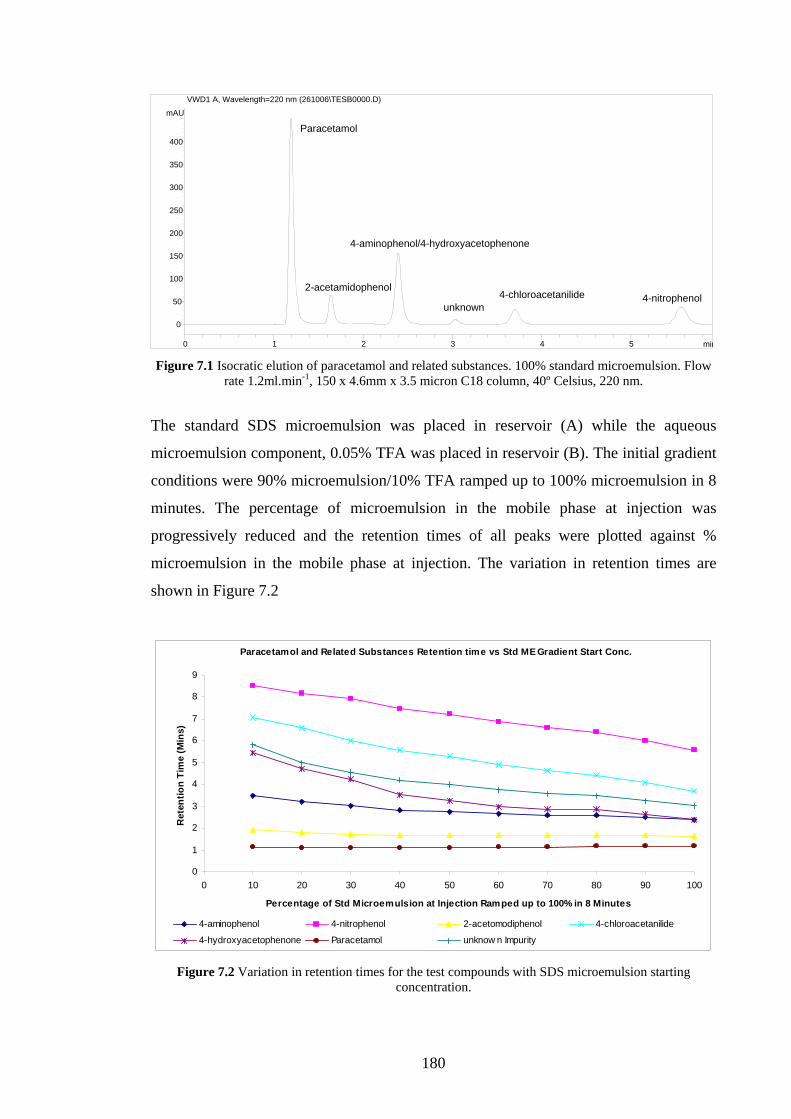
180
min0 1 2 3 4 5
mAU
0
50
100
150
200
250
300
350
400
VWD1 A, Wavelength=220 nm (261006\TESB0000.D)
unknown
Paracetamol
2-acetamidophenol
4-aminophenol/4-hydroxyacetophenone
4-chloroacetanilide 4-nitrophenol
Figure 7.1 Isocratic elution of paracetamol and related substances. 100% standard microemulsion. Flow
rate 1.2ml.min-1, 150 x 4.6mm x 3.5 micron C18 column, 40º Celsius, 220 nm.
The standard SDS microemulsion was placed in reservoir (A) while the aqueous
microemulsion component, 0.05% TFA was placed in reservoir (B). The initial gradient
conditions were 90% microemulsion/10% TFA ramped up to 100% microemulsion in 8
minutes. The percentage of microemulsion in the mobile phase at injection was
progressively reduced and the retention times of all peaks were plotted against %
microemulsion in the mobile phase at injection. The variation in retention times are
shown in Figure 7.2
Paracetamol and Related Substances Retention time vs Std ME Gradient Start Conc.
0
1
2
3
4
5
6
7
8
9
0 10 20 30 40 50 60 70 80 90 100
Percentage of Std Microemulsion at Injection Ramped up to 100% in 8 Minutes
Ret
entio
n Ti
me
(Min
s)
4-aminophenol 4-nitrophenol 2-acetomodiphenol 4-chloroacetanilide
4-hydroxyacetophenone Paracetamol unknow n Impurity
Figure 7.2 Variation in retention times for the test compounds with SDS microemulsion starting concentration.

181
The optimum starting mobile phase concentration was determined to be 50/50,
microemulsion/TFA, ramped up to 100% microemulsion over 8 minutes. All peaks
were fully resolved in a little over seven minutes as shown in Figure 7.3.
min0 1 2 3 4 5 6 7
mAU
0
50
100
150
200
250
300
VWD1 A, Wavelength=220 nm (261006\50STDME0.D)
2-acetamidopenol
Paracetamol
4-nitrophenol4-chloroacetanilide
4-hydroxyacetophenone4-aminophenol
unknown
Figure 7.3 Separation of paracetamol and related substances using gradient elution. Flow rate 1.2ml.min-
1, 150 x 4.6 x 3.5 μm C18 column, 40º C. Gradient conditions; (50/50, microemulsion/0.05% TFA) ramped up to 100% microemulsion over 8 minutes.
For stability indicating studies, the amount of impurities normally tolerated in
pharmaceutical formulations and bulk products is no more than 0.1% of the
concentration of the main compound. When the MELC gradient method described
above was used for the separation of paracetamol suppository samples spiked with 0.1%
of each related compound it was found that the separation shown in Figure 7.3 could not
be reproduced.
In an effort to achieve reproducible separations for the sample solution, a number of
column equilibration studies were carried out. Initial gradient runs involved reducing
the proportion of microemulsion in the starting mobile phase to 90% with 10% of
0.05% TFA, ramped up to 100% microemulsion in 8 minutes. With such a high
proportion of microemulsion in the mobile phase, repeat injections without re-
equilibration between injections produced retention times with repeatability of ~2%
RSD. As the proportion of microemulsion in the starting mobile phase was gradually
reduced, it was observed that retention time repeatability deteriorated further when
performing repeat injections with no re-equilibration. Not only were retention times
irreproducible but peak shape and resolution was also adversely affected and a gradual
182
increase in the level of the baseline was observed. The observed effects of starting
mobile phase concentration at injection and column equilibration are summarised in
Table 7.3.
Table 7.3 Gradient MELC – gradient conditions & column equilibration observations
Starting gradient conditions Equilibration required and chromatographic behaviour
100% microemulsion (ME) No re-equilibration was necessary, repeatable retention times achieved after initial column equilibration (~3 hours)
90% ME ramped up to 100% in 8 minutes. Flow rate 1.2 ml.min-1
With no re-equilibration, retention time and peak resolution repeatability was reduced. Repeatability was achieved after ~10 minutes re-equilibration with 100% microemulsion when baseline stabilised at 0 absorbance units.
60 - 90% ME With no re-equilibration, repeatability further deteriorated and baseline gradually increased during the run. Re-equilibration with the microemulsion for ~20 minutes was required until the baseline stabilised.
20 - 60% ME Retention time reproducibility was very poor. Peak shape deteriorated (widened) and baseline increased sharply during the run. Extended re-equilibration time was required (up to 40 minutes). After re-equilibration, the chromatographic results were poor at lower ME concentrations.
<20% ME Very poor chromatographic results were achieved even after re-equilibration for over 40 minutes.
In an effort to achieve better separation of the test compounds and more reproducible
chromatographic results, the column was equilibrated with the standard SDS
microemulsion diluted between 40 – 100% (v/v) with 0.05% TFA. The test mixture was
run using each diluted microemulsion under isocratic conditions. Figure 7.4 illustrates
the effect of using isocratic elution with the standard SDS microemulsion at different
concentrations on the separation of paracetamol and its related compounds. Changing
the strength of the microemulsion had little effect on the retention times of any
compound with 4-aminophenol and 4-chloroacetanilide co-eluting at all concentrations.
Runs were not performed at concentrations lower than 40% microemulsion as the data
suggested no improvement in separation would be achieved and the peak shapes for all
detected compounds broadened and deteriorated as the microemulsion concentration
was lowered.
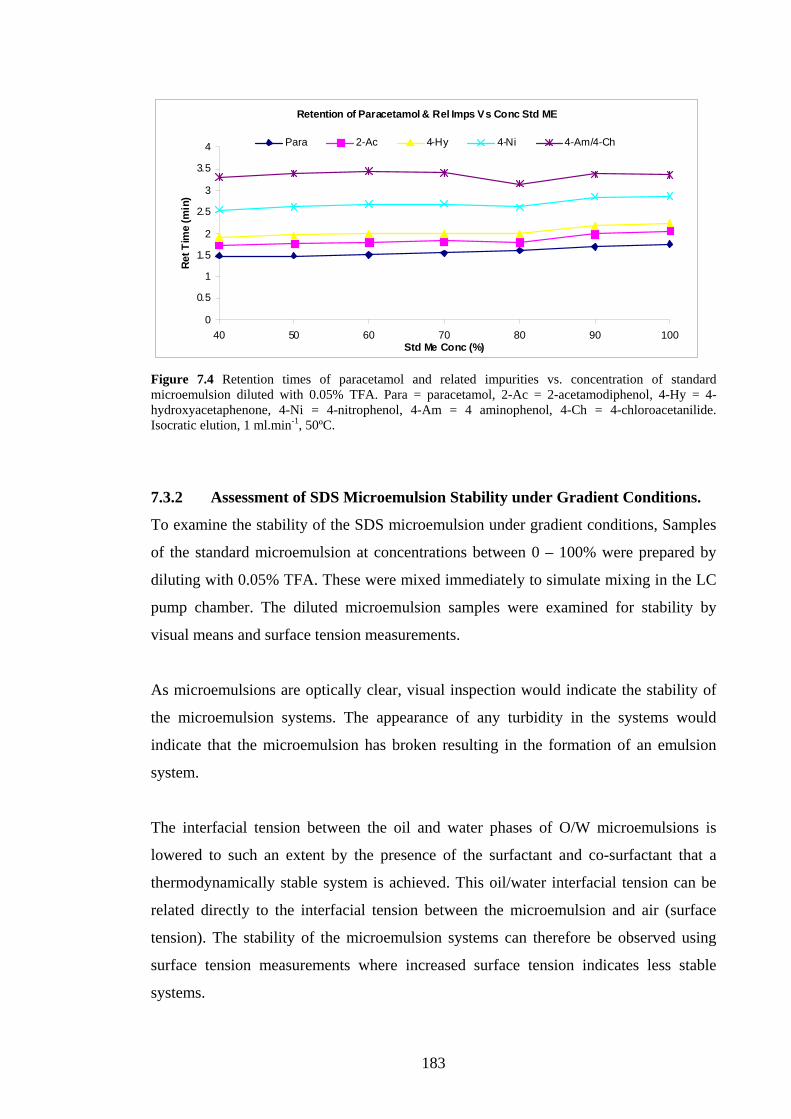
183
Retention of Paracetamol & Rel Imps Vs Conc Std ME
0
0.5
1
1.5
2
2.5
3
3.5
4
40 50 60 70 80 90 100Std Me Conc (%)
Ret T
ime
(min
)
Para 2-Ac 4-Hy 4-Ni 4-Am/4-Ch
Figure 7.4 Retention times of paracetamol and related impurities vs. concentration of standard microemulsion diluted with 0.05% TFA. Para = paracetamol, 2-Ac = 2-acetamodiphenol, 4-Hy = 4-hydroxyacetaphenone, 4-Ni = 4-nitrophenol, 4-Am = 4 aminophenol, 4-Ch = 4-chloroacetanilide. Isocratic elution, 1 ml.min-1, 50ºC.
7.3.2 Assessment of SDS Microemulsion Stability under Gradient Conditions.
To examine the stability of the SDS microemulsion under gradient conditions, Samples
of the standard microemulsion at concentrations between 0 – 100% were prepared by
diluting with 0.05% TFA. These were mixed immediately to simulate mixing in the LC
pump chamber. The diluted microemulsion samples were examined for stability by
visual means and surface tension measurements.
As microemulsions are optically clear, visual inspection would indicate the stability of
the microemulsion systems. The appearance of any turbidity in the systems would
indicate that the microemulsion has broken resulting in the formation of an emulsion
system.
The interfacial tension between the oil and water phases of O/W microemulsions is
lowered to such an extent by the presence of the surfactant and co-surfactant that a
thermodynamically stable system is achieved. This oil/water interfacial tension can be
related directly to the interfacial tension between the microemulsion and air (surface
tension). The stability of the microemulsion systems can therefore be observed using
surface tension measurements where increased surface tension indicates less stable
systems.

184
Each diluted microemulsion from 0 – 100% was examined visually for turbidity.
Surface tension measurements were performed in triplicate on each microemulsion and
a mean value was calculated.
Solutions were prepared to compare the SDS microemulsion and similar non-
microemulsion SDS systems. Turbidity and surface tension of non-microemulsion
systems were measured and compared to the microemulsion prepared with the same
surfactant. The non-microemulsion systems were prepared as detailed in Table 7.4.
Table 7.4 Non-microemulsion SDS systems
Surfactant Butanol octane Aqueous phase Type
A 33 g SDS - - 1000 ml 0.05% TFA Micellar System
B 33 g SDS - 8 g 1000 ml 0.05% TFA Emulsion
C 33 g SDS 66 g - 1000 ml 0.05% TFA Micellar/microemulsion
System
7.3.3 Assessment of CTAB Microemulsion Stability under Gradient Conditions.
A CTAB microemulsion was prepared in the same manner as the SDS microemulsion
except that the SDS surfactant was replaced with an equimolar amount of CTAB
(41.6g). Samples of the CTAB microemulsion were diluted with 0.05% TFA to give a
range of microemulsion concentrations between 0 – 100%.
Each of these diluted microemulsions was examined visually for evidence of turbidity.
Surface tension measurements were also carried out in triplicate on each sample and
mean values calculated. Surface tension was plotted against microemulsion
concentration.
A micellar CTAB solution was prepared using 41.6 g of CTAB made up in 1094 ml of
0.05% TFA. This was the same w/v concentration of CTAB as in the microemulsion.
When the microemulsion components were combined using 1000 ml of 0.05% TFA, the
total volume was 1094 ml. This micellar solution was examined for turbidity and
surface tension. Again surface tension was plotted against concentration.
185
7.3.4 Assessment of TTAB Microemulsion Stability under Gradient Conditions
Microemulsions were prepared using an equimolar weight (38.5 g) of cationic TTAB as
the microemulsion surfactant, all other components were the same as the previously
prepared SDS and CTAB microemulsions. A range of diluted TTAB microemulsions
was prepared between 0 – 100% and examined for turbidity and surface tension.
7.3.5 Assessment of DOTAB Microemulsion Stability with Gradient Conditions
An equimolar weight (35.2 g) of DOTAB was used as the microemulsion surfactant and
prepared as previously with all other components the same. Again, a range of diluted
microemulsions was prepared using 0.05% TFA from 0 – 100% and examined for
turbidity and surface tension.
7.3.6 Stability Assessment of Microemulsion Prepared using Mixed Surfactants
It was attempted to prepare a microemulsion using the non-ionic surfactant Brij 35 in
the same molar ratio as all other surfactants however the microemulsion would not
form. Repeated attempts to vary the amount of Brij 35 used was unsuccessful in
forming a microemulsion. The non-ionic surfactant was also mixed with SDS but again
the microemulsion did not form. When equal amounts of Brij 35 and CTAB were used
the microemulsion formed successfully. The molar concentration of surfactant in this
microemulsion was not identical to previous microemulsions but was in equal
concentration (w/w) to the standard SDS microemulsion i.e. the total weight of the Brij
35/CTAB in the system was 33 g. The mixed surfactant microemulsion was diluted as
previously from 0 - 100% with 0.05% TFA, mixed and examined for turbidity. Surface
tension measurements were carried out on each concentration of the mixed surfactant
microemulsion and results were plotted.

186
7.4 Results of Microemulsion Stability Studies
7.4.1 SDS Microemulsion Stability
Samples of the standard microemulsion were diluted with 0.05% TFA to give
concentrations of 0-100%. These were mixed immediately to simulate mixing in the
HPLC pump chamber. It was noted that the systems became turbid between 70 and 80%
as shown in Figure 7.5.
Figure 7.5 Photograph of standard microemulsion mixed with 0.05% TFA. From left to right, 0-100% ME, turbidity occurring between 70 & 80%. Between 0 & 10% is the CMC of SDS where the solution becomes clear.
From Figure 7.5 it can be seen that the standard microemulsion broke and became
turbid when diluted to between 70-80% suggesting the formation of an emulsion. As
this was a representation of what happened to the microemulsion when performing
gradient separations it may have explained why gradient separation became difficult and
irreproducible. To further investigate the characteristics of these diluted
microemulsions, surface tension measurements were performed on each dilution. The
effects of the SDS microemulsion concentration on its surface tension are shown in
Figure 7.6. The surface tension of the undiluted microemulsion was 31.5 dynes/cm and
remained constant until dilution to approximately 73% as indicated by the arrow. Below
this concentration the surface tension increased linearly until the concentration of SDS
began to reach its CMC, after which a sharp increase was observed as the SDS
aggregates disassembled. The point where the first increase begins (indicated by the red
arrow) corresponds to approximately the same concentration where turbidity begins
shown in Figure 7.5.
0% 100%
70% 80%
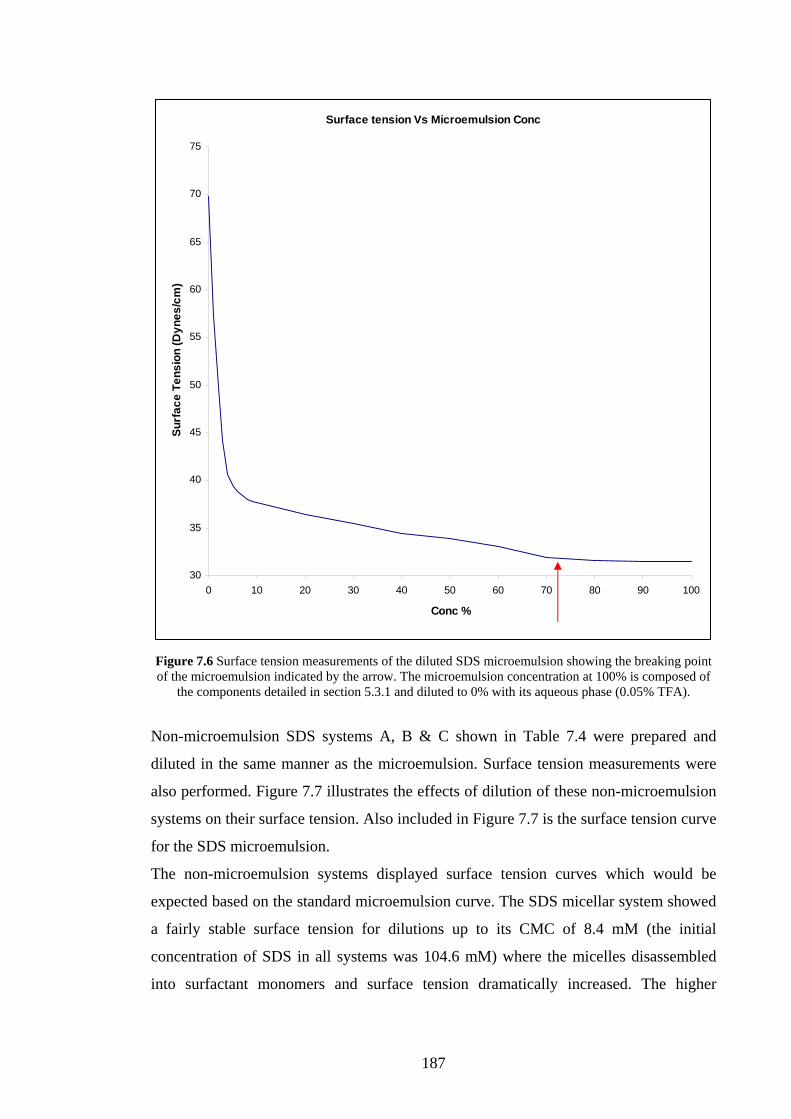
187
Surface tension Vs Microemulsion Conc
30
35
40
45
50
55
60
65
70
75
0 10 20 30 40 50 60 70 80 90 100
Conc %
Surf
ace
Tens
ion
(Dyn
es/c
m)
Figure 7.6 Surface tension measurements of the diluted SDS microemulsion showing the breaking point of the microemulsion indicated by the arrow. The microemulsion concentration at 100% is composed of
the components detailed in section 5.3.1 and diluted to 0% with its aqueous phase (0.05% TFA).
Non-microemulsion SDS systems A, B & C shown in Table 7.4 were prepared and
diluted in the same manner as the microemulsion. Surface tension measurements were
also performed. Figure 7.7 illustrates the effects of dilution of these non-microemulsion
systems on their surface tension. Also included in Figure 7.7 is the surface tension curve
for the SDS microemulsion.
The non-microemulsion systems displayed surface tension curves which would be
expected based on the standard microemulsion curve. The SDS micellar system showed
a fairly stable surface tension for dilutions up to its CMC of 8.4 mM (the initial
concentration of SDS in all systems was 104.6 mM) where the micelles disassembled
into surfactant monomers and surface tension dramatically increased. The higher

188
surface tension of the micellar system relative to that of the microemulsion was due to
the absence of the cosurfactant.
The emulsion system, which contained no co-surfactant, showed a similar curve to the
micellar solution. The system with no oil, which could also be considered a
microemulsion, resulted in a lower surface tension for the undiluted system than the
standard microemulsion due to the absence of oil. The surface tension curve was similar
to that of the standard microemulsion.
Surface Tension Vs Conc
30
35
40
45
50
55
60
65
70
75
0 10 20 30 40 50 60 70 80 90 100
Conc %
Sur
face
tens
ion
(Dyn
es)
Microemulsion Emulsion Micellar No Oil
Figure 7.7 Surface tension measurements of diluted standard microemulsion and similar non- microemulsion SDS systems. Systems at 100% concentration were prepared as detailed in Table 7.4 and
diluted to 0% with their aqueous phase (0.05% TFA).

189
7.4.2 CTAB Microemulsion Stability
As with the SDS standard microemulsion, surface tension measurements were
performed and turbidity was examined for a range of CTAB microemulsion
concentrations from 0 to 100%. Upon mixing the microemulsion with 0.05% TFA, all
concentrations remained clear and there was no turbidity throughout the concentration
range suggesting that the microemulsion was stable at all dilutions. Figure 7.8 illustrates
the effect of diluting the CTAB microemulsion on its surface tension, also included is
the surface tension measurements for the SDS microemulsion and a CTAB micellar
solution using the same concentration of surfactant.
Surface Tension vs Concentration
28
32
36
40
44
48
52
56
60
64
68
0 10 20 30 40 50 60 70 80 90 100
Concentration (%)
Sur
face
ten
sion
(Dyn
es)
SDS ME CTAB ME CTAB micelle
Figure 7.8 Surface tension of a CTAB and SDS microemulsion vs concentration. Included is the surface tension of a CTAB micellar solution measured over the same concentration range.
190
The surface tension of the undiluted CTAB microemulsion was slightly lower than that
of the standard SDS microemulsion and maintained a lower surface tension than the
standard SDS microemulsion throughout the concentration range with a more gradual
increase. The lower surface tension and the fact that the CTAB microemulsion does not
become turbid for all dilutions suggest that it is more stable than the SDS
microemulsion under gradient chromatographic conditions. It was also evident that the
surface tension curve for the CTAB microemulsion was lower throughout the
concentration range than the CTAB micellar solution suggesting that micelles do not
form at any stage of the dilution. The CTAB micellar solution displayed lower surface
tension than the SDS micellar solution shown in Figure 7.7 indicating that the CTAB
molecules contribute more to lowering the interfacial tension between the two phases of
the microemulsion than SDS. The surface tension of the diluted CTAB microemulsion
shows a gradual increase from 100% until the CMC of CTAB is reached (0.9 mM)
when the surface tension rapidly approaches that of water.
7.4.3 DOTAB Microemulsion Stability
Dodecyltrimethylammonium bromide (DOTAB) is a similar cationic surfactant to
CTAB with an identical head group and a C12 hydrocarbon tail group identical to that of
SDS. Samples of the diluted DOTAB microemulsion were prepared in the concentration
range of 0-100% and examined for signs of turbidity. Similar to the standard SDS
microemulsion, it was found that turbidity occurred between 70 and 80% as shown in
Figure 7.9.
Surface tension measurements were performed on all samples and plotted against
microemulsion concentration. Figure 7.10 illustrates the surface tension curves for
microemulsions prepared with SDS, CTAB and DOTAB. The surface tension
measurements for both cationic surfactants were almost identical at 100% concentration
however as the concentration was reduced, the DOTAB curve showed a sharp increase
at approx 75% (the point where turbidity occurs) similar to that of the SDS curve. At
subsequent lower concentrations the DOTAB curve strongly resembled that of the SDS
microemulsion.

191
Figure 7.9 Photograph of DOTAB microemulsion mixed with 0.05% TFA. From left to right, 0-100% ME, turbidity occurring between 70 & 80%. Between 0 & 10% is the CMC of DOTAB where the solution became clear.
Surface Tension vs ME Conc
28
32
36
40
44
48
52
56
60
64
68
0 10 20 30 40 50 60 70 80 90 100
Conc (%)
Surf
ace
Tens
ion
(Dyn
es)
SDS ME CTAB ME DOTAB ME
Figure 7.10 Surface tension of DOTAB, SDS and CTAB microemulsion vs concentration.
0% 100%
70% 80%
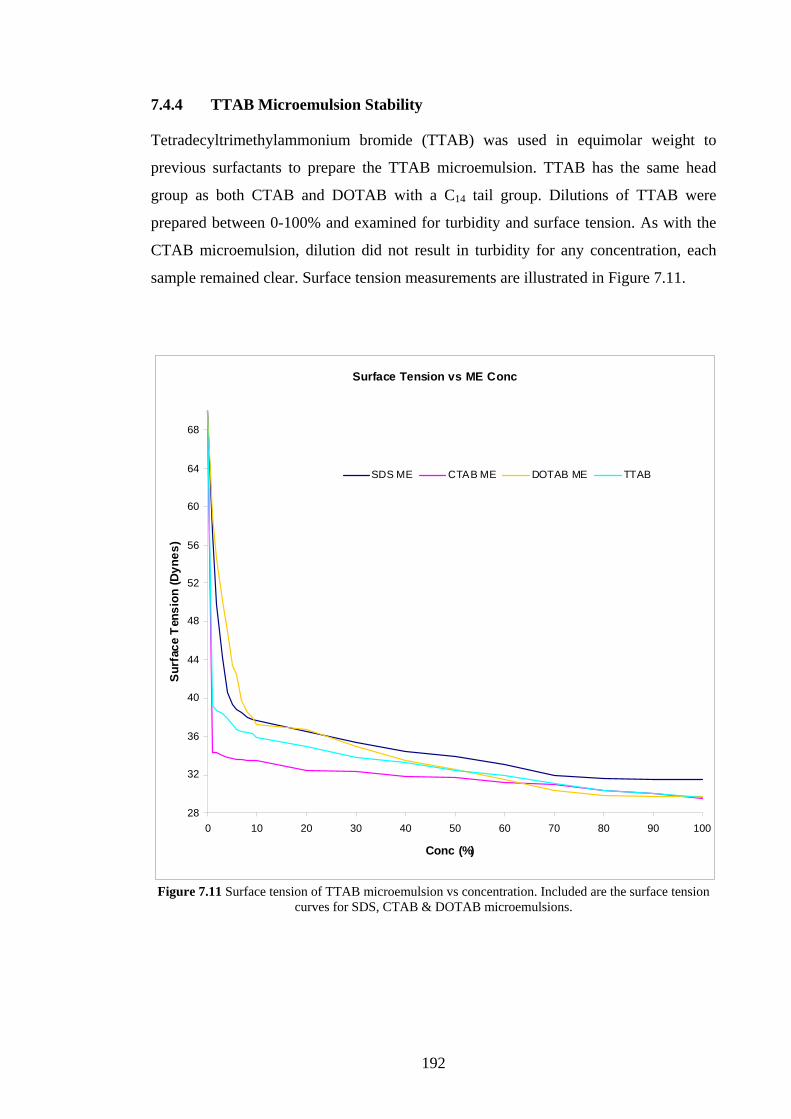
192
7.4.4 TTAB Microemulsion Stability
Tetradecyltrimethylammonium bromide (TTAB) was used in equimolar weight to
previous surfactants to prepare the TTAB microemulsion. TTAB has the same head
group as both CTAB and DOTAB with a C14 tail group. Dilutions of TTAB were
prepared between 0-100% and examined for turbidity and surface tension. As with the
CTAB microemulsion, dilution did not result in turbidity for any concentration, each
sample remained clear. Surface tension measurements are illustrated in Figure 7.11.
Surface Tension vs ME Conc
28
32
36
40
44
48
52
56
60
64
68
0 10 20 30 40 50 60 70 80 90 100
Conc (%)
Sur
face
Ten
sion
(Dyn
es)
SDS ME CTAB ME DOTAB ME TTAB
Figure 7.11 Surface tension of TTAB microemulsion vs concentration. Included are the surface tension curves for SDS, CTAB & DOTAB microemulsions.
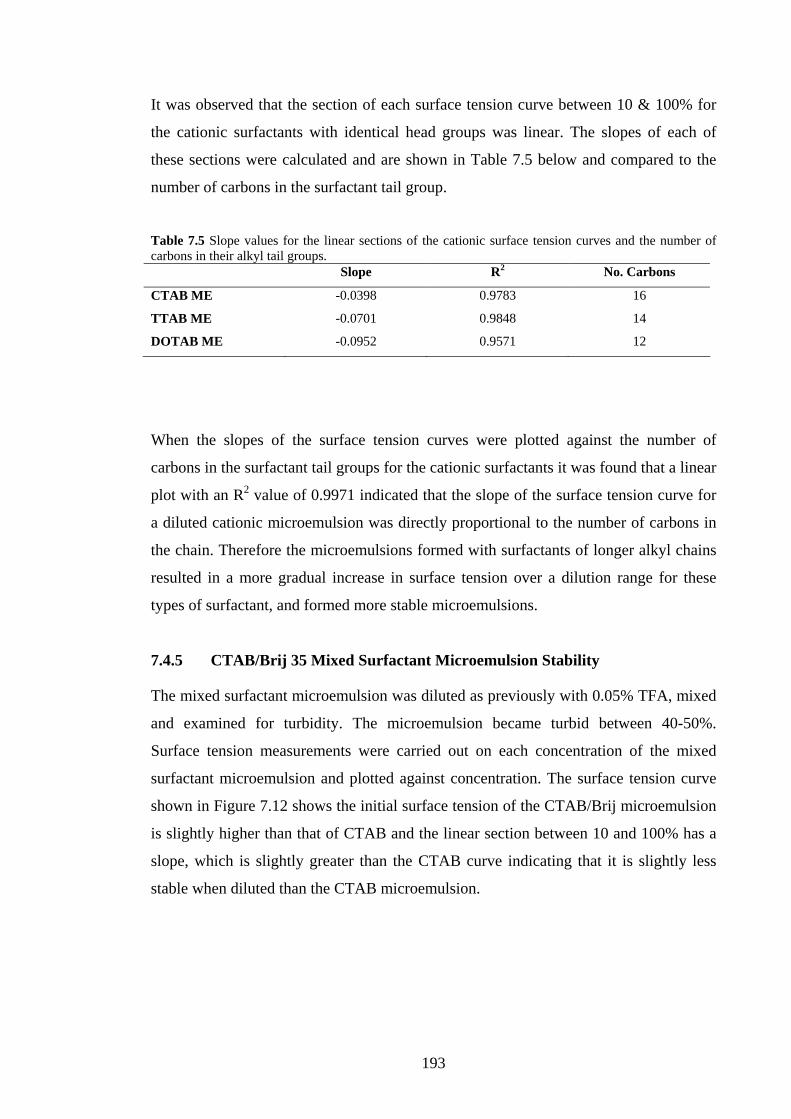
193
It was observed that the section of each surface tension curve between 10 & 100% for
the cationic surfactants with identical head groups was linear. The slopes of each of
these sections were calculated and are shown in Table 7.5 below and compared to the
number of carbons in the surfactant tail group.
Table 7.5 Slope values for the linear sections of the cationic surface tension curves and the number of carbons in their alkyl tail groups. Slope R2 No. Carbons
CTAB ME -0.0398 0.9783 16
TTAB ME -0.0701 0.9848 14
DOTAB ME -0.0952 0.9571 12
When the slopes of the surface tension curves were plotted against the number of
carbons in the surfactant tail groups for the cationic surfactants it was found that a linear
plot with an R2 value of 0.9971 indicated that the slope of the surface tension curve for
a diluted cationic microemulsion was directly proportional to the number of carbons in
the chain. Therefore the microemulsions formed with surfactants of longer alkyl chains
resulted in a more gradual increase in surface tension over a dilution range for these
types of surfactant, and formed more stable microemulsions.
7.4.5 CTAB/Brij 35 Mixed Surfactant Microemulsion Stability
The mixed surfactant microemulsion was diluted as previously with 0.05% TFA, mixed
and examined for turbidity. The microemulsion became turbid between 40-50%.
Surface tension measurements were carried out on each concentration of the mixed
surfactant microemulsion and plotted against concentration. The surface tension curve
shown in Figure 7.12 shows the initial surface tension of the CTAB/Brij microemulsion
is slightly higher than that of CTAB and the linear section between 10 and 100% has a
slope, which is slightly greater than the CTAB curve indicating that it is slightly less
stable when diluted than the CTAB microemulsion.
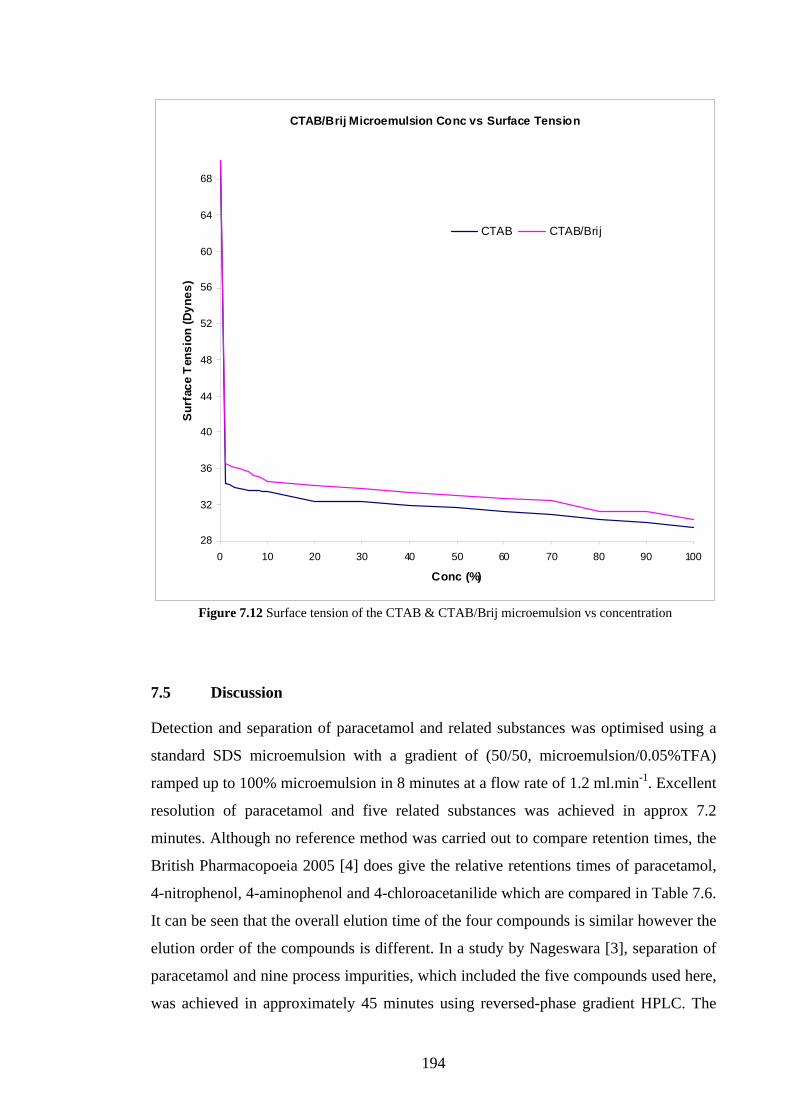
194
CTAB/Brij Microemulsion Conc vs Surface Tension
28
32
36
40
44
48
52
56
60
64
68
0 10 20 30 40 50 60 70 80 90 100
Conc (%)
Sur
face
Ten
sion
(Dyn
es)
CTAB CTAB/Brij
Figure 7.12 Surface tension of the CTAB & CTAB/Brij microemulsion vs concentration
7.5 Discussion
Detection and separation of paracetamol and related substances was optimised using a
standard SDS microemulsion with a gradient of (50/50, microemulsion/0.05%TFA)
ramped up to 100% microemulsion in 8 minutes at a flow rate of 1.2 ml.min-1. Excellent
resolution of paracetamol and five related substances was achieved in approx 7.2
minutes. Although no reference method was carried out to compare retention times, the
British Pharmacopoeia 2005 [4] does give the relative retentions times of paracetamol,
4-nitrophenol, 4-aminophenol and 4-chloroacetanilide which are compared in Table 7.6.
It can be seen that the overall elution time of the four compounds is similar however the
elution order of the compounds is different. In a study by Nageswara [3], separation of
paracetamol and nine process impurities, which included the five compounds used here,
was achieved in approximately 45 minutes using reversed-phase gradient HPLC. The
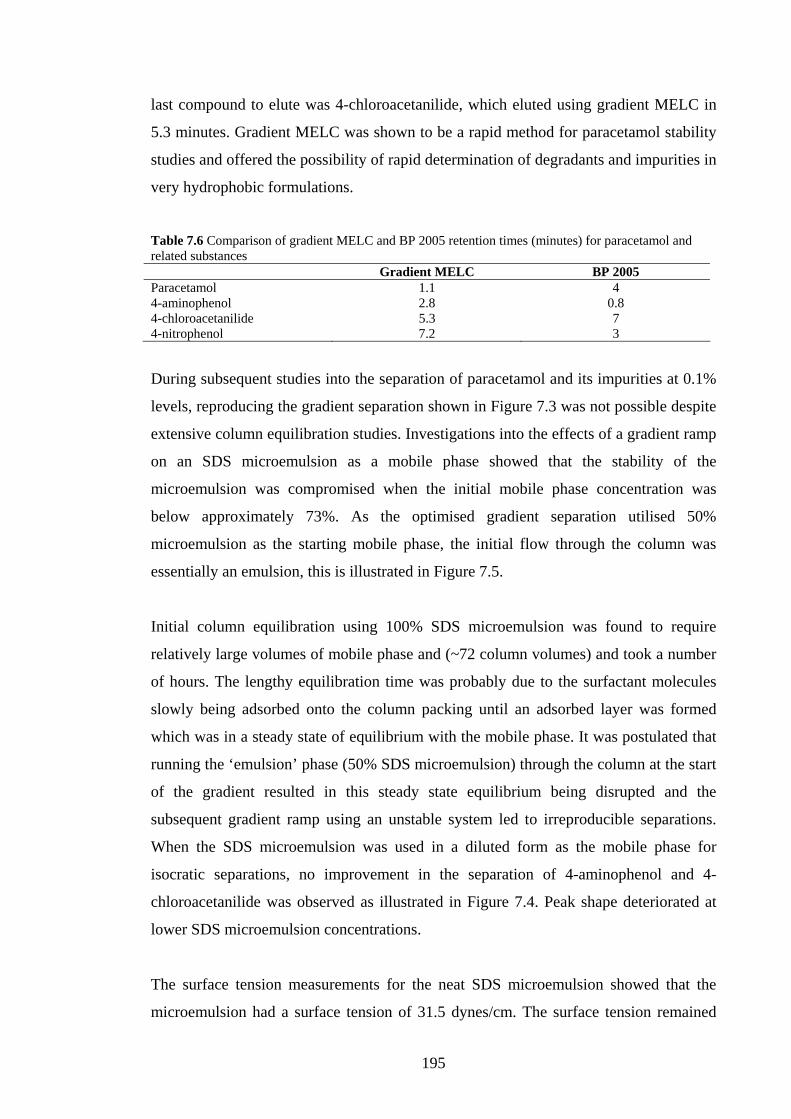
195
last compound to elute was 4-chloroacetanilide, which eluted using gradient MELC in
5.3 minutes. Gradient MELC was shown to be a rapid method for paracetamol stability
studies and offered the possibility of rapid determination of degradants and impurities in
very hydrophobic formulations.
Table 7.6 Comparison of gradient MELC and BP 2005 retention times (minutes) for paracetamol and related substances Gradient MELC BP 2005 Paracetamol 1.1 4 4-aminophenol 2.8 0.8 4-chloroacetanilide 5.3 7 4-nitrophenol 7.2 3
During subsequent studies into the separation of paracetamol and its impurities at 0.1%
levels, reproducing the gradient separation shown in Figure 7.3 was not possible despite
extensive column equilibration studies. Investigations into the effects of a gradient ramp
on an SDS microemulsion as a mobile phase showed that the stability of the
microemulsion was compromised when the initial mobile phase concentration was
below approximately 73%. As the optimised gradient separation utilised 50%
microemulsion as the starting mobile phase, the initial flow through the column was
essentially an emulsion, this is illustrated in Figure 7.5.
Initial column equilibration using 100% SDS microemulsion was found to require
relatively large volumes of mobile phase and (~72 column volumes) and took a number
of hours. The lengthy equilibration time was probably due to the surfactant molecules
slowly being adsorbed onto the column packing until an adsorbed layer was formed
which was in a steady state of equilibrium with the mobile phase. It was postulated that
running the ‘emulsion’ phase (50% SDS microemulsion) through the column at the start
of the gradient resulted in this steady state equilibrium being disrupted and the
subsequent gradient ramp using an unstable system led to irreproducible separations.
When the SDS microemulsion was used in a diluted form as the mobile phase for
isocratic separations, no improvement in the separation of 4-aminophenol and 4-
chloroacetanilide was observed as illustrated in Figure 7.4. Peak shape deteriorated at
lower SDS microemulsion concentrations.
The surface tension measurements for the neat SDS microemulsion showed that the
microemulsion had a surface tension of 31.5 dynes/cm. The surface tension remained

196
constant until the microemulsion was diluted to approximately 73% with 0.05% TFA
after which there was a linear increase in surface tension until the CMC of SDS was
reached. These measurements correlated well with the turbidity assessment of the range
of diluted microemulsions. The approximate extent to which each of the microemulsion
components contributes to lower or increase the surface tension of the microemulsion
can be observed in Figure 7.7. At 100% concentration, the system containing SDS,
butanol and TFA had the lowest surface tension due to the absence of oil. The emulsion
system without co-surfactant had the highest, while the micellar system was slightly
lower indicating that the presence of the co-surfactant had a pronounced influence on
the microemulsion thermodynamic stability.
Similar stability studies carried out on the neat CTAB microemulsion showed that the
microemulsion surface tension was lower than that of the neat SDS microemulsion. As
the molar concentration of surfactant in each microemulsion was the same, it can be
stated that the same numbers of surfactant molecules contribute to the formation of the
stable system and the lower surface tension was due to the longer alkyl chain length of
CTAB. However, Figure 7.11 illustrates the surface tension measurements obtained for
neat SDS, CTAB, DOTAB & TTAB microemulsions where the surface tension values
were almost identical for each of the neat cationic microemulsions with different chain
length. DOTAB for example has the same alkyl chain length as SDS but has lower
surface tension, therefore it was concluded that the head group charge & functionality
contributed most to the greater stability of the neat cationic microemulsions.
The CTAB microemulsion apparently remained stable and clear throughout the dilution
range as was evident from the turbidity observations where no phase separation or
breaking of the microemulsion was seen. The surface tension measurements performed
on the dilute CTAB microemulsions show that the linear increase between 90-10% had
a gentler slope than that of the SDS microemulsion concentration range. When the
slopes of the linear sections for the three cationic microemulsions (Table 7.5) were
plotted against the number of carbons in their alkyl chains, the resulting curve indicated
that cationic microemulsions with longer alkyl chains remained more stable when
diluted under gradient conditions.

197
The effects of using mixed surfactants on microemulsion stability are shown in Figure
7.12 where the neat CTAB/Brij 35 microemulsion had a higher surface tension than the
CTAB microemulsion. This indicates that the non-ionic surfactant contributed less to
lowering the surface tension of the system. When the system was diluted, its increase in
surface tension was almost parallel to that of the pure CTAB system but became turbid
between 40 & 50%. The loss of stability at lower concentrations may have been due to
the lower amount of CTAB in the microemulsion.
7.6 Conclusion
A gradient MELC method utilising an SDS microemulsion was successful for the
separation of paracetamol and five of its related compounds which could not be fully
resolved using an isocratic MELC method. This gradient MELC method however, was
found to be irreproducible due to the poor stability of the SDS microemulsion under
gradient conditions.
Examination of the SDS microemulsion for stability using surface tension and turbidity
assessments showed that the concentration of the butanol cosurfactant had a crucial role
in reducing the interfacial tension of the system and keeping it thermodynamically
stable. The dilution of the microemulsion altered the ratios of the components to the
extent that the system became thermodynamically unstable.
When the cationic microemulsions were examined for stability under gradient
conditions, it was concluded that their ammonium bromide head groups contributed
most to the lower surface tension of the neat microemulsions compared to the SDS
microemulsion. The stability of the cationic microemulsions under gradient conditions
was found to be dependant on the length of their alkyl chain with CTAB having a C16
alkyl group producing the most stable microemulsion for gradient use.
Attempts to form microemulsions with non-ionic surfactants and mixed SDS/non-ionic
surfactants were unsuccessful. Mixed surfactants of CTAB and non-ionic Brij 35
resulted in the formation of a microemulsion, however its stability was reduced
compared to the pure CTAB system and was not stable under gradient conditions.
198
The separation of pharmaceutical compounds and their related substances is a crucial
aspect of pharmaceutical analysis. It was demonstrated that MELC can be utilised for
these applications however the use of gradient elution using an SDS microemulsion
proved problematic. The cationic microemulsions used in this section of MELC
research have been shown to have greater stability than their SDS equivalent. The next
chapter of work will look at evaluating these microemulsions for the gradient MELC
separations of paracetamol and its related substances in suppository formulations.
7.7 References
[1] Marsh A, Clark BJ, Altria, KD, Chromatographia, 61(11-12), 539-547 (2005).
[2] Altria KD, Marsh A, Clark BJ, Chromatographia 63(7-8), 309-314 (2006).
[3] Nageswara Rao R., Narasaraju A. Analytical Sciences 22, 287-292 (2006).
[4] British Pharmacopoeia (2005) Vol III, pp 2554.
199
Chapter Eight
Stability Indicating Studies for Paracetamol
using both MELC and MEEKC
200
8.1 Introduction and Aims
Preliminary studies described in Chapters Five and Six have shown that MELC and
MEEKC utilising both cationic and anionic microemulsions were suitable for the
analysis of paracetamol in a suppository formulation. Sample preparation was kept to a
minimum and sample extraction was eliminated due to the high solubilising power of
the microemulsions for both polar and non-polar substances.
Investigations into the stability indicating capacity of a gradient SDS MELC method
described in Chapter Seven, initially found that paracetamol and five of its related
substances could be rapidly separated. Reproducing the gradient separation was
subsequently found to be impossible due to the poor stability of the SDS microemulsion
when subjected to gradient elution conditions. Three cationic microemulsions and a
mixed cationic/non-ionic microemulsion were also investigated and their stabilities
were found to vary under gradient conditions with the microemulsion formed using
cationic surfactants with longer alkyl chains being more stable.
This section of work was aimed at assessing the cationic microemulsions formed using
CTAB, DOTAB and TTAB surfactants and mixed CTAB/Brij 35 surfactants for the
separation of paracetamol and five of its impurities in a suppository formulation using
isocratic and gradient MELC. The effects of using diluted concentrations of the cationic
microemulsions for isocratic separations were also to be investigated.
The work carried out in Chapter Six describes the use of both SDS and CTAB MEEKC
for the analysis of paracetamol in suppositories. Further to that study, this section of
experimental investigations was aimed at optimising the MEEKC methods described in
Chapter Six for the separation of paracetamol and its related compounds and contrasting
them with MELC methods.
It was also reported in Chapters Five and Six that the CTAB microemulsions prepared
for use with both MELC and MEEKC separations had greater solubilising power for
hydrophobic substances than the SDS microemulsion. A final aim of this section was to
assess the solubilising power of microemulsions formed with surfactants of different
head groups and alkyl chain lengths i.e. C12 SDS, C12 DOTAB and C16 CTAB.

201
8.2 Materials
8.2.1 Chemicals
All microemulsion components were identical to those described in Section 7.2.1.
Additional suppository formulations; Dulco Lax and Anusol HC were obtained from a
local pharmacy. These were to be used to assess the solubilising power of different
microemulsions. Paracetamol and related substances were as shown in Section 7.2.1.
8.2.2 Equipment
The LC equipment utilised was the same as described in Section 7.2.2. The CE
equipment was the same as described in Section 6.2.2.
8.3 Experimental
8.3.1 Microemulsion Preparation
Microemulsions for use with MELC and MEEKC were prepared based on the standard
microemulsion composition of 33 g SDS, 66 g butan-1-ol, and 8 g n-octane in 1 litre of
0.05% TFA. The cationic surfactants were used in equimolar weights except for the
CTAB/Brij 35 (D) microemulsion as shown in Table 8.1.
Table 8.1 Composition of microemulsions for use with MELC and MEEKC studies.
Surfactant Butan-1-ol n-octane Aqueous phase Buffer/Additive MELC
A 41.6 g CTAB 66 g 8 g 1000 ml 0.05% TFA
-
B 35.15 g DOTAB 66 g 8 g 1000 ml 0.05% TFA
-
C 38.48 g TTAB 66 g 8 g 1000 ml 0.05% TFA
-
D 16.5 g CTAB 16.5 g Brij 35
66 g 8g 1000 ml 0.05% TFA
-
E 41.6 g CTAB 66 g 8 g 1000 ml 0.05% phosphoric acid
-
F 41.6 g CTAB 66 g 8 g 1000 ml 0.05% TFA
0.1 – 0.6% TEA
G 41.6 g CTAB 66 g 8 g 1000 ml 0.05% TFA
15, 25 & 50 mM NaH2PO4
H 41.6 g CTAB 66 g 8 g 1000 ml 0.05% TFA
25 &50 mM Na2HPO4
MEEKC I 33 g SDS 66 g 8 g 10 mM
Na2B4O7·10H2O -
J 41.6 g CTAB 66 g 8 g 10 mM Na2B4O7·10H2O
-

202
8.3.2 Sample Preparation
For MELC studies using the cationic microemulsions, samples of 2 mg.ml-1 of the
suppository containing 0.45 mg.ml-1 paracetamol were prepared in the appropriate
microemulsion and spiked with 0.1% (0.45 µg.ml-1) of each of five related compounds.
Samples were prepared in the microemulsion being used as a mobile phase.
MEEKC sample solutions were prepared as follows; suppository samples were prepared
in the SDS microemulsion with a paracetamol concentration of 0.09 mg.ml-1. Samples
were then spiked with 10% w/w (9.0 µg ml-1) and 0.1% (0.09 µg ml-1) of each related
compound. Suppository samples were prepared in the CTAB microemulsion which had
a paracetamol concentration of 0.45 mg.ml-1. Samples were spiked with 10% (4.5
mg.ml-1) and 0.1% (0.45 µg.ml-1) of each related compound.
8.3.3 MELC Chromatographic Conditions
The spiked test mixtures were run under isocratic conditions with each microemulsion
(A-E). Initial column temperature was set at 50º C, UV detection wavelength 250 nm,
flow rate 1 ml.min-1, and using neat microemulsions as mobile phases. Subsequent runs
were performed as outlined in Table 8.2. Microemulsions (E-H) were used to
investigate the effects of different buffers on the separations achieved using the CTAB
microemulsion (A).
Table 8.2 Chromatographic conditions used for each microemulsion. Microemulsion Microemulsion conc. Mode Column temp. ºC Buffer conc.
A 10% to 100% in 10% increments Isocratic 50 - A 100% Isocratic 30-80 - A 70% & 50% to 100% in 5 mins Gradient 50 B 20-100% Isocratic 50 - C 20-100% Isocratic 50 - D 50-100% Isocratic 50 - E 80 & 100% Isocratic 50 - F 100% Isocratic 50 0.1 – 0.6% TEA G 100% Isocratic 50 15, 25 & 50
mM NaH2PO4 H 100% Isocratic 50 25 &50 mM
Na2HPO4
8.3.4 MEEKC Conditions
The initial MEEKC separation conditions using both SDS and CTAB microemulsions
were identical to the conditions used for paracetamol suppository analysis described in
Sections 6.2.4 and 6.2.5. The paracetamol suppository samples spiked with 10% and
203
0.1% of each related compound were injected and run using these conditions. Both
methods were optimised to separate all components.
Initial SDS MEEKC conditions; 50 μM ID fused silica capillary length 32 cm, detection
window at 23.5 cm, flush for 1 minute with 0.1 M NaOH followed by 1 minute with
microemulsion (pH = 9.2), capillary cassette temperature 40º C, applied voltage 16 kV,
sample injection 10 mbar for 10 seconds, UV detection at 200 nm. 30 mbar pressure
applied during run.
Initial CTAB MEEKC conditions; 50 μM ID fused silica capillary length 32 cm,
detection window at 23.5 cm, flush for 1 minute with 0.1 M NaOH followed by 1
minute with microemulsion (pH = 9.2), capillary cassette temperature 40º C, applied
voltage -16 kV, sample injection 10 mbar for 10 seconds, UV detection at 254 nm. 30
mbar pressures applied during run.
8.3.5 Determination of the Solubilising Power of Different Microemulsions.
As described in Chapters Five & Six, a suppository formulation was analysed using
validated O/W MELC and MEEKC methods using SDS and CTAB microemulsions.
The highly hydrophobic sample was solubilised in the microemulsion utilised as the
mobile phase and carrier electrolyte. When a sample of the suppository was solubilised
in both the SDS and CTAB microemulsions, it was noticed that the sample dissolved
more easily and quickly using the CTAB microemulsion as the sample solvent.
To examine the solubilising power of different types of microemulsions (anionic and
cationic) for highly hydrophobic samples, three suppository formulations were obtained.
These contained different active ingredients and similar excipients, with hard fat as a
bulk component common to each. The solubilising powers of both anionic and cationic
surfactants used in microemulsions and the effect of different carbon chain lengths and
head groups were examined for each formulation.
To three sets of 50 mg each of Paralink, Anusol HC and Dulco Lax suppositories, 20 ml
of each microemulsion prepared using equimolar amounts of SDS, CTAB and DOTAB
was added. These were placed in an ultrasonic bath and sonicated with intermittent
shaking. After 2 hours the samples were removed and allowed to rest for one hour. Each

204
sample was filtered by gravity using pre-dried and pre-weighed filter paper. These filter
papers and samples were then dried in an oven on a weighed clock glass at 30º C for 24
hours. The sample and clock glass were allowed to cool and weighed, the weight of the
undissolved sample and the % sample solubilised was calculated. The solubilising
powers of the microemulsions relative to the standard SDS microemulsion were
calculated as; % of sample solubilised by microemulsion divided by the % solubilised
by the SDS microemulsion. The solubilising power of the standard SDS microemulsion
was used as a reference and was equal to 1.0.
8.4 Results
8.4.1 Separation of Spiked Paracetamol Sample using CTAB MELC
Initial isocratic separation of the spiked sample resulted in an improved separation
compared to that achieved with the SDS microemulsion with a different elution order of
the compounds. Figure 8.1 shows the separation achieved using the SDS microemulsion
under isocratic conditions, while Figure 8.2 shows the separation achieved with the
CTAB microemulsion as sample solvent and mobile phase and UV detection at 230 nm.
The separation achieved using the CTAB microemulsion showed good resolution of all
peaks however the last two peaks were not adequately resolved for validation purposes
despite the low sample concentrations.
min0 1 2 3 4 5
mAU
0
50
100
150
200
250
300
350
400
VWD1 A, Wavelength=220 nm (261006\TESB0000.D)
unknown
Paracetamol
2-acetamidophenol
4-aminophenol/4-hydroxyacetophenone
4-chloroacetanilide 4-nitrophenol
Figure 8.1 Isocratic separation of paracetamol and related substances. 100% standard SDS microemulsion. Flow rate 1.2ml.min-1, 150 x 4.6mm x 3.5 micron C18 column, 40º Celsius, 220nm.

205
min0 0.5 1 1.5 2 2.5 3 3.5 4 4.5
mAU
0
2.5
5
7.5
10
12.5
15
17.5
VWD1 A, Wavelength=230 nm (140307\CTABMX08.D)
4-Am
Pa
2-Ac
4-Hy4-Ni 4-Ch
Figure 8.2 Exploratory separation of paracetamol and related substances using 100% CTAB microemulsion with isocratic elution. Flow rate 1 ml.min-1, 50º C, C18 150 mm x 4.6 mm column with 3 µm packing. 4-Am = 4-aminophenol, Pa = paracetamol, 2-Ac = 2-acetamidophenol, 4-Hy = 4-hydroxyacetaphenone, 4-Ni = 4-nitrophenol, 4-Ch = 4-chloroacetanilide.
To investigate the possibility of improving resolution and the effects of gradient elution
on chromatographic behaviour, the column was equilibrated with 70% CTAB
microemulsion/30% 0.05% TFA for 30 minutes prior to injection, the proportion of
microemulsion was ramped up to 100% CTAB ME in 5 minutes after injection. This
was repeated using 50% CTAB microemulsion as the starting mobile phase
concentration.
Gradient elution with 70% initial microemulsion concentration resulted in an extension
of the retention times of later eluting compounds with less of an effect on the earlier
peaks. Peak to peak resolution of the last two peaks was improved. Gradient elution
with 50% starting microemulsion concentration further extended the retention times of
the later peaks but did not result in further improvement in resolution.
Although gradient elution resulted in improved peak to peak resolution for the test
mixture, consistent column equilibration between injections was necessary to achieve
reproducible results. To compare gradient and isocratic elution using a diluted CTAB
microemulsion, the test mixture was run using both isocratic (Figure 8.3) and gradient
modes (Figure 8.4) after the column was equilibrated with 50% CTAB microemulsion
as the mobile phase. Again there was little difference in the retention of the earlier peaks
between gradient and isocratic elution, however the later peaks were more retained
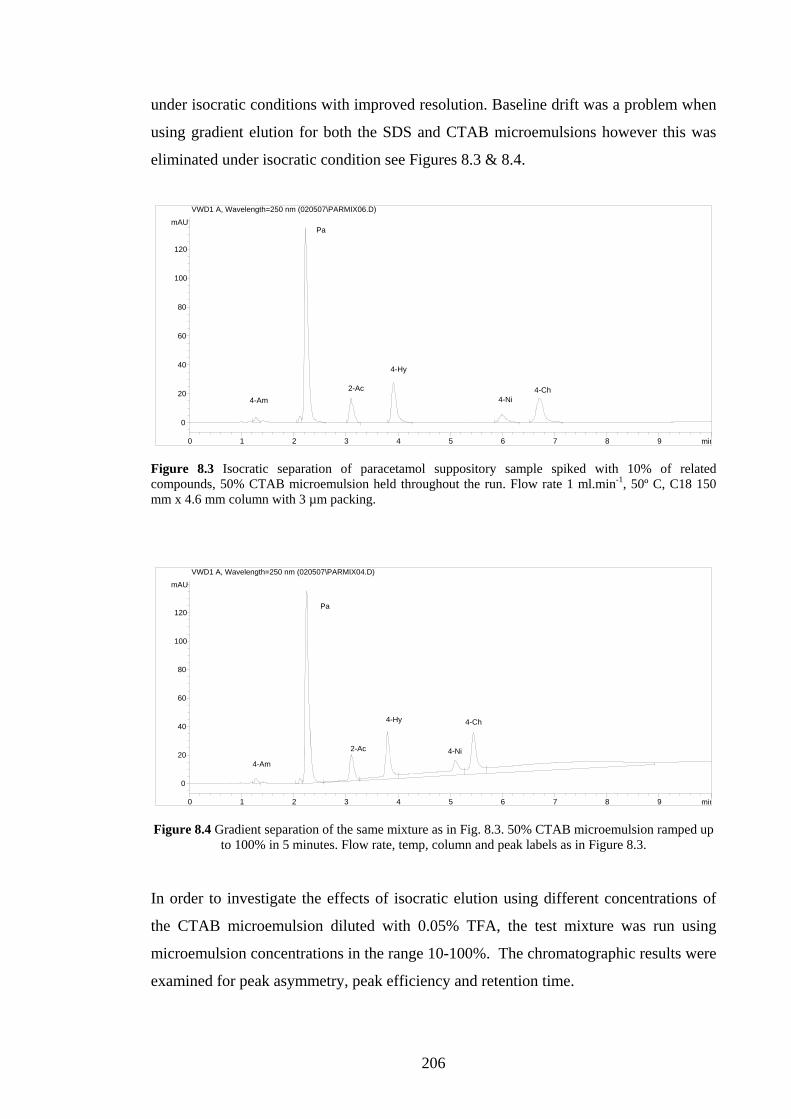
206
under isocratic conditions with improved resolution. Baseline drift was a problem when
using gradient elution for both the SDS and CTAB microemulsions however this was
eliminated under isocratic condition see Figures 8.3 & 8.4.
min0 1 2 3 4 5 6 7 8 9
mAU
0
20
40
60
80
100
120
VWD1 A, Wavelength=250 nm (020507\PARMIX06.D)
4-Am
Pa
2-Ac
4-Hy
4-Ni4-Ch
Figure 8.3 Isocratic separation of paracetamol suppository sample spiked with 10% of related compounds, 50% CTAB microemulsion held throughout the run. Flow rate 1 ml.min-1, 50º C, C18 150 mm x 4.6 mm column with 3 µm packing.
min0 1 2 3 4 5 6 7 8 9
mAU
0
20
40
60
80
100
120
VWD1 A, Wavelength=250 nm (020507\PARMIX04.D)
2-Ac
4-Am
Pa
4-Hy
4-Ni
4-Ch
Figure 8.4 Gradient separation of the same mixture as in Fig. 8.3. 50% CTAB microemulsion ramped up to 100% in 5 minutes. Flow rate, temp, column and peak labels as in Figure 8.3.
In order to investigate the effects of isocratic elution using different concentrations of
the CTAB microemulsion diluted with 0.05% TFA, the test mixture was run using
microemulsion concentrations in the range 10-100%. The chromatographic results were
examined for peak asymmetry, peak efficiency and retention time.
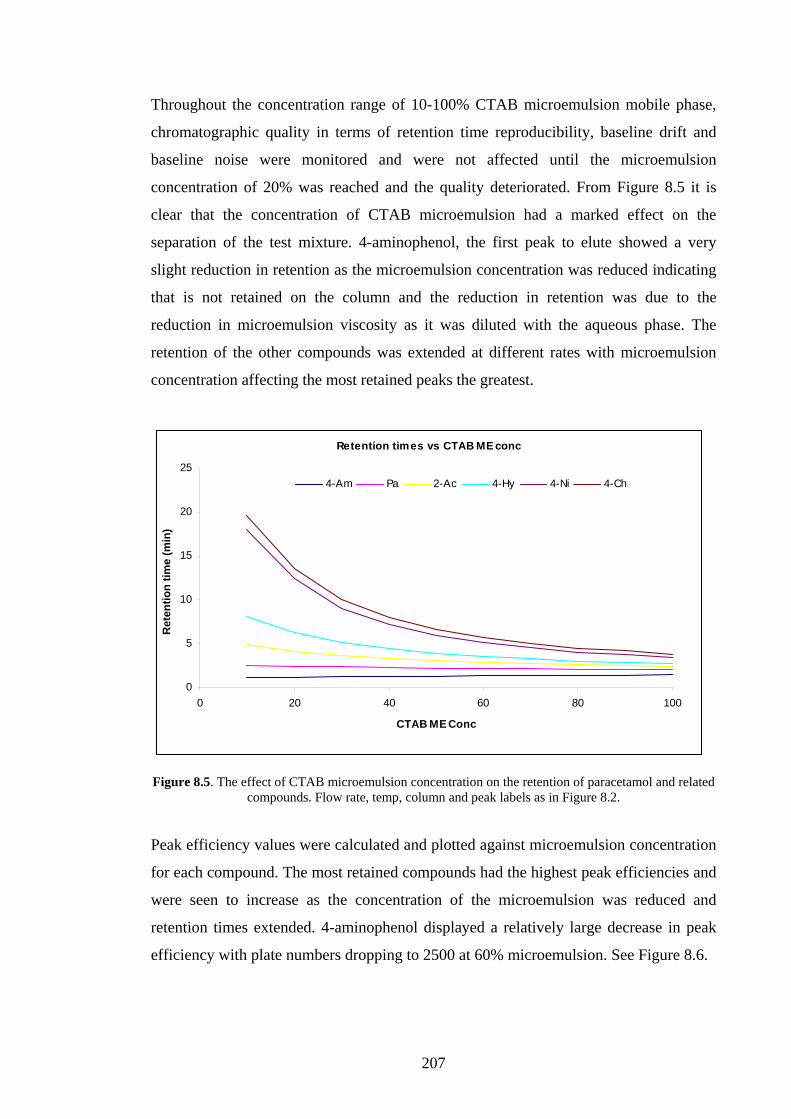
207
Throughout the concentration range of 10-100% CTAB microemulsion mobile phase,
chromatographic quality in terms of retention time reproducibility, baseline drift and
baseline noise were monitored and were not affected until the microemulsion
concentration of 20% was reached and the quality deteriorated. From Figure 8.5 it is
clear that the concentration of CTAB microemulsion had a marked effect on the
separation of the test mixture. 4-aminophenol, the first peak to elute showed a very
slight reduction in retention as the microemulsion concentration was reduced indicating
that is not retained on the column and the reduction in retention was due to the
reduction in microemulsion viscosity as it was diluted with the aqueous phase. The
retention of the other compounds was extended at different rates with microemulsion
concentration affecting the most retained peaks the greatest.
Figure 8.5. The effect of CTAB microemulsion concentration on the retention of paracetamol and related
compounds. Flow rate, temp, column and peak labels as in Figure 8.2. Peak efficiency values were calculated and plotted against microemulsion concentration
for each compound. The most retained compounds had the highest peak efficiencies and
were seen to increase as the concentration of the microemulsion was reduced and
retention times extended. 4-aminophenol displayed a relatively large decrease in peak
efficiency with plate numbers dropping to 2500 at 60% microemulsion. See Figure 8.6.
Retention times vs CTAB ME conc
0
5
10
15
20
25
0 20 40 60 80 100
CTAB ME Conc
Ret
entio
n tim
e (m
in)
4-Am Pa 2-Ac 4-Hy 4-Ni 4-Ch
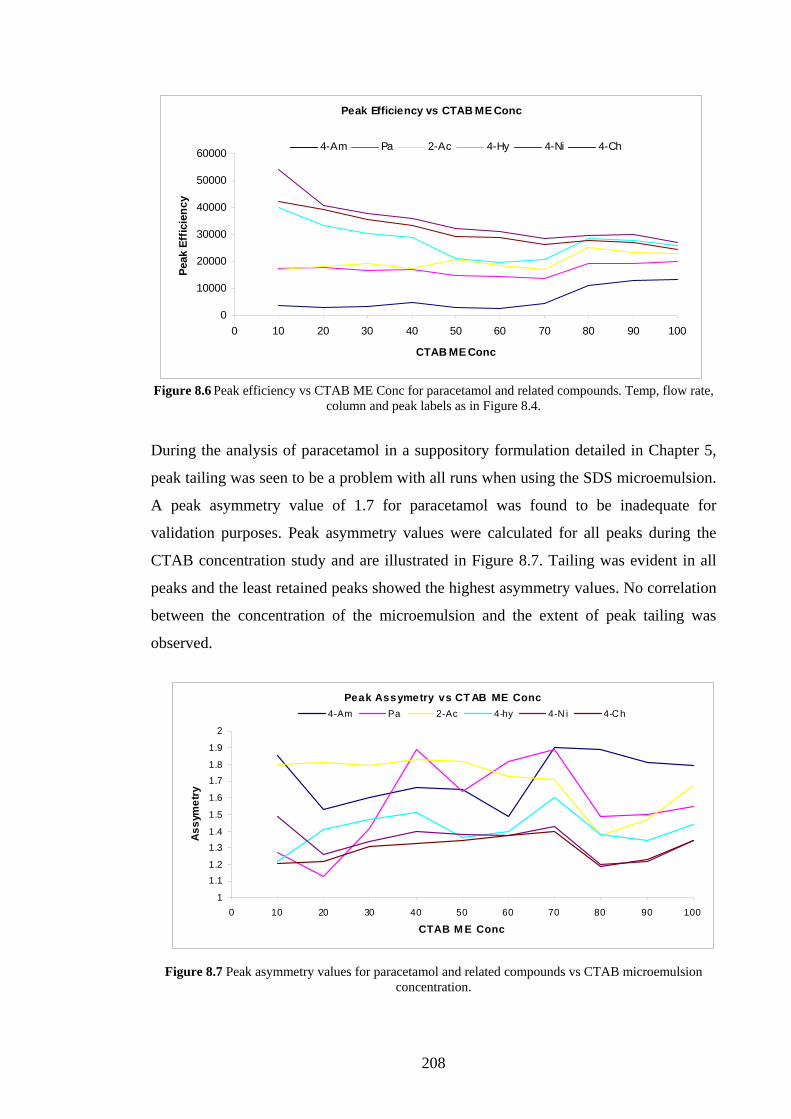
208
Figure 8.6 Peak efficiency vs CTAB ME Conc for paracetamol and related compounds. Temp, flow rate, column and peak labels as in Figure 8.4.
During the analysis of paracetamol in a suppository formulation detailed in Chapter 5,
peak tailing was seen to be a problem with all runs when using the SDS microemulsion.
A peak asymmetry value of 1.7 for paracetamol was found to be inadequate for
validation purposes. Peak asymmetry values were calculated for all peaks during the
CTAB concentration study and are illustrated in Figure 8.7. Tailing was evident in all
peaks and the least retained peaks showed the highest asymmetry values. No correlation
between the concentration of the microemulsion and the extent of peak tailing was
observed.
Figure 8.7 Peak asymmetry values for paracetamol and related compounds vs CTAB microemulsion
concentration.
Peak Efficiency vs CTAB ME Conc
0
10000
20000
30000
40000
50000
60000
0 10 20 30 40 50 60 70 80 90 100
CTAB ME Conc
Peak
Eff
icie
ncy
4-Am Pa 2-Ac 4-Hy 4-Ni 4-Ch
Peak Assymetry vs CT AB ME Conc
1
1.11.2
1.3
1.4
1.5
1.6
1.7
1.8
1.9
2
0 10 20 30 40 50 60 70 80 90 100
CTAB M E Conc
Ass
ymet
ry
4-Am Pa 2-Ac 4-hy 4-N i 4-Ch
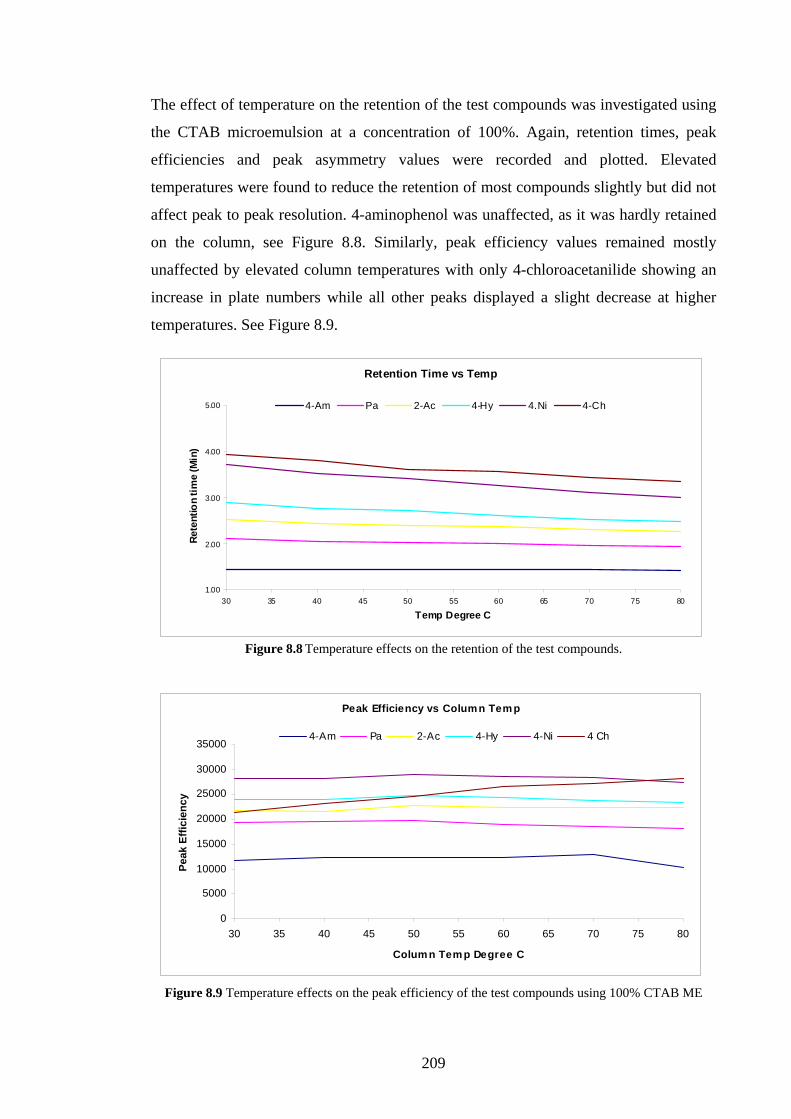
209
The effect of temperature on the retention of the test compounds was investigated using
the CTAB microemulsion at a concentration of 100%. Again, retention times, peak
efficiencies and peak asymmetry values were recorded and plotted. Elevated
temperatures were found to reduce the retention of most compounds slightly but did not
affect peak to peak resolution. 4-aminophenol was unaffected, as it was hardly retained
on the column, see Figure 8.8. Similarly, peak efficiency values remained mostly
unaffected by elevated column temperatures with only 4-chloroacetanilide showing an
increase in plate numbers while all other peaks displayed a slight decrease at higher
temperatures. See Figure 8.9.
Figure 8.8 Temperature effects on the retention of the test compounds.
Figure 8.9 Temperature effects on the peak efficiency of the test compounds using 100% CTAB ME
Retention Time vs Temp
1.00
2.00
3.00
4.00
5.00
30 35 40 45 50 55 60 65 70 75 80
Temp Degree C
Rete
ntio
n tim
e (M
in)
4-Am Pa 2-Ac 4-Hy 4.Ni 4-Ch
Peak Efficiency vs Column Tem p
0
5000
10000
15000
20000
25000
30000
35000
30 35 40 45 50 55 60 65 70 75 80
Colum n Tem p Degree C
Peak
Effi
cien
cy
4-Am Pa 2-Ac 4-Hy 4-Ni 4 Ch

210
Peak tailing for all compounds was increased at higher temperatures with early eluting
peaks showing more pronounced tailing than those which were more retained. Peak
asymmetry of less than 1.2 was not achieved except for 4-nitrophenol at 30º C. See
Figure 8.10.
Figure 8.10 Temperature effects on the peak tailing of the test compounds using 100% CTAB ME. Flow rate, column and peak labels as in Figure 8.2.
Some of the causes and remedies for peak tailing in reversed phase HPLC using
aqueous/organic mobile phases are listed in Table 8.3. A number of these causes were
investigated using the CTAB MELC microemulsion at 100% concentration and are
summarised below.
Table 8.3 Causes of peak tailing in traditional RP HPLC and actions taken to reduce MELC tailing.
Cause Remedy Action taken for MELC Sample solvent stronger than the mobile phase
Dissolve sample in mobile phase or diluted mobile phase
Samples were dissolved in the ME mobile phase
Sample mass overload Reduce amount of sample injected Low concentrations and injection volumes used
Silanol interaction with amines -Reduce mobile phase pH to < 3.0 - Increase mobile phase ionic strength. 25mM to 50mM recommended -Add a competing amine to the mobile phase. 10 mM TEA is usually sufficient.
pH of ME was <3
-- 0.1 to 0.6% TEA added
Peak Assymetry vs Column Temp
1
1.1
1.2
1.3
1.4
1.5
1.6
1.7
1.8
1.9
2
30 35 40 45 50 55 60 65 70 75 80
Column Temp Degree C
Peak
Ass
ymet
ry
4-Am Pa 2-Ac 4-Hy 4-Ni 4-Ch
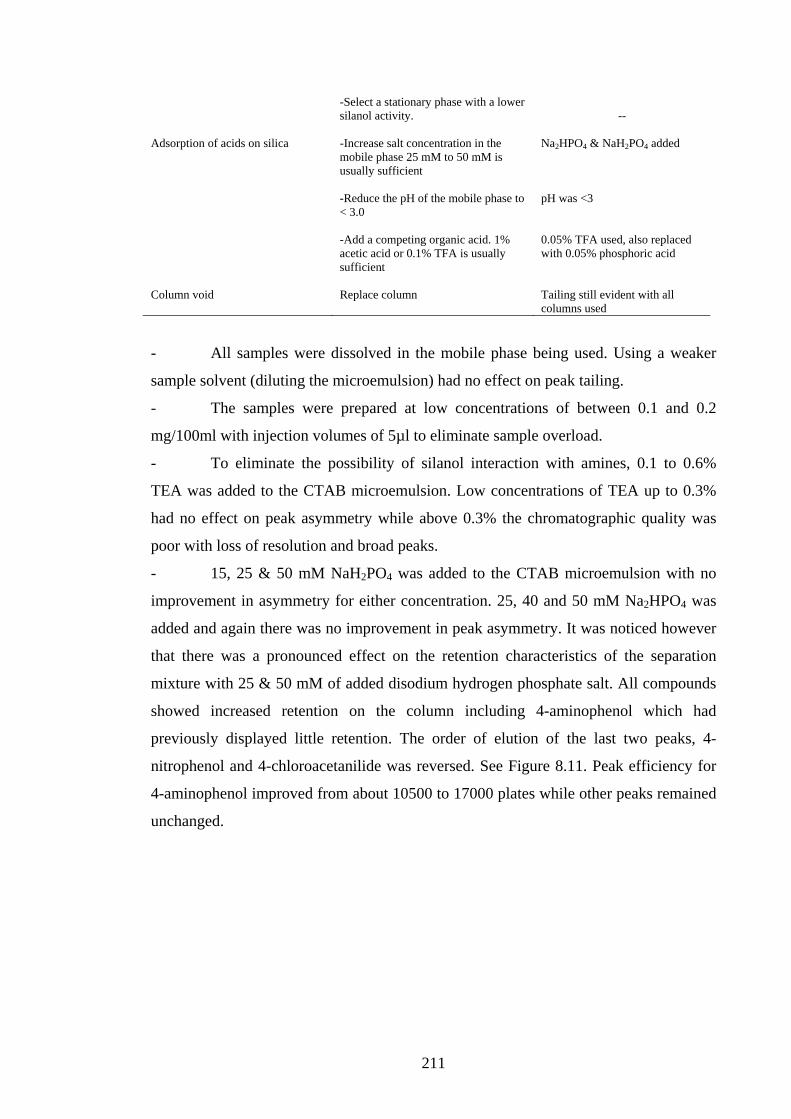
211
-Select a stationary phase with a lower silanol activity.
--
Adsorption of acids on silica -Increase salt concentration in the mobile phase 25 mM to 50 mM is usually sufficient -Reduce the pH of the mobile phase to < 3.0 -Add a competing organic acid. 1% acetic acid or 0.1% TFA is usually sufficient
Na2HPO4 & NaH2PO4 added pH was <3 0.05% TFA used, also replaced with 0.05% phosphoric acid
Column void Replace column Tailing still evident with all columns used
- All samples were dissolved in the mobile phase being used. Using a weaker
sample solvent (diluting the microemulsion) had no effect on peak tailing.
- The samples were prepared at low concentrations of between 0.1 and 0.2
mg/100ml with injection volumes of 5µl to eliminate sample overload.
- To eliminate the possibility of silanol interaction with amines, 0.1 to 0.6%
TEA was added to the CTAB microemulsion. Low concentrations of TEA up to 0.3%
had no effect on peak asymmetry while above 0.3% the chromatographic quality was
poor with loss of resolution and broad peaks.
- 15, 25 & 50 mM NaH2PO4 was added to the CTAB microemulsion with no
improvement in asymmetry for either concentration. 25, 40 and 50 mM Na2HPO4 was
added and again there was no improvement in peak asymmetry. It was noticed however
that there was a pronounced effect on the retention characteristics of the separation
mixture with 25 & 50 mM of added disodium hydrogen phosphate salt. All compounds
showed increased retention on the column including 4-aminophenol which had
previously displayed little retention. The order of elution of the last two peaks, 4-
nitrophenol and 4-chloroacetanilide was reversed. See Figure 8.11. Peak efficiency for
4-aminophenol improved from about 10500 to 17000 plates while other peaks remained
unchanged.
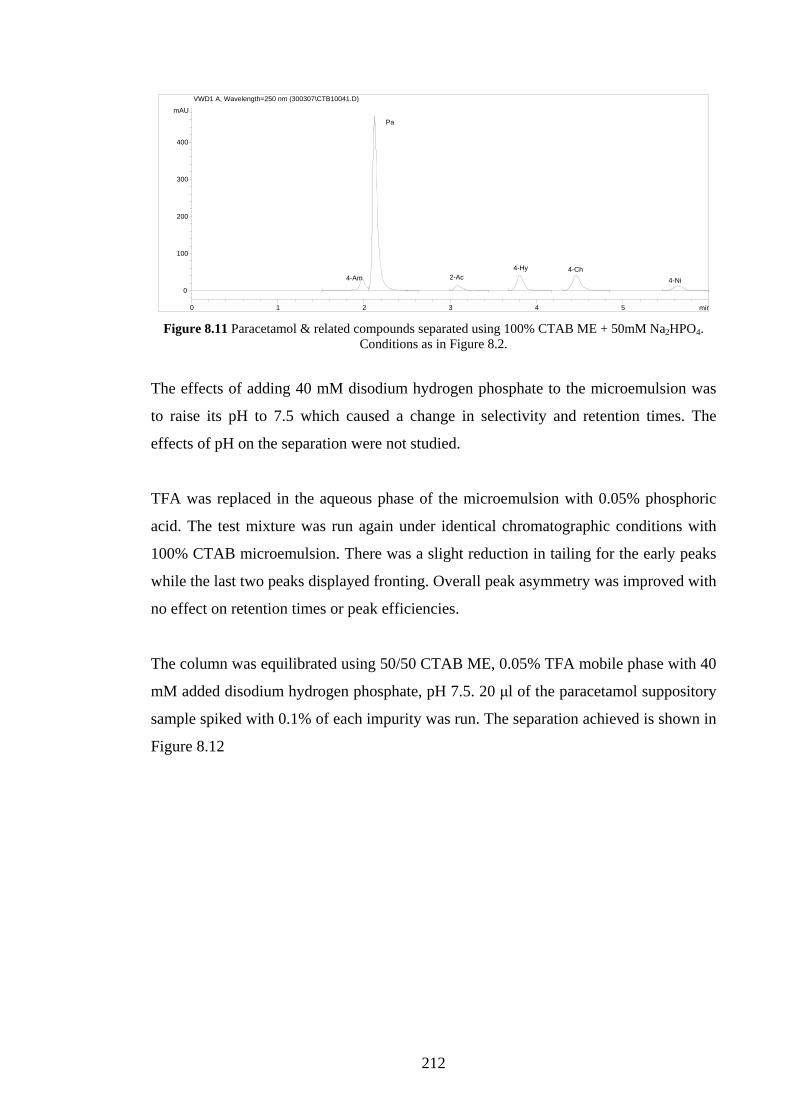
212
min0 1 2 3 4 5
mAU
0
100
200
300
400
VWD1 A, Wavelength=250 nm (300307\CTB10041.D)
4-Am
Pa
2-Ac4-Hy 4-Ch
4-Ni
Figure 8.11 Paracetamol & related compounds separated using 100% CTAB ME + 50mM Na2HPO4.
Conditions as in Figure 8.2.
The effects of adding 40 mM disodium hydrogen phosphate to the microemulsion was
to raise its pH to 7.5 which caused a change in selectivity and retention times. The
effects of pH on the separation were not studied.
TFA was replaced in the aqueous phase of the microemulsion with 0.05% phosphoric
acid. The test mixture was run again under identical chromatographic conditions with
100% CTAB microemulsion. There was a slight reduction in tailing for the early peaks
while the last two peaks displayed fronting. Overall peak asymmetry was improved with
no effect on retention times or peak efficiencies.
The column was equilibrated using 50/50 CTAB ME, 0.05% TFA mobile phase with 40
mM added disodium hydrogen phosphate, pH 7.5. 20 μl of the paracetamol suppository
sample spiked with 0.1% of each impurity was run. The separation achieved is shown in
Figure 8.12
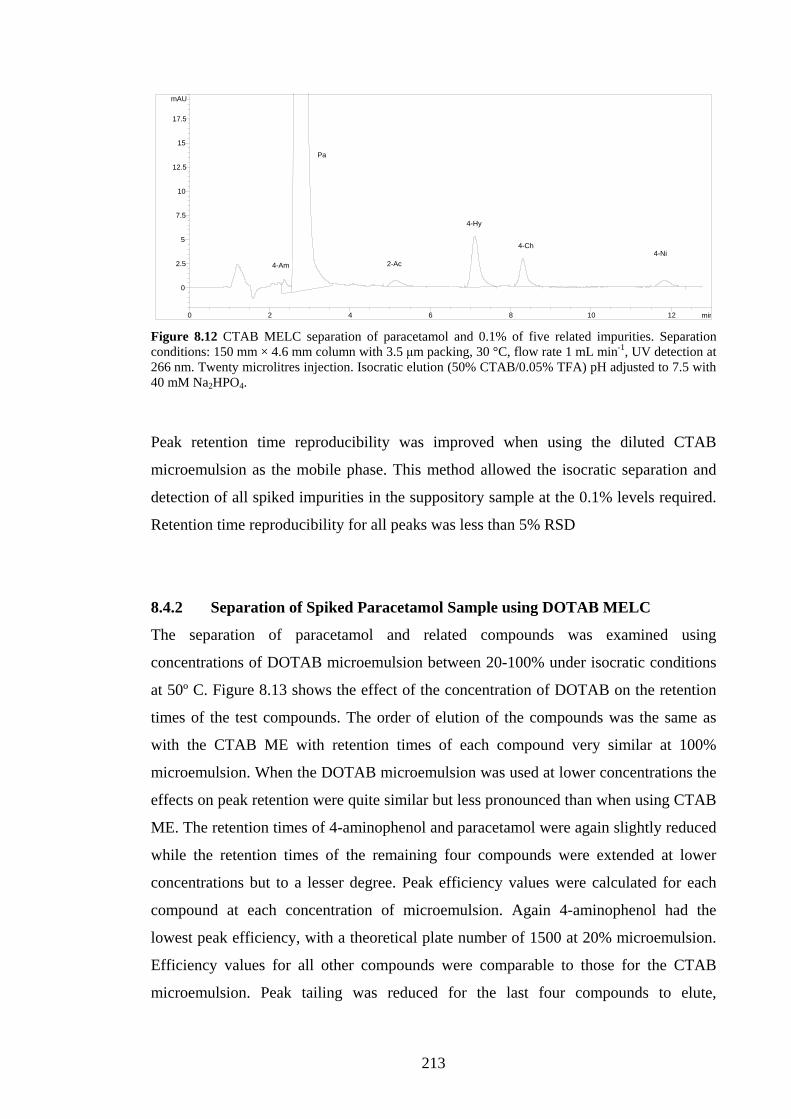
213
min0 2 4 6 8 10 12
mAU
0
2.5
5
7.5
10
12.5
15
17.5
4-Hy
4-Ch4-Ni
2-Ac
Pa
4-Am
Figure 8.12 CTAB MELC separation of paracetamol and 0.1% of five related impurities. Separation conditions: 150 mm × 4.6 mm column with 3.5 μm packing, 30 °C, flow rate 1 mL min-1, UV detection at 266 nm. Twenty microlitres injection. Isocratic elution (50% CTAB/0.05% TFA) pH adjusted to 7.5 with 40 mM Na2HPO4.
Peak retention time reproducibility was improved when using the diluted CTAB
microemulsion as the mobile phase. This method allowed the isocratic separation and
detection of all spiked impurities in the suppository sample at the 0.1% levels required.
Retention time reproducibility for all peaks was less than 5% RSD
8.4.2 Separation of Spiked Paracetamol Sample using DOTAB MELC
The separation of paracetamol and related compounds was examined using
concentrations of DOTAB microemulsion between 20-100% under isocratic conditions
at 50º C. Figure 8.13 shows the effect of the concentration of DOTAB on the retention
times of the test compounds. The order of elution of the compounds was the same as
with the CTAB ME with retention times of each compound very similar at 100%
microemulsion. When the DOTAB microemulsion was used at lower concentrations the
effects on peak retention were quite similar but less pronounced than when using CTAB
ME. The retention times of 4-aminophenol and paracetamol were again slightly reduced
while the retention times of the remaining four compounds were extended at lower
concentrations but to a lesser degree. Peak efficiency values were calculated for each
compound at each concentration of microemulsion. Again 4-aminophenol had the
lowest peak efficiency, with a theoretical plate number of 1500 at 20% microemulsion.
Efficiency values for all other compounds were comparable to those for the CTAB
microemulsion. Peak tailing was reduced for the last four compounds to elute,

214
compared to the CTAB microemulsion particularly when using lower concentrations of
microemulsion. Peak asymmetry values for 4-aminophenol and paracetamol remained
higher than 1.7 while values for the remaining peaks were below 1.2.
DOTAB ME conc vs Retention times
0
1
2
3
4
5
6
7
8
9
20 30 40 50 60 70 80 90 100
DOTAB ME Conc (%)
Ret
entio
n tim
e (m
in)
4-Am Pa 2-Ac 4-Hy 4-Ni 4-Ch
Figure 8.13 Retention of test compounds vs DOTAB ME concentration. Flow rate, temp, column and
peak labels as in Figure 8.2.
The DOTAB microemulsion became turbid and unstable at approximately 75% (Section
7.4.3, Figure 7.9). Chromatographic results for all isocratic separations down to 20%
microemulsion showed that as the microemulsion concentration in the mobile phase was
lowered retention time reproducibility worsened. Good separations were achieved with
microemulsion concentrations as low as 40%, see Figure 8.14, however
chromatographic reproducibility was not possible. This compares to the poor
separations achieved using the standard SDS microemulsion at various concentrations
with isocratic elution described in Section 7.3.1.2, which also became turbid at
approximately 75%. While both microemulsions appeared to break and become
emulsion systems and have some of the same physical characteristics, they displayed
quite different chromatographic results in terms of quality and retention times when
used at lower concentrations. Lower concentrations of the SDS microemulsion used
isocratically had little effect on peak retention times, see Figures 7.4 & 8.13.

215
min0 1 2 3 4 5 6 7 8 9
mAU
0
25
50
75
100
125
150
175
VWD1 A, Wavelength=250 nm (120407\DOTAB023.D)
4-Am
Pa
2-Ac 4-Hy4-Ni
4-Ch
Figure 8.14 Separation of paracetamol & related compounds using 40% DOTAB microemulsion.
Conditions as in Figure 8.2.
8.4.3 Separation of Spiked Paracetamol Sample using TTAB MELC
The TTAB microemulsion was used to investigate the separation of paracetamol and its
related compounds using isocratic elution between 20 & 100% at 50º C. Figure 8.15
shows the effect of microemulsion concentration on the retention of each compound.
TTAB ME Conc vs Retention time
0
1
2
3
4
5
6
7
8
9
20 30 40 50 60 70 80 90 100Conc (%)
4-Am Pa 2-Ac 4-Hy 4-Ni 4-Ch
Figure 8.15 TTAB microemulsion concentration vs retention times for the test compounds
The retention times of all compounds were almost identical to those obtained when
using the DOTAB microemulsion at all concentrations however the later eluting
compounds were retained slightly more. Peak efficiency and asymmetry values were
also similar to those obtained using the DOTAB microemulsion. Again the peak
efficiency of 4-aminophenol was poor with N dropping from 13000 for 100%
microemulsion to 2000 for 20% TTAB. Figure 8.16 shows the isocratic separation
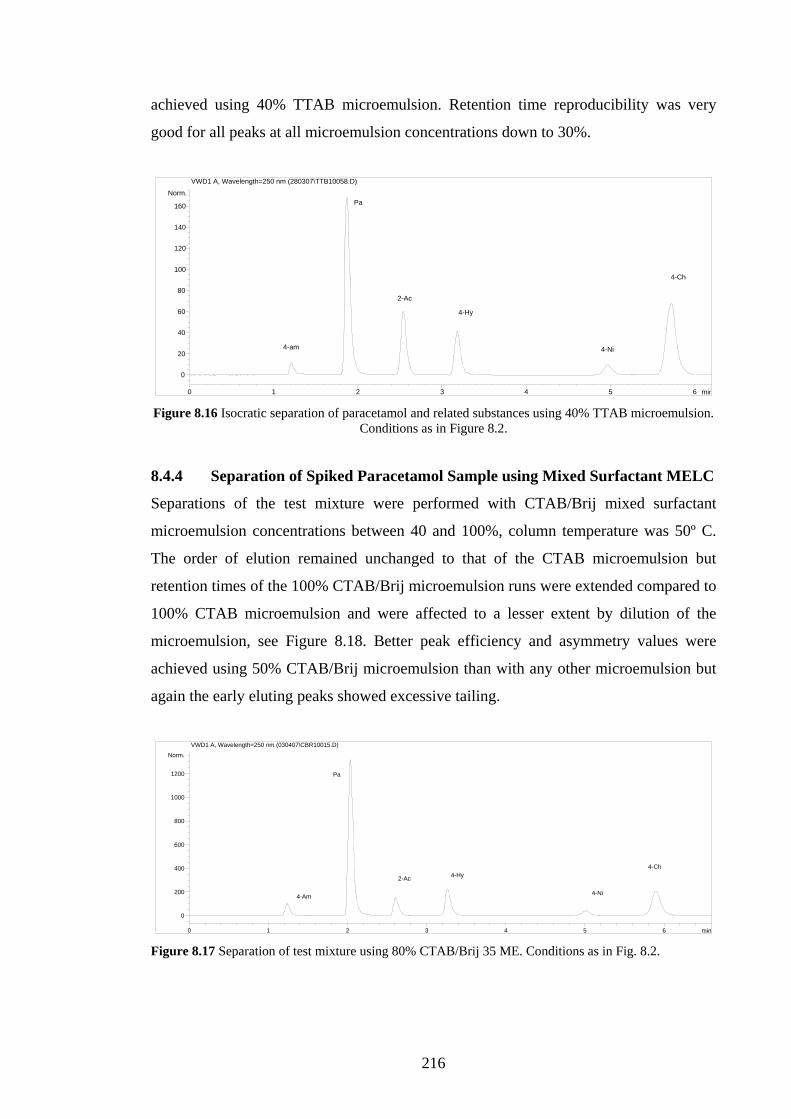
216
achieved using 40% TTAB microemulsion. Retention time reproducibility was very
good for all peaks at all microemulsion concentrations down to 30%.
min0 1 2 3 4 5 6
Norm.
0
20
40
60
80
100
120
140
160
VWD1 A, Wavelength=250 nm (280307\TTB10058.D)
4-am
Pa
2-Ac
4-Hy
4-Ni
4-Ch
Figure 8.16 Isocratic separation of paracetamol and related substances using 40% TTAB microemulsion.
Conditions as in Figure 8.2. 8.4.4 Separation of Spiked Paracetamol Sample using Mixed Surfactant MELC
Separations of the test mixture were performed with CTAB/Brij mixed surfactant
microemulsion concentrations between 40 and 100%, column temperature was 50º C.
The order of elution remained unchanged to that of the CTAB microemulsion but
retention times of the 100% CTAB/Brij microemulsion runs were extended compared to
100% CTAB microemulsion and were affected to a lesser extent by dilution of the
microemulsion, see Figure 8.18. Better peak efficiency and asymmetry values were
achieved using 50% CTAB/Brij microemulsion than with any other microemulsion but
again the early eluting peaks showed excessive tailing.
min0 1 2 3 4 5 6
Norm.
0
200
400
600
800
1000
1200
VWD1 A, Wavelength=250 nm (030407\CBR10015.D)
Pa
4-Am
2-Ac 4-Hy
4-Ni
4-Ch
Figure 8.17 Separation of test mixture using 80% CTAB/Brij 35 ME. Conditions as in Fig. 8.2.
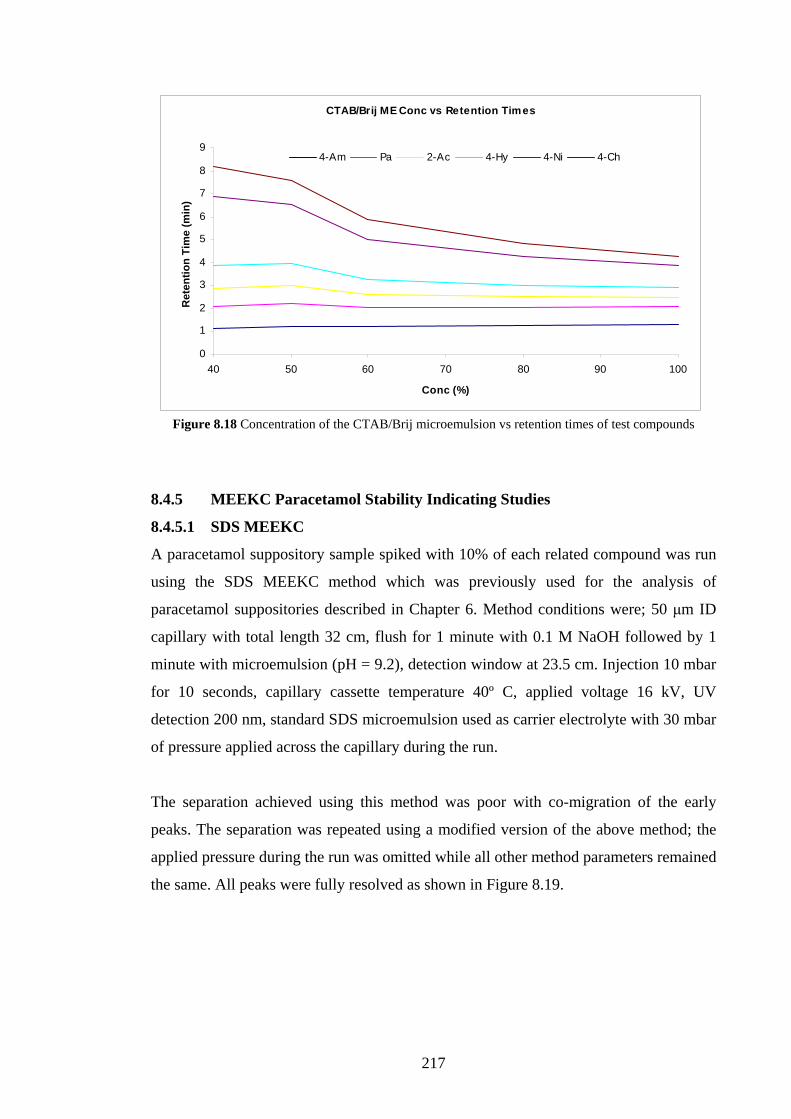
217
Figure 8.18 Concentration of the CTAB/Brij microemulsion vs retention times of test compounds
8.4.5 MEEKC Paracetamol Stability Indicating Studies
8.4.5.1 SDS MEEKC
A paracetamol suppository sample spiked with 10% of each related compound was run
using the SDS MEEKC method which was previously used for the analysis of
paracetamol suppositories described in Chapter 6. Method conditions were; 50 μm ID
capillary with total length 32 cm, flush for 1 minute with 0.1 M NaOH followed by 1
minute with microemulsion (pH = 9.2), detection window at 23.5 cm. Injection 10 mbar
for 10 seconds, capillary cassette temperature 40º C, applied voltage 16 kV, UV
detection 200 nm, standard SDS microemulsion used as carrier electrolyte with 30 mbar
of pressure applied across the capillary during the run.
The separation achieved using this method was poor with co-migration of the early
peaks. The separation was repeated using a modified version of the above method; the
applied pressure during the run was omitted while all other method parameters remained
the same. All peaks were fully resolved as shown in Figure 8.19.
CTAB/Brij ME Conc vs Retention Times
0
1
2
3
4
5
6
7
8
9
40 50 60 70 80 90 100
Conc (%)
Ret
entio
n Ti
me
(min
)
4-Am Pa 2-Ac 4-Hy 4-Ni 4-Ch
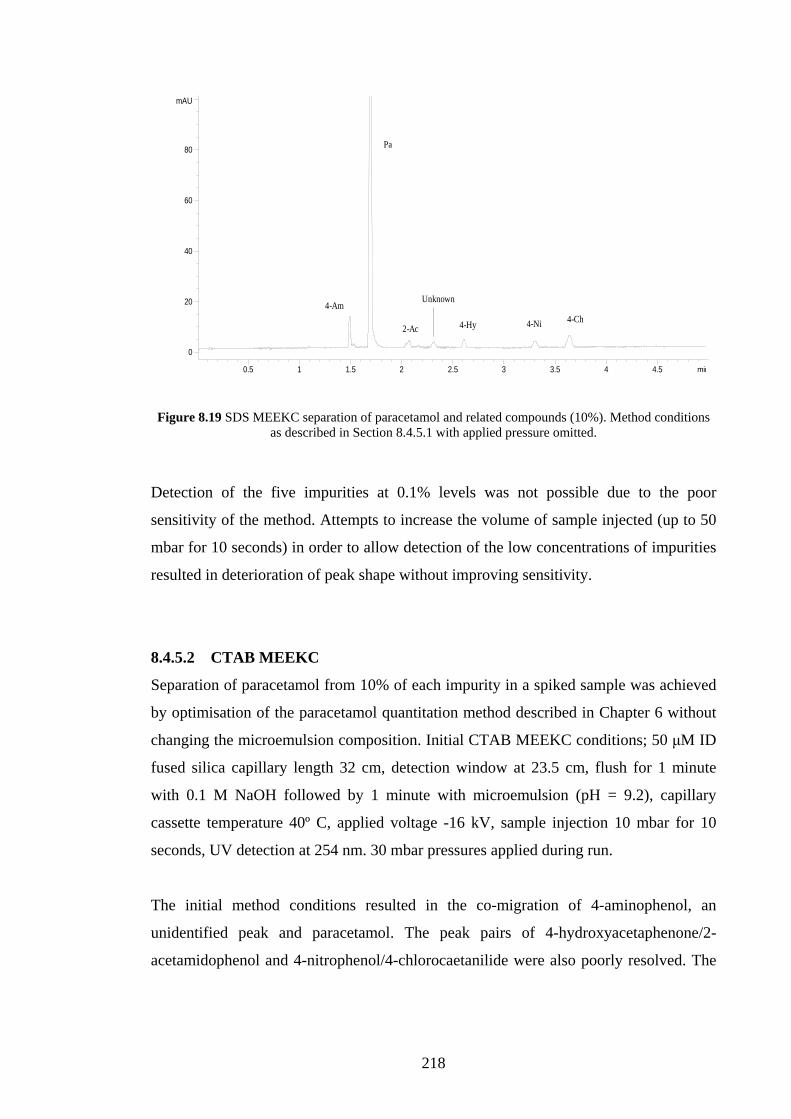
218
min0.5 1 1.5 2 2.5 3 3.5 4 4.5
mAU
0
20
40
60
80
4-Am
Pa
2-Ac
Unknown
4-Hy 4-Ni 4-Ch
Figure 8.19 SDS MEEKC separation of paracetamol and related compounds (10%). Method conditions
as described in Section 8.4.5.1 with applied pressure omitted. Detection of the five impurities at 0.1% levels was not possible due to the poor
sensitivity of the method. Attempts to increase the volume of sample injected (up to 50
mbar for 10 seconds) in order to allow detection of the low concentrations of impurities
resulted in deterioration of peak shape without improving sensitivity.
8.4.5.2 CTAB MEEKC
Separation of paracetamol from 10% of each impurity in a spiked sample was achieved
by optimisation of the paracetamol quantitation method described in Chapter 6 without
changing the microemulsion composition. Initial CTAB MEEKC conditions; 50 μM ID
fused silica capillary length 32 cm, detection window at 23.5 cm, flush for 1 minute
with 0.1 M NaOH followed by 1 minute with microemulsion (pH = 9.2), capillary
cassette temperature 40º C, applied voltage -16 kV, sample injection 10 mbar for 10
seconds, UV detection at 254 nm. 30 mbar pressures applied during run.
The initial method conditions resulted in the co-migration of 4-aminophenol, an
unidentified peak and paracetamol. The peak pairs of 4-hydroxyacetaphenone/2-
acetamidophenol and 4-nitrophenol/4-chlorocaetanilide were also poorly resolved. The
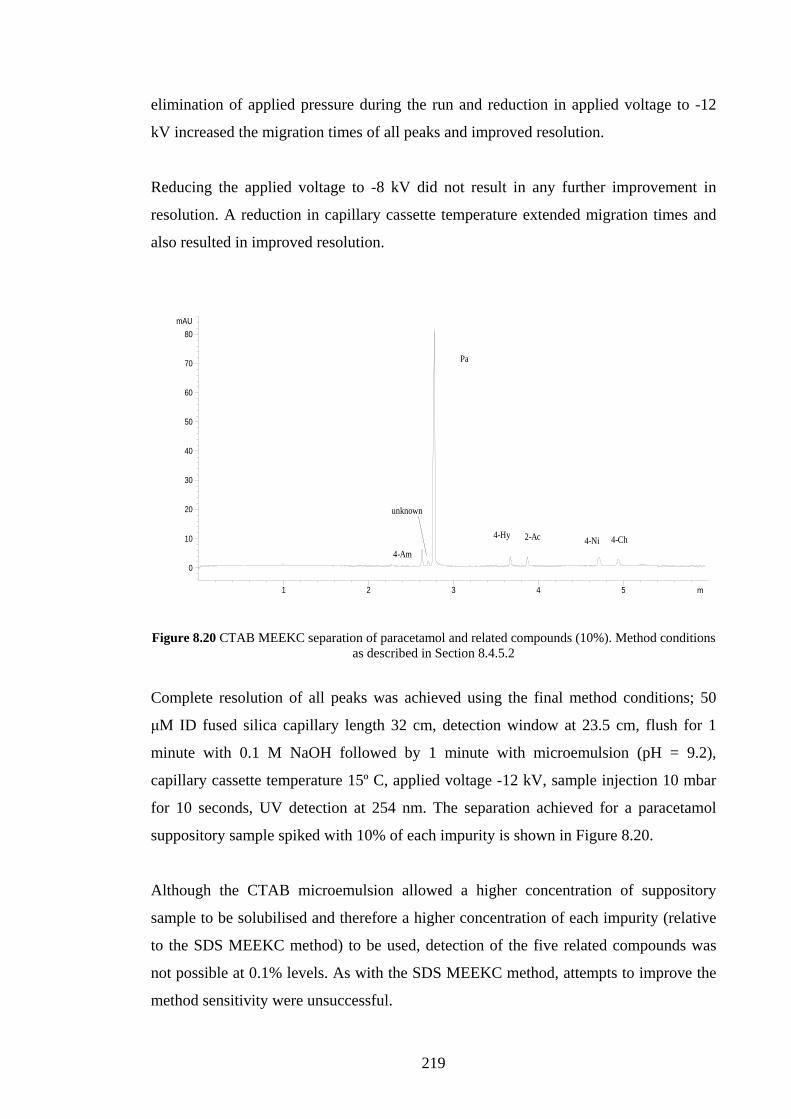
219
elimination of applied pressure during the run and reduction in applied voltage to -12
kV increased the migration times of all peaks and improved resolution.
Reducing the applied voltage to -8 kV did not result in any further improvement in
resolution. A reduction in capillary cassette temperature extended migration times and
also resulted in improved resolution.
m1 2 3 4 5
mAU
0
10
20
30
40
50
60
70
80
4-Ch4-Ni2-Ac4-Hy
Pa
unknown
4-Am
Figure 8.20 CTAB MEEKC separation of paracetamol and related compounds (10%). Method conditions
as described in Section 8.4.5.2
Complete resolution of all peaks was achieved using the final method conditions; 50
μM ID fused silica capillary length 32 cm, detection window at 23.5 cm, flush for 1
minute with 0.1 M NaOH followed by 1 minute with microemulsion (pH = 9.2),
capillary cassette temperature 15º C, applied voltage -12 kV, sample injection 10 mbar
for 10 seconds, UV detection at 254 nm. The separation achieved for a paracetamol
suppository sample spiked with 10% of each impurity is shown in Figure 8.20.
Although the CTAB microemulsion allowed a higher concentration of suppository
sample to be solubilised and therefore a higher concentration of each impurity (relative
to the SDS MEEKC method) to be used, detection of the five related compounds was
not possible at 0.1% levels. As with the SDS MEEKC method, attempts to improve the
method sensitivity were unsuccessful.
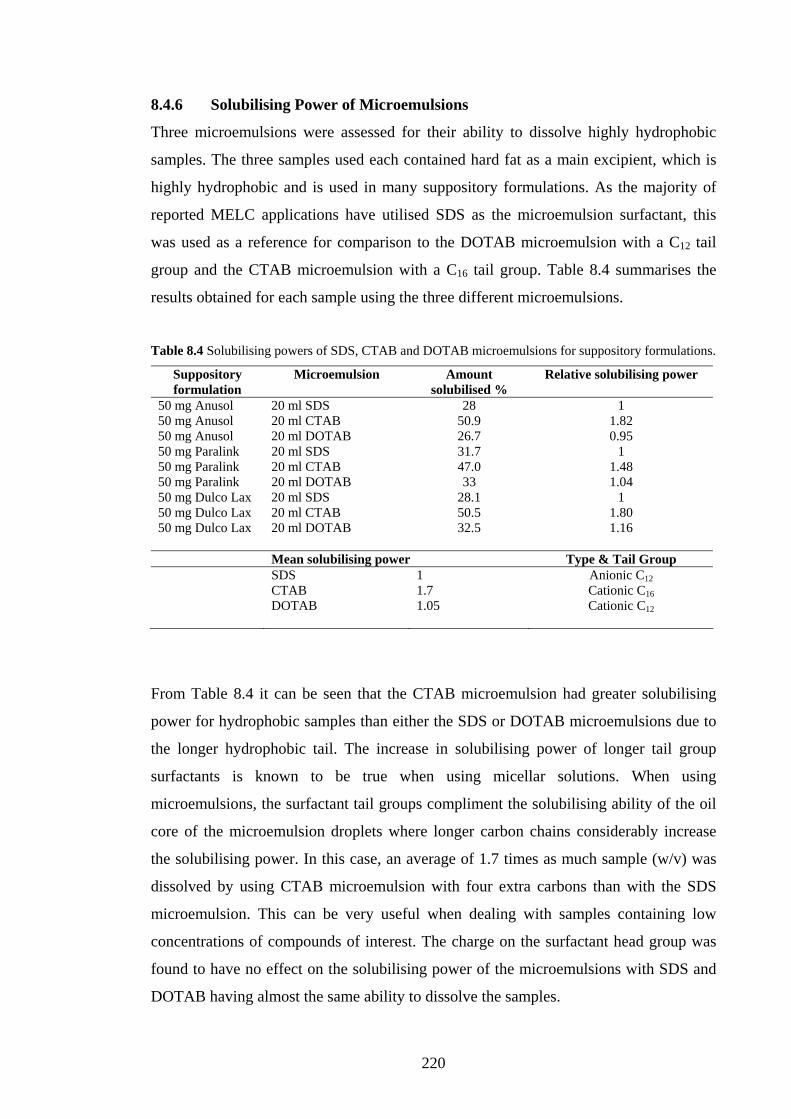
220
8.4.6 Solubilising Power of Microemulsions
Three microemulsions were assessed for their ability to dissolve highly hydrophobic
samples. The three samples used each contained hard fat as a main excipient, which is
highly hydrophobic and is used in many suppository formulations. As the majority of
reported MELC applications have utilised SDS as the microemulsion surfactant, this
was used as a reference for comparison to the DOTAB microemulsion with a C12 tail
group and the CTAB microemulsion with a C16 tail group. Table 8.4 summarises the
results obtained for each sample using the three different microemulsions.
Table 8.4 Solubilising powers of SDS, CTAB and DOTAB microemulsions for suppository formulations.
Suppository formulation
Microemulsion Amount solubilised %
Relative solubilising power
50 mg Anusol 20 ml SDS 28 1 50 mg Anusol 20 ml CTAB 50.9 1.82 50 mg Anusol 20 ml DOTAB 26.7 0.95 50 mg Paralink 20 ml SDS 31.7 1 50 mg Paralink 20 ml CTAB 47.0 1.48 50 mg Paralink 20 ml DOTAB 33 1.04 50 mg Dulco Lax 20 ml SDS 28.1 1 50 mg Dulco Lax 20 ml CTAB 50.5 1.80 50 mg Dulco Lax 20 ml DOTAB 32.5 1.16 Mean solubilising power Type & Tail Group SDS 1 Anionic C12 CTAB 1.7 Cationic C16 DOTAB 1.05 Cationic C12
From Table 8.4 it can be seen that the CTAB microemulsion had greater solubilising
power for hydrophobic samples than either the SDS or DOTAB microemulsions due to
the longer hydrophobic tail. The increase in solubilising power of longer tail group
surfactants is known to be true when using micellar solutions. When using
microemulsions, the surfactant tail groups compliment the solubilising ability of the oil
core of the microemulsion droplets where longer carbon chains considerably increase
the solubilising power. In this case, an average of 1.7 times as much sample (w/v) was
dissolved by using CTAB microemulsion with four extra carbons than with the SDS
microemulsion. This can be very useful when dealing with samples containing low
concentrations of compounds of interest. The charge on the surfactant head group was
found to have no effect on the solubilising power of the microemulsions with SDS and
DOTAB having almost the same ability to dissolve the samples.
221
8.5 Discussion
As described in Chapter 7, the reproducible separation of paracetamol and its related
impurities was not possible using the SDS microemulsion with either gradient or
isocratic MELC conditions. Subsequent investigations found that the SDS
microemulsion was unstable under gradient conditions. Similar investigations into the
stability of microemulsions prepared using cationic and mixed cationic/non-ionic
surfactants found that the stability of cationic microemulsions under gradient conditions
was related to the surfactant alkyl chain length.
The initial separations of the test mixture using all three neat cationic microemulsions
with isocratic elution resulted in improved separations compared to those achieved with
the SDS microemulsion and a different order of elution was achieved. The three cationic
microemulsions gave the same order of elution when the only difference between the
microemulsions was the surfactant alkyl tail length. This indicates that the change in
elution order was due to the positive charge on the surfactant head group. This was not
unexpected as the adsorbed surfactant layer on the column packing had the opposite
charge to the adsorbed SDS layer, altering the partitioning characteristics of charged
solutes.
As mentioned in the previous paragraph, the test mixture separations achieved using a
neat CTAB microemulsion resulted in better resolution for all peaks than the SDS
microemulsion however the last two peaks were not fully resolved. Gradient separations
using both 50 and 70% CTAB microemulsion as the starting mobile phase extended
retention times and improved the resolution of the last two peaks slightly. Although the
separation of the test mixture was improved, baseline drift and irreproducible retention
times between runs were still problematic. The use of diluted forms of the CTAB
microemulsion as the mobile phase under isocratic conditions was found to achieve
superior separations for the test mixture and eliminated the problems of baseline drift
and irreproducible retention times (Figures 8.3 & 8.4).
The investigations into microemulsion stability described in Chapter 7, found that the
CTAB microemulsion remained stable when subjected to gradient conditions. In
contrast, the SDS microemulsion was found to be very unstable under gradient
conditions. It was concluded that the poor stability of the SDS microemulsion was the
222
main factor contributing to the irreproducible separations achieved with gradient
elution. However, this did not explain why the gradient separations achieved using the
apparently stable CTAB microemulsion were also irreproducible. Using microemulsion
mobile phases in LC results in the adsorption of surfactant molecules onto the column
packing. Column equilibration required relatively large volumes of microemulsion to
flow through the column before equilibrium between the adsorbed surfactant layer and
the surfactant in the microemulsion was achieved. Using a gradient ramp was found to
disrupt this equilibrium and required careful and consistent re-equilibration between
runs. It was concluded that both microemulsion stability and column equilibration were
the major causes of poor reproducibility using gradient SDS MELC. Column
equilibration was found to be a key factor in achieving reproducible CTAB MELC
separations as the microemulsion was found to be stable.
The use of diluted forms of the CTAB microemulsion as the mobile phase with isocratic
separation conditions was found to eliminate the column equilibration problems
encountered with gradient separations. The stability of the CTAB microemulsion
enabled it to be diluted with its aqueous component and achieve improved separations
for the test mixture.
The most retained compounds were found to have the highest peak efficiency and a
reduction in the strength of the CTAB microemulsion mobile phase increased their
efficiencies. The efficiencies of the early eluting peaks were reduced as the strength of
the microemulsion was decreased. The isocratic use of diluted DOTAB and TTAB
microemulsions had the same effects on peak efficiency however chromatographic
reproducibility when using the DOTAB microemulsion was poor due to it being less
stable. Isocratic separations achieved using the more stable TTAB microemulsion at
lower concentrations were very reproducible and achieved full resolution of all test
compounds in less than six minutes.
The effects of temperature on the separations achieved using cationic microemulsions
have not been reported to date. When the CTAB microemulsion was studied at 100%
concentration with isocratic elution, temperature was found to have little effect on the
retention times of the test mixture while peak tailing for most peaks increased slightly at
elevated temperatures. The effects of temperature on peak efficiency were also minimal.
223
Peak tailing was evident for all MELC separations using both anionic and cationic
microemulsions. Most of the actions to reduce peak tailing outlined in Table 8.3
resulted in no appreciable improvement in peak asymmetry however the addition of
disodium hydrogen phosphate to the CTAB microemulsion resulted in a change in the
elution order of the test compounds. The addition of disodium hydrogen phosphate
caused an increase in the microemulsion pH from 2.9 to 7.5 and this change in pH was
the probable cause in the change in elution order. pH effects using cationic
microemulsions need to be studied further and should be included in future work.
MELC separation of paracetamol in a suppository sample spiked with 0.1% of each
related compound was possible using all three cationic microemulsions at lower
concentrations and with isocratic elution. However, chromatographic reproducibility
was found to be possible only with the CTAB and TTAB microemulsions while the
microemulsion formed with DOTAB was not stable when used at lower concentrations
as described in Section 7.4.3 resulting in poor reproducibility. The mixed CTAB/Brij 35
microemulsion was also capable of separating all peaks however retention time
reproducibility was again poor when lower microemulsion concentrations were used as
the mobile phase. This was related to the stability of the microemulsion described in
Section 7.4.5. Microemulsion stability when used in lower concentrations was found to
be essential for reproducible chromatographic performance with CTAB and TTAB
producing the most stable microemulsion resulting in better reproducibility. The
presence of Brij 35 in the mixed surfactant microemulsion resulted in a less stable
system and resulted in poor chromatographic performance when the microemulsion
mobile phase concentration was lowered.
The optimisation of the SDS and CTAB MEEKC paracetamol stability indicating
methods was found to be more straight forward and faster than the corresponding
MELC methods. The SDS MEEKC method was almost identical to that used in Chapter
6 for paracetamol suppository analysis and the absence of applied pressure across the
capillary during the runs allowed the rapid separation of all compounds. The maximum
amount possible of paracetamol suppository sample was dissolved in the SDS
microemulsion to increase the amount of each related compound present in the sample
at 0.1% levels. However, detection of such small amounts of analytes was not possible
due to the poor sensitivity of the method.

224
Similarly, the CTAB MEEKC method was optimised based on the method described in
Chapter 6 for paracetamol suppository analysis. No changes in the microemulsion
composition were necessary and separation of all peaks was achieved by changing
instrument parameters such as applied voltage and capillary cassette temperature. The
amount of sample solubilised by the CTAB microemulsion was much greater than that
solubilised by the SDS microemulsion, however the increased concentration of each
related compound in the test solution was insufficient to allow detection due to poor
method sensitivity caused by the short UV detection path length inherent to many CE
techniques. The detection wavelength of 200 nm was chosen for the SDS MEEKC
analysis as all compounds absorbed strongly at this wavelength. Detection at 200 nm
was not possible with the CTAB microemulsion due to its higher UV cut-off and
detection was performed at 254 nm which showed strong absorbance for all analytes.
Subsequent repeat analyses at the wavelength of maximum absorbance for each
compound could not detect peaks for any impurity at 0.1% levels.
The solubilising power of the microemulsions used in this study for highly hydrophobic
samples was found to depend mostly on the length of the surfactants alkyl chain and
less on the type and charge of the head group. The mean amount of sample solubilised
by microemulsions of anionic SDS and cationic DOTAB both with C12 alkyl groups
was almost identical. The microemulsion formed with cationic CTAB (C16) was found
to have much greater solubilising power, see Table 8.4. The greater stability of the
microemulsion as an LC mobile phase and its higher solubilising power for
hydrophobic substances are two advantages of the CTAB microemulsion compared to
the more commonly used SDS microemulsions. The higher UV cut-off of 225 nm for
the CTAB microemulsion compared to less than 200 nm for SDS microemulsion may
limit its use for some applications.
8.6 Conclusions
Isocratic MELC methods using cationic microemulsions have been shown to be suitable
for the determination of paracetamol and five of its related substances at 0.1% levels.
The isocratic methods utilised diluted forms of CTAB and TTAB microemulsions as an
alternative to using gradient elution where chromatographic reproducibility was poor.
The microemulsions formed using longer alkyl chain length surfactants were stable
when used in gradient mode. However, the changing natures of the adsorbed surfactant
225
layer and mobile phase surfactant concentration, due to gradient conditions meant that
consistent and lengthy re-equilibration was necessary between runs. The isocratic use of
weaker microemulsion mobile phases eliminated this problem and allowed rapid
separation of the test compounds at 0.1% levels.
MEEKC methods utilising both SDS and CTAB microemulsions were optimised to
rapidly separate the test mixture. Method optimisation was rapid and no changes to the
microemulsions previously used in Chapter 6 were necessary. Changes to the
instrument operating parameters were quick and convenient with no lengthy
equilibration required. Detection of paracetamol related compounds at 0.1% levels was
not possible with either method due to the poor method sensitivity. Lack of detection
sensitivity is a problem with many CE techniques which use UV detection. Using
alternative detection methods such as laser induced fluorescence detection or high
sensitivity UV flow cells may overcome this problem.
The length of the surfactant alkyl chain was found to be the main factor affecting
microemulsion solubilising power. Microemulsion solubilising power was found to be
greater for those with longer surfactant alkyl chains.
226
Chapter Nine
An Initial Assessment of Chiral Microemulsion
Components and a Chiral Column for
Enantioseparations using MELC.

227
9.1 Introduction
As described in Chapter 3, chiral HPLC separations using chiral mobile phase additives
with achiral columns have been reported widely in the literature. A number of different
chiral selectors have been utilised including cyclodextrins, macrocyclic antibiotics, ion-
pair additives and chiral ligand exchange mobile phases with limited research carried
out using protein additives.
The use of microemulsions as mobile phases for chiral separations with both chiral and
achiral columns has not yet been reported in the literature however there have been a
small number of reports of chiral micellar liquid chromatography (MLC) [1-6].
Chiral separations using MEEKC have been one of the most widely reported application
areas of this technique in recent years [7]. The unique composition and properties of
microemulsions makes it possible for a number of different chiral selectors to be used as
both key microemulsion components (surfactant, oil, co-surfactant) and microemulsion
additives (cyclodextrins). Chiral MEEKC and the use of chiral microemulsions have
been reviewed in Chapter 2.
9.2 Experimental Aims
The overall aim of this section was to examine the effects of using chiral
microemulsions and a chiral column on the MELC chromatographic performance of a
range of chiral pharmaceutical compounds. The three main aims of this experimental
section were;
a) To assess the effects of using chiral microemulsion components and an achiral
column for the separation of a range of chiral pharmaceutical compounds. Cationic and
anionic microemulsions were prepared using a chiral oil, a chiral surfactant and β-
cyclodextrin as a chiral additive. Five chiral pharmaceutical compounds were obtained
and chiral chromatographic performance was to be assessed.
b) To examine the chromatographic effects of each chiral microemulsion
component on the achiral performance of each test compound.
c) The effects of using a standard achiral microemulsion on a chiral β-cyclodextrin
column were to be examined using the five test compounds.

228
9.3 Materials and Methods
9.3.1 Chemicals
Table 9.1. Chemicals used and suppliers
Name Supplier
Sodium dodecyl sulphate (SDS) CMC ~ 8.3 mM Lennox (Dublin, Irl)
Cetyltrimethylammonium bromide (CTAB) CMC ~ 0.9 mM Lennox (Dublin, Irl)
Butan-1-ol Lennox (Dublin, Irl)
n-Octane Lennox (Dublin, Irl)
Trifluoroacetic acid Lennox (Dublin, Irl)
HPLC grade water Lennox (Dublin, Irl)
1-octanol Sigma-Aldrich (Irl)
HPLC grade methanol Lennox (Dublin, Irl)
β-Cyclodextrin M.W. 1134.9 Lennox (Dublin, Irl)
(R)-(-)-2-octanol
CH3(CH2)4CH2
HHO
CH3
M.W. 130.2
Sigma-Aldrich (Irl)
Sodium cholate
OH
OHHO
COO- Na+
M.W. 430.6
CMC ~ 9.5 mM
Lennox (Dublin, Irl)
Ibuprofen racemate
OHO
M.W.
pKa :
logP :
Water solubility :
Sigma-Aldrich (Irl)
206.3
4.91 [8]
3.97 [8]
21 mg/L [8]

229
Ketoprofen racemate
O
COOH
CH3
M.W.
pKa :
logP :
Water solubility
Sigma-Aldrich (Irl)
254.28
4.45 [8]
3.12 [8]
51 mg/L [8]
Baclofen racemate
Cl
H2N
O
OH
M.W.
pKa1 :
pKa2
logP :
Water solubility :
IVAX (Waterford, Irl)
213.66
3.87 [9]
9.62 [9]
-0.96 [8]
2090 mg/L [8]
Atenolol racemate
NH2
OO
OH
NH
M.W.
pKa:
logP:
Water solubility :
IVAX (Waterford, Irl)
266.3
9.6 [8]
0.16 [8]
26.5 mg/mL [8]
Procylcidine hydrochloride racemate
OH
NH
Cl
M.W.
pKa:
logP:
Water solubility :
IVAX (Waterford, Irl)
323.9
10.7
4.78 [8]
8.59 mg/L [8]
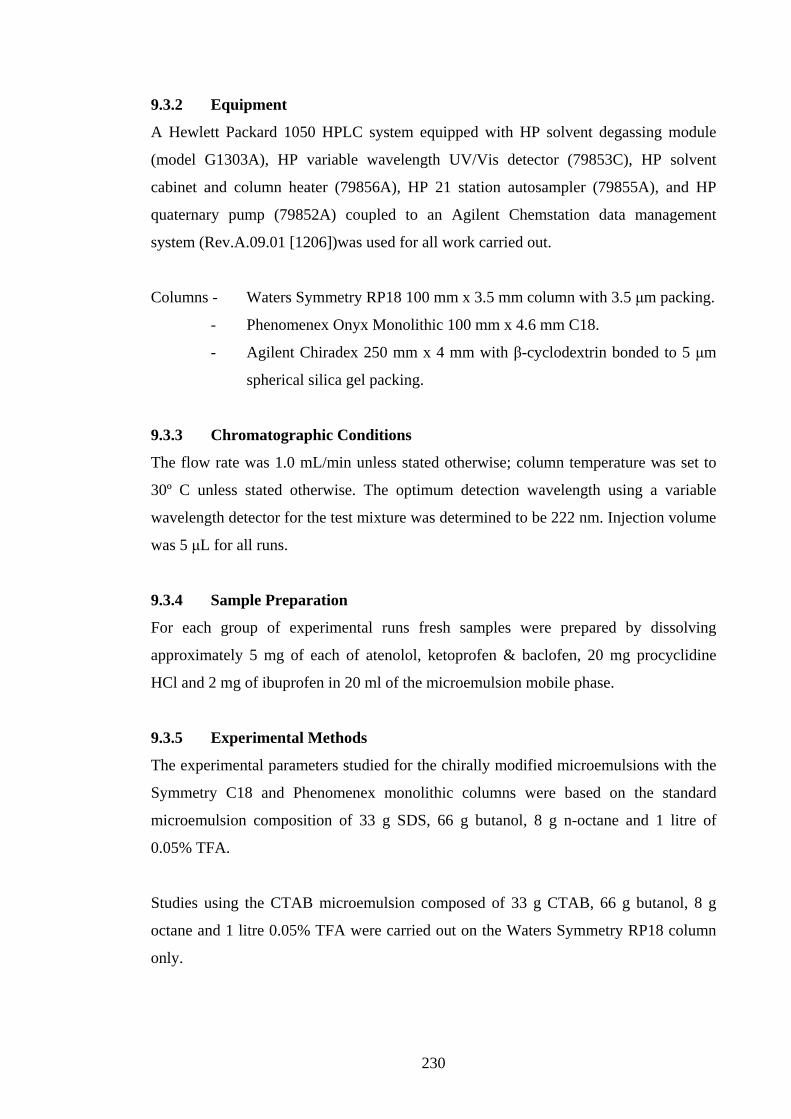
230
9.3.2 Equipment
A Hewlett Packard 1050 HPLC system equipped with HP solvent degassing module
(model G1303A), HP variable wavelength UV/Vis detector (79853C), HP solvent
cabinet and column heater (79856A), HP 21 station autosampler (79855A), and HP
quaternary pump (79852A) coupled to an Agilent Chemstation data management
system (Rev.A.09.01 [1206])was used for all work carried out.
Columns - Waters Symmetry RP18 100 mm x 3.5 mm column with 3.5 μm packing.
- Phenomenex Onyx Monolithic 100 mm x 4.6 mm C18.
- Agilent Chiradex 250 mm x 4 mm with β-cyclodextrin bonded to 5 μm
spherical silica gel packing.
9.3.3 Chromatographic Conditions
The flow rate was 1.0 mL/min unless stated otherwise; column temperature was set to
30º C unless stated otherwise. The optimum detection wavelength using a variable
wavelength detector for the test mixture was determined to be 222 nm. Injection volume
was 5 μL for all runs.
9.3.4 Sample Preparation
For each group of experimental runs fresh samples were prepared by dissolving
approximately 5 mg of each of atenolol, ketoprofen & baclofen, 20 mg procyclidine
HCl and 2 mg of ibuprofen in 20 ml of the microemulsion mobile phase.
9.3.5 Experimental Methods
The experimental parameters studied for the chirally modified microemulsions with the
Symmetry C18 and Phenomenex monolithic columns were based on the standard
microemulsion composition of 33 g SDS, 66 g butanol, 8 g n-octane and 1 litre of
0.05% TFA.
Studies using the CTAB microemulsion composed of 33 g CTAB, 66 g butanol, 8 g
octane and 1 litre 0.05% TFA were carried out on the Waters Symmetry RP18 column
only.
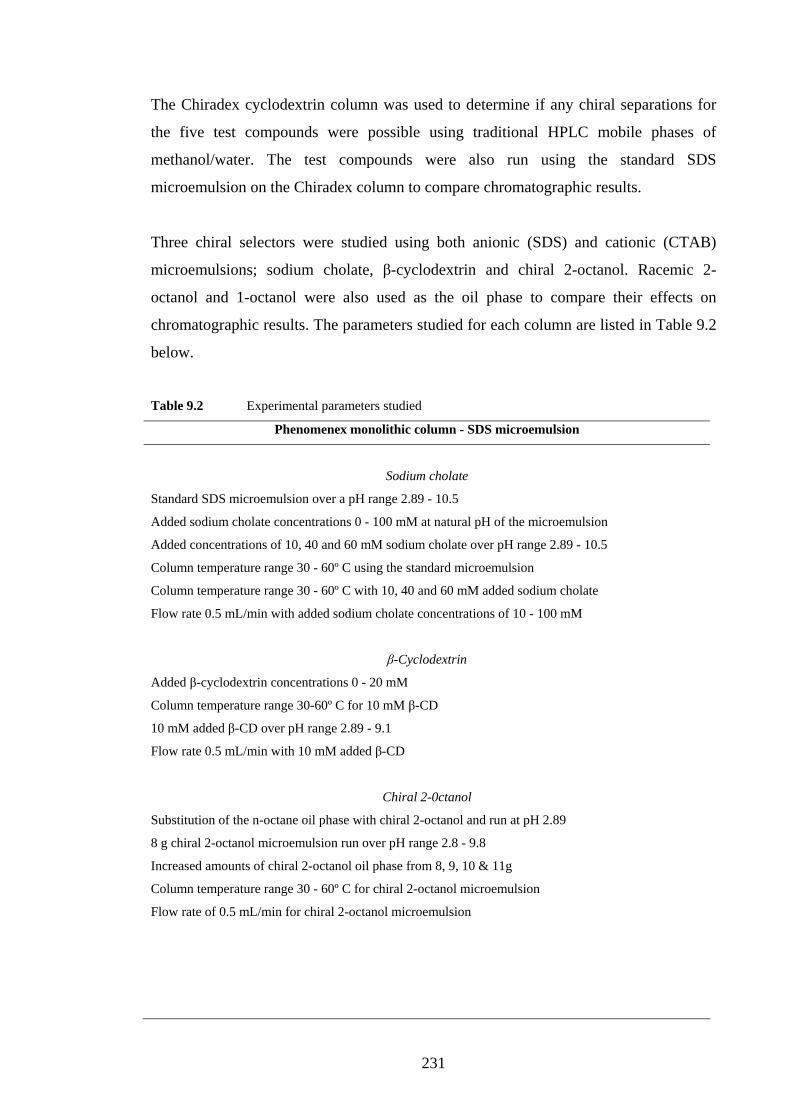
231
The Chiradex cyclodextrin column was used to determine if any chiral separations for
the five test compounds were possible using traditional HPLC mobile phases of
methanol/water. The test compounds were also run using the standard SDS
microemulsion on the Chiradex column to compare chromatographic results.
Three chiral selectors were studied using both anionic (SDS) and cationic (CTAB)
microemulsions; sodium cholate, β-cyclodextrin and chiral 2-octanol. Racemic 2-
octanol and 1-octanol were also used as the oil phase to compare their effects on
chromatographic results. The parameters studied for each column are listed in Table 9.2
below.
Table 9.2 Experimental parameters studied
Phenomenex monolithic column - SDS microemulsion
Sodium cholate
Standard SDS microemulsion over a pH range 2.89 - 10.5
Added sodium cholate concentrations 0 - 100 mM at natural pH of the microemulsion
Added concentrations of 10, 40 and 60 mM sodium cholate over pH range 2.89 - 10.5
Column temperature range 30 - 60º C using the standard microemulsion
Column temperature range 30 - 60º C with 10, 40 and 60 mM added sodium cholate
Flow rate 0.5 mL/min with added sodium cholate concentrations of 10 - 100 mM
β-Cyclodextrin
Added β-cyclodextrin concentrations 0 - 20 mM
Column temperature range 30-60º C for 10 mM β-CD
10 mM added β-CD over pH range 2.89 - 9.1
Flow rate 0.5 mL/min with 10 mM added β-CD
Chiral 2-0ctanol
Substitution of the n-octane oil phase with chiral 2-octanol and run at pH 2.89
8 g chiral 2-octanol microemulsion run over pH range 2.8 - 9.8
Increased amounts of chiral 2-octanol oil phase from 8, 9, 10 & 11g
Column temperature range 30 - 60º C for chiral 2-octanol microemulsion
Flow rate of 0.5 mL/min for chiral 2-octanol microemulsion
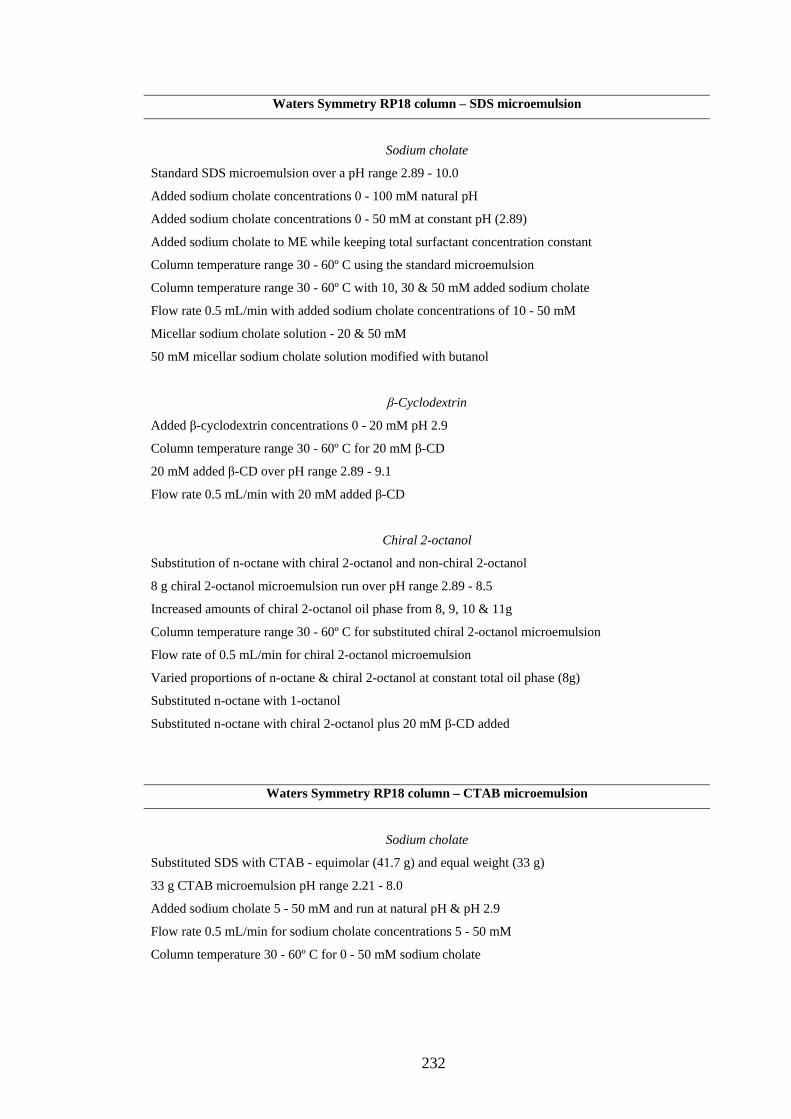
232
Waters Symmetry RP18 column – SDS microemulsion
Sodium cholate
Standard SDS microemulsion over a pH range 2.89 - 10.0
Added sodium cholate concentrations 0 - 100 mM natural pH
Added sodium cholate concentrations 0 - 50 mM at constant pH (2.89)
Added sodium cholate to ME while keeping total surfactant concentration constant
Column temperature range 30 - 60º C using the standard microemulsion
Column temperature range 30 - 60º C with 10, 30 & 50 mM added sodium cholate
Flow rate 0.5 mL/min with added sodium cholate concentrations of 10 - 50 mM
Micellar sodium cholate solution - 20 & 50 mM
50 mM micellar sodium cholate solution modified with butanol
β-Cyclodextrin
Added β-cyclodextrin concentrations 0 - 20 mM pH 2.9
Column temperature range 30 - 60º C for 20 mM β-CD
20 mM added β-CD over pH range 2.89 - 9.1
Flow rate 0.5 mL/min with 20 mM added β-CD
Chiral 2-octanol
Substitution of n-octane with chiral 2-octanol and non-chiral 2-octanol
8 g chiral 2-octanol microemulsion run over pH range 2.89 - 8.5
Increased amounts of chiral 2-octanol oil phase from 8, 9, 10 & 11g
Column temperature range 30 - 60º C for substituted chiral 2-octanol microemulsion
Flow rate of 0.5 mL/min for chiral 2-octanol microemulsion
Varied proportions of n-octane & chiral 2-octanol at constant total oil phase (8g)
Substituted n-octane with 1-octanol
Substituted n-octane with chiral 2-octanol plus 20 mM β-CD added
Waters Symmetry RP18 column – CTAB microemulsion
Sodium cholate
Substituted SDS with CTAB - equimolar (41.7 g) and equal weight (33 g)
33 g CTAB microemulsion pH range 2.21 - 8.0
Added sodium cholate 5 - 50 mM and run at natural pH & pH 2.9
Flow rate 0.5 mL/min for sodium cholate concentrations 5 - 50 mM
Column temperature 30 - 60º C for 0 - 50 mM sodium cholate
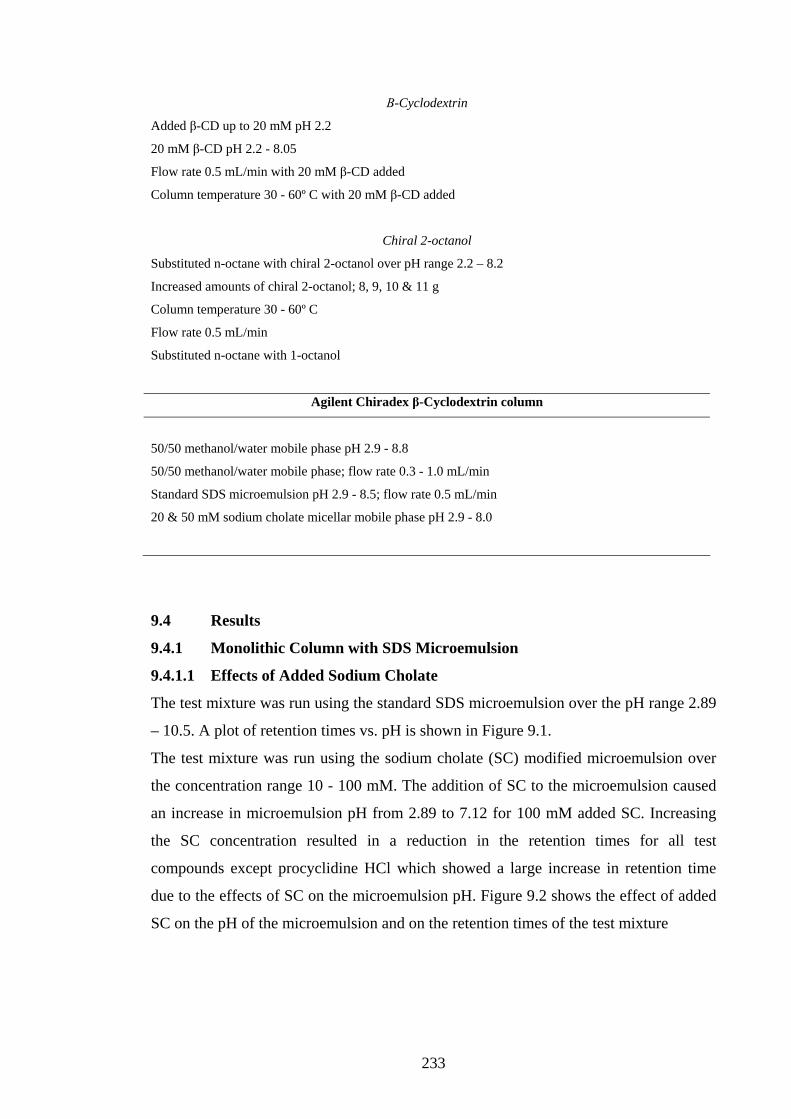
233
Β-Cyclodextrin
Added β-CD up to 20 mM pH 2.2
20 mM β-CD pH 2.2 - 8.05
Flow rate 0.5 mL/min with 20 mM β-CD added
Column temperature 30 - 60º C with 20 mM β-CD added
Chiral 2-octanol
Substituted n-octane with chiral 2-octanol over pH range 2.2 – 8.2
Increased amounts of chiral 2-octanol; 8, 9, 10 & 11 g
Column temperature 30 - 60º C
Flow rate 0.5 mL/min
Substituted n-octane with 1-octanol
Agilent Chiradex β-Cyclodextrin column
50/50 methanol/water mobile phase pH 2.9 - 8.8
50/50 methanol/water mobile phase; flow rate 0.3 - 1.0 mL/min
Standard SDS microemulsion pH 2.9 - 8.5; flow rate 0.5 mL/min
20 & 50 mM sodium cholate micellar mobile phase pH 2.9 - 8.0
9.4 Results
9.4.1 Monolithic Column with SDS Microemulsion
9.4.1.1 Effects of Added Sodium Cholate
The test mixture was run using the standard SDS microemulsion over the pH range 2.89
– 10.5. A plot of retention times vs. pH is shown in Figure 9.1.
The test mixture was run using the sodium cholate (SC) modified microemulsion over
the concentration range 10 - 100 mM. The addition of SC to the microemulsion caused
an increase in microemulsion pH from 2.89 to 7.12 for 100 mM added SC. Increasing
the SC concentration resulted in a reduction in the retention times for all test
compounds except procyclidine HCl which showed a large increase in retention time
due to the effects of SC on the microemulsion pH. Figure 9.2 shows the effect of added
SC on the pH of the microemulsion and on the retention times of the test mixture
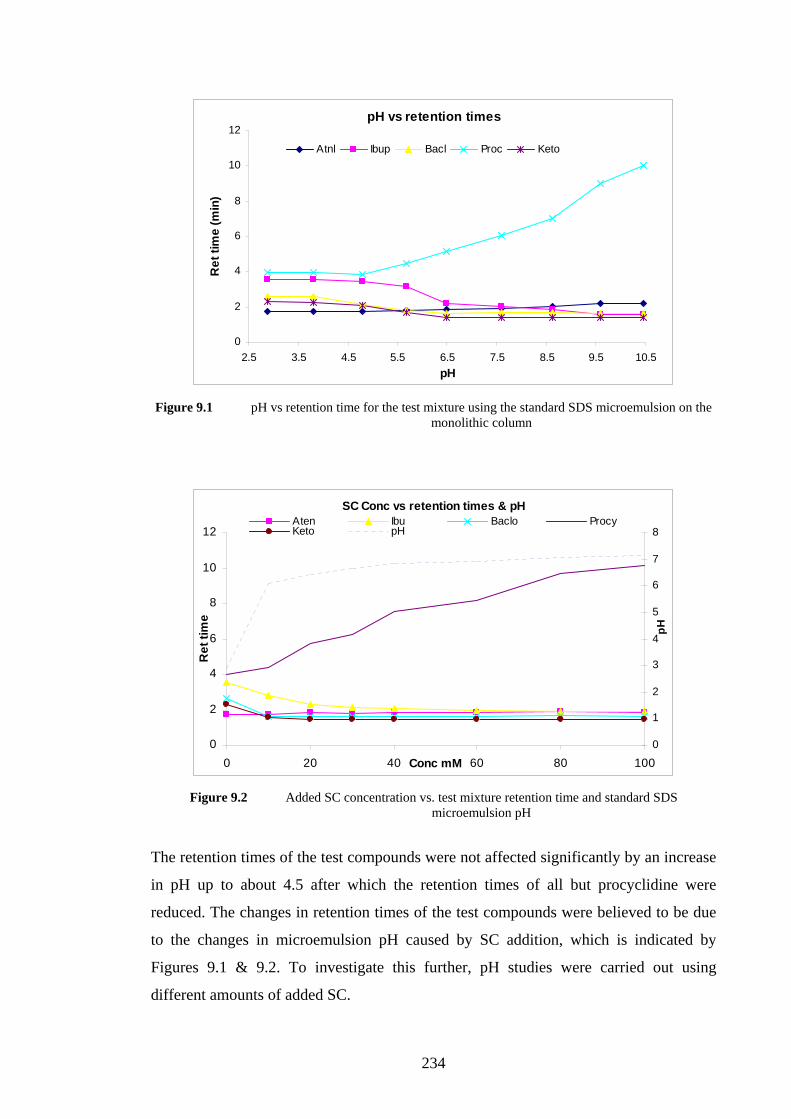
234
pH vs retention times
0
2
4
6
8
10
12
2.5 3.5 4.5 5.5 6.5 7.5 8.5 9.5 10.5pH
Ret
tim
e (m
in)
Atnl Ibup Bacl Proc Keto
Figure 9.1 pH vs retention time for the test mixture using the standard SDS microemulsion on the
monolithic column
SC Conc vs retention times & pH
0
2
4
6
8
10
12
0 20 40 60 80 100Conc mM
Ret
tim
e
0
1
2
3
4
5
6
7
8
pH
Aten Ibu Baclo ProcyKeto pH
Figure 9.2 Added SC concentration vs. test mixture retention time and standard SDS
microemulsion pH
The retention times of the test compounds were not affected significantly by an increase
in pH up to about 4.5 after which the retention times of all but procyclidine were
reduced. The changes in retention times of the test compounds were believed to be due
to the changes in microemulsion pH caused by SC addition, which is indicated by
Figures 9.1 & 9.2. To investigate this further, pH studies were carried out using
different amounts of added SC.

235
The test mixture was run using 10 & 40 mM added SC microemulsions over the pH
range 2.89 - 10.5. Adjusting the natural pH of the microemulsion with 60 mM and
higher added SC by approximately 2 pH units resulted in surfactant crystals coming out
of solution. Figures 9.3 and 9.4 illustrate the retention times for the test mixture using
10 & 40 mM SC at a range of pH values. It was found that the change in retention times
for the test compounds was mainly due to the change in microemulsion pH caused by
the added SC.
10mM SC ME ret time vs pH
0
2
4
6
8
10
12
14
16
18
20
2.5 3.5 4.5 5.5 6.5 7.5 8.5 9.5 10.5pH
Ret
Tim
e
Aten
Ibu
Baclo
Proc
Keto
Figure 9.3 Retention time vs pH for added 10 mM SC microemulsion
40mM SC ME Ret time vs pH
0
2
4
6
8
10
12
14
16
18
20
2.5 3.5 4.5 5.5 6.5 7.5 8.5 9.5 10.5pH
Ret
tim
e
Aten
Ibu
Baclo
Proc
Keto
Figure 9.4 Retention time vs pH for added 40 mM SC microemulsion

236
Changes in microemulsion pH had different effects on peak resolution and retention
times when the amount of added SC was increased. Increasing the amount added from 0
to 10 mM caused an increase in retention times and improved resolution for all peaks at
lower pH levels. When the amount of SC added increased to 40 mM, retention times
decreased at low pH levels. Across the pH range, retention times using 0, 10 and 40 mM
added SC showed similar trends except for the retention of procyclidine HCl which was
highly retained with the presence of SC at high pH levels.
Increasing the column temperature between 30 and 60º C had very little effect on the
retention times of the test compounds using the unmodified microemulsion. The same
temperature study was performed using 10, 40 & 60 mM SC added to the standard
microemulsion. Again no significant changes in retention times, resolution or peak
efficiency were observed for any compound.
The flow rate was reduced to 0.5 mL/min for microemulsions with added SC between
10 – 100 mM. Retention times were approximately doubled and no evidence of chiral
separations was observed.
9.4.1.2 Effects of added β-cyclodextrin
20 mM was the maximum amount of β-CD that could be incorporated into the standard
microemulsion. The chiral test mixture was run using 5, 10, 15 & 20 mM added β-CD.
Up to 15 mM added β-CD there was a slight increase in the retention times for all
compounds with a more pronounced increase for 20 mM β-CD. See Figure 9.5.
Column temperature effects were studied using 10 mM β-CD between 30 & 60º C. At
30º all compounds were completely resolved however at higher temperatures there was
a reduction in retention times for all compounds resulting in loss of resolution for
procyclidine HCl/ibuprofen and baclofen/ketoprofen peak pairs. The retention time of
atenolol was hardly affected and showed very little retention on the column, (Figure
9.6).

237
B-CD conc vs retention
0
1
2
3
4
5
6
7
0 5 10 15 20Conc mM
Ret
entio
n tim
e
Aten Ibu Baclo Proc Keto
Figure 9.5 Added β-CD concentrations versus retention times pH 2.89
10mM B-CD temp vs retention times
0
0.5
1
1.5
2
2.5
3
3.5
4
4.5
5
30 35 40 45 50 55 60Temp
Ret
entio
n tim
e
Aten Ibu Baclo Proc Keto
Figure 9.6 Added 10mM β-CD, Temp vs. retention time
The effects of pH on the retention of the test mixture using the standard microemulsion
with 10 mM added β-CD over the pH range 2.89 – 9.1 was studied. The plot of
retention time vs. microemulsion pH for the test mixture is shown in Figure 9.7.
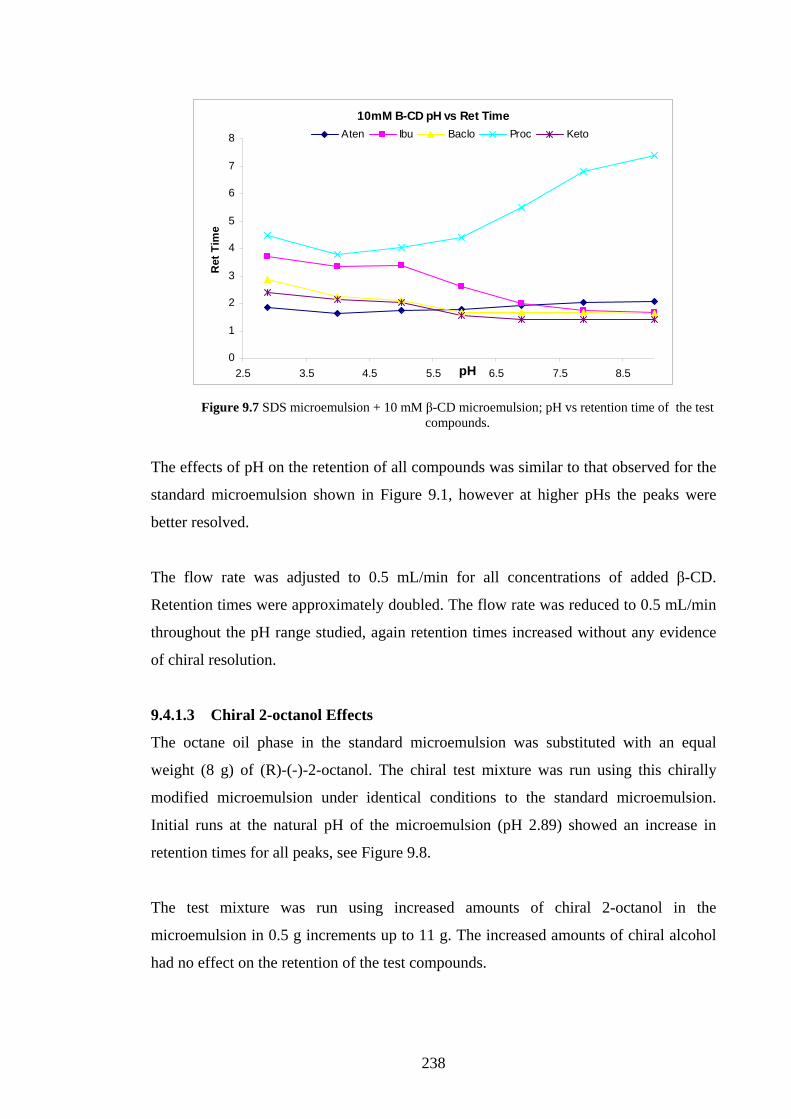
238
10mM B-CD pH vs Ret Time
0
1
2
3
4
5
6
7
8
2.5 3.5 4.5 5.5 6.5 7.5 8.5pH
Ret
Tim
e
Aten Ibu Baclo Proc Keto
Figure 9.7 SDS microemulsion + 10 mM β-CD microemulsion; pH vs retention time of the test
compounds.
The effects of pH on the retention of all compounds was similar to that observed for the
standard microemulsion shown in Figure 9.1, however at higher pHs the peaks were
better resolved.
The flow rate was adjusted to 0.5 mL/min for all concentrations of added β-CD.
Retention times were approximately doubled. The flow rate was reduced to 0.5 mL/min
throughout the pH range studied, again retention times increased without any evidence
of chiral resolution.
9.4.1.3 Chiral 2-octanol Effects
The octane oil phase in the standard microemulsion was substituted with an equal
weight (8 g) of (R)-(-)-2-octanol. The chiral test mixture was run using this chirally
modified microemulsion under identical conditions to the standard microemulsion.
Initial runs at the natural pH of the microemulsion (pH 2.89) showed an increase in
retention times for all peaks, see Figure 9.8.
The test mixture was run using increased amounts of chiral 2-octanol in the
microemulsion in 0.5 g increments up to 11 g. The increased amounts of chiral alcohol
had no effect on the retention of the test compounds.
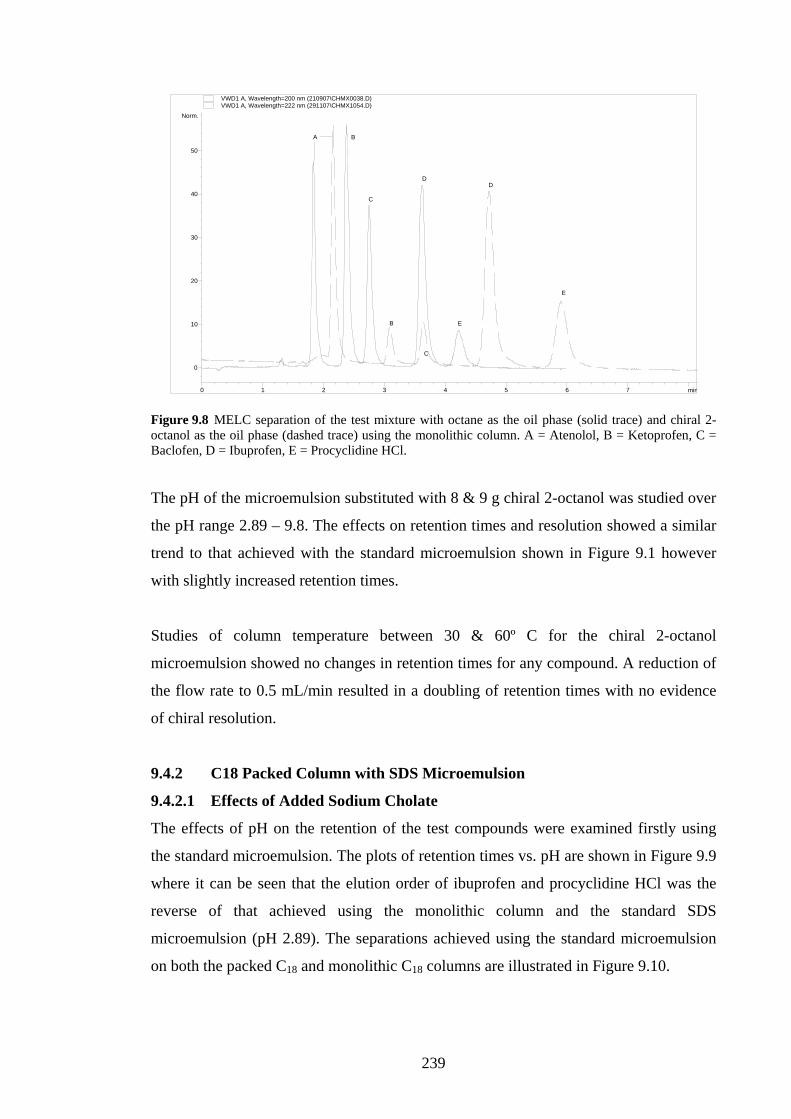
239
min0 1 2 3 4 5 6 7
Norm.
0
10
20
30
40
50
VWD1 A, Wavelength=200 nm (210907\CHMX0038.D)
A B
C
D
EB
C
D
E
VWD1 A, Wavelength=222 nm (291107\CHMX1054.D)
Figure 9.8 MELC separation of the test mixture with octane as the oil phase (solid trace) and chiral 2-octanol as the oil phase (dashed trace) using the monolithic column. A = Atenolol, B = Ketoprofen, C = Baclofen, D = Ibuprofen, E = Procyclidine HCl. The pH of the microemulsion substituted with 8 & 9 g chiral 2-octanol was studied over
the pH range 2.89 – 9.8. The effects on retention times and resolution showed a similar
trend to that achieved with the standard microemulsion shown in Figure 9.1 however
with slightly increased retention times.
Studies of column temperature between 30 & 60º C for the chiral 2-octanol
microemulsion showed no changes in retention times for any compound. A reduction of
the flow rate to 0.5 mL/min resulted in a doubling of retention times with no evidence
of chiral resolution.
9.4.2 C18 Packed Column with SDS Microemulsion
9.4.2.1 Effects of Added Sodium Cholate
The effects of pH on the retention of the test compounds were examined firstly using
the standard microemulsion. The plots of retention times vs. pH are shown in Figure 9.9
where it can be seen that the elution order of ibuprofen and procyclidine HCl was the
reverse of that achieved using the monolithic column and the standard SDS
microemulsion (pH 2.89). The separations achieved using the standard microemulsion
on both the packed C18 and monolithic C18 columns are illustrated in Figure 9.10.
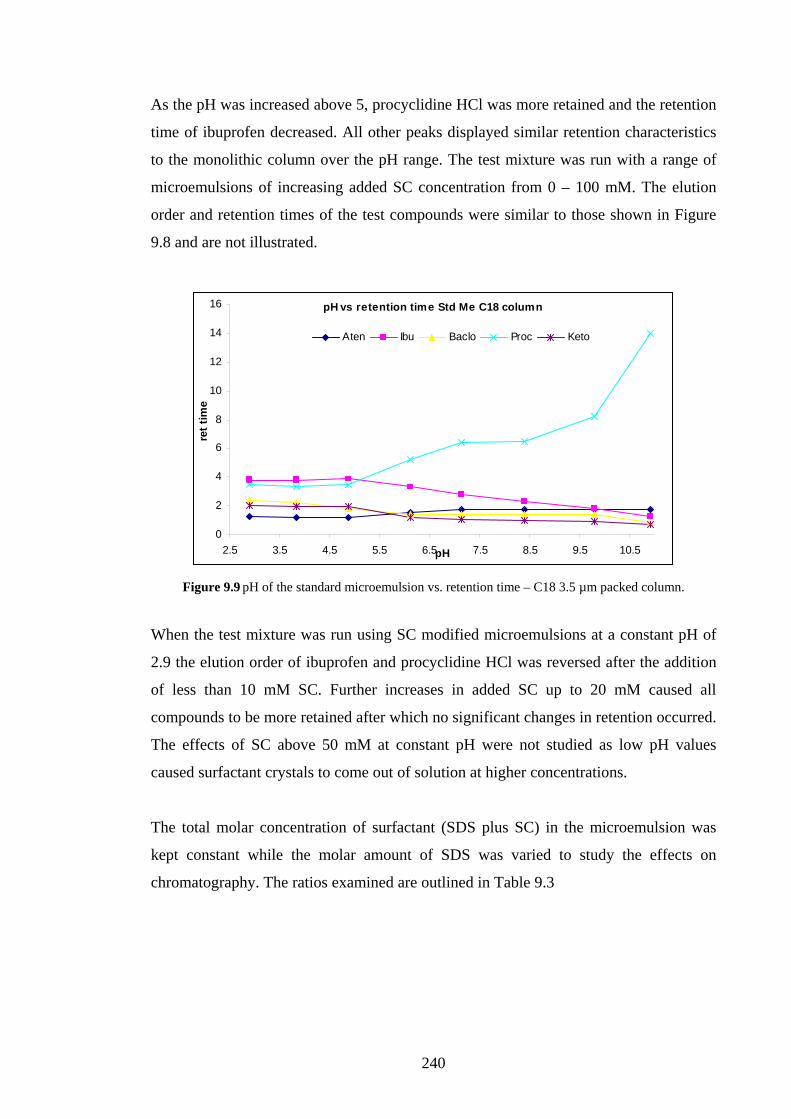
240
As the pH was increased above 5, procyclidine HCl was more retained and the retention
time of ibuprofen decreased. All other peaks displayed similar retention characteristics
to the monolithic column over the pH range. The test mixture was run with a range of
microemulsions of increasing added SC concentration from 0 – 100 mM. The elution
order and retention times of the test compounds were similar to those shown in Figure
9.8 and are not illustrated.
pH vs retention time Std Me C18 column
0
2
4
6
8
10
12
14
16
2.5 3.5 4.5 5.5 6.5 7.5 8.5 9.5 10.5pH
ret t
ime
Aten Ibu Baclo Proc Keto
Figure 9.9 pH of the standard microemulsion vs. retention time – C18 3.5 µm packed column.
When the test mixture was run using SC modified microemulsions at a constant pH of
2.9 the elution order of ibuprofen and procyclidine HCl was reversed after the addition
of less than 10 mM SC. Further increases in added SC up to 20 mM caused all
compounds to be more retained after which no significant changes in retention occurred.
The effects of SC above 50 mM at constant pH were not studied as low pH values
caused surfactant crystals to come out of solution at higher concentrations.
The total molar concentration of surfactant (SDS plus SC) in the microemulsion was
kept constant while the molar amount of SDS was varied to study the effects on
chromatography. The ratios examined are outlined in Table 9.3
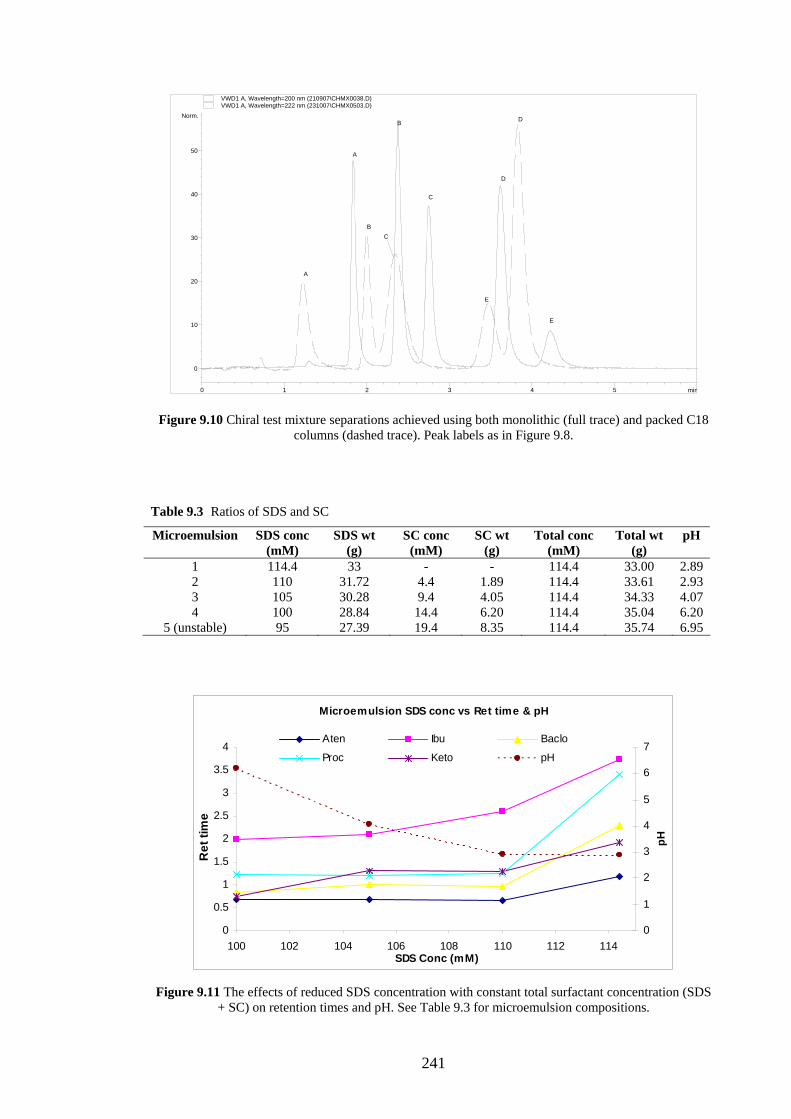
241
min0 1 2 3 4 5
Norm.
0
10
20
30
40
50
VWD1 A, Wavelength=200 nm (210907\CHMX0038.D)
A
B
C
D
E
A
BC
D
E
VWD1 A, Wavelength=222 nm (231007\CHMX0503.D)
Figure 9.10 Chiral test mixture separations achieved using both monolithic (full trace) and packed C18 columns (dashed trace). Peak labels as in Figure 9.8.
Table 9.3 Ratios of SDS and SC
Microemulsion SDS conc (mM)
SDS wt (g)
SC conc (mM)
SC wt (g)
Total conc (mM)
Total wt (g)
pH
1 114.4 33 - - 114.4 33.00 2.89 2 110 31.72 4.4 1.89 114.4 33.61 2.93 3 105 30.28 9.4 4.05 114.4 34.33 4.07 4 100 28.84 14.4 6.20 114.4 35.04 6.20
5 (unstable) 95 27.39 19.4 8.35 114.4 35.74 6.95
Microemulsion SDS conc vs Ret time & pH
0
0.5
1
1.5
2
2.5
3
3.5
4
100 102 104 106 108 110 112 114SDS Conc (mM)
Ret
tim
e
0
1
2
3
4
5
6
7
pH
Aten Ibu Baclo
Proc Keto pH
Figure 9.11 The effects of reduced SDS concentration with constant total surfactant concentration (SDS
+ SC) on retention times and pH. See Table 9.3 for microemulsion compositions.

242
It can be seen from Figure 9.11 that a reduction in the concentration of SDS while
keeping the total surfactant concentration constant had a significantly different effect on
the retention time of procyclidine HCl than when the total surfactant concentration was
increased through the addition of SC.
Substitution of 4.4 mM (1.28 g) SDS with 4.4 mM (1.89 g) SC in the microemulsion
caused a slight increase in microemulsion pH but a large reduction in the retention times
of all test compounds in particular procyclidine HCl which had its retention trend
reversed. Further reductions in the concentration of SDS in the microemulsion with
constant total surfactant concentration caused ketoprofen, baclofen and atenolol to lose
their retention on the column and they co-eluted near the solvent peak while ibuprofen
and procyclidine HCl remained resolved. The presence of higher amounts of SC caused
an increase in microemulsion pH.
Table 9.4 shows the % molar ratios of SDS for the SC modified microemulsions used
on the packed C18 and monolithic C18 column. An increase in the total surfactant
concentration used in the microemulsion up to 214.4 mM (33 g SDS plus 43.06 g SC)
resulted in stable microemulsions while a constant molar concentration of 114.4 mM
surfactant and a reduction in the amount of SDS below 87.4% resulted in poor
microemulsion stability.
It appeared that the presence of a sufficient amount SDS in the microemulsion was
essential to maintain a stable system. Substitution of more than 14.4 mM SDS with SC
may have increased the interfacial tension between the aqueous phase and the oil
droplet to an extent that the microemulsion was unstable. This indicated that SC was a
weaker amphiphile than SDS i.e. had less effect on reducing interfacial tension.
Increasing the total amount of surfactant in the system while keeping a constant SDS
concentration appeared to have no effect on the stability of the microemulsion. Only
when the pH of higher concentrations of SC was lowered did surfactant crystals come
out of solution.
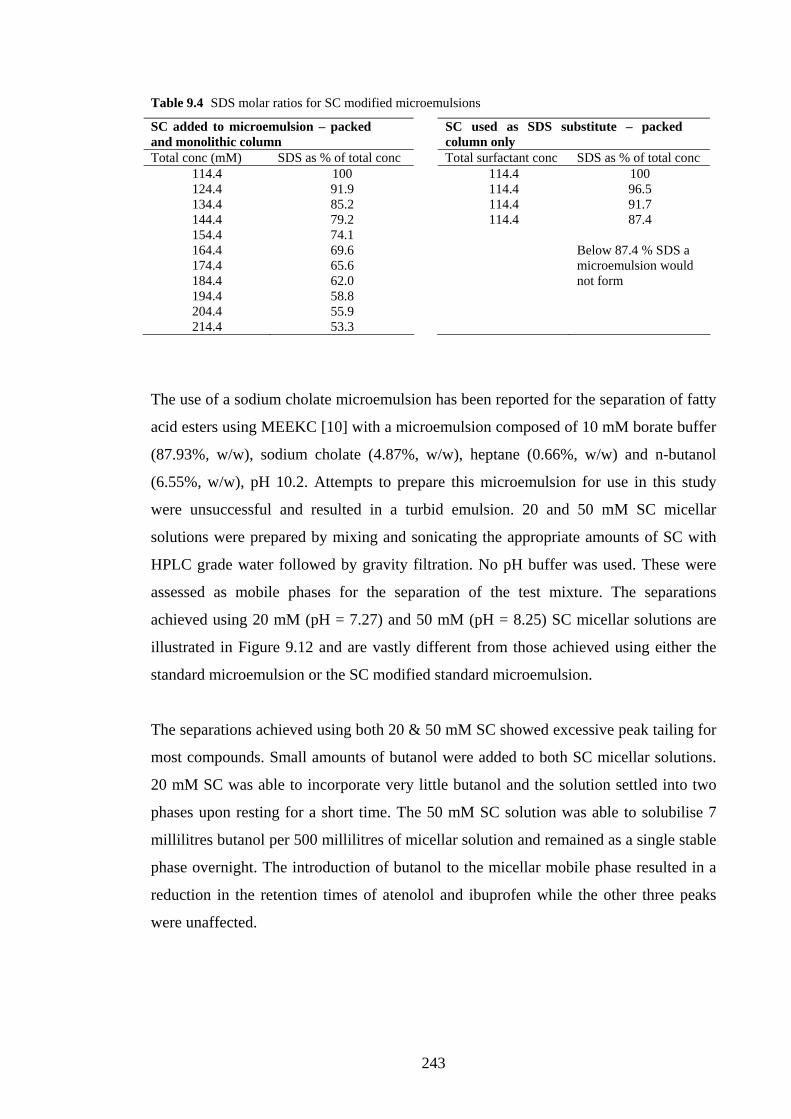
243
Table 9.4 SDS molar ratios for SC modified microemulsions
SC added to microemulsion – packed and monolithic column
SC used as SDS substitute – packed column only
Total conc (mM) SDS as % of total conc Total surfactant conc SDS as % of total conc 114.4 100 114.4 100 124.4 91.9 114.4 96.5 134.4 85.2 114.4 91.7 144.4 79.2 114.4 87.4 154.4 74.1 164.4 69.6 Below 87.4 % SDS a 174.4 65.6 microemulsion would 184.4 62.0 not form 194.4 58.8 204.4 55.9 214.4 53.3
The use of a sodium cholate microemulsion has been reported for the separation of fatty
acid esters using MEEKC [10] with a microemulsion composed of 10 mM borate buffer
(87.93%, w/w), sodium cholate (4.87%, w/w), heptane (0.66%, w/w) and n-butanol
(6.55%, w/w), pH 10.2. Attempts to prepare this microemulsion for use in this study
were unsuccessful and resulted in a turbid emulsion. 20 and 50 mM SC micellar
solutions were prepared by mixing and sonicating the appropriate amounts of SC with
HPLC grade water followed by gravity filtration. No pH buffer was used. These were
assessed as mobile phases for the separation of the test mixture. The separations
achieved using 20 mM (pH = 7.27) and 50 mM (pH = 8.25) SC micellar solutions are
illustrated in Figure 9.12 and are vastly different from those achieved using either the
standard microemulsion or the SC modified standard microemulsion.
The separations achieved using both 20 & 50 mM SC showed excessive peak tailing for
most compounds. Small amounts of butanol were added to both SC micellar solutions.
20 mM SC was able to incorporate very little butanol and the solution settled into two
phases upon resting for a short time. The 50 mM SC solution was able to solubilise 7
millilitres butanol per 500 millilitres of micellar solution and remained as a single stable
phase overnight. The introduction of butanol to the micellar mobile phase resulted in a
reduction in the retention times of atenolol and ibuprofen while the other three peaks
were unaffected.
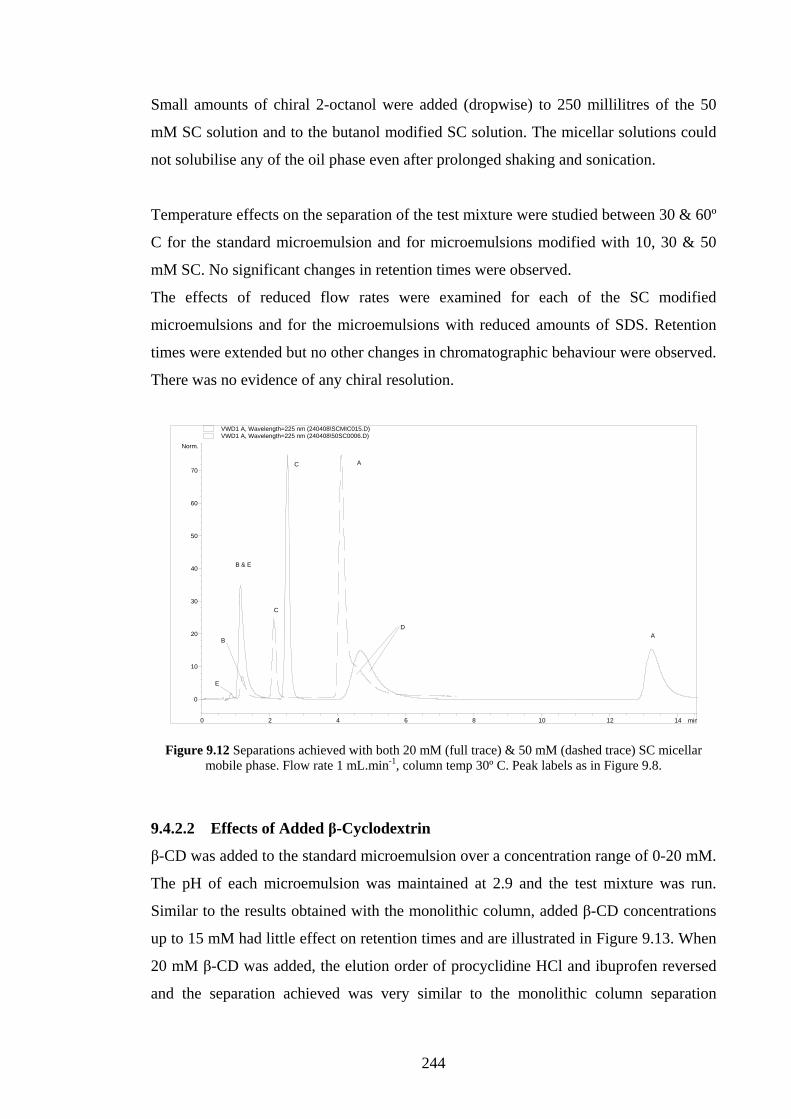
244
Small amounts of chiral 2-octanol were added (dropwise) to 250 millilitres of the 50
mM SC solution and to the butanol modified SC solution. The micellar solutions could
not solubilise any of the oil phase even after prolonged shaking and sonication.
Temperature effects on the separation of the test mixture were studied between 30 & 60º
C for the standard microemulsion and for microemulsions modified with 10, 30 & 50
mM SC. No significant changes in retention times were observed.
The effects of reduced flow rates were examined for each of the SC modified
microemulsions and for the microemulsions with reduced amounts of SDS. Retention
times were extended but no other changes in chromatographic behaviour were observed.
There was no evidence of any chiral resolution.
min0 2 4 6 8 10 12 14
Norm.
0
10
20
30
40
50
60
70
VWD1 A, Wavelength=225 nm (240408\SCMIC015.D)
A
C
B & E
D
A
C
E
B
VWD1 A, Wavelength=225 nm (240408\50SC0006.D)
Figure 9.12 Separations achieved with both 20 mM (full trace) & 50 mM (dashed trace) SC micellar mobile phase. Flow rate 1 mL.min-1, column temp 30º C. Peak labels as in Figure 9.8.
9.4.2.2 Effects of Added β-Cyclodextrin
β-CD was added to the standard microemulsion over a concentration range of 0-20 mM.
The pH of each microemulsion was maintained at 2.9 and the test mixture was run.
Similar to the results obtained with the monolithic column, added β-CD concentrations
up to 15 mM had little effect on retention times and are illustrated in Figure 9.13. When
20 mM β-CD was added, the elution order of procyclidine HCl and ibuprofen reversed
and the separation achieved was very similar to the monolithic column separation
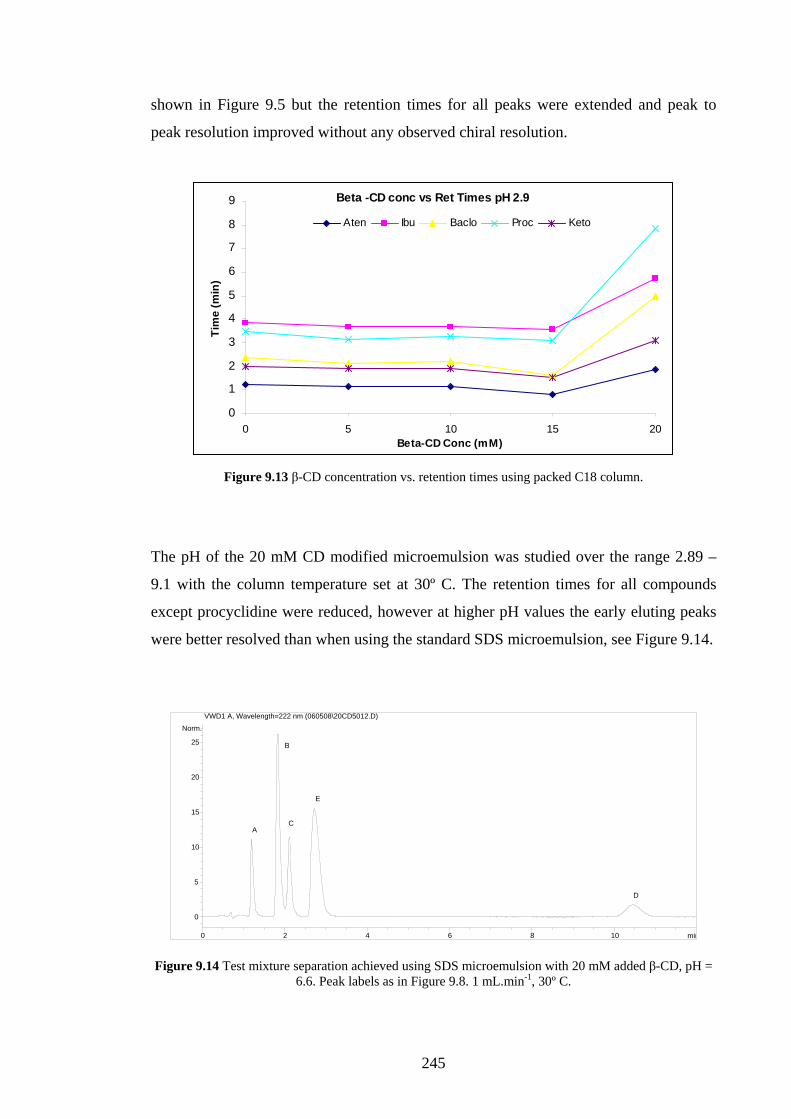
245
shown in Figure 9.5 but the retention times for all peaks were extended and peak to
peak resolution improved without any observed chiral resolution.
Beta -CD conc vs Ret Times pH 2.9
0
1
2
3
4
5
6
7
8
9
0 5 10 15 20Beta-CD Conc (mM)
Tim
e (m
in)
Aten Ibu Baclo Proc Keto
Figure 9.13 β-CD concentration vs. retention times using packed C18 column.
The pH of the 20 mM CD modified microemulsion was studied over the range 2.89 –
9.1 with the column temperature set at 30º C. The retention times for all compounds
except procyclidine were reduced, however at higher pH values the early eluting peaks
were better resolved than when using the standard SDS microemulsion, see Figure 9.14.
min0 2 4 6 8 10
Norm.
0
5
10
15
20
25
VWD1 A, Wavelength=222 nm (060508\20CD5012.D)
A
B
C
E
D
Figure 9.14 Test mixture separation achieved using SDS microemulsion with 20 mM added β-CD, pH = 6.6. Peak labels as in Figure 9.8. 1 mL.min-1, 30º C.
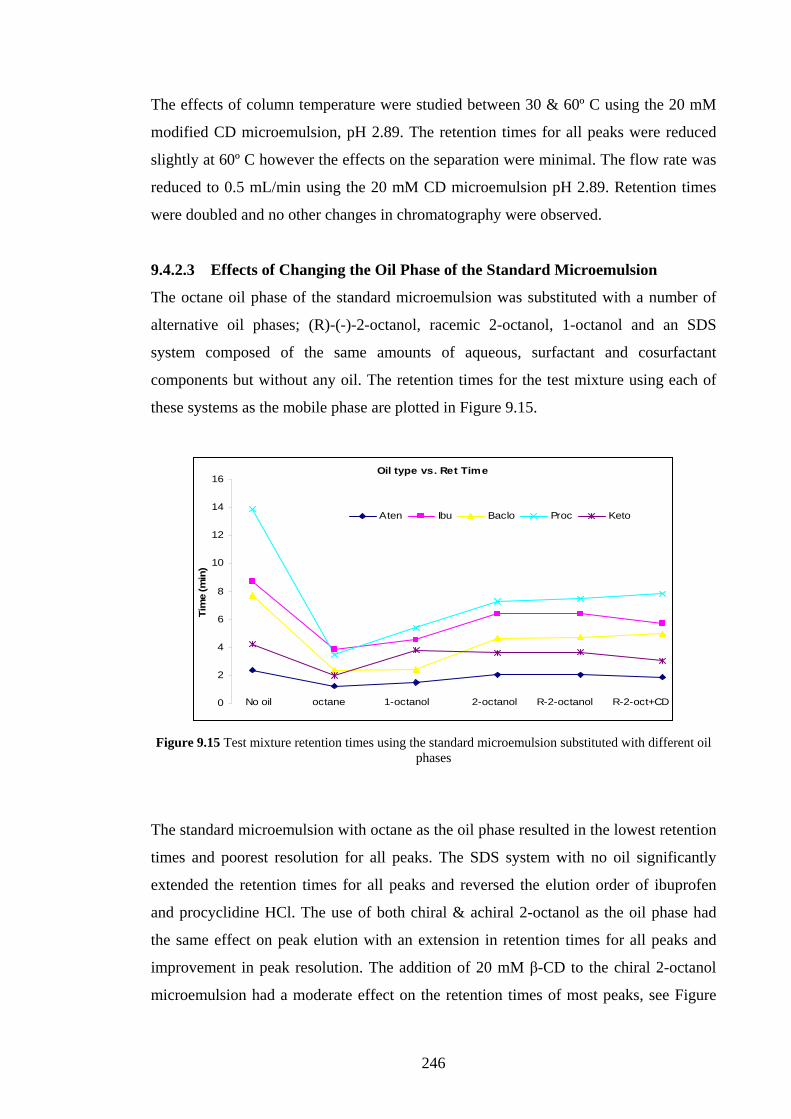
246
The effects of column temperature were studied between 30 & 60º C using the 20 mM
modified CD microemulsion, pH 2.89. The retention times for all peaks were reduced
slightly at 60º C however the effects on the separation were minimal. The flow rate was
reduced to 0.5 mL/min using the 20 mM CD microemulsion pH 2.89. Retention times
were doubled and no other changes in chromatography were observed.
9.4.2.3 Effects of Changing the Oil Phase of the Standard Microemulsion
The octane oil phase of the standard microemulsion was substituted with a number of
alternative oil phases; (R)-(-)-2-octanol, racemic 2-octanol, 1-octanol and an SDS
system composed of the same amounts of aqueous, surfactant and cosurfactant
components but without any oil. The retention times for the test mixture using each of
these systems as the mobile phase are plotted in Figure 9.15.
Oil type vs. Ret Time
0
2
4
6
8
10
12
14
16
Tim
e (m
in)
Aten Ibu Baclo Proc Keto
No oil octane 1-octanol 2-octanol R-2-octanol R-2-oct+CD
Figure 9.15 Test mixture retention times using the standard microemulsion substituted with different oil
phases
The standard microemulsion with octane as the oil phase resulted in the lowest retention
times and poorest resolution for all peaks. The SDS system with no oil significantly
extended the retention times for all peaks and reversed the elution order of ibuprofen
and procyclidine HCl. The use of both chiral & achiral 2-octanol as the oil phase had
the same effect on peak elution with an extension in retention times for all peaks and
improvement in peak resolution. The addition of 20 mM β-CD to the chiral 2-octanol
microemulsion had a moderate effect on the retention times of most peaks, see Figure
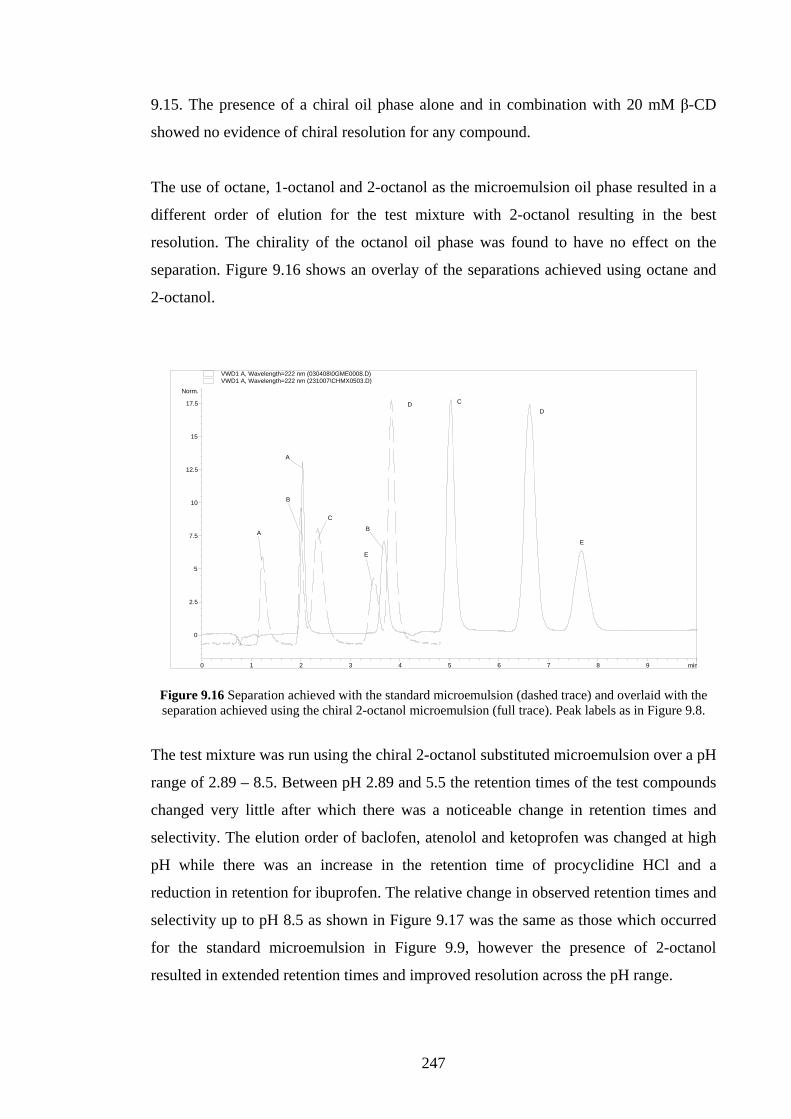
247
9.15. The presence of a chiral oil phase alone and in combination with 20 mM β-CD
showed no evidence of chiral resolution for any compound.
The use of octane, 1-octanol and 2-octanol as the microemulsion oil phase resulted in a
different order of elution for the test mixture with 2-octanol resulting in the best
resolution. The chirality of the octanol oil phase was found to have no effect on the
separation. Figure 9.16 shows an overlay of the separations achieved using octane and
2-octanol.
min0 1 2 3 4 5 6 7 8 9
Norm.
0
2.5
5
7.5
10
12.5
15
17.5
VWD1 A, Wavelength=222 nm (030408\0GME0008.D)
A
B
CD
EA
B
C
E
D
VWD1 A, Wavelength=222 nm (231007\CHMX0503.D)
Figure 9.16 Separation achieved with the standard microemulsion (dashed trace) and overlaid with the separation achieved using the chiral 2-octanol microemulsion (full trace). Peak labels as in Figure 9.8.
The test mixture was run using the chiral 2-octanol substituted microemulsion over a pH
range of 2.89 – 8.5. Between pH 2.89 and 5.5 the retention times of the test compounds
changed very little after which there was a noticeable change in retention times and
selectivity. The elution order of baclofen, atenolol and ketoprofen was changed at high
pH while there was an increase in the retention time of procyclidine HCl and a
reduction in retention for ibuprofen. The relative change in observed retention times and
selectivity up to pH 8.5 as shown in Figure 9.17 was the same as those which occurred
for the standard microemulsion in Figure 9.9, however the presence of 2-octanol
resulted in extended retention times and improved resolution across the pH range.
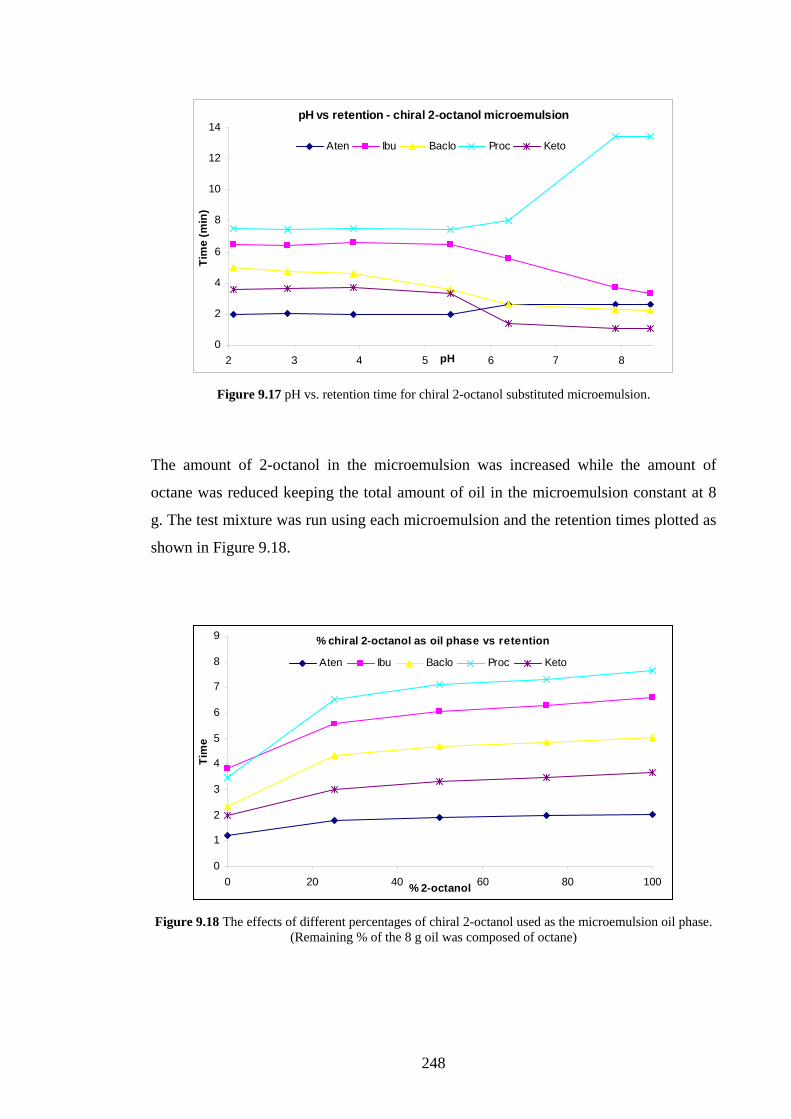
248
pH vs retention - chiral 2-octanol microemulsion
0
2
4
6
8
10
12
14
2 3 4 5 6 7 8pH
Tim
e (m
in)
Aten Ibu Baclo Proc Keto
Figure 9.17 pH vs. retention time for chiral 2-octanol substituted microemulsion.
The amount of 2-octanol in the microemulsion was increased while the amount of
octane was reduced keeping the total amount of oil in the microemulsion constant at 8
g. The test mixture was run using each microemulsion and the retention times plotted as
shown in Figure 9.18.
% chiral 2-octanol as oil phase vs retention
0
1
2
3
4
5
6
7
8
9
0 20 40 60 80 100% 2-octanol
Tim
e
Aten Ibu Baclo Proc Keto
Figure 9.18 The effects of different percentages of chiral 2-octanol used as the microemulsion oil phase.
(Remaining % of the 8 g oil was composed of octane)
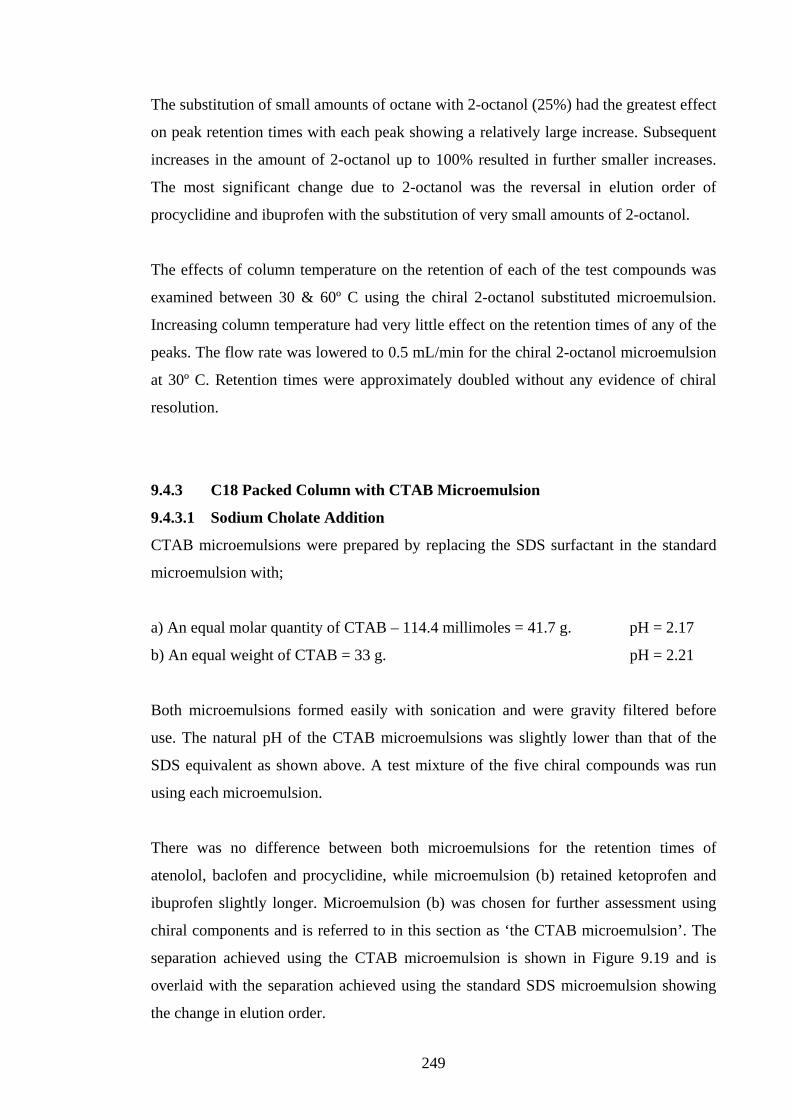
249
The substitution of small amounts of octane with 2-octanol (25%) had the greatest effect
on peak retention times with each peak showing a relatively large increase. Subsequent
increases in the amount of 2-octanol up to 100% resulted in further smaller increases.
The most significant change due to 2-octanol was the reversal in elution order of
procyclidine and ibuprofen with the substitution of very small amounts of 2-octanol.
The effects of column temperature on the retention of each of the test compounds was
examined between 30 & 60º C using the chiral 2-octanol substituted microemulsion.
Increasing column temperature had very little effect on the retention times of any of the
peaks. The flow rate was lowered to 0.5 mL/min for the chiral 2-octanol microemulsion
at 30º C. Retention times were approximately doubled without any evidence of chiral
resolution.
9.4.3 C18 Packed Column with CTAB Microemulsion
9.4.3.1 Sodium Cholate Addition
CTAB microemulsions were prepared by replacing the SDS surfactant in the standard
microemulsion with;
a) An equal molar quantity of CTAB – 114.4 millimoles = 41.7 g. pH = 2.17
b) An equal weight of CTAB = 33 g. pH = 2.21
Both microemulsions formed easily with sonication and were gravity filtered before
use. The natural pH of the CTAB microemulsions was slightly lower than that of the
SDS equivalent as shown above. A test mixture of the five chiral compounds was run
using each microemulsion.
There was no difference between both microemulsions for the retention times of
atenolol, baclofen and procyclidine, while microemulsion (b) retained ketoprofen and
ibuprofen slightly longer. Microemulsion (b) was chosen for further assessment using
chiral components and is referred to in this section as ‘the CTAB microemulsion’. The
separation achieved using the CTAB microemulsion is shown in Figure 9.19 and is
overlaid with the separation achieved using the standard SDS microemulsion showing
the change in elution order.
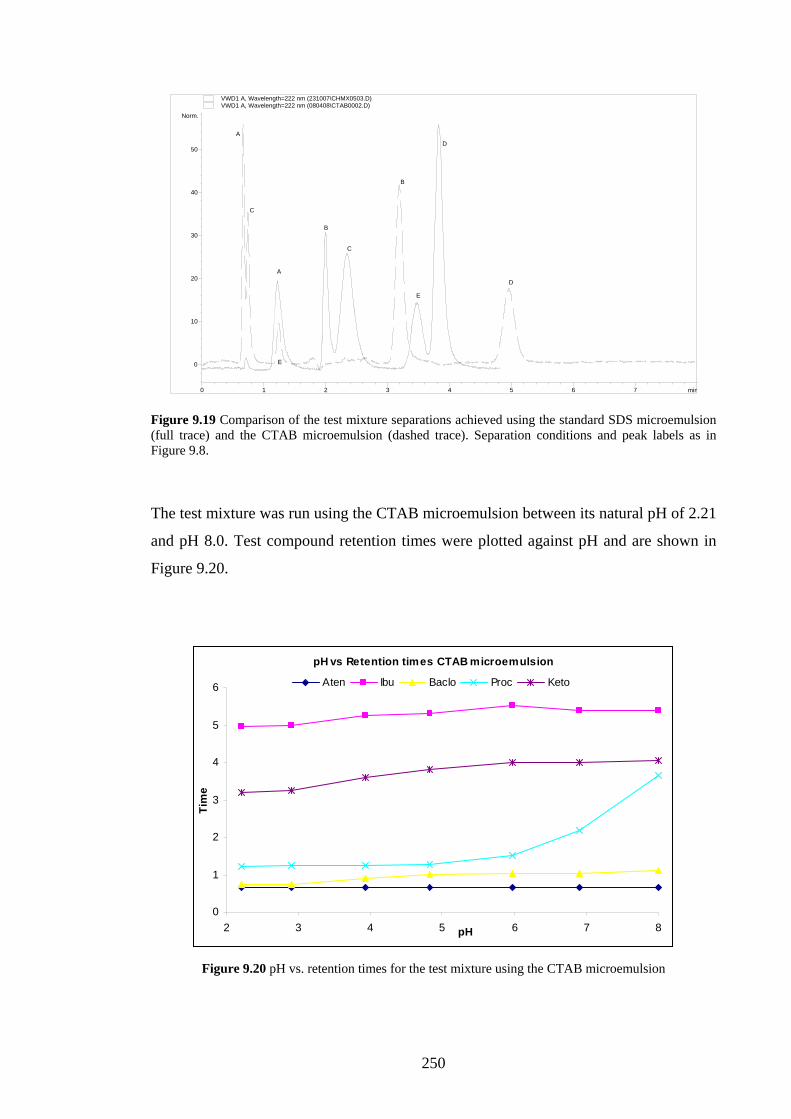
250
min0 1 2 3 4 5 6 7
Norm.
0
10
20
30
40
50
VWD1 A, Wavelength=222 nm (231007\CHMX0503.D)
A
B
C
D
E
VWD1 A, Wavelength=222 nm (080408\CTAB0002.D)
D
B
E
A
C
Figure 9.19 Comparison of the test mixture separations achieved using the standard SDS microemulsion (full trace) and the CTAB microemulsion (dashed trace). Separation conditions and peak labels as in Figure 9.8.
The test mixture was run using the CTAB microemulsion between its natural pH of 2.21
and pH 8.0. Test compound retention times were plotted against pH and are shown in
Figure 9.20.
pH vs Retention times CTAB microemulsion
0
1
2
3
4
5
6
2 3 4 5 6 7 8pH
Tim
e
Aten Ibu Baclo Proc Keto
Figure 9.20 pH vs. retention times for the test mixture using the CTAB microemulsion
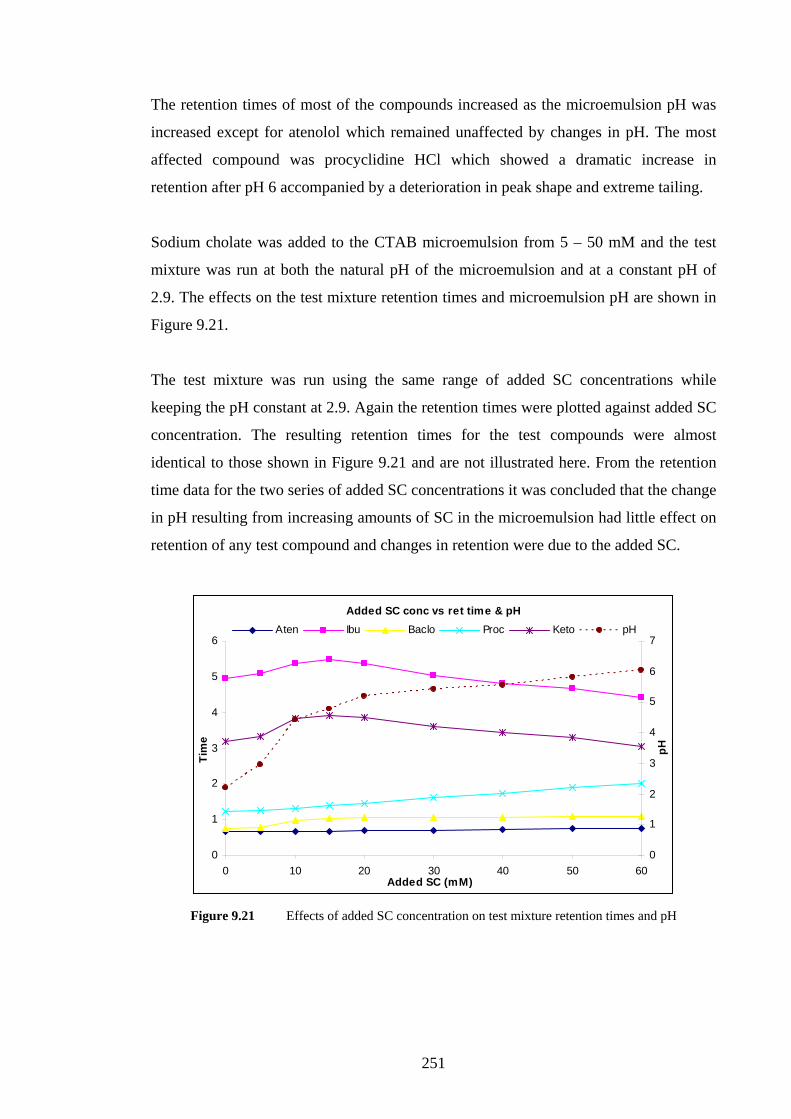
251
The retention times of most of the compounds increased as the microemulsion pH was
increased except for atenolol which remained unaffected by changes in pH. The most
affected compound was procyclidine HCl which showed a dramatic increase in
retention after pH 6 accompanied by a deterioration in peak shape and extreme tailing.
Sodium cholate was added to the CTAB microemulsion from 5 – 50 mM and the test
mixture was run at both the natural pH of the microemulsion and at a constant pH of
2.9. The effects on the test mixture retention times and microemulsion pH are shown in
Figure 9.21.
The test mixture was run using the same range of added SC concentrations while
keeping the pH constant at 2.9. Again the retention times were plotted against added SC
concentration. The resulting retention times for the test compounds were almost
identical to those shown in Figure 9.21 and are not illustrated here. From the retention
time data for the two series of added SC concentrations it was concluded that the change
in pH resulting from increasing amounts of SC in the microemulsion had little effect on
retention of any test compound and changes in retention were due to the added SC.
Added SC conc vs ret time & pH
0
1
2
3
4
5
6
0 10 20 30 40 50 60Added SC (mM)
Tim
e
0
1
2
3
4
5
6
7
pH
Aten Ibu Baclo Proc Keto pH
Figure 9.21 Effects of added SC concentration on test mixture retention times and pH
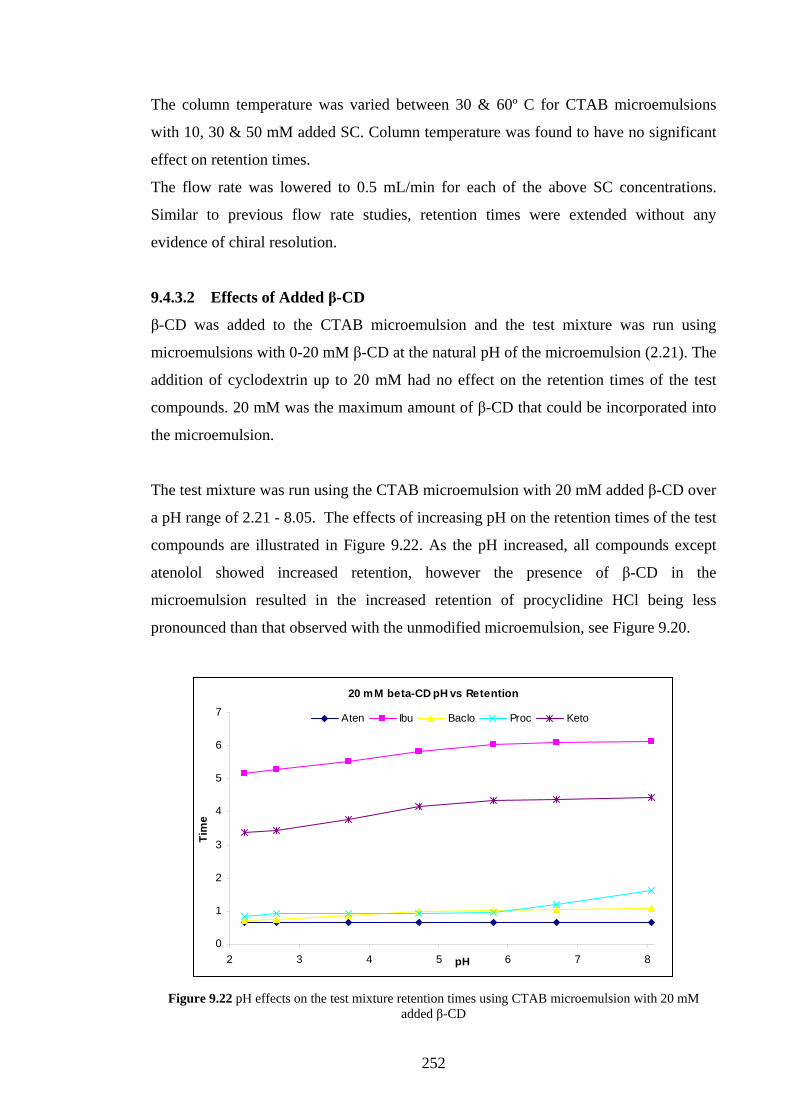
252
The column temperature was varied between 30 & 60º C for CTAB microemulsions
with 10, 30 & 50 mM added SC. Column temperature was found to have no significant
effect on retention times.
The flow rate was lowered to 0.5 mL/min for each of the above SC concentrations.
Similar to previous flow rate studies, retention times were extended without any
evidence of chiral resolution.
9.4.3.2 Effects of Added β-CD
β-CD was added to the CTAB microemulsion and the test mixture was run using
microemulsions with 0-20 mM β-CD at the natural pH of the microemulsion (2.21). The
addition of cyclodextrin up to 20 mM had no effect on the retention times of the test
compounds. 20 mM was the maximum amount of β-CD that could be incorporated into
the microemulsion.
The test mixture was run using the CTAB microemulsion with 20 mM added β-CD over
a pH range of 2.21 - 8.05. The effects of increasing pH on the retention times of the test
compounds are illustrated in Figure 9.22. As the pH increased, all compounds except
atenolol showed increased retention, however the presence of β-CD in the
microemulsion resulted in the increased retention of procyclidine HCl being less
pronounced than that observed with the unmodified microemulsion, see Figure 9.20.
20 mM beta-CD pH vs Retention
0
1
2
3
4
5
6
7
2 3 4 5 6 7 8pH
Tim
e
Aten Ibu Baclo Proc Keto
Figure 9.22 pH effects on the test mixture retention times using CTAB microemulsion with 20 mM
added β-CD

253
The flow rate was reduced to 0.5 mL/min for each of the 20 mM β-CD modified
microemulsions used for the pH study shown in Figure 9.22. Reducing the flow rate had
no effect on chiral resolution and increased retention times for all peaks approximately
two-fold. The column temperature was studied between 30 – 60 º C for the CTAB
microemulsion modified with 20 mM β-CD. No significant change in chromatography
was observed.
9.4.3.3 Effects of Changing the Oil Phase of the CTAB Microemulsion
Octane was replaced by chiral 2-octanol as the oil phase of the CTAB microemulsion.
Substitution of the oil phase with chiral 2-octanol extended the retention times of
ibuprofen and ketoprofen. The retention times of the remaining peaks were not
significantly effected. The separation achieved is shown in Figure 9.23 where it is
overlaid with the separation achieved using the CTAB microemulsion containing
octane. Using 1-octanol as the oil phase also extended the retention times slightly but
not to the extent as 2-octanol. Retention times were found to increase by a very small
amount in the order; octane < 1-octanol < 2-octanol. There was no change in the order
of elution for any of the oil phases.
min0 1 2 3 4 5 6 7 8 9
Norm.
0
10
20
30
40
50
VWD1 A, Wavelength=222 nm (090408\CHIRCT07.D)
C
D
BE
A
VWD1 A, Wavelength=222 nm (080408\CTAB0002.D)
Figure 9.23 Comparison chromatograms for the standard CTAB microemulsion (dashed trace) and the chiral 2-octanol microemulsion (full trace). Labels as in Figure 9.8.

254
The test mixture was run using the chiral 2-octanol microemulsion over the pH range
2.21 – 8.2. Increasing the microemulsion pH had the same effects on peak retention as
those observed using the CTAB microemulsion with octane as the oil phase shown in
Figure 9.20.
The test mixture was run using the chiral 2-octanol CTAB microemulsion over a
column temperature range of 30 - 60º C. No significant changes in chromatographic
behaviour were observed. Reducing the flow rate also had little effect on
chromatographic results except for an extension of retention times.
9.4.4 Agilent Chiradex β-Cyclodextrin Column
9.4.4.1 Separation of the Test Mixture using Aq/organic Mobile Phases
To assess the chiral column for the separation of the text mixture enantiomers, runs
were first performed using a mobile phase of 50/50 methanol/water with a pH of 6.5.
The test mixture was used to observe the retention time of each peak and determine if
any chiral resolution was evident using non microemulsion mobile phases. No method
optimisation was carried out on the test mixture separation using the methanol/water
mobile phase as it was to be used as a reference separation for the microemulsion
mobile phase.
The order of elution for the test compounds was the same as that achieved using the 100
mm C18 column and standard microemulsion. As expected, the retention times for all
peaks were extended compared to the 100 mm column. Slight peak splitting was
observed for the baclofen peak suggesting partial chiral resolution. No evidence of
chiral resolution was observed for any of the other peaks. The flow rate was reduced
gradually from 1.0 mL.min-1 to 0.3 mL.min-1 resulting in improved resolution for the
baclofen peak pairs and broadening of the atenolol peak shown in Figure 9.24. Again,
no evidence of chiral recognition was observed for the remaining peaks.
The peak broadening for atenolol may have been indicative of partial chiral recognition.
Pure (R) & (S) baclofen and atenolol enantiomers were not available at the time this
study was carried out and it was assumed that the splitting of baclofen and broadening
of atenolol was due to chiral recognition on the column.
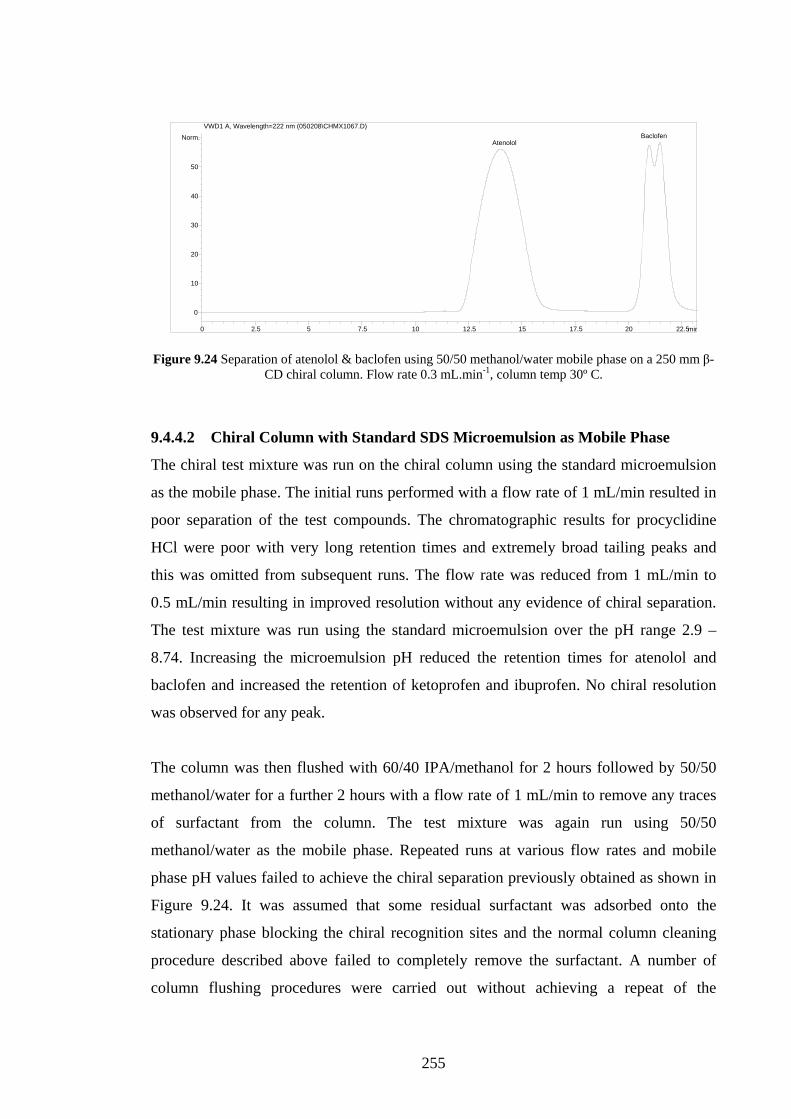
255
min0 2.5 5 7.5 10 12.5 15 17.5 20 22.5
Norm.
0
10
20
30
40
50
VWD1 A, Wavelength=222 nm (050208\CHMX1067.D)
AtenololBaclofen
Figure 9.24 Separation of atenolol & baclofen using 50/50 methanol/water mobile phase on a 250 mm β-CD chiral column. Flow rate 0.3 mL.min-1, column temp 30º C.
9.4.4.2 Chiral Column with Standard SDS Microemulsion as Mobile Phase
The chiral test mixture was run on the chiral column using the standard microemulsion
as the mobile phase. The initial runs performed with a flow rate of 1 mL/min resulted in
poor separation of the test compounds. The chromatographic results for procyclidine
HCl were poor with very long retention times and extremely broad tailing peaks and
this was omitted from subsequent runs. The flow rate was reduced from 1 mL/min to
0.5 mL/min resulting in improved resolution without any evidence of chiral separation.
The test mixture was run using the standard microemulsion over the pH range 2.9 –
8.74. Increasing the microemulsion pH reduced the retention times for atenolol and
baclofen and increased the retention of ketoprofen and ibuprofen. No chiral resolution
was observed for any peak.
The column was then flushed with 60/40 IPA/methanol for 2 hours followed by 50/50
methanol/water for a further 2 hours with a flow rate of 1 mL/min to remove any traces
of surfactant from the column. The test mixture was again run using 50/50
methanol/water as the mobile phase. Repeated runs at various flow rates and mobile
phase pH values failed to achieve the chiral separation previously obtained as shown in
Figure 9.24. It was assumed that some residual surfactant was adsorbed onto the
stationary phase blocking the chiral recognition sites and the normal column cleaning
procedure described above failed to completely remove the surfactant. A number of
column flushing procedures were carried out without achieving a repeat of the

256
separation shown in Figure 9.24. A more vigorous column cleaning procedure described
below resulted in a repeat of the previous separation indicating that the chiral
recognition sites (cyclodextrin cavity and rim) were clear and all SDS had been
removed.
- 60/40, IPA/methanol at 1 mL/min for 2 hours.
- 50/50, THF/methanol at 1 mL/min for 2 hours.
- 50/50, methanol/water with 0.5% TEA at 1 mL/min for 2 hours.
- 50/50, methanol water mobile phase at 1 mL/min for one hour.
9.4.2.3 Chiral Cyclodextrin Column with SC Micellar Mobile Phase.
It was postulated that the hydrophobic C12 chain of the SDS molecules were adsorbed
both onto the C18 column packing and into the hydrophobic cavity of the bound
cyclodextrin, hindering the analyte/cyclodextrin complexation required for chiral
separations. Sodium cholate, which is based around three fused cyclohexane rings has a
much larger molecular volume than either SDS or the volume of the cyclodextrin cavity
and should not be able to form an inclusion complex with the cyclodextrin.
For this reason 20, 30 & 50 mM sodium cholate micellar solutions were prepared as
mobile phases. The test mixture was first run using the 20 mM SC solution with flow
rates of 1.0 & 0.5 mL/min. Chromatographic performance was very poor with very
broad tailing peaks. Increasing the concentration of SC in the solution had little effect
on improving the separation. The addition of up to 6% v/v methanol and 12.7% v/v
butanol to the 20 mM SC solution improved the separation and peak shape of the test
compounds, however no chiral separation occurred. Subsequent runs using both 30 and
50 mM SC micellar solutions yielded similar poor chromatographic results.
The chiral column was rinsed with 60/40 IPA/methanol for one hour followed by 50/50
methanol/water for one hour. The chiral test mixture was then run using the latter
solution as mobile phase. The partial chiral selectivity observed for baclofen and peak
broadening observed for atenolol which was achieved in Figure 9.24 using the
aqueous/organic mobile phase could not be reproduced. The column was again flushed

257
using the more vigorous rinsing procedure as previously described. Only after repeating
the rinse cycle over a number of days was the chiral selectivity of the column regained.
As both surfactant systems (microemulsion SDS & micellar SC) apparently caused the
cyclodextrin column to lose its selectivity for baclofen enantiomers and possibly for the
atenolol enantiomers, no further studies were carried out using the chiral column.
9.5 Discussion
9.5.1 Effects of Added SC on the Microemulsions and Separations.
It was found that the addition of the anionic surfactant, SC or ‘cholic acid, sodium salt’
to both the SDS and CTAB microemulsions caused an increase in microemulsion pH.
The addition of less than 10 mM SC to the SDS microemulsion (pH 2.9) essentially
neutralised the standard SDS microemulsion as shown by the pH curve in Figure 9.2.
When SC was added to the CTAB microemulsion (pH 2.21) the effects on the
microemulsion pH were less pronounced with a more gradual increase to around pH 6
with the addition of 60 mM SC as shown in Figure 9.21.
The addition of SC to the SDS microemulsion caused a decrease in the retention times
of most compounds except for procyclidine HCl, the retention time of which increased
with increasing added SC concentration. When SDS microemulsions with 10 & 40 mM
added SC (natural pH 6.4 & 7 respectively) were studied using a monolithic column
over a wide pH range it was found that the retention curves for each peak showed the
same trend as that shown in Figure 9.2 due to changes in pH, see Figures 9.3 & 9.4. The
effect on the separations caused by added SC were found to be mostly due to the
changes in pH and the effects of the cholate alone were minimal with low
concentrations (10 mM) and low pH (2.9) extending retention times for all peaks
slightly.
SDS microemulsion integrity with added SC concentrations higher than 60 mM was
found to be pH dependant. Lowering the pH of the SC modified microemulsion to
below approximately two units of its natural pH resulted in crystals forming in the
system. These were believed to be SC crystals coming out of solution. The overall
effects of adding the chiral bile salt to the microemulsion using the monolithic column
were negative with no chiral selectivity occurring. The effects on the achiral

258
chromatographic results were also poor with the rapid elution of most compounds
except for procyclidine HCl. At high microemulsion pH and added SC concentrations
above 10 mM, chromatographic selectivity was altered, however because of the very
low retention times for atenolol, baclofen, ibuprofen and ketoprofen, these compounds
were not fully resolved.
A valid point to make about this test mixture is that these compounds were picked for
analysis because of their chirality and it would be highly unlikely that they would be
present together in any pharmaceutical formulation which requires HPLC analysis. The
addition of SC may be useful for other pharmaceutical separations where selectivity
could be altered and retention times reduced dramatically to achieve more efficient
separations.
The addition of SC from 0 – 100 mM to the SDS microemulsion when using a packed
column resulted in the same increase in microemulsion pH as shown in Figure 9.2 and
had the same effect on retention times as increasing the microemulsion pH. The order of
elution for ibuprofen and procyclidine on the packed C18 column was the reverse of
that observed for the monolithic column with the standard microemulsion. When the
effects of SC addition were studied at a constant pH of 2.9, it was found that less than
10 mM added SC caused the elution order of ibuprofen and procyclidine to be reversed
and the retention times of all compounds were increased slightly. Similar to the results
using the monolithic column, the effects of added SC on the retention times were found
to be due to pH changes caused by SC which reduced retention times for most
compounds. The effect of SC, independent of pH, was to increase retention times
slightly.
For the majority of the studies carried out using added SC with both the monolithic and
packed columns, the amount of surfactant in the microemulsion system was dependant
on the amount of added SC as shown in Table 9.4. When the amount of surfactant was
kept constant at 114.4 mM while substituting SDS with SC as detailed in Table 9.3,
retention times were reduced for all peaks. In particular, procyclidine HCl was less
retained on the column when the amount of SDS was reduced and replaced with SC
which was the opposite of that observed for all previous separations. Again there was no
evidence of chiral separations for any of the test compounds.
259
The separations achieved using SC micellar solutions were very different to those
achieved using SC as an additive to both the SDS and CTAB microemulsions. No chiral
resolution was observed for any compound. The concentration of SC in the micellar
solution had a large effect on the separation of the test mixture using the packed column
as shown in Figure 9.12. The addition of small amounts of butanol to the 50 mM SC
solution had little effect on retention times. Chiral 2-octanol could not be solubilised by
50 mM micellar solution.
To date, most MELC separations have been performed using anionic surfactants with
SDS being the most commonly used. In this study, SDS was replaced with cationic
CTAB to observe and compare the separations. The direct substitution of an equal
weight of SDS with CTAB as the microemulsion surfactant produced a very different
separation to that achieved with the SDS microemulsion as shown in Figure 9.19. This
was not unexpected as the positive charge on the surfactant would alter the affinity of
the test compounds for both the microemulsion droplets and the surfactant adsorbed
onto the column packing. Physicochemical investigations into the microstructure and
dynamics of the CTAB system would be required to determine the nature of the system
i.e. is it a true microemulsion and what type is it, droplet size and dynamics etc. From
such studies, direct comparisons of both systems and their separation mechanisms could
be made.
Charged solutes may be coulombically repelled or attracted to the charged droplet in an
ion-pair interaction. The electrostatic interaction between the solute and the adsorbed
surfactant layer will also affect the degree of hydrophobic attraction between the analyte
and the mobile phase. Anionic and cationic surfactant molecules associate differently
with the column stationary phase. The alkyl chain of the negatively charged SDS
molecule will interact with the stationary phase leaving the charged polar head group
oriented away from the surface forming a hydrophilic layer. The reverse happens with
cationic surfactants where the positively charged head groups interact with the
stationary phase leaving the alkyl chain facing outwards and retains the hydrophobicity
of the stationary phase [11].

260
The natural pH of the CTAB microemulsion was 2.21 and increasing the pH up to 8.0
increased the retention times for most compounds in particular procyclidine HCl which
showed a sharp increase after around pH 6.0, see Figure 9.20. The addition of anionic
SC to the cationic CTAB microemulsion at constant pH showed that the overall effect
of added SC was to reduce the retention times for ketoprofen and ibuprofen while
procyclidine HCl and baclofen were slightly more retained.
9.5.2 Effects of Added β-CD
The addition of β-CD to SDS microemulsions for MELC separations has been studied
very little [11] and has not previously been studied using CTAB microemulsions. β-CD
had little effect on the retention times of the test compounds using the SDS
microemulsion until the maximum amount of 20 mM was added. When the test mixture
was run with 20 mM added β-CD the retention times for all compounds were extended,
this was observed for both the monolithic and packed columns, see Figures 9.5 & 9.13.
Increasing the pH of the 10 mM & 20 mM β-CD modified SDS microemulsions had
similar effects to those observed using the standard unmodified microemulsion.
However using the 20 mM β-CD microemulsion allowed the early eluting peaks to be
more retained and better resolved at high pH. When studying the effects of
cyclodextrins on MELC separations, Marsh et al [11] postulated that CD’s become
incorporated onto the column stationary phase and increase solute retention.
The addition of β-CD up to 20 mM to the CTAB microemulsion had no effect on the
retention of the test compounds at the natural microemulsion pH suggesting that the
adsorbed cationic surfactant on the stationary phase would not allow the incorporation
of the CD’s as described in the previously paragraph. At high pH, the presence of 20
mM β-CD caused procyclidine HCl to be less retained.
9.5.3 Effects of Changing the Oil Phase
Substituting octane with chiral 2-octanol as the oil phase of the SDS microemulsion
resulted in extended retention times for all peaks using both the packed and monolithic
columns, while increasing the amount of chiral 2-octanol had no effect on retention
times. Figure 9.15 illustrates the retention times obtained for a number of different oil
phases including a system without oil. The absence of oil substantially increased the

261
retention of all compounds indicating lower analyte affinity for the droplets while
substituting octane with primary and secondary octanol also reduced the analytes
affinity for the droplets. The increase in retention times due to the OH group of the
alcohol indicates a decrease in the extent to which the alcohol can penetrate the droplet.
The use of a secondary alcohol further increased the retention times of all compounds
which indicated a further decrease in penetration of the alcohol into the droplet due to
the secondary position of the OH group.
The retention times for the test mixture obtained using both chiral and achiral 2-octanol
were identical and no chiral resolution was observed using the chiral alcohol. The
addition of 20 mM β-CD to the chiral 2-octanol microemulsion had little effect on the
separation. The effects of pH on the retention times of the test mixture was relatively
similar to that observed for the standard octane microemulsion, however because of the
extended retention times, peak resolution improved at high pH, see Figure 9.17. The
change in selectivity observed at higher pH levels could be more easily exploited due to
improved resolution due to the 2-octanol oil phase.
Substituting octane with chiral 2-octanol as the oil phase of the CTAB microemulsion
had no effect on the elution order of the test mixture and the increase in retention times
were small compared to those observed for the SDS microemulsion. The nature of the
adsorbed CTAB layer on the stationary phase allowed it to retain its hydrophobicity and
separations were less affected by the lipophilicity of the droplet.
9.5.4 SDS Microemulsion on the Chiral Cyclodextrin Column
Initial non-optimised runs using low flow rates and methanol/water mobile phases
indicated that the chiral column was capable of chiral resolution for baclofen and
possibly atenolol. However once the standard SDS microemulsion was introduced onto
the column its ability to achieve any chiral resolution was diminished. This was evident
by the inability of the normal column cleaning procedures to remove all surfactant from
the column and restore its chirality. Only after a long and vigorous washing procedure
was the column restored. The subsequent use of a micellar SC solution also caused the
column to lose its chirality and required vigorous cleaning. It was thought that the
presence of surfactants in the mobile phase inhibited the cyclodextrin cavity by
262
inclusion and steric interference. After equilibration of the column with SDS
microemulsion, a number of SDS molecules may have become incorporated together
into the hydrophobic cyclodextrin cavity, inhibiting the inclusion of chiral analytes. The
alkyl tail group of the SDS molecule with an affinity for the cyclodextrin cavity along
with the polar head groups affinity for the polar cyclodextrin rim would have made their
removal difficult. The polar head groups of SDS molecules which were adsorbed onto
the silica stationary phase surrounding the bound cyclodextrin molecules may also have
sterically interfered with the inclusion cavity. It was thought that sodium cholate, with a
large molecular volume relative to the volume of the cyclodextrin cavity was too big to
enter the cavity fully but once column equilibration was complete it may have been
adsorbed enough to block access to the cavity by the analytes. SC molecules adsorbed
onto the silica support may also have interfered with analyte molecules entering the
cavity.
9.5.5 Comparison of SDS and CTAB Microemulsions
Although no chiral separations were achieved with either the anionic or cationic
microemulsions, some notable comparisons between both systems were observed. The
time for a clean column to equilibrate after introducing an SDS microemulsion as the
mobile phase was found to be in the order of 3 hours at a flow rate of 1 mL/min (~72
column volumes). The equilibration time for the CTAB microemulsion however was
one third of that or approximately 1 hour (~24 column volumes). The equilibration
volume for traditional aqueous/organic mobile phases is 15-20 column volumes [12].
Although CTAB microemulsions have only been reported for successful use in one
MELC paper to date [13], the separations reported here have shown that CTAB MELC
can be used to achieve separations with good resolution, peak shape and with very
different selectivities. This difference in selectivity could be exploited where
separations are difficult using SDS MELC. The effects of changing microemulsion
parameters such as pH, type of oil phase, amount of added anionic surfactant and
amount of added β-CD have been shown to be different to the effects observed with
SDS MELC and need to be examined further.
263
9.6 Conclusions
The use of β-cyclodextrin, sodium cholate and chiral 2-octanol as chiral microemulsion
components with both anionic and cationic microemulsions was unsuccessful for the
chiral separation of five pharmaceutical compounds. The test mixture of chiral
pharmaceutical compounds used in this initial study were selected from compounds
available in the laboratory and were not chosen based on chiral separations reported
using other techniques with particular chiral selectors. Further studies into chiral MELC
could be carried out using selected chiral compounds with chiral selectors which have
been reported to have worked using other techniques. Experimental parameters which
were not examined in this study were the use of lower column temperatures and longer
columns. Suppressed temperatures would slow down the solute mass transfer between
the droplets and stationary phase which may increase the difference in mass transfer of
enantiomers pairs, allowing chiral separation. Longer columns combined with lower
flow rates may also increase the enantioselectivity factor for enantiomer pairs.
The addition of each of the chiral components to the microemulsions had different
effects on chromatography and could be used as modifiers to optimise methods for
applied separations. The use of mixed SDS/SC microemulsions with a constant total
surfactant concentration were shown to yield very different selectivities for the test
mixture. Attempts to form a microemulsion using SC as the sole surfactant were not
successful and future studies using microemulsions with one chiral surfactant could be
carried out.
264
9.7 References
[1] Williams RW, Fu ZS, Hinze WL, J. Chromatogr. Sci. 28 (6), 292-302 (1990).
[2] Hinze WL, Williams RW, Fu ZS, et al. Colloids and Surfaces 48 (1-3), 79-94 (1990).
[3] Hu W, Takeuchi T, Haraguchi H, Chromatographia 33 (1-2), 58-62 (1992).
[4] Hu W, Takeuchi T, Haraguchi H, Chromatographia 33 (1-2), 63-66 (1992).
[5] Hu W, Takeuchi T, Haraguchi H J. High Res. Chromatogr. 15 (4), 275-277 (1992).
[6] Haupt D, Pettersson C, Westerlund D, Chirality 7 (1), 23-27 (1995).
[7] McEvoy E, Marsh A, Altria K, Donegan S, Power J, Electrophoresis 28 (1-2), 193-207
(2007).
[8] http://www.syrres.com/esc/physdemo.htm (21-04-08)
[9] Ahuja S, Prof Drug Subst, Excipients & Rel Methodology 14, 527-548 (1985).
[10] Ivan Miksík, Zdenek Deyl, J Chromatogr A 807(1), 111-119 (1998).
[11] Marsh A, Clark B, Altria K, Chromatographia, 59 (9-10), 531-542 (2004).
[12] Snyder LR, Glajch JL, Kirkland JJ, Practical HPLC Method Development 2nd Edition,
Wiley Interscience New York (1997) pp 173.
[13] McEvoy E, Donegan S, Power J, Altria K. Chromatographia 68, 49-56 (2008).

265
Chapter 10
Conclusions and Future Work

266
10.1 Thesis Summary
The use of microemulsions in separation science, particularly for use with CE and to a
lesser degree with LC have been reported with more regularity over the last number of
years. In Section One of this thesis, theoretical aspects of microemulsions and the
current state of knowledge of MELC and CE for pharmaceutical analysis have been
reviewed. The theoretical aspects of microemulsion formation were described in
Chapter One along with a current review of the use of microemulsions in liquid
chromatographic separations.
Chapter Two detailed various modes of CE used for a range of pharmaceutical analysis
applications and included an expanded section covering microemulsion electrokinetic
chromatography which reviewed the current state of MEEKC for a variety of
pharmaceutical separations.
Chiral separation is an application area of MEEKC which received considerable
attention in recent years. The variety and flexibility of chiral selectors which can be
incorporated into the microemulsion system and the speed of efficiency of the
separations along with its ability to separate more hydrophobic racemic components are
some advantages of this technique. As no reports of chiral MELC have appeared in the
literature, Chapter Three outlined the theory of chiral HPLC and the use of chiral
mobile phases together with a review of chiral microemulsion components with a view
to assessing the use of chiral microemulsions as mobile phases for chiral MELC
separations.
Chapter Four provided a brief review of current methods used for the characterisation of
microemulsion systems. To date, most reports of microemulsion characterisation have
related to drug delivery systems where knowledge about the microstructures of the
droplets and the dynamic behaviour which occurs within the system under different
conditions was extremely useful in evaluating and optimising the microemulsion
composition for intended applications. There have been few reports relating the
separations achieved using MEEKC and MELC to the microstructure of the
microemulsions used. The techniques and methods described in Chapter Four could be
used to provide valuable information about both MELC and MEEKC separation
mechanisms. Comprehensive studies relating the structural and dynamic characteristics
267
of microemulsions to MEEKC and MELC chromatographic behaviour caused by
changes in microemulsion composition and the addition of organic modifiers have not
yet been carried out. The techniques described in Chapter Four could be utilised to
provide information on droplet size, phase transitions, system stability, analyte diffusion
coefficients etc, to further expand the understanding and ability to predict MEEKC and
MELC separations.
The ability of O/W microemulsions to quickly solubilise very hydrophobic samples was
demonstrated in Chapter Five where two hydrophobic pharmaceutical formulations
containing commonly used drugs were rapidly analysed using optimised O/W MELC
methods. The lengthy sample preparation procedure required for a paracetamol
suppository was eliminated with the use of microemulsions as sample solvents and
mobile phases, while MELC analysis was completed using an internal standard in
approximately one minute using both anionic and cationic microemulsions. The
validation data obtained for each MELC method was very good and demonstrated the
potential of MELC for routine analysis of similar formulations.
In order to evaluate MEEKC methods for the analysis of hydrophobic pharmaceutical
preparations, cationic and anionic microemulsions were used to optimise MEEKC
methods for the analysis of paracetamol suppositories as described in Chapter Six.
Although the MEEKC technique was not comparable MELC, the microemulsions used
were very similar and required a substitution of the buffer to obtain a high pH. Again,
sample preparation was very easy and quick while method optimisation was
straightforward and resulted in rapid analysis times. The overall preparation and
analysis times were comparable to those obtained using MELC with similar validation
results.
The stabilities of a range of microemulsions under gradient MELC conditions were
assessed in Chapter Seven using surface tension measurements and turbidity
observations. The initial successful separation of paracetamol and five related
compounds using a gradient SDS MELC method was found to be irreproducible due to
the poor stability of the SDS microemulsion when subjected to gradient conditions.
When microemulsions formed with surfactants of various alkyl chain lengths were

268
examined for stability it was found that those with longer alkyl chains formed the most
stable systems and could be diluted to lower concentrations.
Of the microemulsions examined for stability, the one formed using the cationic CTAB
surfactant was found to be the most stable when diluted under gradient conditions.
Chapter Eight described the development of a novel MELC method using a diluted
CTAB microemulsion used isocratically for paracetamol stability indicating studies. As
described in the previous paragraph, poor SDS microemulsion stability would not allow
reproducible gradient separations. The stability problem was eliminated using a CTAB
microemulsion with gradient elution, however the dynamic adsorbed layer on the
column packing also made reproducible gradient separations extremely difficult. The
novel isocratic use of a diluted CTAB microemulsion circumvented both of these
problems and allowed detection of impurities spiked in a paracetamol suppository
sample at 0.1% levels. MEEKC comparison methods using both SDS and CTAB
microemulsions were quickly optimised to profile paracetamol for impurities. Method
development was very rapid compared to MELC and analysis times were very quick
however the poor method sensitivity would not allow detection of impurities at 0.1%
levels.
The solubilising powers of microemulsions with surfactants of different alky chain
lengths were assessed and it was found that CTAB had a much greater ability to
solubilise hydrophobic samples due to its C16 alkyl chain.
The use of chiral microemulsion components for the MELC separation of a number of
chiral pharmaceutical compounds was described in Chapter Nine. A chiral cyclodextrin
column was also assessed for the separation of the same test mixture. While the use of
cyclodextrin, chiral sodium cholate and chiral 2-octanol as chiral microemulsion
modifiers was unsuccessful for the enantioseparation of the test compounds, each
modifier had different effects on the separations achieved and could be utilised to
optimise methods for applied separations.
Introducing a microemulsion mobile phase to a chiral cyclodextrin column was found to
obstruct the chiral recognition sites of the bound cyclodextrin. Chiral selectivity which
269
was evident using standard aqueous/organic mobile phases was absent once the
microemulsion was introduced.
10.2 Conclusions
O/W MELC and MEEKC methods were developed for the analysis of highly
hydrophobic pharmaceutical formulations. Particular attention was paid to a suppository
formulation which contained highly hydrophobic excipients and required lengthy and
troublesome preparation and extraction procedures prior to analysis by standard
methods. Microemulsions prepared with the commonly used anionic SDS and less
common cationic CTAB surfactants were both found to achieve rapid sample
turnaround times with very agreeable validation results using both MELC and MEEKC
techniques. A second formulation, a topical cream containing ibuprofen, was also
rapidly analysed using an SDS MELC method. Sample preparation was again quick and
easy and was comparable to the reference assay method. Validation results were again
very good however further assessment of the techniques using the cream formulation
was not pursued in favour of the more hydrophobic suppository preparation. It was
concluded that O/W MELC and MEEKC were very well suited to the analysis of
hydrophobic formulations and dramatic reductions in sample preparation and analysis
times for other difficult hydrophobic formulations are possible.
Investigations into the suitability of MELC for stability indication of paracetamol found
that gradient elution using an SDS microemulsion was very useful to improve resolution
between closely eluting compounds. A major problem encountered during the gradient
study using an SDS microemulsion was very poor chromatographic reproducibility. An
experimental assessment of the turbidity and surface tension of the SDS microemulsion
when used under gradient conditions revealed that the system was not stable when
diluted by its aqueous phase and resulted in an emulsion system. The disruption to the
microemulsion system due to gradient dilution was found to be the main cause of the
poor chromatography as the column packing, pure microemulsion and constantly
changing diluted forms of the microemulsion system could never be at a constant
equilibrium.
When microemulsions prepared with equimolar amounts of CTAB, TTAB & DOTAB
surfactants and a mixed CTAB/Brij microemulsion were assessed for stability using
270
turbidity and surface tension, it was found that the CTAB microemulsion was the most
stable and remained as a clear system at all dilutions down to 10%. This microemulsion
was utilised for the gradient separation of paracetamol and its impurities, however
reproducing separations was again problematic and careful equilibration of the column
between injections was needed. Although the CTAB microemulsion was found to be
stable when used in gradient mode, it was concluded that the changing nature of the
adsorbed surfactant layer on the column packing due to the changing surfactant
concentration caused the loss of column/mobile phase equilibrium. Subsequent
investigations into the separation of paracetamol and five of its impurities found that the
isocratic use of a CTAB microemulsion at weaker concentrations can extend the
retention times of most compounds and improve resolution. It was found that more
stable microemulsions were formed using longer alkyl chain surfactants and allowed
dilution to lower concentrations. Although gradient MELC methods were investigated
using a number of different microemulsions, it was concluded that poor microemulsion
stability and the changing adsorbed surfactant layer on the column made gradient
elution unsuitable for microemulsion mobile phases. Using a longer alkyl chain
surfactant to prepare the microemulsion eliminated the stability problem, while using
isocratic elution with weaker microemulsion concentrations negated the equilibrium
problems caused by the changing surfactant concentration, allowing reproducible
separation and detection of paracetamol suppository samples spiked with 0.1% of each
impurity.
The MEEKC paracetamol stability indicating methods optimised using both CTAB and
SDS microemulsions were successful in resolving all compounds. The poor sensitivity
of the methods however would not allow detection of impurities in suppositories at
0.1% levels. Although the methods were optimised for suppository analysis, using
MEEKC for analyte stability indication in different hydrophobic formulations cannot be
ruled out and should be investigated, as method optimisation and monitoring the effects
of changing method parameters was found to be relatively quick and easy.
Although chiral microemulsions have been successfully utilised for enantioseparations
with MEEKC, attempts to achieve chiral resolution of pharmaceutical compounds using
MELC were unsuccessful. While the addition of chiral selectors had no effect on chiral
resolution, the various parameters studied were shown to affect the achiral behaviour of
271
the chosen analytes. The information obtained from the investigations carried out i.e.
effects of oil type/conc, surfactant type, cyclodextrin concentration, mixed surfactant
molar ratio etc could be used for future method optimisation. It was found that using a
chiral cyclodextrin column in conjunction with microemulsion and micellar mobile
phases resulted in a loss of chiral selectivity in the column. This was thought to be due
to hindrance of the chiral recognition sites on the cyclodextrin molecules by the
surfactant molecules. Further investigations into the cyclodextrin/surfactant interactions
are required before conclusions can be drawn as CDs have been successfully used as
chiral selectors for a number of MEEKC applications.
10.3 Evaluation and Comparison of MELC and MEEKC Techniques
10.3.1 O/W MELC using SDS and CTAB Microemulsions
The O/W MELC methods developed for the analysis of hydrophobic formulations
highlighted advantages of the technique over conventional sample preparation and
analytical methods. The greatest advantage was the elimination of lengthy sample
preparation procedures due to the high solubilising power of microemulsions for both
hydrophobic and hydrophilic samples. The additional method development options
made available due to the components in the microemulsion mobile phase and options
of using modifiers can be advantageous when optimising difficult separations. The
ability to use stable diluted microemulsions to improve isocratic resolution and achieve
reproducible results was also highlighted and could be used as method development
options for future work.
Although the advantages highlighted above are very beneficial, a number of operational
drawbacks to using microemulsions for LC separations were observed. Firstly, the
volume of microemulsion and time required to equilibrate a column with a
microemulsion mobile phase was very high. When using an SDS microemulsion
approximately 72 column volumes were required before equilibration was complete and
depending on the flow rate, could take up to three hours. The state of
column/microemulsion equilibrium needed to be closely monitored on a daily basis to
ensure chromatographic reproducibility. This caused method development to be quite
slow as column equilibration between changes in method and microemulsion
parameters was time consuming. When using CTAB microemulsions however, the
272
volume of mobile phase required for equilibration was approximately 24 column
volumes allowing more rapid method development.
UV detection below 200 nm was possible when using the SDS microemulsion however
a UV cut-off of 225 nm was observed for the CTAB microemulsion which can limit its
usefulness for some applications. The CTAB microemulsion had advantages over the
SDS microemulsion because of its greater solubilising power and superior stability
when used in diluted form.
The high column back pressures encountered when using microemulsion mobile phases
somewhat restricted the maximum flow rate which could be used. The SDS
microemulsion generated the highest back pressure but this could be controlled by using
elevated column temperatures. The CTAB microemulsion however generated lower
back pressure and allowed higher flow rates to be used at lower temperatures.
Investigations into the variation in column back pressure due to droplet size and
structure using microemulsion characterisation methods will be included in the future
work section. The use of monolithic silica columns can be used to achieve higher flow
rates at low temperatures without compromising column back pressure.
The effects of microemulsions on the LC instruments can be quite damaging if regular
cleaning and maintenance is not carried out. A constant flow of surfactant rich
microemulsions can cause a build up of surfactant around seals, connections, injection
ports & needles which may lead to blockages and instrument failure. Weekly flushing
with 2-propanol/methanol for 2 hours followed by methanol/water for two hours and
purging of the pump is recommended. Regular cleaning of filters, connections, ports &
needles and replacement of disposable frits is also recommended.
The order of elution and selectivity for the test compounds used in this study was
different for anionic and cationic microemulsions. This was probably due to the charges
on the surfactant head groups which created oppositely charged adsorbed layers on the
column packing for each surfactant, altering the solute/stationary phase interactions.
The difference in analyte elution due to the different microemulsion head group could
be utilised in future MELC method development.
273
10.3.2 O/W MEEKC using SDS and CTAB microemulsions
Microemulsions prepared with both SDS and CTAB microemulsions were used to
achieve very fast turnaround times using optimised MEEKC methods. As with the
MELC methods, the main advantage of the technique for analysing very hydrophobic
samples was the elimination of sample extraction and preparation procedures. CE
methods possess several generic advantages over HPLC methods including; low sample
and solvent consumption, low injection volumes, higher peak efficiency, the ability to
apply pressure across the capillary and quickly vary the capillary length and internal
diameter with little expense. All of these advantages were observed when comparing the
optimised MEEKC and MELC methods.
The main advantage of MEEKC over MELC was the speed and ease of method
development. As described in the previous section, MELC method development can be
very time consuming due to lengthy column equilibration requirements. Because of the
electrodriven separation mechanism employed with MEEKC, this problem was not
encountered and a greater range of development options could be examined in a shorter
time period. Microemulsion instability due to gradient dilution was not encountered
when conducting paracetamol impurity analysis as a neat microemulsion can be used for
all analyses and optimised separations achieved through adjusting instrument and buffer
parameters.
Although analysis times can be much shorter with CE techniques, the run times for
suppository analysis using both techniques were similar. The MEEKC separations of
paracetamol and its impurities achieved with SDS and CTAB microemulsions showed a
different migration order but the overall analysis times were very similar. As with the
CTAB MELC methods, the higher solubilising power of the longer alkyl chain
surfactant enabled higher concentrations of sample to be used. To date SDS has been
one of the most commonly used surfactants for MEEKC separations. While there have
been few reports of the use of CTAB microemulsions, its higher solubilising power
could make it more suitable for very hydrophobic formulations however its relatively
high UV cut-off (~225 nm) could be a limiting factor for its usefulness.
The main disadvantage encountered with the MEEKC methods was the poor sensitivity
of the UV detection method. Although successful separation of paracetamol and its

274
related compounds was achieved using both CTAB and SDS microemulsions, detection
of impurities at 0.1% levels was not possible. Options to improve detection sensitivity
are discussed in the next section.
10.4 Future Work
Of the few reports of microemulsions being used as developers in TLC, most have
examined the separation of amino acids using W/O microemulsion systems while no
investigations into the separation of pharmaceuticals have been reported. Tian & Xie [1]
investigated the use of both W/O and bicontinuous microemulsions as developers for
the separation of amino acids. The microemulsions prepared using CTAB were found to
be suitable for the TLC separation of several amino acid mixtures.
Mohammad Et al [2] used a silica gel stationary phase and a W/O SDS microemulsion
for the separation of L-tryptophan from other amino acids in the presence of metal
cation impurities. The same group [3] also reported on the use of mixed surfactant
systems using Triton-X-100 and SDS for the separation of lysine from other amino
acids using silica gel stationary phases. A report, also by Mohammed et al [4] described
the use of W/O microemulsions as developers for TLC separation of amino acids when
using silica gel plated impregnated with metal cations. One of the few reports of O/W
microemulsion TLC [5] described the separation of amino acids on alumina layers.
Cui et al [6] developed a microemulsion TLC method for fingerprinting the aqueous
extract of licorice. The optimised separation conditions were compared to conventional
TLC results and they reported that the microemulsion system was easier to operate, and
achieved higher resolution and better reproducibility than the conventional TLC
method.
A small amount of exploratory microemulsion TLC (ME-TLC) work for the separation
of pharmaceutical compounds was carried out during the course of the MELC and
MEEKC investigations described in this thesis. A number of different O/W
microemulsions were used as developers with silica gel stationary phases. Preliminary
results showed some migration of samples however the technique was not fully assessed
275
and should be the subject of future work using various microemulsion types and
compositions.
The investigations into microemulsion stability carried out in Chapter Seven utilised
turbidity and surface tension measurements to determine the breaking points of various
microemulsions used for MELC methods. Although the results obtained provided
valuable information about microemulsion stability, other characterisation methods such
as those described in Chapter Four could be utilised to gain further knowledge about the
system dynamics and changes to the microemulsion structure under diluted conditions.
Surfactant adsorption onto the column packing is a very important part of the separation
mechanism for MELC. The nature of the surfactant tail groups but more importantly the
head group charge and functional group interactions with the column packing and
analyte compounds should be investigated to further understand and predict MELC
separations. As with achiral columns, surfactant molecules adsorb onto chiral columns
such as the cyclodextrin column used for chiral MELC investigations in Chapter Nine.
The interactions between the column packing/cyclodextrin selectors and surfactant
molecules/microemulsion droplets & other microemulsion components need to be
investigated further to determine if chiral MELC is feasible. Introducing alternative
chiral stationary phases such as; bound protein phases, ligand exchange phases and
macrocyclic antibiotic phases for use with microemulsion mobile phases should be
considered. Alternative mobile phase selectors such as macrocyclic antibiotics and
chiral surfactants such as dodecoxycarbonylvaline (DDCV) could also be investigated.
Method development for MELC and MEEKC can involve numerous parameters to
investigate due to the numbers of microemulsion components and possible modifiers.
Prediction modelling techniques such as Artificial Neural Networks (ANN’s) and
method development software packages could be assessed to predict chromatographic
behaviour using analyte physicochemical information.
To date, the range of reported applications of MELC is quite small when compared to
MEEKC applications. Investigations into using MELC for a more diverse range of
applications such as liquid and solid vitamin supplements, beverages like beer, tea &
coffee, urine analysis, inks, dyes etc could be carried out.
276
The MEEKC separation of paracetamol and its related compounds in a suppository
sample described in Chapter Six was very straight forward and demonstrated the
suitability of the technique for rapid analyte stability indication in very hydrophobic
formulations. The successful separation was tainted however by the lack of detection
sensitivity for the impurities. Employing more sensitive detection methods like LIFD or
MS or utilising a high sensitivity detection cell could be used to improve detection
limits for such applications.
As described in Chapter Eight, the solubilising power of microemulsions depended on
the length of the surfactant alkyl chain. In terms of solubilisation capacities, a series of
different types of microemulsions and their solubilising capacity for a range of
pharmaceutical compounds and excipients could be assessed. In tandem with such a
study, various characterisation techniques such as NMR, SANS, SAXS, viscosity etc
could be carried out to expand the current knowledge on microemulsions used for
separation science.
Although there have been numerous MEEKC applications reported in the literature and
the number of MELC applications continues to grow, very little characterisation of the
microemulsion systems used has been carried out. A comprehensive characterisation
study to obtain information about the microemulsion droplet structure and size,
viscosity, density, analyte diffusion coefficients, interfacial film thickness and
curvature, conductivity, stability etc could yield valuable data for predicting and
increasing the understanding of MEEKC and MELC separation mechanisms.
As mentioned previously, MELC column equilibration using SDS microemulsion was
found to be very time consuming while equilibration using the CTAB microemulsion
took less than half the time and volume of mobile phase. A second comparison between
the two microemulsions was that lower column back pressures were encountered when
using CTAB microemulsion and allowed higher flow rates than the SDS system. The
composition of the microemulsions differed only in the type of surfactant used. Equal
weights of aqueous phase, oil phase and cosurfactant were used with equimolar amounts
of each surfactant. The differences in equilibration time between both systems should be
examined to establish an understanding of the main factors affecting
microemulsion/column equilibration i.e. head group functionality, alkyl chain length
277
etc. Physical characterisation of both systems using density, viscometry, particle size
analysis, conductivity etc could be used to establish an in depth knowledge of each
system and explain differences in back pressures/viscosity and particle size/dispersity.
The information obtained could be beneficial for method development and prediction of
both MELC and MEEKC separations.
10.5 References
[1] Tian D, Xie HQ, J Liq Chrom & Rel Tech, 31 763-771 (2008).
[2] Mohammad A, Hena S, Bhawani SA, Indian J Chem A, 46, 1663-1666 (2006).
[3] Mohammad A, Laeeq S, J Planar Chrom TLC, 20, 423-427 (2007).
[4] Mohammad A, Agrawal V, Kumar S, J Planar Chrom TLC, 16, 220-226 (2003).
[5] Mohammad A, Agrawal V, Indian J Chem A, 40, 1131-1134 (2001).
[6] Cui S, Fu B, Lee FSC, Wang X, J Chrom B, 828, 33-40 (2005).

278
Appendix
Publications


![High Performance Liquid Chromatography Incorporating to ...liquid chromatography [1-5, 7, 9, 15-20], gas chromatography [12, 21], micellar electrokinetic capillary chromatography [22],](https://static.fdocuments.net/doc/165x107/609dca3350c83715332046f7/high-performance-liquid-chromatography-incorporating-to-liquid-chromatography.jpg)


