The determination of digestibility of Atriplex nummularia ...
135
The determination of digestibility of Atriplex nummularia cv. De Kock with different techniques by Annelize van der Baan Submitted in partial fulfilment of the requirements for the degree M.Sc. (Agric)(Animal Nutrition) in the Department of Animal and Wildlife Sciences Faculty of Natural and Agricultural Science UNIVERSITY OF PRETORIA Pretoria Supervisor : Prof. W.A. van Niekerk Co-supervisor : Prof. N.F.G. Rethman July 2008 © University of Pretoria
Transcript of The determination of digestibility of Atriplex nummularia ...

The determination of digestibility of Atriplex
nummularia cv. De Kock with different techniques
by
Annelize van der Baan
Submitted in partial fulfilment of the requirements for the degree
M.Sc. (Agric)(Animal Nutrition)
in the
Department of Animal and Wildlife Sciences
Faculty of Natural and Agricultural Science
UNIVERSITY OF PRETORIA
Pretoria
Supervisor : Prof. W.A. van Niekerk
Co-supervisor : Prof. N.F.G. Rethman
July 2008
©© UUnniivveerrssiittyy ooff PPrreettoorriiaa
DECLARATION
I declare that this dissertation, for the degree M.Sc. (Agric) at the
University of Pretoria, has not been submitted by me for a degree
at any other university.
A. van der Baan
Pretoria
2008
CONTENTS
ACKNOWLEDGEMENTS I
ABSTRACT II - III
UITTREKSEL IV - V
LIST OF TABLES V - VI
LIST OF FIGURES VII - X
LIST OF ABBREVIATIONS XI - XII
CHAPTER 1……………………………………………………………………… 1
Introductory background on Atriplex species
1.1 Characteristics of plants
1.2 Propagation
1.3 Nutritional value
1.4 Conclusion
CHAPTER 2………………………………………………………………………10
Literature review of the in vivo digestibility technique
2.1 Calculation of digestibility
2.1.1 Direct method
2.1.2 Difference method
2.1.3 Regression method
2.1.4 Indirect method
2.2 Conducting a digestibility experiment
2.3 Sources of variation in in vivo digestibility
2.3.1 Particle size
2.3.2 Level of feeding
2.3.3 Associative effects between feeds
2.3.4 Chemical treatment
2.3.5 Miscellaneous
2.4 Conclusion
CHAPTER 3 …………………………………………………………………….19
Literature review of the in situ technique
3.1 Conclusion
CHAPTER 4………………………………………………………………………27
Different laboratory techniques to determine the digestibility of
Atriplex nummularia cv. De Kock
General introduction
4.1 The evaluation of the in vitro rumen liquor digestibility
technique……………………………………………………29
4.1.1 Activity of inoculum
4.1.2 Processing of rumen fluid
4.1.3 Diet of donor animals
4.1.4 Collecting and handling of rumen fluid
4.1.5 Sample preparation
4.1.6 Type of animal
4.1.7 Modifications
4.1.8 Advantages & disadvantages
4.2 The evaluation of the in vitro faecal liquor
technique …………………………………………………..37
4.2.1 Factors affecting the activity of faecal liquor
4.2.1.1 Source of faeces
4.2.1.2 Effect of diet
4.2.1.3 Age of faeces
4.2.1.4 Choice of buffer
4.2.1.5 Separation of bacteria
4.2.1.6 Faeces-to-buffer ratio
4.2.1.7 Addition of Nitrogen
4.2.1.8 Mixing of sample and faeces liquor
4.2.1.9 Duration of incubation
4.2.2 Use of faecal fluid inoculum for gas production
4.2.3 Microbial population
4.2.4 Factors affecting the second stage incubation
4.3 The evaluation of the in vitro enzyme
technique……………………………………………………. 45
4.3.1 Sources of enzymes
4.3.2 Different pre-treatments on cellulase digestion
4.3.2.1 Incubation with acid pepsin
4.3.2.2 Neutral-detergent extraction
4.3.2.3 Hot-acid extraction
4.4 The evaluation of the in vitro gas production
technique……………………………………………………..51
4.4.1.1 Early techniques
4.4.1.2 The Hohenheim gas test
4.4.1.3 The manual transducer technique
4.4.1.4 The automated systems
4.4.2 Origin of gas
4.4.3 Factors that have an influence on the gas
production technique
4.4.3.1 Sample characteristics
4.4.3.2 Inoculum characteristics
4.4.3.3 Diet
4.4.3.4 Media composition
4.4.4 Some correlations with other techniques
4.4.5 Advantages and disadvantages of the gas
production technique
4.4.6 Applications of the gas production technique
CHAPTER 5………………………………………………………………………..65
Materials & methods of the different techniques used to determine
the digestibility of A. nummularia cv. De Kock
5.1 Experimental materials
5.2 In vivo digestibility trial
5.3 Analytical methods
5.3.1 Dry matter (DM) concentration
5.3.2 Neutral detergent fibre (NDF) concentration
5.3.3 Apparent digestibilities
5.4 In vitro digestibility trials
5.4.1 The in vitro rumen fluid technique (Tilley & Terry
(1963), as modified by Engels & Van der Merwe
(1967))
5.4.2 The in vitro faeces fluid technique (El Shaer et
al., 1987)
5.4.3 The in vitro gas production technique (Pienaar,
1994)
5.4.4 The in vitro cellulase technique (De Boever et al.,
1986)
5.4.5 The in vitro cellulase technique (Wageningen
Institute of Animal Science, The Netherlands)
5.5 Statistics
CHAPTER 6………………………………………………………………………71
Results & discussion of using different techniques to determine
the digestibility of A. nummularia cv. De Kock
6.1 The Tilley & Terry (1963) rumen fluid in vitro technique.
6.2 The in vitro faeces fluid technique (El Shaer et al., 1987)
6.3 The in vitro gas production technique (Pienaar, 1994)
6.4 The in vitro cellulase technique (De Boever et al., 1986)
and the in vitro cellulase technique (Wageningen
Institute of Animal Science, The Netherlands)
6.5 Dry matter digestibility
CHAPTER 7………………………………………………………………………..94
General conclusion on the different techniques used to
determine the digestibility of A. nummularia cv. De Kock
REFERENCES……………………………………………………………………101
APPENDIX………………………………………………………………………..115
I
ACKNOWLEDGEMENTS
“Aan God Alle Eer”
I wish to thank the following people without whom the successful
completion of this study would not have been possible.
• My supervisor, Prof W.A. van Niekerk, and co-supervisor, Prof N.F.G.
Rethman, for guidance and the utmost patience with this study.
• Mr. R.J. Coertze for the help in the statistical analysis of the data.
• The co-operation of the late Dr. E. Birnbaum and Dr A. Degen, of the Ben
Gurion University of the Negev, in this joint programme (funding by US-
AID – CDR Program, Project nr. TA – Mou 99C16-091) is acknowledged.
• All my friends who made student life the best years of my life.
• And last, but most certainly not least, my mom. Without her by my side I
could not have been where I am today. Thanks for everything.
II
ABSTRACT
The determination of digestibility of Atriplex nummularia cv. De Kock
with different techniques
by
A. van der Baan
Supervisor : Prof. W.A. van Niekerk
Co-supervisor : Prof. N.F.G Rethman
Department : Animal and Wildlife Sciences
Faculty of Natural and Agricultural Science
University of Pretoria
Pretoria
Degree : M.Sc (Agric)(Animal Nutrition)
The aim of the study was to determine the digestibility of Atriplex nummularia
cv. De Kock, supplemented with three levels (15%, 30%, and 45%) of either
maize or barley, using different in vitro techniques. An in vivo digestibility trial
was conducted, together with a number of in vitro trials.
An important development has been the introduction of biological methods
(Jones & Theodorou, 2000). Three digestion techniques that simulate the
digestion process are currently available to determine the nutritive value of
ruminant feeds:
1. Digestion with rumen micro-organisms as in the work of Tilley & Terry
(1963) or gas method (Menke et al., 1979). Digestion with faeces micro-
organisms (El Shaer et al., 1987), as an alternative to rumen fluid
inoculum.
2. Cellulase methods
III
3. In situ incubations of samples in nylon bags in the rumen.
The results of this study showed no significant difference (P>0.05) between
the rumen- and faeces inoculum in vitro techniques, but they did differ
significantly from the gas production and cellulase techniques. There was also
no significant difference between the gas production and cellulase techniques.
Organic matter digestibility (OMD %) of the in vitro techniques differed
significantly from the in vivo OMD % values.
There are several possible explanations for the difference between the in vivo
and in vitro OMD %. 1. Practical mistakes could have been made. 2. The
simulation of the rumen motility in vitro is often difficult and it may be that all
the feed particles did not have the same exposure to the micro-organisms, as
it would have in the rumen of an animal. The different rumen pools are also
not fully represented in vitro. 3. The fermentation characteristics and microbial
constitution of the rumen inocula differ, between the animal used for the in
vivo digestibility trial and the animals used for rumen inocula collection. 4.
With in vivo digestibility the time of digestion is not known, and therefore the
time of rumen and gastric digestion in vitro could have been too long or too
short.
It was found that the in vitro faeces technique of El Shaer et al., (1987) is an
easier and cheaper alternative to the classic rumen fluid in vitro technique of
Tilley & Terry (1963), as modified by Engels & Van der Merwe (1967). The in
vitro faeces technique uses faeces as an inoculum and therefore solves the
problems associated with the use of cannulated animals. The gas production
in vitro technique has certain advantages, but still has the disadvantage of
needing cannulated animals for rumen inocula. The cellulase-based in vitro
technique in contrast eliminates the use of cannulated animals. Although the
in vitro gas production technique of Pienaar (1994) and the cellulase in vitro
technique could both be used to determine the OMD % of Atriplex nummularia
cv. De Kock, the values will be lower than in vivo determinations.
IV
UITTREKSEL
Die bepaling van die verteerbaarheid van Atriplex nummularia cv. De
Kock deur gebruik te maak van verskillende tegnieke
deur
A. van der Baan
Studieleier : Prof. W.A. van Niekerk
Medeleier : Prof. N.F.G Rethman
Departement : Vee- en Wildkunde
Fakulteit Natuur- en Landbouwetenskap
Universiteit van Pretoria
Pretoria
Graad : M.Sc (Agric)(Dierevoeding)
Die doel van die studie was om te bepaal wat die verteerbaarheid van Atriplex
nummularia cv. De Kock, gesupplementeer met drie vlakke (15%, 30%, en
45%) van mielies of gars sal wees, deur verskillende laboratorium tegnieke te
gebruik. ‘n In vivo verteringsproef is saam met verskeie in vitro proewe
gedoen.
‘n Belangrike ontwikkeling was die bekendstelling van biologiese metodes
(Jones & Theodorou, 2000). Drie verteringstegnieke wat die verteringsproses
simuleer is huidiglik beskikbaar om die voedingswaarde van herkouervoere te
bepaal:
1. Vertering met rumen mikrobes soos in die studie van Tilley & Terry (1963)
of die gasproduksie metode (Menke et al., 1979). Vertering met mikrobes
V
vanaf mis, word as alternatief vir rumenvloeistof inokulum gebruik (El
Shaer et al., 1987).
2. Sellulase metodes
3. In situ inkubasies van monsters in nylon sakkies in die rumen.
Die resultate van hierdie studie het geen betekenisvolle verskille (p>0.05)
tussen die rumen- en mis inokulum in vitro metodes getoon nie, maar het van
die gasproduksie en sellulase metodes verskil. Daar was ook geen
betekenisvolle verskille tussen die gasproduksie en sellulase metodes nie.
Organiese materiaal verteerbaarheid % (OMV %) van die in vitro metodes het
betekenisvol van die in vivo OMV % waardes verskil.
Daar is veskeie moontlikhede wat vir die verskille tussen die in vitro en in vivo
OMV % verantwoordelik kon wees. 1. Praktiese foute kan gemaak word. 2.
Die simulasie van die rumen motiliteit in vitro is nie maklik nie en al die
voerpartikels het nie dieselfde blootstelling aan die mikrobe aktiwiteit, soos in
die rumen gehad nie. 3. Die verskillende rumenpoele word nie ten volle
verteenwoordig in vitro nie. 4. Die verteringseienskappe van die rumen
inokulum verskil, tussen die diere gebruik vir die in vivo verteringsproef en die
diere gebruik vir die kolleksie van rumen inokulum. 5. Met die in vivo tegniek
is die verteringstyd nie bekend nie en dus kan die in vitro rumen- en
verteringstyd te kort of te lank wees.
Die resultate het getoon dat die in vitro faeces metode van El Shaer et al.
(1987) ‘n makliker en goedkoper alternatief is vir die klassieke rumenvloeistof
in vitro metode van Tilley & Terry (1963), soos gemodifiseer deur Engels &
Van der Merwe (1967). Die in vitro faeces metode gebruik faeces as inokulum
en dit is dus ‘n oplossing vir die probleme geassosieerd met die gebruik van
gekannuleerde diere. Die gas produksie in vitro metode het sekere voordele,
maar daar word steeds van gekannuleerde diere vir die verkryging van rumen
inokulum gebruik gemaak. Alhoewel die in vitro gasproduksie metode van
Pienaar (1994) en die sellulase in vitro metode gebruik kon word vir die
bepaling van OMV% van Atriplex nummularia cv. De Kock, was die waardes
laer as die in vivo bepalings.

VI
LIST OF TABLES
Table 1.3.1 The average composition of A. nummularia on a dry matter
basis ……………………………………………………………………...3
Table 1.3.2 Mean crude protein (CP), ash and in vitro apparent digestibility
of A. nummularia. A. canescens and Cassia sturtii………………..4
Table 1.3.3 Mean levels of ash, crude protein (CP), acid detergent fibre
(ADF), neutral detergent fibre (NDF), lignin and crude fat (CF) in
A. nummularia.…………………………………………………………..4
Table 1.3.4 Mean levels of sodium (Na), calcium (Ca), potassium (K),
magnesium (Mg) and phosphorus (P) and ratios of Na to K
(ionic equivalents) in A. nummularia…………….…………………4
Table 3.1 Factors affecting the accuracy of the in situ rumen
degradability……………………………………………………………...24
Table 6.1.1 A comparison between the Tilley & Terry (1963) rumen fluid in
vitro technique and in vivo data, to determine the predicted
organic matter digestibility (OMD) of A. nummularia cv. De Kock
supplemented with different levels of maize and barley…………71
Table 6.1.2 A comparison between the Tilley & Terry (1963) rumen fluid in
vitro technique and in vivo data, to determine the organic matter
digestibility (OMD) of A. nummularia cv. De Kock over all the
different levels of supplementation….………………………………75
Table 6.2.1 A comparison between the in vitro faeces fluid technique (El
Shaer et al., 1987) and in vivo data, to determine the predicted
organic matter digestibility (OMD) of A. nummularia cv. De Kock
supplemented with different levels of maize and barley…………77

VII
Table 6.2.2 A comparison between the in vitro faeces fluid technique (El-
Shaer et al., 1987) and in vivo data, used to determine the organic
matter digestibility (OMD) of A. nummularia cv. De Kock over all
the different levels of supplementation…………….……………...80
Table 6.3.1 A comparison between the in vitro gas production technique
(Pienaar, 1994) and in vivo data, to determine the predicted
organic matter digestibility (OMD) of A. nummularia cv. De Kock
supplemented with different levels of maize and
barley……………………………………………………………………81
Table 6.3.2 A comparison between the in vitro gas production technique and
in vivo data, used to determine the organic matter digestibility
(OMD) of A. nummularia cv. De Kock over all the different levels
of supplementation……………………………………………………...85
Table 6.4.1 A comparison between two different cellulase techniques and in
vivo data to predict the organic matter digestibility (OMD) of A.
nummularia cv. De Kock, supplemented with different levels of
maize and barley……………………………………………...87
Table 6.4.2 A comparison between the two cellulase in vitro techniques and
in vivo data, used to determine the organic matter digestibility
(OMD) of A. nummularia cv. De Kock, over all the different levels
of supplementation……………………………………………………...92
Table 7.1 A comparison between the different in vitro techniques to
determine which gives the best prediction of the organic matter
digestibility (OMD) of A. nummularia cv. De Kock supplemented
with different levels of maize and barley…………………………….94
VIII
LIST OF FIGURES
Figure 3.1 Degradation of a typical roughage diet expressed by the formula
p=a+b (1-e-ct)………………………………………………………….…..20
Figure 3.2 Degradation of a roughage diet in a rumen in which the rumen
microbial environment is optimal (A) and suboptimal (B). Note
intercept and asymptote are similar…………………………………23
Figure 6.1.1 A relationship between the Tilley & Terry (1963) in vitro technique
and in vivo data, for the determination of a regression to predict
organic matter digestibility (OMD) of A. nummularia cv. De Kock,
supplemented with different levels of maize and barley…………72
Figure 6.1.2 A comparison between the different levels of maize and barley
supplementation (%) of A. nummularia on the in vitro OMD %,
with the in vitro Tilley & Terry (1963) technique……………………74
Figure 6.1.3 A comparison between the different levels of maize and barley
supplementation (%) of A. nummularia on the in vivo OMD %,
with the in vivo technique……………………………………………...75
Figure 6.2.1 A relationship between the faeces fluid in vitro technique (El-
Shaer et al., 1987) and in vivo data, for the determination of a
regression to predict organic matter digestibility (OMD) of A.
nummularia cv. De Kock, supplemented with different levels of
maize and barley…………………………………………………………78
Figure 6.2.2 A comparison between the different levels of maize and barley
supplementation (%) of A. nummularia on the in vitro OMD %,
with the faeces fluid in vitro technique………………………………79
Figure 6.2.3 A comparison between the different levels of maize and barley
supplementation (%) of A. nummularia on the in vivo OMD % in
vivo technique……………………………………………………………79
IX
Figure 6.3.1 The relationship between the in vitro gas production technique
(Pienaar, 1994) and in vivo data, for the determination of a
regression to predict organic matter digestibility (OMD) of A.
nummularia cv. De Kock, supplemented with different levels of
maize and barley…………………………………………………………82
Figure 6.3.2 A comparison between the different levels of maize and barley
supplementation (%) of A. nummularia on the in vitro OMD %,
with the in vitro gas production technique…………………………84
Figure 6.3.3 A comparison between the different levels of maize and barley
supplementation (%) of A. nummularia on the in vivo OMD %,
with the in vivo technique……………………………………………...84
Figure 6.4.1 Relationship between the in vitro cellulase technique (De Boever
et al., 1986) and in vivo data, for the determination of a regression
to predict matter digestibility (OMD) of A. nummularia cv. De
Kock, supplemented with different levels of maize and
barley………………………………………………………………………88
Figure 6.4.2 A relationship between the in vitro cellulase technique
(Wageningen) and in vivo data, for the determination of a
regression to predict organic matter digestibility (OMD) of A.
nummularia cv. De Kock, supplemented with different levels of
maize and barley…………………………………………………………89
Figure 6.4.3 A comparison between the different levels of maize and barley
supplementation (%) of A. nummularia on the in vitro OMD %,
with the in vitro cellulase technique (De Boever, 1986)…………..90
Figure 6.4.4 A comparison between the different levels of maize and barley
supplementation (%) of A. nummularia on the in vitro OMD %,
with the in vitro cellulase technique (Wageningen)……………….91

XI
Figure 6.4.5 A comparison between the different levels of maize and barley
supplementation (%) of A. nummularia on the in vivo OMD %,
with the in vivo technique……………………………………………...91
XI
LIST OF ABBREVIATIONS
D - Digestibility
DM - Dry matter
OM - Organic matter
DMD - Dry matter digestibility
OMD - Organic matter digestibility
DOM - Digestible organic matter
DOMD - Digestible organic matter in the dry matter
DCP - Digestible crude protein
TDN - Total digestible nutrients
NDF - Neutral detergent fibre
ADF - Acid detergent fibre
CP - Crude protein
CF - Crude fibre
Na - Sodium
Ca - Calcium
K - Potassium
Mg - Magnesium
P - Phosphorus
N - Nitrogen
CO2 - Carbon dioxide
mg -milligram
NH3 -Ammonia
LW - Liveweight
rpm - Revolutions per minute
H - Hour
µm - micrometres
cm - Centimetres
mm - Millimetres
g - gram
kg - Kilogram
XII
g/l - gram per litre
l - litre
ha - hectare
ME - Metabolisable energy
MJ - Mega joule
VFA - Volatile Fatty Acid
SCFA - Short-chain Fatty Acid
1
CHAPTER 1
INTRODUCTORY BACKGROUND ON ATRIPLEX SPECIES
The main limitations to animal production in the arid and semi-arid regions, is
the scarcity of green forage. In addition, the natural rangeland, which is the
basal diet of sheep, is usually overgrazed. Thus, sheep have to survive on a
low quality diet throughout most of the year (Ben Salem et al., 2002a). There
is, therefore, an urgent need for an improvement in feed resources in the arid
and semi-arid regions of the country (Aganga et al., 2003).
1.1 Characteristics of plants
According to Breytenbach et al. (1997), Atriplex nummularia is a perennial
shrub, belonging to the family Chenopodiaceae, which is indigenous to
Australia and has been found in South Africa for over a hundred years. It can
reach a height of three metres (m) and can also develop into bushes of about
three metres in diameter. The root system consists of a well-developed
taproot with horizontal, lateral roots, and is suberized. The leaves are almost
round, blue-grey and covered with a white layer and small saltcells. Male and
female flowers are carried on different plants, but are occasionally found on
the same plant. The small, round yellow-brown male flowers are borne in
clusters, 75 –100 millimetres (mm) in length, on the tips of the branches.
Female flowers are grey-green of colour and borne in dense clusters.
Pollination is by wind. The seed consists of two leathery, or papery, scale
leaves, which have grown together around a small, round red-brown seed.
There is a high concentration of sodium chloride (normal salt) in the scale
leaves, which inhibits germination. The salt needs to be leached out before
germination can take place. There should, therefore, be enough moisture
available for the seeds to germinate.
A. nummularia is halophytic, or salt loving, and, because of the high salt
concentration in the roots and leaves, the cell sap has a high osmotic value. It
is this physiological adaptation that makes the plant drought resistant. It also
functions very well under high temperatures and high light intensity.

2
A. nummularia is adapted to a wide variety of climatic conditions and also
resistant to cold and frost. It will grow on a variety of soil types, even on bare
patches of brackish soil and heavy clay soils with poor drainage. The type of
soil determines the salt concentration in the plants. Acid and leached sandy
soils contain too little sodium- and potassium salts for good production. Plants
on brackish soils are, however, less palatable, than those on better soils
(Breytenbach et al., 1997).
1.2 Propagation
To establish A. nummularia, it is better to cultivate the plants in a seedbed or
holders, and then transplant the seedlings at a later stage, rather than to
directly sow the seed in the ground. The seed should be soaked in water for
two to three days before sowing, to leach out the salt in the seed coat. The
optimum temperature for germination is 15 to 20ºC and the seed must not be
planted more than 5mm deep. Sow in August or September and keep the soil
moist. When the plants reach the height of 150 to 200 mm, it can be bedded
out (Breytenbach et al., 1997).
Breytenbach et al. (1997) recommends that A. nummularia should be
established during the late summer or autumn (February or March), under
dryland conditions, when the plants are big enough and when there was
enough rain. Under irrigation, or when there is sufficient rain earlier in the
season, the plants can be bedded out at an earlier age. When the seedlings
are bedded out, care should be taken that the roots are not damaged or
desiccated. The furrows are made 2 m apart and the plants are planted 1 to 2
m apart in the furrows. Depending on the spacing, 2500 to 5000 plants are
required per hectare. Under dry land conditions good establishment can be
obtained by the application of 1 litre of water per plant when it is bedded out,
followed by two litres ten days later and again two litres 20 days later.
When the plants are well established, seed can be harvested during the
second growth season for further expansion of the plantation. The seed can
be kept in airtight holders for up to three years. After that germination will
decline.
3
A. nummularia can also be propagated by means of cuttings. Young stems
should be thicker than 6 mm and 250 mm in length, and planted in sandy soil.
Leave a twig or a leaf on the tip of the cutting. Keep the cuttings moist and
after six weeks roots will develop and it can be bedded out after a further four
weeks (Breytenbach et al., 1997).
Breytenbach et al. (1997) also recommended that A. nummularia should not
be grazed in the first season after establishment. After that it could be grazed
to encourage the development of a bushy growth form. Plants that are not
grazed will grow too tall and sheep can not reach the younger growth. Such
plants should be trimmed to a height of 1.5 metres. Sufficient drinking water
should be supplied to animals grazing saltbush, because they get thirsty due
to the high salt concentrations in these plants. The water should also not
contain high levels of salt, because brackish water will inhibit the intake of
saltbush.
A. nummularia is not a very palatable plant and animals must learn to eat it. It
should not be in the same camp as other more palatable plants as this may
lead to poor utilisation of saltbush and to overgrazing of the other more
palatable plants. Saltbush can be grazed at any time of the year, but rotational
grazing should be implemented to give the plants some chance to recover
from such defoliation.
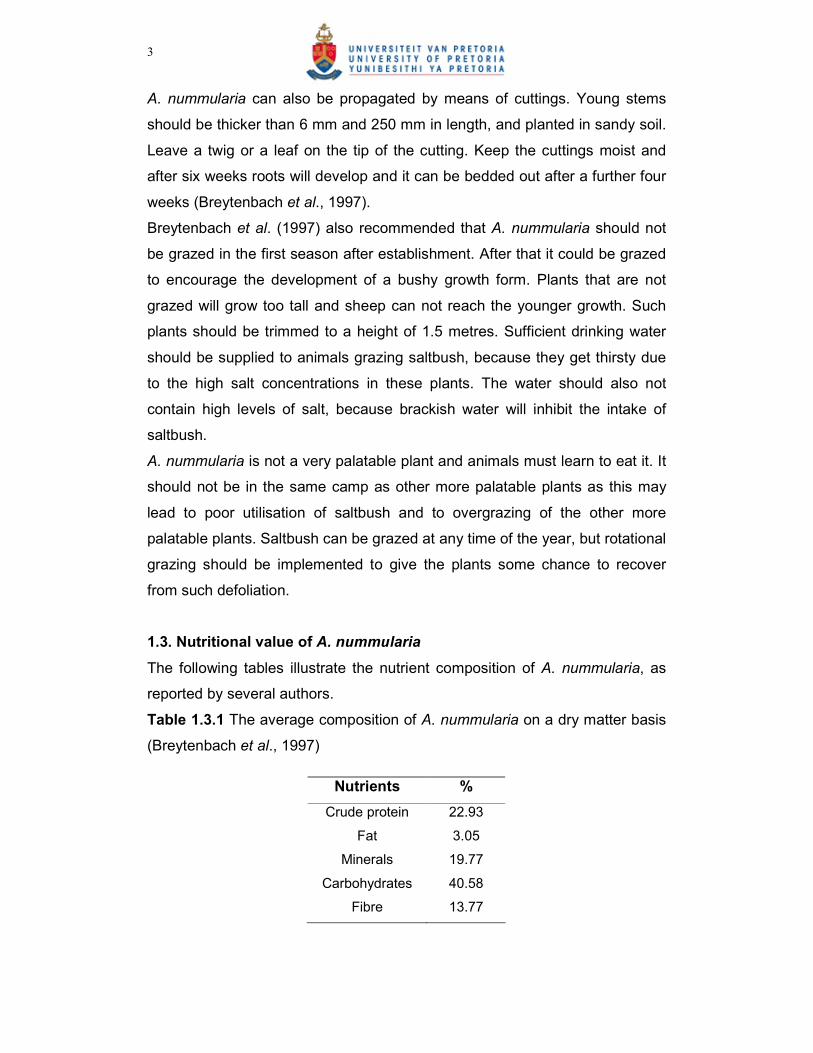
1.3. Nutritional value of A. nummularia
The following tables illustrate the nutrient composition of A. nummularia, as
reported by several authors.
Table 1.3.1 The average composition of A. nummularia on a dry matter basis
(Breytenbach et al., 1997)
Nutrients %
Crude protein 22.93
Fat 3.05
Minerals 19.77
Carbohydrates 40.58
Fibre 13.77
4
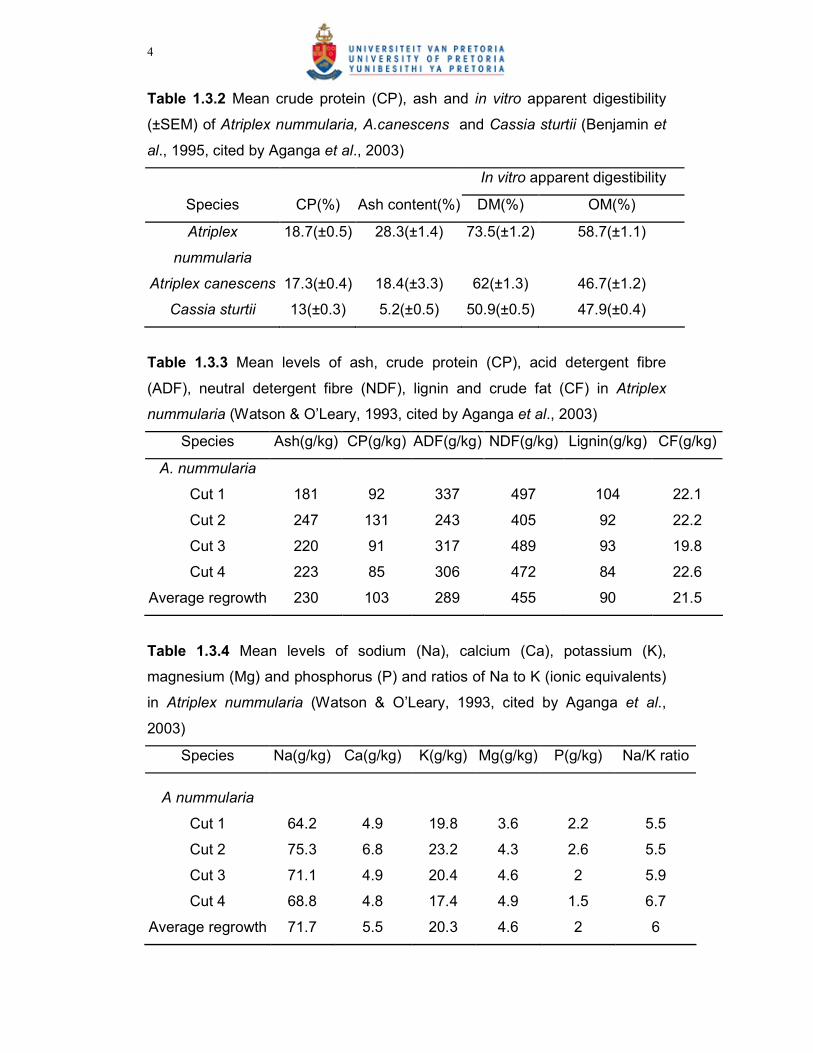
Table 1.3.2 Mean crude protein (CP), ash and in vitro apparent digestibility
(±SEM) of Atriplex nummularia, A.canescens and Cassia sturtii (Benjamin et
al., 1995, cited by Aganga et al., 2003)
In vitro apparent digestibility
Species CP(%) Ash content(%) DM(%) OM(%)
Atriplex
nummularia
18.7(±0.5) 28.3(±1.4) 73.5(±1.2) 58.7(±1.1)
Atriplex canescens 17.3(±0.4) 18.4(±3.3) 62(±1.3) 46.7(±1.2)
Cassia sturtii 13(±0.3) 5.2(±0.5) 50.9(±0.5) 47.9(±0.4)
Table 1.3.3 Mean levels of ash, crude protein (CP), acid detergent fibre
(ADF), neutral detergent fibre (NDF), lignin and crude fat (CF) in Atriplex
nummularia (Watson & O’Leary, 1993, cited by Aganga et al., 2003)
Species Ash(g/kg) CP(g/kg) ADF(g/kg) NDF(g/kg) Lignin(g/kg) CF(g/kg)
A. nummularia
Cut 1 181 92 337 497 104 22.1
Cut 2 247 131 243 405 92 22.2
Cut 3 220 91 317 489 93 19.8
Cut 4 223 85 306 472 84 22.6
Average regrowth 230 103 289 455 90 21.5
Table 1.3.4 Mean levels of sodium (Na), calcium (Ca), potassium (K),
magnesium (Mg) and phosphorus (P) and ratios of Na to K (ionic equivalents)
in Atriplex nummularia (Watson & O’Leary, 1993, cited by Aganga et al.,
2003)
Species Na(g/kg) Ca(g/kg) K(g/kg) Mg(g/kg) P(g/kg) Na/K ratio
A nummularia
Cut 1 64.2 4.9 19.8 3.6 2.2 5.5
Cut 2 75.3 6.8 23.2 4.3 2.6 5.5
Cut 3 71.1 4.9 20.4 4.6 2 5.9
Cut 4 68.8 4.8 17.4 4.9 1.5 6.7
Average regrowth 71.7 5.5 20.3 4.6 2 6

5
The stage of growth and maturity has a considerable affect on the nutritive
value, palatability and utilisation of Atriplex spp. These plants are nutritious in
the wet seasons, while they are relatively poor in nutritive value during the dry
season (El Shaer et al., 2000). The green material usually has a mean value
of 74.71% moisture and 25.29% dry matter (Breytenbach et al., 1997).
Glenn et al. (1998) found that A. nummularia had a high crude protein and
digestible matter content, low fibre and a moderate ash content. Although the
crude protein content was somewhat lower than that of alfalfa (10 vs. 13%)
and the mineral content was higher (15 vs. 10%), A. nummularia yielded
much more crude protein and organic matter, than alfalfa per unit area, due to
its high biomass yield. Ben Salem et al. (2002a) found that the consumable
parts of A. nummularia were high in crude protein, fibre and sodium, but
relatively low in carbohydrates.
Like most halophytes, the ash content of Atriplex spp. is high relative to the
non-halophytic species. Because of its high ash content, the energy value of
Atriplex is low and animals must have a relatively high water intake in order to
excrete the ingested salt (Ben Salem et al., 2002b; El Aich, 1987, as cited by
Aganga et al., 2003).
The digestibility of Atriplex spp. averaged 59% in spring and 46% in summer.
The intake of Atriplex spp. varied within the range of 50-55 DM/kg LW0.73
(Aganga et al., 2003). From Table 1.3.2 it can be seen that A. nummularia
has a high digestibility and this is due to the salt concentration in the leaves
(Benjamin et al., 1995, as cited by Aganga et al., 2003).
Several methods of feeding Atriplex spp. to animals have been investigated.
Atriplex. spp. were either used for a nitrogen (N) supplementation or
supplemented with an energy source.
It has been observed, that although sheep maintain their liveweight while
grazing Atriplex spp. they invariably lose condition (Casson et al., 1996, as
cited by Hopkins & Nicholson, 1999). This is attributed to a large increase in
water intake (Atiq-Ur-Rehman et al., 1994, as cited by Hopkins & Nicholson,
1999), to counter the high amount of sodium and potassium salts found in
Atriplex spp. (Wilson, 1996). Swingle et al. (1996), on the other hand, have

6
shown that Atriplex and other halophyte biomass, containing up to 30%
mineral content, can replace conventional forages at a 30% inclusion rate in
fattening rations for ruminants, with no decrease in weight gain or carcass
quality. Valderràbano et al. (1996) also found that feeding Atriplex spp. did not
affect body weight. These researchers suggested that a sole diet of A.
halimus may be used to maintain sheep and goats, without an energy
supplement until animal requirements are higher, due to pregnancy and milk
production.
Hopkins & Nicholson (1999) fed saltbush and supplemented it with either hay
or grain, to lambs and found that an acceptable meat quality could be
produced. The results were compared to lambs fed on lucerne. Based on
objective and subjective criteria, it is concluded that fat colour problems are
unlikely to occur when lambs are fed on saltbush and that cooked meat taken
from lambs grazed on saltbush, have a stronger aroma. But this had no effect
on the like or dislike of the aroma by consumers. This conclusion must,
however, be restricted to lambs fed for periods up to 68 days and can only be
recommended for lambs fed on A. nummularia, not other Atriplex species
(Hopkins & Nicholson, 1999).
The above strategy has real potential for increasing animal productivity on
saltbush, as proposed by Warren et al. (1990), as cited by Hopkins &
Nicholson (1999). Indications are that energy supplements which will increase
the metabolisable energy concentration of the diet, will allow greater utilisation
of the high levels of crude protein found in saltbush (Atiq-Ur-Rehman et al.,
1994, as cited by Hopkins & Nicholson, 1999).
Pearce & Jacob (2004) found that meat from sheep grazing saltbush is high in
vitamin E. The meat was also leaner and more hydrated, with a consumer
appeal equal to that of grain-fed lambs. The higher vitamin E acts as an
antioxidant, helping to preserve the fresh red colour and shelf life of the meat.
Hassan & Abd El Aziz (1979) fed fresh leaves and succulent stems of A.
nummularia, together with 0, 50, 100 or 150 g barley/day to sheep. These
authors found that the liveweights decreased during the third week of
adaptation, but in the fourth week of the experiment, daily liveweight gains

7
improved. The CP and CF digestibilities were significantly higher at the
highest barley rate of supplementation, and DOM (digestible organic matter)
and DCP (digestible crude protein) intakes were significantly improved by
barley supplementation.
Abou El Nasr et al. (1996) also evaluated the feeding value and utilisation of
A. nummularia by sheep under arid conditions. Acacia saligna and A.
nummularia were compared in three forms: fresh, air-dried and ensiled. The
fresh saltbush diet had higher CP, CF and ash contents than the fresh Acacia
diet. Processing noticeably changed the contents of CP, ether extract and ash
in the saltbush, but not much in the Acacia. The DM, CP, ether extract,
nitrogen-free extract and neutral detergent fibre fractions were efficiently
utilised and digested by sheep given the ensiled shrubs. Saltbush intakes
were superior to that of the Acacia diet. The most nutritious diet was the
saltbush silage, which provided sufficient digested nutrients (TDN and DCP)
to meet energy and protein requirements for the maintenance of sheep. The
other diets, fresh or air-dried, required supplementation with concentrates to
provide a maintenance ration.
Another approach using Atriplex spp. was investigated by Ben Salem et al.
(2002a). These authors used Atriplex spp. as a nitrogen-rich supplement, to
ensure normal microflora activity in the rumen. It was found that it improved
the feeding value of the diets used and consequently sheep growth. The
reason why Atriplex spp. can be used as a nitrogen-rich supplement lies in the
fact that it contains high levels of nitrogen of which a great part is soluble. A.
nummularia can be regarded as a good, cheap source of nitrogen, which may
reduce feeding costs and raise sheep productivity in arid zones (Ben Salem et
al., 2002a). Improved efficiency of microbial protein synthesis was also found,
when Ben Salem et al. (2002b) supplied Atriplex, either with barley or cactus.
Pregnant Angora goat ewes kept on A. nummularia pasture, could maintain
pregnancy if they were supplemented with 300 g alkali-ionophore-treated
whole maize daily. Such animals, however, ran a relatively high risk of
abortion, especially during adverse weather conditions such as cold and wet
spells (Hobson et al., 1986).

8
The low tannin content of A. nummularia results in rapid and extensive DM
and N degradation in the rumen (Ben Salem et al., 2002b). Feeding animals
with a mixture of shrub species seems to be a recommended practice to dilute
the negative effects of possible anti-nutritional factors (tannins, oxalates, etc.)
(Ben Salem et al., 2002b). The high levels of sodium and nitrogen in Atriplex,
is most likely to have a diluting effect on the negative effects associated with
oxalates (Ben Salem et al., 2002b). Norman et al. (2004) examined the
nutritive value and preference by sheep of two different saltbush species, A.
nummularia and A. amnicola (River saltbush). It was found that the content of
total ash and oxalates was present at levels likely to depress voluntary feed
intake, especially in A. nummularia.
As a supplementary fodder, Atriplex spp. should not make up more than 20-
30% of the sheep’s diet. Casson et al. (1996), as cited by Hopkins &
Nicholson (1999) suggested that the high salt content of saltland forage plants
is likely to be the major determinant of palatability. The dilution of salt, through
the availability of other feed resources, would be necessary to improve intake
and performance.
A. nummularia can carry 20-25 sheep/ha for four months of the year
(Breytenbach et al., 1997).
9
1.4. Conclusion
A. nummularia can be an effective fodder component in mixed diets for
livestock. The principal advantages would be that adverse effects due to the
high mineral content of the halophyte tissues could be minimised, that animal
performance and economic returns might be higher than direct grazing of the
shrub species, or in-adequate feed during the dry season in the arid areas.
However the main disadvantage of using A. nummularia as one of the feed
ingredients, would be a reduced feed conversion efficiency, due to the dilution
effect of minerals on energy density (Aganga et al., 2003).
A. nummularia per se is not a balanced diet. The purpose therefore, is not to
fatten animals or to get a high performance, but rather to keep the animals
from starving during droughts (Breytenbach et al., 1997).
Glenn et al. (1998) found that A. nummularia Lindl. had a higher productivity,
water use efficiency and consumptive water use then conventional forage
crops in Arizona irrigation districts. The nutritional content of plant tissues was
acceptable for use as a ruminant forage. It was concluded that A. nummularia
had key traits, desired in a plant for the use of saline water, high consumptive
use to minimise land area devoted to reuse, high salt tolerance and useful
production. It can be concluded, from the above characteristics, that A.
nummularia can be used in veld reclamation, to cover bare patches and has
the potential to be used as a source of feed during droughts.

10
CHAPTER 2
LITERATURE REVIEW OF THE IN VIVO DIGESTIBILITY TECHNIQUE
The energy content of most ruminant feeds is very closely related to the
digestibility of their nutrients. Although there are other losses of nutrients
incurred during metabolism, loss of nutrients in the faeces after ingestion of
food is the most important. This is a measurement of digestibility (Kitessa et
al., 1999). As a nutritive value index, digestibility provides a biological
meaningful parameter that can be used in routine feed evaluation. It is also
very closely related to metabolisable energy, which accounts for further losses
of nutrients via urine and methane. One example of such a relationship allows
the metabolisable energy (ME, MJ/kg DM) content of forages to be calculated
at 0.0157 times the digestible organic matter (g/kg) in the dry matter (r2 = 0.83,
AFRC 1993).
The potential value of a food to supply a particular nutrient can be determined
by chemical analysis, but the actual value of the food to the animal can be
derived only after making allowances for the inevitable losses that occur
during digestion, absorption and metabolism. The first tax imposed on a food
is represented by that part of it which is not absorbed and which is excreted in
the faeces (McDonald et al., 1995).
2.1. Calculation of digestibility
The proportion of a feed that is not excreted in the faeces is assumed to have
been absorbed by the animal, and this is defined as the apparent digestibility
of the feed. It is not the true digestibility, as in ruminant animals the methane
that arises from the fermentation of carbohydrates, is lost in eructation and is
not absorbed (McDonald et al., 1995). Also, in addition to undigested feed
residues, the faeces contain enzymes and other substances secreted in the
gut, which are not reabsorbed. Parts of the gut lining, which slough off as the
feed passes through the gut, are also excreted in the faeces (McDonald et al.,
1995). The amount of this metabolic material that is unavoidably lost, is
11
directly proportional to dry matter (DM) intake, regardless of forage type
(Minson, 1990). Determining the true digestibility rather than apparent
digestibility may be scientifically more accurate. However, no advantage has
been demonstrated from the use of true digestibility in forage evaluation
(Minson, 1990), as the loss of metabolic secretion is a consequence of
feeding the forage and should therefore, be accounted for in the assessment
of the forage value to the animal.
A variety of means of estimating the digestibility of feeds has been developed
(Rymer, 2000).
2.1.1 Direct method
To estimate the dry matter digestibility (DMD) of a diet involves the complete
collection over a period of time of all the faeces excreted by an animal, once it
has been adapted to the diet. The amount of feed dry matter consumed by the
animal during this time is also recorded. This is the actual amount of dry
matter consumed, and so the difference between the amount of dry matter
offered and the amount of dry matter rejected by the animal. The DMD is then
calculated from the equation:
DMD = (DM intake – Faecal DM excreted)/DM intake
The digestibility of other feed fractions may be determined by substituting
them for dry matter in the above equation. For forages, the proportion of
digestible organic matter (OM) in the dry matter (DOMD or D value) is often
calculated as this provides a measure of the available energy in the forage dry
matter. DOMD is calculated using the equation:
DOMD = (OM intake – Faecal OM excreted)/DM intake
12
2.1.2 Difference method
If forage is being fed alone, then its digestibility may be determined using the
direct method. However, it is often necessary in many situations to
supplement the forage with another feed. This complicates the calculation of
digestibility somewhat, and there are two main approaches that have been
adopted to cope with this situation. In both approaches, it is assumed that
there is no interaction between the feeds in terms of their digestibility (Rymer,
2000).
The first approach is to feed the forage with another ‘base feed’ of known
digestibility (McDonald et al., 1995). The digestibility trial is conducted as
normal, and the forage (test feed) should constitute the major proportion of
the diet.
The DMD of the forage is then calculated using the equation:
DMD of test feed =
(DM intake of test feed – (Faecal DM – Faecal DM from excreted base feed))/
DM intake from test feed
The digestibility of the forage is therefore calculated by difference.
2.1.3 Regression method
The second approach is to feed the forage with a supplement (which may be
another forage) at a number of different ratios between forage and
supplement (Schneider & Flatt, 1975, as cited by Rymer, 2000). The
digestibility of each of these different diets is estimated. The digestibility of the
diet is then regressed with the proportion of the forage in the diet, and then
the digestibility of the forage is estimated by extrapolating to zero inclusion of
the supplement (1000 g/kg inclusion of the forage) (Rymer, 2000).
13
2.1.4 Indirect method
In some circumstances, particularly with grazing animals, it may not be
possible to measure either feed intake or faecal output, or both, accurately.
The digestibility of the forage may still be estimated, if it contains a component
that is known to be completely indigestible (Rymer, 2000). This marker should
be completely recovered in the faeces and should go unaltered through the
gut (Omed, 1986, as cited by Rymer, 2000). If the concentrations of this
component in both the feed and the faeces are measured, the digestibility of
the forage may be predicted. In this method, complete collections of faeces
are not needed, as long as representative samples of faeces are collected.
Representative samples of the forage that has been consumed are also
required for the analysis of the marker. The equation used to calculate
digestibility in this instance assumes that all of the marker consumed is
excreted. Therefore, at steady state:
Amount of marker consumed per day = Amount of marker excreted per day.
[Marker]feed * Feed intake = [Marker]faeces * Faecal output,
where marker concentrations are expressed in terms of g/kg DM and feed
intakes and faecal outputs are expressed in terms of kg DM/day. Rearranging
the above-mentioned equations will result in the following equation:
Digestibility = 1 - ([Marker]feed / [Marker]faeces
The marker may be a naturally occurring constituent of the feed, or it may be
a chemical mixed into it. However, it is difficult to mix chemicals with forages,
although the animals could be dosed with the marker each day, but the
disadvantage with this is that it increases the amount of handling that is
required and adds to the stress of the animals. Constituents occurring in
forages that have been used included lignin, acid-detergent fibre, indigestible
acid-detergent fibre (IADF), acid-insoluble ash (AIA) (which is mainly silica)
and some naturally occurring n-alkanes of long chain length (C-25 – C-35).
The indicator most commonly added to feeds is chromium in the form of
chromic oxide, Cr2O3, although a number of other markers have been used as
well. External markers have been found to contaminate grazed forage and
14
then give biased results in future experiments. This was observed by Sprinkle
et al. (1995) with chromic oxide.
The indirect, indigestible marker technique is easy to carry out and requires
less work than estimating digestibility by the complete collection of faeces.
There are three main sources of error associated with this method. These are
the estimation of the marker concentration in the forage, secondly the marker
concentration in the faeces and thirdly the fact that most markers are not
completely indigestible. This third source of error may give rise to very
unreliable estimates of digestibility (Rymer, 2000).
Obtaining a representative sample of the forage is also difficult. Grazing
animals, particularly sheep, can be highly selective in the forage they
consume. One approach that can be adopted is to fistulate the animal’s
oesophagus. A sample of oesophageal extrusa may then be taken and
analysed for the indicator to obtain an estimate of the concentration of the
marker in the forage actually consumed (Rymer, 2000).
2.2 Conducting a digestibility experiment
An in vivo digestibility trial has two stages, the first stage being the adaptation
period and the second the collection period. The adaptation period is
designed to ensure that a stable population of rumen microflora has been
established, that the animals are eating approximately the same amount of
feed daily and at the same time the residues being excreted in the faeces
arise from the digestion of the feed used in the experiment (Omed, 1986, as
cited by Rymer, 2000).
The length of time required for the animal to become adapted to the diet
varies from 4 to 12 days (Omed, 1986, Chenost & Demarquilly, 1982, as cited
by Rymer, 2000). During this adaptation period, the animals should also be
introduced to their digestibility cages if they are being confined (Omed, 1986,
as cited by Rymer, 2000).
15
Following the adaptation period, there is a collection period in which the
faeces are collected from each experimental animal. During this collection
period, representative samples of the feed are also taken and the amount of
feed refused is recorded. Representative samples of the refusals are also
taken and analysed, so that the amount of each nutrient that was actually
consumed, may be calculated (Rymer, 2000).
The length of time of the collection period varies with the nature of the diet.
Shorter collection periods will be required for more uniform diets. A period of
4-12 days is typically chosen (Rymer, 2000).
Complete collection (direct, difference or regression method) or spot sampling
(indirect method) of the faeces can be used. With complete collection, the
faeces should not be contaminated with urine, and the collection should be
made at the same time each day. The faeces taken each day should be
bulked over the whole collection period and a sample taken for analysis.
When spot sampling is used, samples should preferably be taken twice a day,
more frequently if there is diurnal variation in the excretion of the marker
(chromic oxide). When the animals are confined, grab samples from the
rectum can be taken. This may however, stress the animals. If the animals are
grazing, the samples can be taken from the field. The animals can be dosed
with coloured dye to identify individual animals, but the dye should not
interfere with the digestibility or marker used (Rymer, 2000).
The apparatus used in digestibility trials are metabolism cages, which should
have feed boxes that are designed in such a manner that the animals couldn’t
reach the feed of their neighbour. The walls of the feed box should also be
high enough to minimise the amount of feed lost by animals. The inside of the
box should be smooth, so that no feed can lodge in crevices. Clean, fresh
water should be available, either via an automatic drinking bowl or by a water
bucket that is filled two or three times a day. The metabolism cages can have
mesh floors as described by Schneider & Flatt, (1975) as cited by Rymer,
(2000), which separates the faeces and the urine. The animal stands on a
mesh floor, which is situated over a screen that is small enough to retain the
16
faeces. The faeces collect on this screen, while the urine falls through to a
sloped or funnelled pan, which directs it into a collection bottle below. The
disadvantage of this type of cage is that the faeces become exposed to
contamination by urine and may also be trampled on by the animal. Bags
attached to harnesses that are fitted to the animals can also be used. The
faeces collects in these bags. Adaptation to the bags for a few days is
necessary. The bags work best with wethers and can also be used for grazing
animals (Rymer, 2000).
When selecting the animals, the following should be considered:
Species : The advantage of the smaller species is that they consume less
feed and are therefore, less expensive to keep. One of the things that should
be kept in mind though, is that the digestive tract of such species may be
different from the target species (Rymer, 2000).
Sex : Intact male animals are generally preferred, as it is much easier to
separate the faeces and urine (Rymer, 2000) .
Number : The number of animals that should be used, depends on the
expected difference between test feeds and on the degree of confidence that
is required (Rymer, 2000).
If complete collections of faeces are being made, it is important that the
amount and composition of the feed that is consumed in the experiment are
accurately measured. If the indirect method is used, an estimate of the
composition of the forage actually consumed is needed, as it is an accurate
estimate of the concentration of the marker in the consumed forage. The level
of feeding will depend on what the objective is. With whole forage digestibility
the feeding should be restricted to maintenance levels and if selection is
practised, the amount offered should be near ad libitum. When the forage on
offer to the animals in a digestibility trial is prepared, it may in itself not affect
the digestibility. The forage offered may be either fed fresh or harvested
before the experiment or preserved by drying or freezing it. Alternatively, the
animal may be able to graze the forage, and the faeces collected from the
field (Rymer, 2000).
17
2.3. Sources of variation of in vivo digestibility
2.3.1 Particle size
Chaffing, grinding and pelleting can alter particle size of the feed, and
consequently its digestibility. Digestibility may be enhanced if the particle size
is reduced, presumably by increasing the surface area for enzymatic activity.
It can also reduce the retention time. The digestibility may, therefore, also be
reduced and thereby reducing the length of exposure to digestive enzymes
(Kitessa et al., 1999).
2.3.2 Level of feeding
Increased intake entails an increase in the rate of passage of ingested food
through the gastro-intestinal tract, which shortens the length of time the feed
is exposed to enzymatic actions. This may result in depression of digestibility
(Kitessa et al., 1999). There may also be an interaction between feeding level
and associative effects, and between the digestibilities of forage and
concentrate when fed together.
2.3.3 Associative effects between feeds
An associative effect occurs when, two or more feeds of different digestibility
coefficients, is fed in a mixture. The digestibility of the whole mixture is
different from the mean digestibility coefficient of the feeds in the mixture. This
can be negative or positive (Kitessa et al., 1999).
2.3.4 Chemical treatment
Formaldehyde treatment of cereal grains, to reduce or prevent rapid
fermentation in the rumen, and alkali treatment of cereal by-products, to break
the binding of cell wall components to lignin, is the two most common
chemical treatments used (Kitessa et al., 1999).
2.3.5 Miscellaneous
Heat treatment and the species of animal are other factors, which may affect
the digestibility of feeds. This cannot be detected by a relationship between
the concentration of a chemical fraction in a feed and the digestibility of the
feed (Kitessa et al., 1999).
2.4. Conclusion
Although in vivo digestibility is the ultimate measure, it is expensive, labour-
intensive, time-consuming and subject to errors. It is also often associated

18
with the use of digesta flow rate markers, microbial markers and inherent
animal variation (Stern et al., 1997).
19
CHAPTER 3
LITERATURE REVIEW OF THE IN SITU DIGESTIBILITY TECHNIQUE
The Dacron polyester or nylon bag technique has been used widely for
estimating ruminal nutrient degradation. It is a relatively simple, low cost
method, compared with methods involving intestinally cannulated animals.
Another advantage of the technique compared to other laboratory techniques
is that it involves the digestive process that occurs in the rumen of a living
animal (Stern et al., 1997). It is one of the few techniques that describe the
kinetics of feed degradation in the rumen (Adesogan, 2002). The technique
can also be readily used in developing countries, since it is not reliant on
electricity (Adesogan, 2002).
The procedure is as follows: Samples of dried and milled feed (to pass a 3
mm screen) or wet minced samples are placed in nylon bags (usually 10 x 17
cm). About 2 to 5 g, depending on density, is weighed precisely into each bag.
The tied-up bags are incubated in the rumen of sheep on an appropriate diet
by suspending them from a rumen cannula. The bags can be inserted into the
rumen all together and withdrawn at different time intervals, or the bags can
be inserted at different times and withdrawn all at once. This means that all
the bags can be washed and dried together. Degradability of dry matter,
nitrogen, energy, etc., can thus be measured against time. The pore size of
the bags, about 40-60 µm, is such that few particles can escape, and yet
micro-organisms can enter the bag. Thus, the fermentation rate inside the bag
is similar to that in the rumen. The amount of soluble material in the sample is
measured by washing and re-weighing an un-incubated bag. The
characteristics of the degradation curve are described by the equation: P = a
+ b( 1- e - ct ), where P is degradation at time t, a and b are constants and c is
the rate constant of b. For protein, the intercept, a, is similar to the soluble
fraction (washing loss): b represents the potentially degradable fraction
(Ørskov, 2000).

20
McDonald (1981) found that the above equation had to be reassessed when
the degradation of roughages was estimated, because of a lag phase. Figure
3.1 illustrates the degradation of a typical roughage.
Figure 3.1 Degradation of a typical roughage diet expressed by the formula
p=a+b (1-e-ct). Due to a lag phase (L), a is negative. A is the soluble fraction,
B the insoluble, but potentially fermentable fraction (B=(a + b ) – A and c the
rate constant of degradation (Ørskov, 2000)
When the intercept a is no longer similar to the solubility, in fact, when it is
most often negative, as there is a lag-phase period, when no nett
disappearance of substrate occurs. This is because the microbes take time to
adhere to the substrate, so that at first, there is no nett loss in dry matter. In
fact, there may be a small increase in dry matter. While it is possible to
describe a separate curve for the soluble fraction, there is a problem when
increasing the mathematical sophistication. It must be seen in relation to the
accuracy required. Ørskov & Ryle (1990), as cited by Ørskov (2000),
developed another system, in which the soluble fraction of the sample is
determined in the laboratory. The method can use the neutral-detergent fibre
(NDF) soluble fraction, the loss after washing with buffer solutions, or the
washing loss from a nylon bag containing substrate that was not incubated in
the rumen. Since A represents the soluble fraction, the insoluble but
fermentable fraction B is worked out as (a + b)-A, with c as the rate constant.
21
Particular attention must be given to the choice of incubation times. Ideally, no
sample should be taken out of the rumen before the lag phase has ended,
normally not before 8 h of incubation. If bags are withdrawn earlier, the curve
is distorted and the residual standard deviation (RSD) increases. The other
rule is that the asymptote must be clearly identified. This is necessary for
accurate description of both B and c. This is achieved by ensuring that the
differences in degradability between the last two incubation times are small
(less than 10% of the second to last incubation), i.e. 40 and 44%. Usually 72
or 96 h are sufficient to describe the asymptote clearly.
All feed evaluation systems do not predict intake, and this is a particular
problem when roughages or forages are grazed or stall-fed ad libitum. Ideally,
feed evaluations should provide farmers with an exchange rate of one feed
compared with another. They should allow planners of livestock production to
assess the possible production and predict export, or necessity for import of
feed, etc. Digestibility and metabolisability, while positively correlated with
feed intake, can generally only account for about half of the variation in feed
intake (Ørskov, 2000).
If feeds can be characterised in such a way that potential feed intake is
predicted, progress in roughage evaluation will be made. Intake is influenced
by interactions between feed and animal, especially those that affect ruminal
retention of fibre, such as, particle reduction, outflow of small particles and
rumen volume. A feed evaluation system must characterise the feeds
themselves, as the animal interaction cannot be determined in each instance.
Also, because of the length of time it takes, it would be very expensive and
impractical to determine intake and utilisation of each feedstuff by feeding
trials (Ørskov, 2000).
In many experiments, the characteristics of feed degradability have been
described by the following fractions. The soluble fraction A, which, arises from
cell contents, takes up little space and is 100% fermentable. The insoluble,
but degradable fraction B, which takes up space, as long as it remains in the
22
rumen undegraded. And c, which is the speed at which the B fraction is
degraded. The undegradable fraction, 100 – (A+B), takes up space until it is
eliminated by outflow from the rumen. All these fractions have an influence on
the volume of ingesta in the rumen. These rate constants have been used in
an attempt to develop a system that can predict not only feed nutritive value,
but consumption as well. Multiple regressions were tested to see if intake and
digestibility could be predicted from values for A, B and c. It was found that A,
B and c separately gave the best estimates of intake, because the
correlation’s between them were weak (Ørskov, 2000).
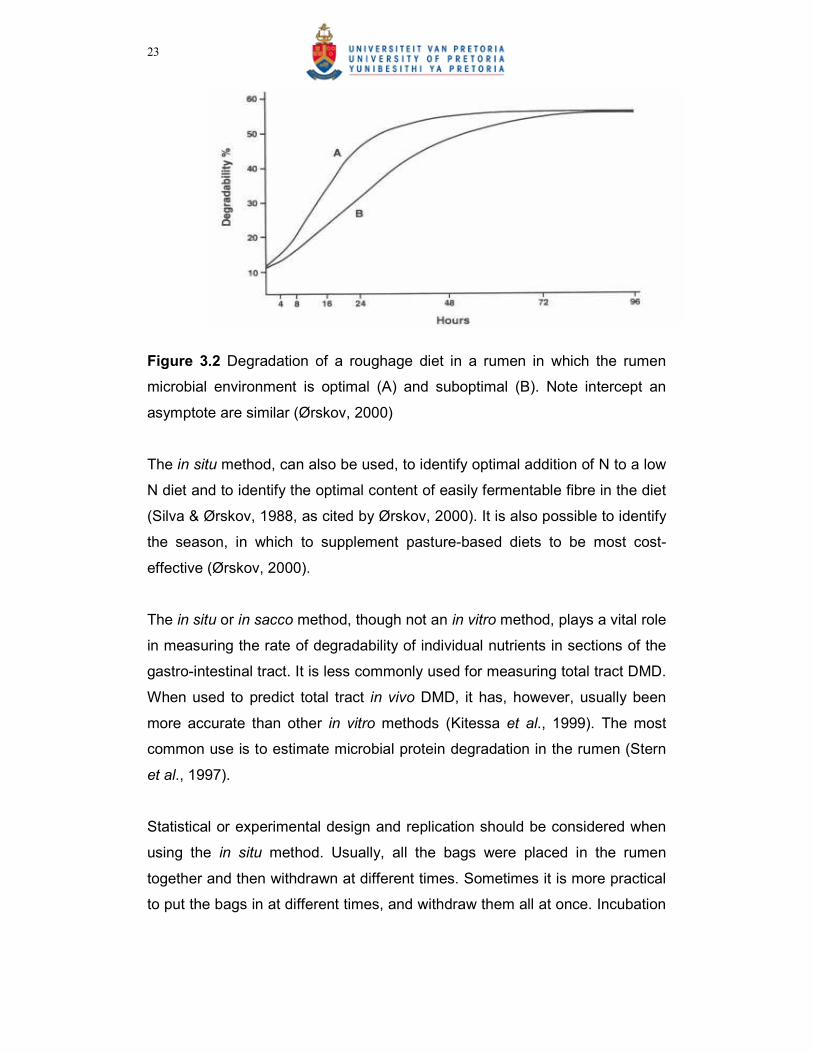
The in situ technique can also be used for studies to evaluate the rumen
environment. When the technique is used to evaluate feed, the rumen
environment should be optimal so that maximum degradability of the feed is
expressed. However, factors like acid conditions and negative interactions
between feeds or deficiencies in the diets, e.g. of N (nitrogen) or S (sulphur),
can make the rumen environment sub-optimal. As these influences are
usually reflected in cellulolysis, the study of the rumen environment is
centralised in changes in the rate constant, c. By using a standard feed
substrate and varying the rumen environment, the feeding regime can be
studied and the most cost-effective rumen environment can be identified, as
shown in Figure 3.2.
23
Figure 3.2 Degradation of a roughage diet in a rumen in which the rumen
microbial environment is optimal (A) and suboptimal (B). Note intercept an
asymptote are similar (Ørskov, 2000)
The in situ method, can also be used, to identify optimal addition of N to a low
N diet and to identify the optimal content of easily fermentable fibre in the diet
(Silva & Ørskov, 1988, as cited by Ørskov, 2000). It is also possible to identify
the season, in which to supplement pasture-based diets to be most cost-
effective (Ørskov, 2000).
The in situ or in sacco method, though not an in vitro method, plays a vital role
in measuring the rate of degradability of individual nutrients in sections of the
gastro-intestinal tract. It is less commonly used for measuring total tract DMD.
When used to predict total tract in vivo DMD, it has, however, usually been
more accurate than other in vitro methods (Kitessa et al., 1999). The most
common use is to estimate microbial protein degradation in the rumen (Stern
et al., 1997).
Statistical or experimental design and replication should be considered when
using the in situ method. Usually, all the bags were placed in the rumen
together and then withdrawn at different times. Sometimes it is more practical
to put the bags in at different times, and withdraw them all at once. Incubation
24
times can also be flexible. The particle size of the sample should be such to
avoid small particles being lost from the bags (Ørskov, 2000).
The replication adopted will depend on the objectives of the study. If the feed
is evaluated and the results are to be used in diet formulation or the rumen
environmental conditions are to be estimated, the variation between animals
should be considered and more than one cannulated animal should be used.
If the objective is to rank the feed potential of forages, then only one animal
may be used (Ørskov, 2000).
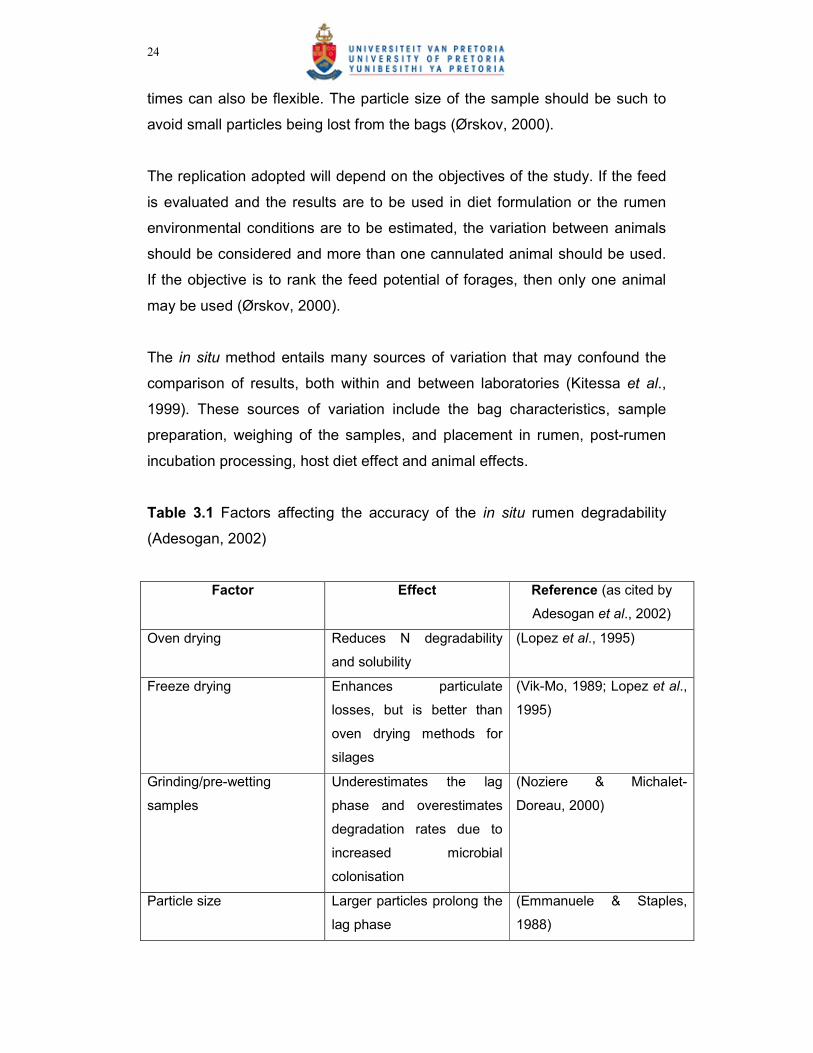
The in situ method entails many sources of variation that may confound the
comparison of results, both within and between laboratories (Kitessa et al.,
1999). These sources of variation include the bag characteristics, sample
preparation, weighing of the samples, and placement in rumen, post-rumen
incubation processing, host diet effect and animal effects.
Table 3.1 Factors affecting the accuracy of the in situ rumen degradability
(Adesogan, 2002)
Factor Effect Reference (as cited by
Adesogan et al., 2002)
Oven drying Reduces N degradability
and solubility
(Lopez et al., 1995)
Freeze drying Enhances particulate
losses, but is better than
oven drying methods for
silages
(Vik-Mo, 1989; Lopez et al.,
1995)
Grinding/pre-wetting
samples
Underestimates the lag
phase and overestimates
degradation rates due to
increased microbial
colonisation
(Noziere & Michalet-
Doreau, 2000)
Particle size Larger particles prolong the
lag phase
(Emmanuele & Staples,
1988)
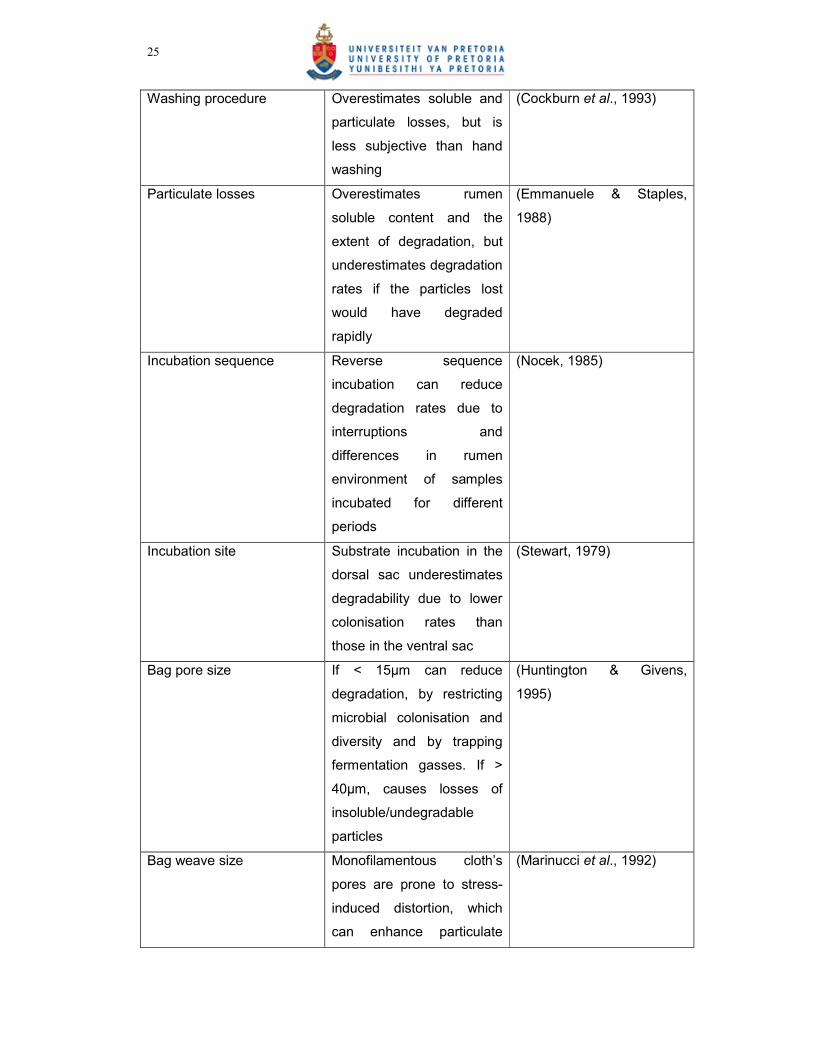
25
Washing procedure Overestimates soluble and
particulate losses, but is
less subjective than hand
washing
(Cockburn et al., 1993)
Particulate losses Overestimates rumen
soluble content and the
extent of degradation, but
underestimates degradation
rates if the particles lost
would have degraded
rapidly
(Emmanuele & Staples,
1988)
Incubation sequence Reverse sequence
incubation can reduce
degradation rates due to
interruptions and
differences in rumen
environment of samples
incubated for different
periods
(Nocek, 1985)
Incubation site Substrate incubation in the
dorsal sac underestimates
degradability due to lower
colonisation rates than
those in the ventral sac
(Stewart, 1979)
Bag pore size If < 15µm can reduce
degradation, by restricting
microbial colonisation and
diversity and by trapping
fermentation gasses. If >
40µm, causes losses of
insoluble/undegradable
particles
(Huntington & Givens,
1995)
Bag weave size Monofilamentous cloth’s
pores are prone to stress-
induced distortion, which
can enhance particulate
(Marinucci et al., 1992)
26
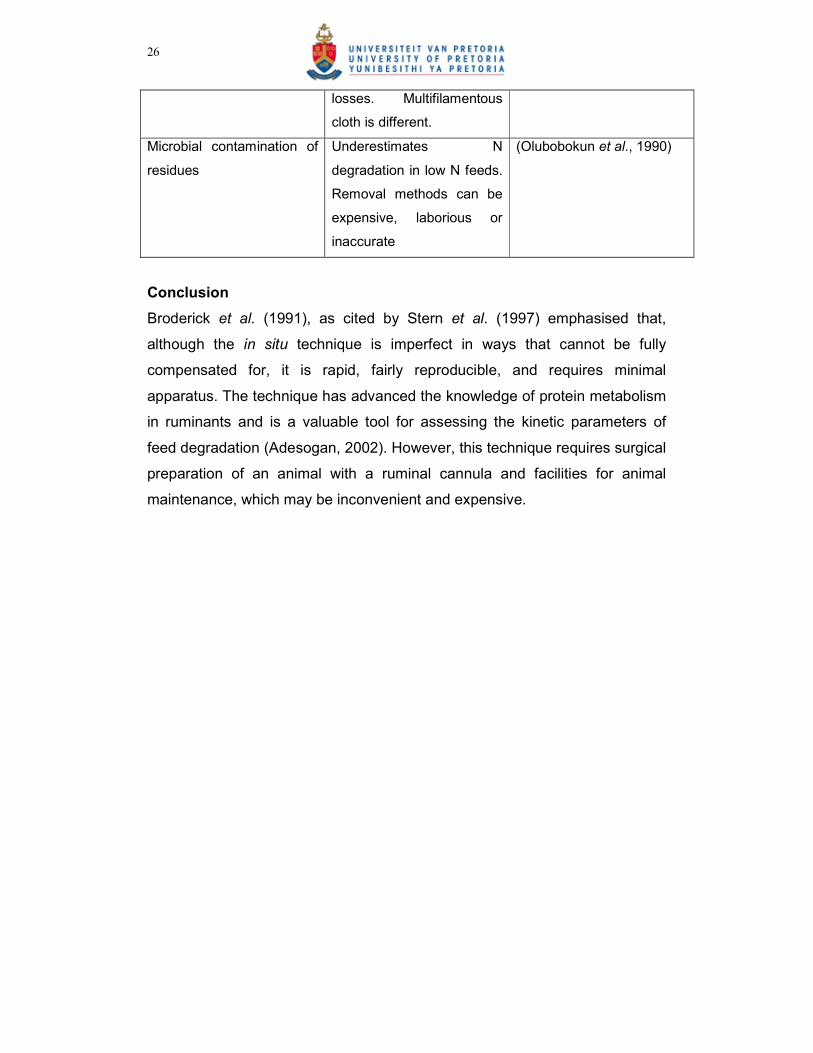
losses. Multifilamentous
cloth is different.
Microbial contamination of
residues
Underestimates N
degradation in low N feeds.
Removal methods can be
expensive, laborious or
inaccurate
(Olubobokun et al., 1990)
Conclusion
Broderick et al. (1991), as cited by Stern et al. (1997) emphasised that,
although the in situ technique is imperfect in ways that cannot be fully
compensated for, it is rapid, fairly reproducible, and requires minimal
apparatus. The technique has advanced the knowledge of protein metabolism
in ruminants and is a valuable tool for assessing the kinetic parameters of
feed degradation (Adesogan, 2002). However, this technique requires surgical
preparation of an animal with a ruminal cannula and facilities for animal
maintenance, which may be inconvenient and expensive.
27
CHAPTER 4
DIFFERENT LABORATORY TECHNIQUES TO DETERMINE THE
DIGESTIBILITY OF ATRIPLEX NUMMULARIA CV. DE KOCK.
GENERAL INTRODUCTION
The development and application of laboratory methods for predicting the
nutritive quality of forages have been an active and successful area of
research during the latter half of this century (Jones & Theodorou, 2000).
Many attempts have been made to predict the intake and digestibility using
laboratory techniques, and thereby developing regression equations to predict
digestibility from forage chemical composition (Getachew et al., 1998).
Traditional wet chemistry techniques for estimating chemical components to
predict digestibility of feeds, rely on a statistical association between the
concentration of a chemical fraction in a feed and the digestibility of the feed
in vivo (Kitessa et al., 1999). This association can be a simple correlation or a
direct cause-effect relationship (Weiss, 1993, as cited by Kitessa et al. 1999).
It is generally accepted that feed fractions with the greatest influence on
digestibility, are those that constitute the cell wall fraction. Cell contents are
almost entirely digestible. The most common cell wall constituents used in
predictive equations for digestibility are neutral detergent fibre (NDF), acid
detergent fibre (ADF) and lignin. The accuracy in predicting in vivo digestibility
from fibre fractions varies, both within and between the fractions used
(Kitessa et al., 1999).
Theoretically, the error of prediction should decrease, as the fibre fraction is
progressively refined to its most indigestible constituent, from NDF to ADF to
lignin. However, this is not always the case, and some feeds are very low in
lignin, especially grain supplements. Ranking such feeds for digestibility, or
energy content, is not of much value (Kitessa et al., 1999).
28
The accuracy of prediction equations is improved when the equations are
applied within the feed types used to generate the equations, because the
equations have an inherent population-dependence (Weiss, 1993, as cited by
Kitessa et al., 1999).
The greatest sources of variation in accuracy of prediction, are the
extrapolations across feed types and difference in the chemical fraction
chosen. In addition, differences in the methods used to determine the
concentration of chemical fractions, can lead to between laboratory variations
in the prediction of in vivo dry matter digestibility (DMD) from chemical
fractions. Such variations can be overcome by standardising methods of
chemical analysis (Kitessa et al., 1999).
Kitessa et al. (1999) stated that, the advantage of using equations based on
chemical indices is that the determination of chemical components is simple,
rapid and cheap, but the statistical association between chemical indices and
digestibility, doesn’t represent the biological processes involved in food
digestion.
An important development has been the introduction of biological methods
(Jones & Theodorou, 2000). Three major digestion techniques (biological
methods) that simulate the digestion process are currently available to
determine the nutritive value of ruminant feeds:
1. Digestion with rumen micro-organisms as in the work of Tilley & Terry
(1963) or the gas method of Menke et al., (1979). Digestion with faeces
micro-organisms (El Shaer et al., 1987), is an alternative to rumen fluid
inoculum.
2. Cellulase methods
3. In situ incubations of samples in nylon bags in the rumen.
Biological methods are more meaningful, since micro-organisms and
enzymes are more sensitive to factors influencing the rate and extent of
digestion, than are chemical methods. However, some important points need
29
to be addressed in the development of a viable in vitro technique. An efficient
laboratory method should be reproducible and should correlate well with
actually measured in vivo parameters. In vitro methods have the advantage of
not only being less expensive and less time-consuming, but they also allow
one to maintain experimental conditions more precisely than can be done in in
vivo trials (Getachew et al., 1998).
Because of increased public scrutiny, elicited by the animal rights movement,
the use of invasive surgical procedures for nutritional research has become
more difficult to justify. In vivo measurement of nutrient digestion is expensive,
labour-intensive, time-consuming, and subject to error associated with use of
digesta flow rate markers, microbial markers, and inherent animal variation.
Hence, alternative methods for predicting nutrient digestion of dietary feed
ingredients in the rumen and small intestine are needed (Stern et al., 1997).
The objective of this study was to determine the digestibility of A. nummularia
cv. De Kock (Oldman’s saltbush), supplemented with two energy sources,
maize and barley. This was done by using different in vitro techniques, and
comparing the results with the in vivo organic matter digestibility data, to
determine, which in vitro digestibility technique, provides the best prediction of
the organic matter digestibility (OMD).
The following review of literature will be of the individual in vitro techniques.
4.1 THE EVALUATION OF THE IN VITRO RUMEN LIQUOR DIGESTIBILITY
TECHNIQUE
An excellent example of a systematic approach to the establishment of a feed
evaluation system, was the development of the first routine in vitro system by
Tilley & Terry (1963). Recognising the importance of diet digestibility, as an
index of nutritional value, these workers established a comprehensive in vivo
database of forage digestibilities, from which, suitable predictive procedures
could be developed. A wide range of forages, both grasses and legumes,
were systematically fed to mature sheep at maintenance levels to obtain
measurements of whole-tract digestibility. Subsequently, these feeds were
30
subjected to an in vitro technique, comprising two stages, to simulate ruminal
and postruminal digestion. A series of equations to predict whole-tract
digestibility for different diets, were proposed (Beever & Mould, 2000).
The establishment of the technique led to the development of the concept of
forage digestibility (D), or DOMD, value, defined as the content of digestible
organic matter in forage DM, and equations to predict DOMD (%). Estimates
of D values, have also been used in systems of grassland management, to
optimise the use of grazed grass or the stage of harvesting of grass for
ensiling. Plant breeders also adopted this concept, as a screening procedure
to examine the nutritional value of new forage cultivars. Equally, DOMD
values derived from IVD (in vitro digestibility) estimates have been used to
predict forage ME contents. A value of 0.15 has been adopted to convert
DOMD to ME (i.e. ME (MJ/kg DM) = 0.15DOMD%) for fresh and dried grass
hay. A higher coefficient of 0.16 was used for high-protein legumes and
fermented feeds (Beever et al., 1999, as cited by Beever & Mould, 2000).
Estimates of forage IVD have also been used to predict forage intake – yet
another example of the utility of this index of nutritive value (Beever & Mould,
2000).
The technique first described by Tilley & Terry (1963) has been the most
commonly used in vitro method for predicting digestibility and as a selection
tool for improving the nutritional quality of forages (Stern et al., 1997).
This two-stage in vitro technique of Tilley & Terry (1963) has shown that it
gives results well related to in vivo digestibility, for a wide range of forages
and under a variety of growing conditions. However, there are inherent
problems in the use of micro-organisms in rumen fluid for forages (Jones &
Theodorou, 2000). Maximising in vitro digestion depends on several factors,
including dilution of the ruminal inoculum, type of buffer used, particle size of
the sample, type of mill used for grinding, and type of diet the donor animal is
fed (Stern et al., 1997).
31
4.1.1 Activity of inoculum
The activity can vary, depending on time of collection after feeding, diet of the
donor animal, species of donor animal, and animal-to-animal variation within a
species (Kitessa et al., 1999).
Jones & Theodorou (2000) found that this activity differs, between different
donor animals and in the same animal on different days. Freeze-drying, or
other methods of preservation, altered the microbe activity. Fresh rumen fluid
should, therefore, be available and this entails, having cannulated sheep or
cattle available as donor animals. The activity of the microbial inoculum
should be checked each time by incubating two or more standard samples of
known digestibility.
An optimum time to collect rumen fluid would be 8-12h after feeding (Weiss,
1994, as cited by Kitessa et al., 1999). This is because the activity of most
fibriolytic enzymes peaks at this time according to Williams (1988), as cited by
Kitessa et al., 1999. If practical, feeding at least 3 times per day can reduce
the variability (Weiss, 1994, as cited by Kitessa et al., 1999). Another
influence on the potency of the rumen fluid is the consumption of water (Jones
& Theodorou, 2000).
4.1.2 Processing of rumen fluid
Ruminal inoculum is typically strained through several layers of cheesecloth
and diluted (20:80) in saline solution, artificial saliva, or various buffers and
this will affect the microbial concentrations (Stern et al., 1997). Craig et al.
(1984), as cited by Stern et al. (1997), suggested, that when simulating
ruminal fermentation of fibre from different feedstuffs, strained ruminal fluid,
plus an inoculum of particulate-associated bacteria should be used, since it is
more effective than strained ruminal fluid alone.
4.1.3 Diet of donor animals
The donor animals need to be maintained on a standard feeding regime for
long periods to minimise variability in inoculum potency. The feeding and care
of the animals is a high and costly labour input (Jones & Theodorou, 2000).
32
Forages under test are not usually the same as the maintenance diet of the
donor animals, thus affecting the rumen microorganism population (Zacharias,
1986).
When the rumen-liquor technique is used to predict the digestibility and
energy value of feeds, such as straw, which is generally bulky and of very low
quality, it is possible that the 48h incubation may be insufficient. The microbial
population may gradually shift to highly fibrolytic species when animals are
retained on straw diets (Kitessa at al., 1999). Cone et al. (1989), as cited by
Stern et al. (1997), demonstrated that the type of diet fed to the animal had an
effect on the results of the in vitro technique. In vitro starch disappearance
was greater, when ruminal fluid was obtained from a concentrate-fed cow
than when it was obtained from a hay-fed cow. A good practice for a
laboratory would be to maintain donor animals on a low cost feed that is
similar in quality characteristics to feed samples commonly analysed in that
laboratory (Kitessa et al., 1999).
Engels & Van der Merwe (1967) also studied the effect of the ration fed to the
donor sheep. These researchers found that the differences between in vivo
and in vitro digestibilities of OM were greatest when rumen liquor was
obtained from sheep on an oat hay diet, than when the sheep were fed on a
lucerne diet. Highly significant differences were observed (p=0.01) for rumen
liquor from different sources. Differences appear to be more pronounced with
forages of low crude protein content, such as oat & grass hay. It was found
that there was no significant variation in in vitro digestibility values, obtained
for the same forages between different sheep. The individuality of donor
sheep fed on the same ration didn’t have a significant effect.
4.1.4 Collecting and handling of rumen fluid
Maintaining anaerobic conditions, the high viscosity of digesta that influence
filtration, unpleasant smells and a need for hygiene, to avoid possible risk of
infection from pathogens, add to the analytical difficulties of using rumen fluid
in vitro studies (Jones & Theodorou, 2000). Zacharias (1986) also found it
difficult to collect and handle the rumen fluid. Grant & Mertens (1992b) tested
several factors that could affect fibre digestibility values, using the in vitro
33
technique, including the maintenance of anaerobic conditions. Purging tubes
with CO2, but not gassing continuously, resulted in a 56% increase in lag time
for NDF digestion and a 69% decrease rate of NDF digestion. These authors
also suggested the use of nutritional additives, such as micro-minerals,
vitamins and tryptone, to ensure that non-fibre factors did not limit
fermentation, especially with substrates low in protein and micro-minerals.
An in vitro buffering system, capable of pH control between 5.8 and 6.8, has
been developed by Grant & Mertens (1992a) and successfully used to study
fibre digestion in vitro (Grant & Mertens, 1992c). Starch digestion also seems
to be affected by the pH in vitro (Stern et al., 1997).
Richards et al. (1995) recommended that dilutions of 1:2 or 1:3 be used when
studying starch digestion of grains that are rapidly fermented. A 1:1 dilution
showed a lower rate and extent of starch digestion, because of a lower pH
when the ruminal fluid was less diluted.
4.1.5 Sample preparation
Richards et al. (1995) found that the type of mill used to grind the sample
also had an affect on in vitro digestibility. Greater starch digestibilities were
noted when a Udy mill, compared to a Wiley mill, was used for milling
samples. Screen size might also affect digestibility, but samples ground to
pass through 2 mm and 1 mm screens yielded similar starch digestibilities.
Cone et al. (1989) reported increasing rates of starch disappearance when
particle size decreased from 1 to 0.1 mm. Kitessa et al. (1999) suggested
that, variations between and within laboratories are minimised if samples are
ground to a standard mesh size.
4.1.6 Type of animal
The effect of species of donor animal on the accuracy of in vitro DMD has
been equivocal. The differences are small and keeping and caring for the
animals, are likely to determine the species (Kitessa et al., 1999). By keeping
a few cannulated animals, the rumen fluid collected can be bulked to
overcome the animal-to-animal variation (Gulati et al., 1997, as cited by
Kitessa et al., 1999). Zacharias (1986) also suggested that, if there is a
34
difference between the type of donor animal (usually sheep) and those to
which the research applies, it could be a potential area for error.
Most of the problems due to the variability in the quality of the rumen fluid can
be prevented by including standards of known in vivo digestibility in
experiments (Jones & Theodorou, 2000; Adesogan, 2002). This allows for
correction of the results relative to standard values, but in practice, it is often
difficult to make a valid correction, unless a large number of standard samples
are included in each analytical batch (Jones & Theodorou, 2000).
Although the above problems are not insurmountable they provide a number
of areas for potential error, especially for the unskilled analyst or range
scientist, who conducts his own forage analysis (Zacharias, 1986).
The more complicated shortcomings of the technique include the disregard of
post-gastric digestion, the outflow of digesta and the digestion of pepsin-
insoluble nitrogenous compounds. Poor predictions of in vivo digestibility,
because of these factors have been reported (Adesogan, 2002). Ibbotson
(1982), as cited by Adesogan (2002), observed a poor prediction of N
digestibility, because of Maillard products in silages. These products are
digested in vitro, but not in vivo and this resulted in an underestimation of
metabolic faecal N in vitro.
4.1.7 Modifications
Several modifications of the original procedure have been used to maximise
the digestion process, because in vitro systems that do not maximise
digestion kinetics, may not detect differences in substrate digestion (Grant &
Mertens, 1992b).
The original Tilley & Terry (1963) method involved two stages in which
forages were subjected to 48h fermentation in a buffer solution containing
rumen fluid, followed by 48h of digestion with pepsin in an acid solution
(Getachew et al., 1998). With the passage of time, possible alternatives to this
in vitro system, as proposed by Tilley & Terry (1963), have been suggested.

35
Several workers have found that the rumen fluid-pepsin technique gives less
accurate predictions of digestibility in silages and straw, than in fresh grasses
(Givens et al., 1995; Adesogan et al., 1998). Hence, to better account for
post-ruminal digestion, Van Soest et al. (1966), as cited by Adesogan (2002),
modified the method, introducing a final washing procedure after the 48h
incubation with neutral detergent solution replacing the acid-pepsin step in
Tilley & Terry (1963) to estimate the predicted true digestibility.
Gizzi et al. (1998) evaluated a rapid in vitro technique, to study the activity of
rumen micro-organisms and to estimate the nutritive value of feeds. The
rumen culture apparatus used is essentially a batch system, modified in order
to ensure conditions of strict anaerobiosis and the balanced growth, of all the
microbial forms present in the mixed rumen inoculum. In vivo and in vitro
studies were done simultaneously and by comparing them, validation of this
technique was obtained. Microbial flora composition, biochemical parameters
of rumen fluid and feed degradability were analysed. It was found that the
total viable bacteria count, did not show significant differences between
fermentations, in vivo and in vitro, at any of the incubation times. The dry
matter degradability values found in vitro were similar to those in vivo, except
for the immediately soluble fraction. This fraction represents the feed
degraded at 0h, which is the amount of dry matter solubilised, after washing
the nylon bags in water without submitting it to any fermentation process. It
was significantly lower (P<0.05) in vitro. Less variability was associated with
results obtained from in vitro system compared with measurements in
animals. Ammonia nitrogen and degradability of compound feed nitrogen did
not show significant differences between the two systems.
Engels & Van der Merwe (1967) tested the Tilley & Terry (1963) in vitro
technique for the evaluation of South African forages using rumen liquor from
different sources. These reasearchers found highly significant differences (P =
0.01) in the in vitro digestibility of the same samples, when it was obtained
using rumen liquor derived, either from a sheep on lucerne hay or from sheep
on oat hay. The in vitro method yielded results with a high degree of
repeatability. No significant differences (P=0.5) were obtained with in vitro
36
digestibility of organic matter, when rumen fluid from four different sheep, on
the same ration, was used as inoculum.
A slight modification, regarding N supplementation, was also investigated.
Urea was added at different levels ranging from 1 –60 mg. It was established
that with urea, which contains 46% N, to obtain 1mg of N an addition of 2.17
mg of urea was necessary. When 20 mg N was added to the rumen liquor,
obtained from a sheep fed on oat or lucerne hay, no significant difference (P =
0.05) was observed. The highest in vitro digestibility was obtained with the
addition of 20 mg N. With more than that, digestibility declined. This is thought
to be due to the toxic effect of excess ammonia (NH3).
Engels & Van der Merwe (1967) found that the reason for the low protein
forages with the higher in vivo digestibility could be due to the higher N in the
rumen liquor from the recycling of urea via saliva and the rumen wall. Sheep
on lucerne hay showed no effect on legumes with N supplementation, but on
non-legumes there was an effect. With the rumen fluid of sheep on an oat
hay diet, N supplementation improved in vitro digestibility in all samples. The
difference in N content of the two different rumen liquors may be the reason
for the differences in digestibilities.
4.1.8 Advantages & Disadvantages
The main advantage of this method is that it is less susceptible to factors,
which confound the prediction of digestibility from chemical indices. It has the
capacity to account for factors such as heat treatment, associative effects,
alkali treatment of straws, and species of animal (if rumen liquor is gathered
from the same species as the test animals). For instance, associative affects
on the digestibility of a forage fed with concentrates can be overcome by
feeding donor animals the forage: concentrate ratio planned, to the test
animals (Kitessa et al., 1999).
Engels & Van der Merwe (1967) investigation showed that the Tilley & Terry
(1963) in vitro digestibility technique yielded a high degree of repeatability.
The in vitro OM digestibility was determined with rumen liquor from the same
sheep drawn on three different days. It was found that the in vitro results were
highly repeatable from day to day and even in the next year.
37
The Tilley & Terry (1963) in vitro method appears to have several
disadvantages. The method is an end-point measurement (gives only one
observation) thus, unless lengthy and labour-intensive, time-course studies
are made, the technique does not provide information on the kinetics of forage
digestion and the residue determination destroys the sample and a large
number of replicates are, therefore, needed. The method is, therefore, difficult
to apply to materials such as tissue culture samples, or cell wall fractions
(Getachew et al., 1998). The requirement of donor animals to supply rumen
fluid, which entails the cost of acquiring the animals, surgical costs, labour for
animal care, feed cost and welfare issues, is also a disadvantage. The
technique is not able to accommodate the effect of change in particle size,
because the samples are ground through the same screen size. The
technique is also very slow, in that at least two days are required per batch of
samples (Kitessa et al., 1999).
4.2 THE EVALUATION OF THE IN VITRO FAECAL LIQUOR TECHNIQUE
Rumen fluid inoculum is required in most of the in vitro techniques utilising a
microbial fermentation approach to feedstuff evaluation (Tilley & Terry, 1963;
Menke et al., 1979). The necessity for cannulated animals to provide this
inoculum raises a number of practical problems, e.g. surgical facilities,
constant care to avoid infections and costs associated with the long-term
maintenance of these animals. In addition, there are a number of ethical
considerations regarding these techniques with respect to animal welfare
(Mauricio et al., 2001).
The prime function of the rumen liquor is to provide a rich source of fibrolytic
organisms, which leaves open the possibility that these might be more readily
obtained elsewhere (Omed et al., 2000). Gut micro-organisms, which are
closely associated with plant debris in the rumen, are also excreted with plant
residues in the faeces (Van Soest, 1982; Theodorou et al., 1993, as cited by
Omed et al., 2000). The faecal material also remains largely anaerobic after
38
voiding and the microflora can be viable for several hours after excretion from
the digestive tract (Holter, 1991, as cited by Lowman et al., 1999).
Faeces can, therefore, be a cheap, readily available source of micro-
organisms, which do not require the use of surgically prepared (cannulated)
animals. It can be collected from any individual or several animals, thereby,
minimising the effects of animal to animal variation (Lowman et al., 1999).
Thus, faeces may be an alternative to the rumen fluid inoculum techniques.
Balfe, (1985), as cited by Omed et al. (2000) first explored the use of faecal
organisms, for the estimation of the digestibility of forages. A filtered
homogenate of sheep faeces in artificial saliva, instead of rumen liquor, was
used in the modification of the Tilley &Terry (1963) method. The method was
not convenient for batch operation, as the faecal liquor rapidly blocked the
sintered filters, a feature confirmed by El Shaer et al. (1987) and Akhter et al.
(1994). The undigested residues were recovered by centrifugation, after
transfer of the liquor from the fermentation tubes. Nsahlai & Umunna (1996)
also used reconstituted sheep faeces as inoculum to determine in vitro
digestibility and reported a coefficient of correlation of 0.88 between DM
digestibility obtained using reconstituted faeces, and DM digestibility obtained
using ruminal fluid.
4.2.1 Factors affecting the activity of faecal liquor
4.2.1.1 Source of faeces
Several researchers used different animal species faeces as a source of
inoculum. When comparisons have been made between liquors from different
species, sheep faeces have been consistently shown to provide the greatest
fibrolytic activity and should, therefore, be considered the preferred faecal
source (Omed et al., 2000). Aiple et al. (1992) concluded that the pellet form
of sheep faeces provides a more stable environment for the micro-organisms
to survive and those results, with faeces from sheep, are definitely superior
compared to those obtained using faeces from cattle and pigs. Even faeces
from donkeys have been used as a source of faecal inoculum. Kirkhope &
39
Lowman (1996) have suggested that the use of such an inoculum could prove
useful in assessing nutritive value for donkeys and ponies.
Lowman et al. (1999) and El-Meadaway et al. (1998) used faeces as microbial
inoculum in gas production studies. Lowman et al. (1999) concluded that
equine faeces could also be a suitable source of microbial inoculum. Equids
are hindgut fermenters, with little or no post fermentative digestion and
absorption of microbial cells, as in the case of ruminants. El-Meadaway et al.
(1998) suggested that faeces from cattle are an effective inoculum,
particularly for good quality feeds.
4.2.1.2 Effect of diet
El-Shaer et al. (1987) noted that faeces obtained from sheep fed hay or equal
weights of hay and concentrate produced similar results. This agrees with the
findings of Akhter et al. (1994) who used bovine faecal liquor, prepared from
concentrate-, concentrate-and-hay or hay-fed donors. No significant
differences were found. The dietary effect on faecal liquor activity was less
than that observed when using rumen liquor (El Shaer et al., 1987).
Food residues reaching the large intestine are thoroughly leached, leaving
mainly residual roughage. Data suggest that a high fibre dietary component is
necessary for donor animals, thus ensuring that sufficient fibrous residue is
present in the hindgut to sustain an active cellulolytic bacterial population.
Concentrates, within the diet, would not be expected to influence in vitro
digestibility results (Omed et al., 2000).
Aiple et al. (1992) on the other hand, studied gas production, using a variety
of feeds with liquor from faeces obtained from animals fed different basal
diets. Small but significant differences were identified. For a dense and active
microbial population in the hindgut and hence in the faeces, the diet of the
animals should provide enough fermentable substrate for the lower digestive
tract (Aiple et al., 1992). It seems important to formulate the diet for the donor
animals as manifold as possible (Aiple et al., 1992). Mauricio et al. (2001) also
suggested that when comparing rumen liquor and faeces, data from similar
types of forage should be used when establishing relationships, because the
type of feed offered will have a major influence on the respective microbial
populations.
40
4.2.1.3 Age of faeces
Initial studies on faecal liquor (El-Shaer et al., 1987) used ovine faecal pellets
within 1h of voiding, on the assumption that the pellets would briefly maintain
a suitable environment for cellulolytic bacteria. However, it was noted that
faeces voided up to 6h previously, were equally effective for forage
digestibility (El-Shaer et al., 1987). More recently Pilling (1997), as cited by
Omed et al. (2000), established that ovine faeces maintained their cellulolytic
capabilities for up to 24h, when stored either at room temperature or at 5°C
under anaerobic conditions. Storage for 24h at room temperature did
however, result in a significant decline in activity. Aiple et al. (1992) found that
gas production from hay but not from concentrates by faecal liquor was
reduced, following storage of faeces for 1h under aerobic conditions at room
temperature, indicating the greater sensitivity of cellulytic organisms than non-
cellulolytic organisms to storage. Akhter et al. (1995) concluded that fresh,
frozen or freeze-dried cow faeces are satisfactory and repeatable substitutes
for rumen liquor as sources of micro-organisms for in vitro digestibility assays
of forages. Nsahlai & Umunna (1996) found that the faeces voided up to 2h
prior to inoculum preparation, produced a significant correlation of in vitro
faecal liquor digestibility (r2 =0.85) with in vitro rumen liquor, but that this was
lower than that of other investigations using fresh faeces.
It can be concluded that the method does not depend on fresh faeces,
although these are the most effective (Omed et al., 2000).
4.2.1.4 Choice of buffer
El-Shaer et al. (1987) successfully used artificial saliva (McDougall, 1948),
which is a bicarbonate buffer. The disadvantage of using this buffer is that
when it is dissolved the natural pH is 8.23, and gassing with CO2 is needed to
achieve the pH of 6.8 favoured by cellulolytic bacteria. This is a time-
consuming procedure and direct acidification, following completion of the
fermentation stage, causes extensive frothing. It is therefore necessary to
physically separate the residue from the inoculum, prior to second-stage acid
digestion (Omed et al., 2000).
41
Menke’s medium (Menke et al., 1979), or a modified version has been used
when investigating gas production (Aiple et al., 1992). A phosphate buffer
(Pigden, 1969) was used by Solangi (1997), as cited by Omed (2000). Gas
production from a bicarbonate buffer is higher than with a phosphate buffer,
since a bicarbonate buffer reacts with the acid products of fermentation to
release CO2.
4.2.1.5 Separation of bacteria
The bonds that are formed by the cellulolytic organisms with their substrates
have to be broken, before effective faecal inocula can be produced from ovine
faeces (H.M. Omed, unpublished observation, as cited by Omed et al., 2000).
Solangi (1997), as cited by Omed et al. (2000), found that the percentage of
cellulose samples digested during 48h incubation was greater when the
faeces and artificial saliva were pummelled together in a plastic bag (75%) or
ground together in a pestle and mortar (70%). When shaken with glass beads
in a bottle (67%) or homogenised in a food processor (65%), the percentage
digested declined.
4.2.1.6 Faeces-to-buffer ratio
El-Shaer et al. (1987) used 60 g of faeces in 300 ml of artificial saliva
(McDougall, 1948). El-Meadaway et al. (1998) used a faecal suspension, with
3%, 6% and 9% fresh cattle faeces as inocula. In vitro dry matter digestibility
values, found with the 3% faecal suspension were not different (p>0,05) from
rumen fluid values. Omed et al. (1989) found that a 60 g/l faeces-artificial
saliva suspension produced a more active inoculum. Bacterial separation is
presumably more efficient when a higher buffer-to-faeces ratio is used.
Larger concentrations of faeces (up to 120g/l of buffer) were found to result in
increased in vitro digestion and/or rates of gas production (Akhter et al., 1994;
Solangi, 1997, as cited by Omed et al., 2000). Dilutions of dry matter between
1:20 and 1:50 produced similar gas volumes. Above or below this, gas
production from fibrous substrates was depressed (Aiple et al., 1992). A
trade-off appears to exist between the mass of faeces used and the potency
of the inoculum. Too small a mass of faeces contains insufficient cellulolytic
42
bacteria, while too large a mass of faeces inhibits separation of bacteria
(Solangi, 1997, as cited by Omed et al., 2000).
4.2.1.7 Addition of nitrogen supplement
El-Shaer et al. (1987) found that the inclusion of urea in the buffer improved
correlation with in vivo digestibility for all assays, involving grasses. Nsahlai &
Umunna (1996) replaced urea with ammonium sulphate and found this to be
equally successful.
4.2.1.8 Mixing of the sample and faeces liquor
It is necessary that the faeces liquor be mixed intimately with the forage
sample. Samples are normally shaken for 30 seconds to suspend the solids,
after adding faeces liquor and sealing the digestion tubes. Following the initial
suspension, three different forms of agitation have been used: a shaking
water bath (El Shaer et al., 1987), a rotor contained within an incubator
(Gonçalves & Borba, 1996) or manual shaking at regular intervals (Omed et
al., 1989). All aim to ensure that the intimate mixing, between inoculum and
substrate continue (Omed et al., 2000). It is possible that periodical
suspension allows bacteria to settle and colonise virgin substrate, whereas
constant mixing prevents this (Omed et al., 2000).
4.2.1.9 Duration of incubation
El Shaer et al. (1987) showed that a 48h incubation in faecal liquor was
sufficient for most forages. However, for highly digestible forages, accurate
predictions of digestibility could be obtained with a reduced incubation period
of 36h (Omed et al., 1989), while a 72h incubation was needed to provide a
good correlation with in vivo data for straws (El Shaer et al., 1987).
4.2.2 Use of faecal fluid inoculum for gas production
There have been quite a few studies, using inocula from a suspension of
sheep faeces, in the in vitro gas production technique.
Mauricio et al. (2001) demonstrated that using faeces liquor was associated
with a longer lag phase. This is likely to be due to the fact that the faecal
micro-organisms, originated mainly in the caecum/colon, where fermentation
43
activity is lower than in the rumen. The lag phase is the period when the
micro-organisms present develop, to enable digestion of the substrate. The
length of the lag time is longer with faeces liquor than with rumen liquor,
because the micro-organism population is lower and they are in a ‘state of
suspended animation’ from which it takes a longer period of time to begin
growing and dividing. A number of environmental factors, in this instance
being low substrate availability and the higher oxygen concentration, bring this
about. Thus, micro-organisms in faeces are likely to exists in a survival mode’
with low metabolic activity, rather than in an actively growing and dividing
state. It can be concluded that faecal matter has potential as an alternative
inoculum to rumen liquor for the in vitro gas production technique, but
methods of overcoming the longer lag phase with faeces require further
research. El-Meadaway et al. (1998) found that total gas production values
were similar, regardless of the source of inoculum.
Lowman et al. (1999) suggested that although faecal material can be a
suitable alternative to rumen liquor, separate calibrations with in vivo data are
required as the rumen digesta and faecal inoculum produced slightly different
gas production profiles. This agrees with the results of Harris et al. (1995).
The different profiles may be due to the different bacterial populations in each
inoculum (El-Meadaway et al., 1998).
4.2.3 Microbial population
Evidence suggests that most rumen organisms fail to survive into the large
intestine, but it is likely that the bacterial community is self-sustaining. The
bacterial population of the large intestine and faeces of ruminants includes
numerous bacterial species present in the rumen (Omed et al., 2000). The
time in the large intestine permits multiplication, so species depleted by
proteolytic activity have a chance to recover, provided niches are available.
The hindgut of the faeces donor needs slowly fermentable nutrients to
stimulate multiplication of cellulytic digesters (Aiple et al., 1992).
Gonçalves & Borba (1996) reported incidences of lower in vitro digestibilities
using faecal liquor and concluded that this could be due to differences in the
microflora present. It is unlikely that lower bacterial numbers in the large
44
intestine are responsible, as the bacterial density there is similar to that in the
rumen (1010-1011g-1 ) (Allison, 1984, as cited by Omed et al., 2000). This
suggests that the differences can be due to fewer cellulolytic species being
extracted into the liquor. It may be compounded by the supply of nutrients
obtained from the rumen fluid. Faecal fluid may lack trace elements and
micronutrients, reinforcing the effect of forage deficiencies on digestibility.
Few soluble carbohydrates will be available, consequently non-cellulolytic
microbial growth will be inhibited until solubilisation occurs under the actions
of the cellulolytic microbial population (Omed et al., 2000). El-Meadaway et al.
(1998) concluded that the relative size of the total and cellulytic populations,
were higher for rumen fluid than for faecal fluid with a greater number of
bacterial genera being isolated from rumen fluid.
The difference in rate of gas production between rumen liquor and faeces as
sources of micro-organisms, can be explained by the diversity of types of
micro-organisms present. The diversity is less in the faeces and thus less
efficient digestion will result in a slower rate of gas production (Mauricio et al.,
2001).
Although the hindgut of ruminants is regarded more as a fermentation
chamber for structural carbohydrates escaping the rumen, it can be seen that
the microbes present are very adaptable and able to degrade non-structural
carbohydrates as well (Aiple et al., 1992).
4.2.4 Factors affecting the second stage incubation
Centrifugation of faecal liquor at 2000 g for 20 minutes was recommended by
El Shaer et al. (1987), but O’Donovan (1995), as cited by Omed et al. (2000)
encountered problems with centrifugation, for upon completion, some of the
forage samples failed to settle, requiring supernatant removal by pipette.
Filtration through sintered glass has also been reported to be problematic (El
Shaer et al., 1987). The acid pepsin treatment, used by El Shaer et al. (1987),
was copied from Tilley & Terry (1963), but it was recommended that the

45
concentration of pepsin be raised from 2 g/l to 4 g/l, as 2 g/l produced lower
than expected digestibilities.
4.3 THE EVALUATION OF THE ENZYME TECHNIQUE
Although methods using microbial inocula have been widely and successfully
used for a range of different forages, there are inherent problems in their use.
Attention has therefore been focused more recently on the replacement of
microbial inoculum methods by enzyme techniques, which use crude cellulase
preparations (Jones & Theodorou, 2000).
Enzymatic techniques could have the advantage of being completely
independent of the animal, which should result in less variation, thereby
making this technique relatively simple to standardise. Conversely, the
biological validity of the results can be limiting, as a result of incomplete
enzymatic activity compared with the ruminal environment (Stern et al., 1997).
Cellulytic enzymes as alternatives to rumen fluid are clearly an attractive
prospect if their use gives results comparable to those obtained with inoculum
methods. The use of enzymes eliminates the need cannulated animals and
anaerobic procedures, thereby simplifying analytical methodology and
eliminating the variability in activity between analytical batches (Jones &
Theodorou, 2000).
The use of enzymes is based on the chemical constituents of forages, which
can be divided into those making up the structure of the plant (cell wall
constituents) and those contained within the cell (cell contents). The cell
contents are essentially completely digestible in vivo and comprise soluble
carbohydrates, starch (in some forages), protein, organic acids, lipids and
soluble minerals. The cell wall constituents (essentially cellulose,
hemicellulose and lignin) vary in digestibility depending on their polymeric
configuration, degree of crystallinity and degree of lignification. Lignin itself is
largely indigestible under anaerobic conditions and its presence exerts a
profound effect on the digestibility of the cell wall fraction associated with it.
The in vivo digestibility of the cellulose and hemicellulose therefore varies
46
from completely digested when unlignified, to completely undigested, when
highly lignified. The cuticle and surface waxes are also indigestible to a large
extent (Jones & Theodorou, 2000).
The enzyme activities sought for analytical procedures to predict in vivo
digestibility need to reflect the digestive processes in the ruminant. The
procedure needs to remove the soluble constituents (cell contents) and to
solubilise unlignified and moderately lignified cell wall to a significant extent.
The extent of solubilisation does not necessarily need to be as complete as in
the in vivo technique, but needs to reflect the effects of lignification in a
comparable and correlated way. Soluble constituents are readily removed in
the pre-treatment with acid pepsin or neutral detergent, which form part of
most of the proposed enzyme methods. The presence of starch in certain
forage crops (maize, cereals) needs to be taken into account, since it is not
removed by acid pepsin, neutral detergent or incubation with cell wall
degrading enzymes. An additional treatment with amyloglucosidase or mild
acid hydrolysis is therefore required in the analysis of forages or feeds
containing starch (Jones & Theodorou, 2000).
The cell wall degrading enzyme used must be sufficiently active to achieve
the second objective, namely the solubilisation of a significant amount of the
cell wall. Crude cellulase preparations are readily available in liquid or solid
form, all of which appear to hydrolyse both cellulose and hemicellulose. There
is a wide disparity in the activity of cellulases from different fungal sources. It
is thus essential to establish the activity of the cellulase by reference to plant
cell wall material or cellulose paper and not to soluble derivatives, such as
carboxymethyl-cellulose. Crude cellulases from Trichoderma species have
generally been found to be the most reliable sources of crude cellulase, but
the activity of enzymes of different suppliers should always be checked before
use (Jones & Theodorou, 2000).
4.3.1 Sources of enzymes
Fungi and other micro-organisms, which produce enzymes able to digest
plant fibre, are very widely distributed in nature, although those able to
47
degrade crystalline cellulose are less common. Micro-organisms in the gut of
herbivores enable these animals to survive on diets largely composed of plant
fibre and therefore vast areas of natural and improved grasslands are thereby
utilised for the production of food (Jones & Theodorou, 2000).
Ideally, the enzyme system used to predict in vivo digestibility would be
derived from rumen micro-organisms, but these have been unsuccessful in
comparison with aerobic fungi and generally gave poor results. This is related
to the anaerobic growth habit of micro-organisms in the rumen, which means
that the yield of extracellular hydrolases is poor in comparison with that of
their aerobic counterparts. Other factors in enzyme production include the fact
that rumen bacterial cellulases are not extracellular but are often produced in
a large complex, the cellulosome, which is tightly associated with the bacterial
cell or bound to the substrate that is being degraded (Jones & Theodorou,
2000).
In view of the above mentioned difficulties, attention has been directed
towards the use of aerobic cellulolytic fungi. The cellulase and associated
enzyme systems of these fungi are extracellular and are, therefore, readily
recovered from the culture fluid in which the organism is grown. Culture
solutions comprise a mixture of salts, nutrients and cellulose at the requisite
pH. After a growth period of 7-10 days under aerobic conditions, the culture
fluid is removed by filtration and freeze-dried or an acetone powder is
prepared (Jones & Theodorou, 2000).
Trichoderma cellulases have generally been found to be more active than
those of other fungi, when using native cellulose or plant cell walls as
substrates. It is evident that the complex comprises several enzymes
necessary for attack of highly orientated forms of cellulose. This includes
exocellulase and endocellulase, which attack amorphous regions of the
cellulose polymer, producing shorter chain oligomers, and a
cellobiohydrolase, which hydrolyses cellobiose to glucose. It is essential that
cellulases used for forage and feed analyses retain all the components of the
complex, otherwise poor activity is obtained (Jones & Theodorou, 2000).
48
4.3.2. Different pre-treatments on cellulase digestion
4.3.2.1 Incubation with acid pepsin
Incubation with pepsin in 0.1 mol/l hydrochloric acid prior to cellulase
treatment was shown, by Jones & Hayward (1975), to increase the amount of
dry matter solubilised and to significantly improve the correlation of enzyme
solubility with the in vivo digestibility of grasses. These authors concluded that
acid-pepsin treatment improved the accessibility of the cell wall
polysaccharides to the cell wall degrading enzymes.
Pepsin-cellulase solubility was also found to be highly correlated with in vitro
(inoculum) digestibility for grasses and clover, with very similar regression
equations derived from different species. This method was found to be highly
reproducible (Jones & Theodorou, 2000).
The only modifications to the original method described by Jones & Hayward
(1975) are (1) the reduction of incubation time in cellulase from 48h to 24h
and (2) the use of a liquid Trichoderma cellulase.
It was concluded that the enzyme method could accurately predict in vivo
digestibility, provided samples of known in vivo digestibility similar to those
being tested were included as standards in each run (Jones & Theodorou,
2000).
The enzyme solubility was less accurate than the inoculum method for
predicting the digestibility of the legumes, when Terry et al. (1978), as cited by
Jones & Theodorou (2000), compared the pepsin-cellulase technique with the
two stage inoculum method (Tilley & Terry, 1963). For the inoculum method, a
single regression equation was permissible for both grasses and legumes.
Separate regressions were however required for grasses and legumes, when
the enzyme technique was used.
Aufrere & Michalet-Doreau (1988) have suggested an interesting variation of
the pepsin-cellulase technique to cater for feeds containing starch. The
method involves the following three stages. After the initial acid-pepsin
incubation at 40ºC, the temperature is raised to 80ºC for 30 minutes to
hydrolyse starch. The final stage is incubation with cellulase after removal of
the acid pepsin. The results were highly correlated with in vivo digestibility for
a range of forage, straw and mixed diets, containing varying preparations of
49
concentrates and byproducts. De Boever et al. (1988) have described a
similar procedure with a longer heating time at 80ºC.
4.3.2.2. Neutral detergent extraction
Neutral detergent extraction, under reflux or at 100ºC, has been widely used
as a pretreatment before incubation with cellulase. Jones & Bailey (1974), as
cited by Jones & Theodorou (2000) showed cellulase digestion with neutral-
detergent residues from grasses to be highly correlated with the voluntary
intake of grasses by sheep. Improving both digestibility and intake by
breeding programmes could benefit from this procedure.
Downman & Collins (1982) compared cellulase solubility, using varying
concentrations of cellulase, after either pepsin or neutral-detergent
pretreatment, with in vitro (inoculum) and in vivo digestibility for a range of
forages, silages and complete diets. An additional digestion with
amyloglucosidase was included in the enzyme methods for materials
containing starch. The results indicated that the enzyme techniques were, at
least, as precise as in vitro inoculum for predicting the in vivo digestibility of
most forages. There were little differences between the two enzyme methods,
although the pepsin-cellulase method was easier to manipulate and less time
consuming than the detergent method. An advantage of the latter was that
samples could be analyzed in fewer working days. It was concluded that both
cellulase methods could be regarded as acceptable alternatives to the in vitro
inoculum method for the routine evaluation of forages.
Downman (1993) has proposed a modified detergent cellulase method to
accommodate the galactomannans found in palm kernel oil. These
polysaccharides are not solubilised by cellulase, but can be solubilised by the
inclusion of an additional carbohydrase, gamanase. This can be included in
the buffered cellulase solution and at to increase the digestion temperature to
a 40h period. This modified method significantly improved the correlation with
in vivo metabolisable energy values.
McLeod & Minson (1982) compared the accuracy of the detergent and pepsin
cellulase methods for predicting the in vivo digestibility of a range of grass and
50
legumes. Both cellulase methods were highly correlated with in vivo
digestibility values, although pepsin pretreatment appeared to be more
precise for grasses and detergent pretreatment for legumes. It was concluded
that the pretreatment with detergent increased analytical error and that the
method failed to produce an overall improvement in the accuracy of predicting
in vivo digestibility; any advantage gained from shorter analysis time was
offset by an increase in analytical error.
Similarly, Coelho et al. (1988) found no advantage of detergent, compared
with pepsin, pretreatment for predicting in vivo digestibility for lucerne, a range
of grasses and rye-lucerne mixtures. Givens et al. (1990a), as cited by Jones
& Theodorou (2000), compared the accuracy of different laboratory
techniques, in predicting the in vivo digestibility. These researchers concluded
that the detergent-cellulase and pepsin-cellulase methods were less affected
by factors, such as year of harvest, location etc. and better related to in vivo
values than in vitro (inoculum) or fibre estimations.
Bughrara & Sleeper (1986) concluded that the one stage cellulase technique
would be adequate as a rapid, low cost, method for screening in plant
breeding programmes. More precise estimations required pretreatment with
detergent or pepsin, although both enzyme methods were considered to be
more rapid and convenient, and less costly, methods of predicting in vivo
digestibility than the two stage in vitro inoculum method of Tilley & Terry
(1963).
4.3.2.3. Hot-acid extraction
More drastic pretreatment than pepsin or neutral detergent has been
proposed in efforts to increase the amount of dry matter solubilised by
cellulase by levels comparable with in vivo digestion. Krichgessner & Kellner
(1977), as cited by Jones & Theodorou (2000), found refluxing with 2 mol/l
hydrochloric acid for 30 minutes, followed by digestion with cellulase and then
pepsin, to give values numerically similar to in vivo digestion for a range of
forages.
Pace et al. (1984) found in vitro (inoculum) values for grasses and legumes to
be highly correlated with pepsin-cellulase solubility and the reflux acid
method. Bughara et al. (1989) found that the reflux acid method compared
51
favorably with the detergent and pepsin methods when applied to lucerne
forages.
De Boever et al. (1988) compared the accuracy of different enzyme
techniques and in vitro inoculum for predicting the in vivo digestibility of maize
silage, grass silage and grass hay. The enzyme techniques included: (1) the 2
mol/l acid-cellulase procedure (2) pepsin-cellulase solubility with varying
incubation times for the pepsin and cellulase stages and (3) a variant of the
pepsin-cellulase method involving three stages, namely: incubation in acid-
pepsin, heating the acid pepsin solution at 80ºC for 45 minutes, to remove
starch and finally incubation with cellulase. The detergent-cellulase method
was not evaluated, as this method had proved more difficult to manipulate
than pepsin-cellulase, resulting in a lower repeatability. The in vitro inoculum
method was the best predictor of in vivo digestibility for grass silage and hay,
but the enzyme methods were generally superior for maize silage, particularly
methods involving a hot acid pretreatment. The drastic 2 mol/l acid gave poor
results, since the pretreatment remove hemicelluloses, which is generally
shown to be the least digestible fraction of the cell-wall polysaccharides, in in
vivo studies. However, the advantage of this method lies with removing starch
without an additional amyloglucosidase, which is not the case with the other
two pretreatment methods. Aufrere & Michalet-Doreau (1988) proposed a
similar method as De Boever et al. (1988), but with a shorter heating time at
80°C. The 2 mol/l acid pretreatment, has sometimes given poor results,
because this removes hemicelluloses, generally shown in in vivo studies, to
be the least digestible fraction of the cell wall polysaccharides. It did, however,
have the advantage of removing starch.
4.4 THE EVALUATION OF THE IN VITRO GAS PRODUCTION
TECHNIQUE
There is a need for a simple, cheap and reliable laboratory technique to
evaluate the nutritive value of forages for ruminant animals. Not only are the
cost and animal welfare considerations making the use of animals less
desirable, but also the increasing human population and demand for animal
52
products create a need for new animal feedstuffs and improved varieties of
traditional ones (Williams, 2000). Measuring gas production during
fermentation is non-destructive, cheap, rapid and can be largely automated
(Pienaar, 1994).
While by no means a new concept, the measurement of gas production to
evaluate forages has come to prominence in the last 10 years (Williams,
2000).
4.4.1.1.Early techniques: Ouin (1943), as cited by Williams (2000), used gas
tight flasks and measured gas manometrically. Measurement of gas by using
liquid displacing systems was suggested in the 1960’s (Johnson 1963, as
cited by Williams, 2000). Later, gas production was measured by use of a
syringe system to simplify measurement of gas by manometry (El-Shazly &
Hungate, 1965, as cited by Williams, 2000).
Waghorn & Stafford (1993), as cited by Getachew et al. (1998), used a
manometric method to measure gas production. Each flask was connected to
a manometric measuring device, which enabled gas volumes to be measured
at atmospheric pressure. The applicability of this method seems to be limited
in routine feed evaluation, because it can handle only a small number of
samples. The accuracy of the manometric, or glass syringe, systems depends
on the accuracy of reading the gas volume in the syringes and reading the
manometer, which may be low. Both systems require a periodic reading of the
gas volume produced, which makes the measurements laborious and time-
consuming (Cone et al., 1996).
4.4.1.2. The Hohenheim gas test: This fermentation process was conducted
within large glass syringes, so that the gas produced pushed the plunger
outwards and the total volume produced was recorded after 24h (Menke &
Ehrensvard, 1974, as cited by Williams, 2000). When larger samples are
incubated, more gas is produced and this necessitates frequent pushback of
the plunger which is inconvenient and is also a potential source of error. The
syringes are also narrow and it is difficult to place a large amount (>500 mg)
53
of sample, particularly those that are bulky in nature e.g., straws and stovers
(Getachew et al., 1998). This evaluation system combines the total gas
volume after 24h with the concentration of crude protein (CP), crude fat, crude
fibre and ash of the feed to predict metabolisable energy (ME) (Williams,
2000).
Blümmel & Ørskov (1993) have adapted the Hohenheim gas test by recording
the change in gas production in the glass syringes at regular time intervals, so
that a measure of the kinetics of fermentation is obtained, as well as the end-
point value. A thermostatically controlled water bath was used.
The main advantages of the modified method (Blümmel & Ørskov, 1993) are
that there is only a minimal drop in temperature of the medium during the
period of recording gas readings on incubation of syringes in a water bath.
This is particularly useful for studying the kinetics of fermentation where gas
volumes must be recorded at various time intervals. Secondly, an increase in
the amount of sample reduces the inherent error associated with gravimetric
determination needed to determine concomitant in vitro apparent and true
digestibility (Blümmel et al., 1997).
4.4.1.3. The manual transducer technique: Theodorou et al. (1991), as
cited by Williams (2000), used a pressure transducer to measure headspace
gases in sealed serum bottles. The use of serum bottles isn’t as expensive as
the glass syringes used by Menke et al. (1979). The pressure and volume
were recorded at regular intervals of approximately every 3-4h for the first
24h, and then less frequently to the end of fermentation at about 120 or 144
hours. The headspace gas is removed after each reading. The cumulative gas
profile represents the kinetics of the fermentation process of individual
feedstuffs.
Only one pressure transducer is required and a larger number of samples can
be handled at a time and at lower cost. However, the large number of
ingredients used complicates medium preparation and the method also
involves an aseptic technique, which makes initial preparation cumbersome.
54
The accumulated pressure is not released and this may negatively affect
microbial fermentation. There may also be a change in the solubility of the
gases in the medium, which may cause error in gas measurement (Getachew
et al., 1998). Periodic reading of a digital display and the manual release of
overpressure are still, however, needed, making the system less suitable for
routine analysis (Cone et al., 1996).
4.4.1.4. The automated systems: Mauricio et al. (1999) described the
Reading Pressure Technique as an in vitro feed evaluation system, based on
a semi-automated gas production technique. The simplicity, low cost and high
capacity of this system makes it ideal for situations where either budget
constraints or the level of technical expertise required render the more
complex systems inappropriate.
Beuvink et al. (1992), as cited by Williams (2000), used a closed system,
based on the weight of the fluid that is displaced by fermentation gas for 24
individual bottles. The change in weight was recorded and a calculation made
to convert the weight to gas volume, which was then registered by a data
logger.
This system needs to be equilibrated, before the actual measurement starts.
This is laborious and complicated (Getachew et al., 1998). It is also
technically difficult to maintain and has a relatively high internal resistance,
introducing an artificial lag time (Cone et al., 1996).
Pell & Schofield (1993) first described the use of computerised pressure
sensors to monitor gas production. Several variables were investigated, such
as sample size, inoculum size, vessel size and type of pressure sensor.
Ranges, within which gas production could be accurately measured, were
then reported. A revised procedure by Schofield & Pell (1995) added a new
step, which consisted of recalibration of the pressure sensors by infusing a
known volume of CO2 every time they were used.
An automated version of the manual transducer technique (called the
55
automated pressure evaluation system (APES)), was first reported by Davies
et al. (1995), as cited by Williams (2000). The system allowed for 50 gas-tight
culture bottles, each of which was fitted with a pressure sensor and solenoid
valve linked to a computer for continuous monitoring of all bottles. During
fermentation, each solenoid valve opens to release the accumulated gas
when the pressure sensor registers a pre-set gas pressure. The number of
vents and the time between each vent for each bottle are recorded
automatically by a computer and are then plotted to give cumulative gas
profiles.
Cone et al. (1996) described a fully automated time related gas production
apparatus. It uses a combination of pressure transducer and an electric valve
for every bottle. Each valve opening represented a fixed amount of gas and
the fermentation kinetics were determined by recording the time of each valve
opening on a data logger (Williams, 2000). Frequent recording of gas
production, offers an advantage over manual recording of gas volume
(Getachew et al., 1998). The fully automated system has a high initial cost,
complex and high maintenance, but is not so labour intensive (Mauricio et al.,
1999).
The general principle of what the different techniques measure is the same.
The technique is similar to the other in vitro digestibility procedures, which use
milled substrates, an anaerobic medium and an inoculum of a mixed microbial
population from the rumen. The pre-weighed substrate is suspended in a
medium, the mixture warmed to ~39°C and a freshly collected sample of
rumen fluid added as inoculum. From that moment, the production of gas
resulting from fermentation is recorded, either at the end of fermentation or at
regular time intervals, for those methods that measure fermentation kinetics.
A cumulative profile is plotted from the results at the end of fermentation. The
curve records the production of a waste product by the micro-organisms, and
so reflects the kinetics of microbial activity (Williams, 2000).
In vitro gas production is related solely to fermentation in the rumen, rather
than to digestibility in the whole digestive tract which also includes enzymatic
56
digestion, absorption and hindgut fermentation.
Rumen fermentation is mainly the result of the activity of the bacteria,
protozoa and fungi in the rumen (Williams, 2000).
4.4.2. Origin of gas
When a feedstuff is incubated with buffered rumen fluid in vitro, the
carbohydrates are fermented to short chain fatty acids (SCFA), gases (mainly
CO2 and CH4) and microbial cells. When substrate is fermented, acetate,
propionate and butyrate are produced (Getachew et al., 1998). The gas
produced in the gas technique is the direct gas produced as a result of
fermentation (CO2 and CH4) and the indirect gas produced from the buffering
of SCFA (CO2 released from the bicarbonate buffer) (Getachew et al., 1998).
4.4.3. Factors that have an influence on the gas production technique
As with the Tilley &Terry (1963) in vitro technique, Cone et al. (1996) found
that the shape of the gas production curve was influenced by several factors.
The chemical composition of the substrate, the ration and the adaptation of
the donor animal to the ration, the time of obtaining the rumen fluid from the
donor animal and the concentration of the substrate.
4.4.3.1. Sample characteristics
The preparation of a forage sample is fraught with many factors that should
be considered with the in vitro gas production technique. It is generally
recognised that a smaller particle size increases the surface area available for
microbial degradation (Williams, 2000). Consequently, most authors, mill the
sample through a 1mm screen, for routine gas production studies (Menke et
al., 1979; Pell & Schofield, 1993; Theodorou et al., 1994)
The method and temperature of drying the samples, used by most groups, is
either freeze-drying or oven-drying at low temperatures, either 60°C or 70°C
(Beuvink et al., 1992; Pell & Schofield, 1993). Oven drying of the samples
eliminates the volatile constituents from fermented substrates, thus reducing
the indirect gas produced from their reaction with the buffer (Deaville &
57
Givens, 1998). When Cone et al. (1994), as cited by Williams (2000),
compared different drying conditions, it was concluded that freeze-drying was
better than oven drying. An increase in gas production was found, when
Sanderson et al. (1997) freeze-dried and milled the samples compared to
chopped or unchopped fresh forage.
4.4.3.2 Inoculum characteristics
Another factor which can influence the in vitro gas production profiles, is the
microbial activity of the inoculum (Jessop & Herrero, 1998, as cited by Nagadi
et al., 2000b). This could be affected by the frequency of sampling of ruminal
liquor (Nagadi et al., 1999, as cited by Nagadi et al., 2000b), the time of
collection (Pell & Schofield, 1993; Cone et al., 1996), animal species
(Williams, 2000), the extent of dilution with buffer and the preparation of the
inoculum (Pell & Schofield, 1993). Combining rumen fluid from different
animals will minimise the difference in activity of the inoculum (Cone et al.,
1996).
Therefore, differences in the activity of micro-organisms from rumens of
different species or of the same species, but different diets, results in the
necessity to describe the conditions of the donor animal, when conducting in
vitro gas production evaluations (Williams, 2000).
4.4.3.3. Diet
The diet of the host animal influences the chemical environment within the
rumen and subsequently the microbial population of ruminal fluid (Weiss,
1994, as cited by Nagadi et al., 2000b). Several studies have indicated that
the diet of donor animal influences, both the total gas production (Menke &
Steingass, 1988, as cited by Nagadi et al., 2000b) and the gas production
profiles (Cone et al., 1996). Pell & Schofield (1993) and Theodorou et al.
(1994) used ruminal fluid taken from donor animals fed on hay only. Others
used ruminal fluid taken from host animals fed on a particular ratio of hay to
concentrate, although the ratio varied between groups and the composition of
the concentrate is rarely specified (Cone et al., 1996). These differences in
the diet of donor animals, may affect microbial activity or concentration and
subsequently, the gas production profiles and, therefore, causes differences
58
in gas production data between laboratories (Moss et al., 1998, as cited by
Nagadi et al., 2000b). Nagadi et al. (2000b) showed that changes in the
microbial concentration in ruminal fluid caused by variation in diet, altered the
gas production profile.
4.4.3.4 Media composition
The living rumen provides an ideal environment for its anaerobic micro-
organisms in terms of pH, temperature, buffering capacity and nitrogen in the
urea form. The micro-organisms also behave symbiotically, by providing each
other with micronutrients, such as branched chain fatty acids and vitamins
(Williams, 2000). Cellulytic bacteria have an optimum temperature and pH for
growth and if this is not optimum, then gas production will be decreased
(Russell & Dombrowski, 1980, as cited by Adesogan, 2002).
All media, used currently, contain buffers, a reducing agent, a nitrogen
source, mineral and vitamins and resazurin, as a redox potential indicator.
The CO2 is used during the medium preparation, to ensure a low redox
potential at the time of inoculation. This low redox potential is very important
in fermentation of fibrous forages (Williams, 2000).
High phosphate buffers reduce gas production by utilising protons that would
have been used for CO2 production (Schofield, 2000, as cited by Adesogan,
2002). If the rumen fluid inoculum to buffer ratio is greater than 1:2, the blank
will no longer truly represents the contribution of inoculum to gas production
(Cone et al., 1997). Measurement of pH is to be recommended at the end of
fermentation to ensure sufficient buffering capacity was available (Williams,
2000).
One of the most challenging problems associated with using gas production
methods, is that the amount of gas produced varies with different molar
proportions of volatile fatty acids (VFA) (Stern et al., 1997). Schofield & Pell
(1995) suggested that it is important to monitor the molar proportion of VFA to
correct for such differences.
59
The molar proportions of different short chain fatty acids (SCFA) (acetate,
propionate and butyrate) produced are dependent on the type of substrate
(Blümmel & Ørskov, 1993). Therefore, to compare gas data between different
forages, it is also useful to examine differences in the acetate:propionate ratio
at the end of fermentation (Groot et al., 1998). Rapidly fermentable
carbohydrates yield relatively more propionate as compared to acetate, and
the reverse takes place when slowly fermentable carbohydrates are
incubated. If fermentation of feeds leads to a higher proportion of acetate,
there will be a concomitant increase in gas production compared with a feed
with a higher proportion of propionate. In other words, a shift in the proportion
of SCFA will be reflected by changes in gas production (Getachew et al.,
1998).
Gizzi et al. (1998) found that the higher values for acetate, propionate and
butyrate measured in the fermenters after 24h is likely to be a consequence of
the accumulation of end products in the closed system.
Protein fermentation influenced gas production mainly in the initial hours of
incubation, because the major part of protein is part of the soluble fraction
(Cone et al., 1999). Gonzàlez-Ronquillo et al. (1998) found that measuring
gas production to estimate microbial fermentation, is a useful technique but
high differences in protein content may bias the results.
Caution in the interpretation of gas production profiles, particularly for forages
of heterogeneous composition, should also be kept in mind. When the cell
wall and cell contents predicted gas production profiles were compared to the
measured profiles, there was generally an overestimation. These results
suggest that gas production profiles are not necessarily linearly related to
degradation or fermentation of substrates. For forage evaluation it is important
to distinguish between degradation and fermentation, as not all degraded cell
wall material is necessarily fermentable (Groot et al., 1998).
4.4.4 Some correlations with other techniques
Comparing in vitro techniques with each other is pointless, unless they are
60
being related to the same set of in vivo data and one can determine which
technique is a better predictor of the in vivo parameters (Williams, 2000).
Menke et al. (1979) found that the in vitro gas measurement correlated well
with the in vivo organic matter (OM) digestibility. Close correlation between
gas production and in vivo digestibility was also reported by Menke &
Steingass (1988), as cited by Williams (2000).
Prediction of metabolisable energy is more accurate when based on gas
measurements (Getachew et al., 1998). Aiple et al. (1996), as cited by
Getachew et al. (1998), found that for predicting nett energy content of
individual feeds, the gas method was superior to the enzymatic and crude
nutrient technique. Pell & Schofield (1993) suggested that under conditions in
which nutrients are not limiting, gas production is a direct measure of
microbial growth, and in some respects is a better index for predicting forage
ME than the indirect measure based on NDF disappearance. Nataraja et al.
(1998) concluded that the use of the in vitro gas production technique has the
potential to be applied to determine ME.
High correlations between gas production and NDF disappearance, r2 = .99
(Pell & Schofield, 1993) or gas production and DM disappearance, r2 = .95
(Prasad et al., 1994), have been reported. However, gas data are more
difficult to interpret than neutral detergent fibre disappearance, because gas is
generated from a wide range of substrates, including both soluble and
insoluble fibre components (Schofield et al., 1994).
The gas production technique and triphasic model proved to be an alternative
to the Tilley & Terry (1963) technique and nylon bag technique (Cone et al.,
1999). Cone et al. (1997) concluded that the cumulative gas production
profiles could be divided into three phases. The first phase representing the
fermentation of the soluble fraction, the second phase representing the
fermentation of the non-soluble fraction and the third phase, which is not
caused by fermentation of the feedstuff, is the consequence of microbial
turnover which becomes detectable when substrates become exhausted.
61
Thus, fermentation kinetics can be determined for both the soluble and non-
soluble fractions, which makes it possible to compare with the Tilley & Terry
(1963) technique and nylon bag technique.
Cone et al. (1998) proved that the gas production technique is an accurate,
reliable and cheap alternative for the in situ technique to determine
differences in fermentation characteristics and feed evaluation parameters of
different grass samples. Khazaal et al. (1993) also concluded that the gas test
has good potential for predicting apparent digestibility and intake, to a level
close to that of the nylon bag technique.
Pienaar (1994) found that the rate of fermentation determined by gas
production, agreed well with the results obtained with the in sacco nylon bag
technique. A largely unexplained discrepancy was found between the in vivo
results and the other methods, when the latter was corrected for rate of
passage (Pienaar, 1994).
Schofield & Pell (1995) used gas production to measure and determine the
kinetics of the neutral detergent soluble carbohydrate fraction and found a
good correlation between the volume of gas produced and the mass of fibre
digested in the samples.
4.4.5. Advantages and disadvantages of the gas production technique
The advantages of this technique are multiple. The amount of material
required ranges from 0.1 to 1 g, making it suitable for materials available in
limited quantities (e.g. from plant-breeding trials, plants grown under special
conditions, etc.) (Williams, 2000).
The initial equipment required could be expensive, but, as the hours for
measuring are significantly reduced, it is a matter of balancing the capital
costs of the equipment with the labour costs (Kitessa et al., 1999; Williams
2000).
62
The use of gas production to study carbohydrate digestion presents an
advantage over the traditional gravimetric method, because it accounts for
both soluble and insoluble substrates (Pell & Schofield, 1993).
Nherera et al., (1999) concluded, that the in vitro gas production technique
has the potential, to be an important tool for assessing degradation (rate and
extent of fermentation over 96h) and estimating in vivo microbial nitrogen
supply (24h gas test) of diets, supplemented with leguminous fodder tree
forage. The 24h gas production test was able to reflect trends in gas
production and degradation, similar to those established in the 96h gas
production test. This also offered the advantage of being able to predict
microbial nitrogen yield. It is, therefore, recommended that the shorter
incubation be used, as this will enable more feeds to be evaluated over a
short period of time.
Nagadi et al. (2000a) harvested ruminal microbes to determine the effect they
had on gas production dynamics. These researchers found no alteration in the
pattern and this increased the potential of the gas production technique,
enabling more control of the nature of the microbial inoculate and microbial
concentration. This demonstrates that protein-energy interactions can be
studied using the in vitro gas production technique.
The relation between gas production and feed intake is interesting, as being
of immediate practical relevance (Williams, 2000). Roughage which produced
proportionally less gas per unit substrate truly degraded, had higher feed
intakes (Blümmel et al., 1997).
It is accurate enough to record small changes in the fermentation process.
Changes from a semi aerobic, hydrogen producing type fermentation, to a
strictly anaerobic type of fermentation, could cause changes in gas pressure,
which are not necessarily related, to the disappearance of the solid substrate.
Fortunately, these changes are small and usually only occur during the start
of the fermentation process (Pienaar, 1994).
63
Information obtained from gas production remains an indicator of what
happens in the rumen, rather than the whole animal, because it measures
kinetics of fermentation (Williams, 2000). There is also still a need cannulated
animals to supply rumen fluid, but far less than for in vitro digestibility trials.
Faeces have been used as an alternative inoculum (Aiple, 1993, as cited by
Williams, 2000).
The lack of uniformity in methodology, which makes comparison of results
from different groups difficult, is offset against the advantages.
Standardisation in terms of kind of medium (ideal buffer concentration,
micronutrients and anaerobiosis), timing of inoculum collection and diet of
donor animals, still needs to be refined. Other important details include:
treatment of inoculum to maximise cellulolytic organism activity, use of blanks,
sample preparation in terms of drying and grinding, relationship between gas,
VFA and microbial production (Williams, 2000). Williams (2000) showed that
atmospheric pressure determines actual gas volumes. This is often omitted,
making it difficult to compare results from different laboratories. Stirring
reduces CO2 supersaturating, which may also cause erroneous
volume/pressure readings (Pell & Schofield, 1993).
Blümmel et al. (1997) found that using the in vitro gas production technique
might select against maximum microbial yield, by favouring substrates with
proportionally high SCFA yield. This intrinsic disadvantage can be overcome
by combining gas measurements with determination of the undegraded
residue.
Rymer & Givens (1997) used three sets of apparatus and found that the
results obtained, using one gas production system, cannot reliably be
extrapolated to another.
4.4.6 Applications of the gas production technique
Differences in quality of hay, grass or silage, due to plant maturity and
conditions of growth, have been investigated by Williams (2000) using the gas
production technique. Gas-production kinetics is also used to rank different

64
species or cultivars (Piva et al., 1988, as cited by Williams, 2000). It has been
used to determine differences in fermentability, between different chemical
(Prasad et al., 1994) and physical pre-treatments of straw, crop residues of
different cultivars or growth under different environmental conditions. The
effect of addition of supplements on the fermentability of straws was also
determined (Prasad et al., 1994).
Different browse trees, as potential feed supplement for poorly degradable
roughages, have been ranked by using the gas production technique (Topps,
1992).
In the in vitro gas method the effects of anti-nutritive factors (ANFs) on rumen
fermentation are reflected in the gas production (Getachew et al., 1998).
Given that there are several possible mechanisms by which browse ANFs
could affect microbial activity, the technique has been used to pinpoint, which
mechanism is responsible for changes to fermentation (Williams, 2000).
Khazaal et al. (1995), as cited by Nherera et al. (1999), reported that the gas
production method was better in determining the nutritive value of fodder trees
containing anti-nutritional factors.
Starch and protein are important components of forages and their
fermentation can provide insight into the fermentation of the whole forage
(Williams, 2000). It was reported that gas production was highly correlated
with in vitro DM disappearance, total VFA production and starch digestion
(Trei et al. 1970, as cited by Williams, 2000). More recently, gas production
from fermentation of several starch-based substrates, proved to be an
accurate index of VFA production and change in pH (Opatpatanakit et al.
1994, as cited by Williams, 2000).
65
CHAPTER 5
MATERIALS & METHODS OF THE DIFFERENT TECHNIQUES USED TO
DETERMINE THE DIGESTIBILITY OF A.NUMMULARIA CV. DE KOCK
5.1 Experimental materials
The A. nummularia cv. De Kock had been harvested between the end of
March and the beginning of April 2001, at the Grootfontein Research Centre
in the Eastern Cape, South Africa. The stand was established in the early
1990’s and had been heavily grazed by sheep, as a drought fodder, during
the previous winter. It was harvested with a mechanical weed eradicator and
by hand. It was sun dried and sorted into edible and non-edible material.
Edible material was defined as leaf and stems with a diameter of 6 mm and
less. After sorting, the material was milled through a hammermill with a 25
mm sieve size.
The crude protein (CP), ash concentration and organic matter (OM)
concentration were determined according to A.O.A.C. (2000) and neutral
detergent fibre (NDF) concentration according to Van Soest & Wine (1967).
The following values for edible material were obtained: CP (10.29 g/kg DM),
ash (14.93 g/kg DM), OM (75 g/kg DM) and NDF (60.86 g/kg DM).
Afgri, Kaalfontein silo, and Southern Associated Malsters in Alberton, South
Africa supplied the maize and barley, respectively.
5.2. In vivo digestibility trial
The in vivo digestibility trial was conducted at the Hatfield Experimental Farm
of the University of Pretoria. The experiment was carried out in a split plot
design. The animals were randomly divided into two groups, so that five
animals each received the different treatments within a group. The trial was
run is four sequential experimental periods, each period lasting 24 days. The
first 14 days of each period was an adaptation period, while the last 10 days
were used for collection of data and samples. The animals were placed in
metabolism crates fitted with individual feed and water troughs and were kept
66
under natural lightning. The crates were also equipped with urine pans for
urine collection. During the experimental period, the animals had harnesses
and nylon canvas bags for total faeces collection.
The basal diet consisted of A. nummularia cv. De Kock. In addition to the
control diet of 100% A. nummularia, 15%, 30% and 45% of maize and barley
were added to the basal diet on a dry matter basis. The diets were offered as
total mixed rations, to prevent particle selection. Animals were fed a
lucerne/Atriplex mixture (85:15) ad lib, when the supplemented diets were not
being tested.
All the animals were used in the digestibility trial, i.e. five per group. The
animals were weighed at the start and finish of each experimental period.
Individual feed intakes were recorded daily by weighing the feed offered as
well as the orts. The quantity of feed offered each day was adjusted to ensure
that the feed troughs contained feed throughout the day. Samples of feed
offered and orts, which were collected every morning, were pooled for
proximate analysis (A.O.A.C., 2000).
All faecal output during the experimental period was recorded and a 10%
sample of the daily output was stored at -10°C until the end of the collection
period. At the end of the collection period, the total faeces collected for each
sheep were mixed and sub-sampled. Feed and faecal samples were dried at
60°C and ground through a 1mm sieve before chemical analyses (Mahgoub
et al., 2000).
The urine output was measured daily and collected in a container that
contained 25 ml of 10% H2SO4 to prevent loss of urinary ammonia. Urine
aliquots (10% of daily output) were pooled, frozen at -10°C and kept for
analyses (Mahgoub et al., 2000).
The animals received fresh water daily on an ad lib basis and the remaining
water was measured back and recorded before feeding commenced the next
morning. Water consumption of individual animals was recorded daily and it
was corrected for evaporation losses.
67
5.3. Analytical methods
5.3.1. Dry matter concentration
Samples of diets and faeces were dried at 100°C for 24h in a forced drought
oven in aluminium foil containers. Dry matter of milled samples was
determined in porcelain crucibles. Dry matter concentration was calculated as
recommended by A.O.A.C. (2000).
5.3.2. Neutral detergent fibre (NDF) concentration
NDF concentration of diets and faeces samples were determined with neutral
detergent solution (NDS) on a Tecator Fibertec system using the procedure
described by Van Soest & Wine (1967).
5.3.3. Apparent digestibilities
The apparent dry matter digestibility (DMD) for each experimental diet was
calculated using the formula described by McDonald et al. (2002):
Nutrient consumed – Nutrient in faeces
Nutrient consumed
5.4. In vitro digestibility trials
A. nummularia cv. De Kock, was supplemented with four levels (0%,15%,
30%, 45%) of either maize or barley and was incubated in vitro in a buffered
medium, with rumen fluid inoculum collected from sheep, as described by
Tilley & Terry (1963). The two different energy sources differ in their
fermentation rates. Maize is a slower fermentable and barley a more rapid
fermentable energy source.
5.4.1. The in vitro rumen fluid technique (Tilley & Terry, 1963, as
modified by Engels & Van der Merwe, 1967)
Triplicate samples, each weighing 0.2 g, after being milled through a 1 mm
sieve, were weighed into centrifuge tubes. An urea solution was made up and
2 ml added to each sample. The artificial saliva (McDougall, 1948) was
prepared and placed in a water bath (39ºC) and saturated with CO2. Rumen
fluid was collected from rumen cannulated sheep, which have been fed good
68
quality lucerne hay. After filtration through cheesecloth, the rumen fluid was
mixed with artificial saliva in a 1:3 ratio and 20 ml of this mixture was added to
the centrifuge tubes. Before sealing the tubes with a rubber stopper, CO2 was
added before being incubated for 48h, while being shaken continuously. In the
second stage, 20 ml of fresh pepsin and 0.1M HCl solution were added to the
residue, after centrifugation at 2500 rpm (revolutions per minute) for 15
minutes. The tubes were incubated again for 48h while being shaken
continuously. After 48 h the tubes were centrifuged, the residue washed with
20 ml of warm tap water and re-centrifuged. The residue was dried at 100ºC
for 18 h, cooled and weighed. It was then ashed at 550ºC for 3h, to determine
the organic matter (OM) mass.
5.4.2. The in vitro faeces fluid technique (El Shaer et al., 1987)
Triplicate samples, each weighing 0.2 g, after being milled through a 1 mm
sieve, were weighed into centrifuge tubes. Faeces from sheep, maintained on
a lucerne diet, were collected within 1h of voiding and macerated, using a
pestle and mortar. This was mixed in a 1:1 ratio with artificial saliva, which
had previously been saturated with CO2. After filtration through cheesecloth,
the filtrate mixture was made up with artificial saliva to the amount needed.
Together with 0.6 ml of a freshly prepared urea solution, 20 ml of the mixture
was added to the tubes. The tubes were incubated, after the addition of CO2
in a shaking water bath at 39ºC for 48h and then centrifuged at 2500 rpm for
15 minutes. A fresh pepsin and 0.1N HCl solution was prepared, 20 ml added
to the tubes and incubated for a further 48h, being shaken to re-suspend the
feedingstuff residues. At the end of the second stage, the same procedures
as in technique (a) were followed.
5.4.3. The in vitro gas production technique (Pienaar, 1994)
The procedure followed was an adaptation of the two-phase technique
described by Tilley & Terry (1963). It involves a 72h fermentation by rumen
micro-organisms in a buffer solution followed by a 48h pepsin digestion after
acidification. Cumulative gas production is measured during the fermentation
period.
69
Rumen fluid was drawn from two cannulated sheep fed ad libitum, one on a
good quality lucerne diet, and the other on a diet of lucerne plus maize in a
ratio of 5:1. The rumen fluid from the two sheep was mixed in a ratio of 1:1.
Duplicate samples, each 0.5 g, were weighed into 100 ml Scott reagent
bottles. An urea solution was made up and 5 ml added to each sample. The
artificial saliva (McDougall’s) was prepared and placed in a water bath (39ºC)
and saturated with CO2. Rumen fluid was collected from cannulated sheep,
which have been fed good quality lucerne hay. After filtration through
cheesecloth, it was mixed with artificial saliva in a 1:2 ratio and 50 ml of this
mixture was added to the centrifuge tubes, flushing the bottle at the same
time with carbon dioxide. The bottle was immediately sealed and attached to
the pressure sensor in the incubator.
A standard fodder sample with known digestibility, e.g. Panicum maximum
was always included in the test run to serve as a check on the test conditions.
After 72h of incubation (with careful daily swirling) 5 ml HCl solution was
added to each bottle (in three portions and mixing carefully after each
addition) and 5 ml pepsin solution. The bottles were closed again and
incubated for a further 48h. After 48h, the contents of each bottle were
transferred to a 100 ml glass centrifuge tube. After centrifuging at 3000 rpm
for 10 minutes, the supernatant was removed, the residue rinsed with hot H2O
and centrifuged again. The residue was dried at 105ºC for 24h, cooled and
weighed. It was then ashed at 500ºC for 6h, to determine the organic matter
(OM) mass.
5.4.4. The in vitro cellulase technique (De Boever et al., 1986)
To facilitate cellulolytic breakdown, the feed sample was treated with a pepsin
solution. Hydrolysing at 80ºC removed the starch. Finally, cell walls were
attacked by cellulase.
Duplicate samples, each weighing 0.3 g, after being milled through a 1mm
sieve, were weighed into a sintered glass crucible (capacity 50 ml, porosity 1)
and the bottom side was closed with a rubber stopper. A preheated pepsin-
HCl (30 ml) was added and after closing the top with ‘glad wrap’, the crucibles
were incubated (40ºC) for 24h, and stirred continuously. To hydrolyse the
starch, the crucibles were placed in a warmbath (80ºC) for 45min and then
70
filtrated. After filtration 30 ml of the preheated cellulose buffer mixture was
added and then incubated for a further 24h. The residue, after filtration and
washing, was dried at 103ºC for 24h, cooled and weighed and then ashed for
1.5h at 500ºC.
5.4.5. The in vitro cellulase technique (Wageningen Institute of Animal
Science, The Netherlands)
Duplicate samples, each weighing, 0.3 g, after being milled through a 1mm
sieve, were weighed into a sintered glass crucible (capacity 50 ml, porosity 1)
and the bottom side was closed with a rubber stopper. A preheated pepsin-
HCl (30 ml) was added and after closing the top with ‘glad wrap’, the crucibles
were incubated (40ºC) for 24h, and stirred continuously. To hydrolyse the
starch, the crucibles were placed in a warmbath (80ºC) for 30 minutes and
then filtrated. After filtration 30 ml of the pre-heated
cellulase/amyloglucosidase mixture was added and then incubated for a
further 24h. The residue, after filtration and washing, was dried at 103ºC for
24h, cooled and weighed and then ashed for 2h at 500ºC.
The amyloglucosidase used was extracted from Aspergillus niger,
(Calbiochem) while the cellulase, Onozuko R-10, was extracted from
Trichoderma viride.
5.5. Statistics
An analysis of variance with the Proc GLM model (Statistical Analysis
Systems, 1994) was used to determine the significance between the in vitro
digestibility techniques and in vivo data. Means and standard deviations (sd)
were calculated. The significance of difference (5%) between means was
determined using Bonferroni’s test (Samuels, 1899). Regressions for the
different techniques and levels of supplementation were determined with the
Proc GLM model (Statistical Analysis Systems, 1994).
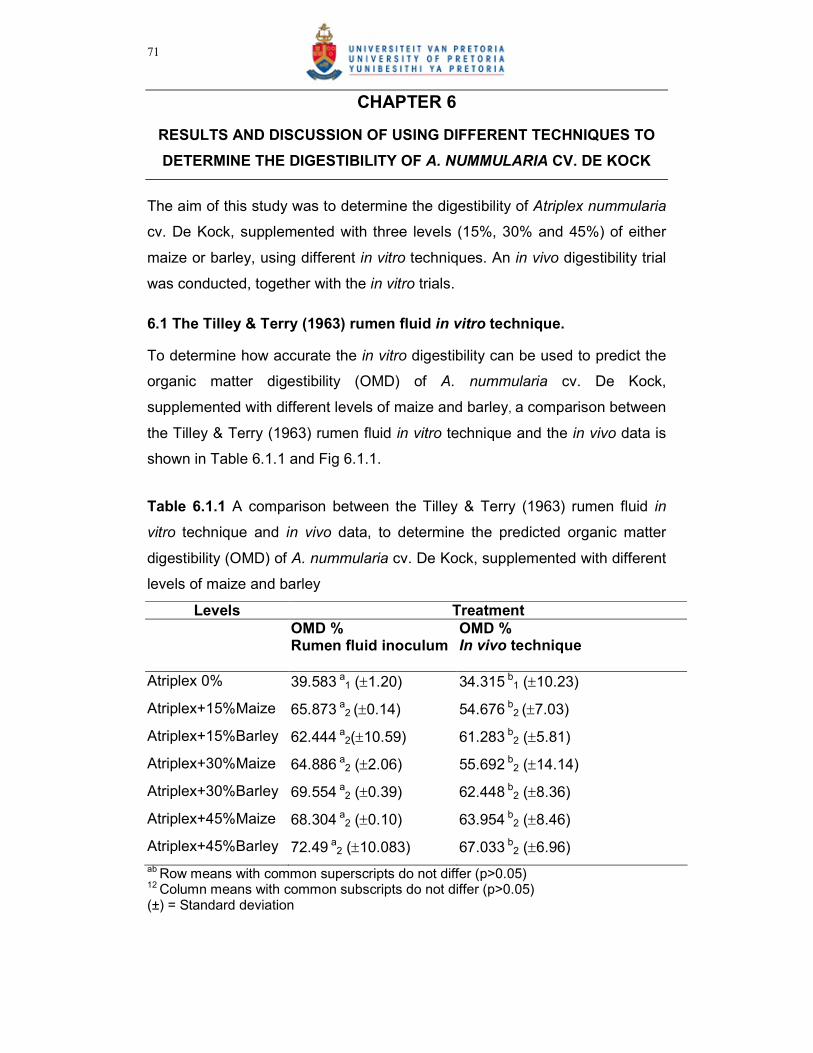
71
CHAPTER 6
RESULTS AND DISCUSSION OF USING DIFFERENT TECHNIQUES TO
DETERMINE THE DIGESTIBILITY OF A. NUMMULARIA CV. DE KOCK
The aim of this study was to determine the digestibility of Atriplex nummularia
cv. De Kock, supplemented with three levels (15%, 30% and 45%) of either
maize or barley, using different in vitro techniques. An in vivo digestibility trial
was conducted, together with the in vitro trials.
6.1 The Tilley & Terry (1963) rumen fluid in vitro technique.
To determine how accurate the in vitro digestibility can be used to predict the
organic matter digestibility (OMD) of A. nummularia cv. De Kock,
supplemented with different levels of maize and barley, a comparison between
the Tilley & Terry (1963) rumen fluid in vitro technique and the in vivo data is
shown in Table 6.1.1 and Fig 6.1.1.
Table 6.1.1 A comparison between the Tilley & Terry (1963) rumen fluid in
vitro technique and in vivo data, to determine the predicted organic matter
digestibility (OMD) of A. nummularia cv. De Kock, supplemented with different
levels of maize and barley
Levels Treatment OMD % OMD % Rumen fluid inoculum
In vivo technique
Atriplex 0% 39.583 a1 (±1.20) 34.315 b1 (±10.23)
Atriplex+15%Maize 65.873 a2 (±0.14) 54.676 b2
(±7.03)
Atriplex+15%Barley 62.444 a2(±10.59) 61.283 b2 (±5.81)
Atriplex+30%Maize 64.886 a2 (±2.06) 55.692 b2 (±14.14)
Atriplex+30%Barley 69.554 a2 (±0.39) 62.448 b2 (±8.36)
Atriplex+45%Maize 68.304 a2 (±0.10) 63.954 b2 (±8.46)
Atriplex+45%Barley 72.49 a2 (±10.083) 67.033 b2 (±6.96)
ab Row means with common superscripts do not differ (p>0.05) 12 Column means with common subscripts do not differ (p>0.05) (±) = Standard deviation
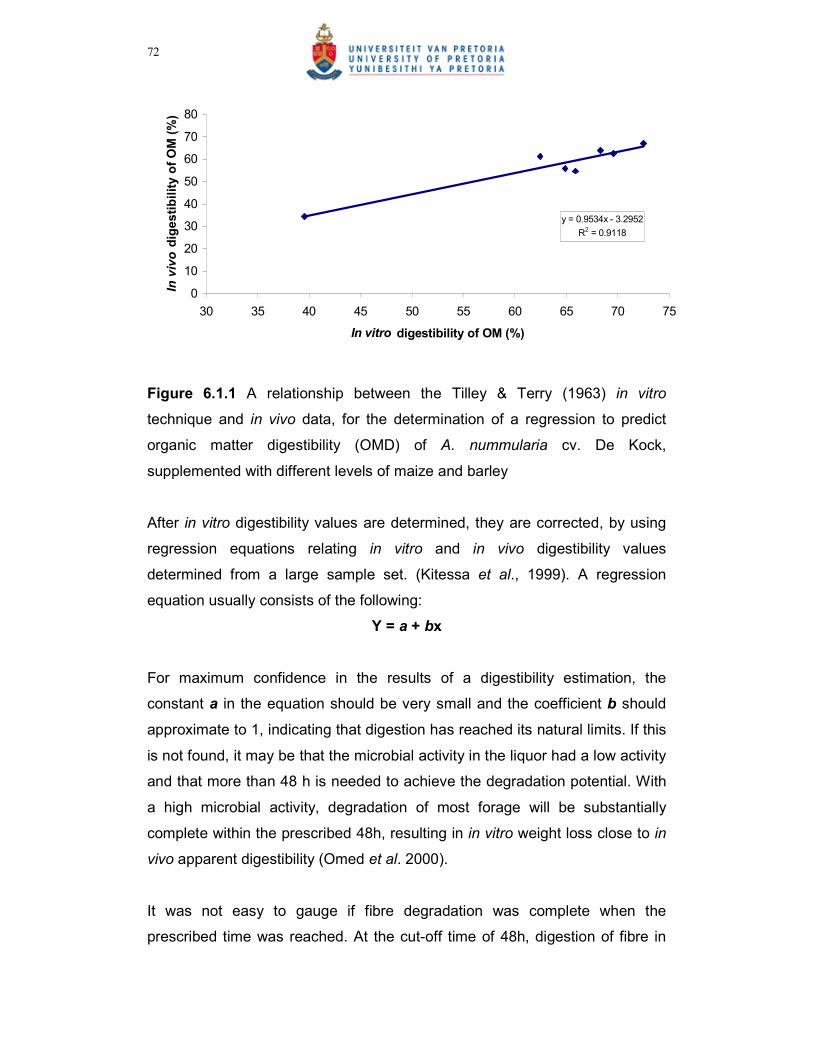
72
y = 0.9534x - 3.2952
R2 = 0.9118
0
10
20
30
40
50
60
70
80
30 35 40 45 50 55 60 65 70 75
In vitro digestibility of OM (%)
In vivo digestibility of OM (%)
Figure 6.1.1 A relationship between the Tilley & Terry (1963) in vitro
technique and in vivo data, for the determination of a regression to predict
organic matter digestibility (OMD) of A. nummularia cv. De Kock,
supplemented with different levels of maize and barley
After in vitro digestibility values are determined, they are corrected, by using
regression equations relating in vitro and in vivo digestibility values
determined from a large sample set. (Kitessa et al., 1999). A regression
equation usually consists of the following:
Y = a + bx
For maximum confidence in the results of a digestibility estimation, the
constant a in the equation should be very small and the coefficient b should
approximate to 1, indicating that digestion has reached its natural limits. If this
is not found, it may be that the microbial activity in the liquor had a low activity
and that more than 48 h is needed to achieve the degradation potential. With
a high microbial activity, degradation of most forage will be substantially
complete within the prescribed 48h, resulting in in vitro weight loss close to in
vivo apparent digestibility (Omed et al. 2000).
It was not easy to gauge if fibre degradation was complete when the
prescribed time was reached. At the cut-off time of 48h, digestion of fibre in
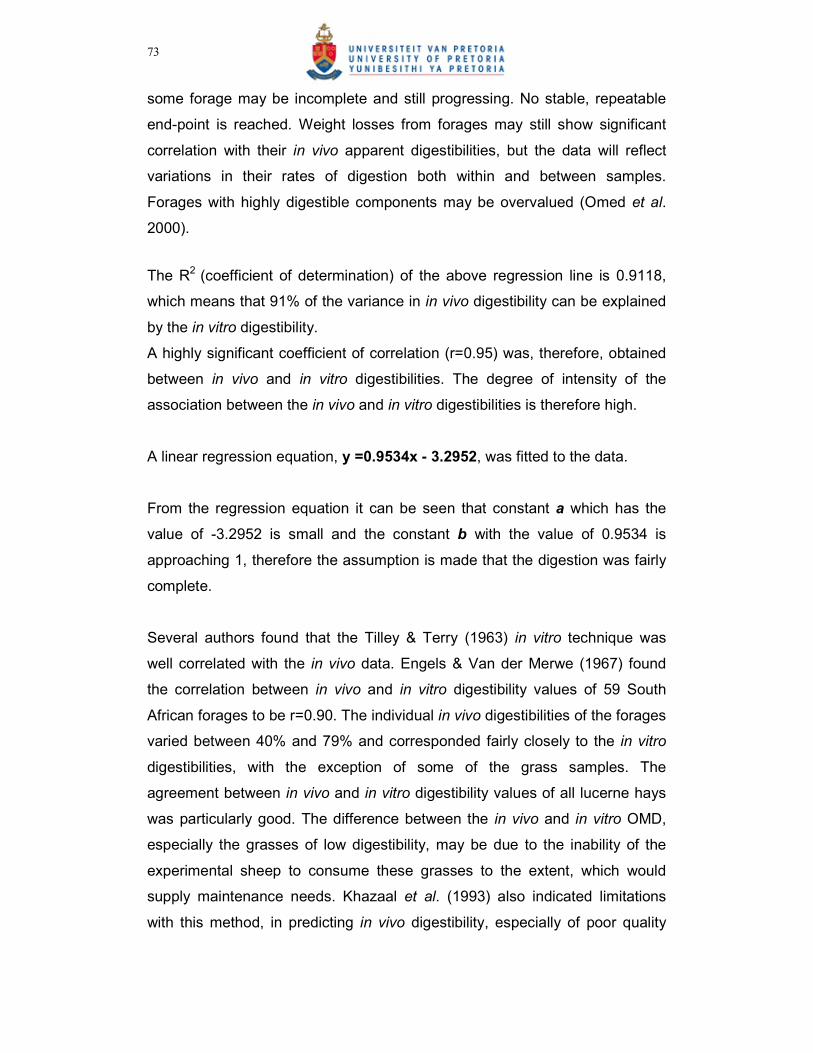
73
some forage may be incomplete and still progressing. No stable, repeatable
end-point is reached. Weight losses from forages may still show significant
correlation with their in vivo apparent digestibilities, but the data will reflect
variations in their rates of digestion both within and between samples.
Forages with highly digestible components may be overvalued (Omed et al.
2000).
The R2 (coefficient of determination) of the above regression line is 0.9118,
which means that 91% of the variance in in vivo digestibility can be explained
by the in vitro digestibility.
A highly significant coefficient of correlation (r=0.95) was, therefore, obtained
between in vivo and in vitro digestibilities. The degree of intensity of the
association between the in vivo and in vitro digestibilities is therefore high.
A linear regression equation, y =0.9534x - 3.2952, was fitted to the data.
From the regression equation it can be seen that constant a which has the
value of -3.2952 is small and the constant b with the value of 0.9534 is
approaching 1, therefore the assumption is made that the digestion was fairly
complete.
Several authors found that the Tilley & Terry (1963) in vitro technique was
well correlated with the in vivo data. Engels & Van der Merwe (1967) found
the correlation between in vivo and in vitro digestibility values of 59 South
African forages to be r=0.90. The individual in vivo digestibilities of the forages
varied between 40% and 79% and corresponded fairly closely to the in vitro
digestibilities, with the exception of some of the grass samples. The
agreement between in vivo and in vitro digestibility values of all lucerne hays
was particularly good. The difference between the in vivo and in vitro OMD,
especially the grasses of low digestibility, may be due to the inability of the
experimental sheep to consume these grasses to the extent, which would
supply maintenance needs. Khazaal et al. (1993) also indicated limitations
with this method, in predicting in vivo digestibility, especially of poor quality
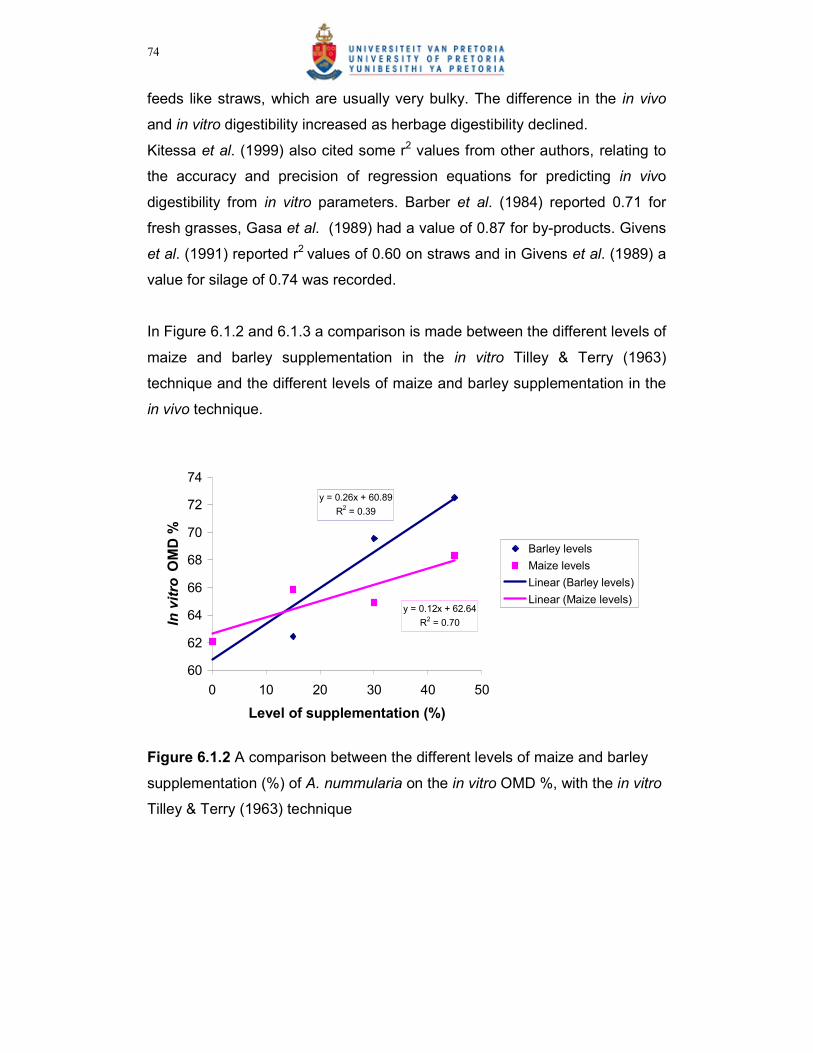
74
feeds like straws, which are usually very bulky. The difference in the in vivo
and in vitro digestibility increased as herbage digestibility declined.
Kitessa et al. (1999) also cited some r2 values from other authors, relating to
the accuracy and precision of regression equations for predicting in vivo
digestibility from in vitro parameters. Barber et al. (1984) reported 0.71 for
fresh grasses, Gasa et al. (1989) had a value of 0.87 for by-products. Givens
et al. (1991) reported r2 values of 0.60 on straws and in Givens et al. (1989) a
value for silage of 0.74 was recorded.
In Figure 6.1.2 and 6.1.3 a comparison is made between the different levels of
maize and barley supplementation in the in vitro Tilley & Terry (1963)
technique and the different levels of maize and barley supplementation in the
in vivo technique.
y = 0.26x + 60.89
R2 = 0.39
y = 0.12x + 62.64
R2 = 0.70
60
62
64
66
68
70
72
74
0 10 20 30 40 50
Level of supplementation (%)
In vitro OMD %
Barley levels
Maize levels
Linear (Barley levels)
Linear (Maize levels)
Figure 6.1.2 A comparison between the different levels of maize and barley
supplementation (%) of A. nummularia on the in vitro OMD %, with the in vitro
Tilley & Terry (1963) technique
75
y = 0.759x + 38.1
R2 = 0.636
y = 0.644x + 37.11
R2 = 0.545
0
10
20
30
40
50
60
70
80
0 10 20 30 40 50
Level of supplementation (%)
In vivo OMD %
Barley
Maize
Linear (Barley)
Linear (Maize)
Figure 6.1.3 A comparison between the different levels of maize and barley
supplementation (%) of A. nummularia on the in vivo OMD %, with the in vivo
technique
The differences in digestibility found between the type and level of
supplementation, to Atriplex nummularia cv. De Kock, may be due the
differences in rate of fermentation of the two carbohydrate sources. Barley is
a faster fermentable carbohydrate source, while maize is slower.
Table 6.1.2 shows the mean in vitro OMD % compared to the mean in vivo
OMD % over all levels of supplementation.
Table 6.1.2 A comparison between the Tilley & Terry (1963) rumen fluid in
vitro technique and in vivo data, to determine the organic matter digestibility
(OMD) of A. nummularia cv. De Kock, over all the different levels of
supplementation
Treatment OMD %
Rumen fluid inoculum 66.52a (±1.93)
In vivo digestibility 56.05b (±1.93)
ab Columns means with common superscripts do not differ (p>0.05) (±) = standard deviation
76
From Table 6.1.2 it can be seen that, the Tilley & Terry (1963) in vitro
technique mean OMD % differed (p<0.05) significantly from the mean in vivo
OMD %. There are several possible explanations for the difference between
the in vivo and in vitro OMD %. Practical mistakes could have been made.
Engels & Van der Merwe (1967) made the same suggestion, that when in vivo
and in vitro processes are compared, there are obvious dissimilarities
between the indigestible residues, obtained from these two types of digestion.
This reflects the inherent analytical errors in the two methods.
The fermentation characteristics and microbial constitution of the rumen
inocula differ between the animals used for the in vivo digestibility trial and the
animals used for rumen inocula collection. The simulation of the rumen
motility in vitro is also difficult. There are several factors that influence the
microbial activity of the inoculum. It can vary depending on the time of
collection after feeding, the diet and species of the donor animal, and animal
to animal variation within species (Kitessa et al., 1999). It could have been
that all the feed particles did not have the same exposure to the
microorganisms. This may be due to forage x particle size interaction
(Baumgardt & Ho, 1964, as cited by Kitessa et al. 1999). With in vivo
digestibility the time of digestion is not known, and therefore, the time of
rumen and gastric digestion in vitro could have been too long or too short.
Animals also show a considerable variation in digestive capacity, especially
with certain forages, where intakes are unrestricted. (Engels & Van der
Merwe, 1967).
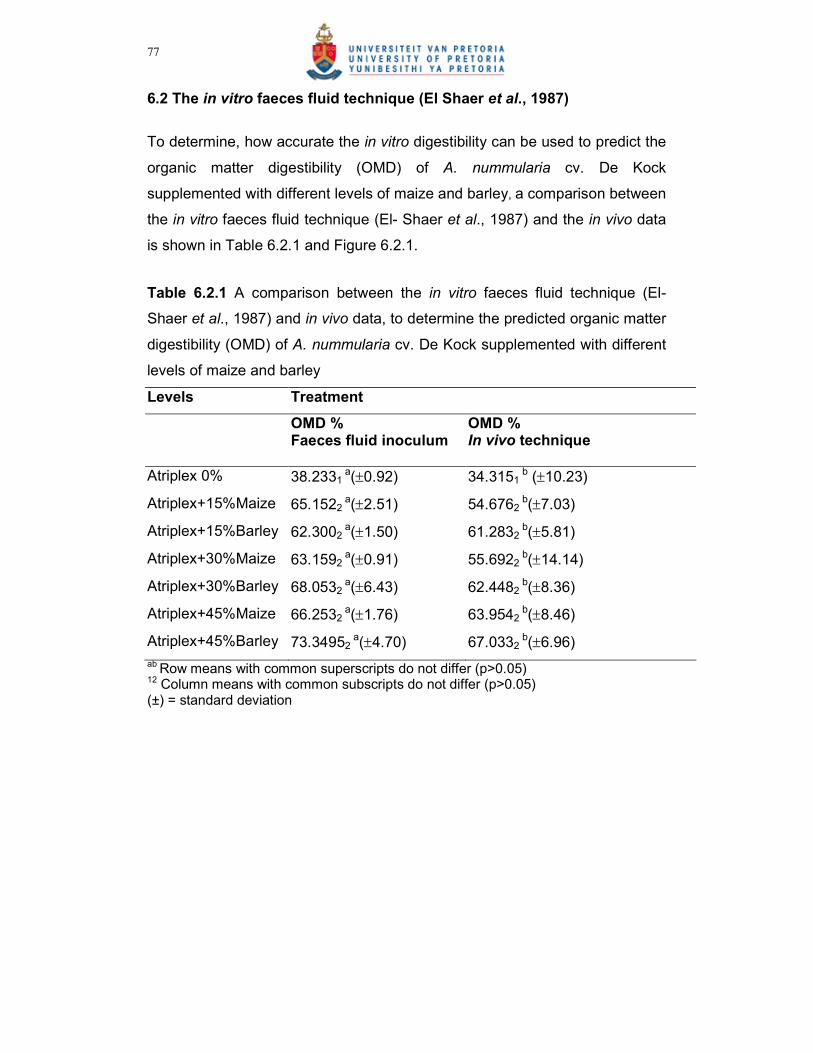
77
6.2 The in vitro faeces fluid technique (El Shaer et al., 1987)
To determine, how accurate the in vitro digestibility can be used to predict the
organic matter digestibility (OMD) of A. nummularia cv. De Kock
supplemented with different levels of maize and barley, a comparison between
the in vitro faeces fluid technique (El- Shaer et al., 1987) and the in vivo data
is shown in Table 6.2.1 and Figure 6.2.1.
Table 6.2.1 A comparison between the in vitro faeces fluid technique (El-
Shaer et al., 1987) and in vivo data, to determine the predicted organic matter
digestibility (OMD) of A. nummularia cv. De Kock supplemented with different
levels of maize and barley
Levels Treatment
OMD % OMD % Faeces fluid inoculum
In vivo technique
Atriplex 0% 38.2331 a(±0.92) 34.3151
b (±10.23)
Atriplex+15%Maize 65.1522 a(±2.51) 54.6762
b(±7.03)
Atriplex+15%Barley 62.3002 a(±1.50) 61.2832
b(±5.81)
Atriplex+30%Maize 63.1592 a(±0.91) 55.6922
b(±14.14)
Atriplex+30%Barley 68.0532 a(±6.43) 62.4482
b(±8.36)
Atriplex+45%Maize 66.2532 a(±1.76) 63.9542
b(±8.46)
Atriplex+45%Barley 73.34952 a(±4.70) 67.0332
b(±6.96)
ab Row means with common superscripts do not differ (p>0.05) 12 Column means with common subscripts do not differ (p>0.05) (±) = standard deviation
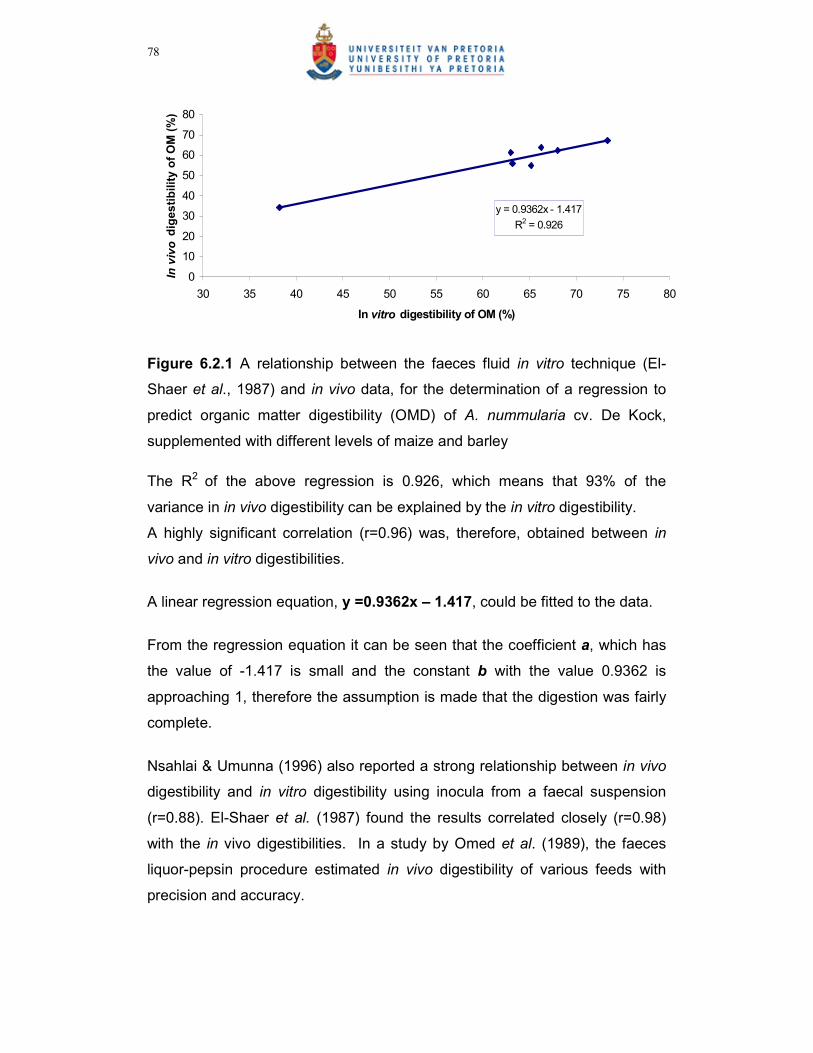
78
y = 0.9362x - 1.417
R2 = 0.926
0
10
20
30
40
50
60
70
80
30 35 40 45 50 55 60 65 70 75 80
In vitro digestibility of OM (%)
In vivo digestibility of OM (%)
Figure 6.2.1 A relationship between the faeces fluid in vitro technique (El-
Shaer et al., 1987) and in vivo data, for the determination of a regression to
predict organic matter digestibility (OMD) of A. nummularia cv. De Kock,
supplemented with different levels of maize and barley
The R2 of the above regression is 0.926, which means that 93% of the
variance in in vivo digestibility can be explained by the in vitro digestibility.
A highly significant correlation (r=0.96) was, therefore, obtained between in
vivo and in vitro digestibilities.
A linear regression equation, y =0.9362x – 1.417, could be fitted to the data.
From the regression equation it can be seen that the coefficient a, which has
the value of -1.417 is small and the constant b with the value 0.9362 is
approaching 1, therefore the assumption is made that the digestion was fairly
complete.
Nsahlai & Umunna (1996) also reported a strong relationship between in vivo
digestibility and in vitro digestibility using inocula from a faecal suspension
(r=0.88). El-Shaer et al. (1987) found the results correlated closely (r=0.98)
with the in vivo digestibilities. In a study by Omed et al. (1989), the faeces
liquor-pepsin procedure estimated in vivo digestibility of various feeds with
precision and accuracy.
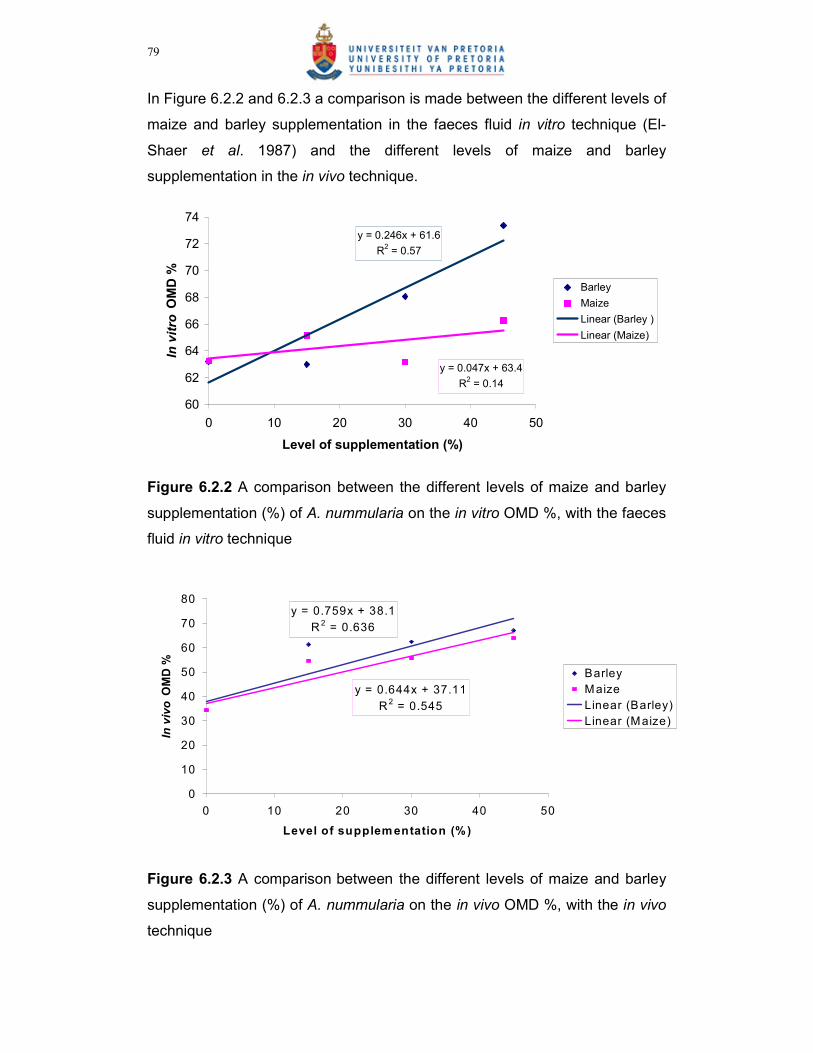
79
In Figure 6.2.2 and 6.2.3 a comparison is made between the different levels of
maize and barley supplementation in the faeces fluid in vitro technique (El-
Shaer et al. 1987) and the different levels of maize and barley
supplementation in the in vivo technique.
y = 0.246x + 61.6
R2 = 0.57
y = 0.047x + 63.4
R2 = 0.14
60
62
64
66
68
70
72
74
0 10 20 30 40 50
Level of supplementation (%)
In vitro OMD %
Barley
Maize
Linear (Barley )
Linear (Maize)
Figure 6.2.2 A comparison between the different levels of maize and barley
supplementation (%) of A. nummularia on the in vitro OMD %, with the faeces
fluid in vitro technique
y = 0.759x + 38.1
R 2 = 0.636
y = 0.644x + 37.11
R2 = 0.545
0
10
20
30
40
50
60
70
80
0 10 20 30 40 50
Level of supplementation (%)
In vivo OMD %
Barley
Maize
Linear (Barley)
Linear (Maize)
Figure 6.2.3 A comparison between the different levels of maize and barley
supplementation (%) of A. nummularia on the in vivo OMD %, with the in vivo
technique
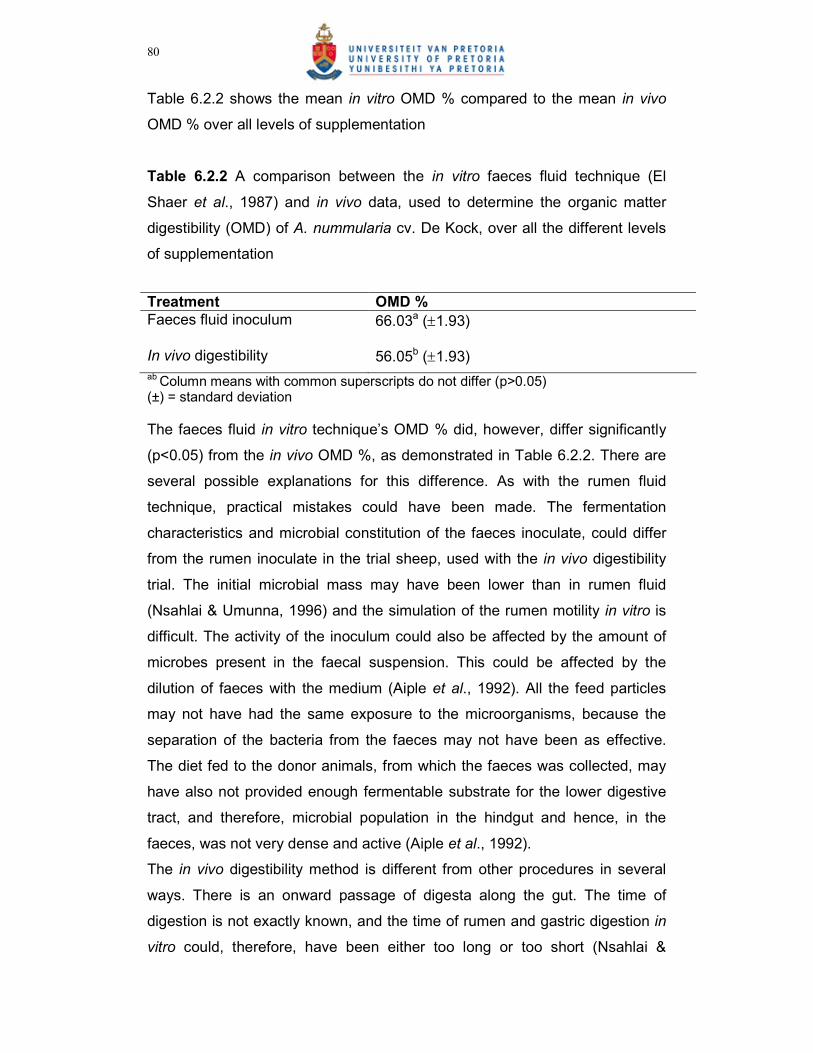
80
Table 6.2.2 shows the mean in vitro OMD % compared to the mean in vivo
OMD % over all levels of supplementation
Table 6.2.2 A comparison between the in vitro faeces fluid technique (El
Shaer et al., 1987) and in vivo data, used to determine the organic matter
digestibility (OMD) of A. nummularia cv. De Kock, over all the different levels
of supplementation
Treatment OMD %
Faeces fluid inoculum 66.03a (±1.93)
In vivo digestibility 56.05b (±1.93)
ab Column means with common superscripts do not differ (p>0.05) (±) = standard deviation
The faeces fluid in vitro technique’s OMD % did, however, differ significantly
(p<0.05) from the in vivo OMD %, as demonstrated in Table 6.2.2. There are
several possible explanations for this difference. As with the rumen fluid
technique, practical mistakes could have been made. The fermentation
characteristics and microbial constitution of the faeces inoculate, could differ
from the rumen inoculate in the trial sheep, used with the in vivo digestibility
trial. The initial microbial mass may have been lower than in rumen fluid
(Nsahlai & Umunna, 1996) and the simulation of the rumen motility in vitro is
difficult. The activity of the inoculum could also be affected by the amount of
microbes present in the faecal suspension. This could be affected by the
dilution of faeces with the medium (Aiple et al., 1992). All the feed particles
may not have had the same exposure to the microorganisms, because the
separation of the bacteria from the faeces may not have been as effective.
The diet fed to the donor animals, from which the faeces was collected, may
have also not provided enough fermentable substrate for the lower digestive
tract, and therefore, microbial population in the hindgut and hence, in the
faeces, was not very dense and active (Aiple et al., 1992).
The in vivo digestibility method is different from other procedures in several
ways. There is an onward passage of digesta along the gut. The time of
digestion is not exactly known, and the time of rumen and gastric digestion in
vitro could, therefore, have been either too long or too short (Nsahlai &
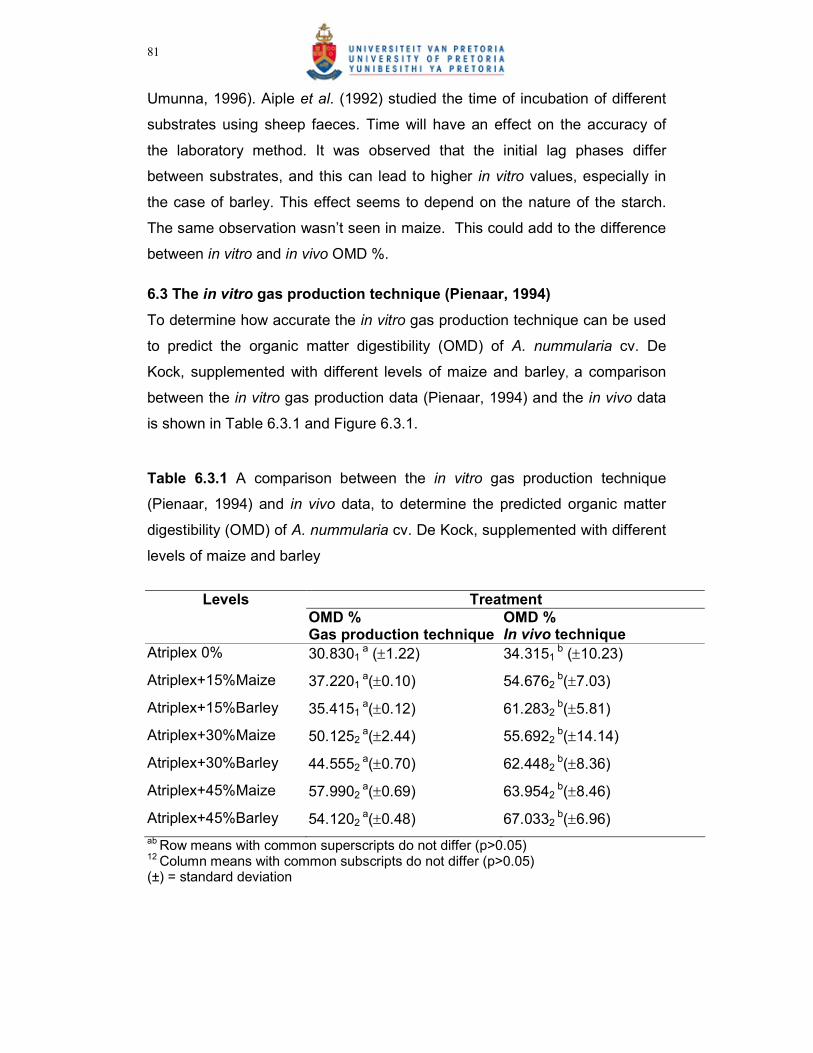
81
Umunna, 1996). Aiple et al. (1992) studied the time of incubation of different
substrates using sheep faeces. Time will have an effect on the accuracy of
the laboratory method. It was observed that the initial lag phases differ
between substrates, and this can lead to higher in vitro values, especially in
the case of barley. This effect seems to depend on the nature of the starch.
The same observation wasn’t seen in maize. This could add to the difference
between in vitro and in vivo OMD %.
6.3 The in vitro gas production technique (Pienaar, 1994)
To determine how accurate the in vitro gas production technique can be used
to predict the organic matter digestibility (OMD) of A. nummularia cv. De
Kock, supplemented with different levels of maize and barley, a comparison
between the in vitro gas production data (Pienaar, 1994) and the in vivo data
is shown in Table 6.3.1 and Figure 6.3.1.
Table 6.3.1 A comparison between the in vitro gas production technique
(Pienaar, 1994) and in vivo data, to determine the predicted organic matter
digestibility (OMD) of A. nummularia cv. De Kock, supplemented with different
levels of maize and barley
Levels Treatment
OMD % OMD % Gas production technique In vivo technique
Atriplex 0% 30.8301 a (±1.22) 34.3151
b (±10.23)
Atriplex+15%Maize 37.2201 a(±0.10) 54.6762
b(±7.03)
Atriplex+15%Barley 35.4151 a(±0.12) 61.2832
b(±5.81)
Atriplex+30%Maize 50.1252 a(±2.44) 55.6922
b(±14.14)
Atriplex+30%Barley 44.5552 a(±0.70) 62.4482
b(±8.36)
Atriplex+45%Maize 57.9902 a(±0.69) 63.9542
b(±8.46)
Atriplex+45%Barley 54.1202 a(±0.48) 67.0332
b(±6.96)
ab Row means with common superscripts do not differ (p>0.05) 12 Column means with common subscripts do not differ (p>0.05) (±) = standard deviation
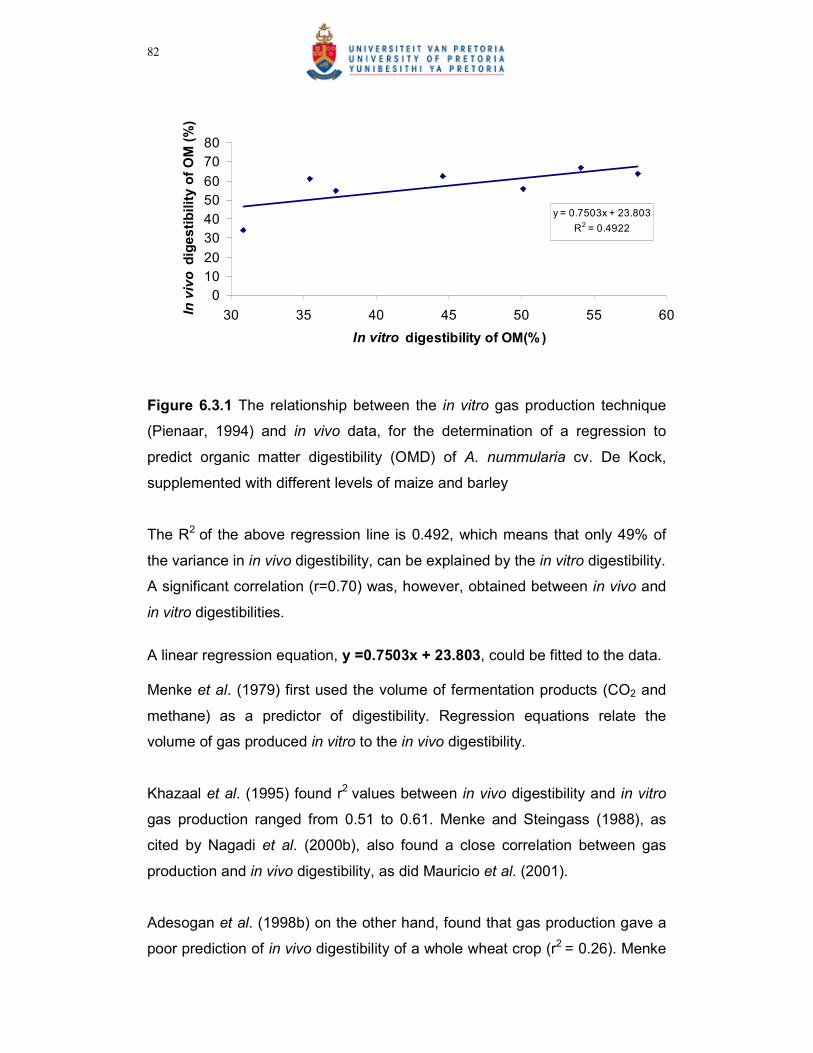
82
y = 0.7503x + 23.803
R2 = 0.4922
0
10
20
30
40
50
60
70
80
30 35 40 45 50 55 60
In vitro digestibility of OM(%)
In vivo digestibility of OM (%)
Figure 6.3.1 The relationship between the in vitro gas production technique
(Pienaar, 1994) and in vivo data, for the determination of a regression to
predict organic matter digestibility (OMD) of A. nummularia cv. De Kock,
supplemented with different levels of maize and barley
The R2 of the above regression line is 0.492, which means that only 49% of
the variance in in vivo digestibility, can be explained by the in vitro digestibility.
A significant correlation (r=0.70) was, however, obtained between in vivo and
in vitro digestibilities.
A linear regression equation, y =0.7503x + 23.803, could be fitted to the data. Menke et al. (1979) first used the volume of fermentation products (CO2 and
methane) as a predictor of digestibility. Regression equations relate the
volume of gas produced in vitro to the in vivo digestibility.
Khazaal et al. (1995) found r2 values between in vivo digestibility and in vitro
gas production ranged from 0.51 to 0.61. Menke and Steingass (1988), as
cited by Nagadi et al. (2000b), also found a close correlation between gas
production and in vivo digestibility, as did Mauricio et al. (2001).
Adesogan et al. (1998b) on the other hand, found that gas production gave a
poor prediction of in vivo digestibility of a whole wheat crop (r2 = 0.26). Menke
83
et al. (1979) suggested that inaccurate gas production and in vivo
relationships could result from in vitro and in vivo differences, in the rates of
degradation, outflow and improved post-ruminal utilisation of nutrient escaping
fermentation. Other factors which may be implicated, include the indirect
production of gas from the buffer or from microbial turnover, the dependence
of gas production on the end products of fermentation and the microbial
potential for switching between VFA and lactate production (Beuvink &
Spoelstra, 1992).
An explanation of the correlation between gas production in vitro and
digestibility in vivo can probably be found in the fact that this method is not
based on a filtration process for separation of digested and undigested
material. Such a separation may not give the full information on digestibility,
partly because some indigestible or less digestible material may pass the
filter. Some digestible material may not be extracted from the indigestible
fraction on the filter (Menke et al., 1979).
In Figure 6.3.2 and Figure 6.3.3 a comparison is made between the different
maize and barley levels of supplementation in the gas production in vitro
technique (Pienaar, 1994) and the different levels of supplementation in the in
vivo technique.
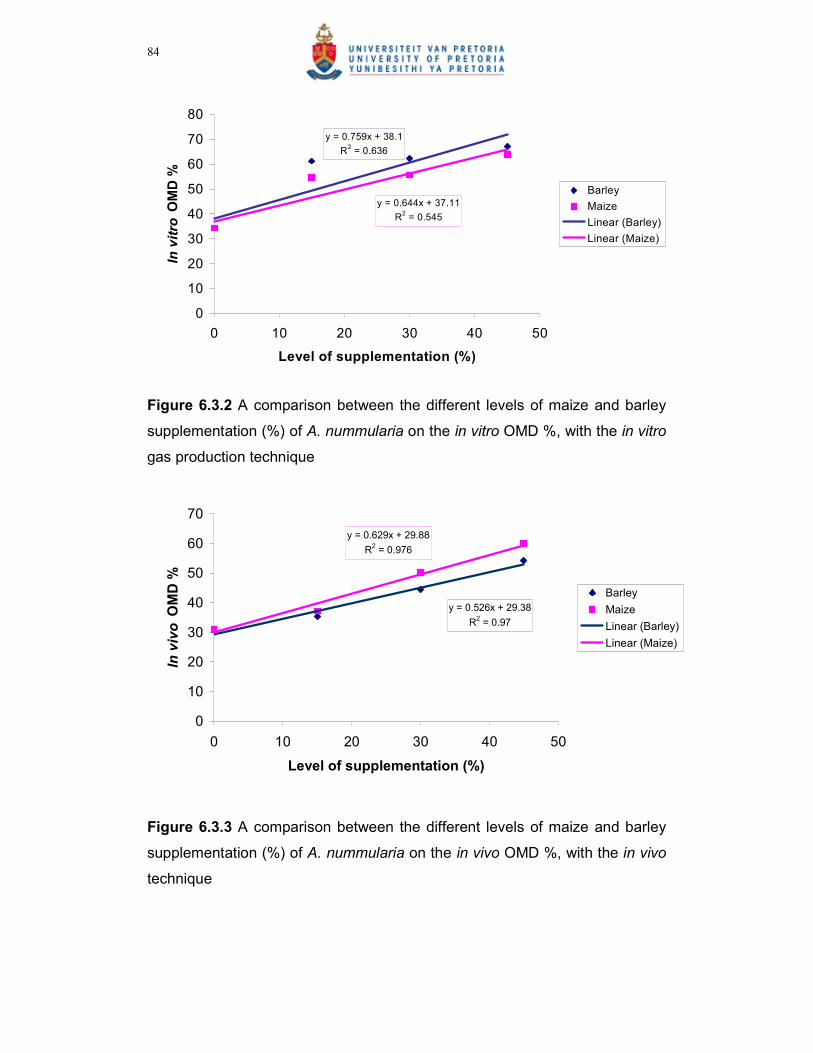
84
y = 0.759x + 38.1
R2 = 0.636
y = 0.644x + 37.11
R2 = 0.545
0
10
20
30
40
50
60
70
80
0 10 20 30 40 50
Level of supplementation (%)
In vitro OMD %
Barley
Maize
Linear (Barley)
Linear (Maize)
Figure 6.3.2 A comparison between the different levels of maize and barley
supplementation (%) of A. nummularia on the in vitro OMD %, with the in vitro
gas production technique
y = 0.526x + 29.38
R2 = 0.97
y = 0.629x + 29.88
R2 = 0.976
0
10
20
30
40
50
60
70
0 10 20 30 40 50
Level of supplementation (%)
In vivo OMD %
Barley
Maize
Linear (Barley)
Linear (Maize)
Figure 6.3.3 A comparison between the different levels of maize and barley
supplementation (%) of A. nummularia on the in vivo OMD %, with the in vivo
technique
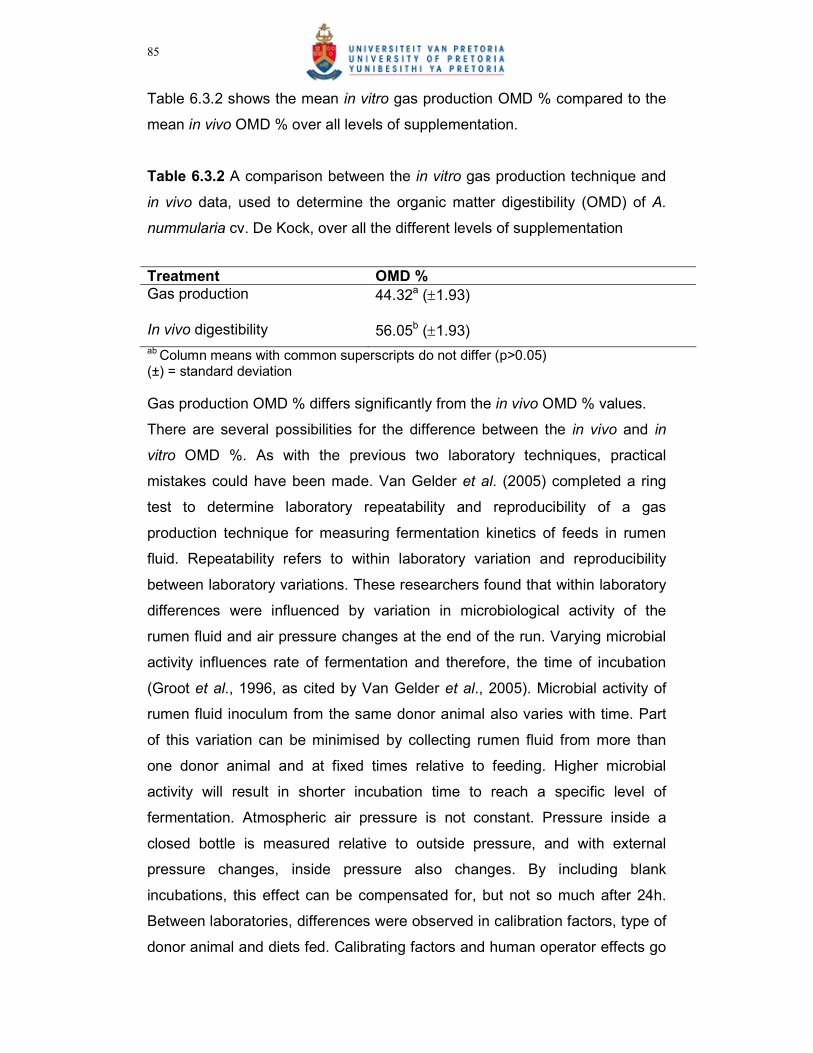
85
Table 6.3.2 shows the mean in vitro gas production OMD % compared to the
mean in vivo OMD % over all levels of supplementation.
Table 6.3.2 A comparison between the in vitro gas production technique and
in vivo data, used to determine the organic matter digestibility (OMD) of A.
nummularia cv. De Kock, over all the different levels of supplementation
Treatment OMD %
Gas production 44.32a (±1.93)
In vivo digestibility 56.05b (±1.93)
ab Column means with common superscripts do not differ (p>0.05) (±) = standard deviation
Gas production OMD % differs significantly from the in vivo OMD % values.
There are several possibilities for the difference between the in vivo and in
vitro OMD %. As with the previous two laboratory techniques, practical
mistakes could have been made. Van Gelder et al. (2005) completed a ring
test to determine laboratory repeatability and reproducibility of a gas
production technique for measuring fermentation kinetics of feeds in rumen
fluid. Repeatability refers to within laboratory variation and reproducibility
between laboratory variations. These researchers found that within laboratory
differences were influenced by variation in microbiological activity of the
rumen fluid and air pressure changes at the end of the run. Varying microbial
activity influences rate of fermentation and therefore, the time of incubation
(Groot et al., 1996, as cited by Van Gelder et al., 2005). Microbial activity of
rumen fluid inoculum from the same donor animal also varies with time. Part
of this variation can be minimised by collecting rumen fluid from more than
one donor animal and at fixed times relative to feeding. Higher microbial
activity will result in shorter incubation time to reach a specific level of
fermentation. Atmospheric air pressure is not constant. Pressure inside a
closed bottle is measured relative to outside pressure, and with external
pressure changes, inside pressure also changes. By including blank
incubations, this effect can be compensated for, but not so much after 24h.
Between laboratories, differences were observed in calibration factors, type of
donor animal and diets fed. Calibrating factors and human operator effects go
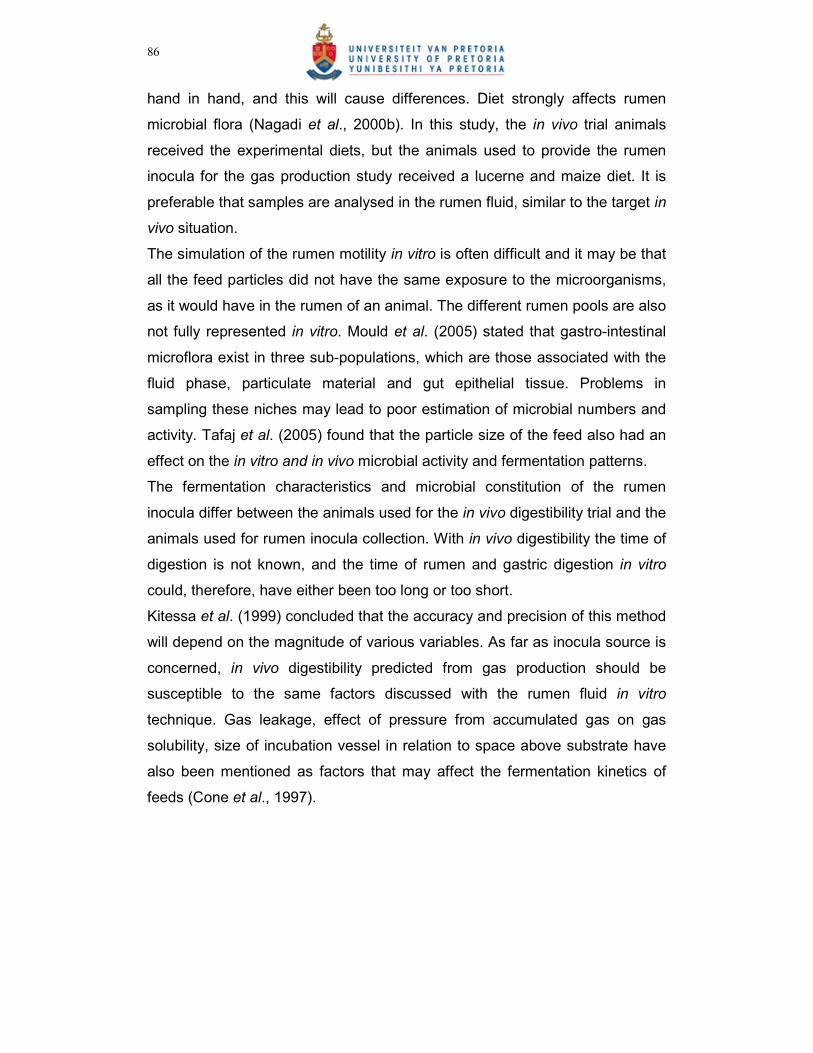
86
hand in hand, and this will cause differences. Diet strongly affects rumen
microbial flora (Nagadi et al., 2000b). In this study, the in vivo trial animals
received the experimental diets, but the animals used to provide the rumen
inocula for the gas production study received a lucerne and maize diet. It is
preferable that samples are analysed in the rumen fluid, similar to the target in
vivo situation.
The simulation of the rumen motility in vitro is often difficult and it may be that
all the feed particles did not have the same exposure to the microorganisms,
as it would have in the rumen of an animal. The different rumen pools are also
not fully represented in vitro. Mould et al. (2005) stated that gastro-intestinal
microflora exist in three sub-populations, which are those associated with the
fluid phase, particulate material and gut epithelial tissue. Problems in
sampling these niches may lead to poor estimation of microbial numbers and
activity. Tafaj et al. (2005) found that the particle size of the feed also had an
effect on the in vitro and in vivo microbial activity and fermentation patterns.
The fermentation characteristics and microbial constitution of the rumen
inocula differ between the animals used for the in vivo digestibility trial and the
animals used for rumen inocula collection. With in vivo digestibility the time of
digestion is not known, and the time of rumen and gastric digestion in vitro
could, therefore, have either been too long or too short.
Kitessa et al. (1999) concluded that the accuracy and precision of this method
will depend on the magnitude of various variables. As far as inocula source is
concerned, in vivo digestibility predicted from gas production should be
susceptible to the same factors discussed with the rumen fluid in vitro
technique. Gas leakage, effect of pressure from accumulated gas on gas
solubility, size of incubation vessel in relation to space above substrate have
also been mentioned as factors that may affect the fermentation kinetics of
feeds (Cone et al., 1997).
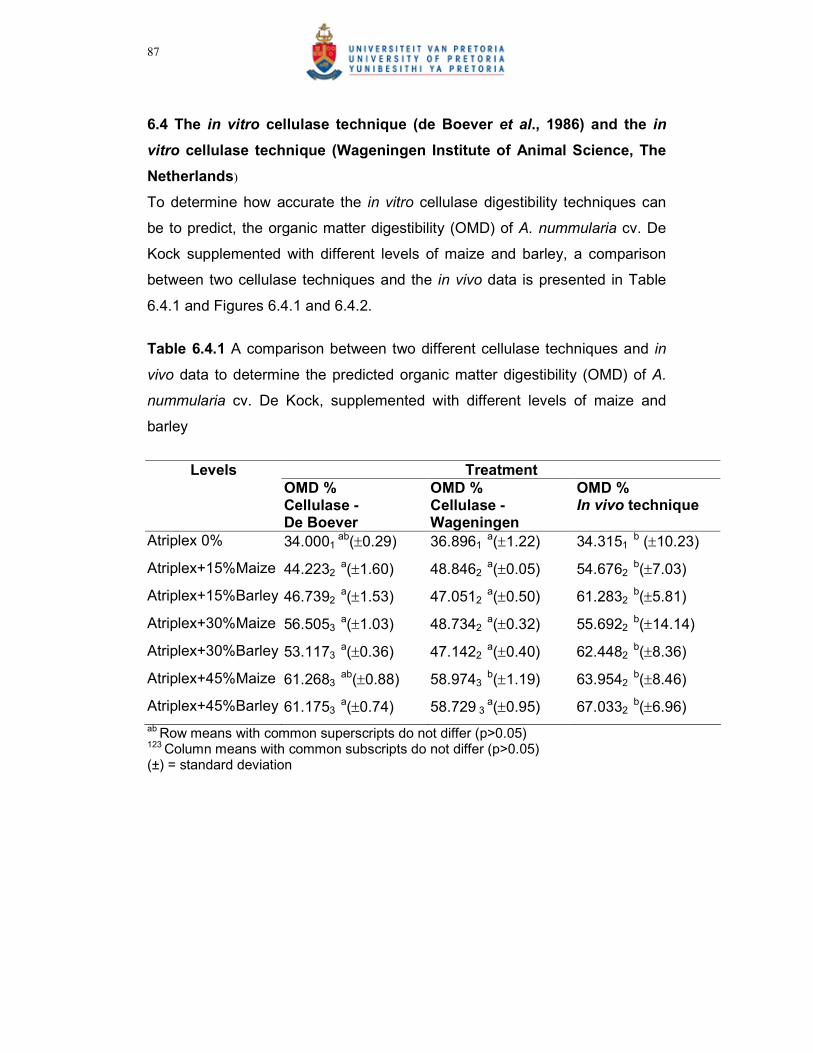
87
6.4 The in vitro cellulase technique (de Boever et al., 1986) and the in
vitro cellulase technique (Wageningen Institute of Animal Science, The
Netherlands)
To determine how accurate the in vitro cellulase digestibility techniques can
be to predict, the organic matter digestibility (OMD) of A. nummularia cv. De
Kock supplemented with different levels of maize and barley, a comparison
between two cellulase techniques and the in vivo data is presented in Table
6.4.1 and Figures 6.4.1 and 6.4.2.
Table 6.4.1 A comparison between two different cellulase techniques and in
vivo data to determine the predicted organic matter digestibility (OMD) of A.
nummularia cv. De Kock, supplemented with different levels of maize and
barley
Levels Treatment
OMD % OMD % OMD % Cellulase -
De Boever Cellulase - Wageningen
In vivo technique
Atriplex 0% 34.0001 ab(±0.29) 36.8961
a(±1.22) 34.3151 b (±10.23)
Atriplex+15%Maize 44.2232 a(±1.60) 48.8462
a(±0.05) 54.6762 b(±7.03)
Atriplex+15%Barley 46.7392 a(±1.53) 47.0512
a(±0.50) 61.2832 b(±5.81)
Atriplex+30%Maize 56.5053 a(±1.03) 48.7342
a(±0.32) 55.6922 b(±14.14)
Atriplex+30%Barley 53.1173 a(±0.36) 47.1422
a(±0.40) 62.4482 b(±8.36)
Atriplex+45%Maize 61.2683 ab(±0.88) 58.9743
b(±1.19) 63.9542 b(±8.46)
Atriplex+45%Barley 61.1753 a(±0.74) 58.729 3
a(±0.95) 67.0332 b(±6.96)
ab Row means with common superscripts do not differ (p>0.05) 123 Column means with common subscripts do not differ (p>0.05) (±) = standard deviation

88
y = 0.9978x + 5.4552
R2 = 0.621
0
10
20
30
40
50
60
70
80
30 35 40 45 50 55 60 65
In vitro digestibility of OM(%)
In vivo digestibility of OM (%)
Figure 6.4.1 Relationship between the in vitro cellulase technique (De Boever
et al., 1986) and in vivo data, for the determination of a regression to predict
organic matter digestibility (OMD) of A. nummularia cv. De Kock,
supplemented with different levels of maize and barley
The R2 of the above regression line is 0.621, which means that 62% of the
variance in in vivo digestibility can be explained by the in vitro digestibility.
A significant correlation (r=0.79) was therefore, obtained between in vivo and
in vitro digestibilities.
A linear regression equation, y =0.9978x +5.4552, could be fitted to the data.
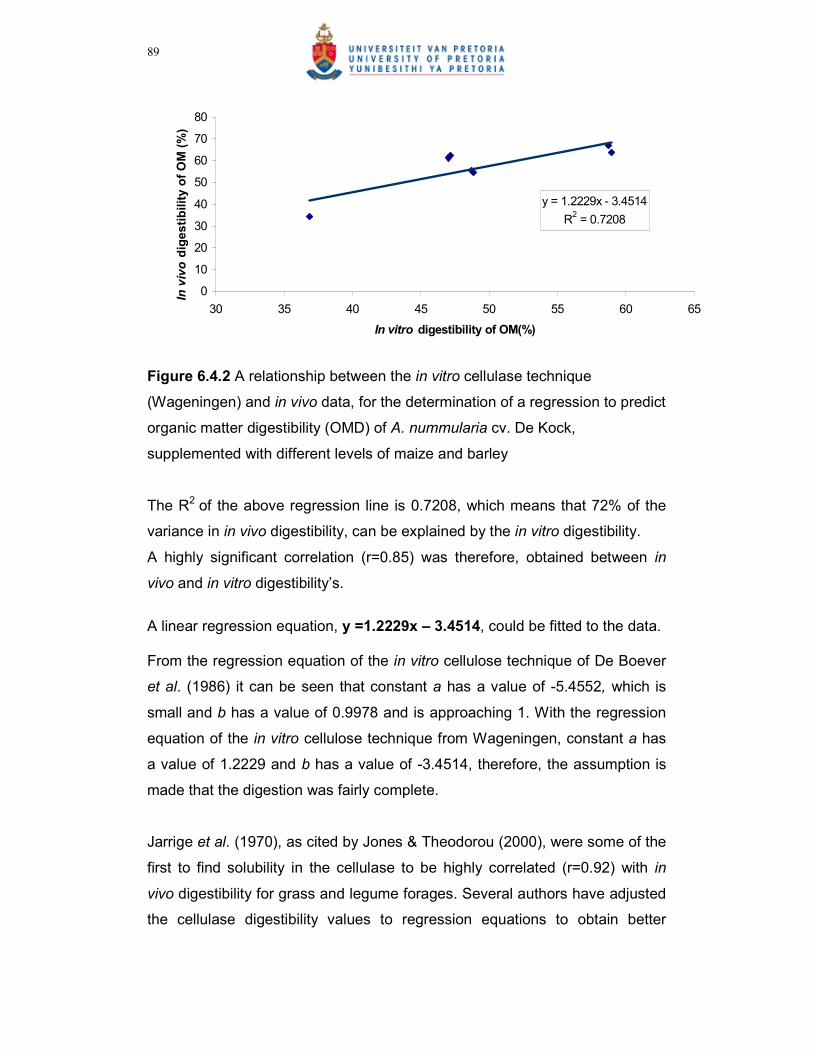
89
y = 1.2229x - 3.4514
R2 = 0.7208
0
10
20
30
40
50
60
70
80
30 35 40 45 50 55 60 65
In vitro digestibility of OM(%)
In vivo digestibility of OM (%)
Figure 6.4.2 A relationship between the in vitro cellulase technique
(Wageningen) and in vivo data, for the determination of a regression to predict
organic matter digestibility (OMD) of A. nummularia cv. De Kock,
supplemented with different levels of maize and barley
The R2 of the above regression line is 0.7208, which means that 72% of the
variance in in vivo digestibility, can be explained by the in vitro digestibility.
A highly significant correlation (r=0.85) was therefore, obtained between in
vivo and in vitro digestibility’s.
A linear regression equation, y =1.2229x – 3.4514, could be fitted to the data. From the regression equation of the in vitro cellulose technique of De Boever
et al. (1986) it can be seen that constant a has a value of -5.4552, which is
small and b has a value of 0.9978 and is approaching 1. With the regression
equation of the in vitro cellulose technique from Wageningen, constant a has
a value of 1.2229 and b has a value of -3.4514, therefore, the assumption is
made that the digestion was fairly complete.
Jarrige et al. (1970), as cited by Jones & Theodorou (2000), were some of the
first to find solubility in the cellulase to be highly correlated (r=0.92) with in
vivo digestibility for grass and legume forages. Several authors have adjusted
the cellulase digestibility values to regression equations to obtain better
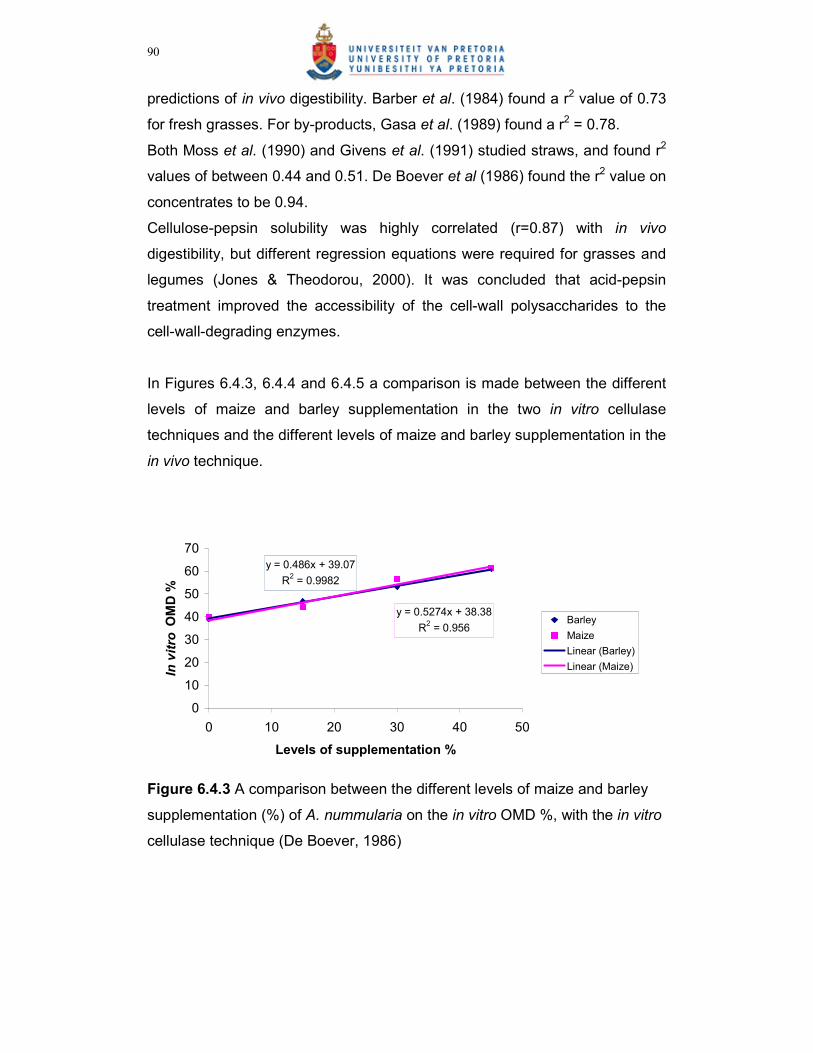
90
predictions of in vivo digestibility. Barber et al. (1984) found a r2 value of 0.73
for fresh grasses. For by-products, Gasa et al. (1989) found a r2 = 0.78.
Both Moss et al. (1990) and Givens et al. (1991) studied straws, and found r2
values of between 0.44 and 0.51. De Boever et al (1986) found the r2 value on
concentrates to be 0.94.
Cellulose-pepsin solubility was highly correlated (r=0.87) with in vivo
digestibility, but different regression equations were required for grasses and
legumes (Jones & Theodorou, 2000). It was concluded that acid-pepsin
treatment improved the accessibility of the cell-wall polysaccharides to the
cell-wall-degrading enzymes.
In Figures 6.4.3, 6.4.4 and 6.4.5 a comparison is made between the different
levels of maize and barley supplementation in the two in vitro cellulase
techniques and the different levels of maize and barley supplementation in the
in vivo technique.
y = 0.486x + 39.07
R2 = 0.9982
y = 0.5274x + 38.38
R2 = 0.956
0
10
20
30
40
50
60
70
0 10 20 30 40 50
Levels of supplementation %
In vitro OMD %
Barley
Maize
Linear (Barley)
Linear (Maize)
Figure 6.4.3 A comparison between the different levels of maize and barley
supplementation (%) of A. nummularia on the in vitro OMD %, with the in vitro
cellulase technique (De Boever, 1986)
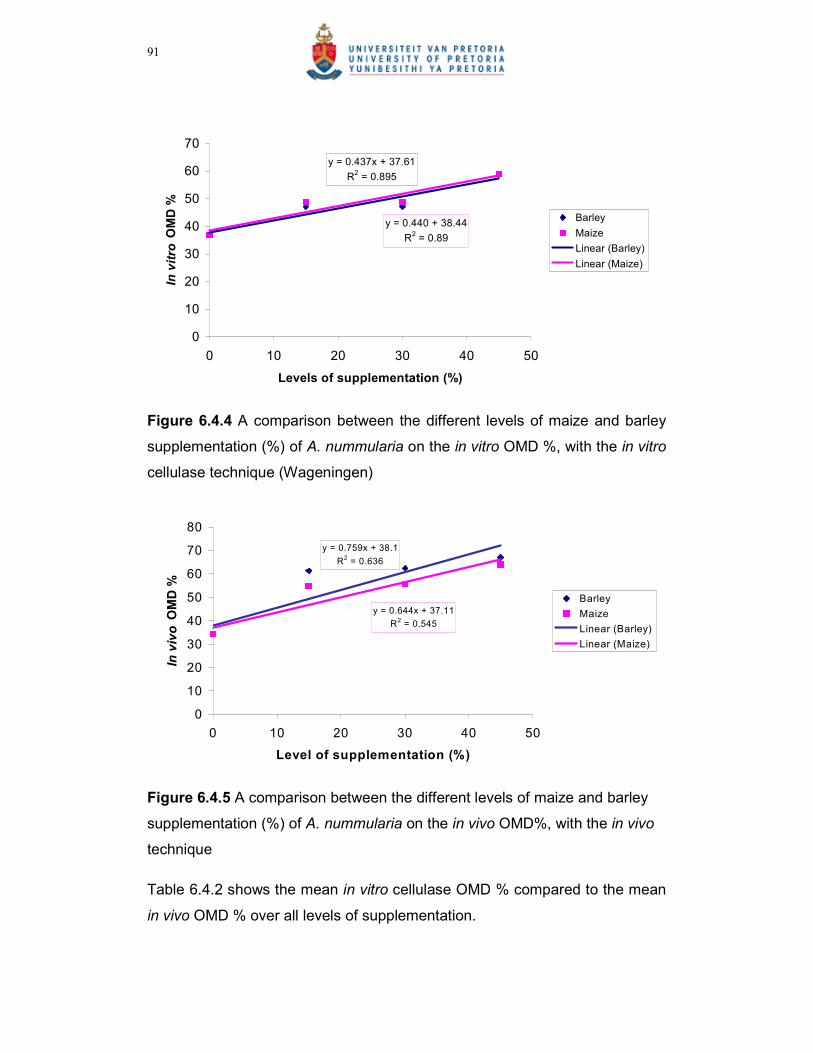
91
y = 0.437x + 37.61
R2 = 0.895
y = 0.440 + 38.44
R2 = 0.89
0
10
20
30
40
50
60
70
0 10 20 30 40 50
Levels of supplementation (%)
In vitro OMD %
Barley
Maize
Linear (Barley)
Linear (Maize)
Figure 6.4.4 A comparison between the different levels of maize and barley
supplementation (%) of A. nummularia on the in vitro OMD %, with the in vitro
cellulase technique (Wageningen)
y = 0.759x + 38.1
R2 = 0.636
y = 0.644x + 37.11
R2 = 0.545
0
10
20
30
40
50
60
70
80
0 10 20 30 40 50
Level of supplementation (%)
In vivo OMD %
Barley
Maize
Linear (Barley)
Linear (Maize)
Figure 6.4.5 A comparison between the different levels of maize and barley
supplementation (%) of A. nummularia on the in vivo OMD%, with the in vivo
technique
Table 6.4.2 shows the mean in vitro cellulase OMD % compared to the mean
in vivo OMD % over all levels of supplementation.
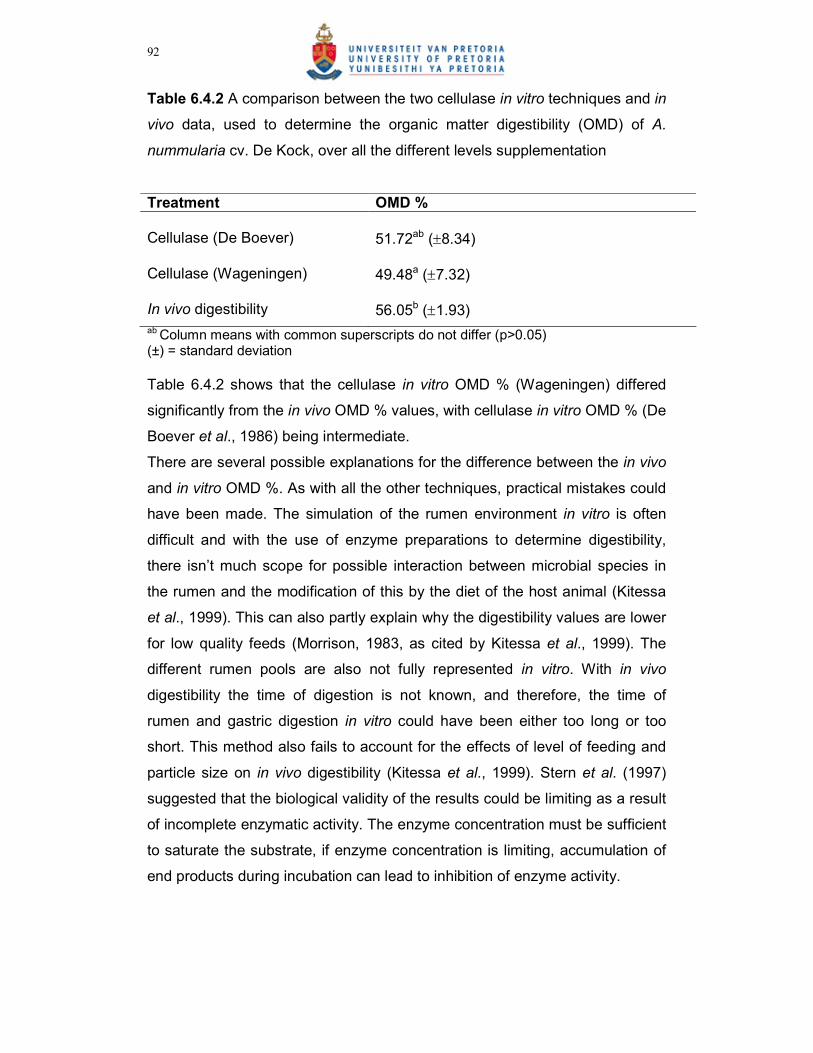
92
Table 6.4.2 A comparison between the two cellulase in vitro techniques and in
vivo data, used to determine the organic matter digestibility (OMD) of A.
nummularia cv. De Kock, over all the different levels supplementation
Treatment OMD %
Cellulase (De Boever) 51.72ab (±8.34) Cellulase (Wageningen) 49.48a (±7.32)
In vivo digestibility 56.05b (±1.93)
ab Column means with common superscripts do not differ (p>0.05) (±) = standard deviation
Table 6.4.2 shows that the cellulase in vitro OMD % (Wageningen) differed
significantly from the in vivo OMD % values, with cellulase in vitro OMD % (De
Boever et al., 1986) being intermediate.
There are several possible explanations for the difference between the in vivo
and in vitro OMD %. As with all the other techniques, practical mistakes could
have been made. The simulation of the rumen environment in vitro is often
difficult and with the use of enzyme preparations to determine digestibility,
there isn’t much scope for possible interaction between microbial species in
the rumen and the modification of this by the diet of the host animal (Kitessa
et al., 1999). This can also partly explain why the digestibility values are lower
for low quality feeds (Morrison, 1983, as cited by Kitessa et al., 1999). The
different rumen pools are also not fully represented in vitro. With in vivo
digestibility the time of digestion is not known, and therefore, the time of
rumen and gastric digestion in vitro could have been either too long or too
short. This method also fails to account for the effects of level of feeding and
particle size on in vivo digestibility (Kitessa et al., 1999). Stern et al. (1997)
suggested that the biological validity of the results could be limiting as a result
of incomplete enzymatic activity. The enzyme concentration must be sufficient
to saturate the substrate, if enzyme concentration is limiting, accumulation of
end products during incubation can lead to inhibition of enzyme activity.

94
CHAPTER 7
GENERAL CONCLUSIONS ON THE DIFFERENT TECHNIQUES USED TO
DETERMINE THE DIGESTIBILITY OF A. NUMMULARIA CV. DE KOCK
The most accurate determination of nutritive value, as indicated by digestibility, dry
matter intake (DM) and production, for animal feeds comes from in vivo feeding
studies. However, high labour inputs, high cost and the need for large quantities of
feed makes them unsuitable for routine feed evaluation. Prediction of digestibility of
ruminant feeds using simple, reliable and inexpensive techniques is, therefore,
important (Garcia-Rodriguez et al., 2005).
Table 7.1 A comparison between the different in vitro techniques to determine which
gives the best prediction of organic matter digestibility (OMD) of A. nummularia cv. De
Kock supplemented with different levels of maize and barley
Levels
Treatment
OMD %
OMD %
OMD %
OMD %
OMD %
Rumen fluid inoculum
Faeces fluid Inoculum
Gas production Cellulase - De Boever
Cellulase - Wageningen
Atriplex 0% 39.583a(±1.202) 38.233
a(±0.92) 30.830
b (±1.22) 34.000
b(±0.29) 36.896
b(±1.22)
Atriplex+15%Maize
65.873 a(±0.143) 65.152
a(±2.51) 37.220
b(±0.100) 44.223
b(±1.60) 48.846
b(±0.05)
Atriplex+15%Barley
62.444a(±10.588) 62.300
a(±1.50) 35.415
b(±0.1.17) 46.739
b(±1.53) 47.051
b(±0.50)
Atriplex+30%Maize
64.886 a(±2.063) 63.159
a(±0.91) 50.125
b(±2.44) 56.505
b(±1.03) 48.734
b(±0.32)
Atriplex+30%Barley
69.554 a(±0.392) 68.053
a(±6.43) 44.555
b(±0.70) 53.117
b(±0.36) 47.142
b(±0.40)
Atriplex+45%Maize
68.304 a(±0.100) 66.253
a(±1.76) 57.990
b(±0.69) 61.268
b(±0.88) 58.974
b(±1.19)
Atriplex+45%Barley
72.49 a(±10.083) 73.3495
a(±4.70) 54.120
b(±0.48) 61.175
b(±0.74) 58.729
b(±0.95)
abc Row means with common superscripts do not differ (p>0.05)
(±) = standard deviation
95
No significant differences (P>0.05) were found between the rumen- and faeces
inoculum in vitro techniques, but differed significantly from the gas production and
cellulase techniques. There was also no significant difference between the gas
production and cellulase techniques. The OMD % of the in vitro techniques differed
significantly from the in vivo OMD % values.
The results in Table 7.1 demonstrated that both the rumen- and faeces inoculum in
vitro techniques could be used to determine the OMD of A. nummularia cv. De Kock,
supplemented with an energy concentrate up to 45%. Higher in vitro OMD values will
be the result, in comparison to the in vivo OMD values. This confirms that the in vitro
faeces technique of El Shaer et el. (1987) is an easier and cheaper alternative to the
classic rumen fluid in vitro technique of Tilley & Terry (1963), as modified by Engels &
Van der Merwe (1967) to determine the OM digestibility of ruminant feeds.
The results also showed that the gas production and cellulase in vitro techniques
resulted in lower OMD values than the in vivo technique. The two in vitro cellulase
techniques are an alternative to the in vitro gas production technique of Pienaar
(1994), to determine the OM digestibility of ruminant feeds. It eliminates the need for
rumen inocula from cannulated animals. The cellulase in vitro technique, where starch
is removed through hydrolysis (De Boever et al., 1986), has the advantage of being
simpler and cheaper, because there is no need to add extra enzymes.
Adesogan (2002) recommended that with the current focus on measuring nutritionally
related plant characteristics, future feed evaluation methods should determine the
concentrations of specific nutrients in feeds and their rates of release to facilitate the
prediction of animal response. In addition to refining current methods for the estimation
of intake, microbial protein production and outflow rates, future analytical methods
should aim to accurately determine diet selection, supplementation effects and
associative effects of different ingredients fed together. Non-conventional factors such
as the environmental impact of feeds and their potential for transferring bioactive
compounds to humans should also be the focus of future evaluation methods (Givens,
et al., 2000).
Kitessa et al. (1999) concluded that the in vivo digestibility of a feed is a function of the
interaction between the feed and the animal, and the laboratory techniques predict
96
digestibility largely on feed sample information alone. Each of the techniques offer
different features and choosing one method over another will, therefore, largely depend
on the reason for measuring digestibility. Commercial laboratories and advisory
services will benefit from choosing a method that has good repeatability and enables a
large number of samples to be analysed per week. In research, the accuracy of
prediction will determine the choice.
The technique first described by Tilley & Terry (1963), has been the most commonly
used in vitro method for predicting digestibility and for use as a selection tool to
improve the nutritional quality of forages (Stern et al., 1997). It is a convenient method
to use, particularly when large-scale testing of feedstuffs is required (Getachew et al.,
1998). The Tilley & Terry (1963) technique is inexpensive and only small feed samples
are required. The method shows promise to predict digestibility, even at levels of intake
higher than the maintenance level. Digestibility of different parts of plants, such as
leaves and stems and of cultivars in the early stages of development can be
determined. A further possible application is in the evaluation of samples from
oesophageal fistulated animals. From this study it was again confirmed that the in vitro
Tilley & Terry (1963) method correlated well with in vivo digestibilities.
The main advantage of the faecal liquor technique is its simplicity combined with its
minimal cost, when compared with the methods based upon rumen inocula. It uses
freely available waste products from farm animals, managed under normal commercial
conditions, saving the cost and inconvenience of maintaining fistulated ruminants.
Faecal liquor is useful when donor material must be obtained from free-ranging
animals (Omed et al., 2000). Aiple et al. (1992) also found that although the hind gut of
ruminants is regarded more as a fermentation chamber for structural carbohydrates
escaping the rumen, inherent microbes are very adaptable and able to degrade non-
structural carbohydrates too.
The materials needed are intact sheep for faeces, bottles, chemicals, carbon dioxide, a
39°C incubator, a centrifuge and a balance. The operator needs few chemistry skills.
The faeces liquor procedure would, therefore, seem to be particularly suitable where
potential food sources need to be screened, using limited equipment (Omed et al.,
2000).
97
This technique will probably be limited to centres that can’t obtain rumen fluid, as it
sometimes give lower digestibility values and combines the protracted, labour-intensive
aspects of the rumen fluid-pepsin technique with faeces collection and activity
problems (Adesogen, 2002).
Mauricio et al. (2001) have suggested that using faeces as inoculum, has the potential
to estimate OMD in vitro as accurately as with rumen liquor and other end-point
techniques. This was also concluded from the current study, with no significant
differences between the in vitro OMD% of the rumen- and faeces inoculum techniques.
Kitessa et al. (1999) noted that this method is susceptible to the same sources of
variation, as when using rumen liquor. In addition, obtaining the correct level of dilution
with artificial saliva and standardising this concentration between runs will require more
skill than with using rumen liquor. It was also suggested that the collection of faeces
after feeding might be standardised by rectal grab sampling.
Enzymatic methods offered similar accuracy, but better repeatability, when compared
to inocula-based methods. The pepsin-cellulase method is recommended for analysis
of digestibility of feeds other than those with high starch content. For cereal grains or
forage-cereal grain mixtures, the use of pepsin-cellulase plus amylase (or high
temperature) or the Tilley & Terry (1963) method, is recommended. The pepsin-
cellulase plus amylase is preferred for better repeatability, as it involves less biological
variation than inocula based methods (Kitessa et al., 1999). Colombatto et al. (2000)
examined the use of enzyme preparations to study the DM degradation dynamics of
forages. It was concluded that the enzyme mixtures have the potential to describe the
DMD profiles of maize silage and alfalfa hay, but that further research was needed for
different feeds. Based on the review the, cellulase-based techniques reviewed, can
predict in vivo digestibility more precisely than chemical methods, and are at least
comparable in accuracy to inoculum digestion methods (Kitessa et al., 1999; Jones &
Theodorou, 2000). In this study it was found that the two different cellulase techniques,
De Boever et al. (1986) and Wageningen, did not result in significantly different
OMD%. Both of the cellulose techniques had significant correlations with the in vivo
OMD%, with the Wageningen cellulase technique correlation a little better that the De
Boever et al. (1986) cellulase technique. This can be linked to the recommendation of
98
Kitessa et al. (1999) that for a forage-cereal grain mixture, as in the case of this study,
A. nummularia with barley and maize, pepsin-cellulase plus amylase will result in a
better prediction of in vivo OMD%.
For a method to have any real value in forage evaluation, it is essential that predictive
equations are applicable to other populations, at least of the same or similar forages.
The relationships between in vivo digestibility and enzyme solubility for different crops
will be variable under different environmental and other conditions. It is known that
environmental factors can influence both the content and degree of lignification of the
cell wall. Enzyme methods solubilise less of the cell wall than in vivo digestion and are
more influenced by the degree of lignification. It is likely, therefore, that environmental
effects on cell-wall structure will influence enzyme solubility differently from in vivo
digestion. Differences in botanical composition may also be significant, since it appears
that the cell walls of legumes are more readily solubilised by cellulase than those of
grasses (Jones & Theodorou, 2000).
A further consideration is that in vivo digestion can be influenced by factors such as
level of feeding, particle size and length or the nutrient status of the feed (Kitessa et al.,
1999; Jones & Theodorou, 2000). With silages, differential losses of volatiles or the
degree and type of fermentation on rumen function and digestibility will also influence
the predictive equations. There is clearly a need for further in vivo and analytical
studies to determine the extent to which predictive equations derived from enzyme
solubility apply to different environmental and other conditions (Jones & Theodorou,
2000).
Jones & Hayward (1973) found the solubility of dried grasses in Trichoderma cellulase
to be highly correlated with in vivo digestibility. The amount of dry matter solubilised by
the enzyme preparation used by Jones & Hayward (1973) was lower than the in vivo or
in vitro (inoculum) values. A regression equation was, therefore, required to relate
cellulase solubility to in vivo digestibility. Different regression equations were required
for different materials assayed, but, subject to this provision, cellulase solubility was
considered a suitable alternative to inoculum methods (Jones & Theodorou, 2000).
99
Of the cellulase methods currently in use, the pepsin-cellulase method has been found
to be the least time consuming and easiest to manipulate (Downman & Collins, 1982).
It also uses inexpensive glassware and chemicals and a higher output per person can
be achieved, than with methods involving refluxing with detergent or strong acid.
Generally, predictions based on the in situ technique were more accurate an explained
a greater percentage of variation in the in vivo DMD, than the in vitro rumen liquor-
pepsin procedure. Both in theory and practice, this method is the closest to
measurement of in vivo digestibility. The accuracy of the other methods could be
tested or adjusted against the in situ method, if in vivo trials are not practical (Kitessa
et al., 1999).
The in vitro gas production procedure in the current study did not exceed either the
enzymatic or inocula-based procedures in accuracy of predicting total tract DM or OM
digestibility. However, it can be used in screening cereal grains for the rate of
hydrolysis of starch in the rumen, which is crucial in the digestion of forage-grain
mixtures by ruminants. For this purpose it is recommended in preference to the in situ
method, which is more laborious and more variable (Kitessa et al., 1999). Mould et al.
(2005) mentioned that the extent of rumen degradation of a feedstuff is the product of
ruminal residence time and rate of degradation. The Tilley & Terry (1963) two-stage
technique is deficient in that it does not provide kinetic information. It is, therefore,
possible for two feeds to have similar end-point degradation values, but different rates
of degradation. This is of fundamental importance, as feeds with higher degradation
rates tend to be consumed in greater quantity. In addition, these assays are generally
made after an incubation period of 48-96h. It is, therefore, possible that degradation is
over-estimated and subtle differences between similar feeds lost. The main advantage
of this method, compared to the rumen-liquor and enzyme methods, is that it takes less
time and totally removes errors due to washing, filtration and weighing of residues. The
method is potentially susceptible to underestimating digestibility of feeds that are slow
in producing gas, but which have a high in vivo digestibility (Kitessa et al., 1999).
Adesogan (2002) also stated that results of gas production experiments are often
misinterpreted and used to draw inappropriate deductions. Rymer et al. (2005)
suggested that if the gas production technique is to be used as a means of feed
evaluation, it may be necessary to require a standardised particle size and sample
100
preparation procedure in order to reduce variation between experiments and
laboratories.
To conclude, from the current study, the accuracy of all the in vitro methods was lowest
when predicting the in vivo digestibility of low quality feeds, such as hay and cereal by-
products. It is likely that the effect of passage rate and level of intake on digestibility, as
well as, animal variation, is greatest on such feed types. None of the in vitro methods
can fully account for these variables (Kitessa et al., 1999).
.
93
6.5 Dry matter digestibility
The digestibility of pure A.nummularia (0% supplementation) as reported in
this trial was lower than those reported by other researchers (Hassan & Abd
El-Aziz, 1979). Atiq-ur-Rehman et al. (1995) reported that digestibilities could
range from 47% to 74% when fed to sheep. The lower digestibilities found in
the present trial, may be due to the higher stem to leaf ratio and differences in
the amount lignin found in the stems. The material used in this trial was
collected from older plants, which had been grazed in the winter prior to
harvest. Therefore, the residual material tended to be more fibrous and less
palatable.
The increase in dry matter digestibility as energy supplementation is provided
supports the results reported by previous authors (Ørskov, 1982, Warren &
Casson, 1993). The increase in digestibility, with energy supplementation, can
be explained by the higher content of digestible organic matter in the energy
sources. The differences in digestibility at the different levels could, in
addition, be due to associative effects.
Mould et al. (2001) studied the non-additivity of feedstuffs in vitro and the
influence of incubation medium pH. Non-additivity occurs when the nutritive
value of mixed feedstuffs differs from that of the sum of its components. One
dietary constituent can have an influence, positive or negative, on the
apparent digestibility of another, where other components, such a nitrogen
and sulphur are non-limiting. Negative effects occur due to the depression of
rumen pH or substrate competition and positive effects occur when a readily
fermentable fibre source has been combined with poorly fermented forages.
The authors observed that non-additive effect can be identified with the use of
an in vitro gas production technique and that the magnitude varies with
incubation interval and pH of the fermentation medium. The results suggest
that the use of gas production and OMD from single feeds, to generate
estimations for a combined feed would not be valid. Sandoval-Castro et al.
(2000) also studied in vitro associative effects of feed mixtures, with the in
vitro gas production technique. It was found the IVDMD and gas production
was depressed when feed mixtures were tested.
101
REFERENCES
ABOU EL NASR, H.M., KANDIL, H,M., EL KERDAWY,A., DAWLAT,
KHAMIS, H.S. & EL-SHAER, H.M., 1996. Value of processed saltbush and
Acacia shrubs as sheep fodders under the arid conditions of Egypt. Small.
Rum. Res. 24, 15.
ADESOGAN, A.T., GIVENS, D.I. & OWEN, E., 1998. Prediction of the in vivo
digestibility of whole crop wheat from in vitro digestibility, chemical
composition, in situ rumen degradability, in vitro gas production and near
infrared reflectance spectroscopy. Anim. Feed Sci. Tech. 74, 259.
ADESOGAN, A.T., 2002. What are feeds worth? A critical evaluation of
selected nutritive value methods. Proc. 13th Annual Florida Ruminant Nutrition
Symposium. 33.
AGANGA, A.A., MTHETHO, J.K. & TSHWENYANE, S., 2003. Atriplex
nummularia (Old Man Saltbush) : A potential forage crop for arid regions of
Botswana. Pakistan J. Nutr. 2 (2), 72.
AIPLE, K.P., STEINGASS, H. & MENKE, K.H.O., 1992. Suitability of a
buffered faecal suspension as the inoculum in the Hohenheim gas test. J.
Anim. Physiol. Anim. Nutr. 67, 57.
AKHTER, S., OWEN, E., FALL, A., O’DONOVAN, F. & THEODOROU, M.K.,
1994. Use of fresh or frozen cow faeces instead of sheep rumen liquor to
provide micro-organisms for in vitro digestibility assays of forages. Presented
at British Society of Animal Production Winter Meeting, Paper 100.
AKHTER, S., OWEN, E., THEODOROU, M.K., TEMBO, S.L. & DEAVILLE,
E.R., 1995. Repeatability of in vitro digestibility assays of forages when using
fresh, frozen of freeze-dried cow faeces instead of sheep rumen liquor as
102
sources of micro-organisms. Presented at British Society of Animal
Production Winter Meeting, Paper 110.
A.O.A.C., 2000. Official methods of analysis (15th Ed.). Association of Official
Analytical Chemists, Arlington, VA.
AUFRERE, J. & MICHALET-DOREAU, B., 1988. Comparison of methods for
predicting digestibility of feeds. Anim. Feed Sci. Tech. 20, 203.
BEEVER, D.E. & MOULD, F.L., 2000. Efficient ruminant livestock production.
In: Forage Evaluation in Ruminant Nutrition. CAB International, Wallingford,
Eds: Givens, D.I., Owen, E., Omed, H.M., Axford, R.F.E., 175.
BEN SALEM, H., NEFZAOUI, A. & BEN SALEM, L., 2002a. Supplementing
spineless cactus (Opuntia ficus-indica f.inermis) based diets with urea-treated
straw or oldman saltbush (Atriplex nummularia): Effects on intake, digestion
and sheep growth. J. Agric. Sci. 138, 85.
BEN SALEM, H., NEFZAOUI, A. & BEN SALEM, L., 2002b. Supplementation
of Acacia cyanophylla Lindl. foliage-based diets with barley or shrubs from
arid areas (Opuntia ficus-indica f. inermis and Atriplex nummularia L.) on
growth and digestibility in lambs. Anim. Feed. Sci. Tech. 96, 15.
BEUVINK, J.M.W., SPOELSTRA, S.F. & HOGENDORP, R.J., 1992. An
automated method for measuring time-course of gas production of feedstuffs
incubated with buffered rumen fluid. Netherlands J. Agric.Sci. 40, 401.
BLÜMMEL, M. & ØRSKOV, E.R., 1993. Comparison of in vitro gas production
and nylon bag degradability of roughages in predicting feed intake in cattle.
Anim. Feed. Sci. Tech. 40, 109.
BLÜMMEL, M., STEINGAß, H. & BECKER, K., 1997. The relationship
between in vitro gas production, in vitro microbial biomass yield and 15N
incorporation and its implications for the prediction of voluntary feed intake of
103
roughages. Br. J. Nutr. 77, 911.
BREYTENBACH, W.A.S., DICKINSON, E.B., HYAM, G.F.S., METCALF,
H.D., BASSON, W.D., WILLIAMS, F,R., SCHEEPERS, L.J., PLINT, A.P.,
SMITH, H.R.H., SMITH, P.J., VAN VUUREN, P.J., VILJOEN, J.H.,
ARCHIBALD, K.P. 7 ELS, J.M., 1997. Kynoch Pasture Handbook. Published
by Kejafa Knowledge Works.
BUGHRARA, S.S. & SLEEPER, D.A., 1986. Digestion of several temperate
forage species by a prepared cellulase solution. Agronomy J. 78, 94.
BUGHRARA, S.S., SLEEPER, D.A., BELYEA, R.L. & MARTEN, G.C., 1989.
Quality of alfalfa herbage estimated by a prepared cellulase solution and near
infrared reflectance spectroscopy. Can. J. Plant Sci. 69, 833.
COELHO, M., HEMBRY, F.C., BARTON, F.E. & SAXTON, A.M., 1988. A
comparison of microbial, enzymatic, chemical and near-infrared reflectance
spectroscopy methods in forage evaluation. Anim Feed Sci. Tech. 20, 219.
COLOMBATTO, D., MOULD, F.L., BHAT, M.K. & OWEN, E., 2000. Fibriolytic
enzyme mixtures as an alternative to rumen fluid for assessing feed
degradation kinetics in vitro. Proc. Brit. Soc. Anim. Sci. 24.
CONE, J.W., CLINE-THEIL, W., MALESTEIN, A. & VAN’T KLOOSTER, A.T.,
1989. Degradation of starch by incubation with rumen fluid. A comparison of
different starch sources. J. Sci. Food Agric. 49, 173.
CONE, J.W., VAN GELDER, A.H., VISSCHER, G.J.W. & OUDSHOORN, L.,
1996. Influence of rumen fluid and substrate concentration on fermentation
kinetics measured with fully automated time related gas production apparatus.
Anim. Feed Sci. Tech. 61, 113.
CONE, J.W., VAN GELDER, A.H. & DRIEHUIS, F., 1997. Description of gas
production profiles with a three-phasic model. Anim. Feed Sci. Tech. 66, 31.

104
CONE, J.W., VAN GELDER, A.H. & VALK, H., 1998. Prediction of nylon bag
degradation characteristics of grass samples with the gas production
technique. J. Sci. Food Agric. 77, 421.
CONE, J.W. & VAN GELDER, A.H., 1999. Influence of protein fermentation
on gas production profiles. Anim. Feed Sci. Tech. 76, 251.
CONE, J.W., VAN GELDER, A.H., SOLIMAN, I.A., DE VISSER, H. & VAN
VUUREN, A.M., 1999. Different techniques to study rumen fermentation
characteristics of maturing grass and grass silage. J Dairy Sci. 82, 957.
DEAVILLE, E.R. & GIVENS, D.I., 1998. Investigation of direct gas production
from silage fermentation acids. Proc. Brit. Soc. Anim. Sci. Annual Meeting,
Scarborough, 64.
DE BOEVER, J.L., 1986 Digestibility methods as predictors of intake and in
vivo digestibility. J. Agric. Sci. 126, 235.
DE BOEVER, J.L., COTTYN, B.G., BUYSSE, F.X. & VANACKER, J.M., 1988.
The use of a cellulase technique to predict digestibility, metabolizable and net
energy of forages. Anim. Feed Sci. Tech. 19, 247.
DOWMAN, M.G. & COLLINS, F.C., 1982. The use of enzymes to predict the
digestibility of animal feeds. J. Sci. Feed Agric. 33, 689.
DOWMAN, M.G., 1993. Modifications to the neutral detergent cellulase
digestibility method for the prediction of the metabolizable energy of
compound feeds containing palm kernel oil. J. Sci. Food Agric. 61, 327.
EL SHAER, H.M., OMED, H.M., CHAMBERLAIN, A.G. & AXFORD, R.F.E.,
1987. Use of faecal organisms from sheep for the in vitro determination of
digestibility. J. Agric. Sci. 109, 257.
105
EL SHAER, H.M., FAHMY, A.A., ABDUL-AZIZ, G.M., SHALABY, A.S. & ABD
EL GAWAD, A.M., 2000. Utilisation of less and unpalatable halophytes as
non-conventional feeds for sheep under the arid conditions in Egypt.
Proceedings of the 3rd All Africa conference on Animal Agriculture and 11th
conference of Egyptian Society of Animal Production. Alenndra, Egypt, 109.
EL-MEADAWAY, A., MIR, Z., MIR, P.S., ZAMAN, M.S. & YANKE, L.J., 1998.
Relative efficacy of inocula from rumen fluid or faecal solution for determining
in vitro digestibility and gas production. Can. J. Anim. Sci. 78, 673.
ENGELS, E.A.N. & VAN DER MERWE, F.J., 1967. Application of an in vitro
technique to South African forages with special reference to the effect to
certain factors on the results. S. Afr. J. Agric. Sci. 10, 983.
GARCIA-RODRIQUEZ, A., MANDALUNIZ, N., FLORES, G. & OREGUI, L.M.,
2005. A gas production technique as a tool to predict organic matter
digestibility of grass and maize silage. Anim. Feed Sci. Tech. 123-124, 267.
GETACHEW, G., BLÜMMEL, M., MAKKAR, H.P.S. & BECKER, K., 1998. In
vitro gas measuring techniques for assessment of nutritional quality of feeds:
A review. Anim. Feed Sci. Tech. 72, 261.
GIVENS, D.I., COTTYN, B.G., DEWEY, P.J.S. & STEG, A., 1995. A
comparison of the neutral detergent cellulase method with other laboratory
methods for predicting the digestibility in vivo of maize silages from three
European countries. Anim. Feed Sci. Tech. 1995.
GIZZI, G., ZANCHI, R. & SCIARAFFIA, F., 1998. Comparison of
microbiological and fermentation parameters, obtained with an improved
rumen in vitro technique, with those obtained in vivo. Anim. Feed Sci. Tech.
73, 291.
GLENN, E., TANNER, R., MIYAMOTO, S.,FITZSIMMONS, K. & BOYER, J.,
1998. Water use, productivity and forage quality of the halophyte Atriplex
106
nummularia grown on saline waste water in a desert environment. J. Arid
Environ. 38, 45.
GONÇALVES, L.M.B.O. & BORBA, A.E.S., 1996. Study of gas producing
capacity of three sources of inocula. J. Agric. Sci., Camb. 127, 511.
GONZÀLEZ RONQUILLO, M., FONDEVILA, M., BARRIOS URDANETA, A. &
NEWMAN, Y., 1998. In vitro gas production from buffel grass (Cenchrus
ciliaris L.) fermentation in relation to the cutting interval, the level of nitrogen
fertilisation and the season of growth. Anim. Feed Sci. 72, 19.
GRANT, R.J. & MERTENS, D.R., 1992a. Development of buffer systems for
pH control and evaluation of pH effects on fiber digestion in vitro. J. Dairy Sci.
75, 1581.
GRANT, R.J. & MERTENS, D.R., 1992b. Impact of in vitro fermentation
techniques upon kinetics of fiber digestion. J. Dairy Sci. 75, 1263.
GRANT, R.J. & MERTENS, D.R., 1992c. Influence of buffer pH and raw corn
starch addition on in vitro fiber digestion kinetics. J. Dairy Sci. 75, 2762.
GROOT, J.C.J., WILLIAMS, B.A., OOSTDAM, A.J., BOER, H. & TAMMINGA,
S., 1998. The use of cumulative gas and volatile fatty acid production to
predict in vitro fermentation kinetics of Italian ryegrass leaf walls and contents
at various time intervals. Br. J. Nutr. 79, 519.
HARRIS, D.M., BARTLET, A. & CHAMBERLAIN, A.T., 1995. The use of dairy
cow faeces rather than rumen liquor in the gas pressure transducer technique
for assessing digestion kinetics in vitro. Presented at British Society of Animal
Production Winter Meeting, Paper 113.
107
HASSAN, N.I. & ABD EL AZIZ, H.M., 1979. Effect of barley supplementation
on the nutritive value of saltbush (Atriplex nummularia). Wrld. Rev. Anim.
Prod. 15:4, 47-55
HOBSON, V., GROBBELAAR, P.D., WENTZEL, D. & KOEN, A., 1986. Effect
of level of supplementary feeding on mohair production and reproductive
performance of Angora ewes (goats) grazing Atriplex nummularia (Oldman
saltbush). S.A. J. of Anim.Sci.16:2, 95
HOPKINS, D.L. & NICHOLSON, A., 1999. Meat quality of wether lambs
grazed on either saltbush (Atriplex nummularia) plus supplements or lucerne
(Medicago sativa). Meat Sci. 51, 91.
JONES, D.I.H. & HAYWARD, M.V., 1973. A cellulase digestion technique for
predicting dry matter digestibility of grasses. J. Sci. Food Agric. 24. 1419.
JONES, D.I.H. & HAYWARD, M.V., 1975. The effect of pepsin pre-treatment
of herbage on the prediction of dry matter digestibility from solubility in fungal
enzyme solutions. J. Sci. Food Agric. 26, 711.
JONES, D.I.H. & THEODOROU, M.K., 2000. Enzyme techniques for
estimating digestibility. In Givens, D.I., Owen, E., Omed, H.M., Axford, R.F.E.
(Eds.), Forage evaluation in ruminant nutrition. CAB International, Wallingford,
155.
KHAZAAL, K., DENTINHO, M.T., RIBEIRO, J.M. & ØRSKOV, E.R., 1993. A
comparison of gas production during incubation with rumen contents in vitro
and nylon bag degradability as predictors of the apparent digestibility in vivo
and voluntary intake of hays. Anim. Prod. 57, 105.
KIRKHOPE, R.T.S. & LOWMAN, R.S., 1996. Use of an in vitro gas production
technique with faeces as inoculant to assess tropical forage quality for equids.
Presented at British Society of Animal Production Winter Meeting, Paper 248.
108
KITESSA, S., FLINN, P.C. & IRISH, G.G., 1999. Comparison of methods
used to predict the in vivo digestibility of feeds in ruminants. Aust. J. Res. 50,
825.
LOWMAN, R.S., THEODOROU, M.K., LONGLAND, A.C. & CUDDEFORD,
D., 1996. A comparison of equid faeces or ceacal digesta as sources of
inoculum for in vitro fermentation studies using the pressure transducer
technique. Presented at British Society of Animal Production Winter Meeting,
Paper 225.
LOWMAN, R.S., THEODOROU, M.K., HYSLOP, J.J., DHANOA, M.S. &
CUDDEFORD, D., 1999. Evaluation of an in vitro batch culture technique for
estimating the in vivo digestible energy content of equine feeds using equine
faeces as the source of microbial inoculum. Anim. Feed. Sci. Tech. 80, 11.
MAHGOUB, O., LU, C.D. & EARLY, R.J., 2000. Effects of dietary energy
density of feed intake, bodyweight gain and carcass chemical composition of
Omani growing lambs. Small Rum. Res. 37, 35.
MAURICIO, R.M., MOULD, F.L., DHANOA, M.S., OWEN, E., CHANNA, K.S.
& THEODOROU, M.K., 1999. A semi-automated in vitro gas production
technique for ruminant feedstuff evaluation. Anim. Feed. Sci. Tech. 79, 321.
MAURICIO, R.M., OWEN, E., MOULD, F.L., GIVENS, I., THEODOROU,
M.K.,FRANCE, J., DAVUES, D.R. & DHANOA, M.S., 2001. Comparison of
bovine rumen liquor and bovine faeces as inoculum for an in vitro gas
production technique for evaluating forages. Anim. Feed Sci. Tech. 89, 33.
McDONALD, I., 1981. A revised model for the estimation of protein
degradability in the rumen. J. Agric. Sci. 96, 251.
109
McDONALD, P., EDWARDS, R.A., GREENHALGH, J.F.D. & MORGAN, C.A.,
1995. Animal Nutrition, 5th ed. Longman Scientific and Technical, Harlow, UK,
221-237.
McDOUGALL, E.I., 1948. Studies on ruminant saliva. 1. The composition and
output of sheep saliva. Biochem. J. 43, 99.
McLEOD, M.N. & MINSON, D.J., 1982. Accuracy of predicting digestibility by
the cellulase technique: The effect of pre-treatment of forage with neutral
detergent or acid-pepsin. Anim. Feed Sci. Tech. 7, 83.
MENKE, K.H., RAAB, L., SALEWSKI, A., STEINGASS, H., FRITZ, D. &
SCHNEIDER, W., 1979. The estimation of the digestibility and metabolisable
energy content of ruminant feedingstuffs from the gas production when they
are incubated with rumen liquor in vitro. J. Agric. Sci. Camb. 93, 217.
MINSON, D.J., 1990. Forage in Ruminant Nutrition. Academic Press, San
Diego, USA, 483.
MOULD, F.L., COLOMABTTO, D., HERVAS, G., IBRIR, F., OWEN, E. &
REYNOLDS, S.K., 2001. Non-additivity of feedstuffs examined in vitro and the
influence of incubation medium pH. Proc. Br. Soc. Anim. Sci. 133.
MOULD, F.L., KLIEM, K.E. & MORGAN, R., 2005. Alternative methodologies
– stretching the in vitro box. Anim. Feed. Sci. Tech. 123-124, 501.
NAGADI, S., HERRERO, M. & JESSOP, N.S., 2000a. The effect of
fermentable nitrogen availability on in vitro gas production and degradability of
NDF. Anim. Feed. Sci. Tech. 87, 241.
NAGADI, S., HERRERO, M. & JESSOP, N.S., 2000b. The influence of diet of
the donor animal on the initial bacterial concentration of ruminal fluid and in
vitro gas production degradability parameters. Anim. Feed. Sci. Tech. 87, 231.

110
NATARAJA, M.B., KRISHNAMOORTHY, U. & KRISHNAPPA, P., 1998.
Assessment of rumen in vitro incubation (gas production) technique and
chemical analyses by detergent system to predict metabolisable energy
content in mixed diets of lactating cows. Anim. Feed Sci. Tech. 74, 169.
NHERERA, F.V., NDLOVU, L.R. & DZOWELA, B.H., 1999. Relationships
between in vitro gas production characteristics, chemical composition and in
vivo quality measures in goats fed fodder tree supplements. Small Rum. Res.
31, 117.
NORMAN, H.C., FRIEND, C., MASTERS, D.G., RINTOUL, A.J., DYNES, R.A.
& WILLIAMS, I.H., 2004. Variation within and between two saltbush species in
plant composition and subsequent selection by sheep. Aust. J. Agric. Res.
55(9), 999
NSAHLAI, I.V. & UMUNNA, N.N., 1996. Comparison between reconstituted
sheep faeces and rumen fluid inocula and between in vitro and in sacco. J.
Agric. Sci. 126, 235.
OMED, H.M., AXFORD, R.F.E., CHAMBERLAIN, A.G.C. & GIVENS, D.I.,
1989. Development of a method for the in vitro estimation of forage in
ruminants. In: New Techniques in Cattle Production. Ed: Phillips, C.J.C.
Butterworth, London, 227.
OMED, H.M., LOVETT, D.K. & AXFORD, R.F.E., 2000. Faeces as a source of
microbial enzymes for estimating digestibility. In: Forage Evaluation in
Ruminant Nutrition. CAB International, Wallingford. Eds: Givens, D.I., Owen,
E., Omed, H.M., Axford, R.F.E., 135.
ØRSKOV, E,R., 1982. Protein Nutrition in Ruminants. Academic Press,
London.
ØRSKOV, E,R., 2000. The in situ technique for the estimation of forage
degradability in ruminants. In: Forage Evaluation in Ruminant Nutrition. CAB
111
International, Wallingford Eds: Givens, D.I., Owen, E., Omed, H.M., Axford,
R.F.E., 175.
PACE, V., BARGE, M.T., SETTINERI, D. & MALOSSINI, F., 1984.
Comparison of forage digestibility in vitro with enzymic solubility. Anim. Feed
Sci. Tech. 11, 125.
PEARCE, K. & JACOB, R., 2004. Saltbush lifts sheep meat vitamin content.
Farming ahead 153, 63.
PELL, A.N. & SCHOFIELD, P., 1993. Computerised monitoring of gas
production to measure forage digestion in vitro. J. Dairy Sci. 76, 1063.
PIENAAR, J.P., 1994. Theoretical and applied aspects of voluntary feed
intake by ruminants, with special reference to the kinetics of rumen digestion.
PhD thesis, University of Natal, Pietermaritzburg, South Africa, 75.
PRASAD, C.S., WOOD, C.D. & SAMPATH, K.T., 1994. Use of in vitro gas
production to evaluate rumen fermentation of untreated and urea treated
finger millet straw (Eleusine coracana) supplemented with different levels of
concentrate. J. Sci. Food Agric. 65, 457.
RICHARDS, C.J., PEDERSON, J,F., BRITTON, R.A., STOCK, R.A. &
KREHBIEL, C.R., 1995. In vitro starch disappearance procedure
modifications. Anim. Feed Sci. Tech. 55, 35.
RYMER, C., 2000. The measurement of forage digestibility in vivo. In: Forage
Evaluation in Ruminant Nutrition. CAB International, Wallingford Eds: Givens,
D.I., Owen, E., Omed, H.M., Axford, R.F.E., 113.
RYMER, C. & GIVENS, D.I., 1997. A comparison of different types of
apparatus used for measuring gas production in vitro. Proc. Br. Soc. Anim.
Sci. 193.
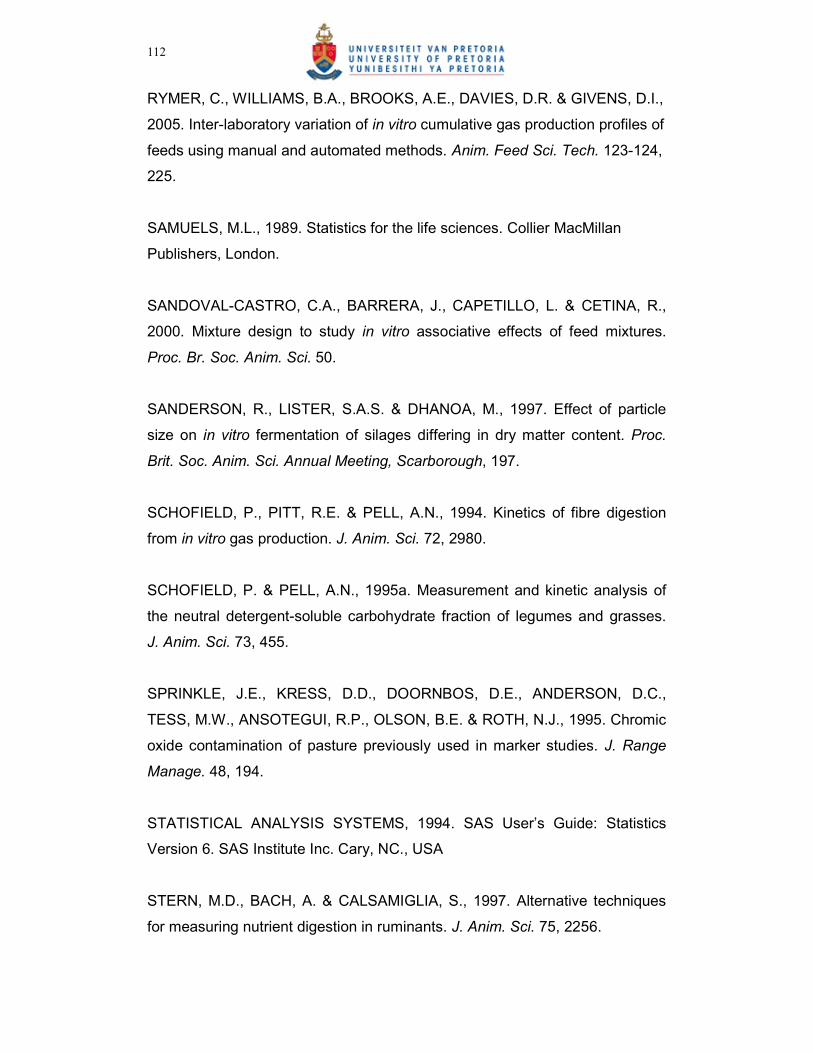
112
RYMER, C., WILLIAMS, B.A., BROOKS, A.E., DAVIES, D.R. & GIVENS, D.I.,
2005. Inter-laboratory variation of in vitro cumulative gas production profiles of
feeds using manual and automated methods. Anim. Feed Sci. Tech. 123-124,
225.
SAMUELS, M.L., 1989. Statistics for the life sciences. Collier MacMillan
Publishers, London.
SANDOVAL-CASTRO, C.A., BARRERA, J., CAPETILLO, L. & CETINA, R.,
2000. Mixture design to study in vitro associative effects of feed mixtures.
Proc. Br. Soc. Anim. Sci. 50.
SANDERSON, R., LISTER, S.A.S. & DHANOA, M., 1997. Effect of particle
size on in vitro fermentation of silages differing in dry matter content. Proc.
Brit. Soc. Anim. Sci. Annual Meeting, Scarborough, 197.
SCHOFIELD, P., PITT, R.E. & PELL, A.N., 1994. Kinetics of fibre digestion
from in vitro gas production. J. Anim. Sci. 72, 2980.
SCHOFIELD, P. & PELL, A.N., 1995a. Measurement and kinetic analysis of
the neutral detergent-soluble carbohydrate fraction of legumes and grasses.
J. Anim. Sci. 73, 455.
SPRINKLE, J.E., KRESS, D.D., DOORNBOS, D.E., ANDERSON, D.C.,
TESS, M.W., ANSOTEGUI, R.P., OLSON, B.E. & ROTH, N.J., 1995. Chromic
oxide contamination of pasture previously used in marker studies. J. Range
Manage. 48, 194.
STATISTICAL ANALYSIS SYSTEMS, 1994. SAS User’s Guide: Statistics
Version 6. SAS Institute Inc. Cary, NC., USA
STERN, M.D., BACH, A. & CALSAMIGLIA, S., 1997. Alternative techniques
for measuring nutrient digestion in ruminants. J. Anim. Sci. 75, 2256.
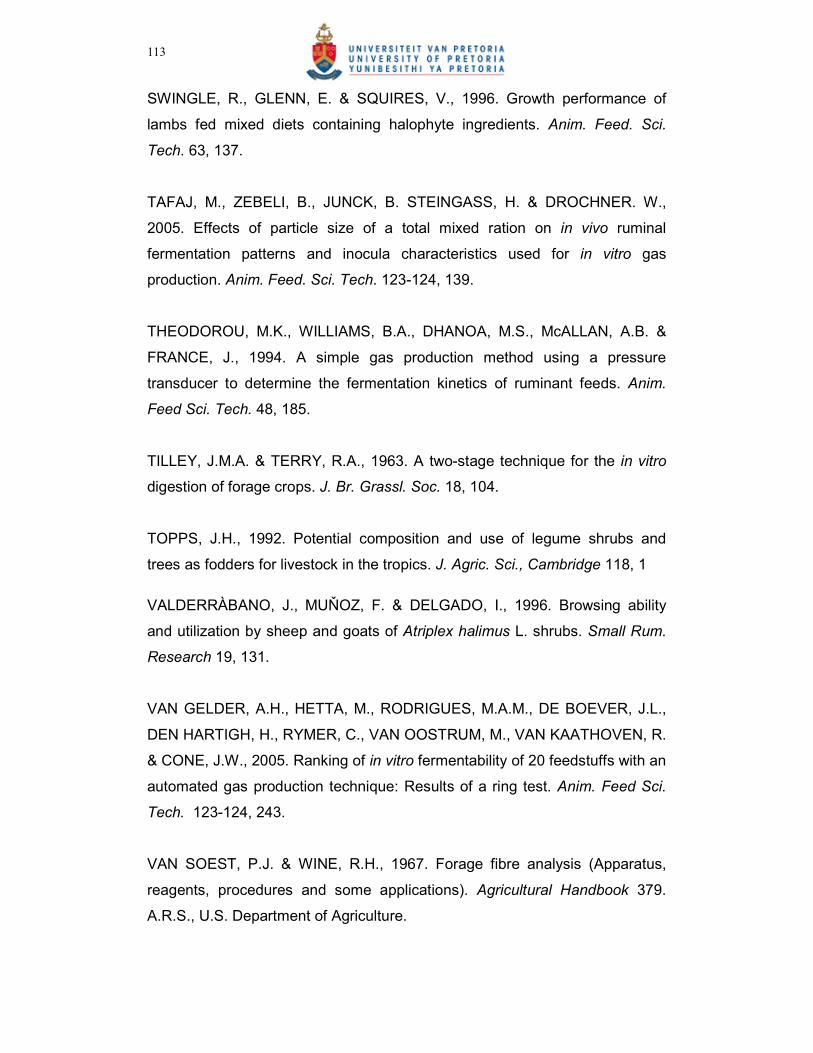
113
SWINGLE, R., GLENN, E. & SQUIRES, V., 1996. Growth performance of
lambs fed mixed diets containing halophyte ingredients. Anim. Feed. Sci.
Tech. 63, 137.
TAFAJ, M., ZEBELI, B., JUNCK, B. STEINGASS, H. & DROCHNER. W.,
2005. Effects of particle size of a total mixed ration on in vivo ruminal
fermentation patterns and inocula characteristics used for in vitro gas
production. Anim. Feed. Sci. Tech. 123-124, 139.
THEODOROU, M.K., WILLIAMS, B.A., DHANOA, M.S., McALLAN, A.B. &
FRANCE, J., 1994. A simple gas production method using a pressure
transducer to determine the fermentation kinetics of ruminant feeds. Anim.
Feed Sci. Tech. 48, 185.
TILLEY, J.M.A. & TERRY, R.A., 1963. A two-stage technique for the in vitro
digestion of forage crops. J. Br. Grassl. Soc. 18, 104.
TOPPS, J.H., 1992. Potential composition and use of legume shrubs and
trees as fodders for livestock in the tropics. J. Agric. Sci., Cambridge 118, 1
VALDERRÀBANO, J., MUŇOZ, F. & DELGADO, I., 1996. Browsing ability
and utilization by sheep and goats of Atriplex halimus L. shrubs. Small Rum.
Research 19, 131.
VAN GELDER, A.H., HETTA, M., RODRIGUES, M.A.M., DE BOEVER, J.L.,
DEN HARTIGH, H., RYMER, C., VAN OOSTRUM, M., VAN KAATHOVEN, R.
& CONE, J.W., 2005. Ranking of in vitro fermentability of 20 feedstuffs with an
automated gas production technique: Results of a ring test. Anim. Feed Sci.
Tech. 123-124, 243.
VAN SOEST, P.J. & WINE, R.H., 1967. Forage fibre analysis (Apparatus,
reagents, procedures and some applications). Agricultural Handbook 379.
A.R.S., U.S. Department of Agriculture.
114
VAN SOEST, P.J., 1982. Nutritional ecology of the ruminant. O and B Books,
OR, USA.
WARREN, B.E. & CASSON, T., 1993. A preliminary examination of the
nutritive value for four saltbush (Atriplex) species. Proc. Aust. Soc. Anim.
Prod. 18, 424.
WILLIAMS, B.A., 2000. Cumulative gas production techniques for forage
evaluation. In: Forage Evaluation in Ruminant Nutrition. CAB International,
Wallingford. Eds: Givens, D.I., Owen, E., Omed, H.M., Axford, R.F.E., 189.
WILSON, A.D., 1996. The intake and excretion of sodium by sheep fed on
species of Atriplex (saltbush) and Kochia (bluebush). Aust. J. Agric. Res. 17,
155.
ZACHARIAS, P.J.K., 1986. The use of the cellulase digestion procedure for
indexing the dry matter digestibility of forages. J. Grassl. Soc. South. Afr. 3,4,
117.
115
APPENDIX
The gas production system at the Agricultural Research Centre – Animal
Improvement Institute, Irene.
The pressure sensors at the Agricultural Research Centre – Animal
Improvement Institute, Irene.

116
The centrifuge at the Agricultural Research Centre – Animal Improvement
Institute, Irene.
Collection of rumen fluid of sheep at the Agricultural Research Centre –
Animal Improvement Institute, Irene.
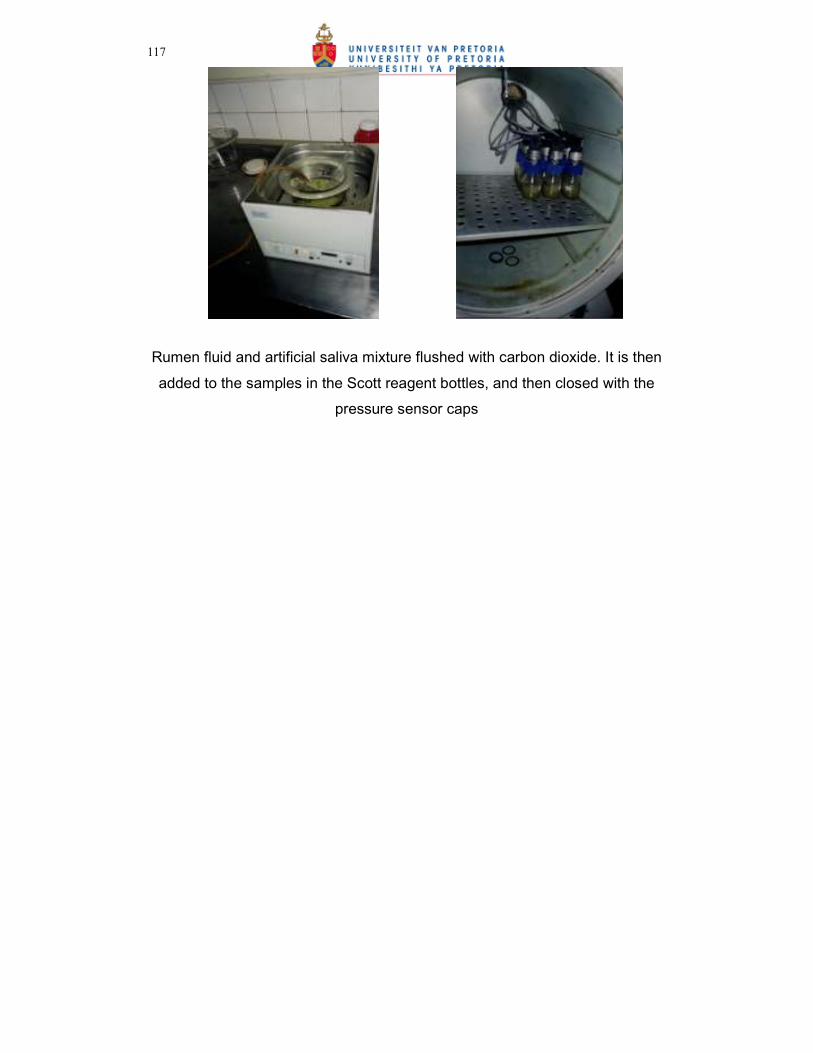
117
Rumen fluid and artificial saliva mixture flushed with carbon dioxide. It is then
added to the samples in the Scott reagent bottles, and then closed with the
pressure sensor caps