
The Determinants of Recovery Rates in the US Corporate...
41
The Determinants of Recovery Rates in the US Corporate Bond Market Rainer Jankowitsch * Florian Nagler † Marti G. Subrahmanyam ‡ First Version: April 26, 2012 This Version: September 3, 2012 Abstract We analyze the recovery rates of defaulted bonds in the US corporate bond market over the time pe- riod 2002 to 2010. Our data set is obtained from the Trade Reporting and Compliance Engine (TRACE ) database maintained by the Financial Regulatory Authority (FINRA) and provides us with a complete set of traded prices and volumes around the default events. The analysis of the microstructure of trading activity allows us to estimate reliable market-based recovery rates. We investigate the relation between these recovery rates and a comprehensive set of bond characteristics, firm fundamentals and macroeco- nomic variables. In addition, we explore the effect of the liquidity of the individual bonds on their traded prices after default. Our panel regression analysis explains 64% of the total variance in the recovery rates across bonds. We find that the type of default event, the seniority of the bond, and the industry in which the firm operates, are important determinants of the recovery rate. However, balance sheet ratios moti- vated by structural credit risk models, macroeconomic variables, and transaction costs metrics measuring liquidity, are of equal importance. JEL-Classification: G12, G33 Keywords: recovery rate, corporate bonds, liquidity * WU (Vienna University of Economics and Business), Department of Finance, Accounting and Statistics, Heili- genst¨adter Straße 46-48, 1190 Vienna, Austria; email: [email protected] † VGSF (Vienna Graduate School of Finance), Heiligenst¨adter Straße 46-48, 1190 Vienna, Austria; email: flo- [email protected] ‡ New York University, Stern School of Business, Department of Finance, 44 West Fourth, Room 9-68, New York, NY 10012; email: [email protected] We thank Edward Altman and the Salomon Center of New York University for providing us access to the Master Default Database.
Transcript of The Determinants of Recovery Rates in the US Corporate...

The Determinants of Recovery Rates in the USCorporate Bond Market
Rainer Jankowitsch∗ Florian Nagler†
Marti G. Subrahmanyam‡
First Version: April 26, 2012This Version: September 3, 2012
Abstract
We analyze the recovery rates of defaulted bonds in the US corporate bond market over the time pe-riod 2002 to 2010. Our data set is obtained from the Trade Reporting and Compliance Engine (TRACE)database maintained by the Financial Regulatory Authority (FINRA) and provides us with a completeset of traded prices and volumes around the default events. The analysis of the microstructure of tradingactivity allows us to estimate reliable market-based recovery rates. We investigate the relation betweenthese recovery rates and a comprehensive set of bond characteristics, firm fundamentals and macroeco-nomic variables. In addition, we explore the effect of the liquidity of the individual bonds on their tradedprices after default. Our panel regression analysis explains 64% of the total variance in the recovery ratesacross bonds. We find that the type of default event, the seniority of the bond, and the industry in whichthe firm operates, are important determinants of the recovery rate. However, balance sheet ratios moti-vated by structural credit risk models, macroeconomic variables, and transaction costs metrics measuringliquidity, are of equal importance.
JEL-Classification: G12, G33Keywords: recovery rate, corporate bonds, liquidity
∗WU (Vienna University of Economics and Business), Department of Finance, Accounting and Statistics, Heili-genstadter Straße 46-48, 1190 Vienna, Austria; email: [email protected]†VGSF (Vienna Graduate School of Finance), Heiligenstadter Straße 46-48, 1190 Vienna, Austria; email: flo-
[email protected]‡New York University, Stern School of Business, Department of Finance, 44 West Fourth, Room 9-68, New York,
NY 10012; email: [email protected] thank Edward Altman and the Salomon Center of New York University for providing us access to the
Master Default Database.
1 Introduction
The global financial crisis has highlighted the importance of credit risk in the pricing of financial
contracts, and emphasized the multifaceted nature of its key determinants: the probability of
default and the recovery rate in the event of default. Traditionally, credit risk modelling has
been focused on the probability of default, while setting the recovery rate to parametric values
that do not necessarily recognize its potential cross-sectional and time-series variation. However,
the magnitude and variability of defaults during the crisis have emphasized the importance of
obtaining more precise estimates of recovery rates, and explaining their variation across issues
and issuers. It is now intuitively understood that recovery rates are potentially driven by many
different factors: endogenous variables (such as specific characteristics of the assets involved and
the characteristics of the firm and industry), or exogenous factors (such as overall macroeconomic
conditions or market liquidity). It is important, therefore, to understand the determinants of this
risk factor and to analyze their interaction effects with other dimensions of default risk.
This paper aims at investigating these relationships at the issue and issuer level for the US
corporate bond market. The Trade Reporting and Compliance Engine (TRACE ) database, main-
tained by the Financial Regulatory Authority (FINRA), allows us to analyze, for the first time,
the prices of defaulted bonds, based on a complete set of transaction data, over the time period
2002 to 2010, covering most of the period before and after the onset of the global financial crisis.
Specifically, we investigate the relation between the recovery rates and a comprehensive set of
bond characteristics, firm fundamentals and macroeconomic variables based on panel data regres-
sions. In addition, we explore the influence of market liquidity on recovery rates, an innovation in
relation to the existing literature, which is largely silent on this issue.
Most credit risk instruments, such as bonds and credit default swaps (CDS), trade over-the-
counter (OTC). This makes research in this area challenging, as traded prices and volumes for
these instruments cannot be directly observed from a central database. Therefore, most studies
have to rely, of necessity, on quotation or trade data from a particular dealer, leaving open the
question of whether the data are representative of the market as a whole. This is even more
of a problem for defaulted financial instruments, as their trading can often be infrequent, with
stale prices, with some quotations or trades of individual dealers even “off market“. However, the
market for US corporate bonds is an ideal laboratory for this study as detailed data on prices and
1

volumes are available since 2002 from the TRACE database, covering all trades following default
events as well. The data not only permit a reliable estimate of a market-based recovery rate,
but also provide an opportunity to study trading activity, and thus liquidity, at different stages
following default.
We combine the TRACE data set with the Mergent Fixed Income Securities Database and the
NYU Salomon Center Master Default Database, which allows us to study a broad set of default
events capturing formal bankruptcy filings, distressed exchanges and downgrades to default status
by rating agencies. Furthermore, we add firm-specific information from the Compustat Database
and macroeconomic indicators from multiple sources. Overall, we cover more than 2, 000 default
events for about 800 bonds, and approximately 1, 700, 000 trades in the relevant time period around
default.
We make three contributions in this paper. First, we provide a detailed analysis of the mi-
crostructure of trading in defaulted bonds offering some interesting new insights. This allows us
to derive reliable market-based estimates of recovery rates. Second, we analyze these recovery
rates employing a broad set of explanatory variables in our regressions, in contrast to much of
the literature, where the analysis has typically been more narrowly focused. Third, we include
liquidity measures in our analysis of recovery rates, which turn out to be of particular importance
when dealing with defaulted bonds, which are potentially illiquid.
Our analysis of recovery rates yields several distinct sets of findings. We examine the trading
activity of the defaulted bonds, as defined by traded prices and volumes, 90 days before, at, and 90
days after the observed default event date. We find that although the price level is already rather
low before the default event, the traded price falls significantly to its lowest level on the default
day itself, around 35% of face value, on average. The price recovers, in the first 30 days following
default, to about 42% of face value and shows a more volatile evolution thereafter.1 Furthermore,
we find that the trading volume of a defaulted bond is relatively high on the default event day.
This high trading activity dies down quickly within the first 30 days after default to pre-default
levels. Based on these findings, we define the recovery rate of a defaulted bond as the average
traded price per unit of face value, between the default day and the next 30 days after default,
and thus, providing a market-based specification.
We analyze these recovery rates across bonds along various dimensions. Comparing different
1Note that a 40% recovery rate, which was the point estimate provided by Altman and Kishore (1996) in anearly paper in this area, has been widely used in calibrations in academia and industry.
2

default event types, we find that distressed exchanges have the highest recovery rates, whereas
Chapter 11 filings result in significantly lower recoveries. This finding provides further evidence
that out-of-court restructurings lead to higher recovery compared to formal bankrupcty proce-
dures. Furthermore, we find significant differences in the performance of the default grades of the
major rating agencies; in particular, the rating frameworks of Moody’s and Fitch seem to incor-
porate recovery rate information to a greater extent.2 Analyzing the differences in the recovery
rates of corporate bonds across industries, we find that among non-financial industries, utility
and energy related firms recover the most in default, while retailers recover the least. Interest-
ingly, among financial firms, the banking and credit & financing industries recover the most in
default, whereas the financial services industry recovers the least. Analyzing the seniority levels of
different defaulted bonds, we find, as expected, that secured bonds recover more than unsecured
and subordinated bonds. Furthermore, we document a substantial variation in recovery rates over
time, e.g., we find quarterly moving averages between 20% and 80% of face value, for the time
period 2002 to 2010.
In the main part of our analysis, we employ panel regressions to explain the variation in recovery
rates using a comprehensive set of bond characteristics, balance sheet ratios, macroeconomic
variables and liquidity measures (in addition to dummy variables, based on the default event type,
industry and seniority). Overall, the regression analysis explains 64% of the total variation in the
recovery rates, with all four groups of variables contributing to the explanatory power of recovery
rates. Among balance sheet ratios, we find significant effects for ratios motivated by structural
credit risk models, i.e., the higher the equity ratio, and the lower the default barrier, the higher the
recovery rate. Furthermore, we document the direct effect of the total assets of the firm, i.e., larger
firms have higher recoveries. Analyzing macroeconomic variables, we find a particularly strong
effect for the market-wide default rate. Thus, we find clear evidence that a high default rate in
the market as a whole, a systematic risk factor, is linked to significantly lower recovery rates of
individual bonds, following default. Along the same lines, we find a positive relation between short
term interest rates, an indicator of the business cycle, and recovery rates. In addition, we analyze
the effect of liquidity, which is an important innovation in this paper, and find a clear link between
the defined liquidity measures of bonds and their recovery rates. In particular, when measuring
2It is often claimed that the rating frameworks of Moody’s and Fitch focus on the expected loss, which involvesboth the probability of default and the recovery rate given default. In contrast, Standard and Poor’s ostensiblyconsiders only the probability of default in its ratings.
3

the transaction costs of trading using the price dispersion measure, we find that illiquid bonds with
high transaction costs recover less, following default. Additional evidence of the liquidity effects is
provided by the trading activity variables. Further, we find that bonds that can be delivered into
a CDS contract have a significantly higher recovery rate, possibly because of buy-side pressure
from protection buyers, who are required to physically deliver the underlying bond.
Overall, we provide a comprehensive analysis going beyond the results that have been presented
in the prior literature. We offer detailed insights into the stochastic nature and drivers of recovery
rates by analyzing a broad set of explanatory variables rather than providing evidence only on
the effects of any one factor. Our results on the effects of liquidity are particularly noteworthy,
since our paper is the first one, to our knowledge, to report findings on the effects of liquidity on
recovery rates.
The paper is organized as follows: Section 2 reviews the literature. Section 3 provides details
of the data used in our analysis. Section 4 states the main hypotheses that are being tested and
the research questions that are being addressed. Section 5 presents the methodology and explains
the setup of the subsequent analysis. Section 6 provides the descriptive analysis and the results
of the panel data regressions. Section 7 concludes.
2 Literature Review
The literature on recovery rates can be divided into two categories: theoretical papers dealing
with credit risk models, which make implicit or explicit assumptions about recoveries in default,
and empirical papers analyzing past default events. Traditionally, credit risk models have been
divided into structural and reduced-form models (see e.g., Altman et al. (2002) for a detailed
discussion). In the basic structural models, starting with Black and Scholes (1973) and Merton
(1974), the default risk of a firm is driven by the process generating the value of its assets; hence,
the risk of the firms’s default is explicitly linked to the volatility of its asset value. Default occurs
when the value of a firm’s assets is lower than that of its liabilities at maturity. In this case,
the debt holders receive the residual market value of the firm’s assets. Hence, in this setup, the
recovery rate, as the residual value of the defaulted company’s assets, is an endogenous variable
that is inversely related to the probability of default. This relation becomes even more evident
when structural models are used as the basis for credit portfolio analysis (see, e.g., Frye (2000) or
4

Gordy (2003)), where asset values are modelled by market-wide factors and idiosyncratic factors,
in which market factors lead to a negative relation between aggregate default and recovery rates.
Several authors provide extensions to the basic Merton (1974) model.3 They generally assume
that default may occur at any time between the issuance and maturity of the debt, that default is
triggered when the value of the firm’s assets reaches a lower threshold barrier, or that bankruptcy
costs arise exogenously. Interestingly, in most of these models the recovery rate is assumed to be
exogenous and independent of the firm’s asset value. It is generally defined as a fixed proportion of
the outstanding debt value, in terms of either face or market value, and is, therefore, independent
of the probability of default.
Reduced-form models of credit risk do not condition default on the structural features of the
firm (see, for example, Jarrow and Turnbull (1995), Duffie and Singleton (1997), Lando (1998), and
Madan and Unal (1998)). Rather, these models allow separate, explicit assumptions regarding the
dynamics of both the probability of default and the recovery rate. Although a complex dependence
structure can be used in such models, in principle, the recovery rate is usually assumed to be
exogenous, either deterministic or stochastic, and often independent of the probability of default.
It has been well documented that neither reduced-form models (see, e.g., Longstaff et al. (2005))
nor structural models (see, e.g., Huang and Huang (2002)) can fully explain observed yield spreads
satisfactorily. It is relevant, therefore, to understand the stochastic nature of recovery rates and
provide evidence from past defaults. During the last two decades, direct attempts have been
undertaken to empirically investigate the behavior of recovery rates. An important first analysis
is provided by Altman and Kishore (1996), who use a data set of over 700 defaulted bond issues
from 1978 to 1995 and analyze the effect of industry affiliation on recovery rates, and conclude
that the highest average recoveries come from public utilities (70%) and chemical, petroleum, and
related products (63%), and that the original rating of a bond has virtually no effect on recovery,
once seniority is accounted for. Hanson and Schuermann (2004) provide similar evidence for the
impact of seniority and industry affiliation, when analyzing a sample of around 2,000 defaults
of bonds and loans. Furthermore, they discuss the empirical distribution of recovery rates and
provide evidence that recoveries are lower in recessions. Along the same lines, Altman et al. (2005)
analyze the relationship at a macroeconomic level and conclude that the average annual recovery
3Leland (1994), Longstaff and Schwartz (1995), Leland and Toft (1996), Anderson and Sundaresan (1996),Collin-Dufresne et al. (2001), Goldstein et al. (2001), Mella-Barral and Perraudin (1997), Black and Cox (1976)and Acharya et al. (2006) are examples of such analyses.
5
rates and default rates are indeed negatively correlated. They show that realized default rates in
a particular year are important drivers of recoveries, whereas other macroeconomic variables, i.e.,
the performance of the economy measured by GDP or the GDP growth rate, are less predictive
than most theoretical papers would suggest.
Acharya et al. (2007) provide a detailed analysis of industry-wide distress and its relation to
recovery rates. They argue that when an industry is in distress, defaulting firms in the industry
experience lower recoveries. One mechanism causing this effect is the lower ability of the distressed
firm to sell assets to competitors in the same industry, as discussed in Shleifer and Vishny (1992).
Using a data set from 1982 to 1999, with about 800 observations, they provide evidence that the
defaulted debt of industries in distress recover 10% to 15% less on average. They also document
a negative effect of aggregate default rates on the recovery rate of individual issues. Furthermore,
they provide evidence that balance sheet ratios, motivated by structural models, are of importance.
Altman and Kalotay (2010) provide further evidence for industry-driven effects, focusing on the
modelling of the distribution of recovery rates, based on ultimate recoveries for defaulted loans
and bonds.4
Additionally, Bris et al. (2006) and Davydenko and Franks (2008) provide evidence that differ-
ences in creditors’ rights and reorganization practices are reflected in the level of recovery rates.
Thus, the particular default event type is of importance. They provide evidence comparing de-
faults across different bankrupcty procedures, e.g., Chapter 7 versus Chapter 11 filings, as well
as across different countries or jurisdictions. Altman and Karlin (2009) provide further evidence
of the importance of the default event by discussing distressed exchanges. They find that in
distressed exchanges, recoveries are higher, compared with other default events.
Our paper extends the existing literature in new directions and provides detailed empirical
evidence analyzing the driving factors of recovery rates. In contrast to prior studies, we employ
market-based estimates of the recovery rates, based on a detailed analysis of the trading mi-
crostructure. Furthermore, we make use of a set of explanatory variables, which have not been
analyzed in the existing literature comprehensively, but rather on a stand-alone basis, and we
include liquidity measures in the analysis, which is an additional contribution.
4See Altman et al. (2010) for a further discussion of the differences between the recovery rates of loans andbonds.
6
3 Data
This paper relies on several data sources that we combine to analyze recovery rates in the
US corporate bond market. First, we identify the default events by type, using the Mergent
Fixed Income Securities Database and NYU Salomon Center Master Default Database. These
databases provide all Chapter 11 filings, distressed exchanges and downgrades to a default rating
grade.5 These events cover basically the whole spectrum of defaults, i.e., formal bankruptcy
filings to informal unlikely-to-pay events. Overall, we observe 1, 270 default events for 534 firms
for the time period July 2002 to October 2010. Table 1 presents the list of event types and their
definitions. Chapter 11 filings represent formal bankruptcy procedures handled by federal courts,
i.e., when a firm is unable to service its debt or repay its creditors, it or its creditors can file
with a federal bankruptcy court for protection under Chapter 11. A trustee can act as debtor
in possession, and thus, operate the business. Chapter 11 filings can be used to restructure the
debt or liquidate the assets. The second type of default event are distressed exchanges, in which
the debtor attempts to avoid formal bankruptcy by proposing a fundamental change in existing
contractual commitments to its creditors. Thus, the creditors can voluntarily agree to avoid
potential costs arising in a formal restructuring. Distressed exchanges became popular in recent
years, particularly since the financial crisis. Altman and Karlin (2009) report that, between 2002
and 2009, around 41 companies engaged in distressed exchange offers, which affected 299 bonds.
The third type of default event consists of ratings downgrades. We retrieve ratings from Moody’s,
Standard and Poor’s and Fitch. Ratings rank the obligor according to creditworthiness (AAA, AA,
. . . , C, D), where the rating agencies provide different default-classes. The worst rating grade (e.g.,
D) indicates an actual default (payment default on a financial commitment). The second worst
rating grade (e.g., C) is meant for highly speculative obligations that are considered as unlikely-
to-pay. This stage is often considered as being already a default event in many regulations (see,
for example, the definitions of default in the Basel II standards).
The second important data set we use is obtained from the TRACE database maintained by
the FINRA, which provides transaction information such as prices and volumes for the whole
universe of US corporate bonds.6 In the US corporate bond market, reporting of any transaction
5We exclude Chapter 7 and 15 filings, as we find almost no events where bonds are traded, after these events.Consequently, for these events, the recovery rate estimates can only be based on ultimate recovery, as in e.g. Briset al. (2006).
6The reported trade volume is capped at $1 million for high yield and unrated bonds, and at $5 million forinvestment grade bonds. However, the exact trade volume is released by FINRA after an 18 month delay.
7

to TRACE is obligatory for broker-dealers, and follows a set of rules approved by the Securities
and Exchange Commission (SEC ), whereby all transactions must be reported within a time-frame
of 15 minutes. This data source is rather unique for an OTC market since, in almost all other
cases, price information must usually be obtained either from an individual dealer’s trading book,
which provides a very limited view of the market, or by using bid-ask quotations. We implement
standard filters to exclude potential errors in TRACE.7
We match the default events with the individual bonds affected by the respective event, within
the time window starting 90 days before default, and ending 90 days after the default event.
However, some minimum requirements must be fulfilled for a bond to be included in our analysis.
We do not include bonds with an amount issued smaller than $10 million. We exclude from our
sample bonds with complex structures, mostly related to embedded derivative features, since the
prices of bonds with such payoff structures are quite different, and could potentially bias the
analysis. In particular, therefore, we drop bonds that are rating-sensitive, convertible, sinkable,
extendible, structured, or posses any other kind of complex optionality. Thus, the bonds included
for our analysis are either straight bonds, or simply puttable or callable. Matching the TRACE
data-set with the default events results in 2, 235 event/bond combinations, covering 818 bonds
issued by 259 firms, and account for approximately 1, 734, 000 trades, with an aggregate volume
of $500 billion.
We add bond and firm characteristics from Bloomberg, covering the amount issued, maturity,
coupon, industry and seniority level, where we group the bonds into four main categories of
seniority: guaranteed, secured, unsecured and subordinated. Furthermore, we match the data-set
with data from Markit.8 This allows us to identify bonds that can be delivered to settle credit
default swaps (CDS). In addition, we match the data-set with balance sheet and income statement
information obtained from Compustat. This permits us to analyze the effect of balance sheet ratios,
motivated by various models for recovery rates. We retrieve macroeconomic data covering interest
rates (US Federal Funds rate and Treasury yields) from Bloomberg, to assess the impact of overall
economic conditions on the level of recovery rates. The final combined data-set allows to assess
the impact of several groups of variables on the level of recovery rates in a comprehensive manner.
7Dick-Nielsen (2009) provides an extensive description of possible reporting errors, and its implications forliquidity analysis. Such errors include (i) trade corrections within the same day, (ii) trade cancelations within thesame day, and (iii) reversals across days, i.e., a mistake that had not been detected on the traded day. Furthermore,we implement price filters eliminating potentially erroneous reported prices.
8Markit provides consensus valuations of credit default swaps (CDS) across different maturities and restructuringclauses.
8
4 Research Questions and Hypotheses
In this section, we discuss the research questions we address and the hypotheses that we test in
this paper. In particular, we consider the underlying trading activity of defaulted bonds and focus
on the potential effects of bond characteristics, firm fundamentals, macroeconomic indicators, and
liquidity measures on the level of recovery rates.
The microstructure of the trading activity of defaulted bonds allows us to analyze interesting
research questions relating to how bond prices, trading volumes and number of trades evolve in
different stages of default, and how a reliable market-based recovery rate can be estimated. We
examine the trading activity of the defaulted bonds 90 days before, at, and 90 days after the
observed default event date. In particular, we search for a “grace period” after the default event,
during which prices are mainly driven by the effects of the default event itself, and test whether
the trading activity levels are significantly different before and after this window. Furthermore, we
analyze the trading microstructure of various sub-samples based on industry, rating and default
event type and compare the trading activity of the defaulted bonds with previous studies of non-
defaulted bonds. It turns out that a grace period of 30 days is optimal in the definition of recovery
rates, i.e., we use the average traded price of a bond between the default day and the next 30 days
after default to compute its recovery rate (see Section 6).
In the main part of our analysis, we explore the time-series and cross-sectional variations of
the recovery rates along various dimensions. First, we focus on three aspects that were found to
be of importance in the previous literature: default event type, industry and seniority. Starting
with the default event type, we cover the full range of default events from formal bankruptcy
to informal unlikely-to-pay events. We test the hypothesis that formal procedures are a sign
of more severe economic problems within a firm, and lead to higher costs to bondholders than
informal procedures. Therefore, we anticipate that Chapter 11 filings have lower recoveries than
distressed exchanges and rating defaults. Furthermore, we expect that default ratings have lower
recoveries than unlikely-to-pay ratings. As for industry affiliation, we would expect that within
non-financial industries, utility and energy firms should recover more than other industries as
reported by various studies (see Section 2), due to their higher proportions of tangible assets.
Similarly, among financial firms, commercial banks should recover more than investment banks,
possibly because of their larger holdings of liquid assets. As for the seniority of the bonds, we
9
hypothesize that the greater the seniority and collateral value of their assets, the higher the
recovery rate.
Going beyond these simple dimensions, we analyze the effects of bond characteristics, firm
characteristics, macroeconomic variables and liquidity variables on recovery rates. The potential
effects of bond characteristics, such as amount issued, maturity, coupon, rating grade one year
before default and CDS availability, on recovery rates address interesting research questions. In
particular, we conjecture that larger bond issues recover more, since they offer greater liquidity,
and bonds with longer maturities recover less, since bonds with a maturity of over ten years are
often held by buy-and-hold investors, such as insurance companies, and are either illiquid or are
sold in large blocks upon default. We expect the coupon rate to be positively related to the
recovery rate, since a higher coupon is of value to the bondholders for certain outcomes of the
default event. Regarding the rating grade one year before default, we hypothesize that the lower
the rating grade, the lower would be the recovery rate. Furthermore, we expect a higher recovery
rate if the bond is deliverable into a CDS contract, as it may generate greater demand upon
default, from protection buyers, compared to non-insurable bonds.
The characteristics of the firm are likely to determine the level of recovery rates. We hypothesize
that the value of equity and the default barrier affect recoveries as suggested by structural models
of credit risk: the lower the equity and the higher the default barrier, the lower the recovery of
debtholders, given a certain drop in the firm’s asset value, triggering default. Furthermore, we test
whether the earnings, tangible assets, receiveables, or firm size, before the default event, matter.
Macroeconomic variables, such as aggregate default rates and information based on interest
rate curves, are generally expected to have a significant impact on the level of recovery rates, since
both are indicators of the overall economic conditions. In particular, we expect that a high level of
the (aggregate) default rate in the overall economy signals that the economic conditions are poor
and, thus, could lead to lower recovery rates for individual firms. Similarly, when the (short-term)
interest rates are low, the economy is at the lower end of the business cycle with lower recovery
rates. We also investigate the impact of the slope of the interest rate term structure on recoveries.
Furthermore, our detailed data-set allows us, for the first time, to estimate liquidity measures,
such as trading activity variables (volume and number of trades) and transaction costs measures
(Amihud measure and price dispersion measure) for defaulted bonds. We test the hypothesis that
less liquid bonds have lower recovery rates. We expect that the liquidity effects on prices that have
10

been extensively documented in the literature on non-defaulted bonds (see, e.g., Bao et al. (2011),
Dick-Nielsen et al. (2012) and Friewald et al. (2012)) would be exacerbated following default.
5 Methodology
This section outlines the general approach to measuring the determinants of recovery rates
in the US corporate bond market. We present here our definitions of the recovery rate and the
various types of bond characteristics, firm fundamentals, macroeconomic variables and liquidity
measures, which are used to explain the level of bond recoveries (see Section 4). We also present
the panel data regression setup that we use in our analysis.
5.1 Recovery Rate
The recovery rate π of a bond i issued by firm j is defined in our analysis as the mean of the
transaction prices p, per 100 of face value, between the default day t and the subsequent T = 30
days after default. If Ki,j,s is the number of trades of bond i of firm j on day s indexed by ki,j,s,
then
πi,j,t =1
T + 1
t+T∑s=t
1
Ki,j,s
∑ki,j,s
ps,ki,j,s
(1)
Thus, this specification of the recovery rate suggests that the level of πi,j,t can be interpreted
as what a buyer (seller) would have to pay (receive), on average, and hence, in expectation,
given that a default event occurred, and given that the transaction takes place within the time
window between the default day and the next 30 days after default. It should be noted that the
accrued interest is set to zero, as most defaulted bonds are traded flat, i.e., without exchange of
accrued interest; thus, all prices under investigation are “clean“ rather than “dirty“ prices. The
specification presented above represents a market-based definition of the recovery rate, in which
a certain grace period is considered. We will further elaborate on our definition based on the
analysis of the transaction data in Section 6.
11

5.2 Bond Characteristics
We use a set of bond characteristics to explain differences in the recovery rates of corporate
bonds. The most basic information available about a bond consists of its amount issued, maturity
and coupon. In addition, we consider the seniority level, which is, of course, very important when
analyzing recovery rates. Specifically, in this paper, we use four different levels of seniority: (i)
guaranteed, (ii) secured, (iii) unsecured and (iv) subordinated.9
Bond ratings from Fitch, Standard and Poor’s and Moody’s, one year before the default events
are retrieved and are mapped to natural numbers, e.g., AAA = 1, AA+ = 2, . . . , D = 21. With
this data, we can analyze whether the rating grade before the default event is of importance in
the determination of the recovery rate, i.e., we can compare “expected“ vs. “unexpected“ credit
events. Additionally, we collect the information about whether the bond is deliverable into a CDS
contract and, hence, is insurable in the CDS market. We consider this a bond-specific event,
since only a selected list of bonds of a particular firm can be delivered into its CDS contract. For
example, if only CDS for unsecured debt are traded for a firm, subordinated bonds cannot be
insured.
5.3 Firm Fundamentals
We employ certain firm characteristics in our analysis. First, we use the industry in which the
firm operates as an important characteristic. Second, we use balance sheet and income statement
information as explanatory variables, which is available for the fiscal year prior to the default
event. We use the following six accounting ratios, which are directly motivated by structural
credit risk models (see Section 2):
Equity =Market Value of Equity
Total Assets(2)
Default Barrier =Short Term Debt + 1
2Long Term Debt
Total Assets(3)
LTD Issuance =Long Term Debt
Total Debt(4)
Profitability =EBITDA
Total Sales(5)
9Note that, for some bonds, the financial data venders provide finer classifications of seniority. However, thesefour classes are important and relevant for all bonds, with data being generally available for almost all bonds.
12
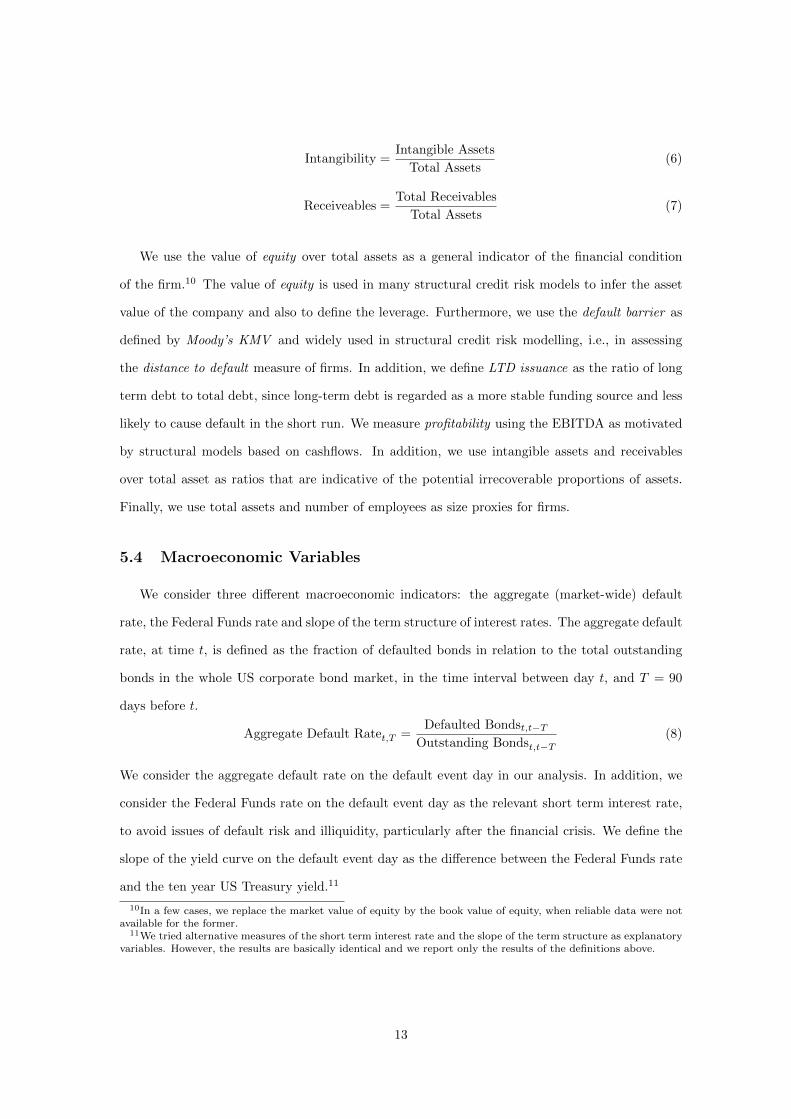
Intangibility =Intangible Assets
Total Assets(6)
Receiveables =Total Receivables
Total Assets(7)
We use the value of equity over total assets as a general indicator of the financial condition
of the firm.10 The value of equity is used in many structural credit risk models to infer the asset
value of the company and also to define the leverage. Furthermore, we use the default barrier as
defined by Moody’s KMV and widely used in structural credit risk modelling, i.e., in assessing
the distance to default measure of firms. In addition, we define LTD issuance as the ratio of long
term debt to total debt, since long-term debt is regarded as a more stable funding source and less
likely to cause default in the short run. We measure profitability using the EBITDA as motivated
by structural models based on cashflows. In addition, we use intangible assets and receivables
over total asset as ratios that are indicative of the potential irrecoverable proportions of assets.
Finally, we use total assets and number of employees as size proxies for firms.
5.4 Macroeconomic Variables
We consider three different macroeconomic indicators: the aggregate (market-wide) default
rate, the Federal Funds rate and slope of the term structure of interest rates. The aggregate default
rate, at time t, is defined as the fraction of defaulted bonds in relation to the total outstanding
bonds in the whole US corporate bond market, in the time interval between day t, and T = 90
days before t.
Aggregate Default Ratet,T =Defaulted Bondst,t−T
Outstanding Bondst,t−T
(8)
We consider the aggregate default rate on the default event day in our analysis. In addition, we
consider the Federal Funds rate on the default event day as the relevant short term interest rate,
to avoid issues of default risk and illiquidity, particularly after the financial crisis. We define the
slope of the yield curve on the default event day as the difference between the Federal Funds rate
and the ten year US Treasury yield.11
10In a few cases, we replace the market value of equity by the book value of equity, when reliable data were notavailable for the former.
11We tried alternative measures of the short term interest rate and the slope of the term structure as explanatoryvariables. However, the results are basically identical and we report only the results of the definitions above.
13

5.5 Liquidity Measures
As we have all the necessary transaction data available, we can define various liquidity proxies
that we use as additional explanatory variables. We employ simple trading activity variables, e.g.,
volume and the number of trades, and more sophisticated liquidity measures, e.g., the Amihud
and price dispersion measures, that have been used in literature (see e.g. Dick-Nielsen et al. (2012)
and Friewald et al. (2012)). We use the time window between the default day t and T = 30 days
after this day for the estimation of the measures.
Volume. The volume variable, vi,j,s, is the average transaction volume, per trade, of bond i, of
firm j, within the default day t, and T = 30 days after this day:
vi,j,t =1
T + 1
t+T∑s=t
1
Ki,j,s
∑ki,j,s
vs,ki,j,s
(9)
Number of trades. This variable, ni,j,t, is the average number of trades of bond i, of firm j,
between the default day t, and T = 30 days after this day:
ni,j,t =1
T + 1
t+T∑s=t
Ki,j,s (10)
Amihud measure. The Amihud measure (Amihud (2002)) of bond i, of firm j, on day s, given
Ni,j,s observed daily returns r indexed by ki,j,s is defined as:
Amihudi,j,s =1
Ni,j,s
∑ki,j,s
|rki,j,s|
vki,j,s
(11)
This measure, based on Kyle (1985), originally designed for limit order markets, assesses the
price impact of the traded volume, and hence the depth of the market. Intuitively, a market is
considered illiquid, if a low transaction volume causes relatively large price changes.
14

Price Dispersion. Similar to Jankowitsch et al. (2011) and Friewald et al. (2012), we define the
price dispersion, di,j,s, of bond i, of firm j, on day s, as:
di,j,s =
√√√√ 1∑ki,j,s
vki,j,s
·∑ki,j,s
(pki,j,s
mi,j,s− 1
)2
· vki,j,s(12)
where mi,j,s is the mean transaction price representing the fair value of the bond, and pi,j,s are
the individual trade prices. The (volume-weighted) volatility of the individual trades around the
fair value permits a direct estimation of transaction costs based on transaction data. The intuition
behind this measure is motivated by market microstructure models: a low dispersion of traded
prices around its market wide valuation indicates that the bond can be bought or sold close to its
fair value and, thus, at lower transaction costs, indicative of a more liquid instrument.
5.6 Panel Data Regression
We rely on a panel data regression approach to analyze the determinants of recovery rates
in the US corporate bond market. As motivated by the discussion in the previous section, the
recovery rate π of bond i, issued by firm j, for default at day t, is assumed to be given by:
πi,j,t = α+ β · (Bond Characteristics)i,j + γ · (Firm Fundamentals)j,t (13)
+ φ · (Macroeconomic Indicators)t + δ · (Liquidity)i,t
+ λ · (Default Event Type)i,j,t + µ · (Industry)j
+ ζ · (Seniority)i,j + εi,j,t
This specification is tested on a pooled data-set that combines the entire time-series and the
cross-section of recovery rates. We use ordinary least squares regressions adjusting the standard
errors for the existence of default event-firm clusters as described in Williams (2000) and Petersen
(2009). This approach addresses the issue that in a particular default event a firm may have
several bonds outstanding, and that all these defaulted bonds show up as separate observations in
our data. In addition, all our regressions include the default event, industry and seniority dummy
variables.
15

6 Results
6.1 Descriptive Analysis
This section analyzes the underlying trading activity of defaulted bonds in the US corporate
bond market and presents descriptive statistics for the resulting recovery rates. We first explore
the traded prices and volumes on the default day, and in the 90 days windows before and after
default. Focusing on the recovery rate itself, we analyze its empirical distribution and quantify the
effects of the default event type, industry and seniority on the recovery rates. We also document
the variation in recovery rates over time. In addition, we provide summary statistics for the
explanatory variables that are used in the panel data regressions.
6.1.1 Trading Microstructure of Defaulted Bonds
In this section, we analyze the underlying trading activity of defaulted bonds. Figure 1, Panel
A, provides the evolution of mean transaction prices per day as a percentage of face value, for a
time window starting 90 days before, and ending 90 days after the default event day, across all
default event/bond combinations. In addition, Panel B shows the mean number of trades and
trading volume in defaulted bonds per day. By investigating transaction prices, we find that the
lowest mean price is observed on the default day itself, and is around 35% of face value. The price
level 90 days before the default is already low and shows a declining trend from about 57% to
45%. However, the default event day witnesses a significant drop in prices and is, thus, not fully
anticipated by the market. Interestingly, we find that the transaction prices recover steadily to
42%, in the ensuing 30 days after default, whereas the prices after 30 days show a more volatile
evolution. Using the Kolmogorov-Smirnov test, we find that the transaction prices within the 90
day window before default are significantly different from those on the default day itself, and in
the subsequent 30 days, which are, in turn, significantly different from those in the time frame of
31 to 90 days after default.
The analysis of the mean number of trades and traded volume across all default event/bond
combinations exhibits interesting patterns. In particular, the average number of trades per bond
on the default day of around 35 is significantly higher than on all other days. This number of
trades is also remarkably high, compared to the market-wide average of the whole corporate bond
market of 3 to 4 trades per day per bond (see, for example, Friewald et al. (2012)). The number of
16

trades decreases rapidly in the subsequent 30 days after default to around 8 to 10 trades per day
per bond, which is still higher than the market-wide average. The average daily traded volume
per bond is around $10 million on the default day, and decreases to the same extent as the number
of trades to about $3 million. Again, the traded volume on the default day is higher than the
market-wide average of around $5 million, see e.g. Friewald et al. (2012). Overall, we find a lower
price and higher level of trading activity on the default day. This price on the default day recovers
quickly in the next 30 days, reaching a stable price level, with the trading activity returning to
pre-default levels thereafter. Based on these findings, we define the recovery rate in our analysis
as the mean transactions price in the window between the default date, and 30 days after default,
as we find evidence that the price discovery in this time window is driven mostly by the default
event itself. Furthermore, this time window represents a reasonable period to split up and sell
larger positions in defaulted bonds. We consider this estimation of a market-based recovery rate
more reliable than quotations or last-trade information from the default date alone, as has been
used by many prior studies due to data limitations. This significant methodological distinction
makes our subsequent analysis all the more robust.
Figure 2 further investigates the trading activity among four important sub-groups: for non-
financial versus financial firms, and investment versus speculative grade bonds, we again analyze
the mean transaction prices, number of trades and traded volume in the 90 days before and after
the default event. The general patterns obtained in the previous analysis of the full sample are
confirmed in each sub-group: first, the lowest transaction price is reported on the default day itself.
Second, trading activity is especially high on the default day and gradually declines afterwards.
By comparing non-financial and financial firms, we find that for non-financial firms, the price
decline leading towards the default day is smoother, and the price decline on the default day itself
is less severe (from 43% to 35%, compared to 47% to 33% for financials), indicating that the actual
default is more of a surprise to the market, in the case of financial firms. For both groups, the
number of trades and the traded volume are especially high on the default day. In addition, the
general level of trading activity around default seems to be higher for financial firms than for non-
financial firms, e.g., the mean number of trades is around 22 for non-financial firms, compared to
around 70 for financial firms, on the default day. The comparison of investment versus speculative
grade bonds yields interesting insights, as well. While the mean transaction prices for speculative
grade bonds decline gradually towards default, prices drop rather steeply on the default day in the
17

case of investment grade bonds (from 42% to 35% compared to 47% to 27%). This might indicate
a greater surprise element in the case of default for more credit-worthy, investment grade bonds.
The number of trades and traded volumes are higher for investment grade bonds, as expected.
Figure 3 presents mean transaction prices 90 days before, and after, default for the different
default event types. Transaction prices for Chapter 11 liquidation and restructuring filings exhibit
very similar patterns. In both cases, the default day induces a relatively sharp decline in prices
from about 50% down to 25%. Within the first 30 days after default, prices recover to around
40%. Especially interesting is the analysis of mean transaction prices in the case of distressed
exchanges. The pattern reveals that these cases are the only default events where transaction
prices before default are lower than after default, indicating that the default itself is seen as a sign
of relief by the market, after an uncertain negotiation process. In particular, distressed exchanges
exhibit the highest transaction prices in the post-event phase. For rating-based default events,
we find that unlikely-to-pay announcement events by all rating agencies lead to a sharp drop of
prices, indicating an element of surprise, whereas the event of downgrading to an actual default
rating class seems to be generally anticipated by the market. The analysis of the number of trades
and traded volumes for different default event types yields very similar results, compared to the
previous analyses, and is, therefore, not presented in the interest of conserving space.
6.1.2 Recovery Rates and Effects of Event Type, Industry and Seniority
Analyzing the resulting recovery rates, i.e., the mean transaction prices between the default
day, and 30 days after default, we first present the empirical distribution of the recovery rates
of defaulted US corporate bonds between 2002 and 2010, in Figure 4. The mean recovery rate
is equal to 38.6% with a standard deviation of 27.4%. While the mean recovery rate is close to
the 40% estimate provided by Altman and Kishore (1996), which is widely used in academia and
industry, the standard deviation around this number suggests substantial variation in recovery
rates across different dimensions; therefore, a comprehensive analysis of the driving factors is
important. Specifically, three peaks can be identified in the empirical distribution - one up to
20%, one between 40% to 50% and one between 60% to 70%. The lowest peak is likely to have
been driven by the recovery rates of bonds issued by Lehman Brothers, which traded at about
15%, after filing for protection under Chapter 11 on September 15, 2008. Overall, the distribution
documents the stochastic nature of the recovery rate.
18

Figure 5 displays the time series of mean recovery rates in the US corporate bond market as a
quarterly moving average. We find that recovery rates are highly volatile over time: around 60%
in 2007, compared to 20% at the end of 2008. The lowest mean recovery rates can be found during
the financial crisis. Thus, cross-sectional average recovery rates are clearly not constant over time
and should be used with caution.
We present summary statistics in Table 2 displaying the recovery rates across different default
event types, industries and seniority levels, to analyze the important determinants of recovery
rates. We report, in total, 2, 235 default event/bond combinations for which transaction data are
available. Panel A displays the statistics for the overall sample and confirms the results discussed
when presenting the empirical distribution. Panel B displays recovery rates across different default
event types. Chapter 11 restructuring filings form the largest group, consisting of 492 observations,
whereas we observe only 13 Chapter 11 liquidations. Interestingly, we find only an insignificant
difference between Chapter 11 restructuring and liquidation filings (i.e., 37.1% vs. 40.7%). Dis-
tressed exchanges exhibit, on average, the highest recovery rate of 51.3%, confirming that avoiding
formal bankruptcy procedures leads to significantly higher recovery rates, by preserving more of
the “going concern” value for bondholders. Furthermore, we find significant differences in recovery
rates, when analyzing the default grades of the rating agencies. We find, within the Fitch and
Moody’s credit classifications, that the actual default grade has a significantly lower recovery than
the unlikely-to-pay grade (Fitch: 31.4% vs. 41.3% and Moody’s: 16.0% vs. 44.9%). This differ-
ence is pronounced, especially in the case of Moody’s, indicating that their rating framework is
indeed more sensitive to the expected loss, as is generally assumed by many market participants.
For Standard and Poor’s such a difference is not observable, which could indicate that Standard
and Poor’s does not incorporate recovery aspects, as suggested by their rating framework.
Panel C displays recovery rates across non-financial industries, while panel D reports recovery
rates for financial firms. One should note that the sample is fairly balanced between non-financial
and financial firms (1, 160 observations belong to non-financial firms, while 1, 075 belong to fi-
nancial firms). We find that among non-financial industries, utility and energy firms recover, on
average, the highest (e.g., electricity 48% and oil & gas 44.4%), while retail firms recover the
least at 33.4%. Among financial industries, we find that the overall highest recovery rate of 56.6%
is reported for the credit & financing industry, while the financial services industry exhibits the
lowest recovery rates - this result is mainly driven by the low recoveries of Lehman Brothers debt.
19
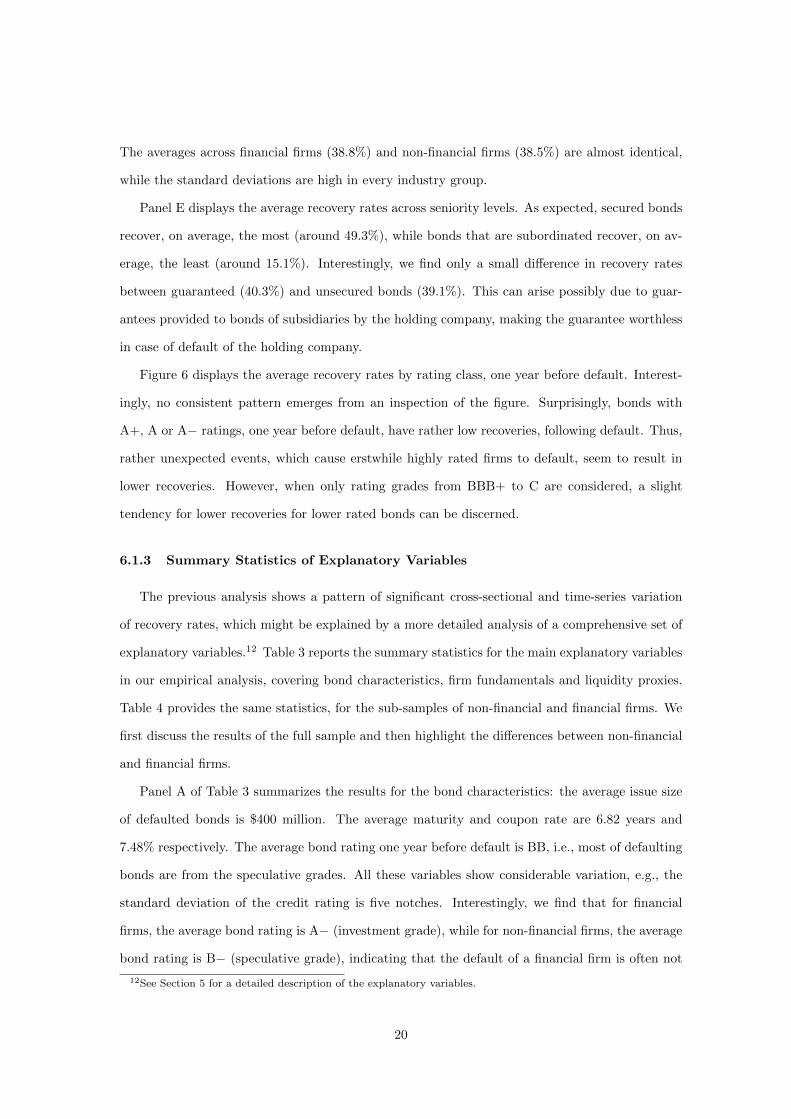
The averages across financial firms (38.8%) and non-financial firms (38.5%) are almost identical,
while the standard deviations are high in every industry group.
Panel E displays the average recovery rates across seniority levels. As expected, secured bonds
recover, on average, the most (around 49.3%), while bonds that are subordinated recover, on av-
erage, the least (around 15.1%). Interestingly, we find only a small difference in recovery rates
between guaranteed (40.3%) and unsecured bonds (39.1%). This can arise possibly due to guar-
antees provided to bonds of subsidiaries by the holding company, making the guarantee worthless
in case of default of the holding company.
Figure 6 displays the average recovery rates by rating class, one year before default. Interest-
ingly, no consistent pattern emerges from an inspection of the figure. Surprisingly, bonds with
A+, A or A− ratings, one year before default, have rather low recoveries, following default. Thus,
rather unexpected events, which cause erstwhile highly rated firms to default, seem to result in
lower recoveries. However, when only rating grades from BBB+ to C are considered, a slight
tendency for lower recoveries for lower rated bonds can be discerned.
6.1.3 Summary Statistics of Explanatory Variables
The previous analysis shows a pattern of significant cross-sectional and time-series variation
of recovery rates, which might be explained by a more detailed analysis of a comprehensive set of
explanatory variables.12 Table 3 reports the summary statistics for the main explanatory variables
in our empirical analysis, covering bond characteristics, firm fundamentals and liquidity proxies.
Table 4 provides the same statistics, for the sub-samples of non-financial and financial firms. We
first discuss the results of the full sample and then highlight the differences between non-financial
and financial firms.
Panel A of Table 3 summarizes the results for the bond characteristics: the average issue size
of defaulted bonds is $400 million. The average maturity and coupon rate are 6.82 years and
7.48% respectively. The average bond rating one year before default is BB, i.e., most of defaulting
bonds are from the speculative grades. All these variables show considerable variation, e.g., the
standard deviation of the credit rating is five notches. Interestingly, we find that for financial
firms, the average bond rating is A− (investment grade), while for non-financial firms, the average
bond rating is B− (speculative grade), indicating that the default of a financial firm is often not
12See Section 5 for a detailed description of the explanatory variables.
20

considered as very likely by rating agencies one year before the actual event, whereas for non-
financial firms, the economic situation of the company is already perceived as being weak. A
similar difference with a parallel reasoning can be found for the coupon rate (financial firms: 5.8%
vs. non-financial firms: 8.6%). Furthermore, defaulted financial bonds have, on average, a longer
maturity by 2.5 years.
Panel B in Table 3 presents statistics for firm fundamentals. On average, firms have an equity
ratio of 6.62% of total assets. The average default barrier equals 47.80% of total assets. Comparing
financial and non-financial firms in Table 4, we find that there is only a small difference in the
equity ratio between these two groups. Interestingly, the default barrier is higher for financial
firms (around 53%) than for non-financial firms (around 23%), indicating that the former use more
short-term financing. On average, receivables are 50% of total assets for financial firms, but only
10% are for non-financial firms. There is also a huge gap in intangibility: for non-financial firms,
intangibility is ten times as high as for financial firms. Despite being close to default, financial
firms seem to be highly profitable, on average, with a profitability of around 60%. Analyzing the
size proxies, the average firm size is equal to $139 billion with 2,970 employees, respectively. While
the average firm size of defaulted financial firms is ten times as large as that of non-financial firms,
the latter have 2.2 times as many employees as financial firms.
Panel C in Table 3 summarizes the trading activity variables and liquidity measures. The
trading activity variables confirm that the number of trades and trading volume are above the
market-wide average and, thus, the market for defaulted bonds is not an obviously illiquid segment
of the corporate bond market for all measures. Interestingly, bonds of financial firms have five
trades per day on average more compared to non-financial firms. However, the volume per trade
is much lower (around $260,000 vs. $470,000). Analyzing the liquidity measures, we find that
trading in defaulted bonds results in relatively high transaction costs. Thus, defaulted bonds are
illiquid in this sense. The average price impact given by the Amihud measure of $1 million is
1.49%, while the market-wide average is at 0.36% (see Friewald et al. (2012)). Transaction costs
amount to 2.80%, estimated by the price dispersion measure, which is six times as high as the
overall market average of 0.43% (see Friewald et al. (2012)).
Figure 7 provides the time series evidence for the key macroeconomic variables, i.e., the aggre-
gate default rate, the Federal Funds rate and the 10 year Treasury rate (used in the slope variable).
Analyzing the default rate, three regimes can be identified: the “dotcom“ bubble in 2002 and 2003,
21

the Ford and General Motors crisis in 2005 and the financial crisis in 2008 and 2009.13 The period
during the financial crisis experienced the highest aggregate default rate, around 3.60%. We find
a significant variation in default rates during our observation period, allowing us to analyze the
relation between recovery and default rates. The Federal Funds rate shows similar patterns, but
in the opposite direction, i.e., low rates in crisis periods, and high rates in the boom phases. The
difference between the 10 year Treasury rate and the Federal Funds rate shows large differences
at the end of crisis, and low or negative differences at the beginning of crisis, whereas the 10 year
rate itself is rather stable over time, albeit with a decrease since the financial crisis, due to central
bank intervention, through quantitative easing.
6.2 Panel Data Analysis
In this section, we present the results of the panel regressions. The recovery rates are explained
by bond characteristics, firm fundamentals, macroeconomic variables and liquidity proxies, as well
as dummy variables for the default event types, industries and seniority classes. The results of
this model specification are presented in the next section. Additionally, we provide an alternative
empirical analysis. In particular, we test the model on two subsamples, i.e., for non-financial and
speculative grade rated bonds, to analyze whether our results are driven by either financial firms
or by firms that were hitherto investment grade, but defaulted subsequently.14
6.2.1 Regression Model Explaining Recovery Rates
In this section, we present the results of our regression analysis. Table 5 presents six different
regression specifications. Model 1 represents a regression including only the dummy variables
for the default event types, industries and seniority levels. This specification allows to explore
the increase in explanatory power compared to the other specifications. We find an adjusted R2
of 37% for Model 1, i.e., reasonable explanatory power can be found even for this specification,
as important dimensions are already included and the results of the descriptive analysis can be
confirmed. The next four specifications, i.e., Models 2 to 5, control for each of the four defined
groups of variables, i.e., bond characteristics, firm fundamentals, macroeconomic variables or
13See Friewald et al. (2012) for a related analysis on the different regimes in the US corporate bond market.14In addition, we perform a factor analysis and identify five factors representing a balance sheet factor, a size
factor, a macroeconomic factor, a trading activity factor and a transaction costs factor, and run the regressions(joint model and subsamples) afresh based on these factors to avoid potential multi-collinearity. The results basedon the factors confirm the overall findings (sign and significance) and are, thus, not presented in detail.
22

liquidity proxies. We find that all four groups add to the explanation of recovery rates. Bond
characteristics (Model 2) increase the adjusted R2 by five percentage points to 42%. However,
these characteristics are not as important as the other groups. Firm fundamentals (Model 3) and
macroeconomic variables (Model 4) seem to be of similar importance, as they exhibit adjusted R2
of 47% and 46% respectively. We obtain the highest adjusted R2 of 53% by including liquidity
measures (Model 5). Thus, the trading activity and liquidity measures are important additional
variables necessary to explain recovery rates.
Model 6 in Table 5 includes all four sets of variables. We focus on this complete model to
discuss the effect of the individual variables. We find that this model is able to capture 64%
of the variation of recovery rates. Among the bond characteristics, four variables turn out to
be significant. As expected, we find a positive association between the amount issued and the
recovery rate, i.e., bonds with higher amounts outstanding trade at favorable prices post-default.
A $10 million increase in amount issued is associated with a 2.85% increase in recoveries per
100% of face value, which represents an economically significant effect. We find that bonds with
a longer maturity exhibit lower recoveries, i.e., an increase in the time to maturity by one year
decreases the recovery rate by around 0.6% of face value. Thus, this effect has rather low economic
impact, and might be caused by selling-pressure imposed by large institutional investors, such as
insurance companies, which typically hold bonds with longer time to maturity, but may be forced
to sell following default, due to mandate restrictions. Furthermore, we find a small positive effect
for the coupon rate, potentially indicating that bonds with a higher coupon are of higher value
for certain outcomes of the default event. Interestingly, the rating variable is insignificant in
the complete model, indicating that the rating one year before the default event conveys little
information concerning the recovery rate. This result is consistent with the findings of Altman
and Kishore (1996). The most interesting result among the bond characteristics is provided by
the CDS dummy, indicating whether a bond can be delivered into a CDS contract. In particular,
we find that bonds that are deliverable into a CDS contract exhibit around 6.70% higher recovery
rates of face value than bonds that are non-deliverable. This effect is quite significant in economic
terms, and may arise due to the potential buy-side pressure of protection buyers, who are obliged
to deliver certain bonds to protection sellers in the case of default.
Among the firm characteristics, we find significant effects for the ratios motivated by structural
credit risk models. We find that the higher the equity value and the lower the default barrier, the
23

higher the recovery. In particular, we find roughly similar partial net effects of these two ratios,
i.e., an increase in the equity ratio and a decrease in the default barrier by ten percentage points,
increases the recovery by around 1.50% and 1.80% respectively. In addition, we find that firm size
matters, i.e., a $100 billion increase in total assets leads to an increase in recoveries by approx-
imately 3.60%. The other firm characteristics employed (long term debt issuance, intangibility,
receivables, profitability, and employees) are statistically insignificant in the joint model. Thus,
the information from these characteristics might be already contained in the industry dummies.
The third group of explanatory variables are macroeconomic characteristics, of which the most
important one is the aggregate (market-wide) default rate. Several studies (see e.g., Altman et al.
(2002)) have concluded that aggregate default rates and aggregate recovery rates are negatively
associated. As already mentioned in Section 5, we employ a more precise estimate of the aggregate
default rate; based on the default event date, we derive for each recovery rate a market-wide default
rate in a trailing 90 day window, to be able to measure the contemporaneous interaction effect
between these two variables. In addition, we consider the Federal Funds rate on the default event
date as the relevant short term rate and we explore the slope between the 10 year Treasury rate and
this short term interest rate. All three variables are highly statistically significant. In particular,
we find that high aggregate default rates and low short term interest rates imply lower recoveries.
Thus, as expected, poor overall economic conditions result in lower recovery rates, i.e., an increase
in the market-wide default rate, and a decrease in the short term interest rates by one percentage
point leads to a decrease in recoveries by around 4.60%, and 6.60% respectively. In addition,
we find a positive effect of the slope factor, i.e., in regimes that could be associated with higher
optimism, we observe higher recoveries. Overall, as expected, systematic risk factors such as the
market-wide default risk influences the level of recoveries. The high explanatory power of the
model points to the fact that a significant part of the variation in recovery rates can be attributed
to this market-wide risk factor.
The fourth group of explanatory variables consists of the liquidity measures (volume, number
of trades, Amihud measure and price dispersion measure). We find that liquidity effects are
of particular importance in explaining the variation of recovery rates across different bonds in
default. In particular, the price dispersion measure introduced by Jankowitsch et al. (2011) is
highly significant and exhibits a negative coefficient - indicating that illiquid bonds suffer more of
a decline in the event of default than liquid bonds. In particular, we find that an increase in the
24

price dispersion measure by 100 basis points leads to a decrease in recovery rates by around 5.05%.
The trading activity variable and the volume variable turn out to be insignificant, indicating that
pure trading activity itself has virtually no impact on recovery rates; rather, transaction cost
metrics seem to be of greater importance. Interestingly, the Amihud measure is insignificant and,
thus, fails to provide explanatory power in addition to the price disperion measure.15
Overall, we find important factors driving the recovery rates of corporate bonds following
default. As expected, bond characteristics are of minor importance. However, we document the
strong effect of deliverability (into the CDS contract) on the recovery rate. On the other hand,
firm characteristics motivated by structural credit risk models and macroeconomic variables are
clearly linked to recovery rates. Interestingly, liquidity variables, especially those proxies that
measure transaction costs, are significant factors in explaining recovery rates.
6.2.2 Non-Financial and Speculative Grade Bonds
In this section, we present the results for two important subsamples of our overall data-set. This
analysis allows to validate the results of the previous section and to analyze whether certain results
are potentially driven by financial firms (especially, Lehman Brothers) or by large investment grade
firms. Table 6 provides the results for non-financial (Model 1) and speculative grade bonds (Model
2). We find an adjusted R2 of around 54% for these two subsamples. Analyzing the effects of
the individual variables, we again find similar results, i.e., all groups of characteristics add to the
explanatory power and most variables that are significant in the overall model are again so. Thus,
the main results stay much the same for these sub-groups as the overall sample.
However, some interesting differences compared to the overall sample need to be highlighted.
Among the bond characteristics, the partial effect of maturity (around −0.96%) is more negative
for both non-financial and speculative grade bonds, i.e., longer maturity bonds recover less in
the two subsamples as compared to the full sample (around −0.61%). The amount issued and
coupon are of minor importance, potentially indicating that bonds of these samples are more
similar compared to the full sample, in this respect. Interestingly, the rating variable is significant
for both samples, i.e., a one notch downgrade is associated with approximately a 1.45% decrease
in recoveries for non-financial and speculative grade bonds. Thus, once the low recoveries that
15This result could be triggered by retail trades, which have to bear very high transaction costs due to their smallsize. The price dispersion measure uses a low weight for this observations, whereas the Amihud measure gives aparticular high weight to low volume transactions.
25

we observe in the A+, A and A− rating grade are disregarded, we find the expected result that
a lower rating grade one year before the default indicates lower recovery. The option to deliver
the bond into a CDS contract reveals interesting insights in these two subsamples. While for
non-financial bonds, the possibility of delivering the bond into the CDS contract still results
in significantly higher recovery rates, the coefficient is insignificant for speculative grade bonds,
perhaps indicating that CDS contracts for these firms are often illiquid before an expected default
event.
As for firm characteristics, we find similar results in the subset-regressions, compared to the
overall sample. We find that the partial effects of equity and the default barrier become stronger for
both of these groups, compared to those for the full sample. In addition, receiveables and number
of employees seem to matter for non-financial firms and speculative grade bonds. Specifically, a one
percentage point increase in receivables is associated with an increase in recoveries of around 0.21%
to 0.27% for these two sub-groups. This effect could not be detected in the overall sample, possibly
because of the higher percentage of receivables for financial firms. Additionally, an increase in the
number of employees by 1000 leads to an increase of recoveries for these two groups by around
0.61%.
The significance and directional effects of macroeconomic variables remain basically unchanged
in the sub-samples compared to the full sample. Further interesting insights can be obtained from
the liquidity measures. For the transaction cost measures (both Amihud and price dispersion
metrics), we find results similar to those for the full sample. The effect of the price dispersion
measure is more pronounced in these two subsets, i.e., an increase in transaction costs by 100
basis points is associated with a decrease in recoveries by 7.7% to 8.8%, indicating that illiquidity
effects are of particular importance for non-financial and speculative grade bonds in explaining the
variation across bond recoveries. Interestingly, the trading activity variables (volume and number
of trades) are significant in the subsets as well. The volume variable has a negative impact, whereas
the number of trades has a positive effect. This could indicate that a large trading volume in a
bond with only a few observed trades has a negative impact on its recovery rate following default.
Such an effect cannot be found in the results for the overall sample, as (large) financial firms and
investment grade firms have potentially more active trading after default, even when recoveries
are lower for other reasons (e.g., Lehman Brothers).
26

7 Conclusion
The recovery rate in the event of default is an important risk factor for pricing financial
contracts exposed to credit risk. Many defaults during the recent past have highlighted the
stochastic nature of recovery rates. Therefore, it is important to understand the determinants
of this risk factor in greater detail. In this paper, we analyze recovery rates of defaulted US
corporate bonds, based on a complete set of transactions data over the time period 2002 to 2010.
In particular, we investigate the underlying trading activity for a broad set of default event types
and provide reliable market-based estimates of the recovery rates. The focus of our analysis is
on the relation between these recovery rates and a comprehensive set of bond characteristics,
firm fundamentals and macroeconomic variables. Furthermore, we use measures quantifying the
liquidity effects for individual bonds, an additional innovation relative to the prior literature.
Analyzing the microstructure of the trading activity reveals that the lowest bond prices indeed
occur on default event day itself (around 35% of face value, on average). Interestingly, the trading
activity on this day, measured by volume and number of trades, is quite high in comparison with
non-defaulted bonds. The prices recover to around 42% in the following 30 days after default with
the trading activity still remaining high. Thereafter, prices show a more volatile evolution and
the trading activity dies down quickly. Based on these findings, we define the recovery rate of a
defaulted bond as the average traded price between the default day and the next 30 days after
default, as we conjecture that price discovery in this time window is mostly driven by the default
event itself.
The subsequent panel regression analysis explains 64% of the total variation in recovery rates
employing bond characteristics, firm fundamentals, macroeconomic variables and liquidity mea-
sures as explanatory variables. As expected, we find that the type of default event, the industry
in which the firm operates, and the seniority, are important determinants of the recovery rate.
However, of equal importance are balance sheet ratios motivated by structural credit risk models
and overall macroeconomic conditions. Furthermore, we find that transaction costs metrics and
trading activity variables measuring liquidity are important determinants of recovery rates. In
summary, we provide a comprehensive analysis offering detailed insights into the stochastic nature
of recovery rates and quantify the effects of various endogenous and exogenous factors on recovery
rates.
27

Figures and Tables
Figure 1: Trading Activity in Defaulted US Corporate BondsThis figure shows the mean transaction prices and volumes as well as the average number of trades per bond on thedefault day, and in the time window 90 days before, and after, default across all default event/bond combinations.In Panel A, the evolution of mean transaction prices around default is presented. In Panel B, the average numberof trades per bond and the traded volume per bond on a daily basis is shown. The data-set consists of transactiondata reported by TRACE for the period July 2002 to October 2010 and amounts to approximately 1, 734, 000trades with an aggregate volume of $500 billion covering 2, 235 default event/bond combinations. The defaultevents are obtained from the Mergent Fixed Income Securities Database and the NYU Salomon Center MasterDefault Database and cover bankruptcy filings, out-of-court restructurings and rating downgrades.
3540
4550
55
Days to Default
Pric
e in
% o
f Fac
e V
alue
Panel A
−90 −60 −30 0 30 60 90
05
1015
2025
3035
Days to Default
Num
ber
of T
rade
s / V
olum
e in
$1,
000,
000
Panel B
−90 −60 −30 0 30 60 90
TradesVolume
28

Figure 2: Trading Activity in Non-Financial/Financial and Investment/Speculative Grade BondsThis figure shows the mean transaction prices and volumes as well as the average number of trades per bond on thedefault day, and in the time window 90 days before, and after, default for bonds of non-financial firms and financialfirms, as well as for investment and speculative grade bonds. The top half refers to bonds of financial versus nonfinancial firms, while the bottom half refers to investment versus speculative grade bonds. The data-set consistsof transaction data reported by TRACE for the period July 2002 to October 2010 and amounts to approximately1, 734, 000 trades with an aggregate volume of $500 billion covering 2, 235 default event/bond combinations. Thedefault events are obtained from the Mergent Fixed Income Securities Database and the NYU Salomon CenterMaster Default Database and cover bankruptcy filings, out-of-court restructurings and rating downgrades.
3540
4550
Days to Default
Pric
e in
% o
f Fac
e V
alue
Non−Financial
−90 −60 −30 0 30 60 900
510
1520
25
Days to Default
Num
ber
of T
rade
s / V
olum
e in
$1,
000,
000
Non−Financial
−90 −60 −30 0 30 60 90
TradesVolume
3540
4550
5560
Days to Default
Pric
e in
% o
f Fac
e V
alue
Financial
−90 −60 −30 0 30 60 90
020
4060
Days to Default
Num
ber
of T
rade
s / V
olum
e in
$1,
000,
000
Financial
−90 −60 −30 0 30 60 90
TradesVolume
3040
5060
Days to Default
Pric
e in
% o
f Fac
e V
alue
Investment Grade
−90 −60 −30 0 30 60 90
010
2030
4050
6070
Days to Default
Num
ber
of T
rade
s / V
olum
e in
$1,
000,
000
Investment Grade
−90 −60 −30 0 30 60 90
TradesVolume
3540
4550
Days to Default
Pric
e in
% o
f Fac
e V
alue
Speculative Grade
−90 −60 −30 0 30 60 90
05
1015
2025
Days to Default
Num
ber
of T
rade
s / V
olum
e in
$1,
000,
000
Speculative Grade
−90 −60 −30 0 30 60 90
TradesVolume
29

Fig
ure
3:T
ran
sact
ion
Act
ivit
yac
ross
Def
ault
Eve
nts
Th
isfi
gu
resh
ow
sth
em
ean
tran
sact
ion
pri
ces
acr
oss
the
diff
eren
td
efau
ltev
ent
typ
eson
the
def
au
ltd
ay
an
din
the
tim
ew
ind
ow
90
days
bef
ore
,an
daft
er,
def
au
lt.
Th
ed
ata
-set
con
sist
sof
tran
sact
ion
data
rep
ort
edby
TR
AC
Efo
rth
ep
erio
dJu
ly2002
toO
ctob
er2010
an
dam
ou
nts
toap
pro
xim
ate
ly1,7
34,0
00
trad
esw
ith
an
aggre
gate
volu
me
of
$500
billion
cover
ing
2,2
35
def
au
ltev
ent/
bon
dco
mb
inati
on
s.T
he
def
au
ltev
ent
data
are
ob
tain
edfr
om
the
Mer
gen
tF
ixed
Inco
me
Sec
uri
ties
Da
taba
sean
dth
eN
YU
Sa
lom
on
Cen
ter
Ma
ster
Def
au
ltD
ata
base
an
dco
ver
ban
kru
ptc
yfi
lin
gs,
ou
t-of-
cou
rtre
stru
ctu
rin
gs
an
dra
tin
gd
ow
ngra
des
.2030405060
Day
s to
Def
ault
Price in % of Face Value
Cha
pter
11
Liqu
idat
ion
−90
−60
−30
030
6090
304050
Day
s to
Def
ault
Price in % of Face Value
Cha
pter
11
Res
truc
turin
g
−90
−60
−30
030
6090
45505560
Day
s to
Def
ault
Price in % of Face Value
Dis
tres
sed
Exc
hang
e
−90
−60
−30
030
6090
305070
Day
s to
Def
ault
Price in % of Face Value
Fitc
h D
−90
−60
−30
030
6090
20304050
Day
s to
Def
ault
Price in % of Face Value
Moo
dy's
C
−90
−60
−30
030
6090
40455055
Day
s to
Def
ault
Price in % of Face Value
Sta
ndar
d an
d P
oor's
D
−90
−60
−30
030
6090
40455055
Day
s to
Def
ault
Price in % of Face Value
Fitc
h C
−90
−60
−30
030
6090
42465054
Day
s to
Def
ault
Price in % of Face Value
Moo
dy's
Ca
−90
−60
−30
030
6090
455055
Day
s to
Def
ault
Price in % of Face Value
Sta
ndar
d an
d P
oor's
C
−90
−60
−30
030
6090
30

Figure 4: Recovery Rates in the US Corporate Bond MarketThis figure shows the empirical distribution of recovery rates of defaulted US corporate bonds. Recovery rates aredefined as the average transaction price per bond within 30 days after default. The data-set consists of transactiondata reported by TRACE for the period July 2002 to October 2010 and amounts to approximately 1, 734, 000 tradeswith an aggregate volume of $500 billion covering 2, 235 default event/bond combinations. The default events dataare obtained from the Mergent Fixed Income Securities Database and the NYU Salomon Center Master DefaultDatabase and cover bankruptcy filings, out-of-court restructurings and rating downgrades.
Recovery Rate
Den
sity
0 20 40 60 80 100 120
0.00
00.
005
0.01
00.
015
Figure 5: Recovery Rates across TimeThis figure shows the time series of mean recovery rates (quarterly moving average) in the US corporate bondmarket. Recovery rates are defined as the average transaction price per bond within 30 days after default. Thedata-set consists of transaction data reported by TRACE for the period July 2002 to October 2010 and amountsto approximately 1, 734, 000 trades with an aggregate volume of $500 billion covering 2, 235 default event/bondcombinations. The default events data are obtained from the Mergent Fixed Income Securities Database and theNYU Salomon Center Master Default Database and cover bankruptcy filings, out-of-court restructurings and ratingdowngrades.
2002 2004 2006 2008 2010
2030
4050
6070
8090
Time
Rec
over
y R
ate
31

Figure 6: Recovery Rates across Rating ClassesThis figure shows the mean recovery rates across rating classes (one year before default). Recovery rates are definedas the average transaction price per bond within 30 days after default. The data-set consists of transaction datareported by TRACE for the period July 2002 to October 2010 and amounts to approximately 1, 734, 000 tradeswith an aggregate volume of $500 billion covering 2, 235 default event/bond combinations. The default events dataare obtained from the Mergent Fixed Income Securities Database and the NYU Salomon Center Master DefaultDatabase and cover bankruptcy filings, out-of-court restructurings and rating downgrades.
A+ A A− BBB+ BBB BBB− BB+ BB BB− B+ B B− CCC+ CCC CCC− C
Rating Class
Mea
n R
ecov
ery
Rat
e
010
2030
4050
Figure 7: Aggregate Default Rate, Federal Funds Rate and Treasury YieldThis figure shows the time series of the aggregate default rate (quarterly moving average), which is given as thefraction of defaulted bonds and outstanding bonds in the US corporate bond market, the Federal Funds rate andthe ten year US Treasury yield for the time period July 2002 to October 2010. The data-set consists of transactiondata reported by TRACE for the period July 2002 to October 2010 and amounts to approximately 1, 734, 000 tradeswith an aggregate volume of $500 billion covering 2, 235 default event/bond combinations. The default events dataare obtained from the Mergent Fixed Income Securities Database and the NYU Salomon Center Master DefaultDatabase and cover bankruptcy filings, out-of-court restructurings and rating downgrades. The Federal Funds rateand the Treasury yield are retrieved from Bloomberg.
2002 2004 2006 2008 2010
01
23
45
6
Time
Agg
rega
te D
efau
lt R
ate
/ Fed
eral
Fun
ds R
ate
/ 10
Year
US
Tre
asur
y Y
ield
Aggregate Default RateFederal Funds Rate10 Year US Treasury Yield
32

Tab
le1:
Def
ault
Eve
nts
Th
ista
ble
list
sth
ed
iffer
ent
def
au
ltev
ent
typ
esu
sed
inth
ean
aly
sis
an
dth
eir
defi
nit
ion
s.W
eco
nsi
der
thre
ecl
ass
esof
def
au
ltev
ents
:fi
lin
gs
for
pro
tect
ion
un
der
Ch
ap
ter
11
(res
tru
ctu
rin
gan
dliqu
idati
on
),d
istr
esse
dex
chan
ges
an
dra
tin
gd
ow
ngra
des
from
the
thre
em
ajo
rra
tin
gagen
cies
,i.e.
,F
itch
Moo
dy’s
,an
dS
tan
da
rda
nd
Poo
r’s.
Typ
eD
esc
ripti
on
Chapte
r11
liquid
ati
on
Ifa
busi
nes
sis
unable
tose
rvic
eit
sdeb
tor
pay
its
cred
itors
,ei
ther
the
busi
nes
sit
self
or
any
of
its
cred
itors
can
file
wit
ha
feder
al
bankru
ptc
yco
urt
for
pro
tect
ion
under
Chapte
r11.
As
thedebtor
inpossession
the
trust
eem
ayliquid
iate
the
ass
ets
of
the
firm
.
Chapte
r11
rest
ruct
uri
ng
Ifa
busi
nes
sis
unable
tose
rvic
eit
sdeb
tor
pay
its
cred
itors
,ei
ther
the
busi
nes
sit
self
or
any
of
its
cred
itors
can
file
wit
ha
feder
al
bankru
ptc
yco
urt
for
pro
tect
ion
under
Chapte
r11.
As
thedebtor
inpossession
the
trust
eem
ayre
stru
cture
the
firm
.
Dis
tres
sed
exch
ange
Deb
tor
pro
pose
sa
fundam
enta
lch
ange
inth
eco
ntr
act
ual
com
mit
men
tsto
cred
itors
who
may
volu
nta
rily
agre
e.
Fit
chD
Rati
ng
gra
de
indic
ate
sth
at
firm
has
ente
red
def
ault
.
Moody’s
CO
bligati
ons
rate
dC
are
the
low
est
rate
dcl
ass
and
are
typic
ally
indef
ault
,w
ith
litt
lepro
spec
tfo
rre
cover
yof
pri
nci
pal
or
inte
rest
.
Sta
ndard
&P
oor’
sD
Pay
men
tdef
ault
on
financi
al
com
mit
men
ts.
Fit
chC
Subst
anti
al
cred
itri
sk.
Def
ault
isa
real
poss
ibilit
y.
Moody’s
Ca
Obligati
ons
rate
dC
aare
hig
hly
spec
ula
tive
and
are
likel
yin
,or
ver
ynea
r,def
ault
,w
ith
som
epro
spec
tof
reco
ver
yof
pri
nci
pal
and
inte
rest
.
Sta
ndard
&P
oor’
sC
Curr
entl
yhig
hly
vuln
erable
obligati
ons.
33

Tab
le2:
Rec
over
yR
ates
acro
ssD
efau
ltE
ven
ts,
Ind
ust
ries
an
dS
enio
rity
Th
ista
ble
rep
ort
sth
esu
mm
ary
stati
stic
sfo
rth
ere
cover
yra
tes
(mea
ntr
an
sact
ion
pri
cew
ith
in30
days
aft
erd
efau
lt)
acr
oss
diff
eren
td
efau
ltev
ent
typ
es,
ind
ust
ries
an
dse
nio
rity
level
s.W
ere
port
the
low
est
reco
ver
yra
te(M
in),
25%
qu
anti
le(Q
0.25),
med
ian
,m
ean
,75%
qu
anti
le(Q
0.75),
hig
hes
tre
cover
yra
te(M
ax),
stan
dard
dev
iati
on
(SD
)an
dnu
mb
erof
ob
serv
ati
on
s(N
).P
an
elA
pro
vid
esth
est
ati
stic
sfo
rth
eto
tal
sam
ple
,P
an
elB
list
sth
esu
mm
ary
stati
stic
sfo
rre
cover
yra
tes
acr
oss
the
diff
eren
td
efau
ltev
ent
typ
es,
Pan
elC
pre
sents
the
stati
stic
sfo
rn
on
-fin
an
cia
lfi
rms,
wh
ile
Pan
elD
list
sfi
na
nci
al
firm
s.P
an
elE
giv
esth
est
ati
stic
sfo
rre
cover
ies
acr
oss
diff
eren
tle
vel
sof
sen
iori
ty.
Th
ed
ata
-set
con
sist
sof
tran
sact
ion
data
rep
ort
edby
TR
AC
Efo
rth
ep
erio
dJu
ly2002
toO
ctob
er2010
an
dam
ou
nts
toap
pro
xim
ate
ly1,7
34,0
00
trad
esw
ith
an
aggre
gate
volu
me
of
$500
billion
cover
ing
2,2
35
def
au
ltev
ent/
bon
dco
mb
inati
on
s.T
he
def
au
ltev
ents
data
are
ob
tain
edfr
om
the
Mer
gen
tF
ixed
Inco
me
Sec
uri
ties
Da
taba
sean
dth
eN
YU
Sa
lom
on
Cen
ter
Ma
ster
Def
au
ltD
ata
base
an
dco
ver
ban
kru
ptc
yfi
lin
gs,
ou
t-of-
cou
rtre
stru
ctu
rin
gs
an
dra
ting
dow
ngra
des
.T
he
ind
ust
rycl
ass
ifica
tion
san
dse
nio
rity
level
s(s
ecu
red
,gu
ara
nte
ed,
un
secu
red
,su
bord
inate
d)
are
retr
ieved
from
Blo
om
berg
.
Min
Q0.2
5M
edia
nM
ean
Q0.7
5M
ax
SD
NP
anel
A:
All
reco
ver
yra
tes
All
0.0
112.8
938.5
338.6
165.4
1116.5
027.3
62235
Panel
B:
Rec
over
yra
tes
acr
oss
def
ault
even
tty
pes
Chapte
r11
liquid
ati
on
0.1
211.6
123.1
340.6
869.4
4103.6
039.3
213
Chapte
r11
rest
ruct
uri
ng
0.0
111.2
425.9
637.1
165.7
8110.8
028.7
6492
Dis
tres
sed
exch
ange
10.6
528.9
851.0
451.2
672.3
598.7
125.4
664
Fit
chD
0.4
18.2
226.0
631.3
660.4
463.7
025.5
424
Moody’s
C0.0
13.1
08.4
716.0
223.8
7100.0
019.0
3289
Sta
ndard
&P
oor’
sD
0.0
113.9
947.8
543.8
466.0
1109.1
027.4
3465
Fit
chC
0.2
918.1
143.4
341.2
855.2
3116.5
025.2
1361
Moody’s
Ca
0.2
624.9
743.6
144.8
759.2
8109.1
023.8
7456
Sta
ndard
&P
oor’
sC
0.5
521.4
538.5
343.5
965.9
3110.0
028.1
171
Panel
C:
Rec
over
yra
tes
by
indust
ry:
non-fi
nanci
al
firm
sM
anif
act
uri
ng
0.0
113.5
231.0
338.9
364.3
6110.8
028.5
5573
Med
ia&
Com
unic
ati
ons
0.0
14.3
221.0
634.7
066.8
5101.0
034.5
6163
Oil
&G
as
9.8
533.7
441.6
744.3
753.6
392.7
923.6
821
Ele
ctri
city
23.8
135.7
140.0
748.0
348.0
4102.8
022.6
739
Ret
ail
1.4
16.6
616.3
533.4
057.8
8100.5
034.1
933
Ser
vic
e&
Lei
sure
0.0
313.4
926.9
938.6
563.9
8116.5
030.3
7190
Tra
nsp
ort
ati
on
16.7
825.7
426.9
438.1
757.4
678.3
818.8
570
Rea
lE
state
13.5
634.2
940.6
341.9
749.0
195.9
716.0
571
Panel
D:
Rec
over
yra
tes
by
indust
ry:
financi
al
firm
sB
ankin
g14.3
221.9
859.5
449.2
661.2
769.5
020.1
962
Cre
dit
&F
inanci
ng
2.2
643.7
965.3
856.5
866.0
198.0
114.2
8588
Fin
anci
al
serv
ices
0.0
14.9
19.8
710.6
413.8
198.6
39.7
5363
Insu
rance
7.9
612.2
234.6
643.3
773.9
996.1
432.7
217
Sav
ings
&L
oan
0.0
10.3
70.6
910.7
428.4
930.2
513.4
144
Panel
E:
Rec
over
yra
tes
by
senio
rity
Sec
ure
d0.0
39.8
943.1
749.2
787.9
8110.0
037.4
784
Guara
nte
ed0.0
116.9
034.7
340.2
763.4
3116.5
028.1
3585
Unse
cure
d0.1
412.9
042.3
939.0
965.5
6101.0
025.6
91457
Sub
ord
inate
d0.0
10.5
85.3
115.1
317.8
698.7
123.7
9109
34

Tab
le3:
Bon
dC
har
acte
rist
ics,
Fir
mF
un
dam
enta
lsan
dL
iqu
idit
yP
roxie
sT
his
tab
lere
port
sth
esu
mm
ary
stati
stic
sof
bon
dch
ara
cter
isti
cs(P
an
elA
),fi
rmfu
nd
am
enta
ls(P
an
elB
)an
dliqu
idit
yp
roxie
s(P
an
elC
).W
ere
port
the
low
est
valu
e(M
in),
25%
qu
anti
le(Q
0.25),
med
ian
,m
ean
,75%
qu
anti
le(Q
0.75),
hig
hes
tvalu
e(M
ax),
stan
dard
dev
iati
on
(SD
)an
dnu
mb
erof
ob
serv
ati
on
s(N
).A
mou
nt
issu
edis
giv
enin
milli
on
s,m
atu
rity
inyea
rs,
cou
pon
inp
erce
nt
of
noti
on
al
an
dra
tin
gs
are
map
ped
onto
natu
ral
nu
mb
ers,
e.g.AAA
=1,AA
+=
2,
...,
D=
21.
Equ
ity,
def
au
ltb
arr
ier,
inta
ngib
ilit
y,re
ceiv
eab
les
are
giv
enin
per
cent
of
tota
lass
ets,
LT
Dis
suan
cein
per
cent
of
tota
ld
ebt
an
dp
rofi
tab
ilit
yin
per
cent
of
tota
lsa
les.
Tota
lass
ets
are
giv
enin
$100
billion
s,em
plo
yee
sin
1,0
00.
Volu
me
isgiv
enin
$100,0
00.
Am
ihu
dm
easu
rere
pre
sents
ap
rice
chan
ge
inp
erce
nt
base
don
$1
million
of
volu
me
an
dp
rice
dis
per
sion
isgiv
enin
per
cent.
Th
ed
ata
-set
con
sist
sof
tran
sact
ion
data
rep
ort
edby
TR
AC
Efo
rth
ep
erio
dJu
ly2002
toO
ctob
er2010
an
dam
ou
nts
toap
pro
xim
ate
ly1,7
34,0
00
trad
esw
ith
an
aggre
gate
volu
me
of
$500
bil
lion
cover
ing
2,2
35
def
au
ltev
ent/
bon
dco
mb
inati
on
s.T
he
def
au
ltev
ents
data
are
ob
tain
edfr
om
the
Mer
gen
tF
ixed
Inco
me
Sec
uri
ties
Da
taba
sean
dth
eN
YU
Sa
lom
on
Cen
ter
Ma
ster
Def
au
ltD
ata
base
an
dco
ver
ban
kru
ptc
yfi
lin
gs,
ou
t-of-
cou
rtre
stru
ctu
rin
gs
an
dra
tin
gd
ow
ngra
des
.B
on
dch
ara
cter
isti
csare
retr
ieved
from
Blo
om
berg
an
dth
efi
rmfu
nd
am
enta
lsfr
om
Co
mp
ust
at. M
inQ
0.2
5M
edia
nM
ean
Q0.7
5M
ax
SD
NP
anel
A:
Chara
cter
isti
csof
def
ault
edb
onds
Am
ount
issu
ed10.0
044.4
0250.0
0399.6
0500.0
04200.0
0517.8
02235
Matu
rity
0.0
12.5
24.6
96.8
27.6
834.5
06.6
22235
Coup
on
3.6
06.0
07.0
07.4
88.8
514.2
52.3
52235
Rati
ng
5.0
08.0
013.0
012.2
117.0
021.0
05.1
52235
Panel
B:
Fundam
enta
lsof
def
ault
edfirm
sE
quit
y−
97.2
13.5
97.1
66.6
215.3
897.3
321.2
62164
Def
ault
barr
ier
0.0
122.8
349.8
847.8
063.0
8100.0
025.1
42181
LT
Dis
suance
0.0
19.5
520.9
324.1
427.1
7201.9
030.5
82117
Inta
ngib
ilit
y0.0
10.7
81.2
811.6
012.3
788.8
519.0
12180
Rec
eivea
ble
s0.0
16.4
925.7
331.2
864.4
985.6
926.5
22140
Pro
fita
bilit
y−
149.2
09.6
632.4
237.4
759.1
4190.6
029.1
52133
Tota
lass
ets
0.0
10.0
45
0.9
01.3
91.8
612.6
41.8
42184
Em
plo
yee
s0.0
10.6
71.1
62.9
72.5
928.3
05.2
92158
Panel
C:
Liq
uid
ity
pro
xie
sof
def
ault
edb
onds
Volu
me
0.0
30.4
82.4
13.6
06.2
450.0
03.6
12235
Tra
des
1.0
02.7
55.1
010.7
111.0
8235.4
016.5
72235
Am
ihud
0.0
10.2
90.9
41.4
92.0
016.5
61.8
42024
Dis
per
sion
0.0
11.2
12.5
12.8
03.9
315.3
71.9
82024
35

Tab
le4:
Bon
dC
har
acte
rist
ics,
Fir
mF
un
dam
enta
lsan
dL
iqu
idit
yP
roxie
sfo
rN
on
-Fin
an
cial
an
dF
inan
cial
Fir
ms
Th
ista
ble
rep
ort
sth
esu
mm
ary
stati
stic
sof
bon
dch
ara
cter
isti
cs(P
an
elA
),fi
rmfu
nd
am
enta
ls(P
an
elB
)an
dliqu
idit
yp
roxie
s(P
an
elC
)se
para
ted
inn
on
-fin
an
cia
lfi
rms
an
dfi
na
nci
al
firm
s.W
ere
port
the
mea
n,
stan
dard
dev
iati
on
(SD
)an
dnu
mb
erof
ob
serv
ati
on
s(N
).A
mou
nt
issu
edis
giv
enin
million
s,m
atu
rity
inyea
rs,
cou
pon
inp
erce
nt
of
noti
on
al
an
dra
tin
gs
are
map
ped
onto
natu
ral
nu
mb
ers,
e.g.AAA
=1,AA
+=
2,
...,
D=
21.
Equ
ity,
def
au
ltb
arr
ier,
inta
ngib
ilit
y,re
ceiv
eab
les
are
giv
enin
per
cent
of
tota
lass
ets,
LT
Dis
suan
cein
per
cent
of
tota
ld
ebt
an
dp
rofi
tab
ilit
yin
per
cent
of
tota
lsa
les.
Tota
lass
ets
are
giv
enin
$100
billion
s,em
plo
yee
sin
1,0
00.
Volu
me
isgiv
enin
$100,0
00.
Am
ihud
mea
sure
rep
rese
nts
ap
rice
chan
ge
inp
erce
nt
base
don
$1
million
of
volu
me
an
dp
rice
dis
per
sion
isgiv
enin
per
cent.
Th
edata
-set
con
sist
sof
tran
sact
ion
data
rep
ort
edby
TR
AC
Efo
rth
ep
erio
dJu
ly2002
toO
ctob
er2010
an
dam
ou
nts
toapp
roxim
ate
ly1,7
34,0
00
trad
esw
ith
an
aggre
gate
volu
me
of
$500
billion
cover
ing
2,2
35
def
au
ltev
ent/
bon
dco
mb
inati
on
s.T
he
def
au
ltev
ents
data
are
ob
tain
edfr
om
the
Mer
gen
tF
ixed
Inco
me
Sec
uri
ties
Da
taba
sean
dth
eN
YU
Sa
lom
on
Cen
ter
Ma
ster
Def
au
ltD
ata
base
an
dco
ver
ban
kru
ptc
yfi
lin
gs,
ou
t-of-
cou
rtre
stru
ctu
rin
gs
an
dra
tin
gd
ow
ngra
des
.B
on
dch
ara
cter
isti
csare
retr
ieved
from
Blo
om
berg
an
dth
efi
rmfu
nd
am
enta
lsfr
om
Co
mp
ust
at.
Non-F
inancia
lfirm
sF
inancia
lfirm
sM
ean
SD
NM
ean
SD
NP
anel
A:
Bond
chara
cter
isti
csA
mount
issu
ed434.8
0459.4
01090
366.0
0565.9
01145
Matu
rity
5.5
75.0
71090
7.9
77.6
41145
Coup
on
8.6
31.9
91090
5.7
71.7
31145
Rati
ng
16.7
82.0
41090
7.8
63.0
01145
Panel
B:
Fir
mfu
ndam
enta
lsE
quit
y6.5
930.5
61023
6.6
54.4
61141
Def
ault
barr
ier
23.3
717.7
01040
53.0
215.1
11141
LT
DIs
suance
21.5
828.7
6979
26.3
531.9
11138
Inta
ngib
ilit
y22.0
722.5
71042
2.0
15.7
61138
Rec
eivea
ble
s10.2
69.8
3999
49.6
822.5
71141
Pro
fita
bilit
y12.9
315.4
41040
60.8
317.7
01093
Tota
lass
ets
0.2
30.6
51043
2.4
51.9
41141
Em
loyee
s4.1
67.0
81024
1.8
92.3
71134
Panel
C:
Liq
uid
ity
pro
xie
sV
olu
me
4.6
72.9
71090
2.5
83.8
61145
Tra
des
8.2
011.6
71090
13.0
919.8
71145
Am
ihud
1.3
61.9
1953
1.6
11.7
71071
Dis
per
sion
2.4
81.7
3953
3.0
92.1
51071
36

Table 5: Regression AnalysisThis table reports the results of the panel data regression analysis. The dependent variable is the recovery rate ofthe default event/bond combinations. The explanatory variables are given by bond characteristics (amount issued,maturity, coupon, rating and CDS dummy), firm characteristics (equity, default barrier, LTD issuance, intangibility,receiveables, profitability, total assets and employees), macroeconomic variables (aggregate default rate, federalfunds rate and slope of the interest rate curve), liquidity measures (volume, number of trades, Amihud measure andprice dispersion measure) and dummy variables representing default event types, industries and seniority levels.Model 1 represents a regression including only these dummy variables. Model 2 additionally controls for the bondcharacteristics. Model 3 controls for the firm characteristics. Model 4 controls for the macroeconomic indicators andModel 5 controls for the liquidity measures. Model 6 represents the complete model containing all variables. Thedata-set consists of transaction data reported by TRACE for the period July 2002 to October 2010 and amountsto approximately 1, 734, 000 trades with an aggregate volume of $500 billion covering 2, 235 default event/bondcombinations. The default events data are obtained from the Mergent Fixed Income Securities Database and theNYU Salomon Center Master Default Database and cover bankruptcy filings, out-of-court restructurings and ratingdowngrades. Bond characteristics and macroconomic data are retrieved from Bloomberg and firm fundamentalsfrom Compustat. Clustered standard errors at the default event-firm level (see e.g. Petersen (2009)) are given inparentheses. Significance is given by: *** < 0.01, ** < 0.05, * < 0.1.
Model(1) (2) (3) (4) (5) (6)
Intercept 36.5099∗∗∗ 57.8231∗∗∗ 32.3022∗∗∗ 34.7875∗∗∗ 50.5939∗∗∗ 20.3193∗∗∗
(1.7535) (6.0960) (4.9439) (1.9165) (2.0104) (10.0191)Amount issued −0.1420 0.2850∗∗∗
(0.0890) (0.0950)Maturity −0.7015∗∗∗ −0.6142∗∗∗
(0.0673) (0.0682)Coupon 0.1412 0.9323∗∗∗
(0.3901) (0.3471)Rating −1.0529∗∗∗ −0.6395
(0.3460) (0.4306)CDS availability 0.0849 6.7313∗∗∗
(1.9267) (2.1436)Equity 0.1603∗∗∗ 0.1487∗∗∗
(0.0573) (0.0543)Default barrier −0.2523∗∗∗ −0.1821∗∗∗
(0.0758) (0.0663)LTD issuance −0.1124∗∗∗ −0.0062
(0.0269) (0.0278)Intangibility −0.2401∗∗∗ −0.0659
(0.0571) (0.0471)Receiveables 0.2465∗∗∗ 0.0989
(0.0824) (0.0928)Profitability 0.0044 −0.0671
(0.0627) (0.0584)Total assets 1.5252 3.5960∗∗
(1.1822) (1.6576)Employees −0.5454∗∗∗ 0.0272
(0.1829) (0.1859)Aggregate default rate −5.6664∗∗∗ −4.5636∗∗∗
(0.9634) (1.0698)Federal Funds rate 11.4106∗∗∗ 6.5625∗∗∗
(1.2021) (1.4215)Slope 11.9764∗∗∗ 6.1983∗∗∗
(1.4512) (1.6013)Volume 0.0010 −0.0005
(0.0018) (0.0026)Trades 0.1299∗∗∗ 0.0038
(0.0263) (0.0219)Amihud −0.0790 0.1580
(0.2730) (0.3090)Dispersion −5.6500∗∗∗ −5.0700∗∗∗
(0.2900) (0.3400)Adjusted R2 0.37 0.42 0.47 0.46 0.53 0.64Observations 2235 2235 1972 2235 2024 1809Event dummies Y Y Y Y Y YIndustry dummies Y Y Y Y Y YSeniority dummies Y Y Y Y Y Y
37

Table 6: Regression Analysis for Non-Financial and Speculative Grade BondsThis table reports the results for two subsample based on the panel data regressions. The dependent variable is therecovery rate of the default event/bond combinations. The explanatory variables are given by bond characteristics(amount issued, maturity, coupon, rating and CDS dummy), firm characteristics (equity, default barrier, LTDissuance, intangibility, receiveables, profitability, total assets and employees), macroeconomic variables (aggregatedefault rate, federal funds rate and slope of the interest rate curve), liquidity measures (volume, number of trades,Amihud measure and price dispersion measure) and dummy variables representing default event types, industriesand seniority levels. Model 1 contains the results for non-financial firms, while Model 2 for speculative gradefirms. The data-set consists of transaction data reported by TRACE for the period July 2002 to October 2010and amounts to approximately 1, 734, 000 trades with an aggregate volume of $500 billion covering 2, 235 defaultevent/bond combinations. The default events data are obtained from the Mergent Fixed Income Securities Databaseand the NYU Salomon Center Master Default Database and cover bankruptcy filings, out-of-court restructuringsand rating downgrades. Bond characteristics and macroeconomic data are retrieved from Bloomberg and firmfundamentals from Compustat. Clustered standard errors at the default event-firm level (see e.g. Petersen (2009))are given in parentheses. Significance is given by: *** < 0.01, ** < 0.05, * < 0.1.
ModelNon-Financial Speculative Grade
(1) (2)Intercept 20.8767∗∗∗ 28.8214∗∗∗
(10.1022) (13.0564)Amount issued 0.0370 0.1340
(0.1780) (0.1450)Maturity −0.9675∗∗∗ −0.9569∗∗∗
(0.1484) (0.1585)Coupon 0.7992∗ 0.8480∗
(0.4571) (0.4350)Rating −1.4762∗∗∗ −1.4511∗∗∗
(0.4727) (0.4901)CDS availability 5.5402∗∗∗ 3.6716
(2.0981) (2.2061)Equity 0.2380∗∗∗ 0.2055∗∗∗
(0.0531) (0.0505)Default barrier −0.3336∗∗∗ −0.2833∗∗∗
(0.0656) (0.0629)LTD Issuance 0.0281 0.0169
(0.0271) (0.0266)Intangibility −0.0395 −0.0246
(0.0491) (0.0448)Receiveables 0.2777∗∗∗ 0.2087∗∗
(0.1013) (0.0956)Profitability −0.0661 −0.0661
(0.0618) (0.0541)Total assets 1.6273 0.3885
(1.4592) (1.0853)Employees 0.6108∗∗∗ 0.6099∗∗∗
(0.2075) (0.1581)Aggregate default rate −3.2360∗∗∗ −3.7297∗∗∗
(1.4925) (1.4209)Federal Funds rate 9.9700∗∗∗ 8.2605∗∗∗
(1.7594) (1.5538)Slope 10.8005∗∗∗ 8.6959∗∗∗
(1.9955) (1.6650)Volume −0.0079∗∗ −0.0059∗∗
(0.0036) (0.0034)Trades 0.1316∗∗ 0.1661∗∗∗
(0.0670) (0.0612)Amihud −0.4040 −0.6320
(0.4750) (0.4330)Dispersion −8.8260∗∗∗ −7.7480∗∗∗
(0.5700) (0.7500)Adjusted R2 0.54 0.54Observations 795 868Event dummies Y YIndustry dummies Y YSeniority dummies Y Y
38

References
Viral Acharya, Jing-zhi Huang, Marti G. Subrahmanyam, and Rangarajan Sundaram. When doesStrategic Debt-service Matter? Economic Theory, 29:363–378, 2006.
Viral V. Acharya, Sreedhar T. Bharath, and Anand Srinivasan. Does Industry-wide Distress AffectDefaulted Firms? - Evidence from Creditor Recoveries. Journal of Financial Economics, 85(3):787–821, 2007.
Edward Altman and Egon Kalotay. A Flexible Approach to Modelling Ultimate Recoveries onDefaulted Loans and Bonds. Working Paper, 2010.
Edward I. Altman and Brenda Karlin. The Re-Emergence of Distressed Exchanges in CorporateRestructurings. Journal of Credit Risk, 5(2):43–56, 2009.
Edward I. Altman and Vellore M. Kishore. Almost Everything You Wanted to Know aboutRecoveries on Defaulted Bonds. Financial Analysts Journal, 52(6):57–64, 1996.
Edward I. Altman, Andrea Resti, and Andrea Sironi. The Link between Default and RecoveryRates: Effects on the Procyclicality of Regulatory Capital Ratios. BIS Working Paper No. 113,2002.
Edward I. Altman, Brooks Brady, Andrea Resti, and Andrea Sironi. The Link between Defaultand Recovery Rates: Theory, Empirical Evidence, and Implications. The Journal of Business,78(6):2203–2228, 2005.
Edward I. Altman, Amar Gande, and Anthony Saunders. Bank Debt versus Bond Debt: Evidencefrom Secondary Market Prices. Journal of Money, Credit and Banking, 42(4):755–767, 2010.
Yakov Amihud. Illiquidity and Stock Returns: Cross-Section and Time-Series Effects. Journal ofFinancial Markets, 5(1):31–56, 2002.
Ronald W. Anderson and Suresh Sundaresan. Design and Valuation of Debt Contracts. TheReview of Financial Studies, 9(1):37–68, 1996.
Jack Bao, Jun Pan, and Jiang Wang. The illiquidity of corporate bonds. The Journal of Finance,66(3):911–946, 2011.
Fischer Black and John C. Cox. Valuing Corporate Securities: Some Effects of Bond IndentureProvisions. The Journal of Finance, 31(2):351–367, 1976.
Fischer Black and Myron Scholes. The Pricing of Options and Corporate Liabilities. The Journalof Political Economy, 81(3):637–654, 1973.
Arturo Bris, Ivo Welch, and Ning Zhu. The Costs of Bankruptcy: Chapter 7 Liquidation versusChapter 11 Reorganization. The Journal of Finance, 61(3):1253–1303, 2006.
Pierre Collin-Dufresne, Robert S. Goldstein, and J. Spencer Martin. The Determinants of CreditSpread Changes. The Journal of Finance, 56(6):2177–2207, 2001.
Sergei A. Davydenko and Julian R. Franks. Do Bankruptcy Codes Matter? A Study of Defaultsin France, Germany, and the U.K. The Journal of Finance, 63(2):565–608, 2008.
Jens Dick-Nielsen. Liquidity Biases in TRACE. Journal of Fixed Income, 19:43–55, 2009.
Jens Dick-Nielsen, Peter Feldhutter, and David Lando. Corporate bond liquidity before and afterthe onset of the subprime crisis. Journal of Financial Economics, 103(3):471–492, 2012.
Darrell Duffie and Kenneth J. Singleton. An Econometric Model of the Term Structure of Interest-Rate Swap Yields. The Journal of Finance, 52(4):1287–1321, 1997.

Nils Friewald, Rainer Jankowitsch, and Marti G. Subrahmanyam. Illiquidity or credit deteriora-tion: A study of liquidity in the US corporate bond market during financial crises. Journal ofFinancial Economics, 105(1):18–36, 2012.
Jon Frye. Collateral Damage: A Source of Systematic Credit Risk. Risk Magazine, 2000.
Robert Goldstein, Nengjiu Ju, and Hayne Leland. An EBIT Based Model of Dynamic CapitalStructure. The Journal of Business, 74(4):483–512, 2001.
Michael B. Gordy. A risk-factor model foundation for ratings-based bank capital rules. Journalof Financial Intermediation, 12(3):199–232, 2003.
Samuel G. Hanson and Til Schuermann. Estimating Probabilities of Default. Working Paper,2004.
Jing-zhi Huang and Ming Huang. How Much of the Corporate-Treasury Yield Spread is Due toCredit Risk? Working Paper, 2002.
Rainer Jankowitsch, Amrut Nashikkar, and Marti G. Subrahmanyam. Price Dispersion in OTCMarkets: A new Measure of Liquidity. Journal of Banking and Finance, 35(2):343–357, 2011.
Robert A. Jarrow and Stuart M. Turnbull. Pricing Derivatives on Financial Securities Subject toCredit Risk. The Journal of Finance, 50(1):53–85, 1995.
Albert S. Kyle. Continuous Auctions and Insider Trading. Econometrica, 53(6):1315–1335, 1985.
David Lando. On Cox Processes and Credit Risky Securities. Review of Derivatives Research, 2:99–120, 1998.
Hayne E. Leland. Corporate Debt Value, Bond Covenants, and Optimal Capital Structure. TheJournal of Finance, 49(4):1213–1252, 1994.
Hayne E. Leland and Klaus Bjerre Toft. Optimal Capital Structure, Endogenous Bankruptcy, andthe Term Structure of Credit Spreads. The Journal of Finance, 51(3):987–1019, 1996.
Francis A. Longstaff and Eduardo S. Schwartz. A Simple Approach to Valuing Risky Fixed andFloating Rate Debt. The Journal of Finance, 50(3):789–819, 1995.
Francis A. Longstaff, Sanjay Mithal, and Eric Neis. Corporate Yield Spreads: Default Risk orLiquidity? New Evidence from the Credit Default Swap Market. The Journal of Finance, 60(5):2213–2253, 2005.
Dilip Madan and Haluk Unal. Pricing the Risks of Default. Review of Derivatives Research, 2:121–160, 1998.
Pierre Mella-Barral and William Perraudin. Strategic Debt Service. The Journal of Finance, 52(2):531–556, 1997.
Robert C. Merton. On the Pricing of Corporate Debt: The Risk Structure of Interest Rates. TheJournal of Finance, 29(2):449–470, 1974.
Mitchell A. Petersen. Estimating Standard Errors in Finance Panel Data Sets: Comparing Ap-proaches. Review of Financial Studies, 22(1):435–480, 2009.
Andrei Shleifer and Robert W. Vishny. Liquidation Values and Debt Capacity: A Market Equi-librium Approach. The Journal of Finance, 47(4):1343–1366, 1992.
Rick L. Williams. A Note on Robust Variance Estimation for Cluster-Correlated Data. Biometrics,56(2):645–646, 2000.
40


