THE DESTINATIONS OF SCHOOL LEAVERS · Destinations by language background and Indigenous status 19...
110
THE DESTINATIONS OF SCHOOL LEAVERS IN VICTORIA > ON TRACK 2004 OFFICE OF LEARNING AND TEACHING
-
Upload
phungkhuong -
Category
Documents
-
view
213 -
download
0
Transcript of THE DESTINATIONS OF SCHOOL LEAVERS · Destinations by language background and Indigenous status 19...
< ON TRACK 2004
THE DESTINATIONS OF SCHOOL LEAVERSIN VICTORIA
> ON TRACK 2004
OFFICE OF LEARNING AND TEACHING
Report of the 2004 On Track project
Richard Teese
John Polesel
Kate Mason
Centre for Post-compulsory Education and Lifelong LearningThe University of Melbourne
THE DESTINATIONS OF SCHOOL LEAVERSIN VICTORIA

© State of Victoria, 2005
ISBN 0794 0385 6
Published by the Communications Division for the Department of Education & Training, GPO Box 4367, Melbourne, Vic. 3001, Australia.
The Department of Education & Training welcomes any use of this publication within the constraints of the Copyright Act 1968. Provided acknowledgment is made to the source, Victorian government and non-government schools and other education bodies are permitted to copy material freely for the purpose of teaching students in schools, or for communication with parents and others in the community. When a charge is authorised for supplying material, such charge shall be limited to direct costs only. When the material is sold for profit, then written authority must first be obtained.
Address inquiries to:The ManagerCopyright ServicesGPO Box 4367, Melbourne, Vic. 3001, Australia.For further informationhttp://www.llen.vic.gov.au/llen/ontrack/index.htm
[ iii
Acknowledgments v
List of figures v
List of tables vii
Australian Bureau of Statistics (ABS) Labour Force Region abbreviations vii used in this report
Acronyms and abbreviations viii
Executive summary 1
Overview 1
Key findings 1
Destinations 1
Deferrals 2
Reasons for not continuing in education and training 2
Regional and school differences 2
Differences based on achievement and socioeconomic status 2
Destination differences based on Year 12 strand (VET and non-VET) 2
Gender differences 3
Employment as a post-school destination 3
Referrals for assistance 3
TAFE as first choice 3
Recommendations regarding methodology 3
Recommendations regarding policy 3
Longitudinal study issues 3
Introduction 5
Chapter 1 Characteristics of Year 12 completers and early leavers 7
Year 12 completers 7
Early leavers 8
Chapter 2 Education and training destinations of Year 12 completers 10
Main destinations 10
Tertiary education aspirations, offers and enrolments 10
Year 12 destinations by achievement level 14
Destinations by Year 12 strand (VET and non-VET) 16
Destinations by language background and Indigenous status 19
Socioeconomic status and student destinations 20
Chapter 3 Regional differences in post-Year 12 destinations 24

iv ]
note
Chapter 4 Labour force destinations 29
The experience of work 29
The jobs of Year 12 completers 32
Chapter 5 Reasons for Year 12 completers not continuing in study 34
Statewide perspective 34
Regional perspective 36
Chapter 6 Early leaver destinations 38
Chapter 7 Reasons for early leavers not continuing in study 43
Chapter 8 Students requesting referrals 45
Year 12 students 45
Early leavers 47
Chapter 9 TAFE as first choice 51
Findings 51
Conclusions 56
Recommendations regarding methodology 56
Recommendations regarding policy 57
Longitudinal study issues and recommendations 58
Bibliography 59
Technical Recruitment of individuals for longitudinal study 60
Proposed sample structure 60
Maintaining sample integrity 60
The achieved sample 61
Appendix 1 Methodology and sample characteristics 61
Methodology 62
Survey administration 62
Reporting 62
Sample 62
Year 12 sample 63
Early leaver sample 63
Appendix 2 Published data 65
Other On Track publications 83
Appendix 3 Survey instrument 84
School Completer Survey 84
Early Leaver Survey 93
[ v
AcknowledgmentsThe authors gratefully acknowledge the assistance of Mr George McLean, Dr Trish Corrie and Ms Bronwen Heathfield of the Victorian Department of Education & Training. The input and advice of other members of the Post Compulsory Co-ordinating Group are also acknowledged. Particular thanks are also extended to Dr Sue Loci of the Victorian Tertiary Admissions Centre and to Mr John Houghton and Ms Claire Robinson-Pope of the Victorian Curriculum and Assessment Authority for their cooperation, technical expertise and great patience in the face of many requests for data files and information.
We also extend our thanks to the many thousands of Victorian school leavers who gave up their time to participate in telephone interviews.
All responsibility for the management of the data and for the interpretations and conclusions set out in this report rests with the authors.
This research is funded by the Victorian Department of Education & Training.
List of figures
Figure 1 Year 12 completers: target sample and achieved sample 19
Figure 2 Regional and gender composition of the early leaver sample 21
Figure 3 School proportions from which Year 11 leavers are drawn, by socioeconomic band of intake 22
Figure 4 Distribution of early leavers by socioeconomic band 23
Figure 5a Main destinations of Year 12 completers, March–April 2004 25
Figure 5b Main destinations of Year 12 completers, showing deferees, March–April 2004 26
Figure 5c Main destinations of Year 12 completers, separating apprentices and trainees, March–April 2004 27
Figure 6 Education and training status of school completers by gender 29
Figure 7a Mean tertiary application rates in schools by socioeconomic status 31
Figure 7b Tertiary offers by socioeconomic status 32
Figure 8a Mean tertiary application rates in schools by achievement level (GAT decile) 33
Figure 8b Tertiary offers by achievement level (GAT decile) 34
Figure 9 Destinations of Year 12 completers by achievement level (GAT quartile) 35
Figure 10 Enrolment in university by achievement level (GAT band) and gender 38
Figure 11 Enrolment in middle-level VET by achievement level (GAT band) and gender 39
Figure 12 Enrolment In TAFE/VET by achievement level (GAT band) and gender 40
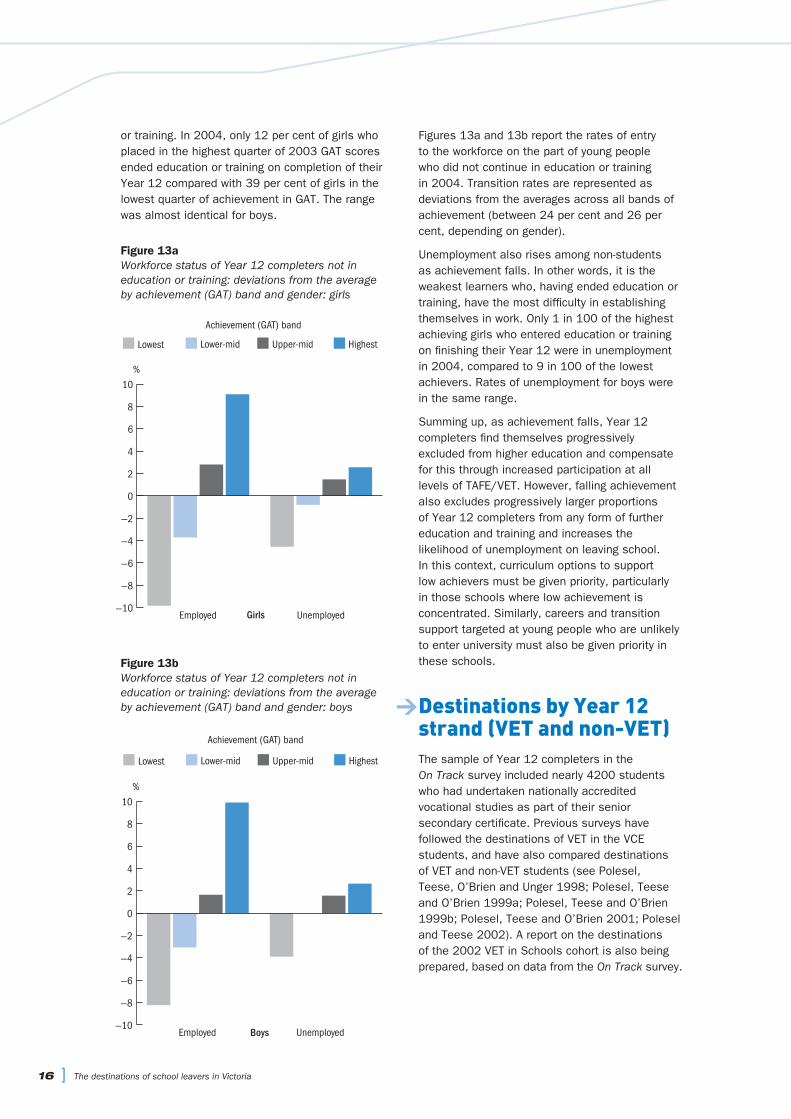
Figure 13a Workforce status of Year 12 completers not in education or training: deviations from the average by achievement (GAT) band and gender: girls 41
Figure 13b Workforce status of Year 12 completers not in education or training: deviations from the average by achievement (GAT) band and gender: boys 43
Figure 14 Destinations of VET in the VCE students by gender 46
Figure 15 Destinations of Year 12 completers by Year 12 strand (VET/non-VET) 47
Figure 16a Destinations of VET and non-VET students by achievement level (GAT quartile): low achievers 48
Figure 16b Destinations of VET and non-VET students by achievement level (GAT quartile): high achievers 49
Figure 17 Destinations of Indigenous and non-Indigenous Year 12 completers 50
Figure 18 Destinations of Year 12 completers by language background 51
Figure 19 Social background of Year 12 completers by achievement level (GAT band) 52
Figure 20 Enrolment at university by socioeconomic status and gender 55
Figure 21 Enrolment in middle-level VET by socioeconomic status and gender 56
Figure 22 Tertiary entrance by socioeconomic status and gender 57

Figure 23 Entry-level VET by socioeconomic status and gender 58
Figure 24 Workforce status of non-students by socioeconomic status and gender 59
Figure 25 Total education transition by socioeconomic status and gender 60
Figure 26 Tertiary education transition by labour force region 62
Figure 27 Differences in tertiary education transition by labour force region 63
Figure 28 VET transition by Australian Qualifications Framework level and labour force region 64
Figure 29 Ending study and entering the workforce, by labour force region 65
Figure 30 Education, training and workforce destinations post-Year 12, by labour force region 66
Figure 31 Transition of Year 12 completers to education or training, by labour force region and achievement level (GAT band) 68
Figure 32 Transition of Year 12 completers to part-time and casual work or to unemployment, by region and achievement level (GAT band) 69
Figure 33 Workforce status of Year 12 completers March–April 2004 (students and non-students) 71
Figure 34 Workforce status of Year 12 completers by gender (students and non-students) 72
Figure 35 Workforce status of Year 12 completers not in further study (includes apprentices and trainees) 73
Figure 36 Comparative academic achievement (GAT band) profile of students (including apprentices and trainees) and non-students, by gender 74
Figure 37 Comparative social profile of students (including apprentices and trainees) and non-students, by gender 75
Figure 38 Regional differences in the proportion of young people continuing in education or training on completion of Year 12 76
Figure 39 Most common jobs of school completers not in education or training (including not in apprenticeships or traineeships): girls 79
Figure 40 Most common jobs of school completers not in education or training (including not in apprenticeships or traineeships): boys 80
Figure 41 Reasons for not studying: Year 12 completers by gender 82
Figure 42 Reasons for not studying: Year 12 completers by achievement level (GAT band) 83
Figure 43 Reasons for not studying: deferring students 84
Figure 44 Reasons for not studying: highest achievement (GAT band) group by socioeconomic status 85
Figure 45 Travel and distance as barriers to education and training, by labour force region 87
Figure 46 Financial barriers to education and training, by labour force region 88
Figure 47 Destinations of early leavers by gender 90
Figure 48 Destinations of early leavers by year level of exit 92
Figure 49 Regional differences in early leaving destinations: boys 95
Figure 50 Regional differences in early leaving destinations: girls 96
Figure 51 Hours worked per week by early leavers, by gender 97
Figure 52a Most common jobs of early leavers by gender: boys 98
Figure 52b Most common jobs of early leavers by gender: girls 99
Figure 53 Reasons for not studying: early leavers by gender 101
Figure 54 Students in your school were well-informed about university courses 113
Figure 55 Students in your school were well-informed about TAFE/VET courses 114
Figure 56 Information about TAFE/VET courses was distributed at school 115
Figure 57 University courses lead to better jobs than TAFE courses 116
Figure 58 TAFE courses take as long to complete as university courses 117
Figure 59 Class sizes are about as big at TAFE as they are at university 118
vi ] The destinations of school leavers in Victoria
Figure 60 You get more individual attention at TAFE than university 119
Figure 61 Teaching in universities is of a higher quality than TAFE 120
Figure 62 You can transfer from TAFE to university with credit for work done 121
Figure 63 TAFE is mainly for students whose marks are too low to get into university 122
List of tables
Table 1 Main destinations of school completers by gender 28
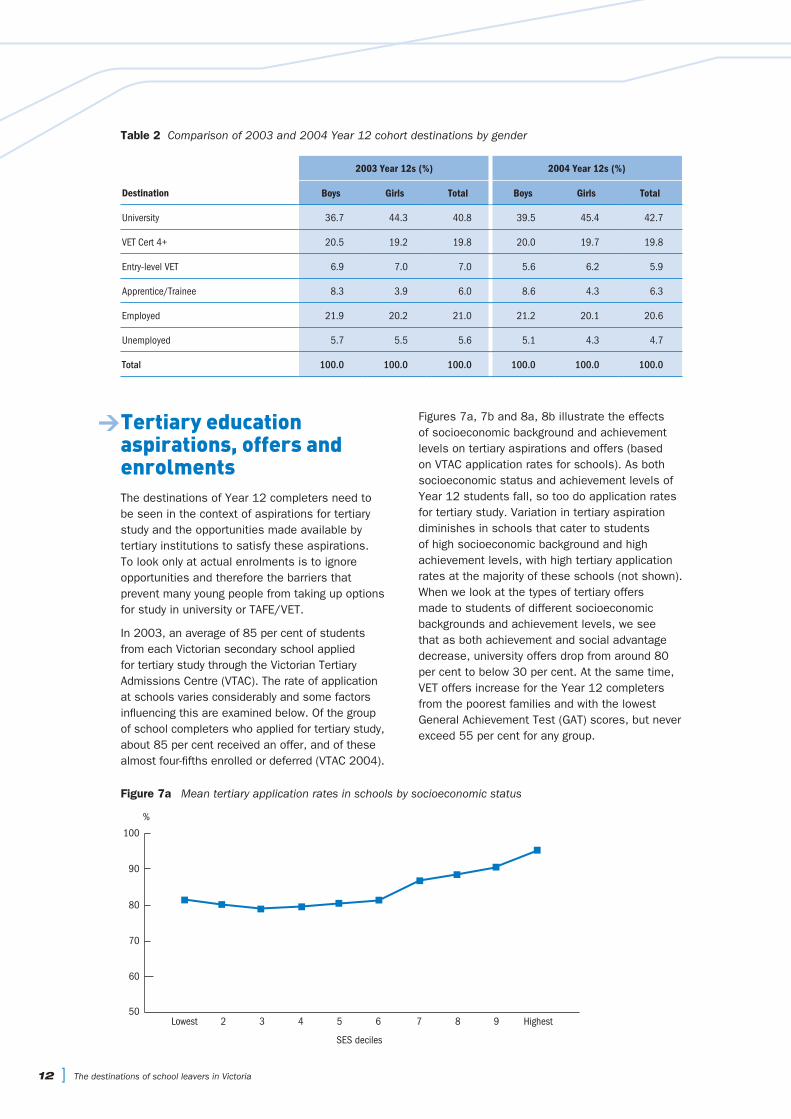
Table 2 Comparison of 2003 and 2004 Year 12 cohort destinations by gender 30
Table 3 Destinations of Year 12 completers by achievement level (GAT band) and gender 36
Table 4 Destinations of Year 12 completers by Year 12 strand 45
Table 5 Destinations of school completers by socioeconomic status and gender 53
Table 6 Education, training and workforce destinations post-Year 12, by labour force region 67
Table 7 Workforce destinations by study status and gender 77
Table 8 Comparison of 2003 and 2004 early leaving destinations by gender 91
Table 9 Gender and year level differences in early leaver destinations 93
Table 10 Referral status of Year 12 completers by gender 103
Table 11 Referral status of Year 12 completers by LLEN 104
Table 12 Referral status of early leavers by gender 106
Table 13 Referral status of early leavers by year level 107
Table 14 Referral status of early leavers by LLEN 108
Table 15 Non-applicants and non-commencers (other than deferees) by gender 111
Table 16 Base sample structure for longitudinal study 130
Table 17 Achieved sample for longitudinal study 131
Table 18 Sector and year level of File A VCAA Identified Early Leavers 134
Table 19 Early leaver achieved sample by gender 135
Table 20 Destinations of Year 12 completers by language background 136
Australian Bureau of Statistics (ABS) Labour Force Region abbreviations used in this report
OW Outer Western Melbourne
NW North Western Melbourne
IN Inner Melbourne
NE North Eastern Melbourne
IE Inner Eastern Melbourne
SO Southern Melbourne
OE Outer Eastern Melbourne
SE South Eastern Melbourne
MP Mornington Peninsula
BA Barwon-Western District
CE Central Highlands-Wimmera
LO Loddon-Mallee
GO Goulburn-Ovens-Murray
GI All Gippsland
[ vii
viii ]
Acronyms and abbreviations
AQF Australian Qualifications Framework
DE&T Department of Education & Training
DEST Department of Education, Science and Technology
GAT General Achievement Test
LLEN Local Learning and Employment Network
MIP Managed Individual Pathways
VCAA Victorian Curriculum and Assessment Authority
VCAL Victorian Certificate of Applied Learning
VCE Victorian Certificate of Education
VET Vocational Education and Training
VTAC Victorian Tertiary Admissions Centre
YPP Youth Pathways Program
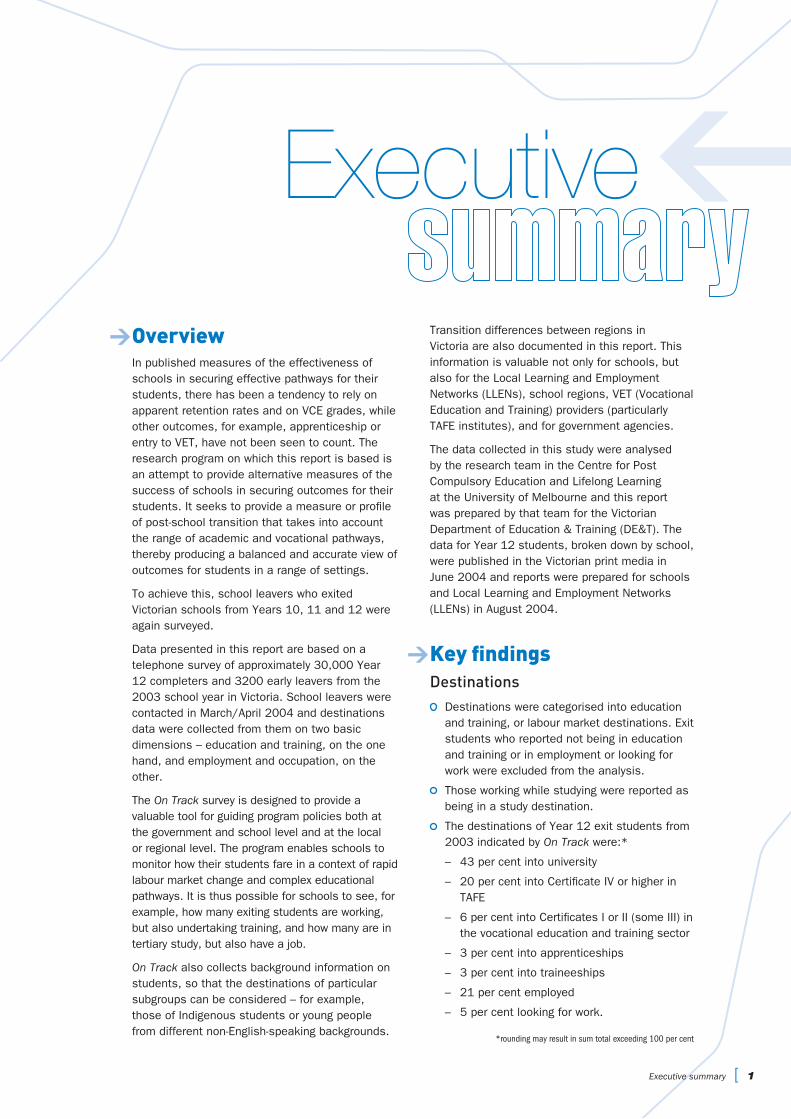
> OverviewIn published measures of the effectiveness of schools in securing effective pathways for their students, there has been a tendency to rely on apparent retention rates and on VCE grades, while other outcomes, for example, apprenticeship or entry to VET, have not been seen to count. The research program on which this report is based is an attempt to provide alternative measures of the success of schools in securing outcomes for their students. It seeks to provide a measure or profile of post-school transition that takes into account the range of academic and vocational pathways, thereby producing a balanced and accurate view of outcomes for students in a range of settings.
To achieve this, school leavers who exited Victorian schools from Years 10, 11 and 12 were again surveyed.
Data presented in this report are based on a telephone survey of approximately 30,000 Year 12 completers and 3200 early leavers from the 2003 school year in Victoria. School leavers were contacted in March/April 2004 and destinations data were collected from them on two basic dimensions – education and training, on the one hand, and employment and occupation, on the other.
The On Track survey is designed to provide a valuable tool for guiding program policies both at the government and school level and at the local or regional level. The program enables schools to monitor how their students fare in a context of rapid labour market change and complex educational pathways. It is thus possible for schools to see, for example, how many exiting students are working, but also undertaking training, and how many are in tertiary study, but also have a job.
On Track also collects background information on students, so that the destinations of particular subgroups can be considered – for example, those of Indigenous students or young people from different non-English-speaking backgrounds.
ExecutiveTransition differences between regions in Victoria are also documented in this report. This information is valuable not only for schools, but also for the Local Learning and Employment Networks (LLENs), school regions, VET (Vocational Education and Training) providers (particularly TAFE institutes), and for government agencies.
The data collected in this study were analysed by the research team in the Centre for Post Compulsory Education and Lifelong Learning at the University of Melbourne and this report was prepared by that team for the Victorian Department of Education & Training (DE&T). The data for Year 12 students, broken down by school, were published in the Victorian print media in June 2004 and reports were prepared for schools and Local Learning and Employment Networks (LLENs) in August 2004.
> Key findingsDestinations
Destinations were categorised into education and training, or labour market destinations. Exit students who reported not being in education and training or in employment or looking for work were excluded from the analysis.
Those working while studying were reported as being in a study destination.
The destinations of Year 12 exit students from 2003 indicated by On Track were:*
– 43 per cent into university
– 20 per cent into Certificate IV or higher in TAFE
– 6 per cent into Certificates I or II (some III) in the vocational education and training sector
– 3 per cent into apprenticeships
– 3 per cent into traineeships
– 21 per cent employed
– 5 per cent looking for work.
*rounding may result in sum total exceeding 100 per cent
Executive summary [ 1
The destinations of early leavers from 2003 indicated by On Track were:*
– 22 per cent into vocational education and training
– 24 per cent into apprenticeships
– 5 per cent into traineeships
– 30 per cent employed
– 19 per cent looking for work.
Deferrals 6.2 per cent of post-Year 12 students deferred
a tertiary place, with wide variation across schools and regions.
Of those who deferred, the majority (88 per cent) were employed at the time of the survey.
Reasons for not continuing in education and training
Reasons given for not continuing in education and training were categorised into:
– perceptions of timeliness
– economic and financial impediments
– perceptions of relevance or academic accessibility.
The feeling of not being ready was the most often cited single reason for Year 12 exit students not continuing in study, particularly those who had deferred. Other major reasons cited were the costs of study and the difficulty of supporting oneself while studying, and not having received a tertiary offer.
Reasons for early leavers not continuing in education and training were similar to those of Year 12 exit students. As for the Year 12 completers, not being ready was the main motive for not being in study, but among the early leavers it was cited somewhat less often. Costs, as well as perceptions of the irrelevance of education and training, and of not being able to cope with further study, were the other main reasons for early leaving.
Regional and school differences Patterns of destinations differed between
regions, particularly metropolitan and non-metropolitan regions, and between schools. Interestingly, the patterns for the Mornington Peninsula consistently reflected a country rather than a metropolitan profile.
Young people exiting Year 12 in country Victoria were more likely to be employed or seeking work, including employment-based training through apprenticeships or traineeships.
The patterns were similar for early leavers, and apprenticeship and traineeship destinations remained strong.
These regional differences are even more marked when achievement (as measured by GAT (General Achievement Test) quartiles) is considered. Only the highest achievers from country Victoria enter tertiary study at higher rates than the statewide average, while in metropolitan areas only the lowest achievers do not exceed this statewide average.
Differences between schools were marked, with many factors having an influence, including provision policy, intake policies, access to further education and training, and local labour market opportunities.
Differences based on achievement and socioeconomic status
Patterns of destinations also differed according to achievement and socioeconomic status. Using the General Achievement Test (GAT) as a measure of achievement, post-Year 12 high achievers were more likely to enrol in university while low achievers were more likely to enrol in Certificate IV or higher programs in TAFE.
Achievement also had an impact in the labour market. Low achievers were more likely to be in the labour market and more likely to be unemployed, and were more likely to be an apprentice or trainee.
There was a strong correlation between socioeconomic status and achievement. Almost two-thirds of all low achievers came from low to very low socioeconomic status backgrounds. Post-Year 12 students from high socioeconomic status backgrounds were more likely to continue to build on their Year 12 achievement through further education and training, while those from lower socioeconomic status backgrounds were more likely than the former to enter the workforce.
Destination differences based on Year 12 strand (VET and non-VET)
Results from On Track support previous studies indicating that students who undertake vocational education and training (VET) studies in Year 12 have strong transition outcomes. The results for students exiting in 2003 were:
– 18 per cent into university
– 28 per cent into Certificate IV or higher in TAFE
*Rounding may result in sum total exceeding 100 per cent
2 ] The destinations of school leavers in Victoria

– 8 per cent into Certificates I or II (some III) in the vocational education and training sector
– 13 per cent into apprenticeships/traineeships
– 27 per cent employed
– 6 per cent looking for work.
Students undertaking VET studies were more likely to enter further education and training in TAFE and to start apprenticeships and traineeships. They were also more likely to enter the workforce and not continue in education and training. Future On Track surveys will provide information on the destinations of students undertaking the Victorian Certificate of Applied Learning (VCAL).
Gender differences Girls who completed Year 12 were more likely
to enter university than boys, while boys were more likely than girls to commence an apprenticeship or traineeship.
Almost twice as many boys left school early compared with girls, and early leaver destination patterns differed significantly between girls and boys. The most frequent destination for female early leavers was a basic VET course (29 per cent), while males were most likely to be in an apprenticeship (32 per cent).
Girls who left school early were less likely than boys to continue in further education and training and more likely to be unemployed.
Employment as a post-school destination
21 per cent of post-Year 12 students were employed and not in further education and training. More often than not, they were working in part-time or casual jobs. This was particularly true for girls.
The pattern of part-time work was even stronger among early leavers, with almost 60 per cent working less than 20 hours per week.
The most common occupations for both early leavers and post-Year 12 students were those of retail assistants (girls) and labourers (boys).
> Referrals for assistance Students identified as not in education and
training and not in full-time employment were offered assistance and referral to a LLEN. Young people referred to LLENs were then put in touch with local career and transition services.
18 per cent of post-Year 12 students were not in education and training or full-time employment and were offered assistance. Of these:
– 70 per cent requested a referral
– 30 per cent refused assistance.
38 per cent of early leavers were not in education, training or full-time employment and were offered assistance. Females were more likely to fall into this category. Of the early leavers offered assistance:
– 73 per cent requested a referral
– 27 per cent refused assistance.
> TAFE as first choiceThis component of the study suggests that many young people have unclear or inaccurate views of tertiary education, particularly concerning quality and teaching in the VET sector.
Stereotyped views may not be sufficiently challenged by the range of careers information provided to students, who appear to get too little insight into instructional practices in the VET sector.
The study highlights the beneficial employment impact of the VET in Schools program for young people who do not apply for tertiary education or do not commence tertiary studies.
> Recommendations regarding methodology
The survey should include a set of questions designed to monitor the educational patterns of VCAL students. The VCAL pathway has emerged as a significant option for students.
The survey should be expanded to ask all respondents about tertiary application and about their preferencing of VET courses (see ‘TAFE as first choice’ above).
A question should be included inviting school leavers to reflect on their satisfaction with the program of studies undertaken at school (see longitudinal issues, below).
A question should be included inviting school leavers to reflect on their satisfaction with their current destination (work and/or study situation) (see longitudinal issues, below).
A question should be included inviting school leavers to reflect on their perceived level of coping with school studies, given the documented impact of achievement level on destinations.
Executive summary [ 3
4 ] The destinations of school leavers in Victoria
Consideration should be given to the collection of more detailed data on students who defer a tertiary place.
Respondents should be asked to reflect on careers education and guidance provided to them prior to leaving school.
Those school leavers who have enrolled in basic VET courses should be asked further questions about their transition.
It should be ensured that the collection of basic destinations data from the school leavers who opt not to participate in the survey aligns with the destinations data obtained during the survey, to allow consolidation of the two data sets at a more detailed level for reporting purposes.
> Recommendations regarding policy
Secondary school students and their parents should be made aware that a significant proportion of early school leavers make a transition to unemployment or low-skilled and predominantly part-time work, and effective transition strategies should be developed for all early leavers, for example, careers guidance, MIPs, and so on.
Given the negative effects of costs, travel and living away from home on school leavers wishing to enter higher education in non-metropolitan Victoria, universities should be encouraged to explore flexible delivery options and different relationships to schools and TAFEs for off-campus delivery.
Given the negative effects of costs, travel and living away from home on school leavers wishing to enter VET courses in non-metropolitan Victoria, the range of TAFE campuses and courses, particularly at Certificate IV level and above, should be expanded.
Better information about the comparative pedagogical and instructional benefits of TAFE should be made available to secondary school students to encourage them to consider tertiary options more fully, especially VET, and to make successful use of these programs.
Given the importance of interpreting the On Track data correctly and making it useful at the local LLEN and school level, consideration should be given to commissioning a program of professional development workshops in order to assist LLEN officers and careers teachers to make the most effective use of the data.
> Longitudinal study issuesThe longitudinal study should investigate the following issues:
Does a post-schooling transition to part-time work lead in the longer term to full-time work?
Is a transition to full-time work sustainable in the longer term?
How likely is it that a transition to full-time or part-time work will in the longer term lead to education or training?
For those school leavers who are in part-time work over the longer term, what is the nature of this work (i.e. low-skilled?), and how can a pathway from this into full-time work or education and training best be managed?
What is the role of part-time work for those in full-time education?
What is the likelihood that those who entered university are still in study? For those no longer in study, what are the reasons?
Which students who commence higher education successfully complete their program?
What is the likelihood that those who entered TAFE have completed or are continuing? For those no longer in study, what are the reasons?
Does attainment level at school have a bearing on tertiary continuation/completion?
Are young people from different regions across Victoria equally successful in managing the demands of tertiary education?
What is the influence of family background on pathways?
What has happened to deferees in the longer term? Why were they deferring? Have they returned to education? If not, why not?
What are the levels of satisfaction of different categories of school leavers with their current situation? Was their transition above expectations or below expectations? Was it difficult? Were there unexpected obstacles?

Today, 4 out of 5 young Victorians complete secondary school; of the remainder, many begin an apprenticeship, traineeship or other accredited vocational training. This high level of participation in education is taking place in a context in which industry, occupational and labour market changes require an increasing investment of effort in lifelong learning.
The complexity of these changes means that no single pathway through post-compulsory education and training will meet all these needs. Young people themselves stress the importance of flexibility, and they want access to a range of options. Moreover, these options are likely to vary according to geographical location, and not all options will be equally accessible to all sub-groups of the teenage population, even in the same locality.
The On Track survey program enables schools to monitor how their students fare in this overall context, in which the destinations of all young people are important. Destinations data are collected on two basic dimensions – education and training, on the one hand, and employment and occupation, on the other. It is thus possible for schools to see, for example, how many exiting students are working, but also undertaking training, and how many are in tertiary study, but also have a job.
On Track also collects background information on students, so that the destinations of particular sub-groups can be considered. What happens to Indigenous students who do not complete school? What about young people from different non-English-speaking backgrounds? This information is valuable not only for schools, but also for the Local Learning and Employment Networks (LLENs) and for government agencies. The Victorian Government is committed to ensuring an excellent education for all young people, and this includes effectiveness of post-school transition (see Blueprint for Government Schools,
www.sofweb.vic.edu.au/blueprint). So, group differences in destinations are an important aid to policy development and analysis. Consequently, particular attention is paid in this report to these differences.
Transition differences between regions in Victoria are also documented in this report. These differences should be seen in the context of regional economic indicators. For example, on Australian Bureau of Statistics figures, over two-thirds of teenagers in country Victoria are in the labour force compared to only 5 per cent in Melbourne. Unemployment is also much higher – 21 per cent compared to only 17 per cent of the age-group (Australian Bureau of Statistics, Labour Force, Sept. 2004, Cat. 6291.0.55.001). The economic context, as measured by these indicators, differs significantly, both in the likelihood of a young person participating in the workforce and the chances of that person seeking but not finding work.
Destinations data are a valuable tool for guiding program policies both at a school level and at a local or regional level. For schools, it is important to know not only how many students complete school, but also what happens to those who leave early. To what extent do early leavers begin vocational education and training – a course in TAFE or with a community or private provider, an apprenticeship, a traineeship? If some early leavers do not enter VET, what are their reasons? What strategies might be developed to improve either retention or transition to VET? Similarly, in regard to school completers, is there a pattern in which some students have a problematic transition? An example would be students who were unsuccessful in applying for a tertiary place and who are unemployed and not in further education or training. What strategies might be implemented to reduce the risks of a difficult transition?
Introduction [ 5
Introduction

6 ] The destinations of school leavers in Victoria
For the Local Learning and Employment Networks (LLENs), the destinations of young people present a number of challenges. Firstly, there is the issue identified in the Ministerial Review (Kirby) of Post-Compulsory Education and Training Pathways of those young people who ‘fall through the cracks’. On Track is able to identify the numbers of exiting students making problematic transitions – for example, those early leavers who are unemployed and not in further education or training. On Track provides information about their characteristics in broad terms, for instance, are they from lower socioeconomic status backgrounds or have they been less successful in the VCE (if they did complete school)? Identifying these group differences is an important task for On Track. A key challenge for the LLEN is to understand the play of local economic and social factors on destination patterns, including group differences. For example, what is it about local labour markets or the regional economy or the outlook of many parents in a particular community that is associated with a strong employment focus on the part of exiting students? Why is it that the destinations of some young people differ between LLEN, after controlling for group characteristics? These questions pave the way for the broader challenge of the LLEN in developing integrated options and services support for young people.
The publication of destinations data for schools gives all parents a valuable insight into what happens to young people when they leave school. Given the complexity of the evolving economic and social environment and the range of different regional settings, no single pattern of destinations can be identified as representing the optimum outcome. Needs and circumstances differ too much. Moreover, the snapshot taken in a young person’s ‘first year out’ from school needs to be supplemented by a longer-term view, as will be provided through the longitudinal component of On Track, beginning in 2005. This component will address questions such as whether university and TAFE entrants completed their awards, whether those young people who were initially in part-time or casual work had found full-time jobs, and whether early leavers who had initially not made the transition to further education or training, did so subsequently.
The population surveyed in 2004 comprised two segments – Year 12 completers and early leavers. The completers were identified by the Victorian Curriculum and Assessment Authority (VCAA), and their permission was sought to release contact details to the survey team. The early leavers were identified by the VCAA (if they had begun their VCE) or by schools (if they had not). For a detailed discussion of the contact methodology, see Appendix 1.
> Year 12 completersThe population of Year 12 completers comprised 48,154 young people who finished school in 2003. It did not include international students. This group was not included in the way the population was defined because it was assumed international students’ contact details would be unreliable and that they would therefore not be contactable.
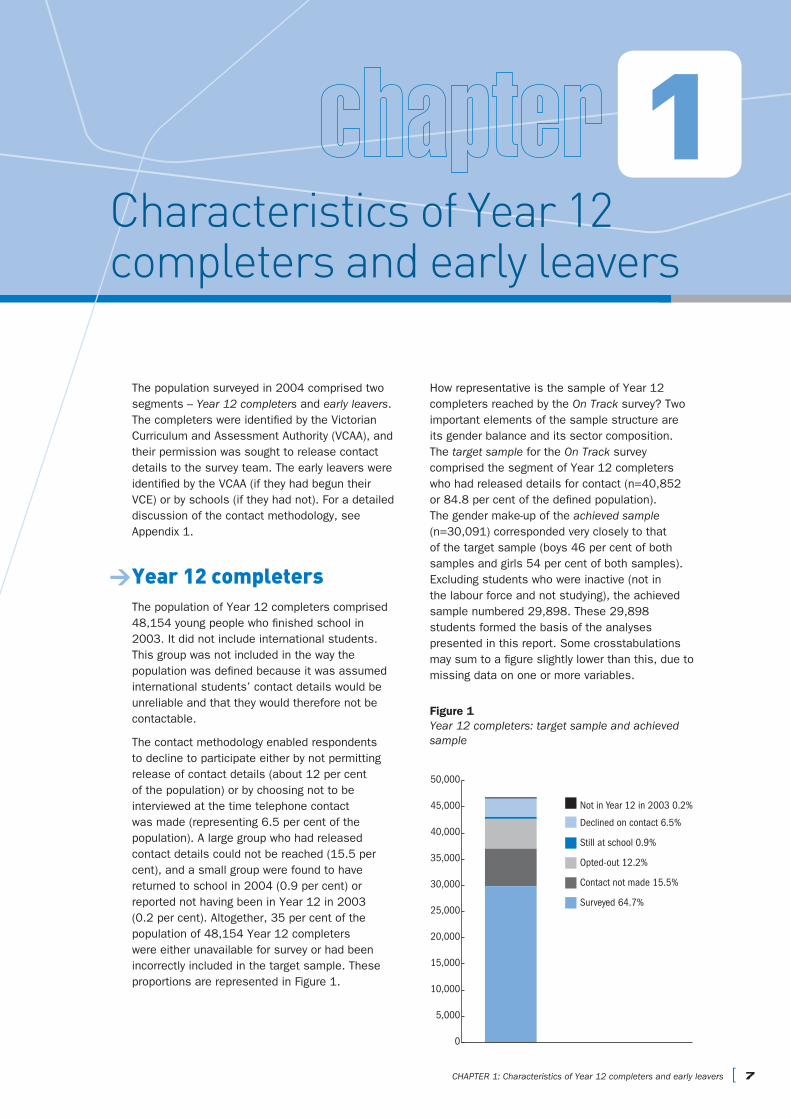
The contact methodology enabled respondents to decline to participate either by not permitting release of contact details (about 12 per cent of the population) or by choosing not to be interviewed at the time telephone contact was made (representing 6.5 per cent of the population). A large group who had released contact details could not be reached (15.5 per cent), and a small group were found to have returned to school in 2004 (0.9 per cent) or reported not having been in Year 12 in 2003 (0.2 per cent). Altogether, 35 per cent of the population of 48,154 Year 12 completers were either unavailable for survey or had been incorrectly included in the target sample. These proportions are represented in Figure 1.
Characteristics of Year 12 completers and early leavers
1
0
5,000
10,000
15,000
20,000
25,000
30,000
35,000
40,000
45,000
50,000
Surveyed 64.7%
Opted-out 12.2%
Contact not made 15.5%
Still at school 0.9%
Declined on contact 6.5%
Not in Year 12 in 2003 0.2%
How representative is the sample of Year 12 completers reached by the On Track survey? Two important elements of the sample structure are its gender balance and its sector composition. The target sample for the On Track survey comprised the segment of Year 12 completers who had released details for contact (n=40,852 or 84.8 per cent of the defined population). The gender make-up of the achieved sample (n=30,091) corresponded very closely to that of the target sample (boys 46 per cent of both samples and girls 54 per cent of both samples). Excluding students who were inactive (not in the labour force and not studying), the achieved sample numbered 29,898. These 29,898 students formed the basis of the analyses presented in this report. Some crosstabulations may sum to a figure slightly lower than this, due to missing data on one or more variables.
Figure 1 Year 12 completers: target sample and achieved sample
CHAPTER 1: Characteristics of Year 12 completers and early leavers [ 7
8 ] The destinations of school leavers in Victoria
in some subjects which, though not ‘literary’ as such, exert significant literacy demands (including some mathematics subjects).
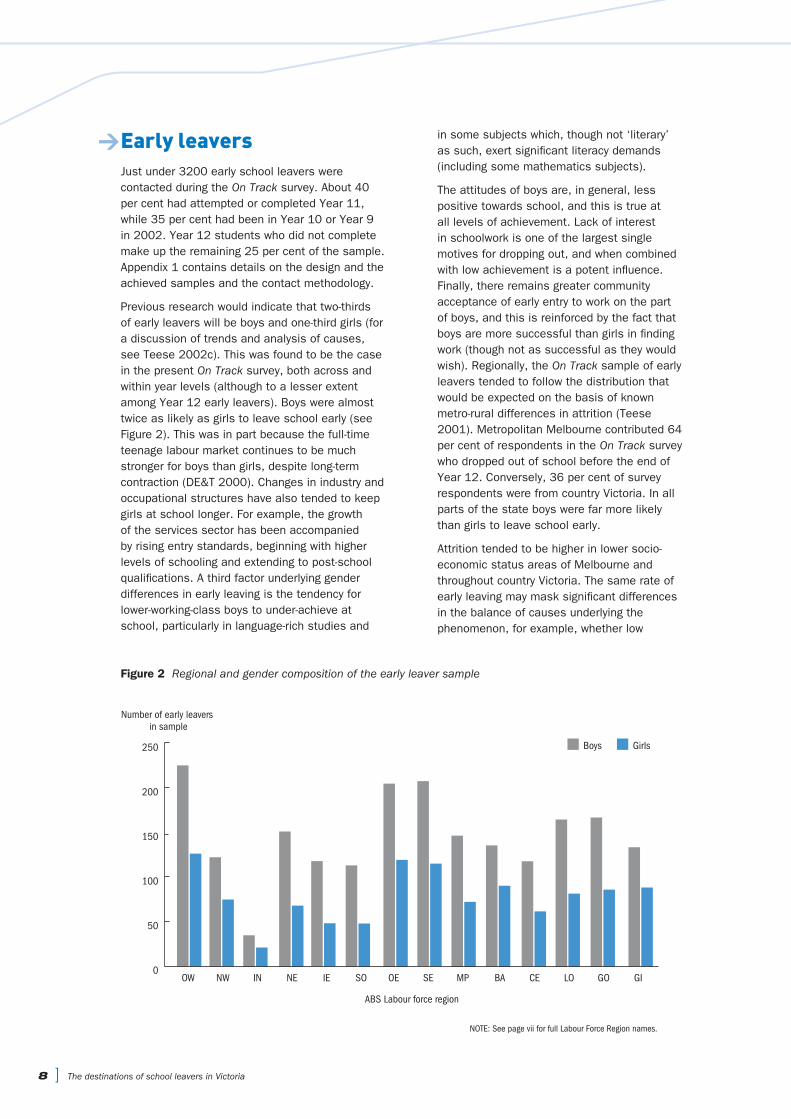
The attitudes of boys are, in general, less positive towards school, and this is true at all levels of achievement. Lack of interest in schoolwork is one of the largest single motives for dropping out, and when combined with low achievement is a potent influence. Finally, there remains greater community acceptance of early entry to work on the part of boys, and this is reinforced by the fact that boys are more successful than girls in finding work (though not as successful as they would wish). Regionally, the On Track sample of early leavers tended to follow the distribution that would be expected on the basis of known metro-rural differences in attrition (Teese 2001). Metropolitan Melbourne contributed 64 per cent of respondents in the On Track survey who dropped out of school before the end of Year 12. Conversely, 36 per cent of survey respondents were from country Victoria. In all parts of the state boys were far more likely than girls to leave school early.
Attrition tended to be higher in lower socio-economic status areas of Melbourne and throughout country Victoria. The same rate of early leaving may mask significant differences in the balance of causes underlying the phenomenon, for example, whether low
> Early leaversJust under 3200 early school leavers were contacted during the On Track survey. About 40 per cent had attempted or completed Year 11, while 35 per cent had been in Year 10 or Year 9 in 2002. Year 12 students who did not complete make up the remaining 25 per cent of the sample. Appendix 1 contains details on the design and the achieved samples and the contact methodology.
Previous research would indicate that two-thirds of early leavers will be boys and one-third girls (for a discussion of trends and analysis of causes, see Teese 2002c). This was found to be the case in the present On Track survey, both across and within year levels (although to a lesser extent among Year 12 early leavers). Boys were almost twice as likely as girls to leave school early (see Figure 2). This was in part because the full-time teenage labour market continues to be much stronger for boys than girls, despite long-term contraction (DE&T 2000). Changes in industry and occupational structures have also tended to keep girls at school longer. For example, the growth of the services sector has been accompanied by rising entry standards, beginning with higher levels of schooling and extending to post-school qualifications. A third factor underlying gender differences in early leaving is the tendency for lower-working-class boys to under-achieve at school, particularly in language-rich studies and
GIGOLOCEBAMPSEOESOIENEINNWOW0
50
100
150
200
250 GirlsBoys
Number of early leavers in sample
ABS Labour force region
Figure 2 Regional and gender composition of the early leaver sample
NOTE: See page vii for full Labour Force Region names.

Figure 3 School proportions from which Year 11 leavers are drawn, by socioeconomic band of intake
0
5
10
15
20
25
LowestLower-midMiddleUpper-midHighest
%
SES band
Only 1 in 10 early leavers came from schools serving high socioeconomic status areas. By contrast, schools drawing on the lowest two socioeconomic status bands contributed a total of 40 per cent. Figure 4 – which graphs all early leavers in the survey – shows the marked working-class bias in the distribution of early leavers across different socioeconomic status bands compared with a theoretical expectation of equality.
Figure 4 Distribution of early leavers by socioeconomic band
0
5
10
15
20
25
30
35
40
LowestLower-midMiddleUpper-midHighest
% ObservedExpected
SES band
CHAPTER 1: Characteristics of Year 12 completers and early leavers [ 9
achievement is the primary cause or whether the economic motive for early leaving predominates in a setting in which scholastic failure is not a major issue.
However, both school-related motives (such as lack of interest in schoolwork and poor achievement) and economic motives tend to be more strongly represented among students from lower socioeconomic backgrounds, whether urban or rural. Findings from the On Track survey confirm that it is these students who contribute most to the population of early leavers. When schools are grouped according to the average socioeconomic status of their Year 11 students, it is possible to estimate the proportion of early leavers who come from different social backgrounds. This is done in Figure 3, which graphs the subsample of exit Year 11 students (n=1259).

10 ] The destinations of school leavers in Victoria
2Education and training destinations of Year 12 completers
> Main destinationsThe On Track survey shows that nearly 3 in 4 young people who completed their Year 12 continued in some recognised form of education and training in the year after they left school. The most likely destination was university (43 per cent), followed by middle-level Diploma or Certificate IV programs in TAFE/VET (20 per cent). Many began a basic or skilled VET program, either campus-based (6 per cent) or employment-based, as an apprentice or trainee (6 per cent). Just over 1 in 4 Year 12 completers did not enter post-school education or training, but were either employed (21 per cent) or looking for work (5 per cent). See Figure 5a.
Figure 5a assigns deferees to their actual labour market destination (employment or unemployment). However, it is also possible to illustrate the destinations of school completers
with deferees identified separately. Figure 5b shows that 5.5 per cent of school completers had deferred a tertiary place and entered employment and 0.7 per cent were unemployed deferees.
Figure 5c presents yet another perspective, showing apprentices and trainees separately. It can be seen that apprenticeships made up 3.4 per cent of the Year 12 cohort’s destinations (accounting for 1029 respondents), while traineeships made up 2.9 per cent of their destinations (accounting for 855 respondents).
Education and training destinations differed according to gender. Girls were much more likely to enter university (45 per cent compared to 39 per cent of boys). Boys, on the other hand, were more likely than girls to enter into a contract of training (apprenticeship or traineeship –
Figure 5a Main destinations of Year 12 completers, March–April 2004
University 42.6%
VET Cert 4+19.8%
VET Entry-level5.9%
Apprentice/Trainee6.3%
Employed20.6%
Unemployed4.7%
Figure 5b Main destinations of Year 12 completers, showing deferees, March–April 2004
University 42.6%
VET Cert 4+19.8%
VET Entry-level5.9%
Apprentice/Trainee6.3%
Employed15%
Unemployed 4.0%
Employed — deferred 5.5%
Unemployed — deferred 0.7%

CHAPTER 2: Education and training destinations of Year 12 completers [ 11
Figure 5cMain destinations of Year 12 completers, separating apprentices and trainees, March–April 2004
University 42.6%
VET Cert 4+19.8%
VET Entry-level 5.9%
Apprentice 3.4%
Employed20.6%
Unemployed4.7%
Trainee 2.9%
9 per cent compared to 4 per cent), equally likely to enrol in a middle-level program (20 per cent), and marginally more likely to be working and not in education or training (21 per cent compared to 20 per cent) (see Table 1 and Figure 6). These numbers mask more subtle (and not so subtle) differences in tertiary courses, fields of study and industry sectors of training. As is shown in Table 2, the proportions of Year 12 completers going into each destination category in 2004 remain very similar to the 2003 figures.
Table 1 Main destinations of school completers by gender
Boys Girls Total
Destination No. % No. % No. %
University 5,448 39.5 7,292 45.4 12,740 42.7
VET Cert 4+ 2,763 20.0 3,161 19.7 5,924 19.8
Entry-level VET 776 5.6 993 6.2 1,769 5.9
Apprentice/Trainee 1,188 8.6 695 4.3 1,883 6.3
Employed 2,922 21.2 3,227 20.1 6,149 20.6
Unemployed 709 5.1 697 4.3 1,406 4.7
Total 13,806 100.0 16,065 100.0 29,871 100.0
Figure 6 Education and training status of school completers by gender
0
5
10
15
20
25
30
35
40
45
50GirlsBoys
Unemployed
Employed
Apprentice/trainee
VET Entry-level
VET Cert 4+
University
%
Destination
12 ] The destinations of school leavers in Victoria
Table 2 Comparison of 2003 and 2004 Year 12 cohort destinations by gender
2003 Year 12s (%) 2004 Year 12s (%)
Destination Boys Girls Total Boys Girls Total
University 36.7 44.3 40.8 39.5 45.4 42.7
VET Cert 4+ 20.5 19.2 19.8 20.0 19.7 19.8
Entry-level VET 6.9 7.0 7.0 5.6 6.2 5.9
Apprentice/Trainee 8.3 3.9 6.0 8.6 4.3 6.3
Employed 21.9 20.2 21.0 21.2 20.1 20.6
Unemployed 5.7 5.5 5.6 5.1 4.3 4.7
Total 100.0 100.0 100.0 100.0 100.0 100.0
> Tertiary education aspirations, offers and enrolmentsThe destinations of Year 12 completers need to be seen in the context of aspirations for tertiary study and the opportunities made available by tertiary institutions to satisfy these aspirations. To look only at actual enrolments is to ignore opportunities and therefore the barriers that prevent many young people from taking up options for study in university or TAFE/VET.
In 2003, an average of 85 per cent of students from each Victorian secondary school applied for tertiary study through the Victorian Tertiary Admissions Centre (VTAC). The rate of application at schools varies considerably and some factors influencing this are examined below. Of the group of school completers who applied for tertiary study, about 85 per cent received an offer, and of these almost four-fifths enrolled or deferred (VTAC 2004).
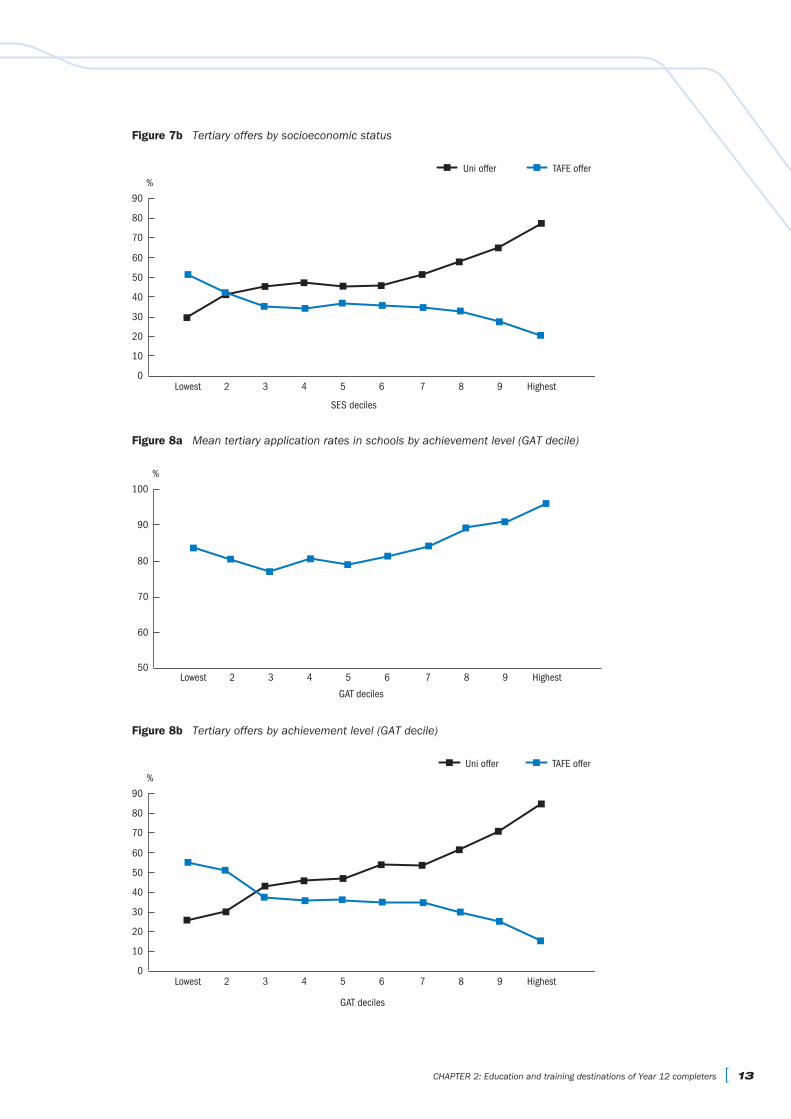
Figures 7a, 7b and 8a, 8b illustrate the effects of socioeconomic background and achievement levels on tertiary aspirations and offers (based on VTAC application rates for schools). As both socioeconomic status and achievement levels of Year 12 students fall, so too do application rates for tertiary study. Variation in tertiary aspiration diminishes in schools that cater to students of high socioeconomic background and high achievement levels, with high tertiary application rates at the majority of these schools (not shown). When we look at the types of tertiary offers made to students of different socioeconomic backgrounds and achievement levels, we see that as both achievement and social advantage decrease, university offers drop from around 80 per cent to below 30 per cent. At the same time, VET offers increase for the Year 12 completers from the poorest families and with the lowest General Achievement Test (GAT) scores, but never exceed 55 per cent for any group.
Figure 7a Mean tertiary application rates in schools by socioeconomic status
Highest98765432Lowest50
60
70
80
90
100
SES deciles
%
CHAPTER 2: Education and training destinations of Year 12 completers [ 13
Figure 7b Tertiary offers by socioeconomic status
Highest98765432Lowest0
10
20
30
40
50
60
%TAFE offerUni offer
70
80
90
SES deciles
Figure 8a Mean tertiary application rates in schools by achievement level (GAT decile)
Highest98765432Lowest50
60
70
80
90
100
GAT deciles
%
Figure 8b Tertiary offers by achievement level (GAT decile)
Highest98765432Lowest0
10
20
30
40
50
60
%TAFE offerUni offer
70
80
90
GAT deciles

14 ] The destinations of school leavers in Victoria
> Year 12 destinations by achievement levelAchievement in Year 12 exercises a very large influence on post-Year 12 destinations. As achievement levels rise, aspirations for tertiary study also rise. So, too, does transition from school to tertiary study, especially entry to university (see Figures 9 and 10). Of the highest achievers as measured by the GAT in 2003, about 80 per cent of girls and 76 per cent of boys enrolled in university. Only 12 per cent and 8 per cent respectively of low achiever girls and boys enrolled in university (see Table 3 and Figure 10).
Achievement, it should be noted, influences tertiary transition partly by raising or lowering aspirations and partly by opening up or closing off tertiary options. In other words, the lower transition rate of low achievers is not simply due to their not receiving tertiary offers. It is partly because they renounce or never form aspirations for tertiary study and consequently do not make themselves available for selection.
Figure 9 Destinations of Year 12 completers by achievement level (GAT quartile)
0
10
20
30
40
50
60
70
80
90
100
Highest
Victoria
Upper-mid
Lower-mid
Lowest
%UniversityVET Cert 4+
VET Entry-levelApprentice/Trainee
EmployedUnemployed
Achievement band (quartiles of GAT)
Table 3 Destinations of Year 12 completers by achievement level (GAT band) and gender
Quartiles of achievement on the GAT
DestinationLowest
(%)Lower-mid
(%)Upper-mid
(%)Highest
(%)Total(%)
Girls University 12* 31 55 80 46
VET Cert 4+ 30 27 18 5 20
Entry-level VET 12 8 4 1 6
Apprentice/Trainee 7 6 3 2 4
Employed 30 24 17 11 20
Unemployed 9 5 3 1 4
Total 100 100 100 100 100
Boys University 8 25 47 76 40
VET Cert 4+ 28 28 20 7 20
Entry-level VET 10 7 5 2 6
Apprentice/Trainee 15 11 6 2 8
Employed 30 24 19 11 21
Unemployed 9 5 4 2 5
Total 100 100 100 100 100
* Numbers may not total 100 due to rounding

Figure 10 Enrolment in university by achievement level (GAT band) and gender
0
10
20
30
40
50
60
70
80
90BoysGirls
HighestUpper-midLower-midLowest
%
Achievement level (GAT band)
Level of achievement also affects the sector direction of tertiary aspirations and destinations. Thus, while university hopes and university entry rise with achievement, aspirations for tertiary study in the VET sector rise as achievement falls. So, too, does the proportion of Year 12 completers who enrol in middle-level programs (see Figures 9 and 11).
Figure 11 Enrolment in middle-level VET by achievement level (GAT band) and gender
0
5
10
15
20
25
30
35
BoysGirls
HighestUpper-midLower-midLowest
%
Achievement level (GAT band)
Underlying the tendency for VET aspirations and destinations to rise as achievement falls are a number of processes. Year 12 students appear to adjust their aspirations to the level of tertiary study they feel is within their reach. Teachers also counsel students on the need for realism. Again, each fall in achievement is also, in general, a fall in anticipated socioeconomic status, and this brings with it a growing economic emphasis in the direction of aspirations (as well as an overall weakening in tertiary plans). This more direct emphasis on economic objectives contributes not only to higher rates of enrolment in middle-level programs, but to higher rates of transition into other forms of VET, including apprenticeship, traineeship and on-campus skilled or basic courses (see Figure 12).
Figure 12 Enrolment In TAFE/VET by achievement level (GAT band) and gender
0
5
10
15
20
25
30
35 HighestUpper-mid
Lower-midLowest
Apprentice/Trainee
VET Entry-level
VET Cert 4+
Apprentice/Trainee
VET Entry-level
VET Cert 4+
%
Achievement band
Boys Girls
How well young people achieve in secondary school has a large bearing on whether they continue in any education or training on completing their Year 12, and whether or not they are unemployed if they do enter the workforce and do not continue in education or training. Among both boys and girls, the likelihood of the decision to end study rises as achievement falls. Thus, while many Year 12 completers enter the workforce, it is the weakest learners who are most likely to do so without undertaking any further study
CHAPTER 2: Education and training destinations of Year 12 completers [ 15
16 ] The destinations of school leavers in Victoria
or training. In 2004, only 12 per cent of girls who placed in the highest quarter of 2003 GAT scores ended education or training on completion of their Year 12 compared with 39 per cent of girls in the lowest quarter of achievement in GAT. The range was almost identical for boys.
Figure 13a Workforce status of Year 12 completers not in education or training: deviations from the average by achievement (GAT) band and gender: girls
—10
—8
—6
—4
—2
0
2
4
6
8
10
UnemployedEmployed
%
Girls
Lowest Lower-mid Upper-mid Highest
Achievement (GAT) band
Figure 13b Workforce status of Year 12 completers not in education or training: deviations from the average by achievement (GAT) band and gender: boys
������ ��������� ��������� �������
��������
��
��
��
��
�
�
�
�
�
��
������������������
�
����
����������������������
Figures 13a and 13b report the rates of entry to the workforce on the part of young people who did not continue in education or training in 2004. Transition rates are represented as deviations from the averages across all bands of achievement (between 24 per cent and 26 per cent, depending on gender).
Unemployment also rises among non-students as achievement falls. In other words, it is the weakest learners who, having ended education or training, have the most difficulty in establishing themselves in work. Only 1 in 100 of the highest achieving girls who entered education or training on finishing their Year 12 were in unemployment in 2004, compared to 9 in 100 of the lowest achievers. Rates of unemployment for boys were in the same range.
Summing up, as achievement falls, Year 12 completers find themselves progressively excluded from higher education and compensate for this through increased participation at all levels of TAFE/VET. However, falling achievement also excludes progressively larger proportions of Year 12 completers from any form of further education and training and increases the likelihood of unemployment on leaving school. In this context, curriculum options to support low achievers must be given priority, particularly in those schools where low achievement is concentrated. Similarly, careers and transition support targeted at young people who are unlikely to enter university must also be given priority in these schools.
> Destinations by Year 12 strand (VET and non-VET)The sample of Year 12 completers in the On Track survey included nearly 4200 students who had undertaken nationally accredited vocational studies as part of their senior secondary certificate. Previous surveys have followed the destinations of VET in the VCE students, and have also compared destinations of VET and non-VET students (see Polesel, Teese, O’Brien and Unger 1998; Polesel, Teese and O’Brien 1999a; Polesel, Teese and O’Brien 1999b; Polesel, Teese and O’Brien 2001; Polesel and Teese 2002). A report on the destinations of the 2002 VET in Schools cohort is also being prepared, based on data from the On Track survey.

Results from the survey show that students undertaking VET in the VCE class of 2003 had positive transition outcomes (as in previous years). Nearly 1 in 5 entered university and more than 1 in 4 began a Diploma or Certificate IV program in TAFE/VET. Eight per cent undertook an
Table 4 Destinations of Year 12 completers by Year 12 strand
Non-VET VET Total
Destination No. % No. % No. %
Girls
University 6,898 48.9 394 20.1 7,292 45.4
VET Cert 4+ 2,560 18.1 601 30.7 3,161 19.7
VET Entry-level 828 5.9 165 8.4 993 6.2
Apprentice 98 0.7 34 1.7 132 0.8
Trainee 457 3.2 106 5.4 563 3.5
Employed 2,676 19.0 551 28.1 3,227 20.1
Unemployed 589 4.2 108 5.5 697 4.3
Total 14,106 100.0 1,959 100.0 16,065 100.0
Boys
University 5,086 43.9 362 16.2 5,448 39.5
VET Cert 4+ 2,182 18.8 581 26.1 2,763 20.0
VET Entry-level 607 5.2 169 7.6 776 5.6
Apprentice 585 5.1 311 14.0 896 6.5
Trainee 214 1.8 78 3.5 292 2.1
Employed 2,345 20.3 577 25.9 2,922 21.2
Unemployed 559 4.8 150 6.7 709 5.1
Total 11,578 100.0 2,228 100.0 13,806 100.0
All
University 11,986 46.6 756 18.1 12,742 42.6
VET Cert 4+ 4,752 18.5 1,182 28.2 5,934 19.8
VET Entry-level 1,437 5.6 334 8.0 1,771 5.9
Apprentice 684 2.7 345 8.2 1,029 3.4
Trainee 671 2.6 184 4.4 855 2.9
Employed 5,028 19.6 1,128 26.9 6,156 20.6
Unemployed 1,153 4.5 258 6.2 1,411 4.7
Total 25,711 100.0 4,187 100.0 29,898 100.0
on-campus basic or skilled VET course, while 12.6 per cent entered a contract of training (8.2 per cent apprentices and 4.4 per cent trainees). The largest group (27 per cent) ended education and training and found work, while about 6 per cent were looking for work (full details are in Table 4).
CHAPTER 2: Education and training destinations of Year 12 completers [ 17
18 ] The destinations of school leavers in Victoria
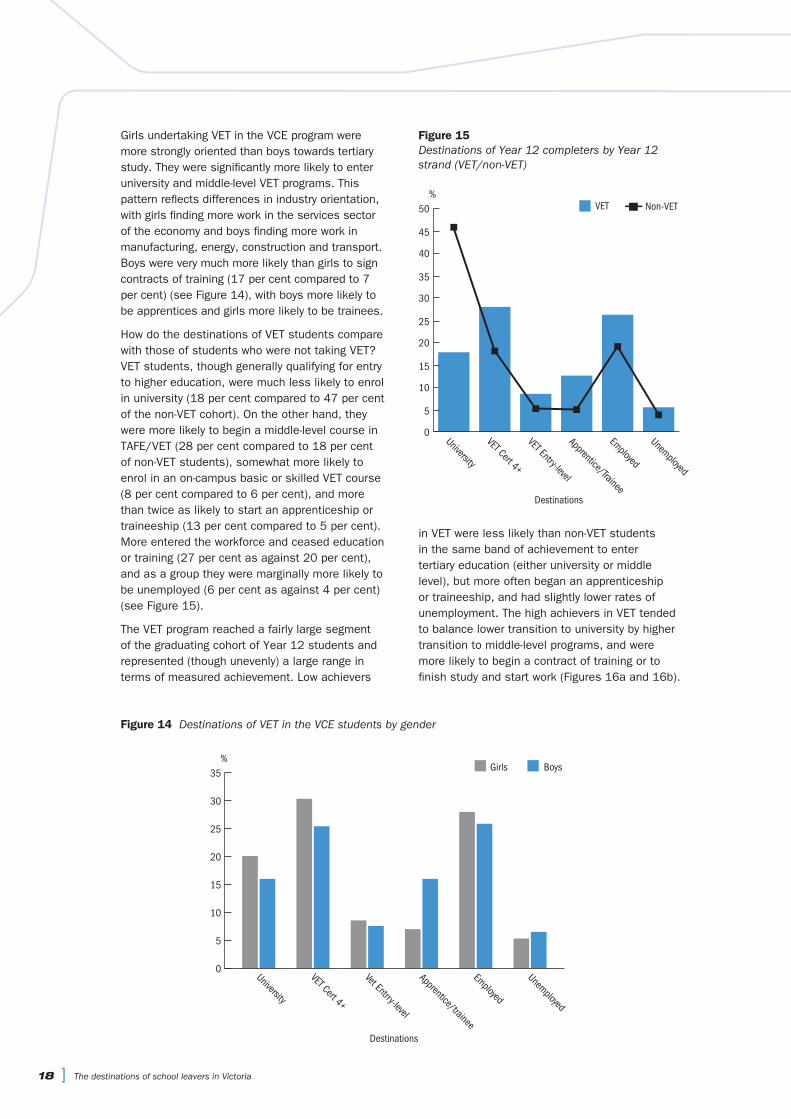
Figure 14 Destinations of VET in the VCE students by gender
0
5
10
15
20
25
30
35BoysGirls
Unemployed
Employed
Apprentice/trainee
Vet Entrry-level
VET Cert 4+
University
%
Destinations
Girls undertaking VET in the VCE program were more strongly oriented than boys towards tertiary study. They were significantly more likely to enter university and middle-level VET programs. This pattern reflects differences in industry orientation, with girls finding more work in the services sector of the economy and boys finding more work in manufacturing, energy, construction and transport. Boys were very much more likely than girls to sign contracts of training (17 per cent compared to 7 per cent) (see Figure 14), with boys more likely to be apprentices and girls more likely to be trainees.
How do the destinations of VET students compare with those of students who were not taking VET? VET students, though generally qualifying for entry to higher education, were much less likely to enrol in university (18 per cent compared to 47 per cent of the non-VET cohort). On the other hand, they were more likely to begin a middle-level course in TAFE/VET (28 per cent compared to 18 per cent of non-VET students), somewhat more likely to enrol in an on-campus basic or skilled VET course (8 per cent compared to 6 per cent), and more than twice as likely to start an apprenticeship or traineeship (13 per cent compared to 5 per cent). More entered the workforce and ceased education or training (27 per cent as against 20 per cent), and as a group they were marginally more likely to be unemployed (6 per cent as against 4 per cent) (see Figure 15).
The VET program reached a fairly large segment of the graduating cohort of Year 12 students and represented (though unevenly) a large range in terms of measured achievement. Low achievers
0
10
20
30
40
50 VET Non-VET
Unemployed
Employed
Apprentice/Trainee
VET Entry-level
VET Cert 4+
University
%
5
15
25
35
45
Destinations
Figure 15 Destinations of Year 12 completers by Year 12 strand (VET/non-VET)
in VET were less likely than non-VET students in the same band of achievement to enter tertiary education (either university or middle level), but more often began an apprenticeship or traineeship, and had slightly lower rates of unemployment. The high achievers in VET tended to balance lower transition to university by higher transition to middle-level programs, and were more likely to begin a contract of training or to finish study and start work (Figures 16a and 16b).

0 20 40 60 80 100
University
VET Cert 4+
Entry-level VET
Apprentice/Trainee
Employed
Unemployed
Non-VETVETLow achievers
(lowest GAT quartile)
GAT level (%)
> Destinations by language background and Indigenous statusThe sample included 62 respondents who identified as Aboriginal or Torres Strait Islander. Comparison of the destinations of this small group with the rest of the sample shows that Indigenous Year 12 completers were much less likely than their non-Indigenous peers to enrol in tertiary study, and much more likely to be employed, contracted as an apprentice or trainee, or unemployed (Figure 17).
Figure 16a Destinations of VET and non-VET students by achievement level (GAT quartile): low achievers
����������
� �� �� �� �� ���
����������
�����������
���������������
������������������
��������
����������
�������������������������������������
�������������
Figure 16b Destinations of VET and non-VET students by achievement level (GAT quartile): high achievers
0 20 40 60 80 100
Non-Indigenous
Indigenous
%
Apprentice/Trainee
VET Cert 4+
Unemployed
Employed
VET Entry-level
University
Figure 17 Destinations of Indigenous and non-Indigenous Year 12 completers
Respondents were also asked about the main language spoken in their home during 2003. Figure 18 shows the destinations of Year 12 completers from different language backgrounds. At least 70 per cent of students from Mandarin and other Chinese-language backgrounds were enrolled in university, compared with less than half for all other groups, including students from primarily English-speaking backgrounds, except Vietnamese-speaking students, of whom 57 per cent were at university. Greek-, Arabic- and Turkish-speaking school completers were the most likely groups to enrol in middle-level
CHAPTER 2: Education and training destinations of Year 12 completers [ 19

20 ] The destinations of school leavers in Victoria
VET courses. Year 12 completers from English-speaking backgrounds were the most likely to enter the workforce rather than continue in study or training, with 22 per cent employed. Of those who did not enter further education or training, the highest rates of unemployment were among the Vietnamese-speaking respondents.
> Socioeconomic status and student destinationsAchievement differences in Year 12 act as a relay for communicating social disadvantage. This is because there is a strong correlation between the two. Nearly two-thirds of all low achievers in Year 12 come from low to very low socioeconomic status backgrounds. The reverse is found among high achievers – two-thirds of them are drawn from high to very high socioeconomic status backgrounds (see Figure 19).
It is mainly through the ‘achievement relay’ that social inequalities in destinations occur. However, economic, financial and cultural (other than scholastic) factors also contribute. These include the need to find work, low income, unwillingness to invest in courses of uncertain value (low-prestige higher education and VET courses) (Teese 2002b), and a perception of tertiary education as being ‘irrelevant’.
0 10 20 30 40 50 60 70 80 90 100
Looking for work
Employed
Apprentice/Trainee
VET Entry-level
VET Cert 4+
University
Other
English
Turkish
Greek
Arabic
Vietnamese
Other Chinese
Mandarin
%
Figure 18 Destinations of Year 12 completers by language background
Note: A more comprehensive listing of transitions for young people from a wider range of language backgrounds (including those appearing in Figure 18) are given in Table 20, Appendix 1.
0
10
20
30
40
50
60
70
80
90
100
Highest SESUpper mid-SES
Lower mid-SESLowest SES
High achievers
Upper-mid achievers
Lower-mid achievers
Low achievers
%
Socioeconomic status (SES)
Achievement (GAT) band
Figure 19 Social background of Year 12 completers by achievement level (GAT band)

The combined effect of the achievement divide and economic and sociocultural factors is a pattern of marked social inequalities in post-Year 12 destinations. Table 5 contains an analysis of major education, training and workforce destinations by socioeconomic status and gender. Socioeconomic status is based on census collection district values of the home addresses of the students before they left home (ABS 2001).
Table 5 Destinations of school completers by socioeconomic status and gender
Socioeconomic Status
University VET Cert 4+Entry-level
VETApprentice/
TraineeEmployed Unemployed Total
(%) (%) (%) (%) (%) (%) (%)
Girls
Highest 64.4 15.6 4.0 1.6 12.6 1.8 100
Upper-mid 46.5 20.4 5.7 4.1 19.6 3.6 100
Lower-mid 37.3 21.3 6.6 5.9 24.2 4.7 100
Lowest 33.1 22.0 8.5 5.5 23.7 7.1 100
Total 45.0 19.9 6.2 4.3 20.2 4.4 100
Boys
Highest 58.4 16.9 4.0 4.1 13.7 2.8 100
Upper-mid 39.1 20.8 6.1 8.3 21.3 4.3 100
Lower-mid 30.7 20.0 6.0 11.5 26.1 5.8 100
Lowest 27.0 23.2 6.7 11.0 24.0 8.1 100
Total 39.2 20.2 5.6 8.6 21.1 5.2 100
All
Highest 61.4 16.3 4.0 2.8 13.2 2.3 100
Upper-mid 43.0 20.6 5.9 6.1 20.4 3.9 100
Lower-mid 34.3 20.7 6.3 8.4 25.1 5.2 100
Lowest 30.4 22.5 7.7 8.0 23.9 7.6 100
Total 42.3 20.0 6.0 6.3 20.6 4.7 100
Higher education, among the range of education and training destinations, exhibited the sharpest social trend. Girls from the most well-educated families were nearly twice as likely as those from the least educated to enter university (64 per cent compared to 33 per cent). Similarly, boys from the most advantaged households were more than twice as likely as those from the least advantaged to proceed directly from school to university (see Figure 20) (these estimates exclude deferees, who are classified according to their actual status in education, training or the workforce).
CHAPTER 2: Education and training destinations of Year 12 completers [ 21

22 ] The destinations of school leavers in Victoria
0
10
20
30
40
50
60
70
Lowest
Lower-mid
Upper-mid
Highest
Lowest
Lower-mid
Upper-mid
Highest
%
64
46
3733
58
39
3127
Socioeconomic status
BoysGirls
Figure 20 Enrolment at university by socioeconomic status and gender
Middle-level training in TAFE/VET displayed a reverse trend – enrolment rates improved as socioeconomic status descended (see Figure 21). However, the social trend in middle-level enrolments was mild compared with that of higher education. Moreover, it failed to balance out chances of entering any form of tertiary education or training. For, whereas Year 12 graduates from upper socioeconomic status homes used diploma programs in TAFE/VET to add to already-high levels of tertiary education based on university, graduates from lower socioeconomic status homes failed even to catch up to these levels through their greater relative use of diploma programs (see Figure 22).
VET destinations generally increased in frequency, the further down the social scale. Thus girls from lower working-class families were more than twice as likely as their counterparts from upper middle-class families to enrol in an on-campus basic or skilled VET course and more than three times as likely to begin an apprenticeship or traineeship.
Boys from lower socioeconomic backgrounds were also more likely than those from higher socioeconomic backgrounds to enrol in a basic or skilled course (7 per cent compared to 4 per cent) and were more than twice as likely to enter a contract of training (see Figure 23).
0
10
20
30
40
50
60
70
Lowest
Lower-mid
Upper-mid
Highest
Lowest
Lower-mid
Upper-mid
Highest
%
16
20 21 2217
21 2023
BoysGirls
Socioeconomic status
Figure 21 Enrolment in middle-level VET by socioeconomic status and gender
0
10
20
30
40
50
60
70
80
90
Lowest
Lower-mid
Upper-mid
Highest
Lowest
Lower-mid
Upper-mid
Highest
%
Girls
UniversityVET Cert 4+
Boys
Socioeconomic status
Figure 22 Tertiary entrance by socioeconomic status and gender
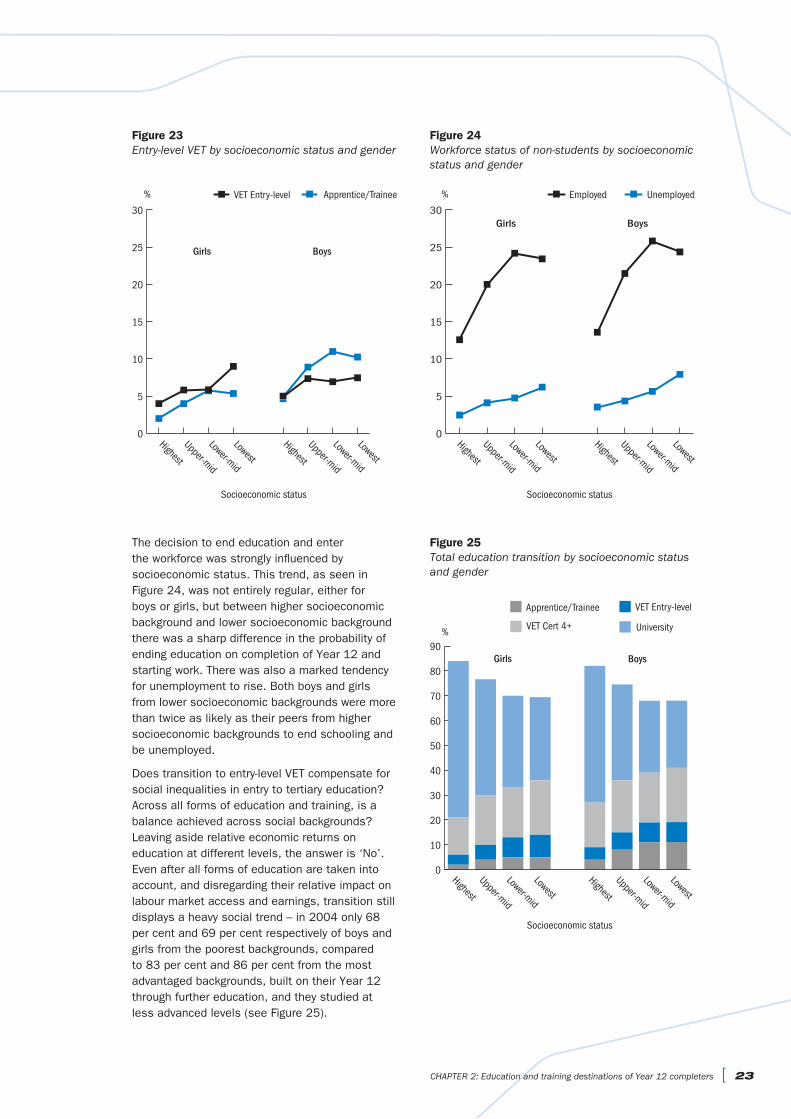
The decision to end education and enter the workforce was strongly influenced by socioeconomic status. This trend, as seen in Figure 24, was not entirely regular, either for boys or girls, but between higher socioeconomic background and lower socioeconomic background there was a sharp difference in the probability of ending education on completion of Year 12 and starting work. There was also a marked tendency for unemployment to rise. Both boys and girls from lower socioeconomic backgrounds were more than twice as likely as their peers from higher socioeconomic backgrounds to end schooling and be unemployed.
Does transition to entry-level VET compensate for social inequalities in entry to tertiary education? Across all forms of education and training, is a balance achieved across social backgrounds? Leaving aside relative economic returns on education at different levels, the answer is ‘No’. Even after all forms of education are taken into account, and disregarding their relative impact on labour market access and earnings, transition still displays a heavy social trend – in 2004 only 68 per cent and 69 per cent respectively of boys and girls from the poorest backgrounds, compared to 83 per cent and 86 per cent from the most advantaged backgrounds, built on their Year 12 through further education, and they studied at less advanced levels (see Figure 25).
0
5
10
15
20
25
30
Apprentice/TraineeVET Entry-level
Lowest
Lower-mid
Upper-mid
Highest
Lowest
Lower-mid
Upper-mid
Highest
%
Girls Boys
Socioeconomic status
Figure 23 Entry-level VET by socioeconomic status and gender
0
5
10
15
20
25
30
UnemployedEmployed
Lowest
Lower-mid
Upper-mid
Highest
Lowest
Lower-mid
Upper-mid
Highest
%
Girls Boys
Socioeconomic status
Figure 24 Workforce status of non-students by socioeconomic status and gender
0
10
20
30
40
50
60
70
80
90
VET Cert 4+
VET Entry-levelApprentice/Trainee
Lowest
Lower-mid
Upper-mid
Highest
Lowest
Lower-mid
Upper-mid
Highest
%
Girls
University
Boys
Socioeconomic status
Figure 25 Total education transition by socioeconomic status and gender
CHAPTER 2: Education and training destinations of Year 12 completers [ 23
24 ] The destinations of school leavers in Victoria
3Regional differences in post-Year 12 destinations
Across Victoria, the destinations of young people who have completed their Year 12 vary greatly. To enable destinations to be viewed in the context of economic and social indicators prepared by the Australian Bureau of Statistics, it is helpful to examine patterns at the level of statistical (or labour force) regions.
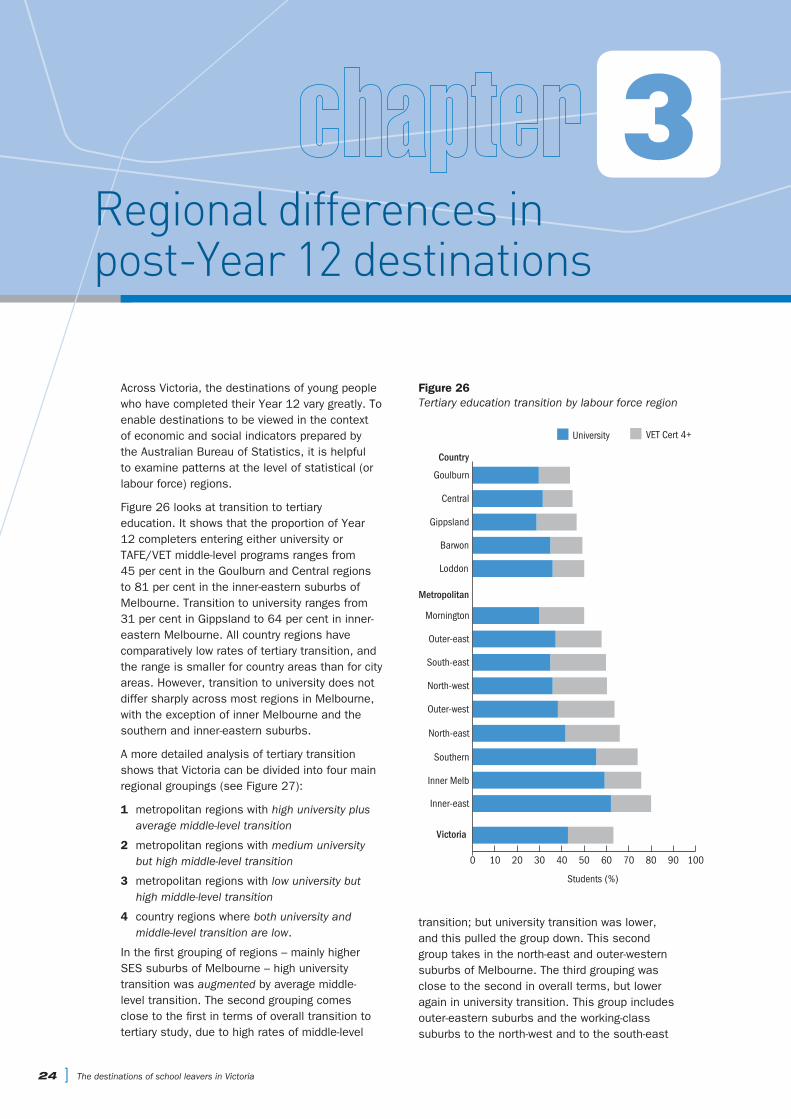
Figure 26 looks at transition to tertiary education. It shows that the proportion of Year 12 completers entering either university or TAFE/VET middle-level programs ranges from 45 per cent in the Goulburn and Central regions to 81 per cent in the inner-eastern suburbs of Melbourne. Transition to university ranges from 31 per cent in Gippsland to 64 per cent in inner-eastern Melbourne. All country regions have comparatively low rates of tertiary transition, and the range is smaller for country areas than for city areas. However, transition to university does not differ sharply across most regions in Melbourne, with the exception of inner Melbourne and the southern and inner-eastern suburbs.
A more detailed analysis of tertiary transition shows that Victoria can be divided into four main regional groupings (see Figure 27):
1 metropolitan regions with high university plus average middle-level transition
2 metropolitan regions with medium university but high middle-level transition
3 metropolitan regions with low university but high middle-level transition
4 country regions where both university and middle-level transition are low.
In the first grouping of regions – mainly higher SES suburbs of Melbourne – high university transition was augmented by average middle-level transition. The second grouping comes close to the first in terms of overall transition to tertiary study, due to high rates of middle-level
VET Cert 4+University
Inner Melb
Inner-east
North-east
Outer-west
North-west
South-east
Outer-east
Mornington
Barwon
Loddon
Central
Goulburn
Gippsland
0 10 20 30 40 50 60 70 80 90 100
Country
Metropolitan
Students (%)
Southern
Victoria
Figure 26 Tertiary education transition by labour force region
transition; but university transition was lower, and this pulled the group down. This second group takes in the north-east and outer-western suburbs of Melbourne. The third grouping was close to the second in overall terms, but lower again in university transition. This group includes outer-eastern suburbs and the working-class suburbs to the north-west and to the south-east

—15 —10 —5 0 5 10 15 20 25 30
VET Cert 4+University
Central
Goulburn
Gippsland
Loddon
Barwon
Mornington
North-west
South-east
Outer-west
North-east
Southern
Inner Melb
Inner-eastGroup 1high university transition, average VET
Group 2medium university transition, high VET
Group 3low university transition, high VET
Group 4low university transition, low VET
Country
Metropolitan
Outer-east
Students (%)
Figure 27 Differences in tertiary education transition by labour force region
of Melbourne, including the adjacent semi-rural Mornington Peninsula, where the transition pattern was more like that of country Victoria (see Figure 26). Country regions – the fourth grouping – had the lowest rates of tertiary transition, due to both low university transfer and low middle-level transfer.
Changing perspective to focus on transition to VET leads to a different ranking of regions. In some metropolitan regions, transition from Year 12 to any form of VET (including middle-level) involved as many as 38 per cent of school completers. These regions include the north-west, south-east and outer-west. By contrast, the wealthier southern, inner and inner-eastern suburbs of Melbourne had low rates of VET transition (between 22 per cent and 28 per cent) (see Figure 28). It is notable that while country Victoria had generally low rates of transfer from the VCE to university, total VET transition across all Australian Qualifications Framework (AQF) levels exceeded one-third of Year 12 completers only in Gippsland.
Country Victoria also had the highest rates of students ending education or training on Year 12 completion. Only Mornington Peninsula – which has a large rural segment – matched
Figure 28 VET transition by Australian Qualifications Framework level and labour force region
Apprentice/Trainee
VET Entry-level
VET Cert 4+
Gippsland
Goulburn
Barwon
Loddon
Central
North-west
Outer-west
South-east
North-east
Mornington
Outer-east
Southern
Inner Melb
Inner-east
0 10 20 30 40 50
Metropolitan
Country
Students (%)
CHAPTER 3: Regional differences in post-Year 12 destinations [ 25
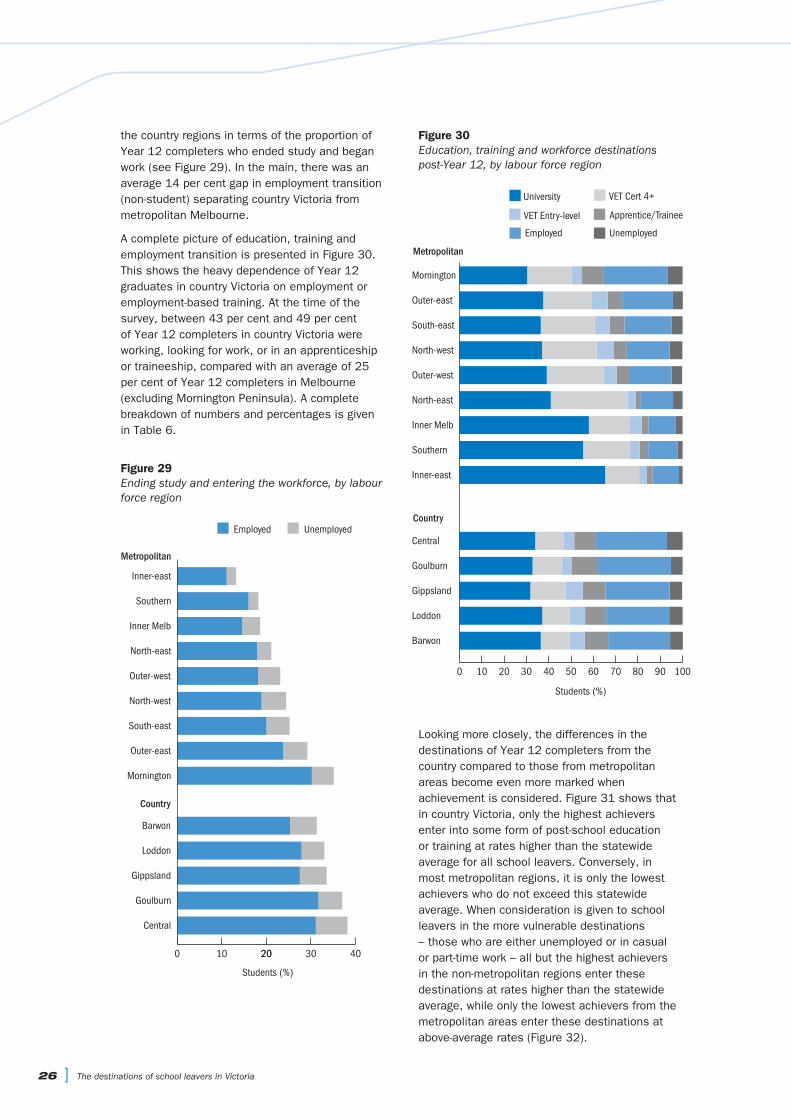
26 ] The destinations of school leavers in Victoria
the country regions in terms of the proportion of Year 12 completers who ended study and began work (see Figure 29). In the main, there was an average 14 per cent gap in employment transition (non-student) separating country Victoria from metropolitan Melbourne.
A complete picture of education, training and employment transition is presented in Figure 30. This shows the heavy dependence of Year 12 graduates in country Victoria on employment or employment-based training. At the time of the survey, between 43 per cent and 49 per cent of Year 12 completers in country Victoria were working, looking for work, or in an apprenticeship or traineeship, compared with an average of 25 per cent of Year 12 completers in Melbourne (excluding Mornington Peninsula). A complete breakdown of numbers and percentages is given in Table 6.
Figure 29 Ending study and entering the workforce, by labour force region
0 10 20 30 40
UnemployedEmployed
Central
Goulburn
Gippsland
Loddon
Barwon
Mornington
Outer-east
South-east
North-west
Outer-west
North-east
Inner Melb
Southern
Inner-east
20
Metropolitan
Country
Students (%)
Figure 30 Education, training and workforce destinations post-Year 12, by labour force region
0 10 20 30 40 50 60 70 80 90 100
UnemployedEmployed
Apprentice/TraineeVET Entry-level
VET Cert 4+University
Barwon
Loddon
Gippsland
Goulburn
Central
Inner-east
Southern
Inner Melb
North-east
Outer-west
North-west
South-east
Outer-east
Mornington
Metropolitan
Country
Students (%)
Looking more closely, the differences in the destinations of Year 12 completers from the country compared to those from metropolitan areas become even more marked when achievement is considered. Figure 31 shows that in country Victoria, only the highest achievers enter into some form of post-school education or training at rates higher than the statewide average for all school leavers. Conversely, in most metropolitan regions, it is only the lowest achievers who do not exceed this statewide average. When consideration is given to school leavers in the more vulnerable destinations – those who are either unemployed or in casual or part-time work – all but the highest achievers in the non-metropolitan regions enter these destinations at rates higher than the statewide average, while only the lowest achievers from the metropolitan areas enter these destinations at above-average rates (Figure 32).
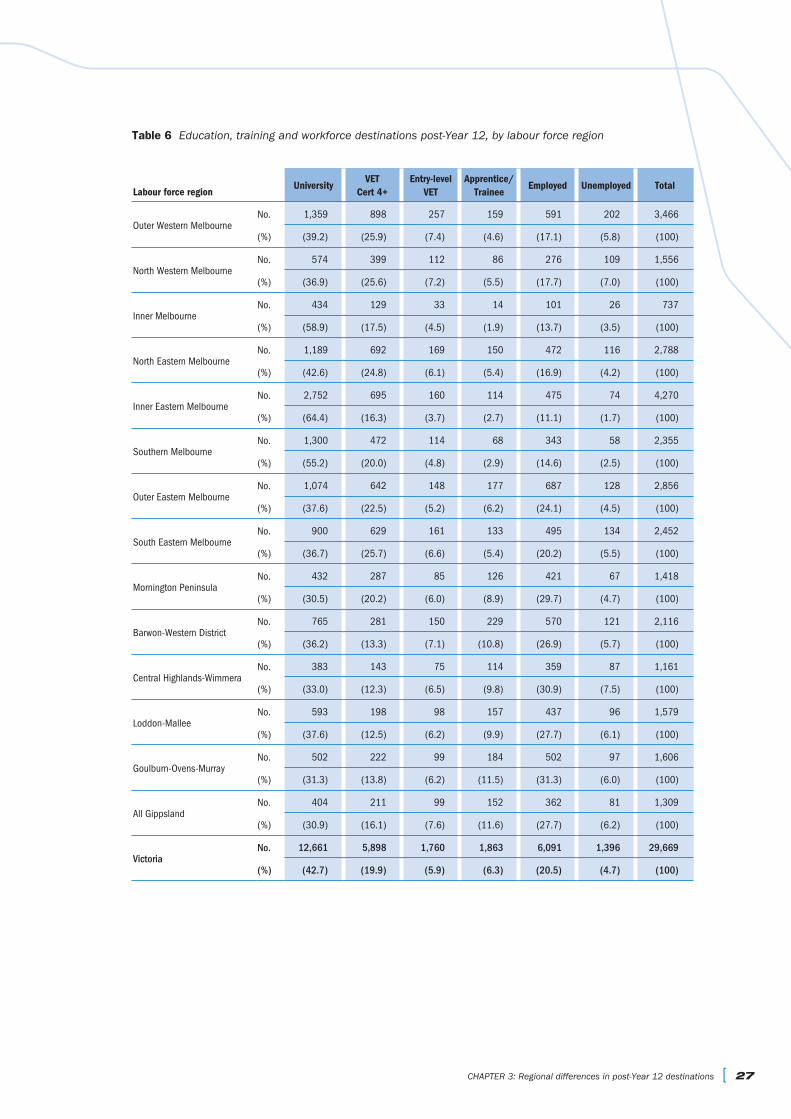
Table 6 Education, training and workforce destinations post-Year 12, by labour force region
Labour force regionUniversity
VET Cert 4+
Entry-level VET
Apprentice/Trainee
Employed Unemployed Total
Outer Western MelbourneNo. 1,359 898 257 159 591 202 3,466
(%) (39.2) (25.9) (7.4) (4.6) (17.1) (5.8) (100)
North Western MelbourneNo. 574 399 112 86 276 109 1,556
(%) (36.9) (25.6) (7.2) (5.5) (17.7) (7.0) (100)
Inner MelbourneNo. 434 129 33 14 101 26 737
(%) (58.9) (17.5) (4.5) (1.9) (13.7) (3.5) (100)
North Eastern MelbourneNo. 1,189 692 169 150 472 116 2,788
(%) (42.6) (24.8) (6.1) (5.4) (16.9) (4.2) (100)
Inner Eastern MelbourneNo. 2,752 695 160 114 475 74 4,270
(%) (64.4) (16.3) (3.7) (2.7) (11.1) (1.7) (100)
Southern MelbourneNo. 1,300 472 114 68 343 58 2,355
(%) (55.2) (20.0) (4.8) (2.9) (14.6) (2.5) (100)
Outer Eastern MelbourneNo. 1,074 642 148 177 687 128 2,856
(%) (37.6) (22.5) (5.2) (6.2) (24.1) (4.5) (100)
South Eastern MelbourneNo. 900 629 161 133 495 134 2,452
(%) (36.7) (25.7) (6.6) (5.4) (20.2) (5.5) (100)
Mornington PeninsulaNo. 432 287 85 126 421 67 1,418
(%) (30.5) (20.2) (6.0) (8.9) (29.7) (4.7) (100)
Barwon-Western DistrictNo. 765 281 150 229 570 121 2,116
(%) (36.2) (13.3) (7.1) (10.8) (26.9) (5.7) (100)
Central Highlands-WimmeraNo. 383 143 75 114 359 87 1,161
(%) (33.0) (12.3) (6.5) (9.8) (30.9) (7.5) (100)
Loddon-MalleeNo. 593 198 98 157 437 96 1,579
(%) (37.6) (12.5) (6.2) (9.9) (27.7) (6.1) (100)
Goulburn-Ovens-MurrayNo. 502 222 99 184 502 97 1,606
(%) (31.3) (13.8) (6.2) (11.5) (31.3) (6.0) (100)
All GippslandNo. 404 211 99 152 362 81 1,309
(%) (30.9) (16.1) (7.6) (11.6) (27.7) (6.2) (100)
VictoriaNo. 12,661 5,898 1,760 1,863 6,091 1,396 29,669
(%) (42.7) (19.9) (5.9) (6.3) (20.5) (4.7) (100)
CHAPTER 3: Regional differences in post-Year 12 destinations [ 27

28 ] The destinations of school leavers in Victoria
Figure 31 Transition of Year 12 completers to education or training, by labour force region and achievement level (GAT band)
GIGOLOCEBAMPSEOESOIENEINNWOW-30
-20
-10
0
10
20
30
Percentage deviation from Statewide level of 75%
Upper-mid GATHighest GAT Lowest GATLower-mid GAT
Labour force region*
Figure 32 Transition of Year 12 completers to part-time and casual work or to unemployment, by region and achievement level (GAT band)
GIGOLOCEBAMPSEOESOIENEINNWOW-20
-15
-10
-5
0
5
10
15
20
Upper-mid GATHighest GAT Lowest GATLower-mid GATPercentage deviation from Statewide level of 18%
Labour force region*
*See page vii for full names.
*See page vii for full names.
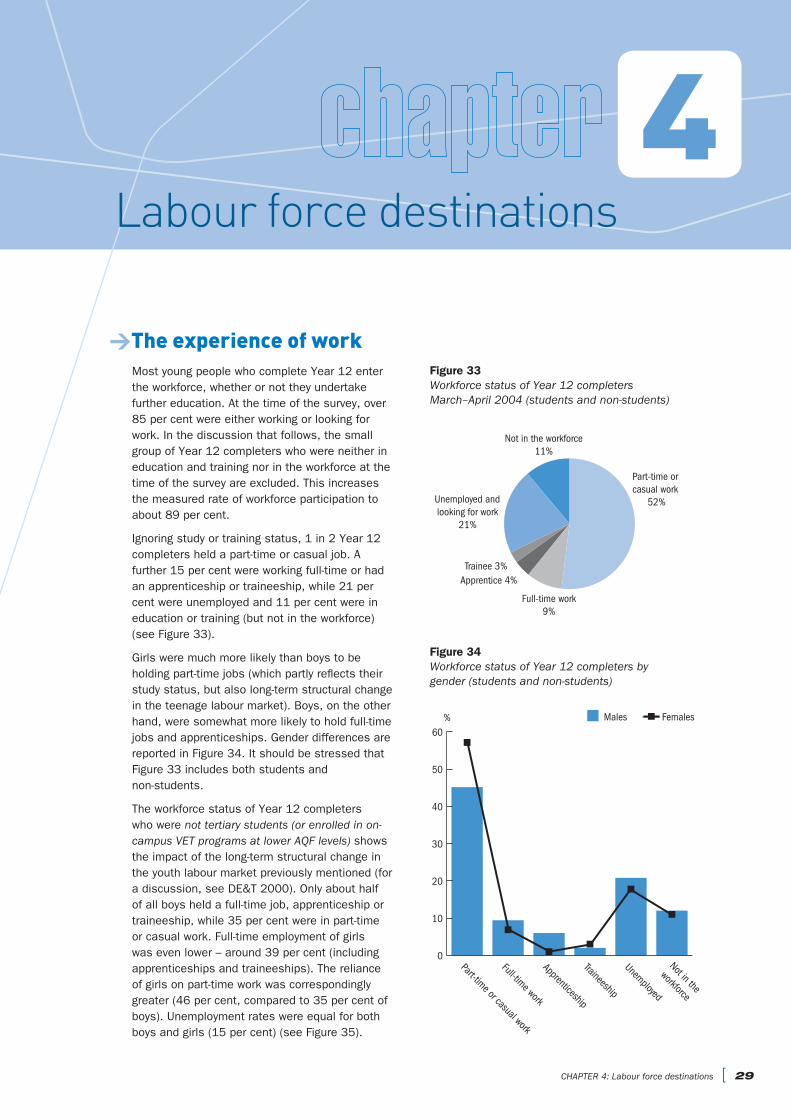
Labour force destinations4
>The experience of workMost young people who complete Year 12 enter the workforce, whether or not they undertake further education. At the time of the survey, over 85 per cent were either working or looking for work. In the discussion that follows, the small group of Year 12 completers who were neither in education and training nor in the workforce at the time of the survey are excluded. This increases the measured rate of workforce participation to about 89 per cent.
Ignoring study or training status, 1 in 2 Year 12 completers held a part-time or casual job. A further 15 per cent were working full-time or had an apprenticeship or traineeship, while 21 per cent were unemployed and 11 per cent were in education or training (but not in the workforce) (see Figure 33).
Girls were much more likely than boys to be holding part-time jobs (which partly reflects their study status, but also long-term structural change in the teenage labour market). Boys, on the other hand, were somewhat more likely to hold full-time jobs and apprenticeships. Gender differences are reported in Figure 34. It should be stressed that Figure 33 includes both students and non-students.
The workforce status of Year 12 completers who were not tertiary students (or enrolled in on-campus VET programs at lower AQF levels) shows the impact of the long-term structural change in the youth labour market previously mentioned (for a discussion, see DE&T 2000). Only about half of all boys held a full-time job, apprenticeship or traineeship, while 35 per cent were in part-time or casual work. Full-time employment of girls was even lower – around 39 per cent (including apprenticeships and traineeships). The reliance of girls on part-time work was correspondingly greater (46 per cent, compared to 35 per cent of boys). Unemployment rates were equal for both boys and girls (15 per cent) (see Figure 35).
Figure 34 Workforce status of Year 12 completers by gender (students and non-students)
0
10
20
30
40
50
60
FemalesMales
Not in the
workforce
Unemployed
Traineeship
Apprenticeship
Full-time work
Part-time or casual work
%
Figure 33 Workforce status of Year 12 completers March–April 2004 (students and non-students)
Part-time or casual work
52%
Full-time work9%
Apprentice 4%Trainee 3%
Unemployed andlooking for work
21%
Not in the workforce11%
CHAPTER 4: Labour force destinations [ 29
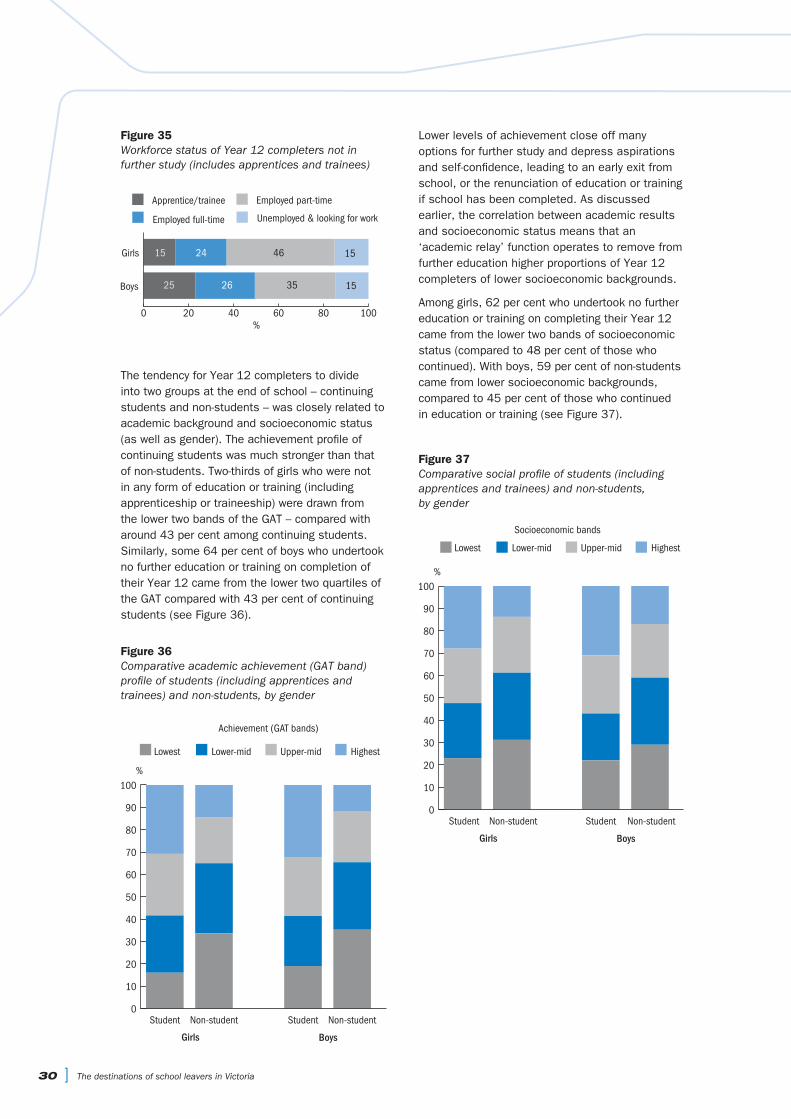
30 ] The destinations of school leavers in Victoria
The tendency for Year 12 completers to divide into two groups at the end of school – continuing students and non-students – was closely related to academic background and socioeconomic status (as well as gender). The achievement profile of continuing students was much stronger than that of non-students. Two-thirds of girls who were not in any form of education or training (including apprenticeship or traineeship) were drawn from the lower two bands of the GAT – compared with around 43 per cent among continuing students. Similarly, some 64 per cent of boys who undertook no further education or training on completion of their Year 12 came from the lower two quartiles of the GAT compared with 43 per cent of continuing students (see Figure 36).
Figure 35 Workforce status of Year 12 completers not in further study (includes apprentices and trainees)
0 20 40 60 80 100
Unemployed & looking for work
Employed part-time
Employed full-time
Apprentice/trainee
Boys
Girls 15 24 46 15
25 26 35 15
%
Lower levels of achievement close off many options for further study and depress aspirations and self-confidence, leading to an early exit from school, or the renunciation of education or training if school has been completed. As discussed earlier, the correlation between academic results and socioeconomic status means that an ‘academic relay’ function operates to remove from further education higher proportions of Year 12 completers of lower socioeconomic backgrounds.
Among girls, 62 per cent who undertook no further education or training on completing their Year 12 came from the lower two bands of socioeconomic status (compared to 48 per cent of those who continued). With boys, 59 per cent of non-students came from lower socioeconomic backgrounds, compared to 45 per cent of those who continued in education or training (see Figure 37).
Figure 36 Comparative academic achievement (GAT band) profile of students (including apprentices and trainees) and non-students, by gender
0
10
20
30
40
50
60
70
80
90
100
HighestLower-midLowest
Non-studentStudentNon-studentStudent
%
Girls
Upper-mid
Boys
Achievement (GAT bands)
Figure 37 Comparative social profile of students (including apprentices and trainees) and non-students, by gender
0
10
20
30
40
50
60
70
80
90
100
Non-studentStudentNon-studentStudent
%
Girls Boys
HighestLower-midLowest Upper-mid
Socioeconomic bands

The trend away from further education on completion of the Year 12 was strongest in country Victoria. Between 30 per cent and 40 per cent of country students ended any involvement in education or training (at least in the short term). In Melbourne, by contrast, there was a much stronger trend to continue in education and training. Across the metropolitan area, the proportion of continuing students (including
Figure 38 Regional differences in the proportion of young people continuing in education or training on completion of Year 12
0
10
20
30
40
50
60
70
80
90
100
Non-studentStudent
CEGOGILOBAMPOESENWOWNEINSOIE
%
Metropolitan Country
NOTE: See page vii for full Labour Force Region names.
apprentices and trainees) ranged from about 66 per cent to as high as 87 per cent (with semi-rural Mornington Peninsula having a profile indistinguishable from country regions) (see Figure 38).
Table 7 provides an analysis of workforce destinations broken down by study status and gender.
CHAPTER 4: Labour force destinations [ 31
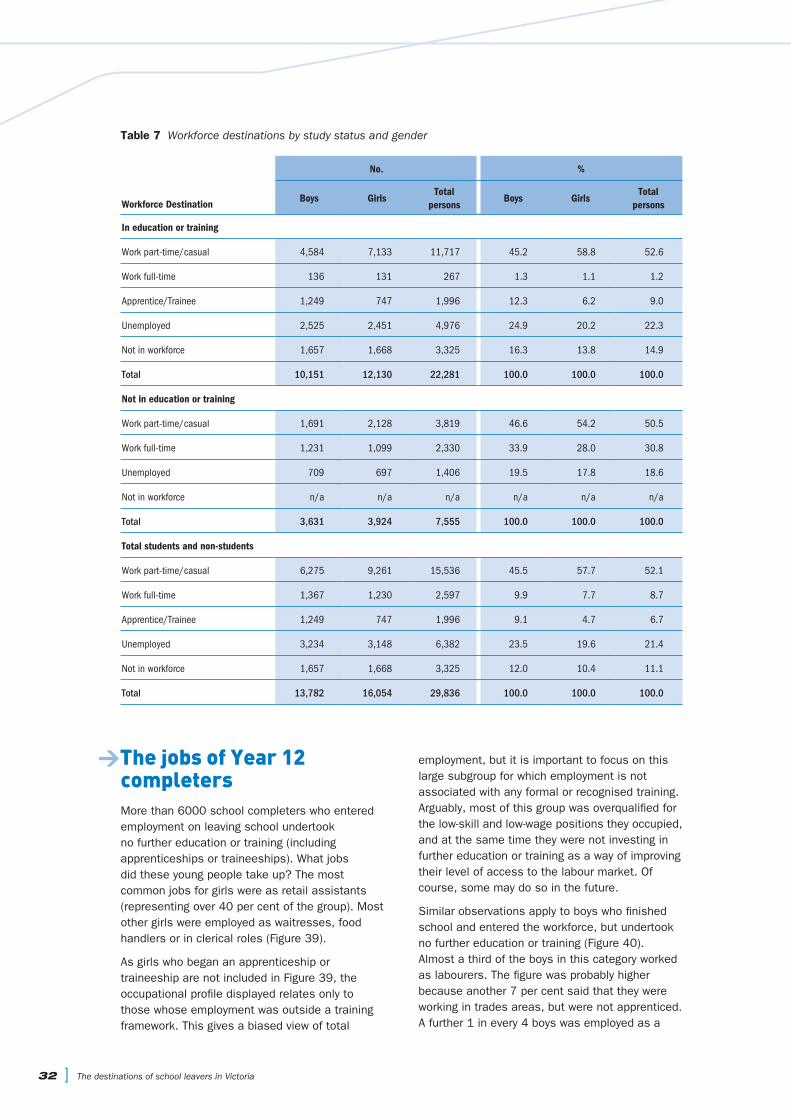
32 ] The destinations of school leavers in Victoria
Table 7 Workforce destinations by study status and gender
No. %
Workforce Destination Boys GirlsTotal
personsBoys Girls
Totalpersons
In education or training
Work part-time/casual 4,584 7,133 11,717 45.2 58.8 52.6
Work full-time 136 131 267 1.3 1.1 1.2
Apprentice/Trainee 1,249 747 1,996 12.3 6.2 9.0
Unemployed 2,525 2,451 4,976 24.9 20.2 22.3
Not in workforce 1,657 1,668 3,325 16.3 13.8 14.9
Total 10,151 12,130 22,281 100.0 100.0 100.0
Not in education or training
Work part-time/casual 1,691 2,128 3,819 46.6 54.2 50.5
Work full-time 1,231 1,099 2,330 33.9 28.0 30.8
Unemployed 709 697 1,406 19.5 17.8 18.6
Not in workforce n/a n/a n/a n/a n/a n/a
Total 3,631 3,924 7,555 100.0 100.0 100.0
Total students and non-students
Work part-time/casual 6,275 9,261 15,536 45.5 57.7 52.1
Work full-time 1,367 1,230 2,597 9.9 7.7 8.7
Apprentice/Trainee 1,249 747 1,996 9.1 4.7 6.7
Unemployed 3,234 3,148 6,382 23.5 19.6 21.4
Not in workforce 1,657 1,668 3,325 12.0 10.4 11.1
Total 13,782 16,054 29,836 100.0 100.0 100.0
>The jobs of Year 12 completersMore than 6000 school completers who entered employment on leaving school undertook no further education or training (including apprenticeships or traineeships). What jobs did these young people take up? The most common jobs for girls were as retail assistants (representing over 40 per cent of the group). Most other girls were employed as waitresses, food handlers or in clerical roles (Figure 39).
As girls who began an apprenticeship or traineeship are not included in Figure 39, the occupational profile displayed relates only to those whose employment was outside a training framework. This gives a biased view of total
employment, but it is important to focus on this large subgroup for which employment is not associated with any formal or recognised training. Arguably, most of this group was overqualified for the low-skill and low-wage positions they occupied, and at the same time they were not investing in further education or training as a way of improving their level of access to the labour market. Of course, some may do so in the future.
Similar observations apply to boys who finished school and entered the workforce, but undertook no further education or training (Figure 40). Almost a third of the boys in this category worked as labourers. The figure was probably higher because another 7 per cent said that they were working in trades areas, but were not apprenticed. A further 1 in every 4 boys was employed as a
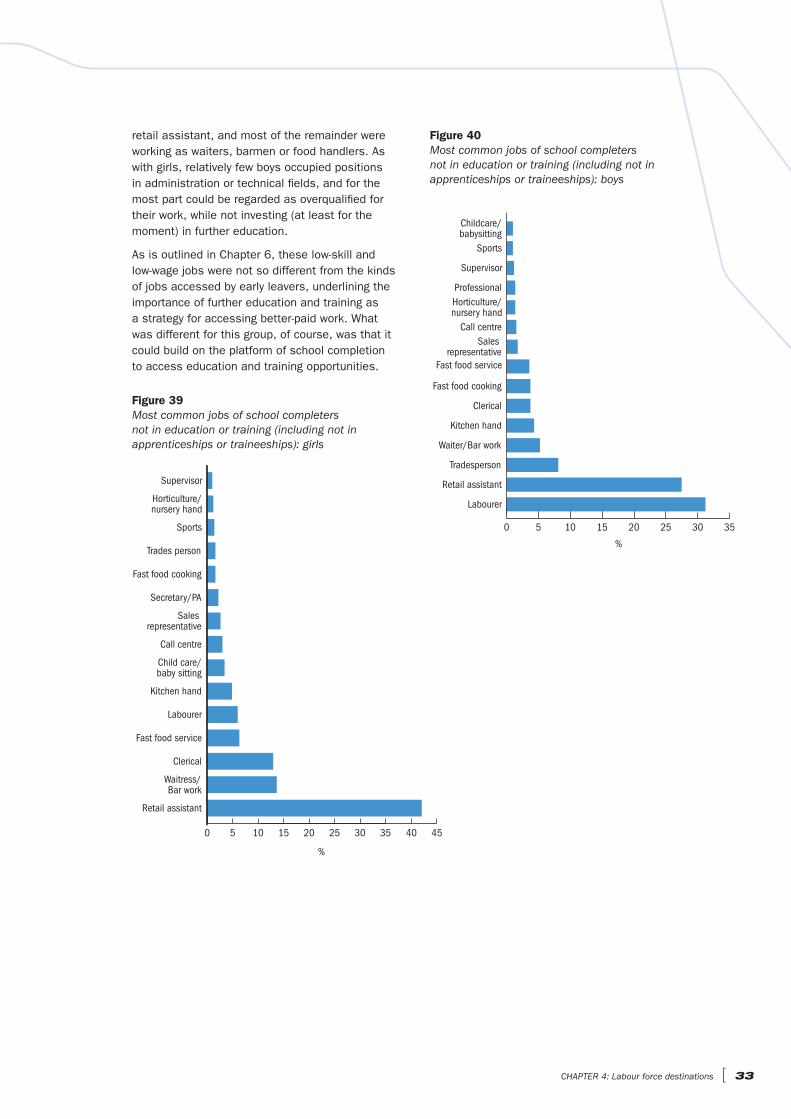
0 5 10 15 20 25 30 35
Labourer
Retail assistant
Tradesperson
Waiter/Bar work
Kitchen hand
Clerical
Fast food cooking
Fast food service
Sales representative
Call centre
Horticulture/nursery hand
Professional
Supervisor
Sports
Childcare/babysitting
%
0 5 10 15 20 25 30 35
Retail assistant
Waitress/Bar work
Clerical
Fast food service
Labourer
Kitchen hand
Child care/baby sitting
Call centre
Sales representative
Secretary/PA
Fast food cooking
Trades person
Sports
Horticulture/nursery hand
Supervisor
40 45
%
retail assistant, and most of the remainder were working as waiters, barmen or food handlers. As with girls, relatively few boys occupied positions in administration or technical fields, and for the most part could be regarded as overqualified for their work, while not investing (at least for the moment) in further education.
As is outlined in Chapter 6, these low-skill and low-wage jobs were not so different from the kinds of jobs accessed by early leavers, underlining the importance of further education and training as a strategy for accessing better-paid work. What was different for this group, of course, was that it could build on the platform of school completion to access education and training opportunities.
Figure 40 Most common jobs of school completers not in education or training (including not in apprenticeships or traineeships): boys
Figure 39 Most common jobs of school completers not in education or training (including not in apprenticeships or traineeships): girls
CHAPTER 4: Labour force destinations [ 33

34 ] The destinations of school leavers in Victoria
5Reasons for Year 12 completers not continuing in study
>Statewide perspectiveWhile a majority of Year 12 completers seek to build on their schooling through further study or training, many do not. The reasons for this are complex and reflect the diversity of groups that today finish school. Given the pressures of study while at school and the uncertainties surrounding the next steps that young people take on leaving school, the expectation that all or most should continue in education or training directly they leave school needs to be tempered. However, the range of jobs obtained by those who end their studies – and for which they are frequently overqualified – suggests that young people should, over time, undertake further education, and that they should have access to flexible arrangements.
Broadly speaking, three groups of responses for not being in further study (as distinct from training) can be distinguished from the survey:
perceptions of timeliness
economic and financial impediments
perceptions of relevance or academic accessibility.
The feeling of not being ready for more study was the largest single reason cited by Year 12 exit students. It was flagged by nearly two-thirds of girls and almost as many (59 per cent) of all boys (see Figure 41).
The costs of study and the difficulty of supporting oneself while studying are the two most important economic impediments. These factors were cited by 39 per cent and 37 per cent respectively of all VCE completers (girls and boys combined). Smaller proportions of school completers also cited excessive travel and the associated costs of this travel (19 and 24 per cent respectively, girls and boys combined), the need to move out
of home in order to study (16 per cent) and family commitments (10 per cent).
Just over a quarter of Year 12 completers who were not in study claimed that this was because they did not receive a tertiary offer. One in five were not studying due to a perception that they might not cope with the demands of tertiary study. Smaller proportions of Year 12 completers cited a lack of information as a reason for not pursuing further education (12 per cent), and a perception that tertiary study was irrelevant. Irrelevance was cited by 20 per cent of boys but only 12 per cent of girls. As is discussed below, the ‘not ready’ motive is different in nature from the perception that further study would not be ‘relevant’.
Have to leave home
Cost of travel
BoysGirls
No information
Irrelevant
Not ready
Not sure I’d cope
No offer
Family commitments
Too much travel
CostsHard to support self
%
0
10
20
30
40
50
60
70
Figure 41 Reasons for not studying: Year 12 completers by gender

Some of the factors associated with the decision not to continue in study are pervasive and were reported by similar proportions of Year 12 completers, whatever their academic or socioeconomic background. These related to cost factors and academic impediments.
However, some factors are influenced by academic background or socioeconomic status (or both). The perception of not being ‘ready’ for more study – with its implication of a possible return – was strongest among high achievers, which is perhaps to be expected. Two-thirds of this group cited this as a motive, compared to 59 per cent of low achievers (see Figure 42).
0
10
20
30
40
50
60
70
Family commitments
No information
Irrelevant
Not sure I’d cope
Not ready
HighestUpper-midLower-midLowest
%
Achievement band (GAT quartiles)
Figure 42 Reasons for not studying: Year 12 completers by achievement level (GAT band)
By contrast, the perception of ‘irrelevance’ tends to rise as achievement falls. It concerned 21 per cent of the weakest learners compared with only 8 per cent of the highest achievers. Family commitments and a concern about an inability to cope with the work involved were cited more frequently as level of achievement fell, as was lack of information about tertiary study. Low achievement appeared to ‘switch off’ any potential interest in further study as a route to personal or economic advancement and to focus attention on the possibilities of work (or family).
So far the discussion has considered the responses of Year 12 completers who at the time of the survey had not been in post-school study since leaving school, or had enrolled, but discontinued. Another large group is deferees. The On Track survey contacted about 1876 respondents in this group (6.3 per cent of the overall sample). The motives of deferees were similar in important respects to other Year 12 completers who do not undertake further study. The costs of study deterred 38 per cent and the difficulty of supporting oneself while studying also weighed heavily. Travel, too, was a factor. Academic impediments were also relevant, even though deferees had already been offered places and had accepted them. It is clear that 10 per cent did not get the offer they wanted or failed to get into the course of their choice. But the biggest motive for deferees was the ‘lack of readiness’ perception, which affected over two-thirds of the group (see Figure 43).
Too much travel
Cost of travel
Irrelevant
No information
Not ready
No offer
Not sure I’d cope
Family commitments
Have to leave home
Hard to support self
Costs of study
%
0
10
20
30
40
50
60
70
Figure 43 Reasons for not studying: deferring students
When the effect of achievement is excluded, the reasons given by school completers for not entering into tertiary education continue to vary across groups from different socioeconomic backgrounds (Figure 44). In the highest GAT achievement band, the financial considerations associated with further study – not surprisingly – weighed more heavily on Year 12 completers from poorer backgrounds, and, to a lesser extent, travel considerations were more likely to be a factor with these students.
CHAPTER 5: Reasons for Year 12 completers not continuing in study [ 35
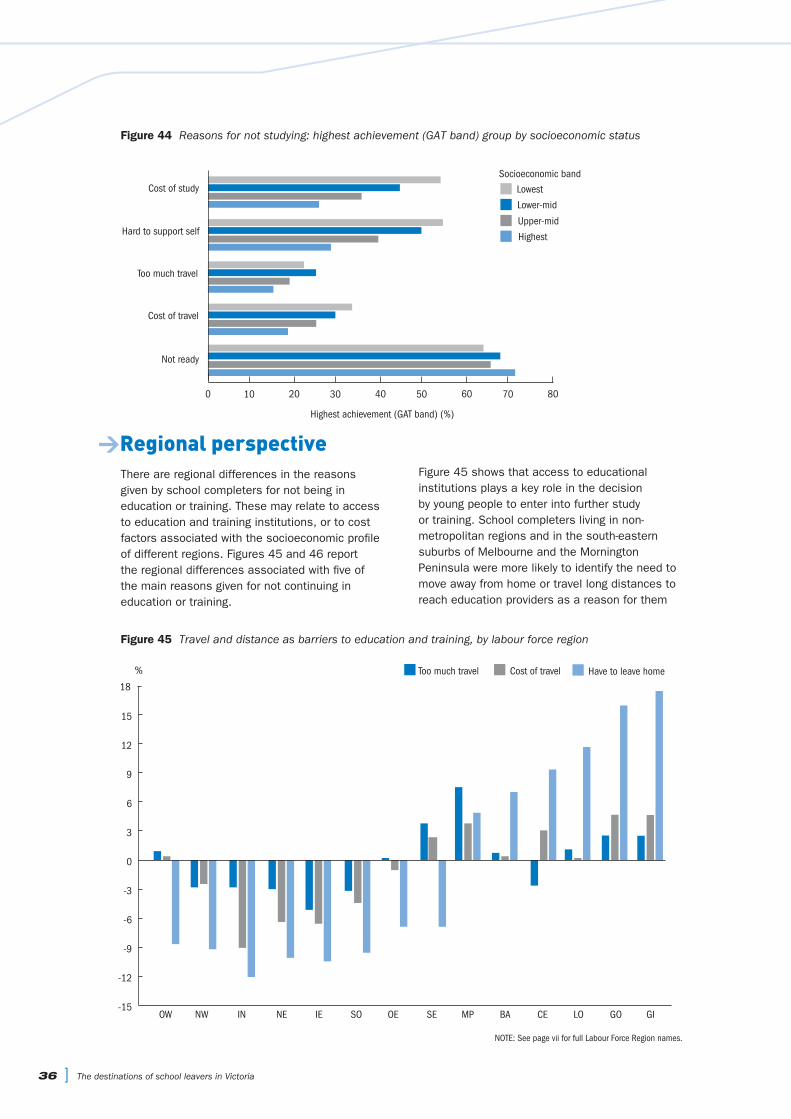
36 ] The destinations of school leavers in Victoria
>Regional perspectiveThere are regional differences in the reasons given by school completers for not being in education or training. These may relate to access to education and training institutions, or to cost factors associated with the socioeconomic profile of different regions. Figures 45 and 46 report the regional differences associated with five of the main reasons given for not continuing in education or training.
Figure 44 Reasons for not studying: highest achievement (GAT band) group by socioeconomic status
0 20 40 60 80
Not ready
Cost of travel
Too much travel
Hard to support self
Cost of study
Highest achievement (GAT band) (%)
Lowest
Lower-mid
10 30 50 70
Upper-mid
Highest
Socioeconomic band
Figure 45 shows that access to educational institutions plays a key role in the decision by young people to enter into further study or training. School completers living in non-metropolitan regions and in the south-eastern suburbs of Melbourne and the Mornington Peninsula were more likely to identify the need to move away from home or travel long distances to reach education providers as a reason for them
Cost of travelToo much travel
GIGOLOCEBAMPSEOESOIENEINNWOW-15
-12
-9
-6
-3
0
3
6
9
12
15
%
18
Have to leave home
Figure 45 Travel and distance as barriers to education and training, by labour force region
NOTE: See page vii for full Labour Force Region names.

no longer being in study or training. The costs associated with travel were also more likely to be nominated by school leavers living in most of these areas. Similarly, the costs associated with study and the difficulty of supporting oneself during study were more likely to be nominated by young people living in the non-metropolitan regions (although not all of them) and in the outer-east and south-east of Melbourne and the Mornington Peninsula, possibly indicating greater financial pressures acting on those who live outside the city (Figure 46).
This regional perspective indicates that barriers associated with access and socioeconomic pressures tend to affect young people living in the country more than those living in Melbourne.
However, the effect of financial pressures can also be seen in some regions of Melbourne, mostly those with a lower socioeconomic profile. And in the Mornington Peninsula, it can be seen that both financial and access issues emerge as important.
The longitudinal perspective to be provided next year by a follow-up survey of a subsample of the 2003 Year 12 cohort, will assist in identifying the role of access as a barrier to further education and training in the longer term. It will also allow an assessment to be made of the longer-term pathways of those respondents who have deferred their university places and will provide input into the policy debate regarding the nature and accessibility of tertiary options.
Cost of studyHard to support self
GIGOLOCEBAMPSEOESOIENEINNWOW
%
-10
-8
-6
-4
-2
0
2
4
6
8
10
Figure 46 Financial barriers to education and training, by labour force region
NOTE: See page vii for full Labour Force Region names
CHAPTER 5: Reasons for Year 12 completers not continuing in study [ 37

38 ] The destinations of school leavers in Victoria
6Early leaver destinations
Just over half of the early school leavers in the survey undertook some form of education or training in their first year out from school (around 51 per cent). This means that almost half did not. For girls, the most frequent education or training destination was a basic VET course (29 per cent), with apprenticeships and traineeships accounting for a further 7 per cent and 8 per cent respectively. For boys, apprenticeships dominated (32 per cent), followed by basic VET courses (19 per cent) and traineeships (4 per cent).
Female early leavers were much less likely than their male counterparts to be in education or training. About 55 per cent entered the workforce without undertaking further education or training, compared with 45 per cent of boys. Main destinations by gender are reported in Figure 47. Table 8 shows that the proportions of early leavers in each destination has remained similar since the previous (2003) On Track survey, although in 2004 there were fewer early leavers entering apprenticeships and more entering employment compared with the 2003 report.
0
5
10
15
20
25
30
35
40GirlsBoys
UnemployedEmployedTrainee
Destinations
ApprenticeVET
%
Figure 47 Destinations of early leavers by gender
Table 8 Comparison of 2003 and 2004 early leaving destinations by gender
2003 2004
DestinationBoys(%)
Girls(%)
Total(%)
Boys(%)
Girls(%)
Total(%)
VET 20.1 28.9 23.0 19.2 28.8 22.4
Apprentice 37.3 11.4 28.7 31.7 7.4 23.5
Trainee 4.1 8.0 5.4 3.7 8.4 5.3
Employed 24.3 29.0 25.9 27.1 34.5 29.6
Unemployed 14.2 22.6 17.0 18.3 20.9 19.2
Total 100.0 100.0 100.0 100.0 100.0 100.0
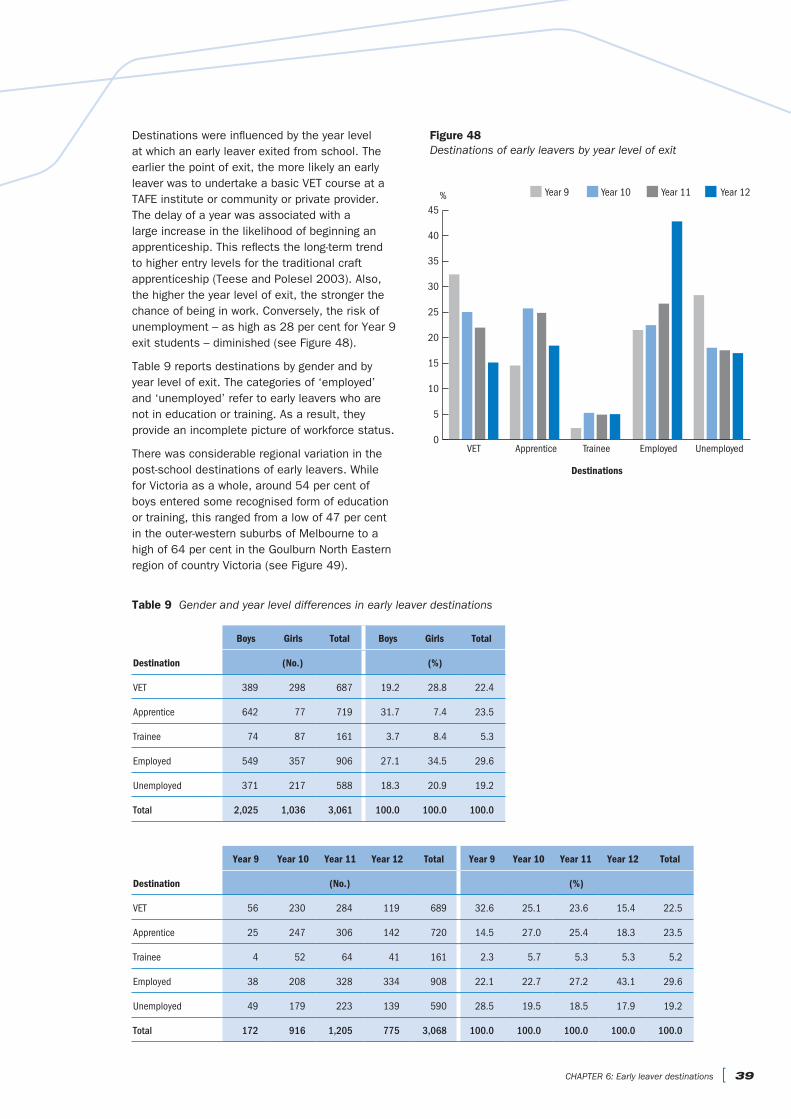
Destinations were influenced by the year level at which an early leaver exited from school. The earlier the point of exit, the more likely an early leaver was to undertake a basic VET course at a TAFE institute or community or private provider. The delay of a year was associated with a large increase in the likelihood of beginning an apprenticeship. This reflects the long-term trend to higher entry levels for the traditional craft apprenticeship (Teese and Polesel 2003). Also, the higher the year level of exit, the stronger the chance of being in work. Conversely, the risk of unemployment – as high as 28 per cent for Year 9 exit students – diminished (see Figure 48).
Table 9 reports destinations by gender and by year level of exit. The categories of ‘employed’ and ‘unemployed’ refer to early leavers who are not in education or training. As a result, they provide an incomplete picture of workforce status.
There was considerable regional variation in the post-school destinations of early leavers. While for Victoria as a whole, around 54 per cent of boys entered some recognised form of education or training, this ranged from a low of 47 per cent in the outer-western suburbs of Melbourne to a high of 64 per cent in the Goulburn North Eastern region of country Victoria (see Figure 49).
0
5
10
15
20
25
30
35
Year 11Year 10Year 9
UnemployedEmployedTrainee
Destinations
ApprenticeVET
40
45% Year 12
Figure 48 Destinations of early leavers by year level of exit
Table 9 Gender and year level differences in early leaver destinations
Boys Girls Total Boys Girls Total
Destination (No.) (%)
VET 389 298 687 19.2 28.8 22.4
Apprentice 642 77 719 31.7 7.4 23.5
Trainee 74 87 161 3.7 8.4 5.3
Employed 549 357 906 27.1 34.5 29.6
Unemployed 371 217 588 18.3 20.9 19.2
Total 2,025 1,036 3,061 100.0 100.0 100.0
Year 9 Year 10 Year 11 Year 12 Total Year 9 Year 10 Year 11 Year 12 Total
Destination (No.) (%)
VET 56 230 284 119 689 32.6 25.1 23.6 15.4 22.5
Apprentice 25 247 306 142 720 14.5 27.0 25.4 18.3 23.5
Trainee 4 52 64 41 161 2.3 5.7 5.3 5.3 5.2
Employed 38 208 328 334 908 22.1 22.7 27.2 43.1 29.6
Unemployed 49 179 223 139 590 28.5 19.5 18.5 17.9 19.2
Total 172 916 1,205 775 3,068 100.0 100.0 100.0 100.0 100.0
CHAPTER 6: Early leaver destinations [ 39
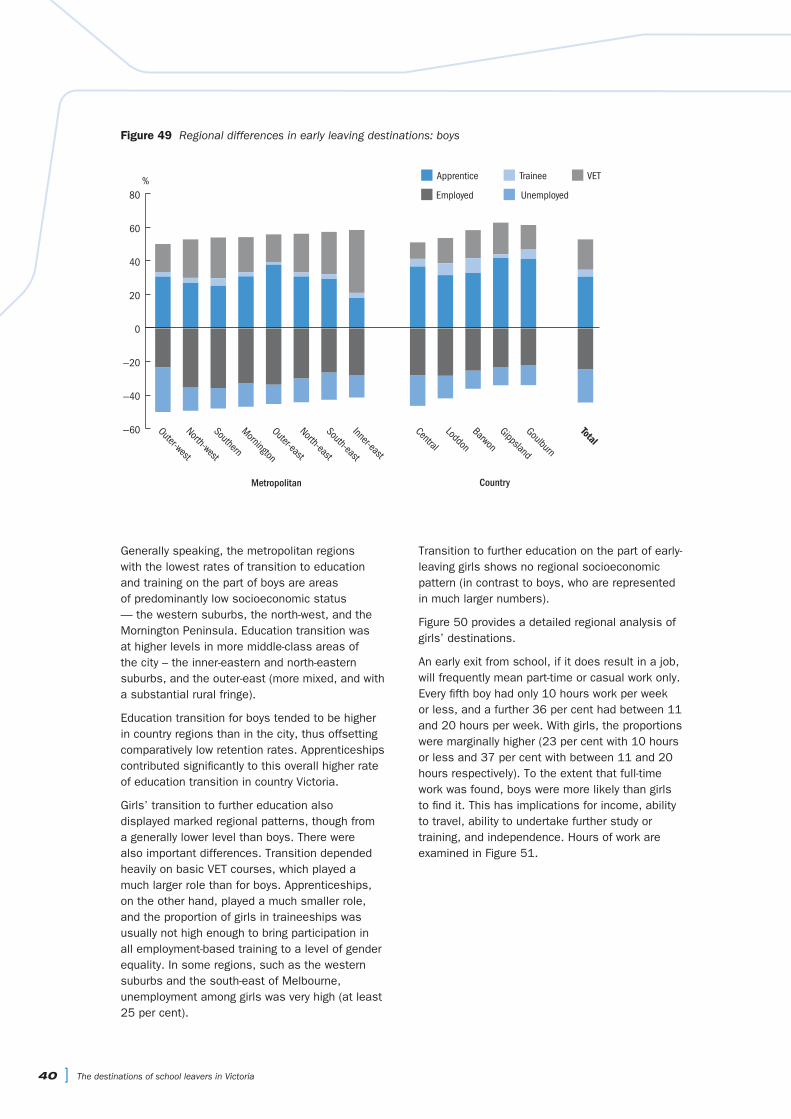
40 ] The destinations of school leavers in Victoria
Generally speaking, the metropolitan regions with the lowest rates of transition to education and training on the part of boys are areas of predominantly low socioeconomic status — the western suburbs, the north-west, and the Mornington Peninsula. Education transition was at higher levels in more middle-class areas of the city – the inner-eastern and north-eastern suburbs, and the outer-east (more mixed, and with a substantial rural fringe).
Education transition for boys tended to be higher in country regions than in the city, thus offsetting comparatively low retention rates. Apprenticeships contributed significantly to this overall higher rate of education transition in country Victoria.
Girls’ transition to further education also displayed marked regional patterns, though from a generally lower level than boys. There were also important differences. Transition depended heavily on basic VET courses, which played a much larger role than for boys. Apprenticeships, on the other hand, played a much smaller role, and the proportion of girls in traineeships was usually not high enough to bring participation in all employment-based training to a level of gender equality. In some regions, such as the western suburbs and the south-east of Melbourne, unemployment among girls was very high (at least 25 per cent).
Figure 49 Regional differences in early leaving destinations: boys
—60
—40
—20
0
20
40
60
80
VETTraineeApprentice
TotalGoulburn
Gippsland
Barwon
Loddon
Central
Inner-east
South-east
North-east
Outer-east
Mornington
Southern
North-west
Outer-west
%UnemployedEmployed
Metropolitan Country
Transition to further education on the part of early-leaving girls shows no regional socioeconomic pattern (in contrast to boys, who are represented in much larger numbers).
Figure 50 provides a detailed regional analysis of girls’ destinations.
An early exit from school, if it does result in a job, will frequently mean part-time or casual work only. Every fifth boy had only 10 hours work per week or less, and a further 36 per cent had between 11 and 20 hours per week. With girls, the proportions were marginally higher (23 per cent with 10 hours or less and 37 per cent with between 11 and 20 hours respectively). To the extent that full-time work was found, boys were more likely than girls to find it. This has implications for income, ability to travel, ability to undertake further study or training, and independence. Hours of work are examined in Figure 51.
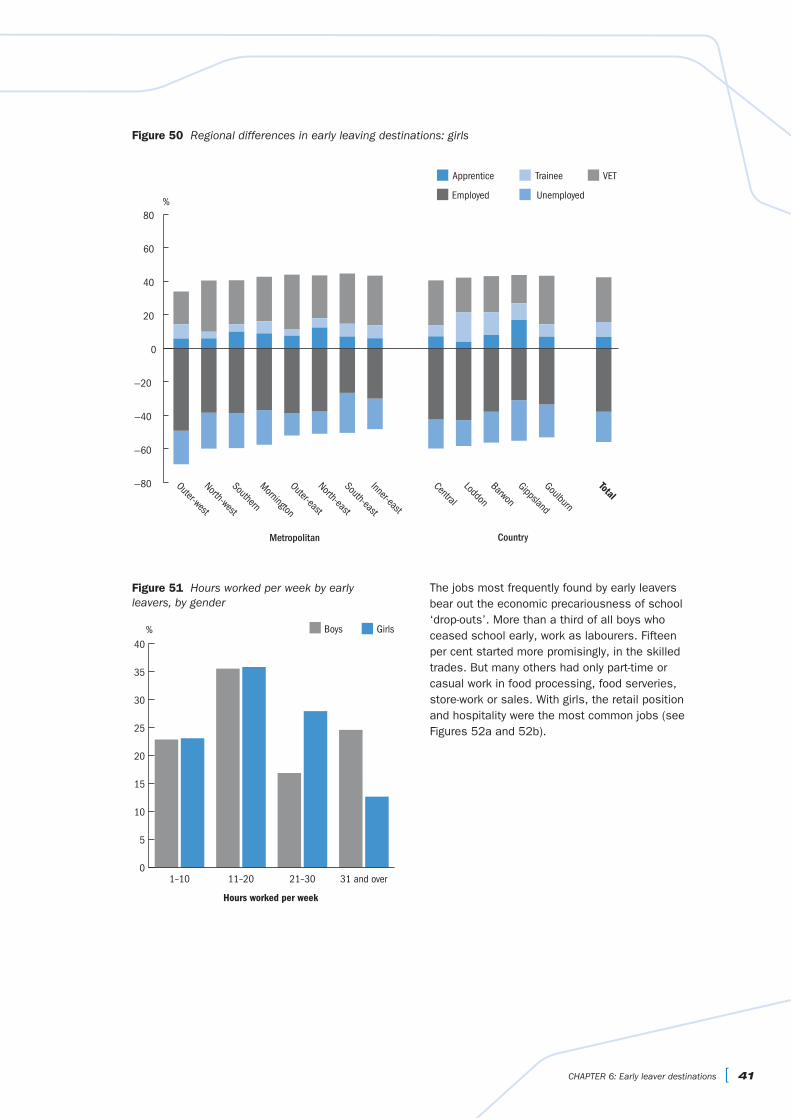
Figure 50 Regional differences in early leaving destinations: girls
—80
—60
—40
—20
0
20
40
60
80
VETTraineeApprentice
%UnemployedEmployed
TotalGoulburn
Gippsland
Barwon
Loddon
Central
Inner-east
South-east
North-east
Outer-east
Mornington
Southern
North-west
Outer-west
Metropolitan Country
Figure 51 Hours worked per week by early leavers, by gender
0
5
10
15
20
25
30
35
40
GirlsBoys
31 and over21–3011–201–10
%
Hours worked per week
The jobs most frequently found by early leavers bear out the economic precariousness of school ‘drop-outs’. More than a third of all boys who ceased school early, work as labourers. Fifteen per cent started more promisingly, in the skilled trades. But many others had only part-time or casual work in food processing, food serveries, store-work or sales. With girls, the retail position and hospitality were the most common jobs (see Figures 52a and 52b).
CHAPTER 6: Early leaver destinations [ 41
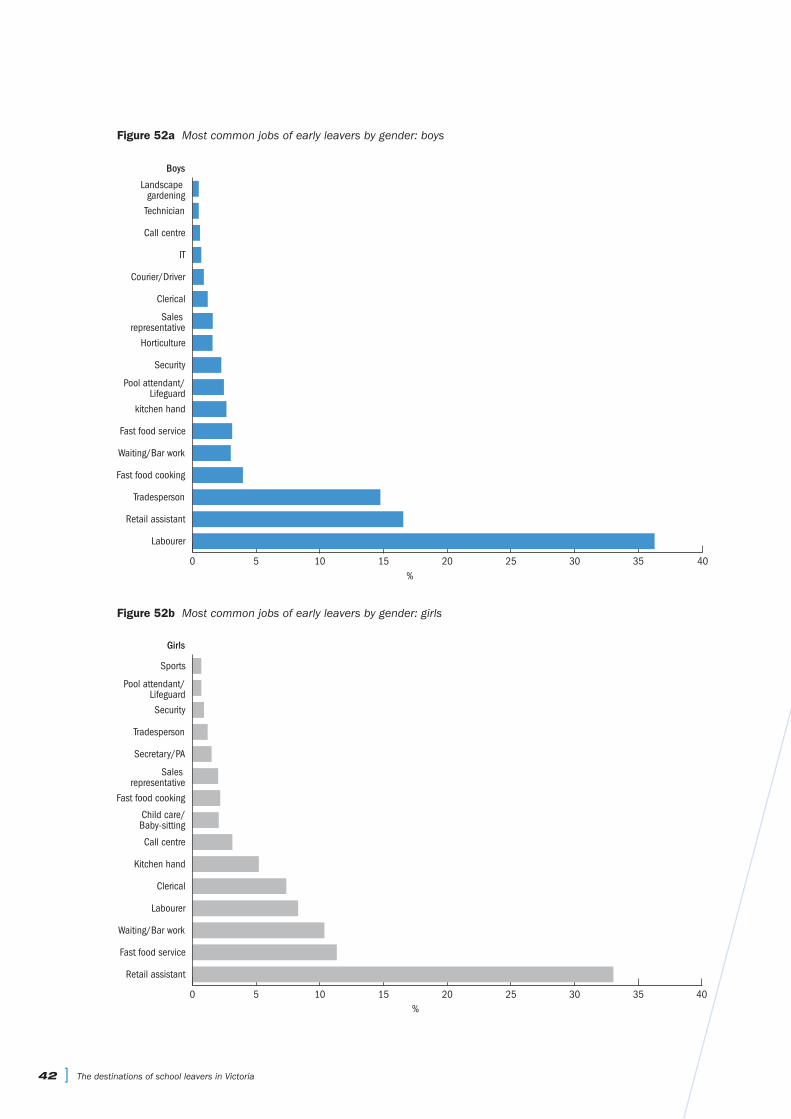
42 ] The destinations of school leavers in Victoria
Figure 52a Most common jobs of early leavers by gender: boys
0 5 10 15 20 25 30 35
Labourer
Retail assistant
Tradesperson
Fast food cooking
Waiting/Bar work
Fast food service
kitchen hand
Pool attendant/Lifeguard
Security
Horticulture
Sales representative
Clerical
Courier/Driver
IT
Call centre
Technician
Landscape gardening
%
%
Boys
40
Figure 52b Most common jobs of early leavers by gender: girls
0 5 10 15 20 25 30 35
Retail assistant
Fast food service
Waiting/Bar work
Labourer
Clerical
Kitchen hand
Call centre
Child care/Baby-sitting
Fast food cooking
Sales representative
Secretary/PA
Tradesperson
Security
Pool attendant/Lifeguard
Sports
%
Girls
40
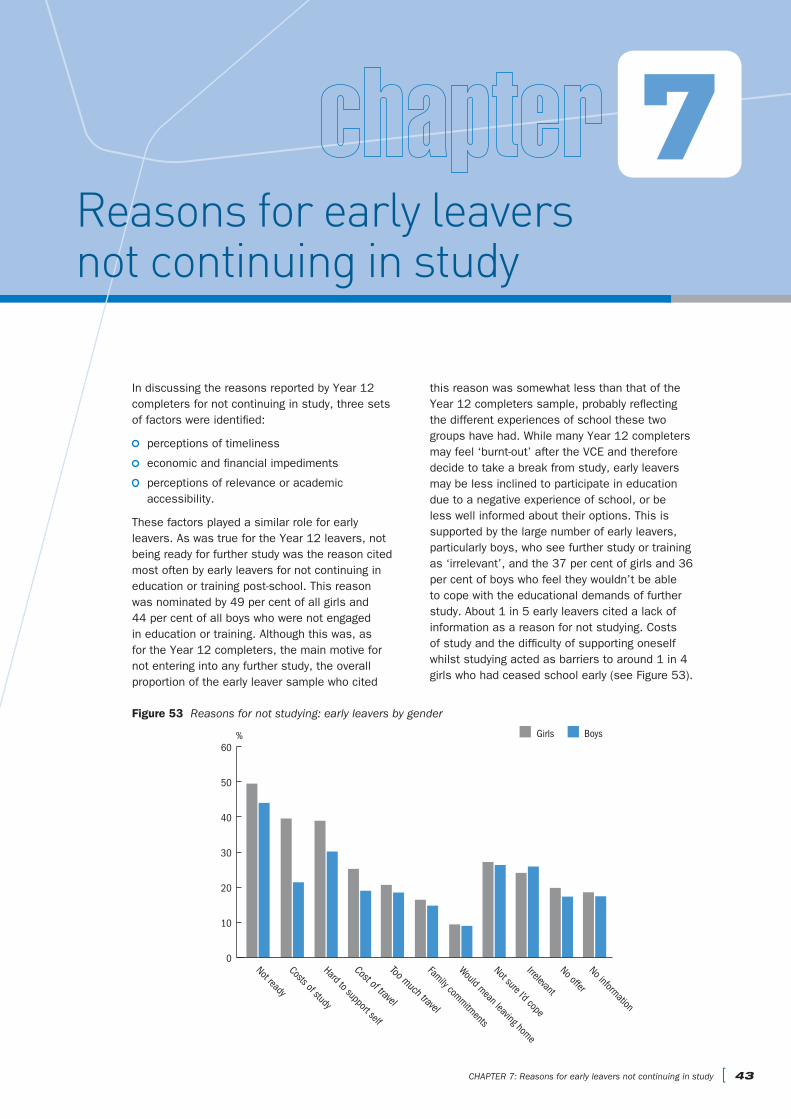
7Reasons for early leavers not continuing in study
CHAPTER 7: Reasons for early leavers not continuing in study [ 43
In discussing the reasons reported by Year 12 completers for not continuing in study, three sets of factors were identified:
perceptions of timeliness
economic and financial impediments
perceptions of relevance or academic accessibility.
These factors played a similar role for early leavers. As was true for the Year 12 leavers, not being ready for further study was the reason cited most often by early leavers for not continuing in education or training post-school. This reason was nominated by 49 per cent of all girls and 44 per cent of all boys who were not engaged in education or training. Although this was, as for the Year 12 completers, the main motive for not entering into any further study, the overall proportion of the early leaver sample who cited
this reason was somewhat less than that of the Year 12 completers sample, probably reflecting the different experiences of school these two groups have had. While many Year 12 completers may feel ‘burnt-out’ after the VCE and therefore decide to take a break from study, early leavers may be less inclined to participate in education due to a negative experience of school, or be less well informed about their options. This is supported by the large number of early leavers, particularly boys, who see further study or training as ‘irrelevant’, and the 37 per cent of girls and 36 per cent of boys who feel they wouldn’t be able to cope with the educational demands of further study. About 1 in 5 early leavers cited a lack of information as a reason for not studying. Costs of study and the difficulty of supporting oneself whilst studying acted as barriers to around 1 in 4 girls who had ceased school early (see Figure 53).
Family commitments
Cost of travel
BoysGirls
No information
No offer
Not ready
Irrelevant
Not sure I’d cope
Would mean leaving home
Too much travel
Costs of study
Hard to support self
%
0
10
20
30
40
50
60
Figure 53 Reasons for not studying: early leavers by gender

44 ] The destinations of school leavers in Victoria
Early leavers differed from school completers most in citing lack of information (almost 20 per cent of early leavers compared to about 12 per cent of school completers), in lower perceptions of not being ready (46 per cent compared to 61 per cent), higher perceptions of irrelevance (32 per cent of early leavers as against 16 per cent of school completers) and fewer academic impediments (for example, 19 per cent of early leavers not offered a place, compared to 27 per cent of completers).
These differences bring into relief two factors that are of particular concern to education providers and LLENs:
1 the 20 per cent of early leavers who say they have too little information
2 the 19 per cent of early leavers who say they tried to get into a course but were not offered a place.
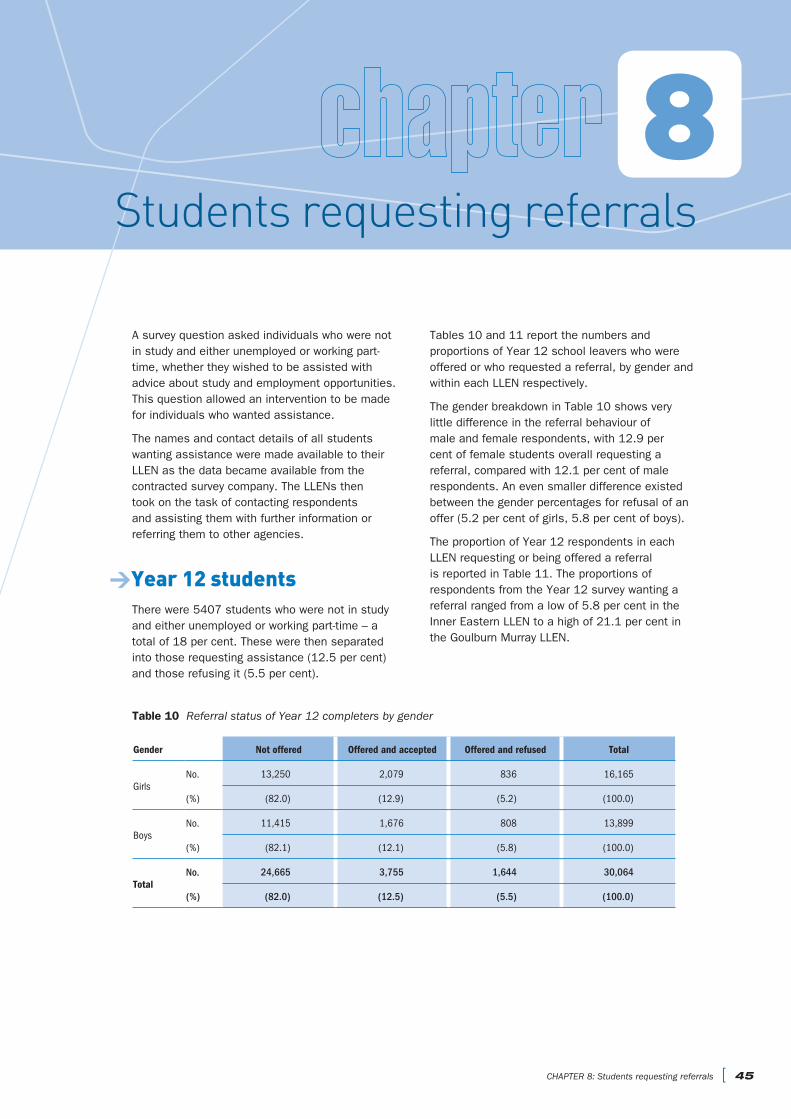
8Students requesting referrals
A survey question asked individuals who were not in study and either unemployed or working part-time, whether they wished to be assisted with advice about study and employment opportunities. This question allowed an intervention to be made for individuals who wanted assistance.
The names and contact details of all students wanting assistance were made available to their LLEN as the data became available from the contracted survey company. The LLENs then took on the task of contacting respondents and assisting them with further information or referring them to other agencies.
>Year 12 studentsThere were 5407 students who were not in study and either unemployed or working part-time – a total of 18 per cent. These were then separated into those requesting assistance (12.5 per cent) and those refusing it (5.5 per cent).
Tables 10 and 11 report the numbers and proportions of Year 12 school leavers who were offered or who requested a referral, by gender and within each LLEN respectively.
The gender breakdown in Table 10 shows very little difference in the referral behaviour of male and female respondents, with 12.9 per cent of female students overall requesting a referral, compared with 12.1 per cent of male respondents. An even smaller difference existed between the gender percentages for refusal of an offer (5.2 per cent of girls, 5.8 per cent of boys).
The proportion of Year 12 respondents in each LLEN requesting or being offered a referral is reported in Table 11. The proportions of respondents from the Year 12 survey wanting a referral ranged from a low of 5.8 per cent in the Inner Eastern LLEN to a high of 21.1 per cent in the Goulburn Murray LLEN.
Table 10 Referral status of Year 12 completers by gender
Gender Not offered Offered and accepted Offered and refused Total
GirlsNo. 13,250 2,079 836 16,165
(%) (82.0) (12.9) (5.2) (100.0)
BoysNo. 11,415 1,676 808 13,899
(%) (82.1) (12.1) (5.8) (100.0)
TotalNo. 24,665 3,755 1,644 30,064
(%) (82.0) (12.5) (5.5) (100.0)
CHAPTER 8: Students requesting referrals [ 45

46 ] The destinations of school leavers in Victoria
Table 11 Referral status of Year 12 completers by LLEN
LLEN Not offered Offered and accepted Offered and refused Total
Banyule NillumbikNo. 1,267 143 53 1,463
(%) (86.6) (9.8) (3.6) (100.0)
Bayside Glen Eira Kingston
No. 1,565 175 79 1,819
(%) (86.0) (9.6) (4.3) (100.0)
Brimbank MeltonNo. 972 167 78 1,217
(%) (79.9) (13.7) (6.4) (100.0)
Capital CityNo. 499 36 20 555
(%) (89.9) (6.5) (3.6) (100.0)
Frankston Mornington Peninsula
No. 1,048 229 112 1,389
(%) (75.4) (16.5) (8.1) (100.0)
Hume WhittleseaNo. 1,018 177 84 1,279
(%) (79.6) (13.8) (6.6) (100.0)
Inner EasternNo. 3,051 195 88 3,334
(%) (91.5) (5.8) (2.6) (100.0)
Inner NorthernNo. 1,006 144 72 1,222
(%) (82.3) (11.8) (5.9) (100.0)
Maribyrnong & Moonee Valley
No. 1,108 147 67 1,322
(%) (83.8) (11.1) (5.1) (100.0)
Outer EasternNo. 1,882 328 140 2,350
(%) (80.1) (14.0) (6.0) (100.0)
South EastNo. 1,734 305 101 2,140
(%) (81.0) (14.3) (4.7) (100.0)
The GatewayNo. 2,838 250 117 3,205
(%) (88.5) (7.8) (3.7) (100.0)
WynBayNo. 748 107 68 923
(%) (81.0) (11.6) (7.4) (100.0)
Baw Baw LatrobeNo. 486 101 48 635
(%) (76.5) (15.9) (7.6) (100.0)
Campaspe CohunaNo. 202 45 17 264
(%) (76.5) (17.0) (6.4) (100.0)
Central GrampiansNo. 86 24 7 117
(%) (73.5) (20.5) (6.0) (100.0)
Central RangesNo. 355 64 26 445
(%) (79.8) (14.4) (5.8) (100.0)
Gippsland EastNo. 314 72 37 423
(%) (74.2) (17.0) (8.7) (100.0)
Glenelg Southern Grampians
No. 150 38 22 210
(%) (71.4) (18.1) (10.5) (100.0)
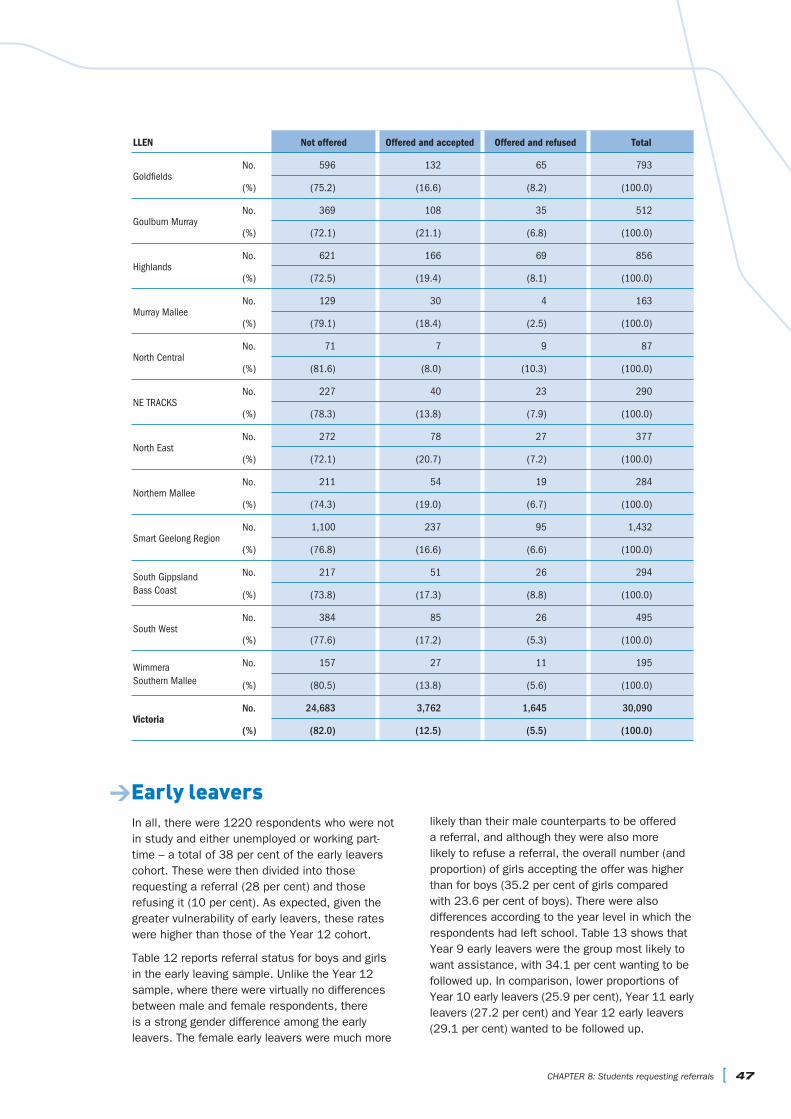
CHAPTER 8: Students requesting referrals [ 47
LLEN Not offered Offered and accepted Offered and refused Total
GoldfieldsNo. 596 132 65 793
(%) (75.2) (16.6) (8.2) (100.0)
Goulburn MurrayNo. 369 108 35 512
(%) (72.1) (21.1) (6.8) (100.0)
HighlandsNo. 621 166 69 856
(%) (72.5) (19.4) (8.1) (100.0)
Murray MalleeNo. 129 30 4 163
(%) (79.1) (18.4) (2.5) (100.0)
North CentralNo. 71 7 9 87
(%) (81.6) (8.0) (10.3) (100.0)
NE TRACKSNo. 227 40 23 290
(%) (78.3) (13.8) (7.9) (100.0)
North EastNo. 272 78 27 377
(%) (72.1) (20.7) (7.2) (100.0)
Northern MalleeNo. 211 54 19 284
(%) (74.3) (19.0) (6.7) (100.0)
Smart Geelong RegionNo. 1,100 237 95 1,432
(%) (76.8) (16.6) (6.6) (100.0)
South Gippsland Bass Coast
No. 217 51 26 294
(%) (73.8) (17.3) (8.8) (100.0)
South WestNo. 384 85 26 495
(%) (77.6) (17.2) (5.3) (100.0)
Wimmera Southern Mallee
No. 157 27 11 195
(%) (80.5) (13.8) (5.6) (100.0)
VictoriaNo. 24,683 3,762 1,645 30,090
(%) (82.0) (12.5) (5.5) (100.0)
>Early leaversIn all, there were 1220 respondents who were not in study and either unemployed or working part-time – a total of 38 per cent of the early leavers cohort. These were then divided into those requesting a referral (28 per cent) and those refusing it (10 per cent). As expected, given the greater vulnerability of early leavers, these rates were higher than those of the Year 12 cohort.
Table 12 reports referral status for boys and girls in the early leaving sample. Unlike the Year 12 sample, where there were virtually no differences between male and female respondents, there is a strong gender difference among the early leavers. The female early leavers were much more
likely than their male counterparts to be offered a referral, and although they were also more likely to refuse a referral, the overall number (and proportion) of girls accepting the offer was higher than for boys (35.2 per cent of girls compared with 23.6 per cent of boys). There were also differences according to the year level in which the respondents had left school. Table 13 shows that Year 9 early leavers were the group most likely to want assistance, with 34.1 per cent wanting to be followed up. In comparison, lower proportions of Year 10 early leavers (25.9 per cent), Year 11 early leavers (27.2 per cent) and Year 12 early leavers (29.1 per cent) wanted to be followed up.
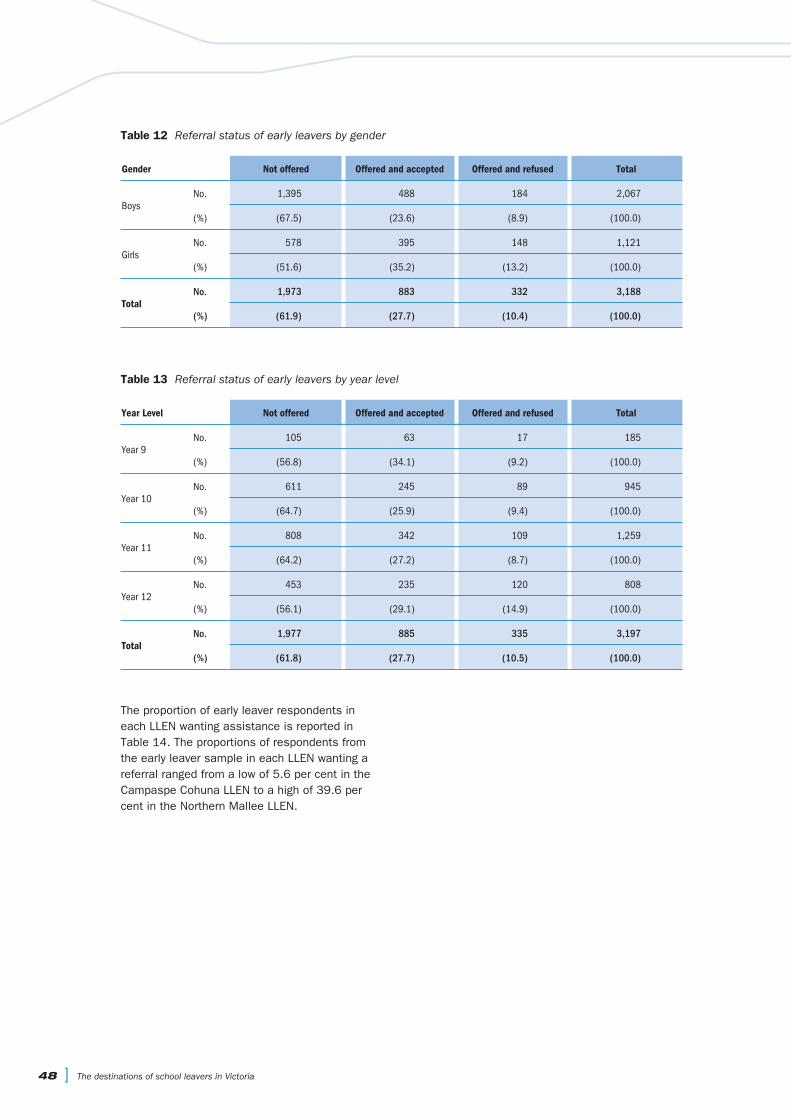
48 ] The destinations of school leavers in Victoria
Table 12 Referral status of early leavers by gender
Gender Not offered Offered and accepted Offered and refused Total
BoysNo. 1,395 488 184 2,067
(%) (67.5) (23.6) (8.9) (100.0)
GirlsNo. 578 395 148 1,121
(%) (51.6) (35.2) (13.2) (100.0)
TotalNo. 1,973 883 332 3,188
(%) (61.9) (27.7) (10.4) (100.0)
Table 13 Referral status of early leavers by year level
Year Level Not offered Offered and accepted Offered and refused Total
Year 9No. 105 63 17 185
(%) (56.8) (34.1) (9.2) (100.0)
Year 10No. 611 245 89 945
(%) (64.7) (25.9) (9.4) (100.0)
Year 11No. 808 342 109 1,259
(%) (64.2) (27.2) (8.7) (100.0)
Year 12No. 453 235 120 808
(%) (56.1) (29.1) (14.9) (100.0)
TotalNo. 1,977 885 335 3,197
(%) (61.8) (27.7) (10.5) (100.0)
The proportion of early leaver respondents in each LLEN wanting assistance is reported in Table 14. The proportions of respondents from the early leaver sample in each LLEN wanting a referral ranged from a low of 5.6 per cent in the Campaspe Cohuna LLEN to a high of 39.6 per cent in the Northern Mallee LLEN.
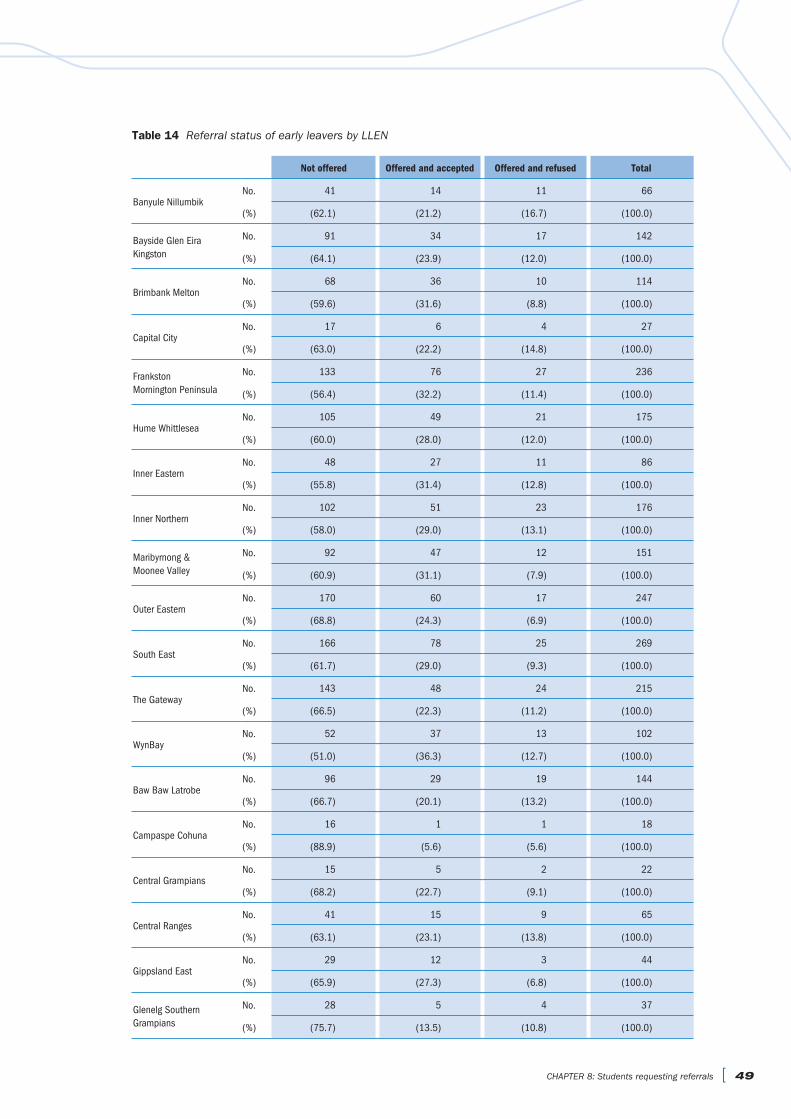
CHAPTER 8: Students requesting referrals [ 49
Table 14 Referral status of early leavers by LLEN
Not offered Offered and accepted Offered and refused Total
Banyule NillumbikNo. 41 14 11 66
(%) (62.1) (21.2) (16.7) (100.0)
Bayside Glen Eira Kingston
No. 91 34 17 142
(%) (64.1) (23.9) (12.0) (100.0)
Brimbank MeltonNo. 68 36 10 114
(%) (59.6) (31.6) (8.8) (100.0)
Capital CityNo. 17 6 4 27
(%) (63.0) (22.2) (14.8) (100.0)
Frankston Mornington Peninsula
No. 133 76 27 236
(%) (56.4) (32.2) (11.4) (100.0)
Hume WhittleseaNo. 105 49 21 175
(%) (60.0) (28.0) (12.0) (100.0)
Inner EasternNo. 48 27 11 86
(%) (55.8) (31.4) (12.8) (100.0)
Inner NorthernNo. 102 51 23 176
(%) (58.0) (29.0) (13.1) (100.0)
Maribyrnong & Moonee Valley
No. 92 47 12 151
(%) (60.9) (31.1) (7.9) (100.0)
Outer EasternNo. 170 60 17 247
(%) (68.8) (24.3) (6.9) (100.0)
South EastNo. 166 78 25 269
(%) (61.7) (29.0) (9.3) (100.0)
The GatewayNo. 143 48 24 215
(%) (66.5) (22.3) (11.2) (100.0)
WynBayNo. 52 37 13 102
(%) (51.0) (36.3) (12.7) (100.0)
Baw Baw LatrobeNo. 96 29 19 144
(%) (66.7) (20.1) (13.2) (100.0)
Campaspe CohunaNo. 16 1 1 18
(%) (88.9) (5.6) (5.6) (100.0)
Central GrampiansNo. 15 5 2 22
(%) (68.2) (22.7) (9.1) (100.0)
Central RangesNo. 41 15 9 65
(%) (63.1) (23.1) (13.8) (100.0)
Gippsland EastNo. 29 12 3 44
(%) (65.9) (27.3) (6.8) (100.0)
Glenelg Southern Grampians
No. 28 5 4 37
(%) (75.7) (13.5) (10.8) (100.0)
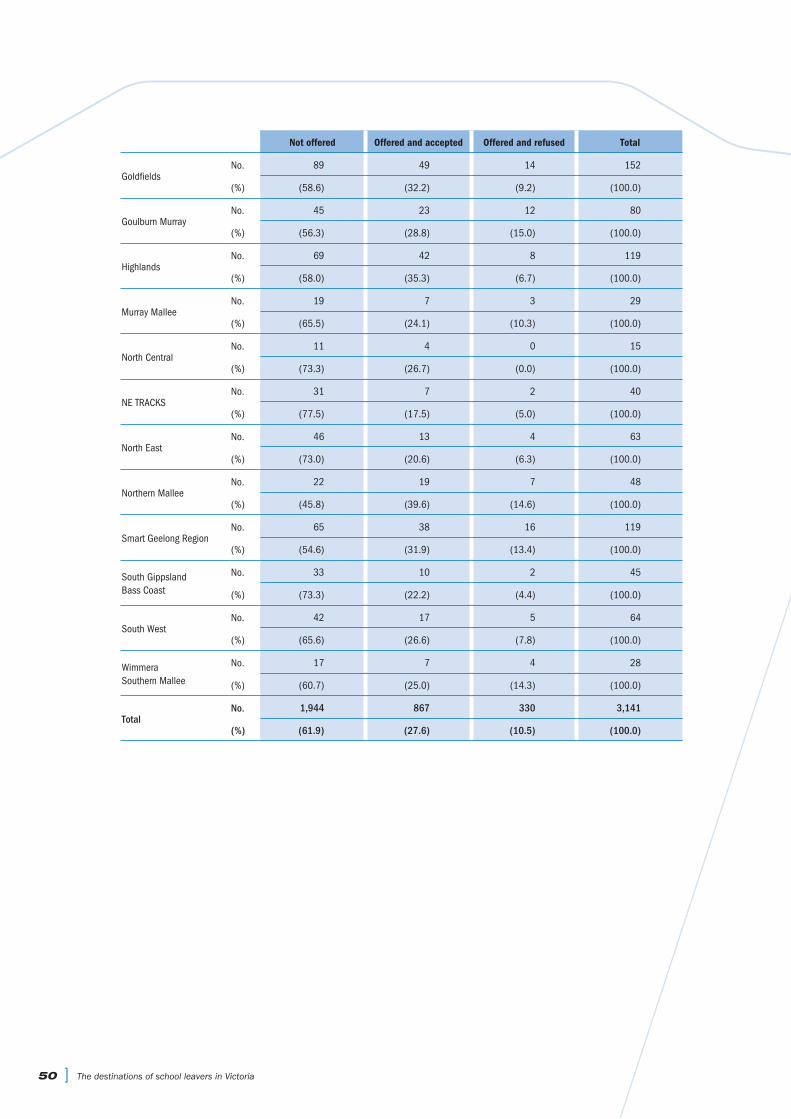
50 ] The destinations of school leavers in Victoria
Not offered Offered and accepted Offered and refused Total
GoldfieldsNo. 89 49 14 152
(%) (58.6) (32.2) (9.2) (100.0)
Goulburn MurrayNo. 45 23 12 80
(%) (56.3) (28.8) (15.0) (100.0)
HighlandsNo. 69 42 8 119
(%) (58.0) (35.3) (6.7) (100.0)
Murray MalleeNo. 19 7 3 29
(%) (65.5) (24.1) (10.3) (100.0)
North CentralNo. 11 4 0 15
(%) (73.3) (26.7) (0.0) (100.0)
NE TRACKSNo. 31 7 2 40
(%) (77.5) (17.5) (5.0) (100.0)
North EastNo. 46 13 4 63
(%) (73.0) (20.6) (6.3) (100.0)
Northern MalleeNo. 22 19 7 48
(%) (45.8) (39.6) (14.6) (100.0)
Smart Geelong RegionNo. 65 38 16 119
(%) (54.6) (31.9) (13.4) (100.0)
South Gippsland Bass Coast
No. 33 10 2 45
(%) (73.3) (22.2) (4.4) (100.0)
South WestNo. 42 17 5 64
(%) (65.6) (26.6) (7.8) (100.0)
Wimmera Southern Mallee
No. 17 7 4 28
(%) (60.7) (25.0) (14.3) (100.0)
TotalNo. 1,944 867 330 3,141
(%) (61.9) (27.6) (10.5) (100.0)

9TAFE as first choice
This year’s On Track survey included a selection of questions relating to young people’s views about TAFE/VET. These questions were included because previous research has shown that there are many VCE completers who either do not apply for a tertiary place (including TAFE/VET) or who choose not to take up a place they are offered (as distinct from deferring).
How well informed are young people about TAFE/VET options? Are they making decisions on the basis of a good understanding of what is available to them?
Only a summary of the responses is given in this report. A full analysis will be available separately. The summary relates to three groups of VCE completers. The first group is referred to as non-applicants. These are young people who did not seek a place in tertiary education, whether university or TAFE/VET, and who were not in study at the time of the survey. The second group is referred to as VET non-commencers. These are young people who either turned down a place in TAFE/VET (or cancelled their enrolment) and who were not in study at the time of the survey. For potential contrast, university non-commencers are included. These are young people who rejected a university offer and who were not in study at the time of the survey. The third group does not include deferees.
Table 15 provides a gender breakdown of numbers and percentages in each of these groups.
>FindingsMost young people who completed their VCE, but who either did not make a tertiary application or did not commence tertiary education, report that the students in their schools were ‘well-informed about university courses’ (Figure 54).
Table 15 Non-applicants and non-commencers (other than deferees) by gender
Males Females Total
No. % No. % No. %
Non-applicants 1,881 68.1 1,349 60.0 3,230 64.4
Non-commencers (VET) 253 9.2 300 13.3 553 11.0
Non-commencers (Uni) 630 22.8 600 26.7 1,230 24.5
Total 2,764 100 2,249 100 5,013 100
Note: Table relates to those not in study at time of survey.
Figure 54 Students in your school were well-informed about university courses
0
10
20
30
40
50
60
70
80
90
100
UnsureDisagreeAgree
Non-commencers(Uni)
Non-commencers (VET)
Non-applicants
%
211
87
116
83
113
86
CHAPTER 9: TAFE as first choice [ 51
NOTE: Percentages may not add to 100 due to rounding

52 ] The destinations of school leavers in Victoria
Those who disagreed about students being well informed about university courses represented between 11 per cent and 16 per cent of respondents. Those least likely to agree were the tertiary applicants who had been offered a place in TAFE/VET, but who had either rejected the place (possibly because it was not high on their list of preferences) or had cancelled their enrolment (the VET non-commencers) (16 per cent).
There was broadly similar agreement that students were well informed about TAFE/VET courses – between 79 per cent and 89 per cent. However, non-commencers in TAFE/VET were again the most likely to disagree that students were well informed. One in five respondents in this category disagreed.
It is possible that this rejection of a VET place was related to a perceived lack of information, but this cannot be inferred simply from the higher level of negative response (Figure 55).
Figure 55 Students in your school were well-informed about TAFE/VET courses
0
10
20
30
40
50
60
70
80
90
100
UnsureDisagreeAgree%
Non-commencers(Uni)
Non-commencers (VET)
Non-applicants
110
89
120
79
014
86
Figure 56 Information about TAFE/VET courses was distributed at school
0
10
20
30
40
50
60
70
80
90
100%
UnsureDisagreeAgree
Non-commencers(Uni)
Non-commencers (VET)
Non-applicants
17
91
215
83
110
89
Figure 57 University courses lead to better jobs than TAFE courses
0
10
20
30
40
50
60
70
80
90
100%
UnsureDisagreeAgree
Non-commencers(Uni)
Non-commencers (VET)
Non-applicants
6
49
45
5
49
47
4
52
44
Most students reported that information about TAFE/VET was distributed at school. Agreement ranged from 83 per cent to 91 per cent (see Figure 56). On this question, too, the non-commencers in VET were the most likely to disagree (15 per cent, with a further 2 per cent unsure or not knowing whether information had been distributed).
Many young people who either do not apply for tertiary education or who do not commence tertiary studies see universities as offering an advantage in the job market. Agreement approaches half of all respondents – 45 per cent of non-applicants, 47 per cent of non-commencers (VET) and 44 per cent of non-commencers (university) (see Figure 57).
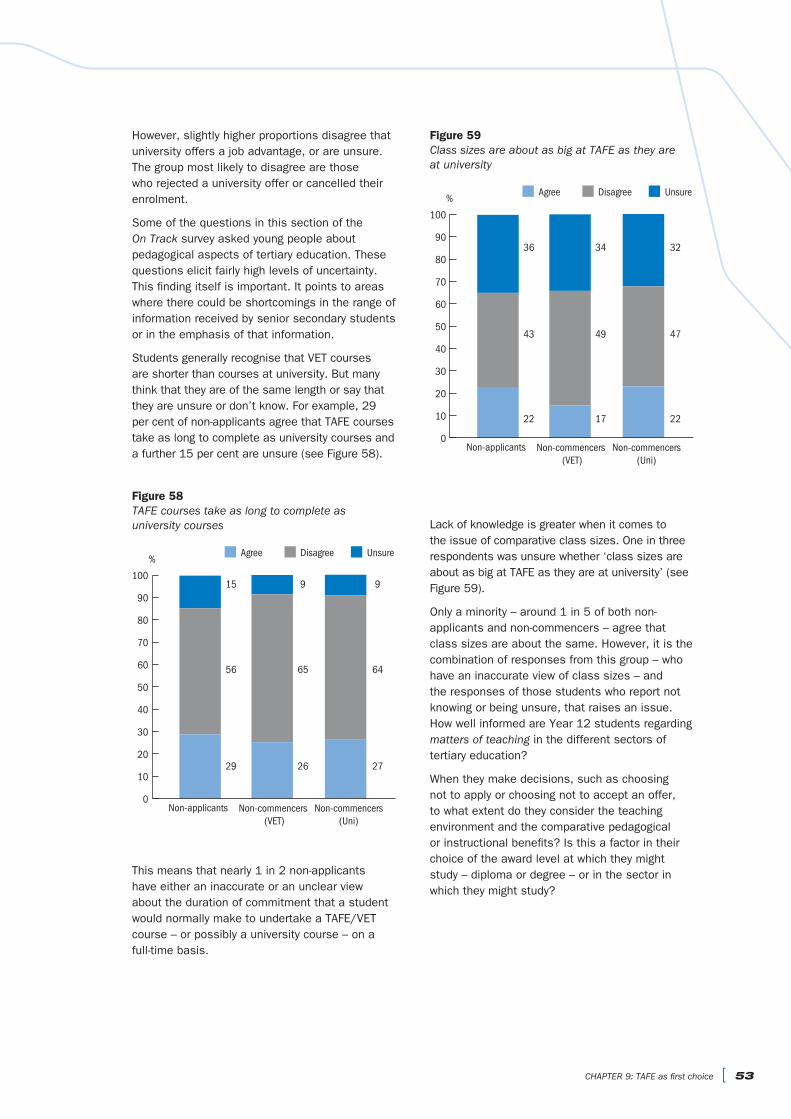
CHAPTER 9: TAFE as first choice [ 53
Figure 58 TAFE courses take as long to complete as university courses
0
10
20
30
40
50
60
70
80
90
100
%UnsureDisagreeAgree
Non-commencers(Uni)
Non-commencers (VET)
Non-applicants
15
56
29
9
65
26
9
64
27
However, slightly higher proportions disagree that university offers a job advantage, or are unsure. The group most likely to disagree are those who rejected a university offer or cancelled their enrolment.
Some of the questions in this section of the On Track survey asked young people about pedagogical aspects of tertiary education. These questions elicit fairly high levels of uncertainty. This finding itself is important. It points to areas where there could be shortcomings in the range of information received by senior secondary students or in the emphasis of that information.
Students generally recognise that VET courses are shorter than courses at university. But many think that they are of the same length or say that they are unsure or don’t know. For example, 29 per cent of non-applicants agree that TAFE courses take as long to complete as university courses and a further 15 per cent are unsure (see Figure 58).
Figure 59 Class sizes are about as big at TAFE as they are at university
0
10
20
30
40
50
60
70
80
90
100
%UnsureDisagreeAgree
Non-commencers(Uni)
Non-commencers (VET)
Non-applicants
36
43
22
34
49
17
32
47
22
This means that nearly 1 in 2 non-applicants have either an inaccurate or an unclear view about the duration of commitment that a student would normally make to undertake a TAFE/VET course – or possibly a university course – on a full-time basis.
Lack of knowledge is greater when it comes to the issue of comparative class sizes. One in three respondents was unsure whether ‘class sizes are about as big at TAFE as they are at university’ (see Figure 59).
Only a minority – around 1 in 5 of both non-applicants and non-commencers – agree that class sizes are about the same. However, it is the combination of responses from this group – who have an inaccurate view of class sizes – and the responses of those students who report not knowing or being unsure, that raises an issue. How well informed are Year 12 students regarding matters of teaching in the different sectors of tertiary education?
When they make decisions, such as choosing not to apply or choosing not to accept an offer, to what extent do they consider the teaching environment and the comparative pedagogical or instructional benefits? Is this a factor in their choice of the award level at which they might study – diploma or degree – or in the sector in which they might study?

54 ] The destinations of school leavers in Victoria
This means that nearly 1 in 2 Year 12 students who do not apply for tertiary education or who do not commence a course are unclear or not accurate in their perception of teaching environments in tertiary education. Responses to this item and to the item on class sizes suggest that many young people do not have a well-informed view about the teaching situations typically found in tertiary education, and specifically in TAFE institutes.
While it might be argued that Year 12 students have only limited opportunities to become informed about teaching environments, responses do suggest that they do have views, and that these views are frequently inaccurate. They are more likely to see examples of the lecture theatre on television programs – though not the tutorial or a laboratory class. They are less likely to see examples of teaching in a TAFE/VET setting. This is one potential problem.
The other relates to the emphasis in information. If the information is mainly pitched at job and training opportunities, and ignores potential instructional advantages, it may fail to address a real issue that students face when making tertiary choices – will they be able to cope academically?
As if to confirm their views on class sizes and individual attention, a high proportion of respondents believe that ‘teaching in universities is of a higher quality than TAFE’ (see Figure 61).
Figure 60 You get more individual attention at TAFE than university
0
10
20
30
40
50
60
70
80
90
100
%UnsureDisagreeAgree
Non-commencers(Uni)
Non-commencers (VET)
Non-applicants
28
21
50
28
20
52
23
21
56
Figure 61 Teaching in universities is of a higher quality than TAFE
0
10
20
30
40
50
60
70
80
90
100
%UnsureDisagreeAgree
Non-commencers(Uni)
Non-commencers (VET)
Non-applicants
10
43
47
11
51
37
8
45
47
A lack of awareness of comparative class sizes on the part of many young people carries through to perceptions about levels of individual attention (see Figure 60). Firstly, a sizeable minority – between 23 per cent and 28 per cent – are unsure whether ‘you get more individual attention at TAFE than university’. Secondly, another sizeable minority – between 20 per cent and 21 per cent – disagree that TAFE presents an advantage on this score (Figure 60).
The belief that university teaching is better is found more often among non-applicants and non-commencers in higher education than the group of young people who rejected a TAFE/VET place (47 per cent each for the first two groups and only 37 per cent for the last).
While comparative teaching quality is a difficult issue to assess – within universities, across universities, and across whole sectors – it does appear that young people often believe that a higher standard is found in the sector of higher prestige and higher entry standards.
This belief may or may not influence how young people decide on choices. But a more important question concerns the adequacy of the information on which they base their belief. A general view about teaching quality appears to be reinforced in the minds of many students by a more discriminating view about differences in approaches to teaching and their relevance to the learning needs of different groups of students.
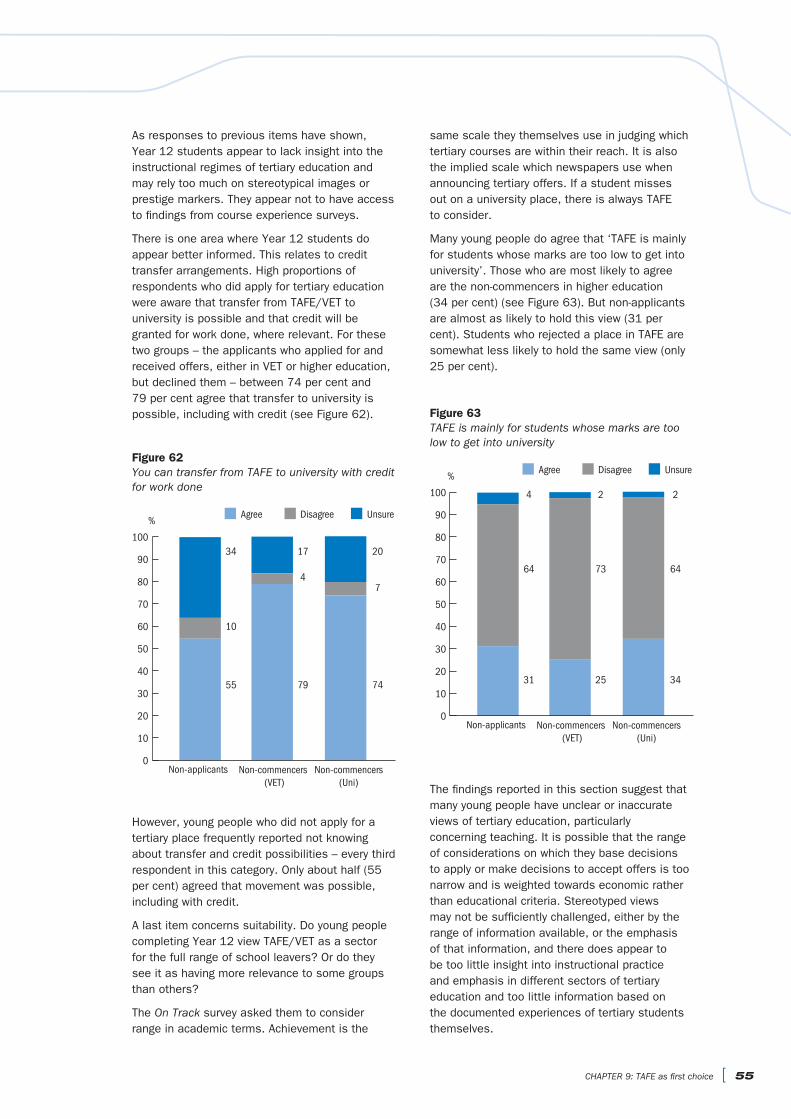
CHAPTER 9: TAFE as first choice [ 55
As responses to previous items have shown, Year 12 students appear to lack insight into the instructional regimes of tertiary education and may rely too much on stereotypical images or prestige markers. They appear not to have access to findings from course experience surveys.
There is one area where Year 12 students do appear better informed. This relates to credit transfer arrangements. High proportions of respondents who did apply for tertiary education were aware that transfer from TAFE/VET to university is possible and that credit will be granted for work done, where relevant. For these two groups – the applicants who applied for and received offers, either in VET or higher education, but declined them – between 74 per cent and 79 per cent agree that transfer to university is possible, including with credit (see Figure 62).
However, young people who did not apply for a tertiary place frequently reported not knowing about transfer and credit possibilities – every third respondent in this category. Only about half (55 per cent) agreed that movement was possible, including with credit.
A last item concerns suitability. Do young people completing Year 12 view TAFE/VET as a sector for the full range of school leavers? Or do they see it as having more relevance to some groups than others?
The On Track survey asked them to consider range in academic terms. Achievement is the
Figure 63 TAFE is mainly for students whose marks are too low to get into university
0
10
20
30
40
50
60
70
80
90
100
%UnsureDisagreeAgree
Non-commencers(Uni)
Non-commencers (VET)
Non-applicants
4
64
31
2
73
25
2
64
34
same scale they themselves use in judging which tertiary courses are within their reach. It is also the implied scale which newspapers use when announcing tertiary offers. If a student misses out on a university place, there is always TAFE to consider.
Many young people do agree that ‘TAFE is mainly for students whose marks are too low to get into university’. Those who are most likely to agree are the non-commencers in higher education (34 per cent) (see Figure 63). But non-applicants are almost as likely to hold this view (31 per cent). Students who rejected a place in TAFE are somewhat less likely to hold the same view (only 25 per cent).
Figure 62 You can transfer from TAFE to university with credit for work done
0
10
20
30
40
50
60
70
80
90
100
%UnsureDisagreeAgree
Non-commencers(Uni)
Non-commencers (VET)
Non-applicants
34
10
55
17
4
79
20
7
74
The findings reported in this section suggest that many young people have unclear or inaccurate views of tertiary education, particularly concerning teaching. It is possible that the range of considerations on which they base decisions to apply or make decisions to accept offers is too narrow and is weighted towards economic rather than educational criteria. Stereotyped views may not be sufficiently challenged, either by the range of information available, or the emphasis of that information, and there does appear to be too little insight into instructional practice and emphasis in different sectors of tertiary education and too little information based on the documented experiences of tertiary students themselves.

56 ] The destinations of school leavers in Victoria
Conclusions
The On Track survey has now provided destinations data for school completers and early leavers from two different cohorts of Victorian students – those at school in 2002 and those at school in 2003. The study has shown an increase in the proportion of VCE completers undertaking further education and study, and has given us unparalleled insights into the post-schooling pathways of young people in Victoria. For example:
The major influence exerted by achievement differences across the range of destinations, including employment.
The labour market trends resulting in a majority of young people not in study or training undertaking part-time or casual work.
Marked regional differences in destinations, such as comparatively low VET transition in country regions.
The relatively weak labour market destinations of early leavers.
The beneficial employment impact of VET in Schools for young people who do not apply for tertiary education or do not commence.
The strong destination outcomes (including high apprenticeship and traineeship commencement rates) for schools serving disadvantaged communities.
The high apprenticeship and traineeship commencement rates for students from schools in regional communities.
The important role played by TAFE, other training providers and ACE for early leavers.
Refinements in the methodology used and in the questions asked of school leavers in 2004 have given us additional insights in this report into the reasons for deferring and into the barriers to further study. They have also enabled us to examine the reasons why many students do not consider TAFE/VET or reject an offer of a TAFE/VET course. Similarly, these refinements have allowed the project to investigate the differential
outcomes of school leavers from various language groups and Indigenous Victorians.
In addition, in 2004, for the first time respondents were asked to volunteer to take part in a longitudinal study that will track a sample of school leavers over the longer term, allowing an assessment to be made of the sustainability and success of the various pathways pursued by them over four years – both the early leavers and the school completers. For example:
Does a post-schooling transition to part-time work lead in the longer term to full-time work or training?
Are those who entered university or VET still in study? If not, what are the reasons?
What has happened to deferees in the longer term?
This report elucidates the findings of the current study and relates these findings both to the future conduct of the On Track study and to the policy implications arising from the project.
>Recommendations regarding methodology
The survey should include a set of questions designed to monitor the educational patterns of VCAL students. The VCAL pathway has emerged as a significant option for students.
The survey should be expanded to ask all respondents about tertiary application and about their preferencing of VET courses.
A question should be included inviting school leavers to reflect on their satisfaction with the program of studies undertaken at school.
A question should be included inviting school leavers to reflect on their satisfaction with their current destination (work and/or study situation).

Conclusions [ 57
A question should be included inviting school leavers to reflect on their perceived level of coping with school studies, given the documented impact of achievement level on destinations.
Consideration should be given to the collection of more detailed data on students who defer a tertiary place.
Respondents should be asked to reflect on careers education and guidance provided to them prior to leaving school.
Those school leavers who have enrolled in basic VET courses should be asked further questions about their transition.
It should be ensured that the collection of basic destinations data from the school leavers who opt not to participate in the survey aligns with the destinations data obtained during the survey, to allow consolidation of the two data sets at a more detailed level, for reporting purposes.
>Recommendations regarding policy
Secondary school students and their parents should be made aware that a significant proportion of early school leavers make a transition to unemployment or low-skilled and predominantly part-time work, so that effective transition strategies can be developed for all early leavers, for example, careers guidance, MIPS, and so on.
Secondary school students and their parents should be made aware that most school completers who do not enter a study or training destination make a transition to low-skilled and predominantly part-time work, so that effective transition strategies can be developed for all school completers, for example, careers guidance, MIPS, and so on.
Given the negative effects of costs, travel and living away from home on school leavers wishing to enter higher education in non-metropolitan Victoria, universities should be encouraged to explore flexible delivery options and different relationships to schools and TAFEs for off-campus delivery.
Given the negative effects of costs, travel and living away from home on school leavers wishing to enter VET courses in non-metropolitan Victoria, the range of TAFE campuses and courses, particularly at Certificate IV level and above, should be expanded.
Better information about the comparative pedagogical and instructional benefits of TAFE should be made available to secondary school students to encourage them to consider tertiary options more fully, especially VET, and to make successful use of these programs.
Given the importance of interpreting the On Track data correctly and making it useful at the local LLEN and school level, consideration should be given to commissioning a program of professional development workshops in order to assist LLEN officers and careers teachers to make the most effective use of the data.
All of the 2003 recommendations regarding policy have been implemented. These were:
Given the role assigned to the On Track program, schools should no longer follow up Year 12 completers, but focus on those likely to leave school early.
Links should be made between the destination profiles reported in this study and the Blueprint for Education strategies relating to school improvement.
The study findings relating to issues of students’ socioeconomic status should be linked to the consideration of the proposed Resource Allocation Model.
Career and transition support for students needs to be re-evaluated in the light of the broad range of destinations reported in this study.
Curriculum options that support pathways for low achievers need to be examined and developed.
All of the 2003 recommendations regarding methodology have been implemented. These were:
All Year 12 students should be contacted by the VCAA regarding participation in On Track, including those who have studied the International Baccalaureate and those who are international and interstate-based students.
An agreed set of protocols should be determined by the researchers and by Department of Education & Training (DE&T) staff regarding which schools are eligible for publication of destinations data (that is, minimum response numbers, etc.).
As numbers enrolled in VCAL programs grow, it is recommended that VCAL status form a category for analysis in future tracking studies.
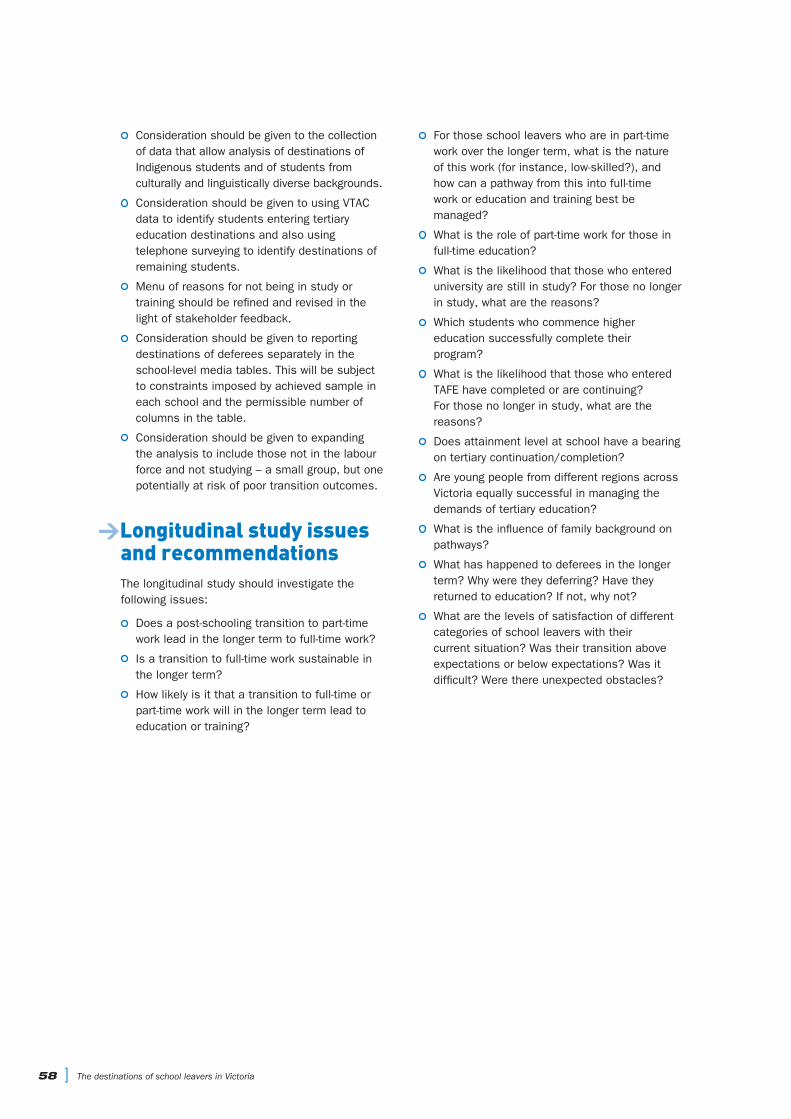
58 ] The destinations of school leavers in Victoria
Consideration should be given to the collection of data that allow analysis of destinations of Indigenous students and of students from culturally and linguistically diverse backgrounds.
Consideration should be given to using VTAC data to identify students entering tertiary education destinations and also using telephone surveying to identify destinations of remaining students.
Menu of reasons for not being in study or training should be refined and revised in the light of stakeholder feedback.
Consideration should be given to reporting destinations of deferees separately in the school-level media tables. This will be subject to constraints imposed by achieved sample in each school and the permissible number of columns in the table.
Consideration should be given to expanding the analysis to include those not in the labour force and not studying – a small group, but one potentially at risk of poor transition outcomes.
>Longitudinal study issues and recommendationsThe longitudinal study should investigate the following issues:
Does a post-schooling transition to part-time work lead in the longer term to full-time work?
Is a transition to full-time work sustainable in the longer term?
How likely is it that a transition to full-time or part-time work will in the longer term lead to education or training?
For those school leavers who are in part-time work over the longer term, what is the nature of this work (for instance, low-skilled?), and how can a pathway from this into full-time work or education and training best be managed?
What is the role of part-time work for those in full-time education?
What is the likelihood that those who entered university are still in study? For those no longer in study, what are the reasons?
Which students who commence higher education successfully complete their program?
What is the likelihood that those who entered TAFE have completed or are continuing? For those no longer in study, what are the reasons?
Does attainment level at school have a bearing on tertiary continuation/completion?
Are young people from different regions across Victoria equally successful in managing the demands of tertiary education?
What is the influence of family background on pathways?
What has happened to deferees in the longer term? Why were they deferring? Have they returned to education? If not, why not?
What are the levels of satisfaction of different categories of school leavers with their current situation? Was their transition above expectations or below expectations? Was it difficult? Were there unexpected obstacles?
ABS 2001, Census of Population and Housing, Cat. No. 2015, Australian Bureau of Statistics Canberra.
—— 2002, Education & Training Indicators 2002, cat. no. 4230, Australian Bureau of Statistics Canberra.
—— 2004, Labour Force 2004, cat. no. 6291.0.55.001, Australian Bureau of Statistics Canberra.
Davies, M. & Walstab, A. 2002, Evaluation Paper: MIPS Program, unpublished paper, Department of Education & Training, Melbourne.
DE&T 2000, Ministerial Review of Post Compulsory Education & Training Pathways in Victoria. Final Report (Kirby report), Department of Education & Training, Melbourne.
—— 2001a, Patterns of Participation in Higher Education, Department of Education & Training, Melbourne.
—— (2001b) Years Prep – 10. Curriculum and Standards Framework II, Department of Education & Training, Melbourne.
—— 2002, Improved Educational Outcomes. A Better Reporting and Accountability System for Schools, Department of Education & Training, Melbourne.
—— 2003, Managed Individual Pathways (MIPs) and Youth Pathways Program (YPP) (www.deet.vic.gov.au/deet/postcomp/initiatives/mips.htm).
de Landsheere, G. 1994, Le pilotage des systèmes d’éducation, De Boeck-Wesmael, Brussels.
DEST 1999, Completions. Undergraduate Academic Outcomes for 1992 Commencing Students, Department of Education, Science and Training, Canberra.
—— 2001, Undergraduate Completion Rates: An Update, Department of Education, Science and Training, Canberra.
James, R. 2002, Socioeconomic Background and Higher Education Participation: An Analysis of School Students’ Aspirations and Expectations, Department of Education, Science and Training (Higher Education Group), Canberra.
James, R., Wyn, J., Baldwin, G. et. al. 1999, Rural and Isolated School Students and their Higher Education Choices, NBEET, Canberra.
King, A. 1999, The Cost to Australia of Early School Leaving, Dusseldorp Skills Forum, Sydney.
Polesel, J. & Teese, R. 2002, Transitions from the VET in Schools Program. The 2000 Year 12 Cohort, Department of Education & Training, Melbourne.
Polesel, J., Teese, R. & O’Brien, K. 1999a, The 1998 VET in Schools Cohort. How Do Their Post-Schooling Destinations Compare?, Department of Education & Training, Melbourne.
—— 1999b, Two Years Out – the Class of 1997. A Report on the 1999 Destinations of the 1997 VET in Schools Cohort, Department of Education & Training, Melbourne.
—— 2001, Transitions from the VET in Schools Program. The 1999 Year 12 Cohort, Department of Education & Training, Melbourne.
Polesel, J., Teese, R., O’Brien, K. & Unger, S. 1998, VET in Schools. A Study of Post-schooling Destinations. Destinations of Students Enrolled in VET in Schools Programs in 1997, Department of Education & Training, Melbourne.
Teese, R. 2000, Academic Success and Social Power, Melbourne University Press, Carlton.
—— 2001, ‘Early Leaving in Victoria, 2000: A Regional Analysis’, CPET Research Report, no. 6, Centre for Post-compulsory Education & Lifelong Learning, The University of Melbourne.
—— 2002a, ‘No offer: school leavers not offered tertiary places, a regional and gender analysis 2001’, CPET Research Report, no. 7, Centre for Post-compulsory Education & Lifelong Learning, The University of Melbourne.
—— 2002b, ‘Challenges of Post-Compulsory Education & Training’, public lecture, The University of Melbourne, 12 June 2002.
—— 2002c, ‘Early Leaving in Victoria: Geographical Patterns, Origins, and Strategic Issues’, unpublished paper prepared for the Department of Education & Training, Melbourne.
Teese, R. & Polesel, J. 2003, Undemocratic Schooling. Equity and Quality in Mass Secondary Education in Australia, Melbourne University Press, Carlton North.
VTAC 2001, Annual Report 2000–2001, Victorian Tertiary Admissions Centre, Melbourne.
—— 2004, VTAC Statistics 2003–2004, Victorian Tertiary Admissions Centre, Melbourne.
Bibliography [ 59
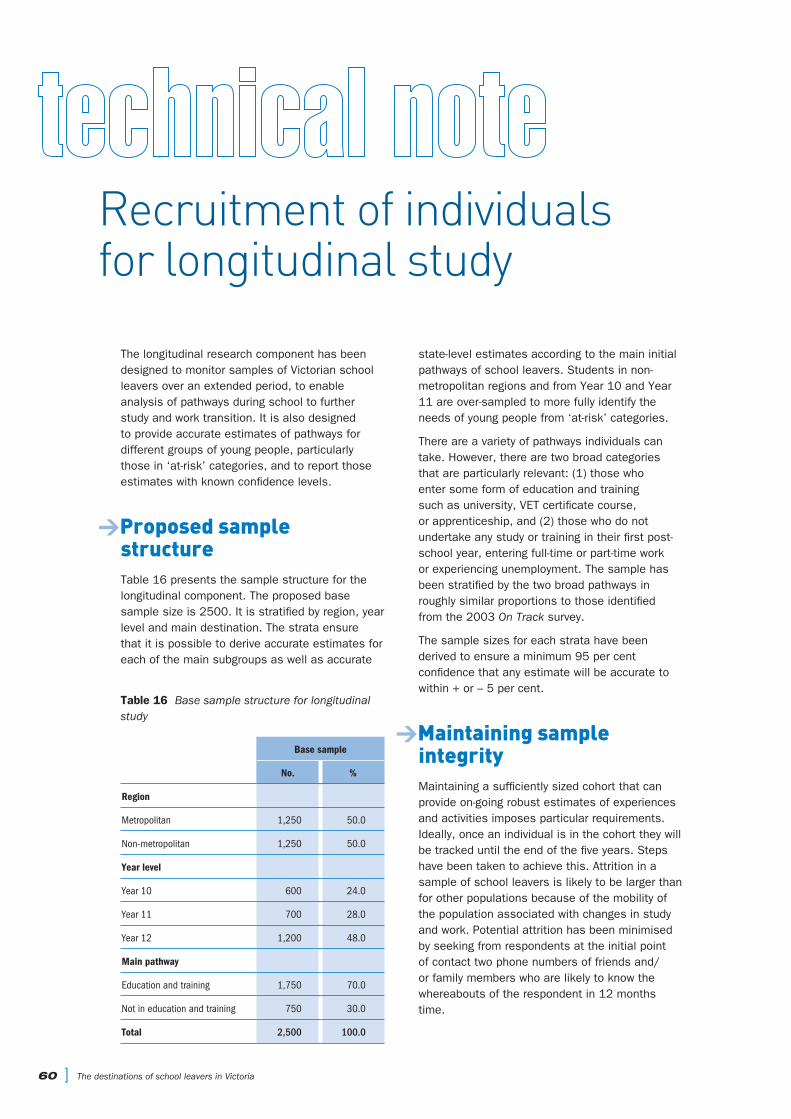
60 ] The destinations of school leavers in Victoria
Recruitment of individuals for longitudinal study
The longitudinal research component has been designed to monitor samples of Victorian school leavers over an extended period, to enable analysis of pathways during school to further study and work transition. It is also designed to provide accurate estimates of pathways for different groups of young people, particularly those in ‘at-risk’ categories, and to report those estimates with known confidence levels.
>Proposed sample structureTable 16 presents the sample structure for the longitudinal component. The proposed base sample size is 2500. It is stratified by region, year level and main destination. The strata ensure that it is possible to derive accurate estimates for each of the main subgroups as well as accurate
Table 16 Base sample structure for longitudinal study
Base sample
No. %
Region
Metropolitan 1,250 50.0
Non-metropolitan 1,250 50.0
Year level
Year 10 600 24.0
Year 11 700 28.0
Year 12 1,200 48.0
Main pathway
Education and training 1,750 70.0
Not in education and training 750 30.0
Total 2,500 100.0
state-level estimates according to the main initial pathways of school leavers. Students in non-metropolitan regions and from Year 10 and Year 11 are over-sampled to more fully identify the needs of young people from ‘at-risk’ categories.
There are a variety of pathways individuals can take. However, there are two broad categories that are particularly relevant: (1) those who enter some form of education and training such as university, VET certificate course, or apprenticeship, and (2) those who do not undertake any study or training in their first post-school year, entering full-time or part-time work or experiencing unemployment. The sample has been stratified by the two broad pathways in roughly similar proportions to those identified from the 2003 On Track survey.
The sample sizes for each strata have been derived to ensure a minimum 95 per cent confidence that any estimate will be accurate to within + or – 5 per cent.
>Maintaining sample integrityMaintaining a sufficiently sized cohort that can provide on-going robust estimates of experiences and activities imposes particular requirements. Ideally, once an individual is in the cohort they will be tracked until the end of the five years. Steps have been taken to achieve this. Attrition in a sample of school leavers is likely to be larger than for other populations because of the mobility of the population associated with changes in study and work. Potential attrition has been minimised by seeking from respondents at the initial point of contact two phone numbers of friends and/or family members who are likely to know the whereabouts of the respondent in 12 months time.
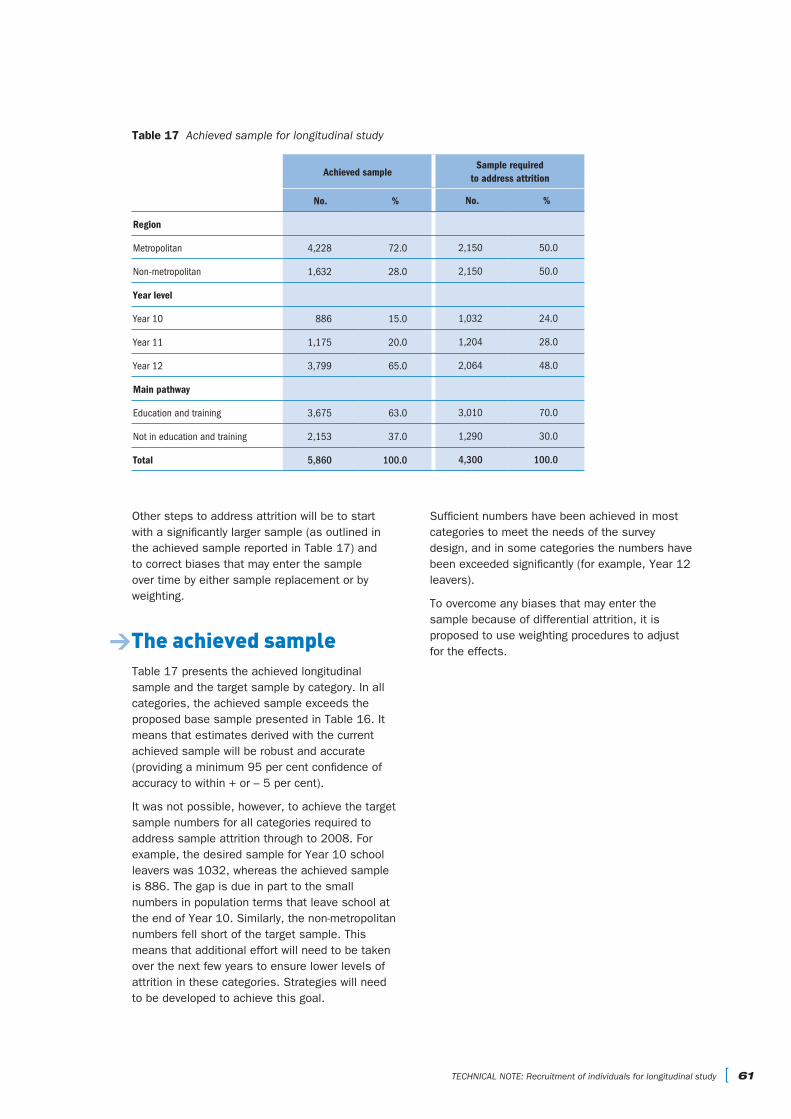
Other steps to address attrition will be to start with a significantly larger sample (as outlined in the achieved sample reported in Table 17) and to correct biases that may enter the sample over time by either sample replacement or by weighting.
>The achieved sampleTable 17 presents the achieved longitudinal sample and the target sample by category. In all categories, the achieved sample exceeds the proposed base sample presented in Table 16. It means that estimates derived with the current achieved sample will be robust and accurate (providing a minimum 95 per cent confidence of accuracy to within + or – 5 per cent).
It was not possible, however, to achieve the target sample numbers for all categories required to address sample attrition through to 2008. For example, the desired sample for Year 10 school leavers was 1032, whereas the achieved sample is 886. The gap is due in part to the small numbers in population terms that leave school at the end of Year 10. Similarly, the non-metropolitan numbers fell short of the target sample. This means that additional effort will need to be taken over the next few years to ensure lower levels of attrition in these categories. Strategies will need to be developed to achieve this goal.
Table 17 Achieved sample for longitudinal study
Achieved sampleSample required
to address attrition
No. % No. %
Region
Metropolitan 4,228 72.0 2,150 50.0
Non-metropolitan 1,632 28.0 2,150 50.0
Year level
Year 10 886 15.0 1,032 24.0
Year 11 1,175 20.0 1,204 28.0
Year 12 3,799 65.0 2,064 48.0
Main pathway
Education and training 3,675 63.0 3,010 70.0
Not in education and training 2,153 37.0 1,290 30.0
Total 5,860 100.0 4,300 100.0
Sufficient numbers have been achieved in most categories to meet the needs of the survey design, and in some categories the numbers have been exceeded significantly (for example, Year 12 leavers).
To overcome any biases that may enter the sample because of differential attrition, it is proposed to use weighting procedures to adjust for the effects.
TECHNICAL NOTE: Recruitment of individuals for longitudinal study [ 61
62 ] The destinations of school leavers in Victoria
1Methodology and sample characteristics
>MethodologyA requirement for measuring and reporting the transition profile of a school is that complete information is available on the range of destinations of students exiting from different year levels. Previous projects designed to monitor the destinations of VET in Schools students (and a matching sample of non-VET students) did not allow such a view of individual schools, as the samples were statewide, with a regional structure. More comprehensive tracking strategies, as envisaged in the MIPs program, were intended to provide a more complete picture, but the burden on teachers of universal tracking has been regarded as possibly detracting from the important case management work of MIPs teachers (Davies and Walstab 2002).
The approach underlying this program of research was to lift this burden from schools and to undertake a comprehensive monitoring of student destinations with a view to describing a ‘profile’ of transitions for each secondary school.
>Survey administrationThis involved a telephone survey of all school leavers from the chosen schools. The telephone survey was conducted by DBM market research company.
Data collected by the market research agency were subsequently analysed by the research team in the Centre for Post-compulsory Education and Lifelong Learning at the University of Melbourne and this report was prepared by that team for the Victorian Department of Education & Training, Post Compulsory Division, Office of Learning and Teaching.
>ReportingThis report presents the destinations data in a number of formats, including charts for schools, tables for the system (including LLENs), and tables for the purpose of public reporting. The school-level data are presented in a form that allows comparisons to be made with the LLEN and with the state. The data for Year 12 students, broken down by school, were published in the Victorian print media in July 2004.
>SampleThis study aimed to track all school leavers enrolled in Years 10, 11 and 12 during 2003. In keeping with the requirements of privacy legislation, permission to obtain from the VCAA names and contact details of school completers and early leavers enrolled in the VCE was sought through a question on the VCE enrolment form. The survey targeted all those who agreed to allow VCAA to release their contact details. Additionally, those who refused were sent a letter giving them the opportunity to be added to the target sample. Those who did not wish to be added to the sample were asked to provide basic destination data. The contact details of the target sample were released only to the University of Melbourne research team and to DBM after this process had been completed. In addition, schools were requested to supply data on early leavers from Year 10 from their own records and these contact details were also supplied to the University of Melbourne.
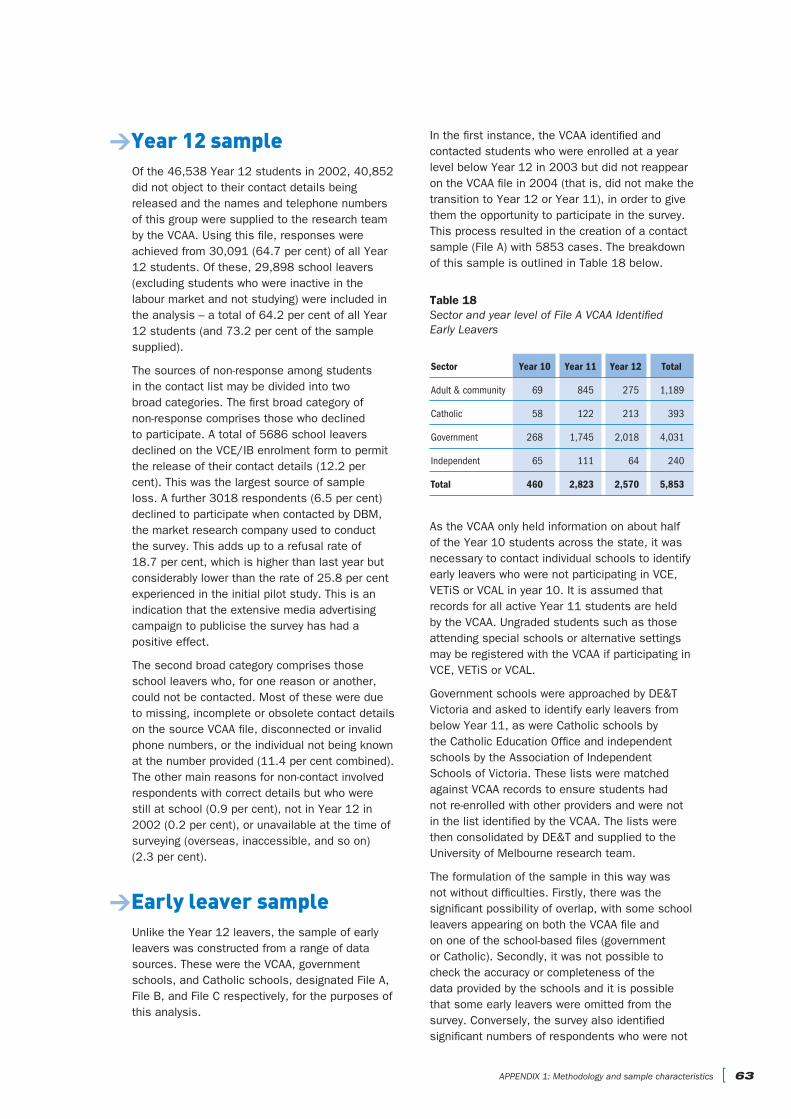
APPENDIX 1: Methodology and sample characteristics [ 63
>Year 12 sampleOf the 46,538 Year 12 students in 2002, 40,852 did not object to their contact details being released and the names and telephone numbers of this group were supplied to the research team by the VCAA. Using this file, responses were achieved from 30,091 (64.7 per cent) of all Year 12 students. Of these, 29,898 school leavers (excluding students who were inactive in the labour market and not studying) were included in the analysis – a total of 64.2 per cent of all Year 12 students (and 73.2 per cent of the sample supplied).
The sources of non-response among students in the contact list may be divided into two broad categories. The first broad category of non-response comprises those who declined to participate. A total of 5686 school leavers declined on the VCE/IB enrolment form to permit the release of their contact details (12.2 per cent). This was the largest source of sample loss. A further 3018 respondents (6.5 per cent) declined to participate when contacted by DBM, the market research company used to conduct the survey. This adds up to a refusal rate of 18.7 per cent, which is higher than last year but considerably lower than the rate of 25.8 per cent experienced in the initial pilot study. This is an indication that the extensive media advertising campaign to publicise the survey has had a positive effect.
The second broad category comprises those school leavers who, for one reason or another, could not be contacted. Most of these were due to missing, incomplete or obsolete contact details on the source VCAA file, disconnected or invalid phone numbers, or the individual not being known at the number provided (11.4 per cent combined). The other main reasons for non-contact involved respondents with correct details but who were still at school (0.9 per cent), not in Year 12 in 2002 (0.2 per cent), or unavailable at the time of surveying (overseas, inaccessible, and so on) (2.3 per cent).
>Early leaver sampleUnlike the Year 12 leavers, the sample of early leavers was constructed from a range of data sources. These were the VCAA, government schools, and Catholic schools, designated File A, File B, and File C respectively, for the purposes of this analysis.
In the first instance, the VCAA identified and contacted students who were enrolled at a year level below Year 12 in 2003 but did not reappear on the VCAA file in 2004 (that is, did not make the transition to Year 12 or Year 11), in order to give them the opportunity to participate in the survey. This process resulted in the creation of a contact sample (File A) with 5853 cases. The breakdown of this sample is outlined in Table 18 below.
Table 18 Sector and year level of File A VCAA Identified Early Leavers
Sector Year 10 Year 11 Year 12 Total
Adult & community 69 845 275 1,189
Catholic 58 122 213 393
Government 268 1,745 2,018 4,031
Independent 65 111 64 240
Total 460 2,823 2,570 5,853
As the VCAA only held information on about half of the Year 10 students across the state, it was necessary to contact individual schools to identify early leavers who were not participating in VCE, VETiS or VCAL in year 10. It is assumed that records for all active Year 11 students are held by the VCAA. Ungraded students such as those attending special schools or alternative settings may be registered with the VCAA if participating in VCE, VETiS or VCAL.
Government schools were approached by DE&T Victoria and asked to identify early leavers from below Year 11, as were Catholic schools by the Catholic Education Office and independent schools by the Association of Independent Schools of Victoria. These lists were matched against VCAA records to ensure students had not re-enrolled with other providers and were not in the list identified by the VCAA. The lists were then consolidated by DE&T and supplied to the University of Melbourne research team.
The formulation of the sample in this way was not without difficulties. Firstly, there was the significant possibility of overlap, with some school leavers appearing on both the VCAA file and on one of the school-based files (government or Catholic). Secondly, it was not possible to check the accuracy or completeness of the data provided by the schools and it is possible that some early leavers were omitted from the survey. Conversely, the survey also identified significant numbers of respondents who were not
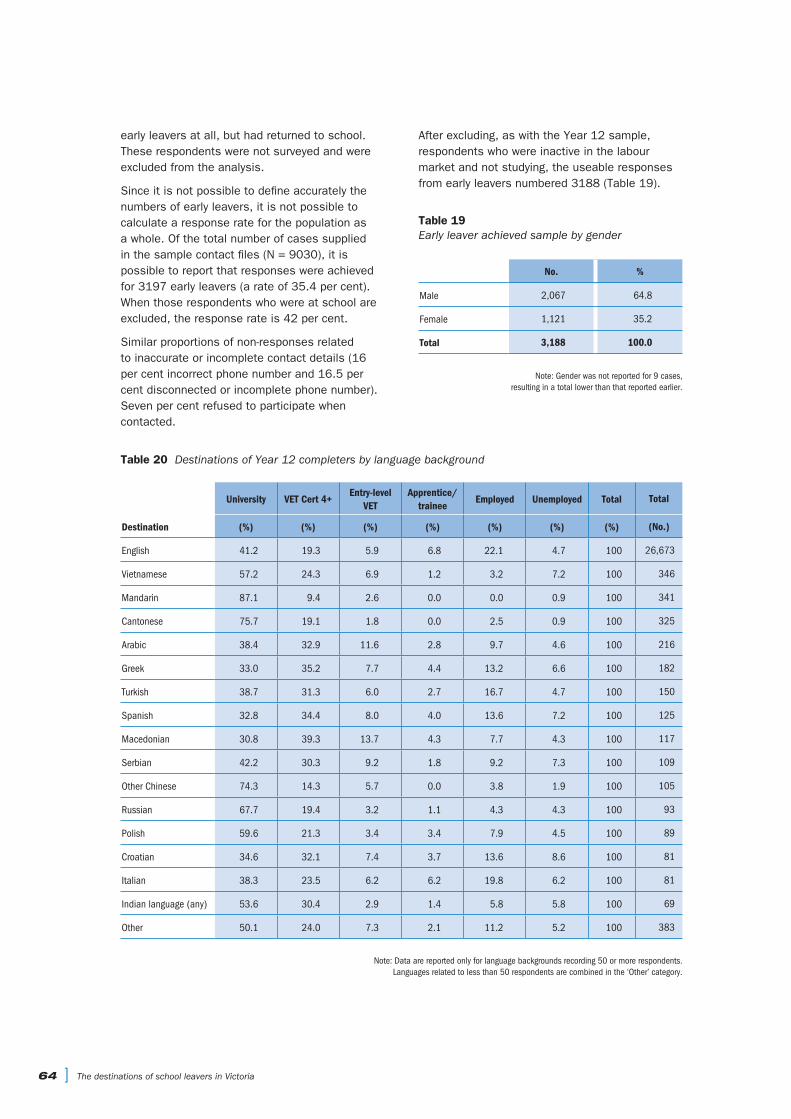
64 ] The destinations of school leavers in Victoria
early leavers at all, but had returned to school. These respondents were not surveyed and were excluded from the analysis.
Since it is not possible to define accurately the numbers of early leavers, it is not possible to calculate a response rate for the population as a whole. Of the total number of cases supplied in the sample contact files (N = 9030), it is possible to report that responses were achieved for 3197 early leavers (a rate of 35.4 per cent). When those respondents who were at school are excluded, the response rate is 42 per cent.
Similar proportions of non-responses related to inaccurate or incomplete contact details (16 per cent incorrect phone number and 16.5 per cent disconnected or incomplete phone number). Seven per cent refused to participate when contacted.
After excluding, as with the Year 12 sample, respondents who were inactive in the labour market and not studying, the useable responses from early leavers numbered 3188 (Table 19).
Table 19 Early leaver achieved sample by gender
No. %
Male 2,067 64.8
Female 1,121 35.2
Total 3,188 100.0
Note: Gender was not reported for 9 cases, resulting in a total lower than that reported earlier.
Table 20 Destinations of Year 12 completers by language background
University VET Cert 4+Entry-level
VETApprentice/
traineeEmployed Unemployed Total Total
Destination (%) (%) (%) (%) (%) (%) (%) (No.)
English 41.2 19.3 5.9 6.8 22.1 4.7 100 26,673
Vietnamese 57.2 24.3 6.9 1.2 3.2 7.2 100 346
Mandarin 87.1 9.4 2.6 0.0 0.0 0.9 100 341
Cantonese 75.7 19.1 1.8 0.0 2.5 0.9 100 325
Arabic 38.4 32.9 11.6 2.8 9.7 4.6 100 216
Greek 33.0 35.2 7.7 4.4 13.2 6.6 100 182
Turkish 38.7 31.3 6.0 2.7 16.7 4.7 100 150
Spanish 32.8 34.4 8.0 4.0 13.6 7.2 100 125
Macedonian 30.8 39.3 13.7 4.3 7.7 4.3 100 117
Serbian 42.2 30.3 9.2 1.8 9.2 7.3 100 109
Other Chinese 74.3 14.3 5.7 0.0 3.8 1.9 100 105
Russian 67.7 19.4 3.2 1.1 4.3 4.3 100 93
Polish 59.6 21.3 3.4 3.4 7.9 4.5 100 89
Croatian 34.6 32.1 7.4 3.7 13.6 8.6 100 81
Italian 38.3 23.5 6.2 6.2 19.8 6.2 100 81
Indian language (any) 53.6 30.4 2.9 1.4 5.8 5.8 100 69
Other 50.1 24.0 7.3 2.1 11.2 5.2 100 383
Note: Data are reported only for language backgrounds recording 50 or more respondents. Languages related to less than 50 respondents are combined in the ‘Other’ category.
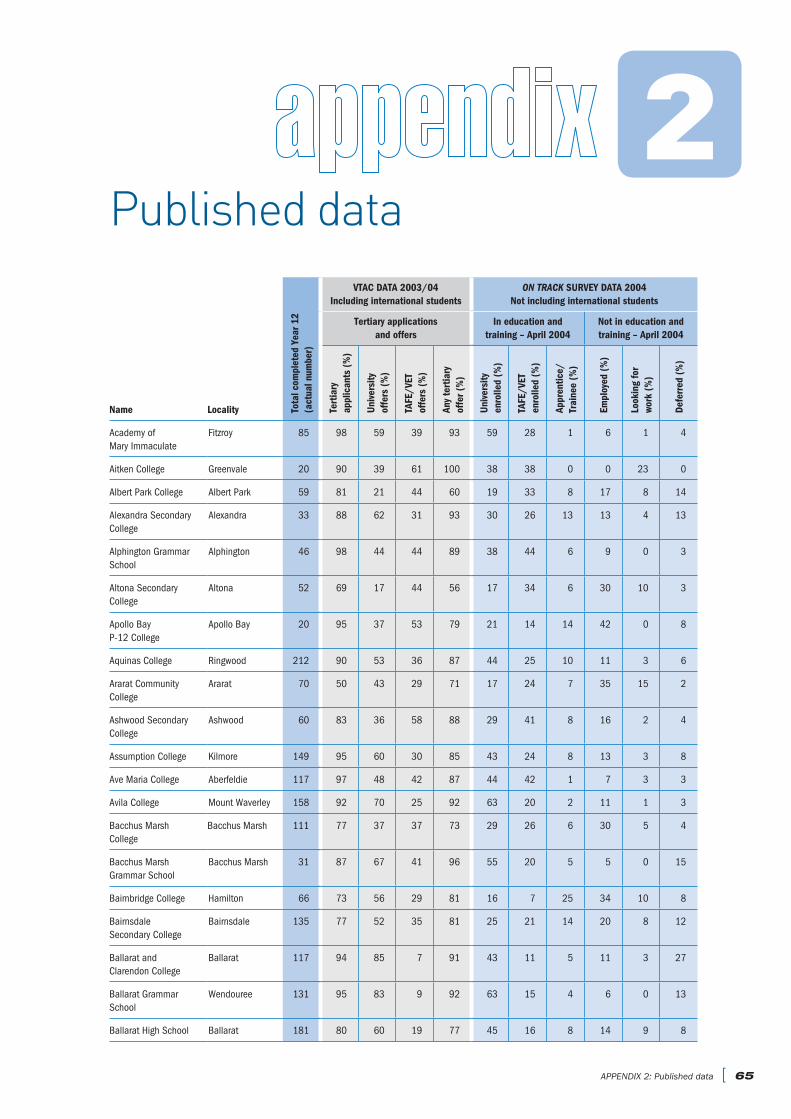
2Published data
APPENDIX 2: Published data [ 65
Tota
l com
plet
ed Y
ear 1
2(a
ctua
l num
ber)
VTAC DATA 2003/04Including international students
ON TRACK SURVEY DATA 2004 Not including international students
Tertiary applications and offers
In education and training – April 2004
Not in education and training – April 2004
Name Locality Tert
iary
appl
ican
ts (
%)
Uni
vers
ityof
fers
(%
)
TAFE
/VET
offe
rs (
%)
Any
tert
iary
offe
r (%
)
Uni
vers
ityen
rolle
d (%
)
TAFE
/VET
enro
lled
(%)
Appr
entic
e/Tr
aine
e (%
)
Empl
oyed
(%
)
Look
ing
for
wor
k (%
)
Defe
rred
(%
)
Academy of Mary Immaculate
Fitzroy 85 98 59 39 93 59 28 1 6 1 4
Aitken College Greenvale 20 90 39 61 100 38 38 0 0 23 0
Albert Park College Albert Park 59 81 21 44 60 19 33 8 17 8 14
Alexandra Secondary College
Alexandra 33 88 62 31 93 30 26 13 13 4 13
Alphington Grammar School
Alphington 46 98 44 44 89 38 44 6 9 0 3
Altona Secondary College
Altona 52 69 17 44 56 17 34 6 30 10 3
Apollo Bay P-12 College
Apollo Bay 20 95 37 53 79 21 14 14 42 0 8
Aquinas College Ringwood 212 90 53 36 87 44 25 10 11 3 6
Ararat Community College
Ararat 70 50 43 29 71 17 24 7 35 15 2
Ashwood Secondary College
Ashwood 60 83 36 58 88 29 41 8 16 2 4
Assumption College Kilmore 149 95 60 30 85 43 24 8 13 3 8
Ave Maria College Aberfeldie 117 97 48 42 87 44 42 1 7 3 3
Avila College Mount Waverley 158 92 70 25 92 63 20 2 11 1 3
Bacchus Marsh College
Bacchus Marsh 111 77 37 37 73 29 26 6 30 5 4
Bacchus Marsh Grammar School
Bacchus Marsh 31 87 67 41 96 55 20 5 5 0 15
Baimbridge College Hamilton 66 73 56 29 81 16 7 25 34 10 8
Bairnsdale Secondary College
Bairnsdale 135 77 52 35 81 25 21 14 20 8 12
Ballarat and Clarendon College
Ballarat 117 94 85 7 91 43 11 5 11 3 27
Ballarat Grammar School
Wendouree 131 95 83 9 92 63 15 4 6 0 13
Ballarat High School Ballarat 181 80 60 19 77 45 16 8 14 9 8
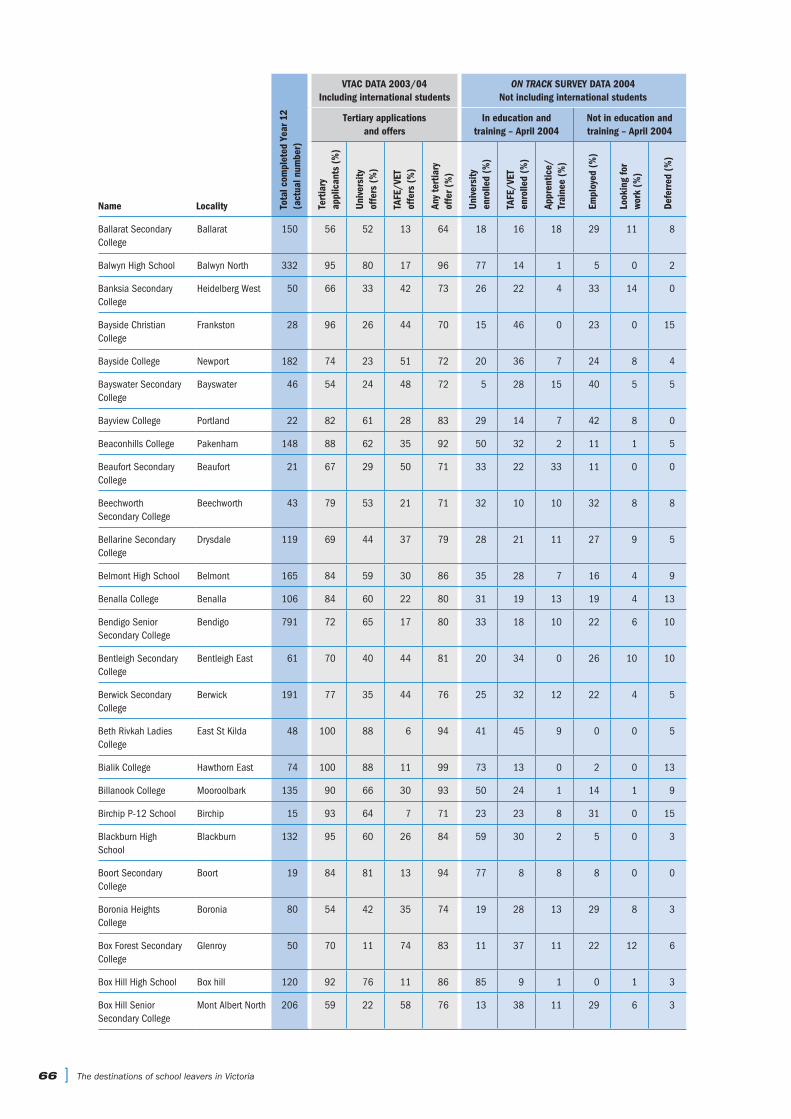
66 ] The destinations of school leavers in Victoria
Tota
l com
plet
ed Y
ear 1
2(a
ctua
l num
ber)
VTAC DATA 2003/04Including international students
ON TRACK SURVEY DATA 2004 Not including international students
Tertiary applications and offers
In education and training – April 2004
Not in education and training – April 2004
Name Locality Tert
iary
appl
ican
ts (
%)
Uni
vers
ityof
fers
(%
)
TAFE
/VET
offe
rs (
%)
Any
tert
iary
offe
r (%
)
Uni
vers
ityen
rolle
d (%
)
TAFE
/VET
enro
lled
(%)
Appr
entic
e/Tr
aine
e (%
)
Empl
oyed
(%
)
Look
ing
for
wor
k (%
)
Defe
rred
(%
)
Ballarat Secondary College
Ballarat 150 56 52 13 64 18 16 18 29 11 8
Balwyn High School Balwyn North 332 95 80 17 96 77 14 1 5 0 2
Banksia Secondary College
Heidelberg West 50 66 33 42 73 26 22 4 33 14 0
Bayside Christian College
Frankston 28 96 26 44 70 15 46 0 23 0 15
Bayside College Newport 182 74 23 51 72 20 36 7 24 8 4
Bayswater Secondary College
Bayswater 46 54 24 48 72 5 28 15 40 5 5
Bayview College Portland 22 82 61 28 83 29 14 7 42 8 0
Beaconhills College Pakenham 148 88 62 35 92 50 32 2 11 1 5
Beaufort Secondary College
Beaufort 21 67 29 50 71 33 22 33 11 0 0
Beechworth Secondary College
Beechworth 43 79 53 21 71 32 10 10 32 8 8
Bellarine Secondary College
Drysdale 119 69 44 37 79 28 21 11 27 9 5
Belmont High School Belmont 165 84 59 30 86 35 28 7 16 4 9
Benalla College Benalla 106 84 60 22 80 31 19 13 19 4 13
Bendigo Senior Secondary College
Bendigo 791 72 65 17 80 33 18 10 22 6 10
Bentleigh Secondary College
Bentleigh East 61 70 40 44 81 20 34 0 26 10 10
Berwick Secondary College
Berwick 191 77 35 44 76 25 32 12 22 4 5
Beth Rivkah Ladies College
East St Kilda 48 100 88 6 94 41 45 9 0 0 5
Bialik College Hawthorn East 74 100 88 11 99 73 13 0 2 0 13
Billanook College Mooroolbark 135 90 66 30 93 50 24 1 14 1 9
Birchip P-12 School Birchip 15 93 64 7 71 23 23 8 31 0 15
Blackburn High School
Blackburn 132 95 60 26 84 59 30 2 5 0 3
Boort Secondary College
Boort 19 84 81 13 94 77 8 8 8 0 0
Boronia Heights College
Boronia 80 54 42 35 74 19 28 13 29 8 3
Box Forest Secondary College
Glenroy 50 70 11 74 83 11 37 11 22 12 6
Box Hill High School Box hill 120 92 76 11 86 85 9 1 0 1 3
Box Hill Senior Secondary College
Mont Albert North 206 59 22 58 76 13 38 11 29 6 3

APPENDIX 2: Published data [ 67
Tota
l com
plet
ed Y
ear 1
2(a
ctua
l num
ber)
VTAC DATA 2003/04Including international students
ON TRACK SURVEY DATA 2004 Not including international students
Tertiary applications and offers
In education and training – April 2004
Not in education and training – April 2004
Name Locality Tert
iary
appl
ican
ts (
%)
Uni
vers
ityof
fers
(%
)
TAFE
/VET
offe
rs (
%)
Any
tert
iary
offe
r (%
)
Uni
vers
ityen
rolle
d (%
)
TAFE
/VET
enro
lled
(%)
Appr
entic
e/Tr
aine
e (%
)
Empl
oyed
(%
)
Look
ing
for
wor
k (%
)
Defe
rred
(%
)
Braemar College Woodend 67 97 82 20 97 77 11 2 0 2 9
Brauer College Warrnambool 153 71 71 19 83 30 12 21 16 3 18
Braybrook College Braybrook 102 95 22 59 80 22 47 1 16 11 2
Brentwood Secondary College
Glen Waverley 105 95 68 26 90 62 20 2 12 2 1
Bright P-12 College Bright 25 76 74 16 84 33 20 13 27 0 7
Brighton Grammar School
Brighton 100 97 86 13 97 87 10 0 3 0 0
Brighton Secondary College
Brighton East 107 79 58 33 88 45 30 4 15 4 2
Brimbank College St Albans 72 71 25 59 82 24 34 11 27 4 0
Broadford Secondary College
Broadford 53 75 35 43 75 25 25 13 26 6 6
Broadmeadows Secondary College
Broadmeadows 33 88 38 52 90 35 43 0 14 7 0
Brunswick Secondary College
Brunswick 47 94 45 45 89 45 33 0 9 0 12
Buckley Park College Essendon 59 80 28 53 79 20 41 7 24 5 3
Bundoora Secondary College
Bundoora 65 75 31 53 82 29 29 13 18 7 4
Camberwell Anglican Girls Grammar School
Canterbury 91 99 81 13 93 77 13 0 4 2 5
Camberwell Grammar School
Canterbury 164 99 88 12 99 80 13 0 2 0 6
Camberwell High School
Canterbury 158 91 65 29 93 61 20 4 8 4 4
Camperdown College Camperdown 15 80 25 67 92 8 50 17 17 0 8
Canterbury Girls Secondary College
Canterbury 167 98 70 24 91 60 23 1 10 0 5
Carey Baptist Grammar School
Kew 256 96 84 14 95 80 11 3 3 0 3
Caroline Chisholm Catholic College
Braybrook 193 90 43 47 87 38 41 2 12 4 3
Carwatha College P-12
Noble Park North 106 78 43 42 84 33 33 7 18 7 3
Casterton Secondary College
Casterton 21 62 15 54 69 13 13 25 50 0 0
Castlemaine Secondary College
Castlemaine 118 73 60 21 80 29 15 12 25 5 14
Catholic College Sale 118 80 55 33 81 44 18 18 12 6 3
Catholic College Bendigo 138 83 76 13 87 47 16 8 20 2 7
Catholic College Wodonga 143 76 69 23 86 45 17 14 14 2 8
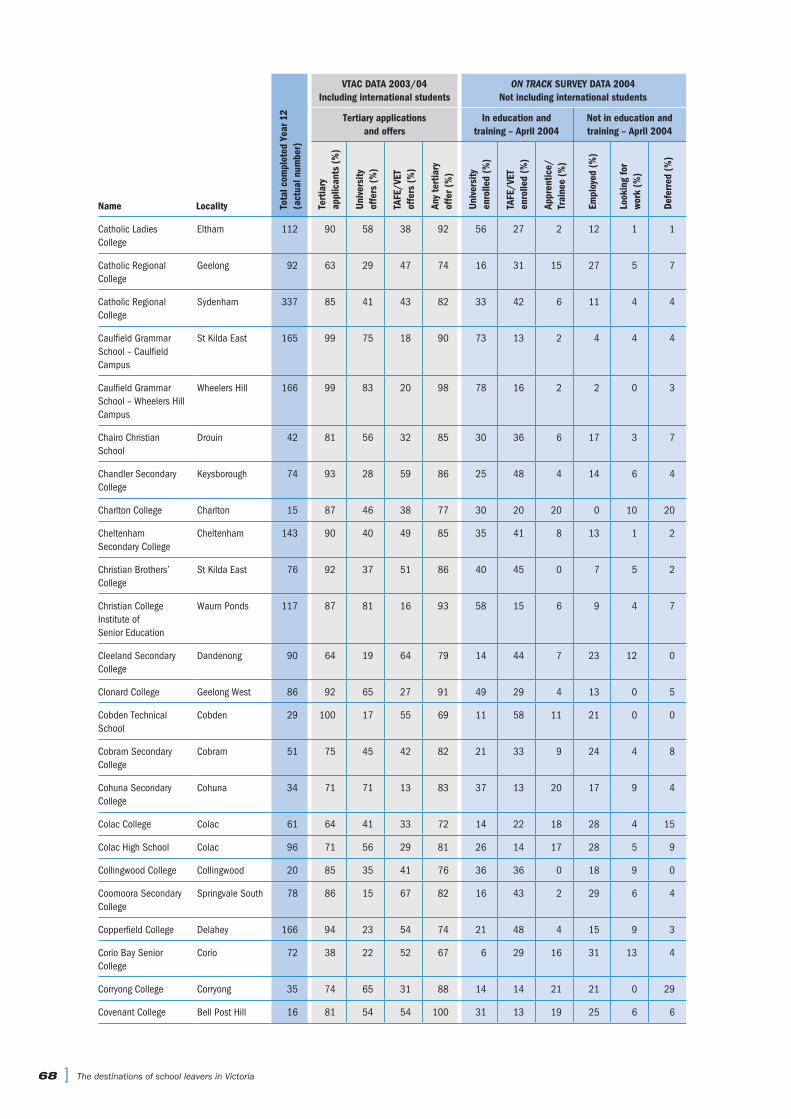
68 ] The destinations of school leavers in Victoria
Tota
l com
plet
ed Y
ear 1
2(a
ctua
l num
ber)
VTAC DATA 2003/04Including international students
ON TRACK SURVEY DATA 2004 Not including international students
Tertiary applications and offers
In education and training – April 2004
Not in education and training – April 2004
Name Locality Tert
iary
appl
ican
ts (
%)
Uni
vers
ityof
fers
(%
)
TAFE
/VET
offe
rs (
%)
Any
tert
iary
offe
r (%
)
Uni
vers
ityen
rolle
d (%
)
TAFE
/VET
enro
lled
(%)
Appr
entic
e/Tr
aine
e (%
)
Empl
oyed
(%
)
Look
ing
for
wor
k (%
)
Defe
rred
(%
)
Catholic Ladies College
Eltham 112 90 58 38 92 56 27 2 12 1 1
Catholic Regional College
Geelong 92 63 29 47 74 16 31 15 27 5 7
Catholic Regional College
Sydenham 337 85 41 43 82 33 42 6 11 4 4
Caulfield Grammar School – Caulfield Campus
St Kilda East 165 99 75 18 90 73 13 2 4 4 4
Caulfield Grammar School – Wheelers Hill Campus
Wheelers Hill 166 99 83 20 98 78 16 2 2 0 3
Chairo Christian School
Drouin 42 81 56 32 85 30 36 6 17 3 7
Chandler Secondary College
Keysborough 74 93 28 59 86 25 48 4 14 6 4
Charlton College Charlton 15 87 46 38 77 30 20 20 0 10 20
Cheltenham Secondary College
Cheltenham 143 90 40 49 85 35 41 8 13 1 2
Christian Brothers’ College
St Kilda East 76 92 37 51 86 40 45 0 7 5 2
Christian College Institute of Senior Education
Waurn Ponds 117 87 81 16 93 58 15 6 9 4 7
Cleeland Secondary College
Dandenong 90 64 19 64 79 14 44 7 23 12 0
Clonard College Geelong West 86 92 65 27 91 49 29 4 13 0 5
Cobden Technical School
Cobden 29 100 17 55 69 11 58 11 21 0 0
Cobram Secondary College
Cobram 51 75 45 42 82 21 33 9 24 4 8
Cohuna Secondary College
Cohuna 34 71 71 13 83 37 13 20 17 9 4
Colac College Colac 61 64 41 33 72 14 22 18 28 4 15
Colac High School Colac 96 71 56 29 81 26 14 17 28 5 9
Collingwood College Collingwood 20 85 35 41 76 36 36 0 18 9 0
Coomoora Secondary College
Springvale South 78 86 15 67 82 16 43 2 29 6 4
Copperfield College Delahey 166 94 23 54 74 21 48 4 15 9 3
Corio Bay Senior College
Corio 72 38 22 52 67 6 29 16 31 13 4
Corryong College Corryong 35 74 65 31 88 14 14 21 21 0 29
Covenant College Bell Post Hill 16 81 54 54 100 31 13 19 25 6 6
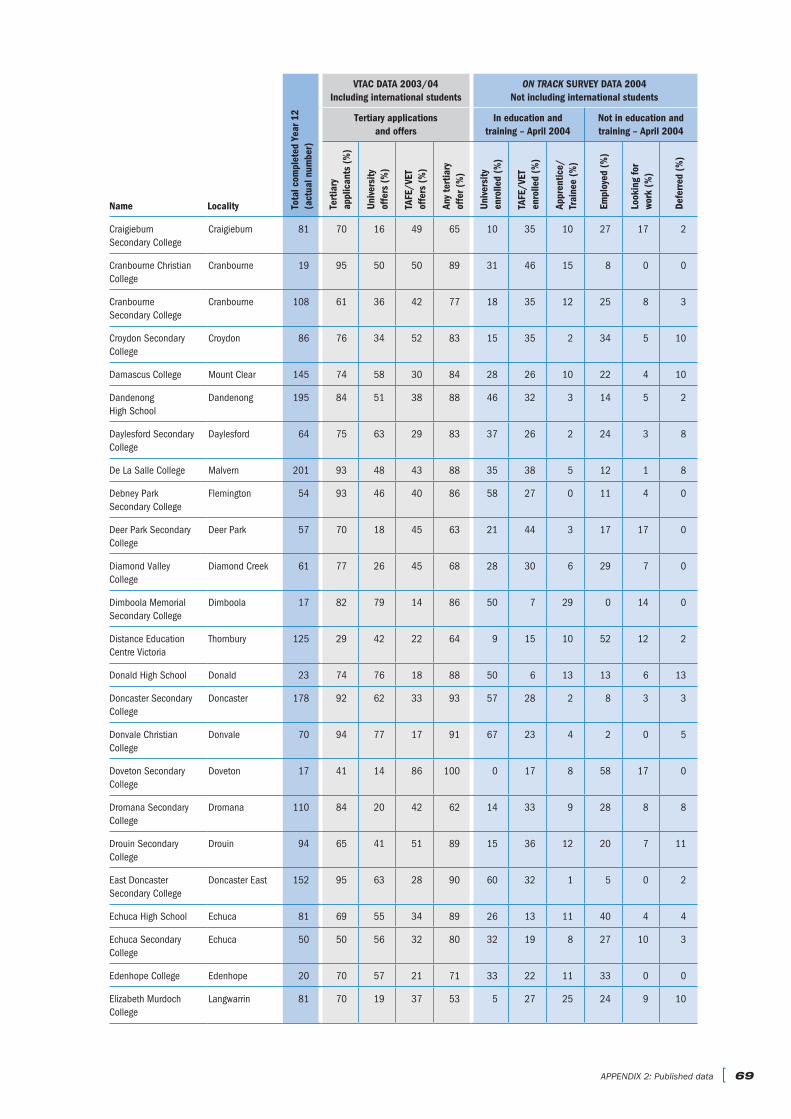
APPENDIX 2: Published data [ 69
Tota
l com
plet
ed Y
ear 1
2(a
ctua
l num
ber)
VTAC DATA 2003/04Including international students
ON TRACK SURVEY DATA 2004 Not including international students
Tertiary applications and offers
In education and training – April 2004
Not in education and training – April 2004
Name Locality Tert
iary
appl
ican
ts (
%)
Uni
vers
ityof
fers
(%
)
TAFE
/VET
offe
rs (
%)
Any
tert
iary
offe
r (%
)
Uni
vers
ityen
rolle
d (%
)
TAFE
/VET
enro
lled
(%)
Appr
entic
e/Tr
aine
e (%
)
Empl
oyed
(%
)
Look
ing
for
wor
k (%
)
Defe
rred
(%
)
Craigieburn Secondary College
Craigieburn 81 70 16 49 65 10 35 10 27 17 2
Cranbourne Christian College
Cranbourne 19 95 50 50 89 31 46 15 8 0 0
Cranbourne Secondary College
Cranbourne 108 61 36 42 77 18 35 12 25 8 3
Croydon Secondary College
Croydon 86 76 34 52 83 15 35 2 34 5 10
Damascus College Mount Clear 145 74 58 30 84 28 26 10 22 4 10
Dandenong High School
Dandenong 195 84 51 38 88 46 32 3 14 5 2
Daylesford Secondary College
Daylesford 64 75 63 29 83 37 26 2 24 3 8
De La Salle College Malvern 201 93 48 43 88 35 38 5 12 1 8
Debney Park Secondary College
Flemington 54 93 46 40 86 58 27 0 11 4 0
Deer Park Secondary College
Deer Park 57 70 18 45 63 21 44 3 17 17 0
Diamond Valley College
Diamond Creek 61 77 26 45 68 28 30 6 29 7 0
Dimboola Memorial Secondary College
Dimboola 17 82 79 14 86 50 7 29 0 14 0
Distance Education Centre Victoria
Thornbury 125 29 42 22 64 9 15 10 52 12 2
Donald High School Donald 23 74 76 18 88 50 6 13 13 6 13
Doncaster Secondary College
Doncaster 178 92 62 33 93 57 28 2 8 3 3
Donvale Christian College
Donvale 70 94 77 17 91 67 23 4 2 0 5
Doveton Secondary College
Doveton 17 41 14 86 100 0 17 8 58 17 0
Dromana Secondary College
Dromana 110 84 20 42 62 14 33 9 28 8 8
Drouin Secondary College
Drouin 94 65 41 51 89 15 36 12 20 7 11
East Doncaster Secondary College
Doncaster East 152 95 63 28 90 60 32 1 5 0 2
Echuca High School Echuca 81 69 55 34 89 26 13 11 40 4 4
Echuca Secondary College
Echuca 50 50 56 32 80 32 19 8 27 10 3
Edenhope College Edenhope 20 70 57 21 71 33 22 11 33 0 0
Elizabeth Murdoch College
Langwarrin 81 70 19 37 53 5 27 25 24 9 10

70 ] The destinations of school leavers in Victoria
Tota
l com
plet
ed Y
ear 1
2(a
ctua
l num
ber)
VTAC DATA 2003/04Including international students
ON TRACK SURVEY DATA 2004 Not including international students
Tertiary applications and offers
In education and training – April 2004
Not in education and training – April 2004
Name Locality Tert
iary
appl
ican
ts (
%)
Uni
vers
ityof
fers
(%
)
TAFE
/VET
offe
rs (
%)
Any
tert
iary
offe
r (%
)
Uni
vers
ityen
rolle
d (%
)
TAFE
/VET
enro
lled
(%)
Appr
entic
e/Tr
aine
e (%
)
Empl
oyed
(%
)
Look
ing
for
wor
k (%
)
Defe
rred
(%
)
Eltham College of Education
Research 157 91 73 30 94 67 17 2 6 1 7
Eltham High School Eltham 173 84 51 38 86 38 30 4 17 6 6
Elwood College Elwood 141 79 54 34 82 42 34 0 13 8 2
Emerald Secondary College
Emerald 122 95 38 58 91 34 37 7 14 1 8
Emmanuel College Warrnambool 69 97 61 36 96 38 13 13 15 0 23
Emmaus College Burwood 138 87 52 38 88 39 30 11 11 4 5
Epping Secondary College
Epping 53 89 21 57 77 21 28 8 29 11 4
Erinbank Secondary College
Westmeadows 53 81 21 65 84 13 55 11 13 8 0
Essendon Keilor College
Essendon 340 93 30 48 77 29 36 6 18 5 6
Eumemmerring College
Hallam 325 70 23 60 79 16 40 10 25 6 2
Euroa Secondary College
Euroa 28 100 46 32 75 45 18 9 18 0 9
F.C.J. College Benalla 29 93 63 22 85 48 10 14 11 11 6
Fairhills High School Knoxfield 108 86 47 48 91 37 32 10 16 1 4
Fawkner Secondary College
Fawkner 55 82 22 56 76 20 37 9 22 6 6
Ferntree Gully College Ferntree Gully 20 100 10 50 60 15 38 8 38 0 0
Fintona Girls School Balwyn 51 96 94 4 98 95 5 0 0 0 0
Firbank Grammar School
Brighton 91 100 75 16 91 70 17 0 4 0 9
Flinders Christian Community College
Tyabb 75 93 43 37 79 31 25 10 22 0 13
Footscray City College Footscray 185 82 27 36 63 27 35 7 15 13 3
Forest Hill College Burwood East 138 78 40 42 79 24 41 6 17 9 3
Frankston High School
Frankston 224 84 62 31 89 40 20 6 14 5 14
Galen College Wangaratta 107 87 59 25 83 29 23 16 12 5 14
Galvin Park Secondary College
Werribee 114 93 15 64 77 12 52 8 16 9 3
Geelong Grammar School
Corio 187 96 82 12 91 57 6 4 10 0 23
Geelong High School Geelong East 130 74 48 34 78 33 21 9 19 12 6
Genazzano F.C.J. College
Kew 151 100 87 13 99 84 9 0 4 0 3
Gilmore College for Girls
Footscray 46 93 30 49 79 25 50 0 11 7 7

APPENDIX 2: Published data [ 71
Tota
l com
plet
ed Y
ear 1
2(a
ctua
l num
ber)
VTAC DATA 2003/04Including international students
ON TRACK SURVEY DATA 2004 Not including international students
Tertiary applications and offers
In education and training – April 2004
Not in education and training – April 2004
Name Locality Tert
iary
appl
ican
ts (
%)
Uni
vers
ityof
fers
(%
)
TAFE
/VET
offe
rs (
%)
Any
tert
iary
offe
r (%
)
Uni
vers
ityen
rolle
d (%
)
TAFE
/VET
enro
lled
(%)
Appr
entic
e/Tr
aine
e (%
)
Empl
oyed
(%
)
Look
ing
for
wor
k (%
)
Defe
rred
(%
)
Gilson College Taylors Hill 15 93 50 29 79 83 8 0 0 8 0
Gippsland Grammar School
Sale 78 95 77 22 95 58 14 2 6 2 18
Girton Grammar School
Bendigo 76 99 95 5 99 85 6 0 2 0 7
Gisborne Secondary College
Gisborne 127 79 49 38 81 35 22 11 19 7 6
Gladstone Park Secondary College
Gladstone Park 170 88 43 43 84 45 27 9 14 4 2
Glen Eira College Caulfield South 36 100 42 36 72 42 31 4 19 0 4
Glen Waverley Secondary College
Glen Waverley 276 99 78 18 94 71 20 4 3 1 2
Good Shepherd College
Hamilton 20 70 71 14 86 31 13 25 13 0 19
Goulburn Valley Grammar School
Shepparton 55 98 80 6 85 71 6 3 7 3 10
Greensborough Secondary College
Greensborough 33 97 31 59 88 19 54 12 5 5 5
Grovedale College Grovedale 94 71 54 28 76 32 17 8 28 9 6
Haileybury College Keysborough 196 98 82 16 96 77 11 3 1 1 6
Hampton Park Secondary College
Hampton Park 132 70 25 67 88 23 43 7 19 7 0
Hawthorn Secondary College
Hawthorn East 130 46 43 35 77 29 50 2 16 2 2
Healesville High School
Healesville 51 86 20 50 70 7 36 7 29 5 16
Heathdale Christian College
Werribee 48 90 53 44 95 46 29 7 9 6 3
Heatherhill Secondary College
Springvale South 86 80 28 57 84 27 42 2 14 12 4
Heathmont College Heathmont 115 77 36 48 83 23 39 6 24 5 4
Heywood and District Secondary College
Heywood 31 55 35 18 47 16 16 21 41 0 6
Highvale Secondary College
Glen Waverley 113 87 55 39 92 48 26 8 16 1 0
Highview Christian Community College
Maryborough 37 86 78 19 91 41 22 7 13 4 13
Hillcrest Christian College
Clyde North 32 59 47 37 79 26 43 0 8 15 8
Hillcrest Secondary College
Broadmeadows 34 82 7 64 71 5 43 10 19 19 5
Hoppers Crossing Secondary College
Hoppers Crossing 106 69 21 56 77 16 44 3 30 6 0

72 ] The destinations of school leavers in Victoria
Tota
l com
plet
ed Y
ear 1
2(a
ctua
l num
ber)
VTAC DATA 2003/04Including international students
ON TRACK SURVEY DATA 2004 Not including international students
Tertiary applications and offers
In education and training – April 2004
Not in education and training – April 2004
Name Locality Tert
iary
appl
ican
ts (
%)
Uni
vers
ityof
fers
(%
)
TAFE
/VET
offe
rs (
%)
Any
tert
iary
offe
r (%
)
Uni
vers
ityen
rolle
d (%
)
TAFE
/VET
enro
lled
(%)
Appr
entic
e/Tr
aine
e (%
)
Empl
oyed
(%
)
Look
ing
for
wor
k (%
)
Defe
rred
(%
)
Horsham College Horsham 122 72 69 10 75 33 15 17 22 1 13
Huntingtower School Mount Waverley 38 97 86 11 95 84 16 0 0 0 0
Isik College Broadmeadows 26 100 73 19 92 74 5 0 0 5 16
Ivanhoe Girls’ Grammar School
Ivanhoe 135 97 84 11 95 82 14 1 1 0 2
Ivanhoe Grammar School
Ivanhoe 198 96 83 14 94 77 9 3 4 0 7
John Paul College Frankston 162 89 41 40 81 30 30 8 22 2 9
Kardinia International College
Bell Post Hill 98 97 81 16 95 77 11 3 2 0 8
Karingal Park Secondary College
Frankston 180 79 33 51 82 21 36 11 23 4 6
Kealba Secondary College
Kealba 49 92 18 69 87 19 53 0 21 7 0
Keilor Downs College Keilor Downs 196 87 34 56 86 35 38 8 14 3 2
Kerang Technical High School
Kerang 68 96 60 22 78 52 24 2 15 2 4
Kew High School Kew East 132 95 67 26 92 55 24 2 12 1 5
Kilbreda College Mentone 158 99 54 39 87 57 25 3 10 2 3
Killester College Springvale 115 96 50 44 90 50 34 1 7 5 3
Kilvington Baptist Girls’ Grammar School
Ormond 49 94 83 11 93 76 17 0 2 0 5
King Khalid Islamic College
Coburg 35 83 62 41 97 63 33 0 4 0 0
Kingswood College Box hill 85 98 63 23 84 53 28 5 14 0 0
Koo Wee Rup Secondary College
Koo Wee Rup 63 63 43 43 78 30 26 7 28 7 2
Koonung Secondary College
Mont Albert North 93 88 51 37 85 33 33 7 15 5 8
Korowa Anglican Girls’ School
Glen Iris 69 97 91 9 99 98 0 0 2 0 0
Korumburra Secondary College
Korumburra 44 75 61 27 88 30 23 20 17 3 7
Kurnai College Morwell 112 60 37 33 70 27 29 5 26 8 5
Kurunjang Secondary College
Melton 92 82 23 45 67 20 46 7 21 5 2
Kyabram Secondary College
Kyabram 108 72 49 35 83 30 20 22 16 9 3
Kyneton Secondary College
Kyneton 66 82 33 52 81 18 34 16 12 8 12
La Trobe Secondary College
Macleod 29 97 7 75 79 8 38 13 38 4 0
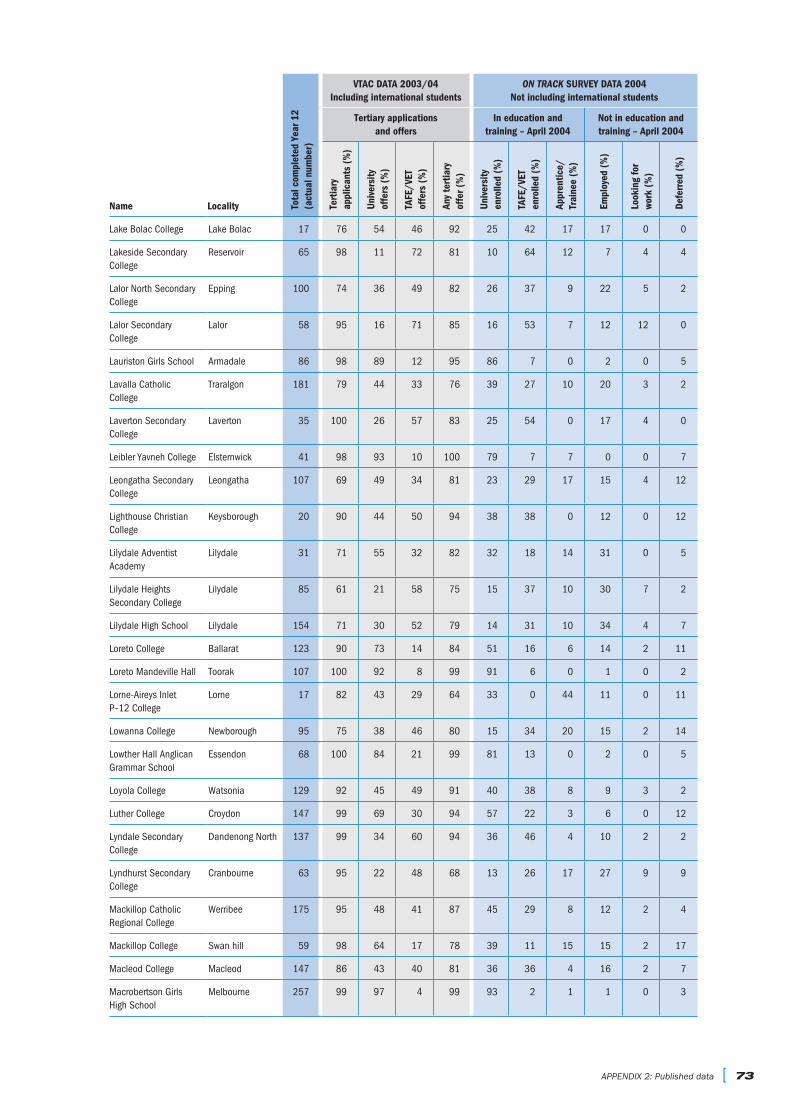
APPENDIX 2: Published data [ 73
Tota
l com
plet
ed Y
ear 1
2(a
ctua
l num
ber)
VTAC DATA 2003/04Including international students
ON TRACK SURVEY DATA 2004 Not including international students
Tertiary applications and offers
In education and training – April 2004
Not in education and training – April 2004
Name Locality Tert
iary
appl
ican
ts (
%)
Uni
vers
ityof
fers
(%
)
TAFE
/VET
offe
rs (
%)
Any
tert
iary
offe
r (%
)
Uni
vers
ityen
rolle
d (%
)
TAFE
/VET
enro
lled
(%)
Appr
entic
e/Tr
aine
e (%
)
Empl
oyed
(%
)
Look
ing
for
wor
k (%
)
Defe
rred
(%
)
Lake Bolac College Lake Bolac 17 76 54 46 92 25 42 17 17 0 0
Lakeside Secondary College
Reservoir 65 98 11 72 81 10 64 12 7 4 4
Lalor North Secondary College
Epping 100 74 36 49 82 26 37 9 22 5 2
Lalor Secondary College
Lalor 58 95 16 71 85 16 53 7 12 12 0
Lauriston Girls School Armadale 86 98 89 12 95 86 7 0 2 0 5
Lavalla Catholic College
Traralgon 181 79 44 33 76 39 27 10 20 3 2
Laverton Secondary College
Laverton 35 100 26 57 83 25 54 0 17 4 0
Leibler Yavneh College Elsternwick 41 98 93 10 100 79 7 7 0 0 7
Leongatha Secondary College
Leongatha 107 69 49 34 81 23 29 17 15 4 12
Lighthouse Christian College
Keysborough 20 90 44 50 94 38 38 0 12 0 12
Lilydale Adventist Academy
Lilydale 31 71 55 32 82 32 18 14 31 0 5
Lilydale Heights Secondary College
Lilydale 85 61 21 58 75 15 37 10 30 7 2
Lilydale High School Lilydale 154 71 30 52 79 14 31 10 34 4 7
Loreto College Ballarat 123 90 73 14 84 51 16 6 14 2 11
Loreto Mandeville Hall Toorak 107 100 92 8 99 91 6 0 1 0 2
Lorne-Aireys Inlet P–12 College
Lorne 17 82 43 29 64 33 0 44 11 0 11
Lowanna College Newborough 95 75 38 46 80 15 34 20 15 2 14
Lowther Hall Anglican Grammar School
Essendon 68 100 84 21 99 81 13 0 2 0 5
Loyola College Watsonia 129 92 45 49 91 40 38 8 9 3 2
Luther College Croydon 147 99 69 30 94 57 22 3 6 0 12
Lyndale Secondary College
Dandenong North 137 99 34 60 94 36 46 4 10 2 2
Lyndhurst Secondary College
Cranbourne 63 95 22 48 68 13 26 17 27 9 9
Mackillop Catholic Regional College
Werribee 175 95 48 41 87 45 29 8 12 2 4
Mackillop College Swan hill 59 98 64 17 78 39 11 15 15 2 17
Macleod College Macleod 147 86 43 40 81 36 36 4 16 2 7
Macrobertson Girls High School
Melbourne 257 99 97 4 99 93 2 1 1 0 3

74 ] The destinations of school leavers in Victoria
Tota
l com
plet
ed Y
ear 1
2(a
ctua
l num
ber)
VTAC DATA 2003/04Including international students
ON TRACK SURVEY DATA 2004 Not including international students
Tertiary applications and offers
In education and training – April 2004
Not in education and training – April 2004
Name Locality Tert
iary
appl
ican
ts (
%)
Uni
vers
ityof
fers
(%
)
TAFE
/VET
offe
rs (
%)
Any
tert
iary
offe
r (%
)
Uni
vers
ityen
rolle
d (%
)
TAFE
/VET
enro
lled
(%)
Appr
entic
e/Tr
aine
e (%
)
Empl
oyed
(%
)
Look
ing
for
wor
k (%
)
Defe
rred
(%
)
Maffra Secondary College
Maffra 78 82 55 30 81 35 18 16 8 12 12
Mansfield Secondary College
Mansfield 46 72 79 15 91 65 4 4 22 0 5
Maranatha Christian School
Endeavour hills 57 91 60 40 90 47 29 2 10 2 10
Marcellin College Bulleen 185 91 50 46 93 51 31 5 8 2 4
Marian College Ararat 47 74 69 17 80 39 6 3 41 0 10
Marian College Sunshine west 109 97 37 54 87 37 46 3 10 1 2
Marian College Myrtleford 20 85 35 41 76 31 25 13 23 0 8
Maribyrnong Secondary College
Maribyrnong 51 98 22 58 78 35 44 3 7 7 4
Marist Sion College Warragul 95 83 54 33 87 38 22 6 19 1 14
Maroondah Secondary College
Croydon 50 82 49 29 78 39 36 3 19 4 0
Mary Mackillop Catholic Regional College
Leongatha 33 94 48 29 74 30 15 4 24 5 24
Maryborough Regional College
Maryborough 87 67 52 21 69 25 26 8 16 16 10
Mater Christi College Belgrave 155 94 63 27 89 56 22 1 11 3 8
Matthew Flinders Girls’ Secondary College
Geelong 136 82 63 24 82 42 18 4 22 5 8
Mazenod College Mulgrave 144 92 73 27 96 64 22 4 7 1 2
Mcguire College Shepparton 60 60 31 47 78 20 25 15 32 5 3
Mckinnon Secondary College
Mckinnon 187 94 68 27 93 58 27 5 7 1 3
Melbourne Girls’ College
Richmond 164 98 71 17 86 68 16 0 11 0 4
Melbourne Girls Grammar
South Yarra 118 98 89 13 97 78 7 0 3 3 9
Melbourne Grammar School
Melbourne 194 99 87 13 96 85 8 2 2 0 3
Melbourne High School
South Yarra 329 100 95 6 99 93 4 0 1 0 2
Melbourne Rudolf Steiner School
Warranwood 39 82 69 16 81 21 3 0 27 4 46
Melton Secondary College
Melton 135 76 28 31 59 22 28 14 24 9 2
Mentone Girls’ Grammar School
Mentone 89 100 72 28 96 68 17 0 5 0 10
Mentone Girls’ Secondary College
Mentone 176 94 60 33 91 55 26 1 10 2 6

APPENDIX 2: Published data [ 75
Tota
l com
plet
ed Y
ear 1
2(a
ctua
l num
ber)
VTAC DATA 2003/04Including international students
ON TRACK SURVEY DATA 2004 Not including international students
Tertiary applications and offers
In education and training – April 2004
Not in education and training – April 2004
Name Locality Tert
iary
appl
ican
ts (
%)
Uni
vers
ityof
fers
(%
)
TAFE
/VET
offe
rs (
%)
Any
tert
iary
offe
r (%
)
Uni
vers
ityen
rolle
d (%
)
TAFE
/VET
enro
lled
(%)
Appr
entic
e/Tr
aine
e (%
)
Empl
oyed
(%
)
Look
ing
for
wor
k (%
)
Defe
rred
(%
)
Mentone Grammar School
Mentone 103 96 75 16 89 59 8 4 12 3 13
Mercy Diocesan College
Coburg 104 99 38 49 84 46 34 4 11 2 3
Mercy Regional College Camperdown
Camperdown 44 98 67 19 86 57 11 11 10 0 10
Merrilands College Prep–12
Reservoir 53 77 10 63 73 12 55 2 17 14 0
Methodist Ladies College
Kew 325 100 85 16 96 78 14 0 2 0 6
Mildura Senior College
Mildura 258 63 56 19 74 33 19 10 27 4 6
Mill Park Secondary College
Epping 241 78 34 52 84 26 37 7 19 5 6
Minaret College Springvale 29 97 39 32 71 50 44 0 0 6 0
Mirboo North Secondary College
Mirboo North 58 97 50 29 77 37 28 14 9 6 6
Mitchell Secondary College
Wodonga 117 62 38 29 65 18 26 17 26 9 5
Monash Secondary College
Notting Hill 32 91 31 41 72 17 44 0 28 6 6
Monbulk College Monbulk 54 96 29 42 71 22 34 5 30 3 6
Monivae College Hamilton 69 75 58 37 90 18 23 30 17 2 10
Monterey Secondary College
Frankston North 71 82 19 60 79 17 50 2 20 11 0
Montmorency Secondary College
Montmorency 132 92 30 65 93 32 45 6 10 3 4
Mooroolbark College Mooroolbark 118 82 19 68 85 11 46 10 25 4 5
Mooroopna Secondary College
Mooroopna 96 52 54 22 74 21 16 13 28 7 16
Mordialloc College Mordialloc 88 76 37 36 72 30 33 9 18 4 6
Moreland City College Coburg 33 91 17 80 93 18 55 0 18 9 0
Mornington Secondary College
Mornington 64 81 27 52 73 16 30 8 39 3 3
Mount Beauty Secondary College
Mount Beauty 25 88 55 36 91 26 16 16 26 5 11
Mount Clear College Mount Clear 112 59 59 20 74 28 22 10 18 14 7
Mount Eliza Secondary College
Mount Eliza 170 86 47 37 82 29 32 8 13 6 12
Mount Erin Secondary College
Frankston 87 68 20 53 73 11 35 24 25 2 3
Mount Evelyn Christian School
Mount Evelyn 27 81 55 18 68 25 25 4 23 9 14
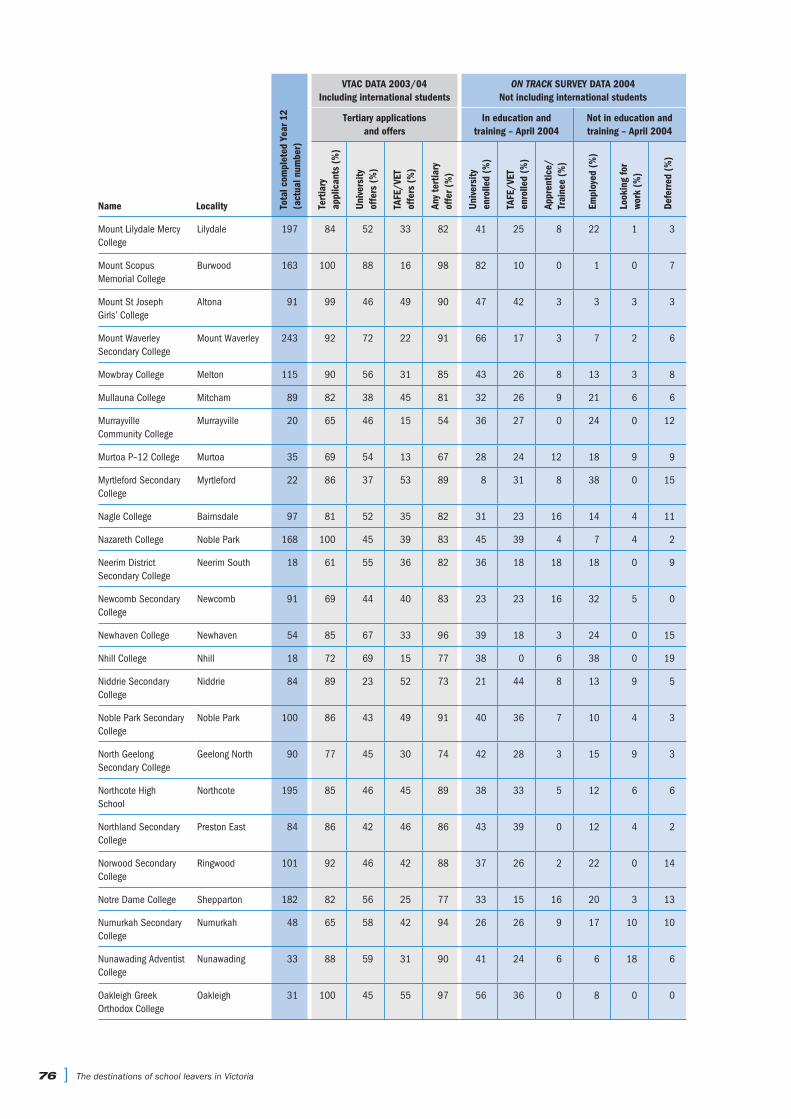
76 ] The destinations of school leavers in Victoria
Tota
l com
plet
ed Y
ear 1
2(a
ctua
l num
ber)
VTAC DATA 2003/04Including international students
ON TRACK SURVEY DATA 2004 Not including international students
Tertiary applications and offers
In education and training – April 2004
Not in education and training – April 2004
Name Locality Tert
iary
appl
ican
ts (
%)
Uni
vers
ityof
fers
(%
)
TAFE
/VET
offe
rs (
%)
Any
tert
iary
offe
r (%
)
Uni
vers
ityen
rolle
d (%
)
TAFE
/VET
enro
lled
(%)
Appr
entic
e/Tr
aine
e (%
)
Empl
oyed
(%
)
Look
ing
for
wor
k (%
)
Defe
rred
(%
)
Mount Lilydale Mercy College
Lilydale 197 84 52 33 82 41 25 8 22 1 3
Mount Scopus Memorial College
Burwood 163 100 88 16 98 82 10 0 1 0 7
Mount St Joseph Girls’ College
Altona 91 99 46 49 90 47 42 3 3 3 3
Mount Waverley Secondary College
Mount Waverley 243 92 72 22 91 66 17 3 7 2 6
Mowbray College Melton 115 90 56 31 85 43 26 8 13 3 8
Mullauna College Mitcham 89 82 38 45 81 32 26 9 21 6 6
Murrayville Community College
Murrayville 20 65 46 15 54 36 27 0 24 0 12
Murtoa P–12 College Murtoa 35 69 54 13 67 28 24 12 18 9 9
Myrtleford Secondary College
Myrtleford 22 86 37 53 89 8 31 8 38 0 15
Nagle College Bairnsdale 97 81 52 35 82 31 23 16 14 4 11
Nazareth College Noble Park 168 100 45 39 83 45 39 4 7 4 2
Neerim District Secondary College
Neerim South 18 61 55 36 82 36 18 18 18 0 9
Newcomb Secondary College
Newcomb 91 69 44 40 83 23 23 16 32 5 0
Newhaven College Newhaven 54 85 67 33 96 39 18 3 24 0 15
Nhill College Nhill 18 72 69 15 77 38 0 6 38 0 19
Niddrie Secondary College
Niddrie 84 89 23 52 73 21 44 8 13 9 5
Noble Park Secondary College
Noble Park 100 86 43 49 91 40 36 7 10 4 3
North Geelong Secondary College
Geelong North 90 77 45 30 74 42 28 3 15 9 3
Northcote High School
Northcote 195 85 46 45 89 38 33 5 12 6 6
Northland Secondary College
Preston East 84 86 42 46 86 43 39 0 12 4 2
Norwood Secondary College
Ringwood 101 92 46 42 88 37 26 2 22 0 14
Notre Dame College Shepparton 182 82 56 25 77 33 15 16 20 3 13
Numurkah Secondary College
Numurkah 48 65 58 42 94 26 26 9 17 10 10
Nunawading Adventist College
Nunawading 33 88 59 31 90 41 24 6 6 18 6
Oakleigh Greek Orthodox College
Oakleigh 31 100 45 55 97 56 36 0 8 0 0

APPENDIX 2: Published data [ 77
Tota
l com
plet
ed Y
ear 1
2(a
ctua
l num
ber)
VTAC DATA 2003/04Including international students
ON TRACK SURVEY DATA 2004 Not including international students
Tertiary applications and offers
In education and training – April 2004
Not in education and training – April 2004
Name Locality Tert
iary
appl
ican
ts (
%)
Uni
vers
ityof
fers
(%
)
TAFE
/VET
offe
rs (
%)
Any
tert
iary
offe
r (%
)
Uni
vers
ityen
rolle
d (%
)
TAFE
/VET
enro
lled
(%)
Appr
entic
e/Tr
aine
e (%
)
Empl
oyed
(%
)
Look
ing
for
wor
k (%
)
Defe
rred
(%
)
Oberon High School Belmont 128 77 63 32 92 40 17 15 13 1 13
Orbost Secondary College
Orbost 40 68 70 26 93 40 12 20 14 14 0
Our Lady of Mercy College
Heidelberg 150 97 66 34 95 65 26 1 3 2 3
Our Lady of Sacred Heart College
Bentleigh 103 94 63 36 96 57 27 4 5 0 8
Our Lady of Sion College
Box hill 103 99 65 25 88 61 19 3 6 2 8
Ovens College Wangaratta 30 70 24 24 48 11 21 11 51 0 7
Overnewton Anglican Community College
Keilor 142 95 70 23 90 61 20 3 11 1 4
Oxley College Chirnside Park 76 97 77 18 91 76 11 0 8 3 3
Padua College Mornington 200 85 53 34 85 38 22 7 21 2 10
Pakenham Secondary College
Pakenham 86 77 24 53 74 16 38 9 15 12 12
Parade College Bundoora 222 84 39 52 87 35 40 12 8 1 4
Parkdale Secondary College
Mordialloc 111 83 46 36 82 30 34 7 18 0 10
Parkwood Secondary College
Ringwood North 47 94 25 52 77 29 47 3 16 3 3
Pascoe Vale Girls Secondary College
Pascoe Vale 193 95 42 49 89 35 34 4 11 7 8
Patterson River Secondary College
Carrum 129 78 39 46 83 30 39 8 20 0 4
Pembroke Secondary College
Mooroolbark 145 88 29 47 74 20 32 11 27 4 6
Penleigh and Essendon Grammar School
Keilor East 220 99 86 12 96 81 9 1 4 1 3
Penola Catholic College
Broadmeadows 188 88 37 49 82 36 36 8 9 6 6
Peter Lalor Secondary College
Lalor 37 95 11 63 74 15 41 7 19 9 9
Plenty Valley Christian School
Doreen 68 87 46 39 83 34 32 2 12 0 20
Portland Secondary College
Portland 82 67 56 31 84 24 26 13 29 0 8
Presbyterian Ladies’ College
Burwood 176 100 94 6 99 92 4 2 0 1 1
Presentation College Windsor
Windsor 111 97 56 31 84 48 36 2 10 0 3

78 ] The destinations of school leavers in Victoria
Tota
l com
plet
ed Y
ear 1
2(a
ctua
l num
ber)
VTAC DATA 2003/04Including international students
ON TRACK SURVEY DATA 2004 Not including international students
Tertiary applications and offers
In education and training – April 2004
Not in education and training – April 2004
Name Locality Tert
iary
appl
ican
ts (
%)
Uni
vers
ityof
fers
(%
)
TAFE
/VET
offe
rs (
%)
Any
tert
iary
offe
r (%
)
Uni
vers
ityen
rolle
d (%
)
TAFE
/VET
enro
lled
(%)
Appr
entic
e/Tr
aine
e (%
)
Empl
oyed
(%
)
Look
ing
for
wor
k (%
)
Defe
rred
(%
)
Preshil the Margaret Lyttle Memorial School
Kew 20 100 80 25 90 70 10 0 0 0 20
Preston Girls Secondary College
Preston 36 89 13 78 88 15 54 8 17 6 0
Princes Hill Secondary College
Carlton North 105 92 60 30 84 51 31 1 7 1 7
Red Cliffs Secondary College
Red Cliffs 45 64 72 10 83 34 18 11 23 9 6
Reservoir District Secondary College
Reservoir 117 81 26 49 73 23 53 1 16 6 1
Ringwood Secondary College
Ringwood 187 83 58 31 86 45 25 7 15 5 3
Robinvale Secondary College
Robinvale 23 78 50 28 78 19 13 19 43 7 0
Rochester Secondary College
Rochester 62 84 65 15 79 45 14 5 22 0 14
Rosebud Secondary College
Rosebud 121 75 55 29 80 22 21 9 21 3 24
Rowville Secondary College
Rowville 193 69 38 44 78 31 29 9 24 6 2
Roxburgh College Dallas 70 100 24 71 96 36 40 4 9 11 0
Rushworth P–12 College
Rushworth 36 61 59 23 82 29 24 10 13 25 0
Rutherglen High School
Rutherglen 40 78 74 13 81 38 22 9 17 3 10
Ruyton Girls’ School Kew 58 100 91 9 98 90 8 0 0 0 2
Sacre Coeur Glen Iris 66 98 77 22 97 74 25 2 0 0 0
Sacred Heart College Kyneton 77 94 50 42 89 58 22 4 9 0 7
Sacred Heart College Newtown 213 94 77 19 92 33 21 14 15 4 15
Sacred Heart Girls’ College
Oakleigh 147 98 76 27 95 74 20 1 4 0 0
Sale College Sale 102 69 27 46 71 14 24 19 32 7 4
Salesian College Chadstone 102 92 52 40 93 46 34 7 9 0 3
Salesian College Sunbury 124 95 52 36 84 48 26 4 11 5 6
Samaritan Catholic College
Preston 101 88 34 49 80 33 45 7 10 4 0
Sandringham College Sandringham 301 71 33 51 81 23 33 6 21 7 9
Santa Maria College Northcote 149 99 51 39 85 48 34 2 12 1 3
Scoresby Secondary College
Scoresby 66 76 32 56 84 18 38 5 16 13 11
Scotch College Hawthorn 229 99 89 12 98 81 4 2 4 0 9
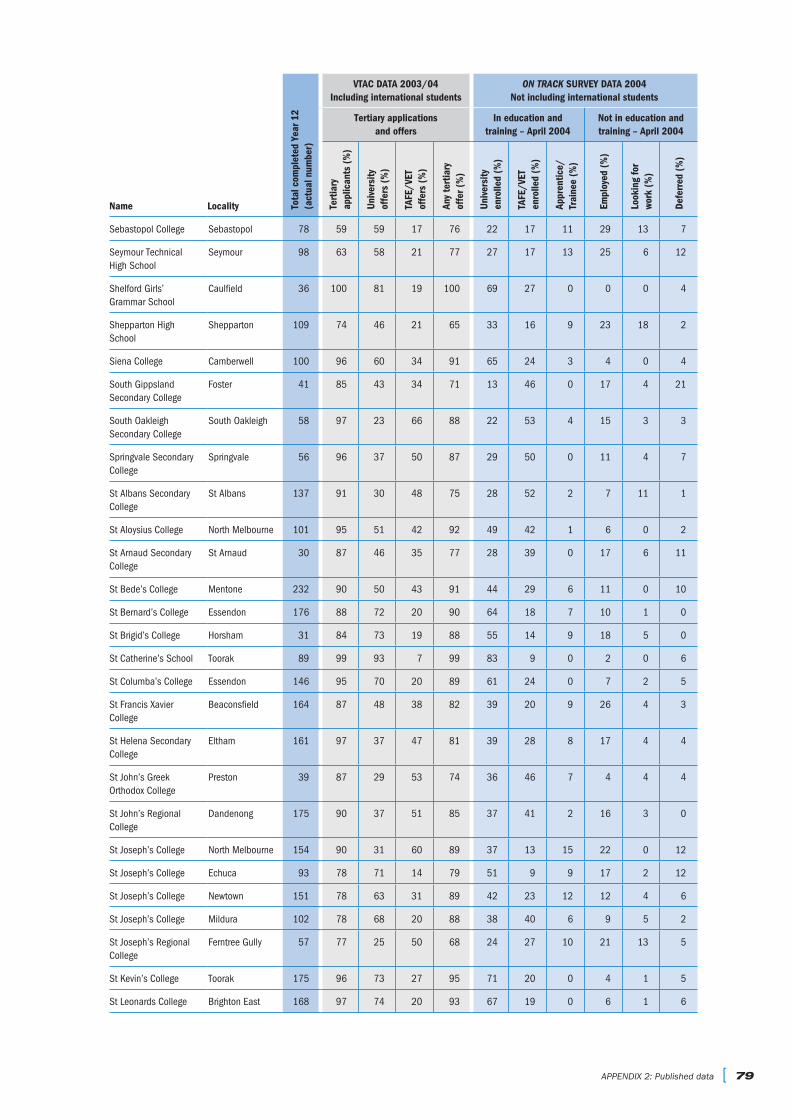
APPENDIX 2: Published data [ 79
Tota
l com
plet
ed Y
ear 1
2(a
ctua
l num
ber)
VTAC DATA 2003/04Including international students
ON TRACK SURVEY DATA 2004 Not including international students
Tertiary applications and offers
In education and training – April 2004
Not in education and training – April 2004
Name Locality Tert
iary
appl
ican
ts (
%)
Uni
vers
ityof
fers
(%
)
TAFE
/VET
offe
rs (
%)
Any
tert
iary
offe
r (%
)
Uni
vers
ityen
rolle
d (%
)
TAFE
/VET
enro
lled
(%)
Appr
entic
e/Tr
aine
e (%
)
Empl
oyed
(%
)
Look
ing
for
wor
k (%
)
Defe
rred
(%
)
Sebastopol College Sebastopol 78 59 59 17 76 22 17 11 29 13 7
Seymour Technical High School
Seymour 98 63 58 21 77 27 17 13 25 6 12
Shelford Girls’ Grammar School
Caulfield 36 100 81 19 100 69 27 0 0 0 4
Shepparton High School
Shepparton 109 74 46 21 65 33 16 9 23 18 2
Siena College Camberwell 100 96 60 34 91 65 24 3 4 0 4
South Gippsland Secondary College
Foster 41 85 43 34 71 13 46 0 17 4 21
South Oakleigh Secondary College
South Oakleigh 58 97 23 66 88 22 53 4 15 3 3
Springvale Secondary College
Springvale 56 96 37 50 87 29 50 0 11 4 7
St Albans Secondary College
St Albans 137 91 30 48 75 28 52 2 7 11 1
St Aloysius College North Melbourne 101 95 51 42 92 49 42 1 6 0 2
St Arnaud Secondary College
St Arnaud 30 87 46 35 77 28 39 0 17 6 11
St Bede’s College Mentone 232 90 50 43 91 44 29 6 11 0 10
St Bernard’s College Essendon 176 88 72 20 90 64 18 7 10 1 0
St Brigid’s College Horsham 31 84 73 19 88 55 14 9 18 5 0
St Catherine’s School Toorak 89 99 93 7 99 83 9 0 2 0 6
St Columba’s College Essendon 146 95 70 20 89 61 24 0 7 2 5
St Francis Xavier College
Beaconsfield 164 87 48 38 82 39 20 9 26 4 3
St Helena Secondary College
Eltham 161 97 37 47 81 39 28 8 17 4 4
St John’s Greek Orthodox College
Preston 39 87 29 53 74 36 46 7 4 4 4
St John’s Regional College
Dandenong 175 90 37 51 85 37 41 2 16 3 0
St Joseph’s College North Melbourne 154 90 31 60 89 37 13 15 22 0 12
St Joseph’s College Echuca 93 78 71 14 79 51 9 9 17 2 12
St Joseph’s College Newtown 151 78 63 31 89 42 23 12 12 4 6
St Joseph’s College Mildura 102 78 68 20 88 38 40 6 9 5 2
St Joseph’s Regional College
Ferntree Gully 57 77 25 50 68 24 27 10 21 13 5
St Kevin’s College Toorak 175 96 73 27 95 71 20 0 4 1 5
St Leonards College Brighton East 168 97 74 20 93 67 19 0 6 1 6

80 ] The destinations of school leavers in Victoria
Tota
l com
plet
ed Y
ear 1
2(a
ctua
l num
ber)
VTAC DATA 2003/04Including international students
ON TRACK SURVEY DATA 2004 Not including international students
Tertiary applications and offers
In education and training – April 2004
Not in education and training – April 2004
Name Locality Tert
iary
appl
ican
ts (
%)
Uni
vers
ityof
fers
(%
)
TAFE
/VET
offe
rs (
%)
Any
tert
iary
offe
r (%
)
Uni
vers
ityen
rolle
d (%
)
TAFE
/VET
enro
lled
(%)
Appr
entic
e/Tr
aine
e (%
)
Empl
oyed
(%
)
Look
ing
for
wor
k (%
)
Defe
rred
(%
)
St Margarets School Berwick 68 97 86 12 97 73 14 0 8 0 5
St Mary of the Angels School
Nathalia 36 94 41 38 79 35 27 4 20 5 10
St Mary’s Coptic Orthodox College
Coolaroo 37 95 60 26 83 59 41 0 0 0 0
St Michael’s Grammar School
St Kilda 153 98 79 19 93 65 11 3 4 0 17
St Monica’s College Epping 251 93 37 51 85 38 39 6 12 4 2
St Patrick’s College Ballarat 102 91 57 23 77 39 24 10 13 6 9
St Paul’s Anglican Grammar School
Warragul 130 95 77 18 93 67 11 5 6 2 9
St Paul’s College Altona North 113 82 44 39 82 39 35 10 9 7 0
St Peter’s College Cranbourne 85 88 33 63 95 30 46 4 16 1 1
Star of the Sea College
Gardenvale 166 99 66 32 91 57 24 2 3 2 12
Staughton College Melton South 36 75 22 52 70 17 22 17 30 13 0
Stawell Secondary College
Stawell 62 56 43 31 71 22 24 12 26 8 8
Stott’s College Melbourne 45 96 86 5 91 72 24 4 0 0 0
Strathcona Baptist Girls Grammar School
Canterbury 110 99 83 18 98 74 19 0 3 0 4
Strathmore Secondary College
Strathmore 187 86 50 42 89 45 33 2 13 5 2
Sunbury College Sunbury 131 74 40 39 77 26 34 7 21 7 5
Sunbury Downs Secondary College
Sunbury 87 71 35 37 73 22 35 22 13 5 4
Sunshine College Sunshine 130 99 25 48 71 24 36 7 18 13 2
Swan Hill College Swan Hill 112 81 48 32 74 25 25 16 18 1 15
Swinburne Senior Secondary College
Hawthorn 163 79 33 40 70 20 33 5 19 10 12
Tallangatta Secondary College
Tallangatta 33 85 46 29 71 30 26 22 11 0 11
Taylors Lakes Secondary College
Taylors Lakes 162 90 23 68 88 25 46 4 17 5 3
Templestowe College Templestowe Lower
163 87 47 36 83 40 32 4 15 3 4
Terang College Terang 20 85 53 41 94 29 41 12 12 0 6
The Geelong College Newtown 152 93 84 15 97 65 7 6 7 2 13
The Grange P–12 College
Hoppers Crossing 100 92 29 53 79 30 43 0 14 7 6
The Hamilton and Alexandra College
Hamilton 48 96 80 20 96 50 16 6 7 0 21
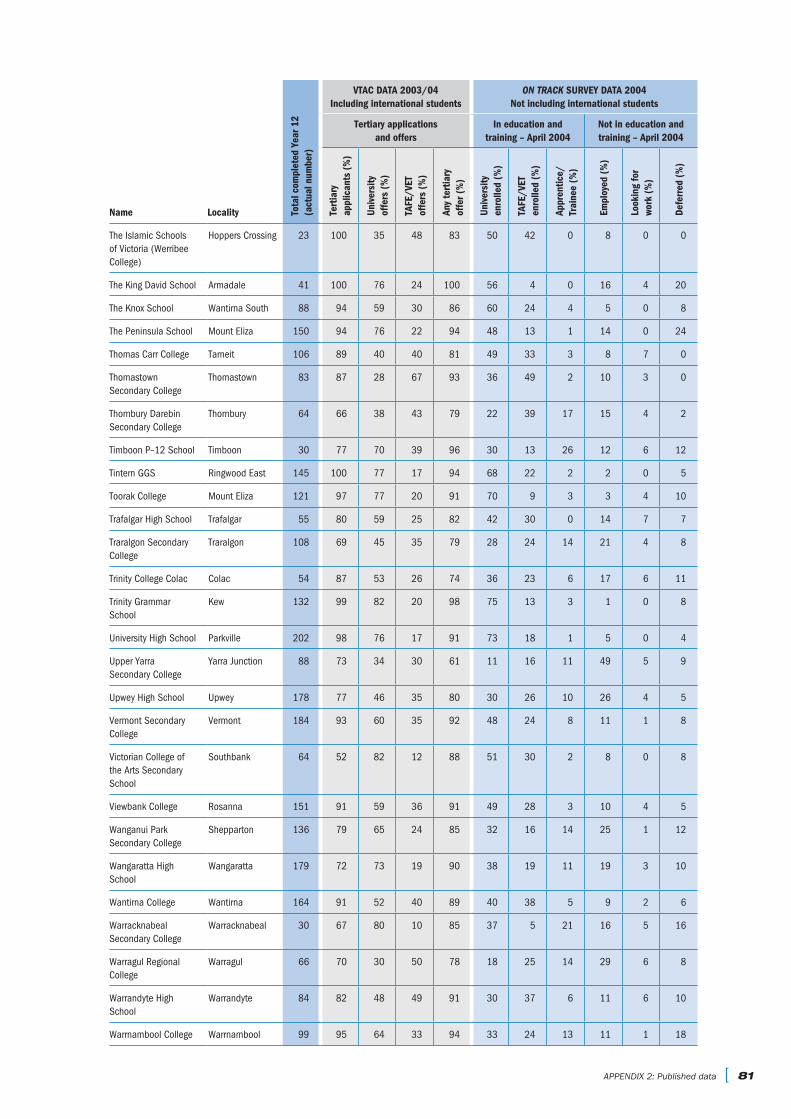
APPENDIX 2: Published data [ 81
Tota
l com
plet
ed Y
ear 1
2(a
ctua
l num
ber)
VTAC DATA 2003/04Including international students
ON TRACK SURVEY DATA 2004 Not including international students
Tertiary applications and offers
In education and training – April 2004
Not in education and training – April 2004
Name Locality Tert
iary
appl
ican
ts (
%)
Uni
vers
ityof
fers
(%
)
TAFE
/VET
offe
rs (
%)
Any
tert
iary
offe
r (%
)
Uni
vers
ityen
rolle
d (%
)
TAFE
/VET
enro
lled
(%)
Appr
entic
e/Tr
aine
e (%
)
Empl
oyed
(%
)
Look
ing
for
wor
k (%
)
Defe
rred
(%
)
The Islamic Schools of Victoria (Werribee College)
Hoppers Crossing 23 100 35 48 83 50 42 0 8 0 0
The King David School Armadale 41 100 76 24 100 56 4 0 16 4 20
The Knox School Wantirna South 88 94 59 30 86 60 24 4 5 0 8
The Peninsula School Mount Eliza 150 94 76 22 94 48 13 1 14 0 24
Thomas Carr College Tarneit 106 89 40 40 81 49 33 3 8 7 0
Thomastown Secondary College
Thomastown 83 87 28 67 93 36 49 2 10 3 0
Thornbury Darebin Secondary College
Thornbury 64 66 38 43 79 22 39 17 15 4 2
Timboon P–12 School Timboon 30 77 70 39 96 30 13 26 12 6 12
Tintern GGS Ringwood East 145 100 77 17 94 68 22 2 2 0 5
Toorak College Mount Eliza 121 97 77 20 91 70 9 3 3 4 10
Trafalgar High School Trafalgar 55 80 59 25 82 42 30 0 14 7 7
Traralgon Secondary College
Traralgon 108 69 45 35 79 28 24 14 21 4 8
Trinity College Colac Colac 54 87 53 26 74 36 23 6 17 6 11
Trinity Grammar School
Kew 132 99 82 20 98 75 13 3 1 0 8
University High School Parkville 202 98 76 17 91 73 18 1 5 0 4
Upper Yarra Secondary College
Yarra Junction 88 73 34 30 61 11 16 11 49 5 9
Upwey High School Upwey 178 77 46 35 80 30 26 10 26 4 5
Vermont Secondary College
Vermont 184 93 60 35 92 48 24 8 11 1 8
Victorian College of the Arts Secondary School
Southbank 64 52 82 12 88 51 30 2 8 0 8
Viewbank College Rosanna 151 91 59 36 91 49 28 3 10 4 5
Wanganui Park Secondary College
Shepparton 136 79 65 24 85 32 16 14 25 1 12
Wangaratta High School
Wangaratta 179 72 73 19 90 38 19 11 19 3 10
Wantirna College Wantirna 164 91 52 40 89 40 38 5 9 2 6
Warracknabeal Secondary College
Warracknabeal 30 67 80 10 85 37 5 21 16 5 16
Warragul Regional College
Warragul 66 70 30 50 78 18 25 14 29 6 8
Warrandyte High School
Warrandyte 84 82 48 49 91 30 37 6 11 6 10
Warrnambool College Warrnambool 99 95 64 33 94 33 24 13 11 1 18
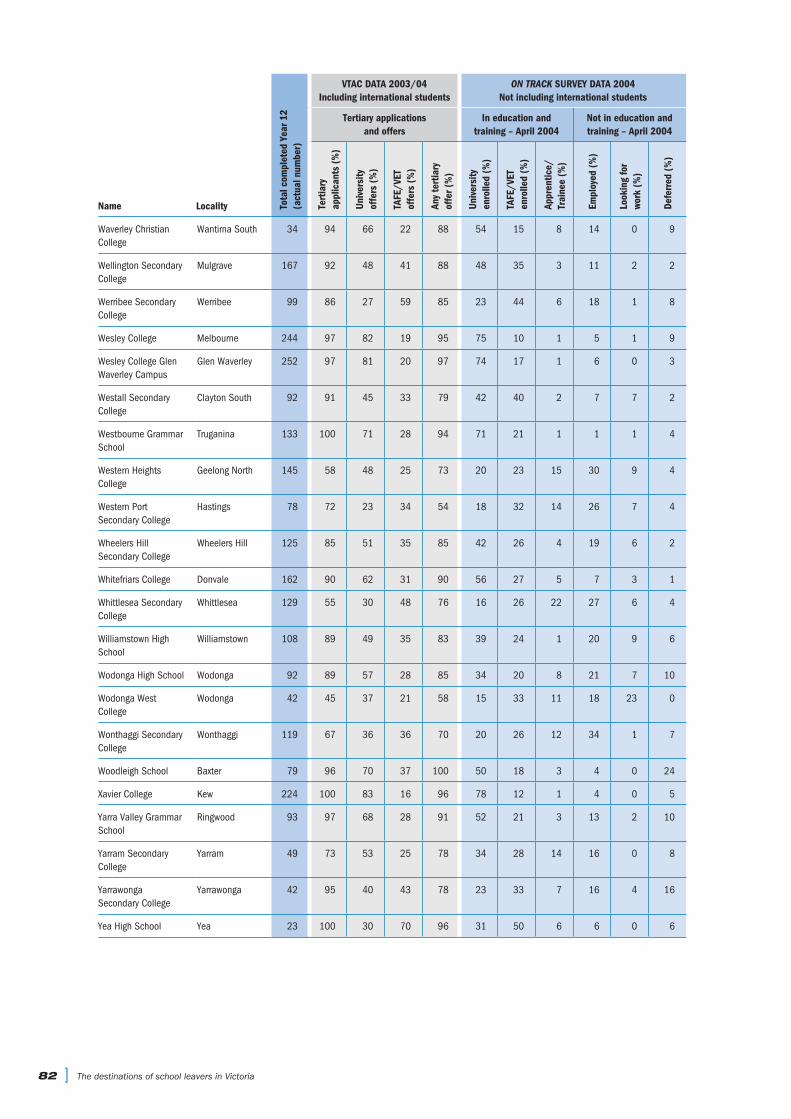
82 ] The destinations of school leavers in Victoria
Tota
l com
plet
ed Y
ear 1
2(a
ctua
l num
ber)
VTAC DATA 2003/04Including international students
ON TRACK SURVEY DATA 2004 Not including international students
Tertiary applications and offers
In education and training – April 2004
Not in education and training – April 2004
Name Locality Tert
iary
appl
ican
ts (
%)
Uni
vers
ityof
fers
(%
)
TAFE
/VET
offe
rs (
%)
Any
tert
iary
offe
r (%
)
Uni
vers
ityen
rolle
d (%
)
TAFE
/VET
enro
lled
(%)
Appr
entic
e/Tr
aine
e (%
)
Empl
oyed
(%
)
Look
ing
for
wor
k (%
)
Defe
rred
(%
)
Waverley Christian College
Wantirna South 34 94 66 22 88 54 15 8 14 0 9
Wellington Secondary College
Mulgrave 167 92 48 41 88 48 35 3 11 2 2
Werribee Secondary College
Werribee 99 86 27 59 85 23 44 6 18 1 8
Wesley College Melbourne 244 97 82 19 95 75 10 1 5 1 9
Wesley College Glen Waverley Campus
Glen Waverley 252 97 81 20 97 74 17 1 6 0 3
Westall Secondary College
Clayton South 92 91 45 33 79 42 40 2 7 7 2
Westbourne Grammar School
Truganina 133 100 71 28 94 71 21 1 1 1 4
Western Heights College
Geelong North 145 58 48 25 73 20 23 15 30 9 4
Western Port Secondary College
Hastings 78 72 23 34 54 18 32 14 26 7 4
Wheelers Hill Secondary College
Wheelers Hill 125 85 51 35 85 42 26 4 19 6 2
Whitefriars College Donvale 162 90 62 31 90 56 27 5 7 3 1
Whittlesea Secondary College
Whittlesea 129 55 30 48 76 16 26 22 27 6 4
Williamstown High School
Williamstown 108 89 49 35 83 39 24 1 20 9 6
Wodonga High School Wodonga 92 89 57 28 85 34 20 8 21 7 10
Wodonga West College
Wodonga 42 45 37 21 58 15 33 11 18 23 0
Wonthaggi Secondary College
Wonthaggi 119 67 36 36 70 20 26 12 34 1 7
Woodleigh School Baxter 79 96 70 37 100 50 18 3 4 0 24
Xavier College Kew 224 100 83 16 96 78 12 1 4 0 5
Yarra Valley Grammar School
Ringwood 93 97 68 28 91 52 21 3 13 2 10
Yarram Secondary College
Yarram 49 73 53 25 78 34 28 14 16 0 8
Yarrawonga Secondary College
Yarrawonga 42 95 40 43 78 23 33 7 16 4 16
Yea High School Yea 23 100 30 70 96 31 50 6 6 0 6
>Other On Track publicationsThe Destinations of School Leavers in Victoria report of the 2003 On Track Survey provides a comprehensive analysis of the destinations of Victorian students who left Years 10–12 in 2002. This analysis includes destinations by gender, year level, socioeconomic status and regional areas; reasons for not continuing in education and training; and details on the occupations and hours worked of employed school leavers. The report can be accessed at www.llen.vic.gov.au/llen/ontrack/data.htm
The VET IN SCHOOLS PATHWAYS. THE 2003 YEAR 12 COHORT report outlines the destinations of the 2003 cohort, using data from 2003 and 2004 VCAA files, as well as data gathered by telephone surveys conducted as part of the OnTrack program. The report is part of an ongoing study into the implementation of the VET in Schools program. The report (and all previous VET IN SCHOOLS PATHWAYS reports can be accessed at www.sofweb.vic.edu.au/voced/vetschls/intro.htm
APPENDIX 2: Published data [ 83
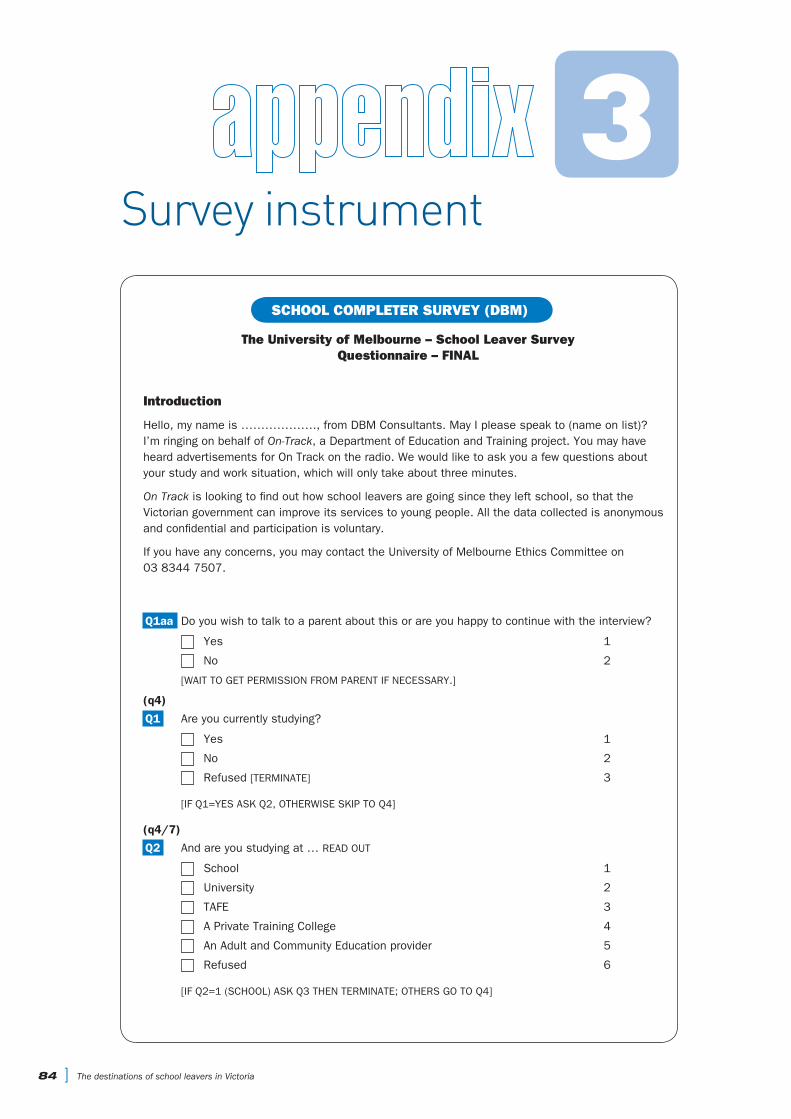
84 ] The destinations of school leavers in Victoria
3Survey instrument
SCHOOL COMPLETER SURVEY (DBM)
The University of Melbourne – School Leaver SurveyQuestionnaire – FINAL
Introduction
Hello, my name is ………………., from DBM Consultants. May I please speak to (name on list)? I’m ringing on behalf of On-Track, a Department of Education and Training project. You may have heard advertisements for On Track on the radio. We would like to ask you a few questions about your study and work situation, which will only take about three minutes.
On Track is looking to find out how school leavers are going since they left school, so that the Victorian government can improve its services to young people. All the data collected is anonymous and confidential and participation is voluntary.
If you have any concerns, you may contact the University of Melbourne Ethics Committee on 03 8344 7507.
Q1aa Do you wish to talk to a parent about this or are you happy to continue with the interview?
Yes 1
No 2
[WAIT TO GET PERMISSION FROM PARENT IF NECESSARY.]
(q4)
Q1 Are you currently studying?
Yes 1
No 2
Refused [TERMINATE] 3
[IF Q1=YES ASK Q2, OTHERWISE SKIP TO Q4]
(q4/7)
Q2 And are you studying at … READ OUT
School 1
University 2
TAFE 3
A Private Training College 4
An Adult and Community Education provider 5
Refused 6
[IF Q2=1 (SCHOOL) ASK Q3 THEN TERMINATE; OTHERS GO TO Q4]
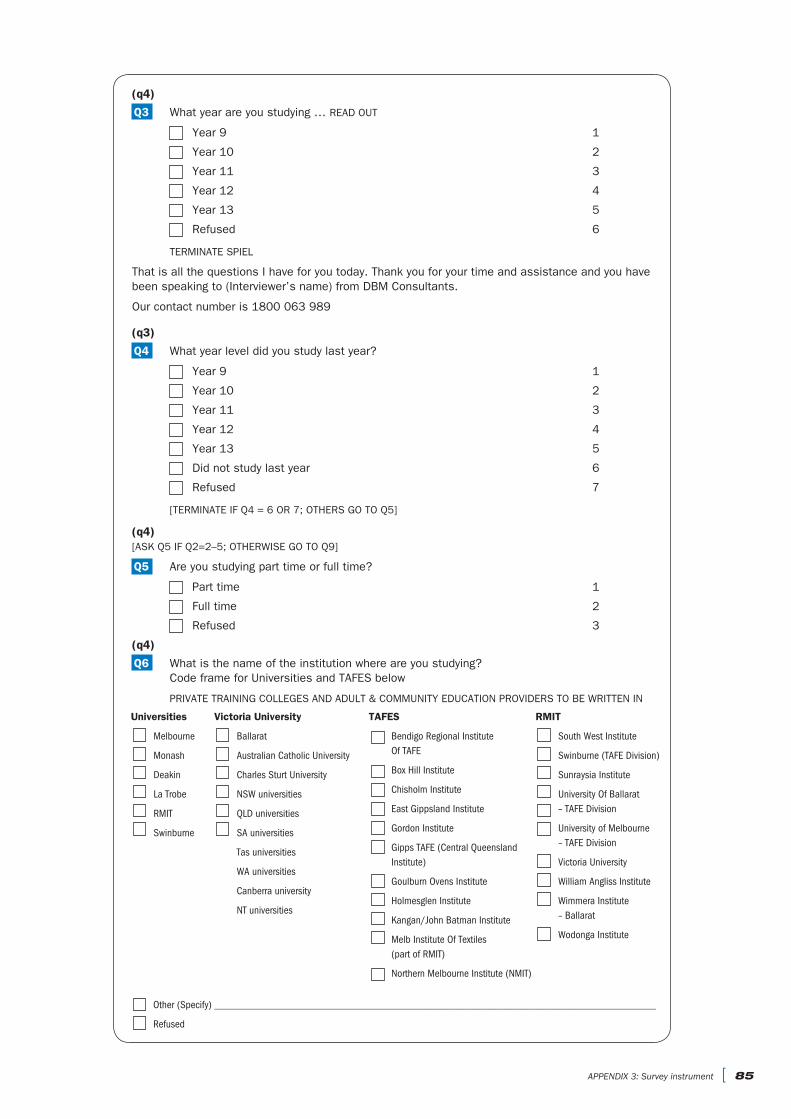
APPENDIX 3: Survey instrument [ 85
(q4)
Q3 What year are you studying … READ OUT
Year 9 1
Year 10 2
Year 11 3
Year 12 4
Year 13 5
Refused 6
TERMINATE SPIEL
That is all the questions I have for you today. Thank you for your time and assistance and you have been speaking to (Interviewer’s name) from DBM Consultants.
Our contact number is 1800 063 989
(q3)
Q4 What year level did you study last year?
Year 9 1
Year 10 2
Year 11 3
Year 12 4
Year 13 5
Did not study last year 6
Refused 7
[TERMINATE IF Q4 = 6 OR 7; OTHERS GO TO Q5]
(q4)[ASK Q5 IF Q2=2–5; OTHERWISE GO TO Q9]
Q5 Are you studying part time or full time?
Part time 1
Full time 2
Refused 3
(q4)
Q6 What is the name of the institution where are you studying? Code frame for Universities and TAFES below
PRIVATE TRAINING COLLEGES AND ADULT & COMMUNITY EDUCATION PROVIDERS TO BE WRITTEN IN
Other (Specify) ___________________________________________________________________________________
Refused
Universities
Melbourne
Monash
Deakin
La Trobe
RMIT
Swinburne
Victoria University
Ballarat
Australian Catholic University
Charles Sturt University
NSW universities
QLD universities
SA universities
Tas universities
WA universities
Canberra university
NT universities
TAFES
Bendigo Regional Institute Of TAFE
Box Hill Institute
Chisholm Institute
East Gippsland Institute
Gordon Institute
Gipps TAFE (Central Queensland Institute)
Goulburn Ovens Institute
Holmesglen Institute
Kangan/John Batman Institute
Melb Institute Of Textiles (part of RMIT)
Northern Melbourne Institute (NMIT)
RMIT
South West Institute
Swinburne (TAFE Division)
Sunraysia Institute
University Of Ballarat – TAFE Division
University of Melbourne – TAFE Division
Victoria University
William Angliss Institute
Wimmera Institute – Ballarat
Wodonga Institute
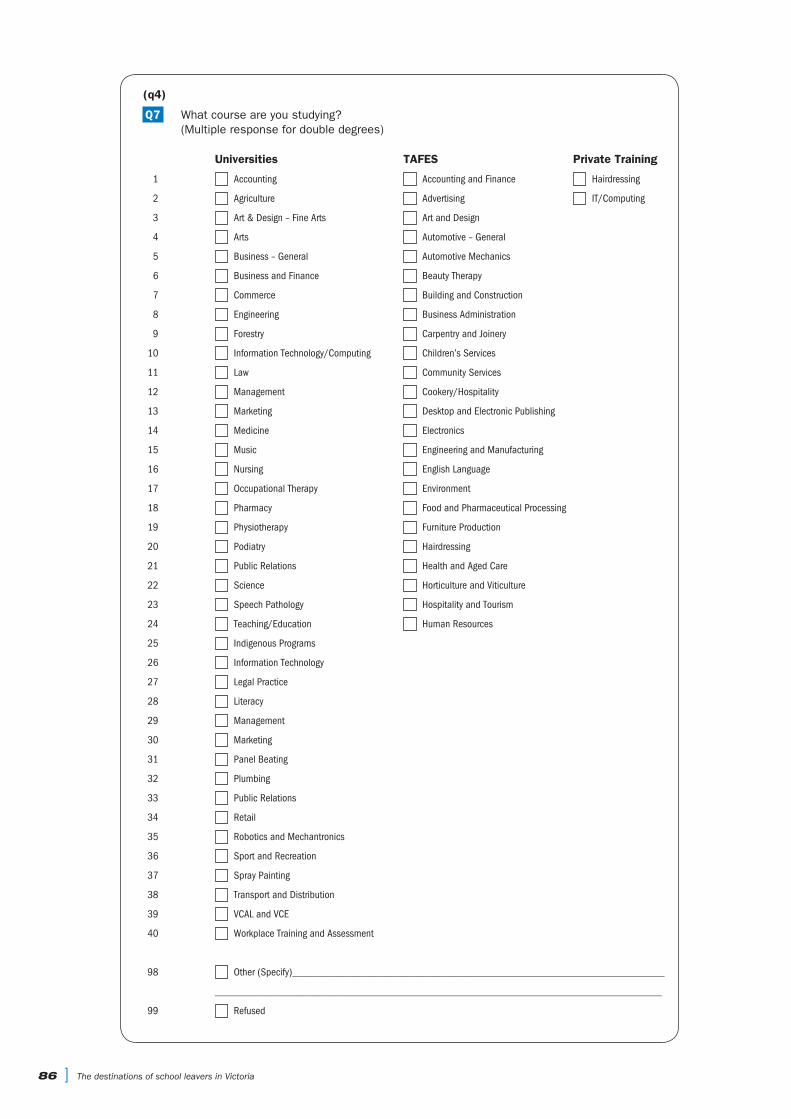
86 ] The destinations of school leavers in Victoria
(q4)
Q7 What course are you studying? (Multiple response for double degrees)
Universities TAFES Private Training
1 Accounting Accounting and Finance Hairdressing
2 Agriculture Advertising IT/Computing
3 Art & Design – Fine Arts Art and Design
4 Arts Automotive – General
5 Business – General Automotive Mechanics
6 Business and Finance Beauty Therapy
7 Commerce Building and Construction
8 Engineering Business Administration
9 Forestry Carpentry and Joinery
10 Information Technology/Computing Children’s Services
11 Law Community Services
12 Management Cookery/Hospitality
13 Marketing Desktop and Electronic Publishing
14 Medicine Electronics
15 Music Engineering and Manufacturing
16 Nursing English Language
17 Occupational Therapy Environment
18 Pharmacy Food and Pharmaceutical Processing
19 Physiotherapy Furniture Production
20 Podiatry Hairdressing
21 Public Relations Health and Aged Care
22 Science Horticulture and Viticulture
23 Speech Pathology Hospitality and Tourism
24 Teaching/Education Human Resources
25 Indigenous Programs
26 Information Technology
27 Legal Practice
28 Literacy
29 Management
30 Marketing
31 Panel Beating
32 Plumbing
33 Public Relations
34 Retail
35 Robotics and Mechantronics
36 Sport and Recreation
37 Spray Painting
38 Transport and Distribution
39 VCAL and VCE
40 Workplace Training and Assessment
98 Other (Specify)______________________________________________________________________
____________________________________________________________________________________
99 Refused

(q4)
Q8 What level are you studying?
[READ OUT IF NECESSARY; NOTE UNIVERSITY STUDENTS SHOULD BE STUDYING AN UNDERGRADUATE DEGREE BUT MUST CONFIRM]
Undergraduate degree 1
Advanced Diploma 2
Diploma 3
Certificate 4 4
Certificate 3 5
Certificate 2 6
Certificate 1 7
Certificate Unspecified 9
Other (specify) 10
Refused 11
[ASK Q5A FOR THOSE NOT CURRENTLY STUDYING]
DO NOT ASK EARLY SCHOOL LEAVERS
[ASK Q9 IF Q1=2; OTHERS SKIP TO Q13]
(bb)
Q9 Last year, did you apply for a tertiary place through VTAC?
[IF ASKED VTAC IS VICTORIAN TERTIARY ADMISSIONS CENTRE]
Yes 1
No 2
Refused 3
(q4)
[ASK Q10 IF Q9 = 1; OTHERS SKIP TO Q12]
Q10 Did you… READ OUT
Receive a tertiary offer, but reject it 1
Receive a tertiary offer, enrol but later cancel 2
Defer your place at a tertiary institution 3
None of these 4
Refused 5
(Q5) [ASK Q5C IF Q5B = 1 OR 2]
[ASK Q11 IF Q10 = 1–2; OTHERS SKIP TO Q12]
Q11 Was it a TAFE or university place you knocked back?
TAFE 1
University 2
Refused 3
APPENDIX 3: Survey instrument [ 87

88 ] The destinations of school leavers in Victoria
(q6)
Q12 Which of the following is a reason why you are not studying?
Agree Disagree
You would have difficulty supporting yourself while studying
You have family commitments that make it difficult for you to study You don’t have information on what is available There is too much travel involved You have tried to get into a course, but were not successful
You don’t feel ready for more study at the moment You don’t see the relevance of doing any more study The costs of study are a barrier The costs of travel are a barrier (e.g. HECS debt or fees) You were unsure whether you would be able to cope with the work It would have meant leaving home
ASK ALL and experience
(q7)
Q13 Are you now working?
Yes 1
No 2
Refused 3
(q7)
[IF Q13=1 ASK Q14, OTHERS GO TO Q17]
Q14 Which of the following best describes your employment status? You are working…READ OUT
[SINGLE RESPONSE]
As part of an apprenticeship 1
As part of a traineeship 2
Full time 3
Part time/casual 4
Refused 5
(q7)
[ASK Q15 IF Q14=4 (PART TIME OR CASUAL), OTHERS GO TO Q16]
Q15 How many hours are you working on average per week?
WRITE IN

(q7)
Q16 What is your job? [DON’T READ OUT; SINGLE RESPONSE]
Call centre/telemarketers/market researchers 1
Chef (apprentice) 2
Child care / baby sitting 3
Clerical (reception, payroll, bank tellers) 4
Fast food cooking 5
Fast food delivery 6
Fast food service 7
Horticulture / nursery hand 8
Kitchen hand / food preparation café 9
Labourers (factory, farm, cleaners, packagers) 10
Police force 11
Retail/sales assistant 12
Sales representatives 13
Secretary / Personal assistant 14
Security 15
Tradesperson (mechanic, hairdresser, plumber) 16
Usher 17
Waiting / Bar work 18
Other (specify) 98
Refused 99
[ASK Q17 IF Q13=2, OTHERS GO TO Q18]
(q7)
Q17 Are you… READ OUT
Looking for work 1
Not looking for work 2
Refused 3
ASK ALL
(q1)
Q18 Have you heard about the On Track survey before?
Yes 1
No 2
Don’t know 3
(q2)
[IF Q18=1 (YES) ASK Q19, OTHERWISE GO TO DEMOGRAPHICS]
Q19 Where did you hear about it? [MULTIPLE RESPONSE]
Letter 1
School 2
Postcard 3
Web/Internet 4
Radio 5
Family/friends 6
Newspaper 7
TV 8
Other 9
Don’t know /can’t remember 10
APPENDIX 3: Survey instrument [ 89

90 ] The destinations of school leavers in Victoria
DEMOGRAPHICS
We would now like to ask you a couple of background questions to assist in our analysis.
(q9)
D1 In 2003, while at school, did you receive Youth Allowance or Abstudy?
Yes 1
No 2
Don’t know/refused 3
(q10)
D2 When you were studying last year, what was the main language spoken at home?
English Mandarin
Albanian Other Chinese
Arabic Pacific Island language (any)
Bosnian Persian
Cantonese Polish
Croatian Romanian
Greek Russian
Hakka Serbian
Indian language (any) Sinhalese
Indonesian Spanish
Italian Somali
Japanese Tagalog (Filipino)
Khmer Turkish
Korean Vietnamese
Macedonian Other
[ASK D3 IF Q4=1–3 (FOR EARLY LEAVERS ONLY)]
(q11)
D3 Are you of Aboriginal or Torres Strait Islander origin?
Aboriginal 1
Torres Strait Islander 2
Neither 3
Refused 4
[ASK D4 IF Q1=2 (NOT STUDYING) AND Q13=2–3 OR Q14=4–5 (NOT WORKING FULL TIME OR APPRENTICE/TRAINEE); OTHERS SKIP TO D5]
(q8)
D4 Local Learning and Employment Networks are Victorian state-government organisations funded to undertake local planning and research to improve the education, training and employment outcomes of young people. Is it OK if we pass on your name and number to your Local Learning and Employment Network so they can contact you with information regarding work or study opportunities?
Yes 1
No 2
Don’t know/refused 3
DO NOT ASK EARLY SCHOOL LEAVERS

[ASK Q20 IF Q1=2 (NOT STUDYING) AND Q10 IS NOT 3 (HAVE NOT DEFERRED PLACE); OTHERS SKIP TO DEMOGRAPHICS]
(aa)
Q20 Thinking about further study or training after school, to what extent would you agree or disagree with the following statements READ OUT EACH STATEMENT
Would that be strongly agree, agree, disagree or strongly disagree
ROTATE Strongly Agree Disagree Strongly Unsure/ agree disagree don’t know
Students in your school were well-informed about university courses
Students in your school were well-informed about TAFE/VET courses
Information about TAFE/VET courses was distributed at school
University courses lead to better jobs than TAFE courses
TAFE courses take as long to complete as university courses
Class sizes are about as big at TAFE as they are at university
You get more individual attention at TAFE than university
You can transfer from TAFE to university with credit for work done
TAFE is mainly for students whose marks are too low to get into university
Teaching in universities is of a higher quality than TAFE
(q12)
D5 And lastly, we would like to contact you next year to see how your plans are working out. Would you agree to be contacted to answer a few brief questions next year?
Yes (ASK D6) 1
No (PRIVACY ACT) 2
Don’t know/refused 3
[ASK D6 IF D5=1; OTHERS SKIP TO PRIVACY]
(q13)
D6 Can we reach you next year on.. READ OUT
Your current phone number 1
Or an alternative number 2
Don’t know/refused 3
(q13)
[ASK D7 IF D6=2]
D7 What will the alternative number be?
WRITE IN / DON’T KNOW RESPONSE
APPENDIX 3: Survey instrument [ 91

92 ] The destinations of school leavers in Victoria
(q13)
[NUMBER CALLED TO APPEAR ON SCREEN]
D8 Do you have a mobile number?
Yes 1
No 2
Already have mobile number 3
Refused 4
(q13)
[ASK D9 IF D8=1]
D9 And what is this?
WRITE IN / REFUSED RESPONSE
(q13)
D10 Could we also have the name and number of someone who will know where you are in case we cannot contact you next year?
Name
Number
Refused
(q13)
D11 Could you please tell me your first name in case my supervisor needs to recontact you to ask a couple of questions, to verify some of the information that we collected.
[RECORD NAME]
As this is market research, it is carried out in compliance with the Privacy Act and the information you provided will be used only for research purposes.
Q9 PRIV2. Would you like me to read out the details of how DBM complies with the Privacy Act?
Yes [GO TO Q9PRIV3] 1
No [GO TO CLOSING STATEMENT] 2
Q9 PRIV3. As soon as the information processing period has finished, your name and contact details will be removed from your responses to the survey. After that time, we will no longer be able to identify the responses provided by you. However, for the period that your name and contact details remain with your survey responses, which will be approximately 3 months, you will be able to contact us to request access to the information that you have provided.
If you wish to do this, you can contact us on 1800 063 989 and quote project number
[INSERT JOB NUMBER].
CLOSING STATEMENT
The On Track report will eventually be available on DE&T’s website. [If asked the website is www.det.vic.gov.au].
IF NECESSARY FOR RESPONDENTS NOT ASKED ABOUT REFERRAL TO LLEN
Those seeking advice on careers or employment should contact their careers or employment adviser at the institution where they are studying (if studying) or ring the Youth Employment Link Line (YEL) on 1800 152 025.
That is the end of the interview. Thank you very much for your time and assistance.
In case you missed it, my name is ‘+iname+’ from DBM Consultants in Melbourne.
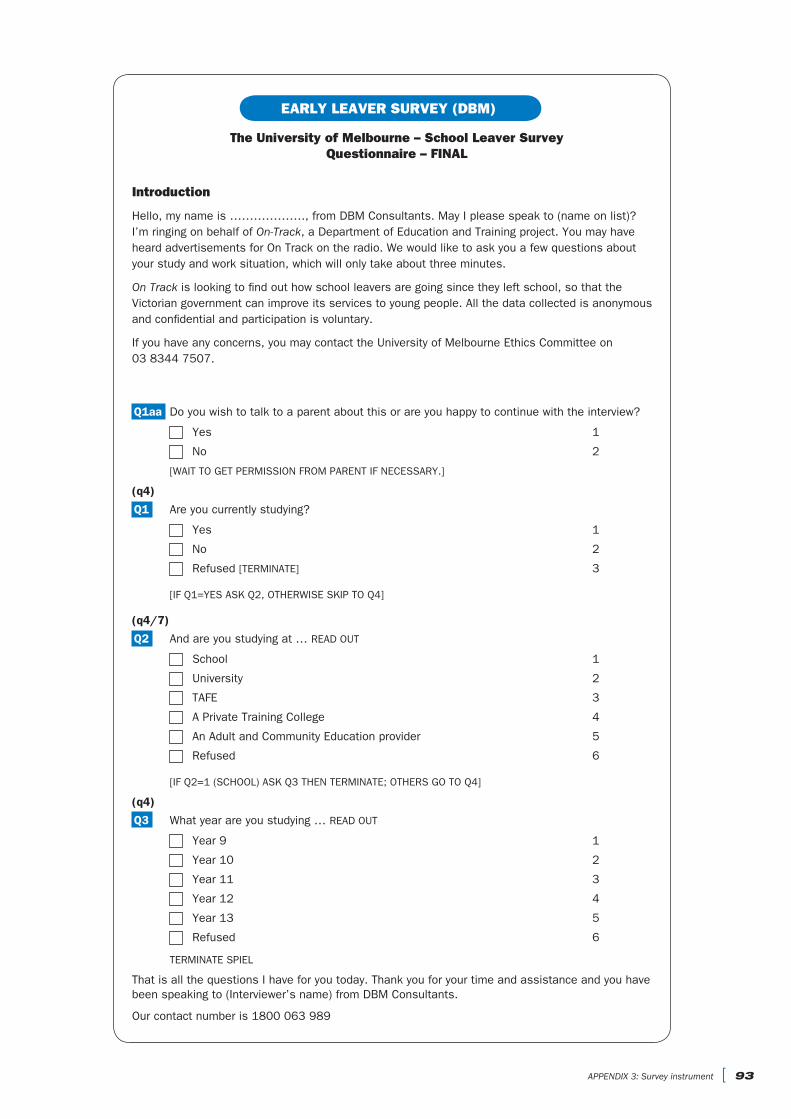
EARLY LEAVER SURVEY (DBM)
The University of Melbourne – School Leaver SurveyQuestionnaire – FINAL
Introduction
Hello, my name is ………………., from DBM Consultants. May I please speak to (name on list)? I’m ringing on behalf of On-Track, a Department of Education and Training project. You may have heard advertisements for On Track on the radio. We would like to ask you a few questions about your study and work situation, which will only take about three minutes.
On Track is looking to find out how school leavers are going since they left school, so that the Victorian government can improve its services to young people. All the data collected is anonymous and confidential and participation is voluntary.
If you have any concerns, you may contact the University of Melbourne Ethics Committee on 03 8344 7507.
Q1aa Do you wish to talk to a parent about this or are you happy to continue with the interview?
Yes 1
No 2
[WAIT TO GET PERMISSION FROM PARENT IF NECESSARY.]
(q4)
Q1 Are you currently studying?
Yes 1
No 2
Refused [TERMINATE] 3
[IF Q1=YES ASK Q2, OTHERWISE SKIP TO Q4]
(q4/7)
Q2 And are you studying at … READ OUT
School 1
University 2
TAFE 3
A Private Training College 4
An Adult and Community Education provider 5
Refused 6
[IF Q2=1 (SCHOOL) ASK Q3 THEN TERMINATE; OTHERS GO TO Q4]
(q4)
Q3 What year are you studying … READ OUT
Year 9 1
Year 10 2
Year 11 3
Year 12 4
Year 13 5
Refused 6
TERMINATE SPIEL
That is all the questions I have for you today. Thank you for your time and assistance and you have been speaking to (Interviewer’s name) from DBM Consultants.
Our contact number is 1800 063 989
APPENDIX 3: Survey instrument [ 93

94 ] The destinations of school leavers in Victoria
(q3)
Q4 What year level did you study last year?
Year 9 1
Year 10 2
Year 11 3
Year 12 4
Year 13 5
Did not study last year (Terminate) 6
Refused (Terminate) 7
[TERMINATE IF Q4 = 6 TO 7; IF Q4 =4 OR 5 GO TO Q4A, OTHERS GO TO Q5]
Q4a Did you complete that year?
Yes (Terminate) 1
No 2
Refused (Terminate) 3
[TERMINATE IF Q4A = 1 OR 3; OTHERS GO TO Q5]
(q4)[ASK Q5 IF Q2=2–5; OTHERWISE GO TO Q9]
Q5 Are you studying part time or full time?
Part time 1
Full time 2
Refused 3
(q4)
Q6 What is the name of the institution where are you studying? Code frame for Universities and TAFES below
PRIVATE TRAINING COLLEGES AND ADULT & COMMUNITY EDUCATION PROVIDERS TO BE WRITTEN IN
Other (Specify) ___________________________________________________________________________________
Refused
Universities
Melbourne
Monash
Deakin
La Trobe
RMIT
Swinburne
Victoria University
Ballarat
Australian Catholic University
Charles Sturt University
NSW universities
QLD universities
SA universities
Tas universities
WA universities
Canberra university
NT universities
TAFES
Bendigo Regional Institute Of TAFE
Box Hill Institute
Chisholm Institute
East Gippsland Institute
Gordon Institute
Gipps TAFE (Central Queensland Institute)
Goulburn Ovens Institute
Holmesglen Institute
Kangan/John Batman Institute
Melb Institute Of Textiles (part of RMIT)
Northern Melbourne Institute (NMIT)
RMIT
South West Institute
Swinburne (TAFE Division)
Sunraysia Institute
University Of Ballarat – TAFE Division
University of Melbourne – TAFE Division
Victoria University
William Angliss Institute
Wimmera Institute – Ballarat
Wodonga Institute
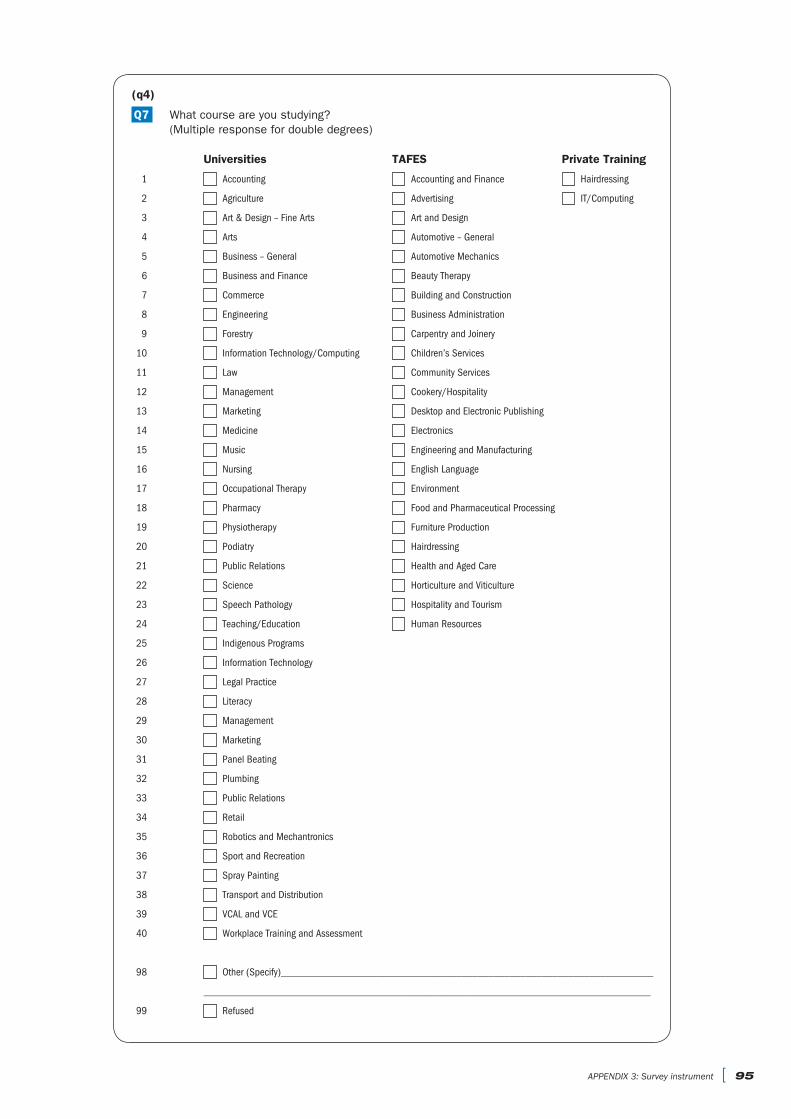
(q4)
Q7 What course are you studying? (Multiple response for double degrees)
Universities TAFES Private Training
1 Accounting Accounting and Finance Hairdressing
2 Agriculture Advertising IT/Computing
3 Art & Design – Fine Arts Art and Design
4 Arts Automotive – General
5 Business – General Automotive Mechanics
6 Business and Finance Beauty Therapy
7 Commerce Building and Construction
8 Engineering Business Administration
9 Forestry Carpentry and Joinery
10 Information Technology/Computing Children’s Services
11 Law Community Services
12 Management Cookery/Hospitality
13 Marketing Desktop and Electronic Publishing
14 Medicine Electronics
15 Music Engineering and Manufacturing
16 Nursing English Language
17 Occupational Therapy Environment
18 Pharmacy Food and Pharmaceutical Processing
19 Physiotherapy Furniture Production
20 Podiatry Hairdressing
21 Public Relations Health and Aged Care
22 Science Horticulture and Viticulture
23 Speech Pathology Hospitality and Tourism
24 Teaching/Education Human Resources
25 Indigenous Programs
26 Information Technology
27 Legal Practice
28 Literacy
29 Management
30 Marketing
31 Panel Beating
32 Plumbing
33 Public Relations
34 Retail
35 Robotics and Mechantronics
36 Sport and Recreation
37 Spray Painting
38 Transport and Distribution
39 VCAL and VCE
40 Workplace Training and Assessment
98 Other (Specify)______________________________________________________________________
____________________________________________________________________________________
99 Refused
APPENDIX 3: Survey instrument [ 95
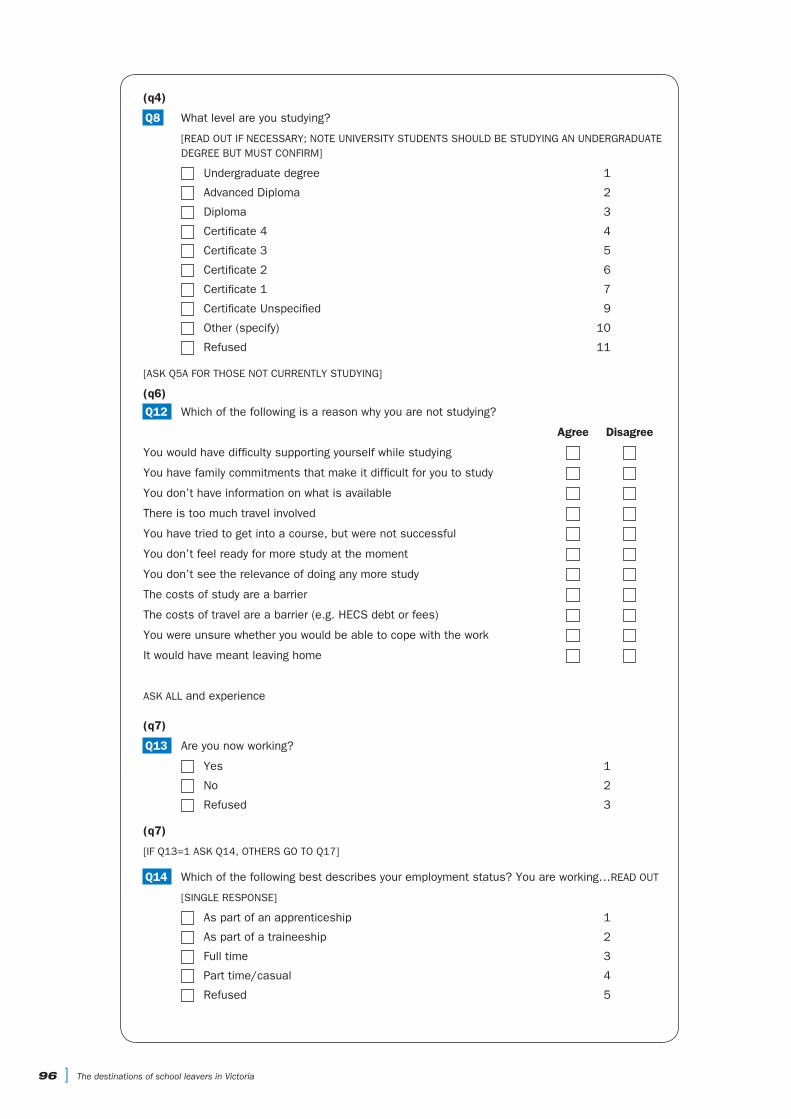
96 ] The destinations of school leavers in Victoria
(q4)
Q8 What level are you studying?
[READ OUT IF NECESSARY; NOTE UNIVERSITY STUDENTS SHOULD BE STUDYING AN UNDERGRADUATE DEGREE BUT MUST CONFIRM]
Undergraduate degree 1
Advanced Diploma 2
Diploma 3
Certificate 4 4
Certificate 3 5
Certificate 2 6
Certificate 1 7
Certificate Unspecified 9
Other (specify) 10
Refused 11
[ASK Q5A FOR THOSE NOT CURRENTLY STUDYING]
(q6)
Q12 Which of the following is a reason why you are not studying?
Agree Disagree
You would have difficulty supporting yourself while studying
You have family commitments that make it difficult for you to study You don’t have information on what is available There is too much travel involved You have tried to get into a course, but were not successful
You don’t feel ready for more study at the moment You don’t see the relevance of doing any more study The costs of study are a barrier The costs of travel are a barrier (e.g. HECS debt or fees) You were unsure whether you would be able to cope with the work It would have meant leaving home
ASK ALL and experience
(q7)
Q13 Are you now working?
Yes 1
No 2
Refused 3
(q7)
[IF Q13=1 ASK Q14, OTHERS GO TO Q17]
Q14 Which of the following best describes your employment status? You are working…READ OUT
[SINGLE RESPONSE]
As part of an apprenticeship 1
As part of a traineeship 2
Full time 3
Part time/casual 4
Refused 5
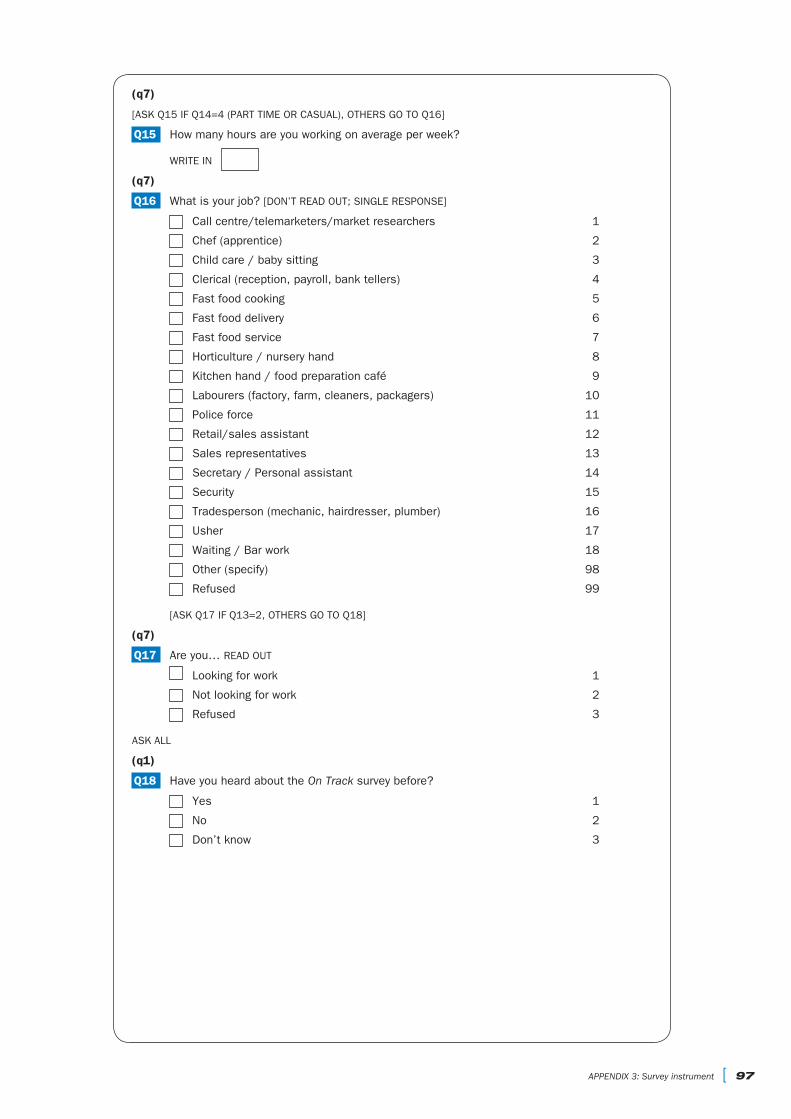
(q7)
[ASK Q15 IF Q14=4 (PART TIME OR CASUAL), OTHERS GO TO Q16]
Q15 How many hours are you working on average per week?
WRITE IN
(q7)
Q16 What is your job? [DON’T READ OUT; SINGLE RESPONSE]
Call centre/telemarketers/market researchers 1
Chef (apprentice) 2
Child care / baby sitting 3
Clerical (reception, payroll, bank tellers) 4
Fast food cooking 5
Fast food delivery 6
Fast food service 7
Horticulture / nursery hand 8
Kitchen hand / food preparation café 9
Labourers (factory, farm, cleaners, packagers) 10
Police force 11
Retail/sales assistant 12
Sales representatives 13
Secretary / Personal assistant 14
Security 15
Tradesperson (mechanic, hairdresser, plumber) 16
Usher 17
Waiting / Bar work 18
Other (specify) 98
Refused 99
[ASK Q17 IF Q13=2, OTHERS GO TO Q18]
(q7)
Q17 Are you… READ OUT
Looking for work 1
Not looking for work 2
Refused 3
ASK ALL
(q1)
Q18 Have you heard about the On Track survey before?
Yes 1
No 2
Don’t know 3
APPENDIX 3: Survey instrument [ 97

98 ] The destinations of school leavers in Victoria
(q2)
[IF Q18=1 (YES) ASK Q19, OTHERWISE GO TO DEMOGRAPHICS]
Q19 Where did you hear about it? [MULTIPLE RESPONSE]
Letter 1
School 2
Postcard 3
Web/Internet 4
Radio 5
Family/friends 6
Newspaper 7
TV 8
Other 9
Don’t know /can’t remember 10
DEMOGRAPHICS
We would now like to ask you a couple of background questions to assist in our analysis.
(q9)
D1 In 2003, while at school, did you receive Youth Allowance or Abstudy?
Yes 1
No 2
Don’t know/refused 3
(q10)
D2 When you were studying last year, what was the main language spoken at home?
English Mandarin
Albanian Other Chinese
Arabic Pacific Island language (any)
Bosnian Persian
Cantonese Polish
Croatian Romanian
Greek Russian
Hakka Serbian
Indian language (any) Sinhalese
Indonesian Spanish
Italian Somali
Japanese Tagalog (Filipino)
Khmer Turkish
Korean Vietnamese
Macedonian Other
[ASK D3 IF Q4=1–3(FOR EARLY LEAVERS ONLY)]
(q11)
D3 Are you of Aboriginal or Torres Strait Islander origin?
Aboriginal 1
Torres Strait Islander 2
Neither 3
Refused 4

[ASK D4 IF Q1=2 (NOT STUDYING) AND Q13=2–3 OR Q14=4–5 (NOT WORKING FULL TIME OR APPRENTICE/TRAINEE); OTHERS SKIP TO D5]
(q8)
D4 Local Learning and Employment Networks are Victorian state-government organisations funded to undertake local planning and research to improve the education, training and employment outcomes of young people. Is it OK if we pass on your name and number to your Local Learning and Employment Network so they can contact you with information regarding work or study opportunities?
Yes 1
No 2
Don’t know/refused 3
ASK D5A. IF NOT STUDYING: Q1=2 AND Q14 NOT EQUAL TO 1–2. OTHERS SKIP TO D10
D5a What is your postcode?
ALLOW 4 DIGITS REF
IF METRO POSTCODE, ASK D5 TO D9, OTHERS SKIP TO D10
IF Q4=4–5 (YR 12 OR 13 EARLY SCHOOL LEAVERS) SKIP D5 AND GO TO D1
(q12)
D5 And lastly, we would like to contact you next year to see how your plans are working out. Would you agree to be contacted to answer a few brief questions next year?
Yes (ASK D6) 1
No (PRIVACY ACT) 2
Don’t know/refused 3
[ASK D6 IF D5=1; OTHERS SKIP TO PRIVACY]
(q13)
D6 Can we reach you next year on.. READ OUT
Your current phone number 1
Or an alternative number 2
Don’t know/refused 3
(q13)
[ASK D7 IF D6=2]
D7 What will the alternative number be?
WRITE IN / DON’T KNOW RESPONSE
(q13)
[NUMBER CALLED TO APPEAR ON SCREEN]
D8 Do you have a mobile number?
Yes 1
No 2
Already have mobile number 3
Refused 4
(q13)
[ASK D9 IF D8=1]
D9 And what is this?
WRITE IN / REFUSED RESPONSE
APPENDIX 3: Survey instrument [ 99

100 ] The destinations of school leavers in Victoria
(q13)
D10 Could we also have the name and number of someone who will know where you are in case we cannot contact you next year?
Name
Number
Refused
(q13)
D11 Could you please tell me your first name in case my supervisor needs to recontact you to ask a couple of questions, to verify some of the information that we collected.
[RECORD NAME]
As this is market research, it is carried out in compliance with the Privacy Act and the information you provided will be used only for research purposes.
Q9 PRIV2. Would you like me to read out the details of how DBM complies with the Privacy Act?
Yes [GO TO Q9PRIV3] 1
No [GO TO CLOSING STATEMENT] 2
Q9 PRIV3. As soon as the information processing period has finished, your name and contact details will be removed from your responses to the survey. After that time, we will no longer be able to identify the responses provided by you. However, for the period that your name and contact details remain with your survey responses, which will be approximately 3 months, you will be able to contact us to request access to the information that you have provided.
If you wish to do this, you can contact us on 1800 063 989 and quote project number
[INSERT JOB NUMBER].
CLOSING STATEMENT
The On Track report will eventually be available on DE&T’s website. [If asked the website is www.det.vic.gov.au].
IF NECESSARY FOR RESPONDENTS NOT ASKED ABOUT REFERRAL TO LLEN
Those seeking advice on careers or employment should contact their careers or employment adviser at the institution where they are studying (if studying) or ring the Youth Employment Link Line (YEL) on 1800 152 025.
That is the end of the interview. Thank you very much for your time and assistance.
In case you missed it, my name is ‘+iname+’ from DBM Consultants in Melbourne.

< ON TRACK 2004
THE DESTINATIONS OF SCHOOL LEAVERSIN VICTORIA
> ON TRACK 2004
OFFICE OF LEARNING AND TEACHING